

Page 1

EdgeTech
3300 HULL MOUNT SUB-BOTTOM PROFILER
USER HARDWARE MANUAL
0016732_REV_C 5/1/2018
i
4 Little Brook Road
West Wareham, MA 02576
Tel: (508) 291-0057
Fax: (508) 291-2491
www.EdgeTech.com
Page 2

ii
The information, figures, and specifications in this manual are proprietary and are issued in strict
confidence on condition that they not be copied, reprinted, or disclosed to a third party, either wholly or
in part, without the prior, written consent of EdgeTech. Any reproduction of EdgeTech supplied software
or file sharing is strictly prohibited.
Copyright © 2015 – 2018 EdgeTech. All rights reserved.
Microsoft® and Windows® are registered trademarks of Microsoft Corporation.
Kevlar® is a registered trademark of the DuPont Company.
Intel® and Pentium® are registered trademarks of Intel Corporation.
Novagard G624® is a trademark of Novagard Solutions, Inc.
Storm Case™ is a trademark of Pelican.
Page 3

iii
ATTENTION – READ THIS FIRST!
All personnel involved with the installation, operation, or maintenance of the equipment described in this
manual should read and understand the warnings and cautions provided below.
CAUTION! This equipment contains devices that are extremely sensitive
to static electricity. Therefore, extreme care should be taken when
handling them. Normal handling precautions involve the use of anti-static
protection materials and grounding straps for personnel.
WARNING! High Voltage may be present in all parts of the system.
Therefore, use caution when the electronics are removed from their
containers for servicing.
CAUTION! Operation with improper line voltage may cause serious
damage to the equipment. Always ensure that the proper line voltage is
used.
Page 4

iv
HARDWARE VARIATIONS AND COMPATIBILITY
The 3300 Hull Mount Sub-Bottom Profiler contains both standard and proprietary hardware. At times,
EdgeTech may change the standard components due to their availability or performance improvements.
Although the component manufacturers—along with their models and styles—may change from unit to
unit, replacement parts will generally be interchangeable.
EdgeTech will make every effort to see that replacement components are interchangeable and use the
same software drivers (if applicable). At times, however, direct replacements may not exist. When this
happens, EdgeTech will provide the necessary drivers with the replacement part, if applicable.
EdgeTech may also change certain hardware per customer requirements. Therefore, portions of this
manual, such as parts lists and test features, are subject to change. These sections should be used for
reference only. When changes are made that affect system operation, they will be explicitly noted. Also,
some options and features may not be active in the customer’s unit at time of delivery. Upgrades will be
made available when these features are implemented.
Contact
EDGETECH CUSTOMER SERVICE with any questions relating to compatibility.
Page 5
v
REVISION
DESCRIPTION
DATE
APPROVAL
A
Release to Production
03/09/2015
RM B Updates
08/25/2017
RM C Updates
05/01/2018
TS
ABOUT THIS DOCUMENT
We, the employees at EdgeTech, would like to thank you for purchasing 3300 Hull Mount Sub-Bottom
Profiler. At EdgeTech, it is our policy to provide high-quality, cost-effective products and support services
that meet or exceed your requirements. We also strive to deliver them on-time, and to continuously look
for ways to improve them. We take pride in the products we manufacture, and want you to be entirely
satisfied with your equipment.
Purpose of this Manual
The purpose of this manual is to provide the user with information on the setup and use of EdgeTech’s
3300 Hull Mount Sub-Bottom Profiler. Although this manual encompasses the latest operational features
of the 3300 Hull Mount Sub-Bottom Profiler, some features may be periodically upgraded. Therefore, the
information in this manual is subject to change and should be used for reference only.
Liability
EdgeTech has made every effort to document the 3300 Hull Mount Sub-Bottom Profiler in this manual
accurately and completely. However, EdgeTech assumes no liability for errors or for any damages that
result from the use of this manual or the equipment it documents. EdgeTech reserves the right to upgrade
features of this equipment, and to make changes to this manual, without notice at any time.
Warnings, Cautions, and Notes
Where applicable, warnings, cautions, and notes are provided in this manual as follows:
WARNING! Identifies a potential hazard that could cause injury or death.
CAUTION! Identifies a potential hazard that could damage equipment or
data.
NOTE: Recommendations or general information that is particular to the
material being presented.
Revision History
Page 6

vi
WARRANTY STATEMENT
All equipment manufactured by EdgeTech is warranted against defective components and workmanship
for a period of one year after shipment. Warranty repair will be done by EdgeTech free of charge.
Shipping costs are to be borne by the customer. Malfunction due to improper use is not covered in the
warranty, and EdgeTech disclaims any liability for consequential damage resulting from defects in the
performance of the equipment. No product is warranted as being fit for a particular purpose, and there is
no warranty of merchantability. This warranty applies only if:
i. The items are used solely under the operating conditions and in the manner recommended in
Seller's instruction manual, specifications, or other literature.
ii. The items have not been misused or abused in any manner, nor have repairs been attempted
thereon without the approval of EdgeTech Customer Service.
iii. Written notice of the failure within the warranty period is forwarded to Seller and the directions
received for properly identifying items returned under warranty are followed.
iv. The return notice authorizes Seller to examine and disassemble returned products to the extent
Seller deems necessary to ascertain the cause for failure.
The warranties expressed herein are exclusive. There are no other warranties, either expressed or implied,
beyond those set forth herein, and Seller does not assume any other obligation or liability in connection
with the sale or use of said products. Any product or service repaired under this warranty shall be
warranted for the remaining portion of the original warranty period only.
Equipment not manufactured by EdgeTech is supported only to the extent of the original manufacturer's
warranties.
Page 7

vii
SOFTWARE SERVICE OVERVIEW
EdgeTech provides software services free of charge. This software agreement does not address customerspecified modifications or enhancements. These services may be ordered separately. Furthermore,
EdgeTech software upgrades are meant for the sole use of EdgeTech customers. Any reproduction of
EdgeTech-supplied software or file sharing is strictly prohibited.
Software Updates and Enhancements
EdgeTech customers can download new software releases with all modifications and enhancements from
the EdgeTech ftp site. Major software issues, should they occur, will be reported directly to the customer.
New software releases consist of the following:
• Software enhancements that are not on the price list
• Software fixes and changes
• Product integration
• Documentation updates to on-line help
• Tests for compatibility with other modules
Software patches consist of software that has undergone the following:
• Minor software enhancements
• Software fixes and changes
EdgeTech customers are entitled to contact
to report a difficulty, to discuss a problem or to receive advice on the best way to perform a task. When
contacted, EdgeTech Customer Service will do the following:
• Respond within 24 hours via Telephone, Facsimile, and E-mail Support
• Immediately attend to serious problems affecting operations
• Attempt to find an immediate work-around
EDGETECH CUSTOMER SERVICE by telephone, facsimile, or e-mail
Page 8

viii
RETURNED MATERIAL AUTHORIZATION
Prior to returning any equipment to EdgeTech, a Returned Material
Authorization (RMA) Number must be obtained from CUSTOMER SERVICE.
RMA Purpose
The RMA Number identifies returned equipment when it arrives at our receiving dock and enables tracking
while at our facility. Refer to RMA number on all documentation and correspondences.
All returned materials must be shipped prepaid. Freight collect shipments will not be accepted. All
equipment should be adequately insured for shipping, but equipment belonging to EdgeTech must be
insured for full value.
If there is more than one item per consignment, include a packing with the shipment. An invoice can
double as a packing slip only when the contents are clearly numbered and identified on the invoice.
Shipper’s Oath:
"I, ______________________________, declare that the articles herein specified are the growth,
produce, or manufacture of the United States; that they were exported from the
United States from the port of _____________________, on or about _______________; that they
are returned without having been advanced in value or improved in condition by any
process of manufacture or any other means; and that no drawback, or allowance has
been paid or admitted hereof."
CAUTION! Never attempt to ship a Portable Topside in its Storm CaseTM
alone. Although rugged, these cases are not intended to be used as
shipping containers and the delicate internal components could be
damaged. Shipping in this manner will void any warranties.
NOTE: All shipping charges shall be the responsibility of the customer,
unless under warranty, as EdgeTech will pay for return shipping.
NOTE: For International Shipments valued over $1000, the following
Shipper's oath must be sent with the invoice.
Signed ______________________________
Page 9

ix
CUSTOMER SERVICE
Customer service personnel at EdgeTech are always eager to hear from users of our products. Your
feedback is welcome, and is a valuable source of information which we use to continually improve these
products. Therefore, we encourage you to contact EdgeTech Customer Service to offer any suggestions
or to request technical support:
E-mail: service@edgetech.com
Mail: 4 Little Brook Road
West Wareham, MA 02576
Telephone: (508) 291-0057
Facsimile: (508) 291-2491
24-Hour Emergency
Technical Support Line: (508) 942-8043
NOTE: Please have your system Serial Number available when contacting
Customer Service.
For more information please go to www.EdgeTech.com.
Page 10

x
COMPANY BACKGROUND
EdgeTech (formerly EG&G Marine Instruments) traces its history in Underwater Data Acquisition and
Processing back to 1966. EdgeTech has designed, developed, and manufactured products, instruments,
and systems — for the acquisition of underwater data, including marine, estuarine, and coastal
applications — for over 50 years.
EdgeTech responds to the needs of the Scientific, Naval, and Offshore communities by providing industryleading equipment — such as Sub-Bottom Profilers, Side Scan Sonar, Acoustic Releases, USBL Positioning
Systems, and Bathymetric Systems — that have become standards in the industry.
EdgeTech consistently anticipates and responds to future needs with an active Research and Development
Program. Current efforts are focused on adapting new cutting-edge acoustic technology.
Page 11

xi
TABLE OF CONTENTS
ATTENTION – READ THIS FIRST! ......................................................................................................... iii
HARDWARE VARIATIONS AND COMPATIBILITY .................................................................................. iv
ABOUT THIS DOCUMENT .................................................................................................................... v
Purpose of this Manual ............................................................................................................................. v
Liability ...................................................................................................................................................... v
Warnings, Cautions, and Notes ................................................................................................................. v
Revision History ........................................................................................................................................ v
WARRANTY STATEMENT ................................................................................................................... vi
SOFTWARE SERVICE OVERVIEW ........................................................................................................ vii
Software Updates and Enhancements.................................................................................................... vii
RETURNED MATERIAL AUTHORIZATION .......................................................................................... viii
RMA Purpose ......................................................................................................................................... viii
CUSTOMER SERVICE .......................................................................................................................... ix
COMPANY BACKGROUND .................................................................................................................. x
TABLE OF CONTENTS ......................................................................................................................... xi
LIST OF FIGURES .............................................................................................................................. xiv
LIST OF TABLES ................................................................................................................................ xv
1.0: OVERVIEW ...............................................................................................................................1-1
1.1 Advantages of Full Spectrum CHIRP Technology .......................................................................... 1-1
1.1.1 Compared to Older Technology ............................................................................................. 1-1
1.1.2 Transducer Array .................................................................................................................... 1-2
1.1.3 Resolution ............................................................................................................................... 1-2
1.1.4 Processing Enhancements ...................................................................................................... 1-2
1.1.5 Reduction of Side Lobes and High Repeatability .................................................................... 1-3
1.2 Major Components ....................................................................................................................... 1-3
1.2.1 Deck Unit ................................................................................................................................ 1-5
1.2.2 T/R Box Assembly ................................................................................................................... 1-6
1.2.3 Transducer Array .................................................................................................................... 1-7
1.3 Applications .................................................................................................................................. 1-8
2.0: SPECIFICATIONS .......................................................................................................................2-1
2.1 Deck Unit Specifications................................................................................................................ 2-1
Page 12

xii
2.1.1 Processor Specifications ......................................................................................................... 2-1
2.1.2 Amplifier Specifications .......................................................................................................... 2-2
2.1.2.1 Power Output ............................................................................................................. 2-3
2.1.2.2 Performance ............................................................................................................... 2-3
2.1.2.3 Construction ............................................................................................................... 2-4
2.1.3 Display, Keyboard, and Mouse Specifications ........................................................................ 2-4
2.2 T/R Box Specifications ................................................................................................................... 2-4
2.3 Technical Drawings ....................................................................................................................... 2-4
2.4 Spider & Array Specifications ........................................................................................................ 2-7
2.5 Technical Drawings ....................................................................................................................... 2-7
KT-216H Specifications: ..................................................................................................................... 2-9
KT-106D Specifications:...................................................................................................................... 2-9
2.5.1 Array Sizes ............................................................................................................................ 2-11
2.6 Signal Cable Specifications .......................................................................................................... 2-18
3.0: CONTROLS & CONNECTIONS .....................................................................................................3-1
3.1 Deck Unit Controls and Indicators ................................................................................................ 3-1
3.2 Deck Unit Connections .................................................................................................................. 3-3
4.0: INSTALLATION ..........................................................................................................................4-1
4.1 Unpacking & Inspecting ................................................................................................................ 4-1
4.2 Topside Installation ....................................................................................................................... 4-2
4.2.1 Power Supply .......................................................................................................................... 4-2
4.2.2 Use of an Uninterruptable Power Supply............................................................................... 4-2
4.2.3 Selecting the Power Amplifier Input Power Voltage .............................................................. 4-2
4.2.4 Changing to a Non-US Power Plug ......................................................................................... 4-2
4.2.5 Navigation Interface ............................................................................................................... 4-3
4.2.6 Deck Unit Placement .............................................................................................................. 4-3
4.3 Hull Mount Array Installation ....................................................................................................... 4-3
4.4 Connecting the System ................................................................................................................. 4-5
5.0: OPERATION ..............................................................................................................................5-1
5.1 Activating the System ................................................................................................................... 5-1
5.2 File Format .................................................................................................................................... 5-1
5.2.1 EdgeTech’s Native JSF Format ................................................................................................ 5-1
Page 13

xiii
5.2.2 Standard SEG-Y Format .......................................................................................................... 5-1
5.2.3 Palette File Format ................................................................................................................. 5-2
5.3 Triggering and Coupling ................................................................................................................ 5-2
6.0: MAINTENANCE .........................................................................................................................6-1
6.1 Hard Drive Disk ............................................................................................................................. 6-1
6.2 Array Connectors .......................................................................................................................... 6-1
7.0: TROUBLESHOOTING .................................................................................................................7-1
7.1 Freq. Plots and Raw Data Time Series Analysis Using J-STAR ....................................................... 7-1
7.2 System Does Not Operate ............................................................................................................. 7-4
7.2.1 Symptom / Probable Cause .................................................................................................... 7-5
7.2.2 Poor Image Quality or Performance Issues ............................................................................ 7-6
7.3 Sonar Errors .................................................................................................................................. 7-6
A.0: SYSTEM RESTORE .................................................................................................................... A-1
B.0: FAQ: FREQUENTLY ASKED QUESTIONS ..................................................................................... B-1
C.0: NAVIGATION SYSTEMS ............................................................................................................ C-1
C.1 NMEA Approved Sentence Structure ........................................................................................... C-1
C.2 Port Parameters ............................................................................................................................ C-1
C.3 Port Selection ................................................................................................................................ C-2
C.4 Inputs ............................................................................................................................................ C-2
GLL – Geographic Position – Latitude/Longitude ................................................................... C-3
GXY Geographic Position X and Y Coordinates ....................................................................... C-3
GUU – Geographic Position – X and Y Coordinates ................................................................ C-4
GGA – Global Positioning System Fix Data ............................................................................. C-4
RMA – Recommended Minimum Specific Loran-C Data ........................................................ C-5
RMC – Recommended Minimum Specific GNSS Data ............................................................ C-5
VTG – Track Made Good and Ground Speed.......................................................................... C-5
ZDA – Time & Date ................................................................................................................. C-6
HDG - Heading, Deviation and Variation ................................................................................ C-6
EVT – Event * Annotation (EdgeTech Custom) ...................................................................... C-7
EMA: Event, Set Mark & Annotation (EdgeTech Custom) ...................................................... C-8
C.5 Serial Port Connections ................................................................................................................. C-9
C.6 Troubleshooting ............................................................................................................................ C-9
Page 14

xiv
LIST OF FIGURES
Figure 1-1: Overall System Diagram (2x2 Configuration) .......................................................................... 1-4
Figure 1-2: 3200 Rack Mount Processor .................................................................................................... 1-5
Figure 1-3: T/R Box (Interior & Exterior) .................................................................................................... 1-6
Figure 1-4: Spider Array ............................................................................................................................. 1-7
Figure 1-5: Single Transducer..................................................................................................................... 1-7
Figure 1-6: 2x2 Sea Chest Array ................................................................................................................. 1-7
Figure 2-1: Topside Processor Internals ..................................................................................................... 2-2
Figure 2-2: T/R Box Assembly Drawing - 0007914 ..................................................................................... 2-5
Figure 2-3: T/R Box Wiring Diagram - 0004638 ......................................................................................... 2-6
Figure 2-4: Spider Wiring Diagram - 0009969 ............................................................................................ 2-8
Figure 2-5 : KT-106 Non-Symmetrical Array Configurations .................................................................... 2-10
Figure 2-6: Deck Cable, T/R Box, and Spider Wiring Diagram (2x2 Configuration) ................................. 2-12
Figure 2-7: Single Transducer Drawing - 0013579 ................................................................................... 2-13
Figure 2-8: 2x2 Transducer Configuration - 0011720 .............................................................................. 2-14
Figure 2-9: 3x3 Transducer Configuration - 0015753 .............................................................................. 2-15
Figure 2-10: 4x4 Transducer Configuration - 0013960 ............................................................................ 2-16
Figure 2-11: 5x5 Transducer Configuration - 0016713 ............................................................................ 2-17
Figure 2-12: Topside Unit Deck Cable for Hull Mount Systems (Female) Amphenol #97-3106A-20-33F2-18
Figure 2-13: Female Marshal Connector – 86-5FC (Deck Cable to T/R Box Connection) ........................ 2-19
Figure 2-14: Male Marshal Connector – 86-5MC (T/R Box to Deck Cable Connection) .......................... 2-19
Figure 2-15: Deck Cable Schematic - 0002976 ......................................................................................... 2-20
Figure 3-1: Topside Front Panel Controls and Connections....................................................................... 3-2
Figure 3-2: Topside Rear Panel Controls and Connections ........................................................................ 3-4
Figure 3-3: Rear Panel Schematic - 0004957 ............................................................................................. 3-5
Figure 7-1: Graph Display Tab .................................................................................................................... 7-2
Page 15

xv
LIST OF TABLES
Table 2-1: Overall Physical Deck Unit Specs .............................................................................................. 2-1
Table 2-2: Processor Specifications ........................................................................................................... 2-1
Table 2-3: Power Amp Specifications: Power Output ................................................................................ 2-3
Table 2-4: Power Amp Specifications: Performance ................................................................................. 2-3
Table 2-5: Power Amp Specifications: Construction .................................................................................. 2-4
Table 2-6: Display, Keyboard, and Mouse Specifications .......................................................................... 2-4
Table 2-7: Physical Specifications of T/R Box ............................................................................................. 2-4
Table 2-8: General Array Specifications ..................................................................................................... 2-7
Table 2-9: KT-216A2H Array Specifications................................................................................................ 2-9
Table 2-10: KT-106D Array ......................................................................................................................... 2-9
Table 2-11: Array Size vs. Expected Signal-to-Noise Ratio (SNR) ............................................................. 2-11
Table 2-12: Signal Cable Specifications .................................................................................................... 2-18
Table 2-13: Deck Cable Pinouts................................................................................................................ 2-18
Table 2-15: Deck CABLE Connector Pinouts............................................................................................. 2-19
Table 4-1: AC Power Cord Wiring .............................................................................................................. 4-2
Table 7-1: Troubleshooting Causes and Solutions ..................................................................................... 7-5
Table 7-2: Image Quality or Performance Issues ....................................................................................... 7-6
Table 7-3: Troubleshooting Sonar Errors ................................................................................................... 7-6
Table C-1: NMEA Approved Sentence Structure ....................................................................................... C-1
Table C-2: Port Parameters ........................................................................................................................ C-1
Table C-3: GLL Geographic Position – Latitude/Longitude ........................................................................ C-3
Table C-4: GXY Geographic Position X and Y Coordinates ......................................................................... C-3
Table C-5: GUU – Geographic Position – X and Y Coordinates .................................................................. C-4
Table C-6: GGA – Global Positioning System Fix Data ............................................................................... C-4
Table C-7: VTG – Track Made Good and Ground Speed ............................................................................ C-5
Table C-8: ZDA – Time and Date ................................................................................................................ C-6
Table C-9: HDG: Heading, Deviation, and Variation .................................................................................. C-6
Table C-10: EVT – Event * Annotation (EdgeTech Custom) ....................................................................... C-7
Table C-11: EMA: Event, Set Mark & Annotation ...................................................................................... C-8
Table C-12: 9 Male Pin Out ........................................................................................................................ C-9
Page 16

Page 17

1-1
1.0: OVERVIEW
The 3300 Hull Mounted Sub-Bottom Profiler (3300-HM SBP) Full Spectrum Sonar is a versatile, wideband,
FM sub-bottom profiler that generates cross-sectional images of the seabed and collects digital normal
incidence reflection data over a wide variety of frequency ranges.
The system transmits an FM pulse that is linearly swept over a full spectrum frequency range (also called
a “CHIRP pulse”). The reflections, measured by the system, are displayed as shades of gray or color on a
computer monitor. Data is stored real-time into a large capacity hard drive, and can be archived to a
CD/DVD ROM or thumb drive.
1.1 Advantages of Full Spectrum CHIRP Technology
EdgeTech’s Full Spectrum Technology has several distinct advantages over conventional sub-bottom
systems, including increased penetration and higher resolution. The tapered wave form spectrum results
in images that have virtually constant resolution with depth.
The 3300-HM SBP system generates virtually no side lobes, due to the wide bandwidth of the sweep
frequency. This bandwidth has an effect of smearing the side lobes of the transducer, resulting in a beam
pattern with almost no side lobes.
Because the FM pulse is generated by a digital-to-analog converter with a wide dynamic range and a
transmitter with linear components, the energy, amplitude, and phase characteristics of the acoustic
pulse can be precisely controlled. This precision produces the high repeatability and signal definition
required for sediment classification.
The operating frequency range is determined by the acoustic characteristics and mounting schematic of
the transducers. EdgeTech offers various transducer configurations that can transmit acoustic pulses with
different center frequencies and bandwidths. Pulse selection is made by the operator while profiling to
achieve the best imagery.
For detailed information regarding configuration options, contact
EDGETECH CUSTOMER SERVICE.
1.1.1 Compared to Older Technology
EdgeTech’s 3300-HM SBP Full Spectrum sonar system transmits FM pulses. FM pulses have been used in
radar and sonar systems for over 40 years and are sometimes referred to as CHIRP or Swept-frequency
pulses. The advent of modern digital signal processing components has provided tools for realizing the
potential of these methods.
Full Spectrum signal processing technology does not use a conventional matched filter (the typical
correlation filter used to compress FM signals) to process wide band signals. It uses proprietary amplitude
and phase weighting functions for the transmitted pulse and a pulse compression filter that maximizes
the Signal-to-Noise Ratio (SNR) of the acoustic images over a wide band of operating frequencies. These
Page 18

1.0: OVERVIEW 1-2
functions provide a significant SNR improvement in the acoustic image over other impulse and CHIRP
sonar with band-limited components that are limited in dynamic range.
1.1.2 Transducer Array
Acoustic projectors in the 3300-HM SBP system are constructed from wideband, piston-type transducers
and the acoustic receivers are a discrete line array of PZT crystals. The acoustic hull-mounted transducers
are designed for profiling at ship speeds varying from zero (drifting) to 7 knots.
The transducer array receives the low amplitude sub-bottom reflections, while a 24-dB gain preamplifier
amplifies and drives the signal through a 50-meter cable. A software-controlled, programmable gain
amplifier provides a final amplification stage before the signal is digitized with a 16-bit Analog-to-Digital
(A/D) converter at a sampling rate of 24, 40, 50, and 66 kHz. To achieve the theoretical temporal resolution
predicted by the inverse of the bandwidth, the FM pulse is compressed using a digital compression filter.
The correlation process is implemented in real-time, with forward and inverse Fast Fourier Transforms.
The compressed pulse resulting from this signal processing procedure has a time duration approximately
equal to the inverse of the bandwidth of the FM pulse.
1.1.3 Resolution
High temporal resolution allows for the measurement of fine layering. Good resolution is an important
factor in sediment classification, as it provides a more precise impulse response of the sediment, and, in
turn, a realistic picture of the true geologic variability of the seafloor and accurate determination of the
depositional processes. When the time duration of the processed pulse is too large, individual reflections
will be lumped together with random phase causing constructive and destructive interference, thereby
making it difficult to estimate the impedance and examine the geologic processes.
1.1.4 Processing Enhancements
In addition to the resolution improvement, correlation processing achieves a signal processing gain over
the background noise. This gain is approximately ten times the log of the time-bandwidth product. This
improvement is due to the signal having a time duration longer than the inverse of the bandwidth, thus
increasing signal energy without increasing the power of the outgoing pulse. To equal the typical
performance of the Full Spectrum sonar pulse, conventional pulse sonar would have to operate at a peak
pulse power of 100 times greater than the Full Spectrum pulse with a time-bandwidth product of 100.
Another important feature of the Full Spectrum Sub-Bottom Sonar is that the computer generates a signal
that optimizes the performance of the system. The sonar contains many components, each with a unique
dynamic range and linearity characteristic, which are frequency dependent.
In addition to this, the amplitude spectrum of the outgoing pulse is chosen to be approximately Gaussian
in shape in order to limit the side lobe level and temporal resolution losses due to attenuation. As a
wavelet with a Gaussian-shaped spectrum is attenuated by the sediment, energy is lost but its bandwidth
Page 19

1-3
is nearly preserved. Thus, even after being attenuated by sand, the acoustic pulse has approximately the
same resolution as an un-attenuated pulse.
1.1.5 Reduction of Side Lobes and High Repeatability
Full Spectrum sonar has the unique ability to reduce side lobes in the effective transducer aperture. The
wide bandwidth of the sweep frequency has the effect of smearing the side lobes of the transducer and
thus achieving a beam pattern with virtually no side lobes. The effective spatial beam width obtained after
processing the 2-10 kHz signal is 20 degrees measured to -3db points.
Since the transmitted Full Spectrum pulse is highly repeatable, and its peak amplitude is precisely known,
the sediment reflectivity values can be estimated from the peak pulse amplitude measurements of the
bottom returns.
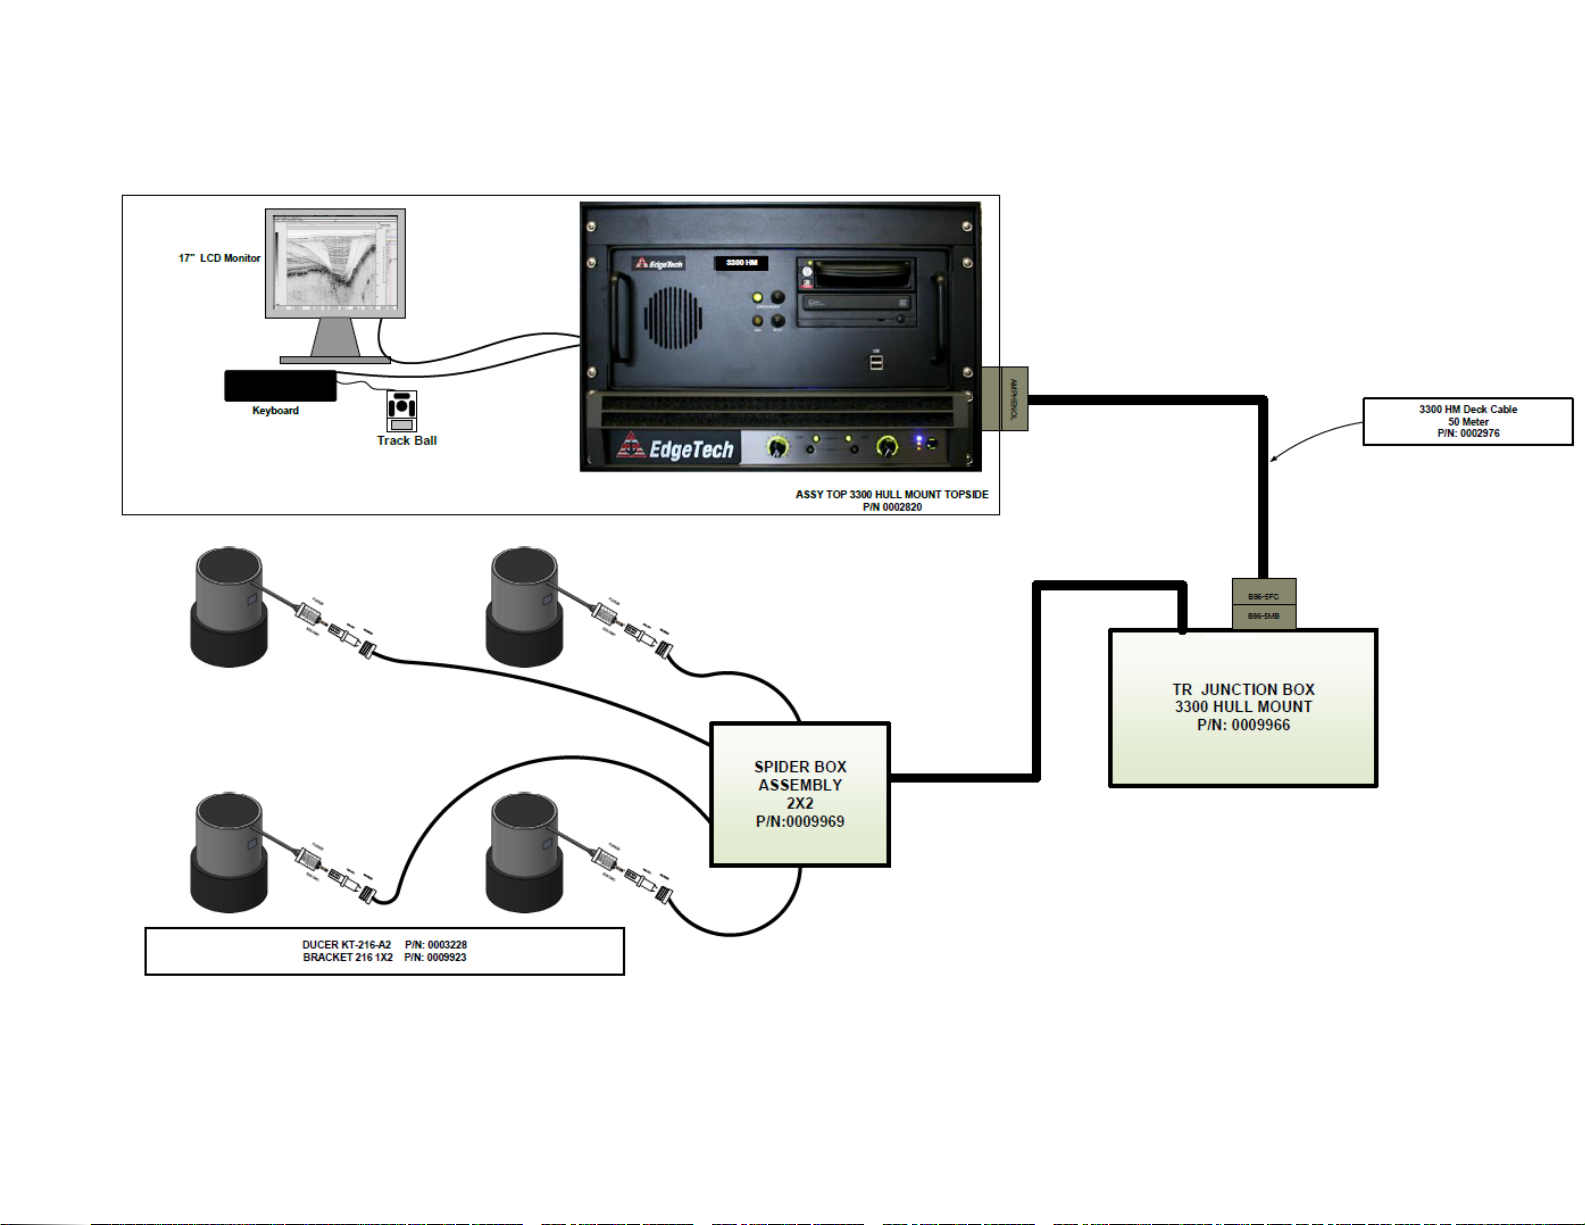
1.2 Major Components
The hull mounted configuration consists of the topside unit, deck cable, T-R box, spider box assembly, and
the transducer arrays (see an example of a 2x2 system configuration is shown in
FIGURE 1-1.
Page 20
1.0: OVERVIEW 1-4
Figure 1-1: Overall System Diagram (2x2 Configuration)
Page 21
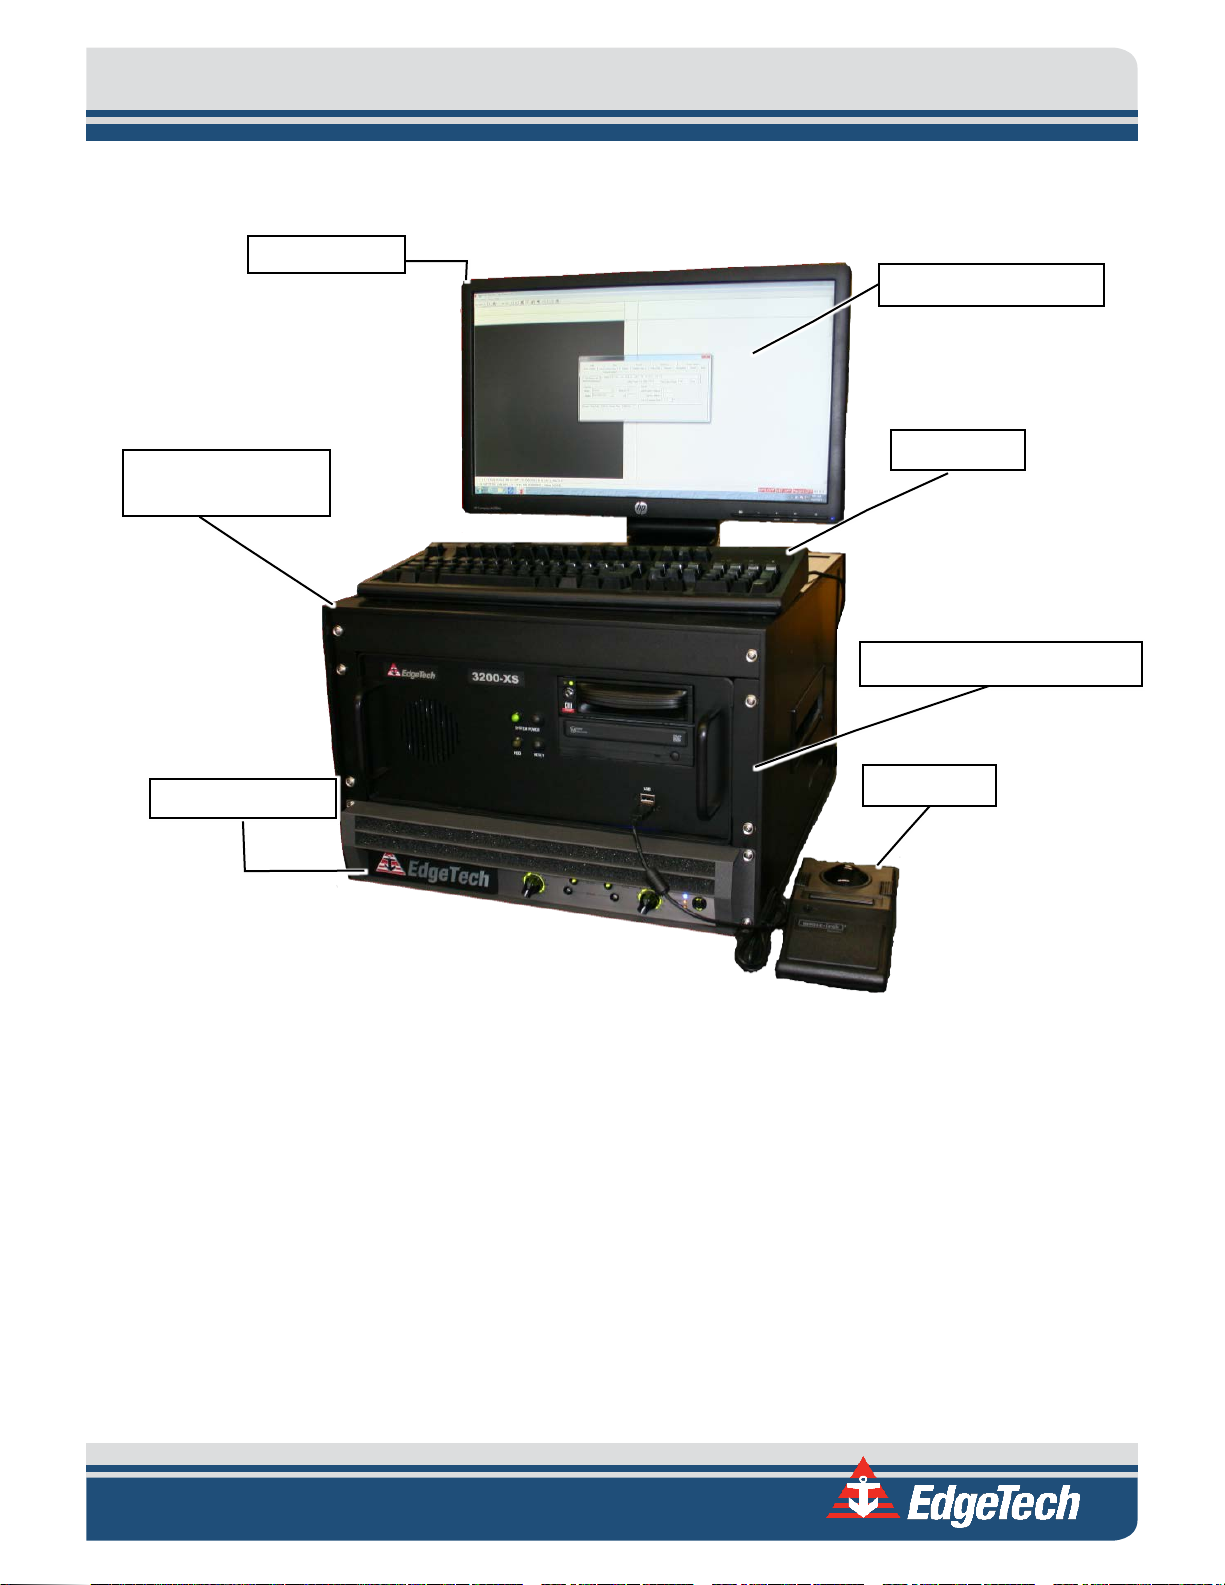
1.2.1 Deck Unit
LCD Monitor
19-inch Rack
Power Amplifier
DISCOVER Software
Keyboard
Trackball
3200-XS Topside Processor
1-5
The Deck Unit consists of a processor, amplifier, and monitor as shown in
Mount enclosure consists of a computer-based controller containing a Sonar Interface Board (SIB). The
SIB stores the transmitted waveform and the correlation filter, and performs the correlation processing
and spherical range correction. At periodic intervals, the SIB sends the transmitted waveform to the 16bit digital-to-analog converter, which generates an analog pilot signal that is amplified by a 2 kW power
amplifier. This amplifier drives the transducer.
The acoustic signal returns from the seafloor are measured by the receiving arrays, and are then increased
by a preamplifier. The output of the preamplifier is connected via the underwater signal cable to a
digitally-controlled amplifier on the sub-bottom board (mounted on the SIB) before being sampled by a
16-bit analog-to-digital converter. The SIB board performs the correlation processing, corrects for
spherical spreading, and transfers the data to the system board.
Figure 1-2: 3200 Rack Mount Processor
FIGURE 1-2. The 19-inch Tack
Page 22
1.0: OVERVIEW 1-6
Connect to array T/R Box
The DISCOVER Sub-Bottom software is supported on Windows 7 OS. The data and control connections to
the DISCOVER Sub-Bottom program are entirely through TCP/IP connections.
EdgeTech’s Full Spectrum sonar systems employ advanced CHIRP technology to obtain high resolution,
low-noise data records. EdgeTech’s advanced CHIRP technology employs long-duration, wide-band,
frequency-modulated transmit pulses. Return sonar echo data is processed to remove the FM carrier, and
produce high-resolution images of the echo field. DISCOVER Sub-Bottom allows monitoring of this normal,
de-CHIRPed, sub-bottom data, as well as raw, CHIRPed data. This latter data type is often useful for
diagnostic purposes.
For compatibility with other EdgeTech products, the DISCOVER Sub-Bottom program interfaces to a
second program that is run in the background called sonar.exe. Sonar.exe interfaces with both the SIB and
the analog interface boards to generate and transmit CHIRP pulses. A startup file launches the sonar.exe
program automatically every time the system is booted.
The 3300-HM SBP interfaces with the ship’s Navigation (GPS, IMU, etc), triggers, motion and heave
sensors, echo sounder, and printers.
The 3300-HM SBP’s computer-based controller and amplifier components are mounted in a rugged
Optima Case. The computer-based controller and amplifier can be removed from Optima case and
installed in a 19-inch rack.
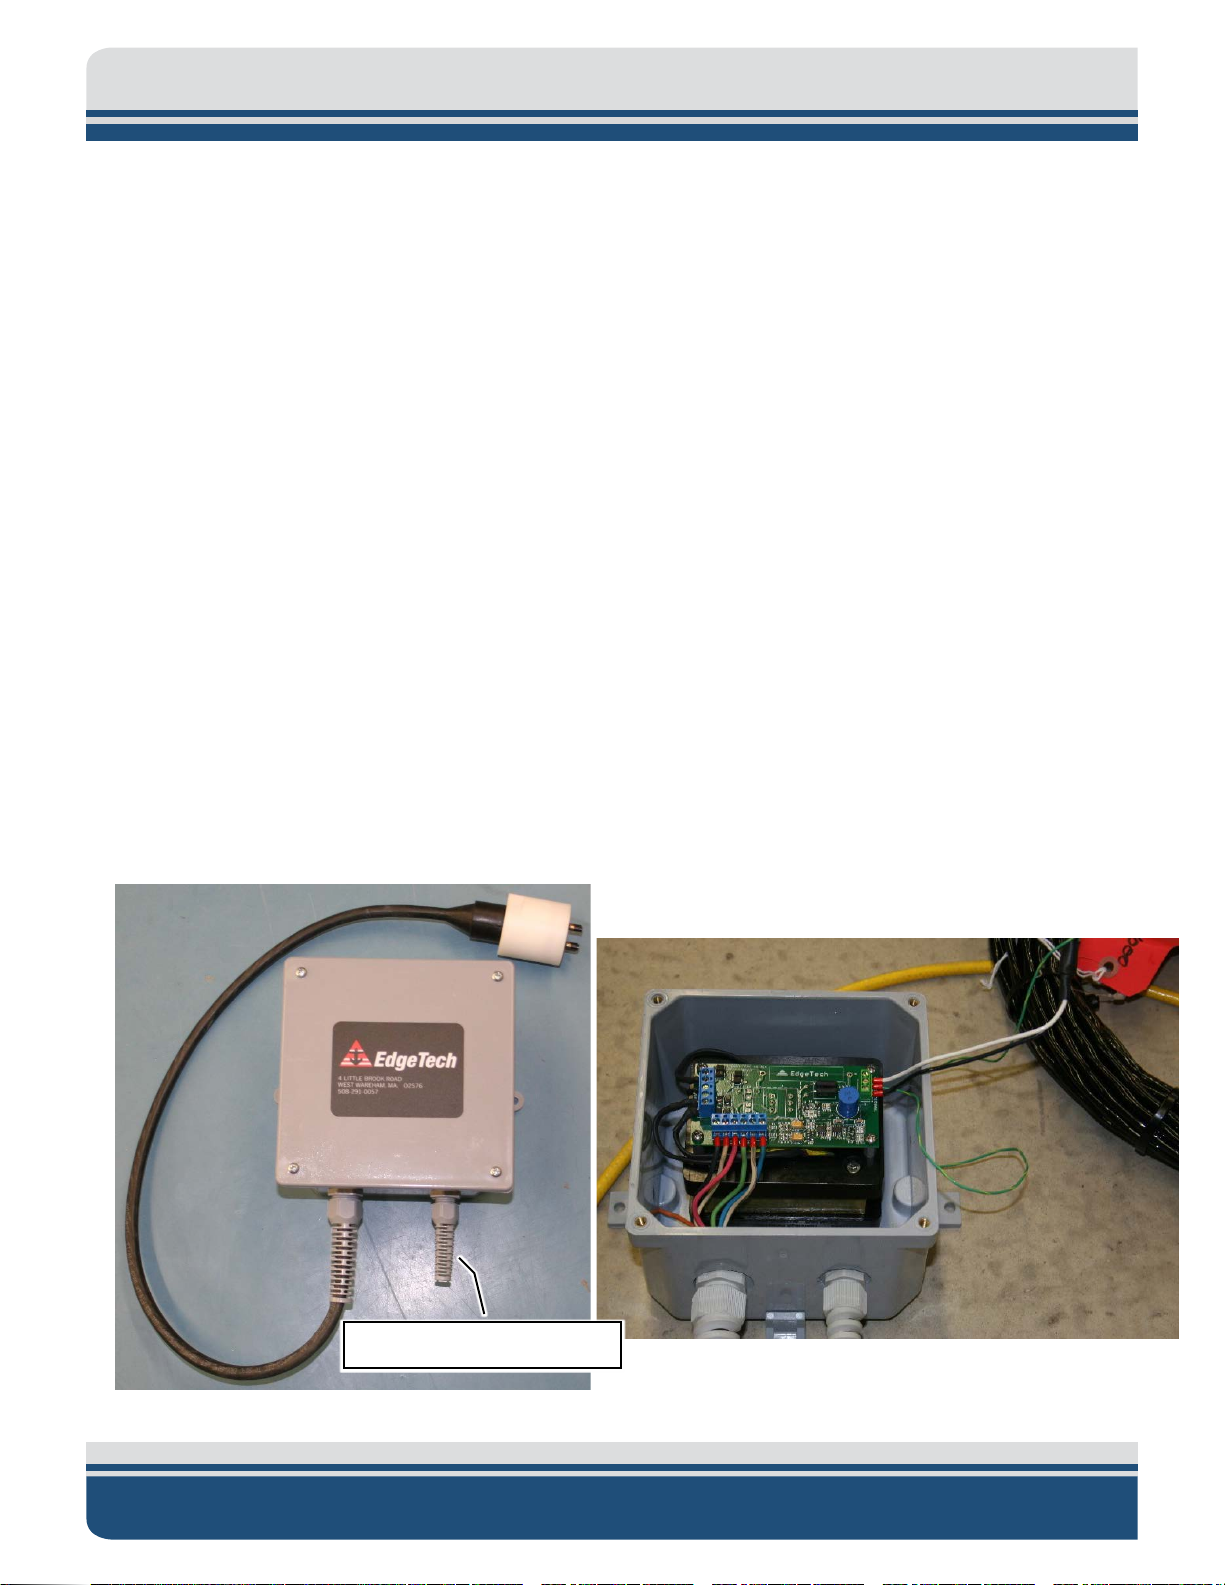
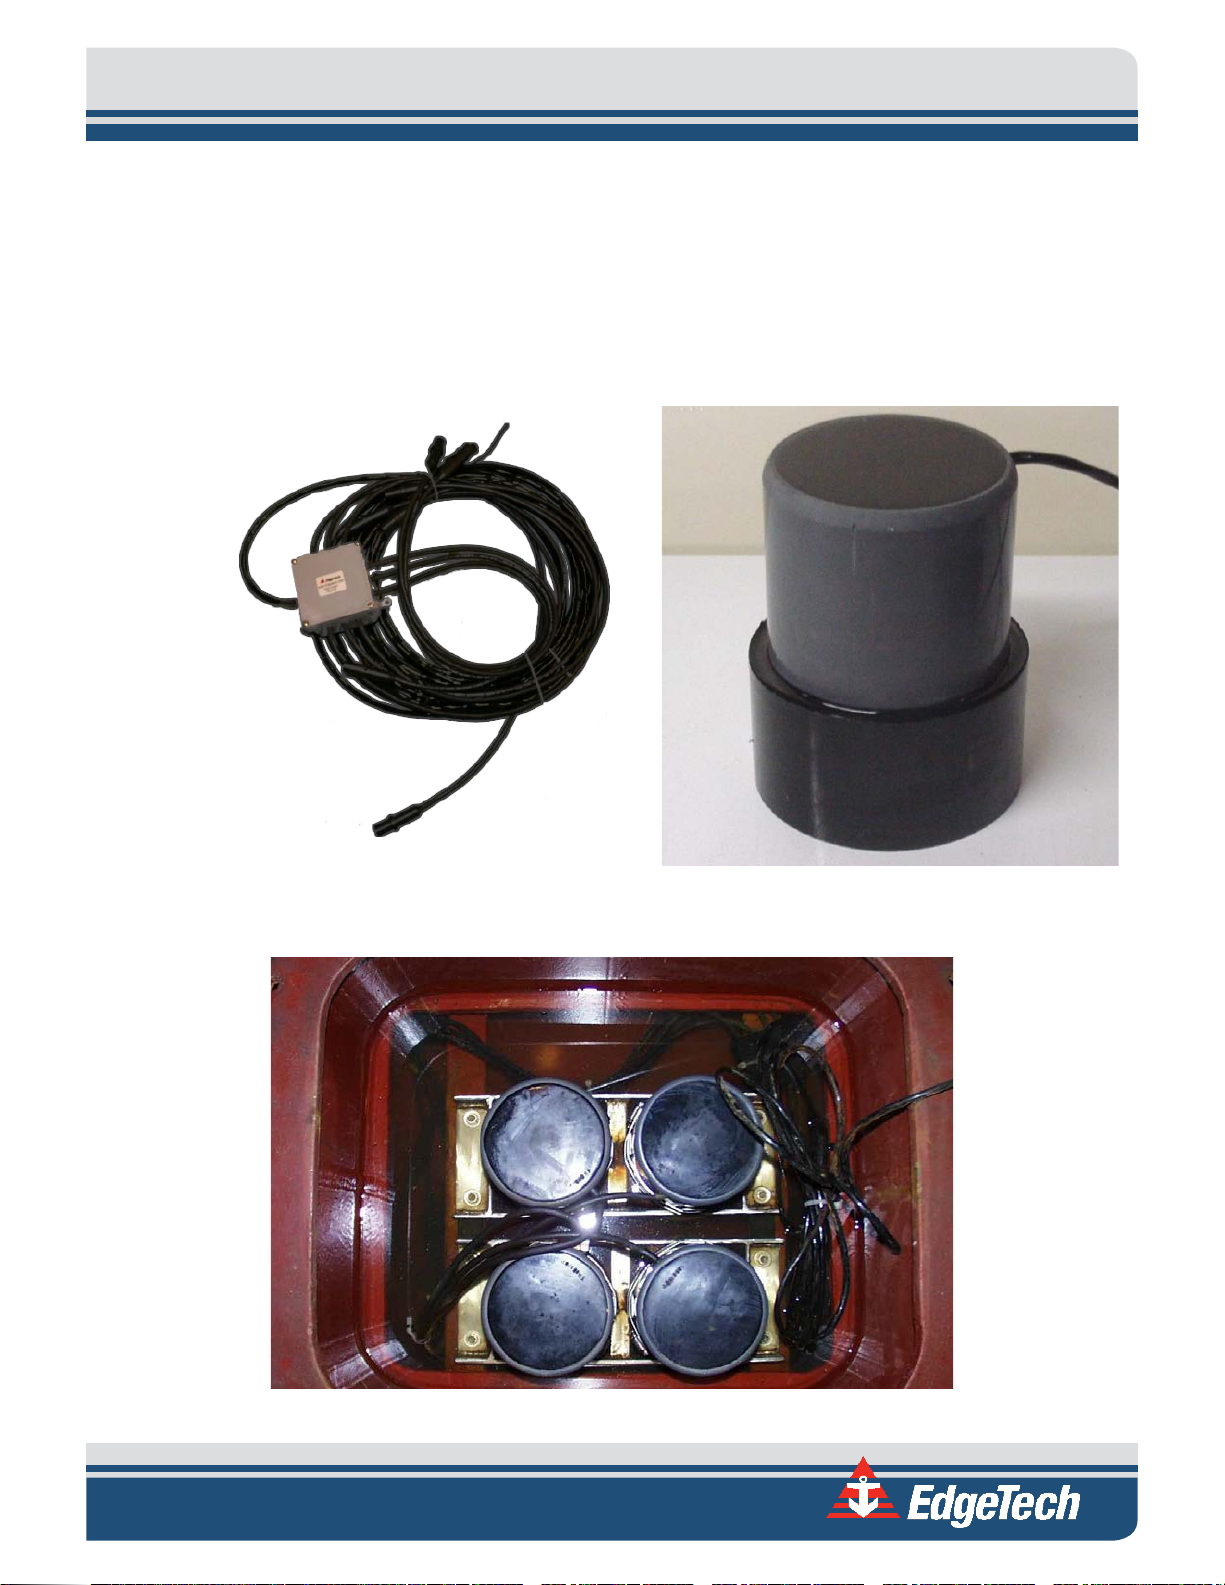
1.2.2 T/R Box Assembly
The T/R Box connects the topside to the transducers array. It contains a pre-amp, a matching transformer,
and the T/R switch. See
FIGURE 1-3 below:
3300 HULL MOUNT SUB-BOTTOM PROFILER 0016732_REV_C
Figure 1-3: T/R Box (Interior & Exterior)
Page 23
1-7
1.2.3 Transducer Array
The transducers for the 3300-HM SBP are mounted in a two-dimensional array inside a closed well on
board a survey vessel. These transducers act as both projectors and hydrophones.
EdgeTech offers a range of transducer arrays, each designed to provide various beam widths. In general,
lower operating frequencies require multiple receiving arrays and larger transducers, therefore requiring
different array sizes.
Figure 1-4: Spider Array
Figure 1-6: 2x2 Sea Chest Array
Figure 1-5: Single Transducer
Page 24

1.0: OVERVIEW 1-8
NOTE: Each transducer is fitted with an 81 cm (32 in.) pigtail with a single
pin (2 contacts) connectors. All Transducer Cables connect to a T/R Box.
1.3 Applications
The 3300-HM SBP has the unique ability to strip-away the world’s oceans during imaging and provide high
resolution sub-bottom images.
This tool lends itself to various tasks that include:
• Imaging fluidized mud to a resolution of 8 cm
• Sediment classification
• Buried pipeline and cable location and routing
• Dredging studies for inlets
• Scour/erosion surveys in rivers and streams
• Marine geotechnical surveys
• Bridge erosion surveys
• Hazardous waste target location
• Geological surveys
• Archeological surveys
• Imaging biologics in water column
• Mapping shellfish populations
• Beach re-nourishment
• Military and Offshore Oil applications
• Full ocean depth sub-bottom imaging
3300 HULL MOUNT SUB-BOTTOM PROFILER 0016732_REV_C
Page 25
2-1
Temperature
0 to 40°C (32 to 104°F)
Portable aluminum case suitable for transit. Unit can be
Size
50W x 60D x 33H cm (19.5x23.5x13 in)
Weight
46 kg (102 lbs.)
Size
76L x 71W x 50H cm (30x28x20 in)
Weight
82 kg (330 lbs.)
Material
Sealed high impact polyurethane case
Main Processor
Intel I7 Quad Core 3.4GHz 8MB Cache
Memory
8GB DDR4 RAM
Hard drive
500GB capacity minimum (operating system)
CDRW
10x4x32 min speed
Operating System
Windows 7 64 bit
Input Power
120 or 220 VAC auto sense
Front Panel: (2) USB2
(4) port RS-232
Analog Input
16-bit resolution, 200 kHz max. sampling rate
Analog Output
16-bit resolution, 200 kHz max. sampling rate
2.0: SPECIFICATIONS
The 3300-HM SBP system is composed of a deck unit, T/R Box, and hull-mounted transducer array. This
section details the sub-components of the system and provides their specifications. For information
related to the provided DISCOVER software, refer to 0019800 in the Manual Folder.
2.1 Deck Unit Specifications
The Deck Unit is composed of a computer processor, trackball, keyboard, LCD monitor, and a power
amplifier, as shown in
2-1, and the minimum specifications for the individual parts are given in the sub-sections that follow.
SPEC TYPE SPECIFICATION VALUE
FIGURE 1-2. The physical specifications for the entire deck unit are provided in TABLE
Environment
Enclosure
Shipping Containers
Humidity 5% to 95% relative
Vibration Normal ship environment
removed from case and mounted in a 19” rack.
Deck Unit (No topside Processor)
Table 2-1: Overall Physical Deck Unit Specs
2.1.1 Processor Specifications
SPECIFICATION VALUE
I/O
Data Acquisition
SIB & A/D-D/A
Rear Panel: (2) USB2 (2) USB3.1
(2) USB3 (2) Ethernet
Table 2-2: Processor Specifications
Page 26
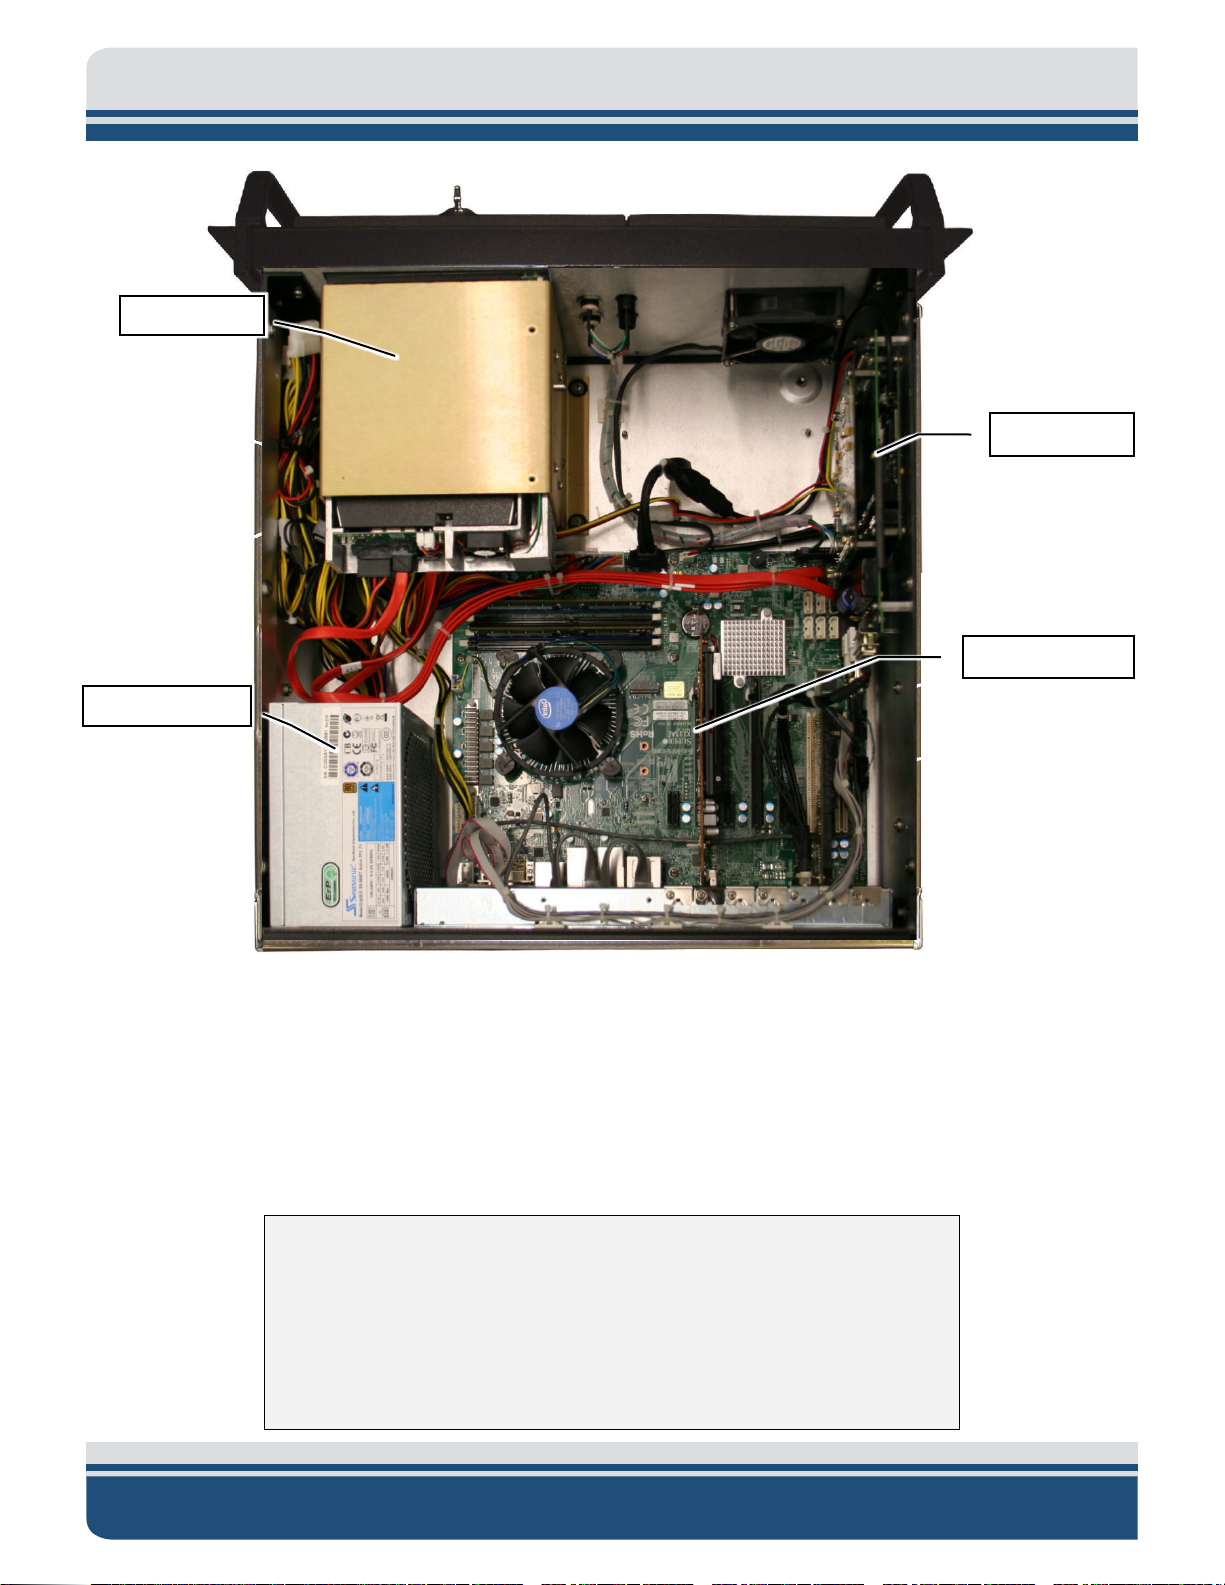
2.0: SPECIFICATIONS 2-2
Tiger Board
Mother Board
Power Supply
Hard Drive
Figure 2-1: Topside Processor Internals
2.1.2 Amplifier Specifications
The amplifier is designed for mounting in standard 19-inch Computer Rack. The power amplifier must stay
close to the topside processor due to the short cables connecting the two units. The amplifier requires at
least 10 cm (4 in.) of clearance behind the heat sink array to permit vertical air flow through the array. In
the rack mount, ensure the environmental operating temperature does not exceed 55°C (131°F).
CAUTION!
Inadequate ventilation can cause overheating. Should this occur, the
thermal protection circuit automatically protects the amplifier. If this
occurs, the system will stop transmitting and DISCOVER will display a
‘HOT’ error message. When a safe operating temperature is restored, the
amplifier will resume normal operation.
3300 HULL MOUNT SUB-BOTTOM PROFILER 0016732_REV_C
Page 27

2-3
4-ohm Bridge
5,600 W
8-ohm Bridge
6,000 W
Frequency Response (at 1 watt, 20 Hz – 20 kHz into
Signal to Noise Ratio
Total Harmonic Distortion (THD) (at 1 watt into 8
THD plus Noise (at full rated power)
< 0.35%, 20 Hz to 20 kHz
Intermodulation Distortion (60 Hz and 7kHz at 4:1,
Damping Factor (20 Hz to 100 Hz at 8 ohms)
> 5000
Crosstalk (below rated power, 20 Hz to 1 kHz)
> 80 dB
Common Mode Rejection (20 Hz to 1 kHz)
> 55 dB, typically > 70 dB
DC Output Offset (Shorted input)
< ± 3 mV
Input Impedance (Nominal)
10 kilohms balanced, 5 kilohms unbalanced
Maximum Input Level
+20 dBu typical
Stereo: 1/2/4/8/16 ohms Bridge
Input Sensitivity (Referenced to 8 ohm rated output)
1.4V, 32 dB gain, and 26 dB gain
Voltage Gain (Referenced to 8 ohm rated output)
37.9 dB to 23.0 dB
Universal AC input, 100-240VAC, 50/60 Hz (±10%).
The specifications for the Power Amplifier (PN 0010855) are shown in TABLE 2-3, TABLE 2-4, and TABLE 2-5.
2.1.2.1 Power Output
SPECIFICATION VALUE
Table 2-3: Power Amp Specifications: Power Output
2.1.2.2 Performance
SPECIFICATION VALUE
8 ohms)
(below rated full bandwidth power, A-weighted)
ohms)
from full rated output to -30 dB)
± 0.25 dB
> 108 dB
< 0.1%
< 0.35%
Load Impedance (Safe with All Types of Loads)
Required AC Mains
Table 2-4: Power Amp Specifications: Performance
Mono: 2/4/8 ohms
Maximum AC mains voltage 264VAC.
Page 28

2.0: SPECIFICATIONS 2-4
Cooling
Dual-zone, microprocessor controlled, continuously variable speed fans, front-to-back airflow
Front Panel
Cast aluminum with integrated handles
Weight
28 pounds (12.7 kg) net, 36 pounds (16.3 kg) shipping.
Dimensions
19 in. (48.3 cm) W x 3.5 in. (8.9 cm) H x 16.2 in. (41.1 cm) D.
Amplifier is protected against reactive loads, faults and shorts. If one channel experiences a
catastrophic failure, the entire amplifier will shut down.
SPECIFICATION
VALUE
Video Display
One High resolution 17” flat panel monitor
Keyboard
High impact industrial keyboard
Trackball
High impact industrial trackball
SPECIFICATION
VALUE
Dimensions (WxDxH):
18 cm x 18 cm x 12 cm
2.1.2.3 Construction
SPECIFICATION VALUE
Protection
Table 2-5: Power Amp Specifications: Construction
2.1.3 Display, Keyboard, and Mouse Specifications
Table 2-6: Display, Keyboard, and Mouse Specifications
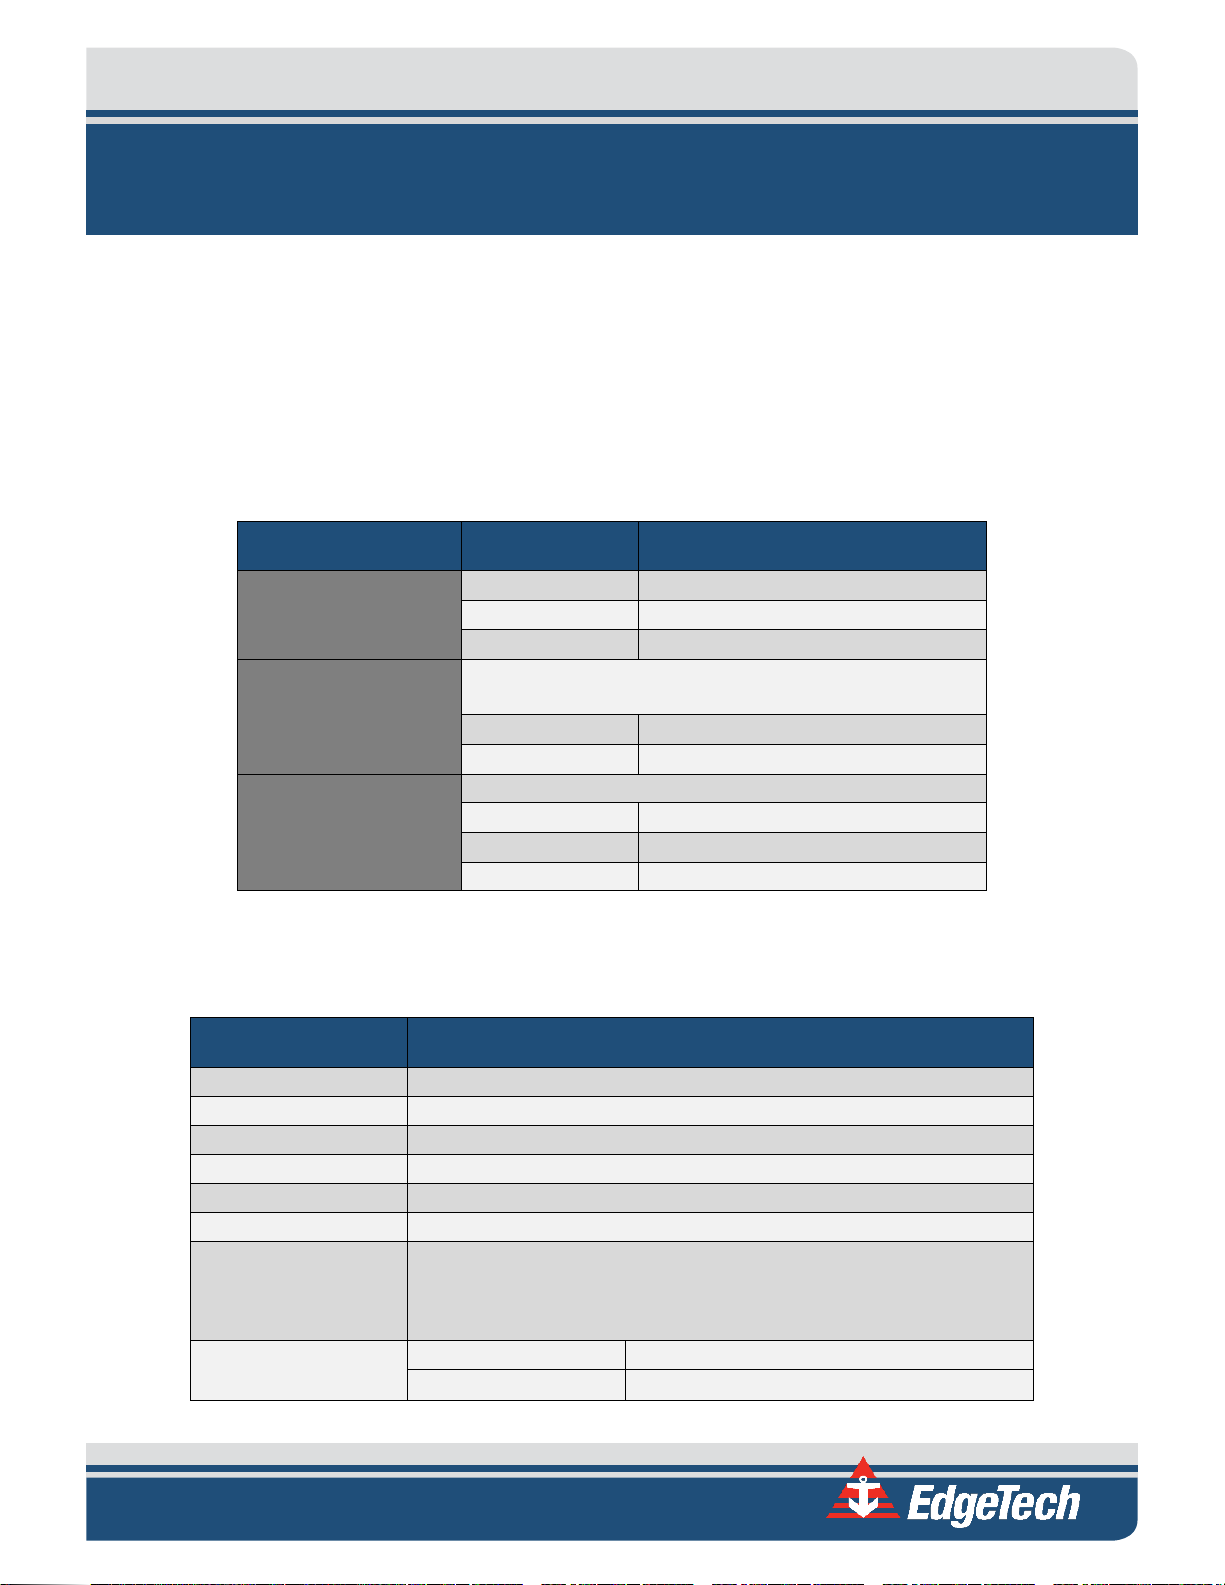
2.2 T/R Box Specifications
Weight: 1.8 kg
Table 2-7: Physical Specifications of T/R Box
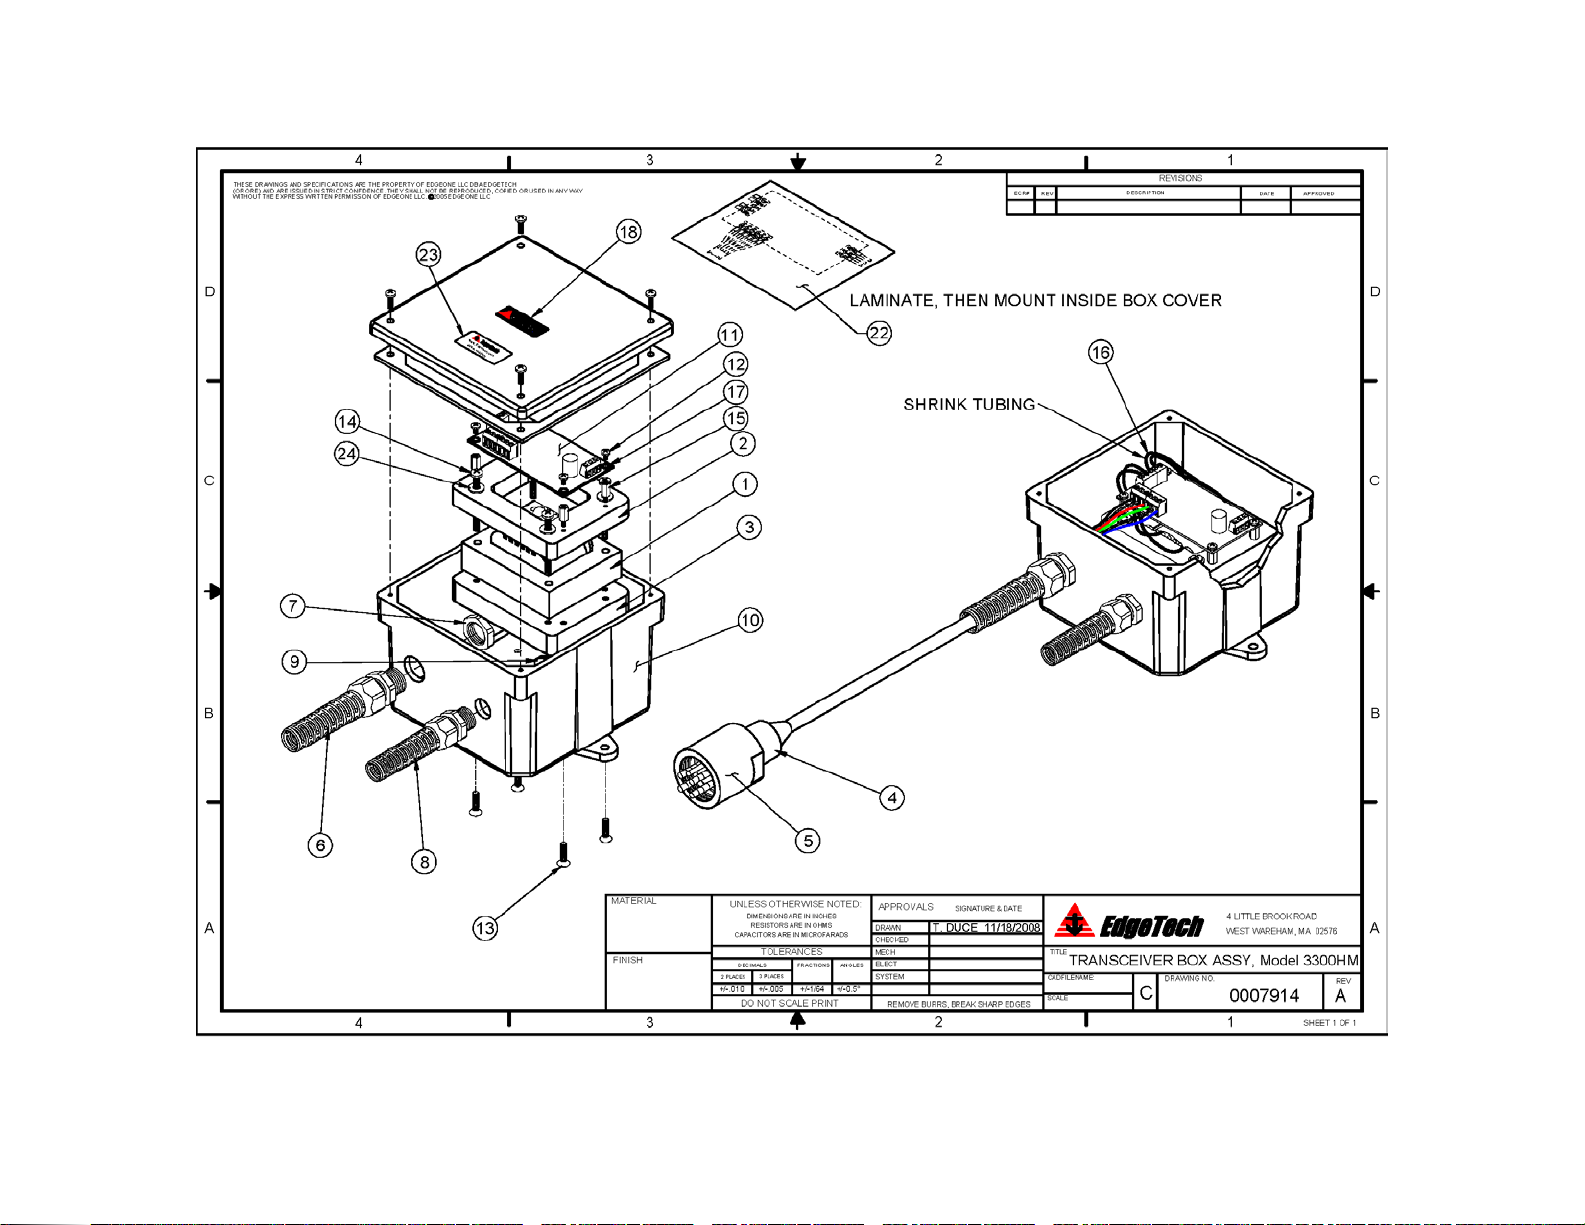
2.3 Technical Drawings
An assembly drawing of the T/R Box is provided in FIGURE 2-2.
A wiring diagram of the T/R Box is provided in
FIGURE 2-3.
3300 HULL MOUNT SUB-BOTTOM PROFILER 0016732_REV_C
Page 29
2-5
Figure 2-2: T/R Box Assembly Drawing - 0007914
Page 30

2-6
Figure 2-3: T/R Box Wiring Diagram - 0004638
Page 31
2-7
SPECIFICATION
VALUE
2.4 Spider & Array Specifications
The standard transducers for the 3300-HM SBP system have a good frequency response from 2 kHz to 16
kHz. Multiple transducers are mounted to give various beam width options. Specifications for the array
are given in
TABLE 2-6 and a wiring diagram for the spider box is provided in FIGURE 2-4.
Pulse Type Full Spectrum CHIRP FM
Pulse Length From 5 to 100 ms
Bandwidth From 500Hz to 12kHz depending on application
Trigger In TTL negative edge triggered
Trigger Out TTL negative edge triggered. Minimum 5ms long pulse (Lower BNC)
Sampling Rate 20, 25, 40,50 kHz depending on the pulse upper frequency
Acoustic Power
Resolution
Beam width 20 to 40 degrees depending on transducer configuration
Minimum array height 5 meters above seafloor
Table 2-8: General Array Specifications
NOTE: The 3300-HM SBP system is an application-specific unit; using it
for purposes other than sonar data acquisition is strongly discouraged.
The above information is for documentation purposes only.
Specifications are subject to change without notice.
2.5 Technical Drawings
About 212 dB ref 1µPa peak at center frequency of system
From 4 to 50 cm of vertical resolution depending on pulse vehicle
and pulse bandwidth
A wiring diagram of the spider box in a 2x2 configuration is shown in FIGURE 2-4.
Page 32

2.0: SPECIFICATIONS 2-8
_C
Figure 2-4: Spider Wiring Diagram - 0009969
Page 33

TABLE 2-7 and TABLE 2-8 show the specifications for the KT-216H and KT-106D arrays, respectively:
SPECIFICATION
VALUE
Frequency Range:
2 - 12 kHz
2 - 5 kHz, 100 ms
2 - 12 kHz, 3 ms
Vertical Resolution
(depends on pulse selected):
In Course Calcareous Sand:
6 m
In Clay:
80 m
Directivity Index
(per Array Size):
2 X 2
15 dB
3 X 3
18 dB
4 X 4
21 dB
5 X 5
23 dB
Beam Width (per Array Size):
Beam Width (per Array Size):
6 kHz Center Frequency
2 X 2
33°
3 X 3
25°
4 X 4
20°
5 X 5
17°
SPECIFICATION
VALUE
Frequency Range:
1 - 6 kHz
1.2 - 5.0 kHz, 66 ms
1.5 - 6.5 kHz, 12 ms
Vertical Resolution
(depends on pulse selected):
In Course Calcareous Sand:
6 m
In Clay:
80 m
Directivity Index
(per Array Size):
2 X 2
13 dB
5†
15 dB
7†
16 dB
3 X 3
17 dB
4 X 4
20 dB
Beam Width
3.75 kHz Center Frequency
KT-216H Specifications:
2 - 6 kHz, 40 ms
Pulses (user selected):
Penetration (typical):
2 - 8 kHz2 - 8 kHz, 40 ms, Wide Band (WB)
2 - 10 kHz, 20 ms
2 - 12 kHz, 20 ms
6 - 10 cm
2-9
4.5 kHz Center Frequency
KT-106D Specifications:
Pulses
(user selected):
Penetration
(typical):
2 X 2
40°
3 X 3
30°
4 X 4
24°
Table 2-9: KT-216A2H Array Specifications
1.5 - 4.5 kHz, 33 ms
1.5 - 4.5 kHz, 12 ms
1.5 - 5.5 kHz, 12 ms
1.5 - 6.0 kHz, 20 ms
6 - 10 cm
5 X 5
20°
† See FIGURE 2-5
(per Array Size):
2 X 2
38°
5†
26°
Table 2-10: KT-106D Array
7†
29°
3 X 3
24°
4 X 4
18°
Page 34

2.0: SPECIFICATIONS 2-10
2
1
3
5 4
6 7
7x Kt-106
2
1
3
5 4
5x Kt-106
NOTES: Vertical resolution is the smallest distinguishable distance
between the peaks of two reflections that can be displayed on the screen
as separate reflectors. Sound energy is reflected to the sonar system
when the transmitted pulse encounters a change in density, and the
resolution of a sonar system is measured by its ability to distinguish
between two adjacent targets. The vertical resolution is dependent on
the transmitted CHIRP pulse bandwidth. It is theoretically calculated by
the product of the transmitted pulse length (inverse of the bandwidth)
and half the speed of sound in water (approximately 750m/s).
The value for sub-bottom penetration is the maximum distance beneath
the sea floor that a step change of 10% in density can be seen on the subbottom display. This assumes the sediment is gas-free (without organic
materials), and the lowest frequency of the pulse spectrum is
transmitted. Lower frequencies reduce attenuation (sound absorption).
Many factors contribute to the penetration performance of a Hull
Mounted system. However, one of the essential factors in determining
the performance of a CHIRP pulse, along with the expected penetration
and resolution, is the center frequency of the CHIRP pulse? Therefore, for
example if you have a pulse of 1-8 kHz then you use the center frequency
(4.5 kHz) to determine resolution and penetration. The size of the array
is another contributing factor, as low frequency efficiency goes up as the
side of the array is increased due to increased directivity.
Figure 2-5 : KT-106 Non-Symmetrical Array Configurations
3300 HULL MOUNT SUB-BOTTOM PROFILER 0016732_REV_C
Page 35

2-11
ARRAY SIZE
EXPECTED SNR
2 X 2
28 dB
3 X 3
31 dB
4 X 4
34 dB
5 X 5
37 dB
2.5.1 Array Sizes
Selection of array size depends on transducer type (KT-216 or KT-106) and the geological survey
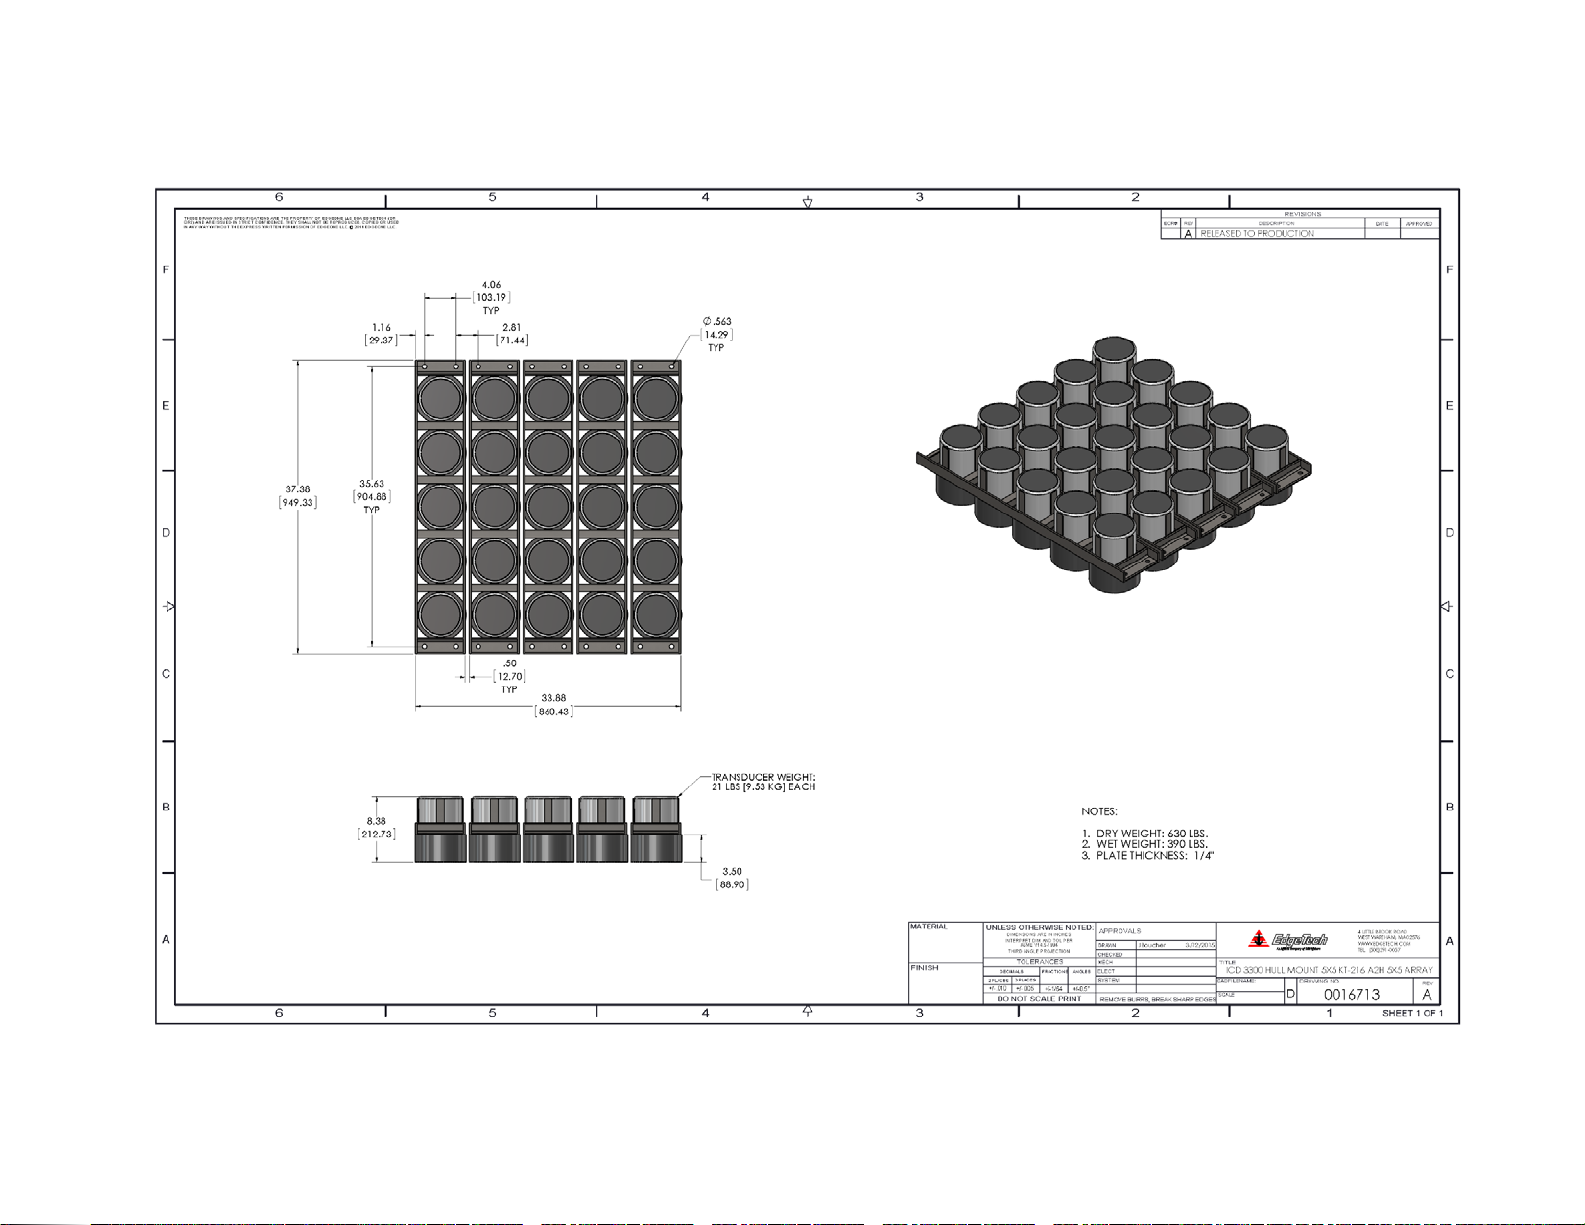
application. The important decision parameter is the water depth in which the system is to be used. For
most deployments to 3000 meters, a 4 x 4 array will provide the needed performance. A 2 x 2 array should
be considered only for coastal application and water depths to 300 meters. Only a 5 x 5 array can be used
for full ocean depth.
The following is a matrix of Signal to Noise Ratio for each array size. It assumes sea state 5, flow noise of
70 dB (about 10-knots), a loss in typical seafloor sediments of 10 dB, a 20 ms pulse length, and a bandwidth
of 5 kHz. Several other variables are not included in this matrix. They include hull type and thickness, selfnoise, variations in flow noise, other ship’s speeds, other sea states, and roll and pitch. Nor does it consider
other conditions that could affect the performance, such as a bubble screen.
Table 2-11: Array Size vs. Expected Signal-to-Noise Ratio (SNR)
NOTE: The 2-way transmission coefficient for a 4 kHz center frequency
over a 0.5 inch steel acoustic window is 0.5 (i.e. 50% of the acoustic pulse
amplitude is lost due to the 2-way travel of sound through the plate). The
coefficient reduces with higher frequencies and thicker steel hull.
See the following figures for images of the various array configurations:
FIGURE 2-6: DECK CABLE, T/R BOX, AND SPIDER WIRING DIAGRAM (2X2 CONFIGURATION)
•
• FIGURE 2-7: SINGLE TRANSDUCER DRAWING
• FIGURE 2-8: 2X2 TRANSDUCER CONFIGURATION
• FIGURE 2-9: 3X3 TRANSDUCER CONFIGURATION
• FIGURE 2-10: 4X4 TRANSDUCER CONFIGURATION
• FIGURE 2-11: 5X5 TRANSDUCER CONFIGURATION
Page 36

2-12
Figure 2-6: Deck Cable, T/R Box, and Spider Wiring Diagram (2x2 Configuration)
Page 37

2-13
Figure 2-7: Single Transducer Drawing - 0013579
Page 38

2-14
Figure 2-8: 2x2 Transducer Configuration - 0011720
Page 39

2-15
Figure 2-9: 3x3 Transducer Configuration - 0015753
Page 40

2-16
Figure 2-10: 4x4 Transducer Configuration - 0013960
Page 41
2-17
Figure 2-11: 5x5 Transducer Configuration - 0016713
Page 42

2.0: SPECIFICATIONS 2-18
SPECIFICATION
VALUE
Nominal Cable Weight:
30.8 kg per 100 m (207 lb/1000 ft.)
Voltage Rating:
600 Volts.
Bending Radius:
10 cm (4 in)
Length:
50, 60, or 75 meters (164, 197, or 245 ft.)
PIN
FUNCTION
A
AMPLIFIER OUTPUT SHIELD
B
+12 VDC
C
SEA GROUND
D
DF1000 SHIELD (SUBSCAN ONLY)
E
AMPLIFIER OUTPUT 1
F
DF1000 DATA (SUBSCAN ONLY)
H
AMPLIFIER OUTPUT 2
J
PRE-AMPLIFIER INPUT CHANNEL A
K
PRE-AMPLIFIER COMMON
L
NC M NC
K
J
H
F
E
D
C
B
A
M
L
2.6 Signal Cable Specifications
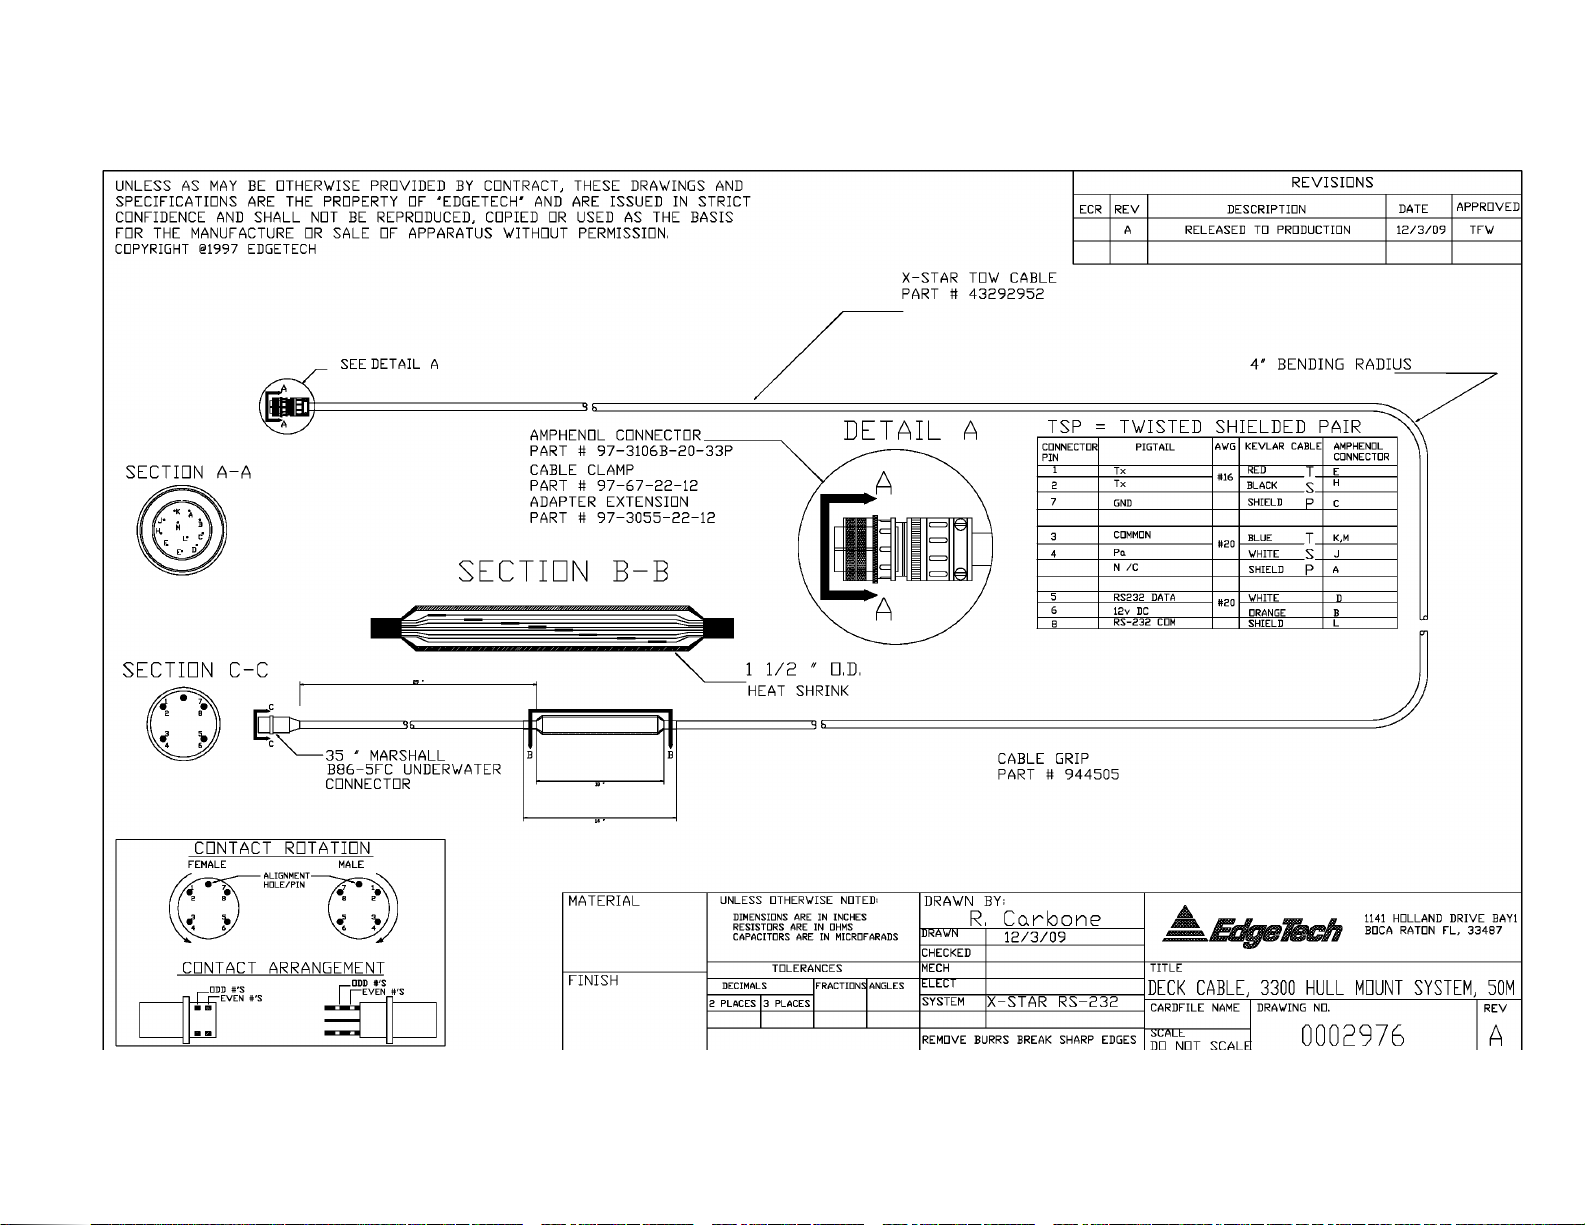
The deck cable is made of six wires twisted and shielded in pairs. The cable has a Kevlar strength member
that provides a 1600 kg (3500 lb.) minimum breaking strength and 295 kg (650 lb.) working strength. See
TABLE 2-12:
Table 2-12: Signal Cable Specifications
The deck cable is terminated at the topside with a military type Amphenol connector and at the T/R Box
with a Marshal underwater wet pluggable connector. The Pinout Diagrams for the signal cable can be
found in
FIGURE 2-12, FIGURE 2-13, and FIGURE 2-14.
FIGURE 2-15 provides the wiring diagram for the signal cable.
Table 2-13: Deck Cable Pinouts
Figure 2-12: Topside Unit Deck Cable for Hull Mount Systems (Female) Amphenol #97-3106A-20-33F
3300 HULL MOUNT SUB-BOTTOM PROFILER 0016732_REV_C
Page 43
PIN
FUNCTION
1
AMPLIFIER OUTPUT 1
2
AMPLIFIER OUTPUT 2
3
PREAMPLIFER COMMON
4
PRE-AMPLIFIER SIGNAL
5
RS-232 DATA
6
+ 12 VDC
7
SEA GROUND
8
RS-232 COMMON
3
1
87
5 6
2
4
4
3
2 1
8 7
56
Figure 2-13: Female Marshal Connector – 86-5FC
(Deck Cable to T/R Box Connection)
2-19
Table 2-14: Deck CABLE Connector Pinouts
Figure 2-14: Male Marshal Connector – 86-5MC
(T/R Box to Deck Cable Connection)
Page 44
2-20
Figure 2-15: Deck Cable Schematic - 0002976
Page 45

3.0: CONTROLS & CONNECTIONS
This section describes the controls and indicators, along with the connections for the 3300-HM SBP.
3.1 Deck Unit Controls and Indicators
The deck unit controls and indicators are as follows, and are shown in FIGURE 3-1:
POWER SUPPLY: Rocker switch. Turns on the power supply in the 3300-HM SBP Topside
Processor. This switch can be left in the on position at all times.
SYSTEM POWER: Push button toggle switch. Turns the 3300-HM SBP Topside Processor on.
POWER: A blue indicator lights up when amplifier is on.
RESET: Momentary push button switch. Resets 3300-HM SBP Topside Processor.
HARD DISK: Red indicator. Indicates when a hard drive on the 3300-HM SBP Topside
3-1
Processor is active.
SYSTEM: Green indicator. Illuminated when 3300-HM SBP Topside Processor is on.
POWER AMP OUT TX1: Red indicator. Flashes when Channel 1 of the Power Amplifier transmits.
POWER AMP OUT TX2: Red indicator. Flashes when Channel 2 of Power Amplifier transmits.
READY: Green indicators. Illuminate when the system is ready to transmit. Upon
power up it will take one to two minutes for indicator to illuminate.
12 VDC OUT TO PREAMP: Test point. Used to measure the 12 VDC voltage applied to the
preamplifier in the T/R Box.
PREAMP 5 VDC: Test point. Used to measure the 5 VDC voltage preamplifier feedback
voltage from the T/R Box.
PREAMP COMMON: Test point. Common ground for the preamplifier.
GND: System ground connection.
DATA: Amp Indicator lights up and blinks when data is being transmitted
CH1 & 2: Defunct dials on the amplifier. Turning these will not affect the
performance or function of the 3300-HM SBP system in any way
Page 46

3.0: CONTROLS & CONNECTIONS 3-2
System Indicator
System Power
Hard Disk
Indicator
Hard Disk
Reset Button
USB
DVD R/RW
Removable 1-TB HDD
Ready
Power, Bridge, &
Data Indicators
CH2 Dial
(defunct)
CH1 Dial
(defunct)
Drive
3300 HULL MOUNT SUB-BOTTOM PROFILER 0016732_REV_C
Connectors
Indicators
Figure 3-1: Topside Front Panel Controls and Connections
Page 47

3-3
3.2 Deck Unit Connections
The topside deck unit connections are as follows, and are shown in FIGURE 3-2 . The wiring diagram can be
seen in
FIGURE 3-3:
TRACKBALL: USB on front or rear panel connects to the trackball.
KEYBOARD: USB on front or rear panel connects to the keyboard.
SEA CABLE: 11-Pin female bulkhead connector. Connects to the deck cable.
MONITOR: Mini display port on rear panel connects to the LCD monitor.
COM 1-NAV: DB-9 female connector. RS-232 serial port connects to the navigation system.
COM 3, 5, 6: DB-9 female connectors. RS-232 serial ports can be used to connect to the navigation
system.
TRIGGER IN: BNC connector. Connects to an external trigger source to enable and disable the sonar.
TRIGGER OUT: BNC connector. Connects to an external sonar system to trigger it.
ETHERNET: (2) RJ-45 connector. Available for connection to a local area network (LAN) and/or
printer.
USB: Front Panel:
(2) USB2
Rear Panel:
(2) USB2
(2) USB3
(2) USB3.1
AC POWER: CEE-type AC input and output connectors. The AC input connector connects to the AC
power source, and the AC output connectors are available for powering LCD monitor
and other equipment, if required.
Page 48

3-4
Power Supply
COM 1-NAV
Connector
COM 3
Connector
Ethernet1
Connectors
Ethernet2
Connectors
TRIGGER IN
Connector
TRIGGER OUT
Connector
USB3 Ports
GND
SEA CABLE Connector
Sonar Data Main I/O
Connector
POWER AMP OUT
TX2 indicator
12 VDC OUT TO
PREAMP test point
TOWFISH PREAMP
5 VDC test point
PREAMP COMMON
POWER AMP OUT
TX1 indicator
AC POWER input
USB 3.1 Ports
Mini Display Port Video
Connectors
Figure 3-2: Topside Rear Panel Controls and Connections
Test point
Page 49

3-5
Figure 3-3: Rear Panel Schematic - 0004957
Page 50

Page 51

4-1
4.0: INSTALLATION
This section explains how to unpack, inspect, and install the 3300-HM SBP system. It describes placement
considerations for the topside and transducer arrays, along with power requirements.
Refer to the PN 0016695 for a more detailed explanation of 3300-HM SBP installation.
For information on connecting a navigation device or printer, please refer to
B.0: NAVIGATION SYSTEMS.
4.1 Unpacking & Inspecting
The EdgeTech 3300-HM SBP system is supplied complete with all necessary cables. The system
components are individually packed in reusable shipping containers.
Before unpacking the system components, inspect the shipping containers for any damage. Report any
damage to the carrier and to
If the shipping containers appear free of damage, carefully unpack the components and inspect them for
damage. Again, if any damage is found, report it to the carrier and to
check the packing list and verify that all the items on the list are included. If any items are missing,
immediately contact
be damaged.
Although the items shipped may vary, depending on the customer requirements, the 3300-HM SBP
typically includes the following:
• Topside Unit
• Hull Mount Transducer Arrays
EDGETECH CUSTOMER SERVICE. Do not install or operate any equipment that appears to
EDGETECH CUSTOMER SERVICE, who will provide additional guidance.
EDGETECH CUSTOMER SERVICE. Also
• Connection Cable
• AC power cords (2)
• Software USB
• Manuals
After unpacking the system components, be sure to safely store the shipping containers – including any
packing materials – for later use. When transporting or storing the system, all items should be packed in
their original shipping containers in the same manner in which they were originally shipped, and always
store the system in a dry environment when not in use.
Page 52

4.0: INSTALLATION 4-2
4.2 Topside Installation
Once unpacked, the topside unit could be installed in a standard 19-inch rack, but can be set on any level
surface, as in the Optima case. Several requirements are necessary for proper placement of the unit, and
are addressed below:
4.2.1 Power Supply
The system power requirements are 120–220 VAC, 50/60 Hz. For the 3300-HM SBP Topside Processor,
the input voltage is auto sensing. For the Power Amplifier, you must select 120 VAC or 220 VAC operation
manually.
4.2.2 Use of an Uninterruptable Power Supply
The AC power source should be continuously free of high-amplitude, high-frequency transients, as this
type of interference could cause degraded performance or damage to the equipment. An uninterruptable
power supply (UPS) with power surge protection is recommended for powering the equipment.
However, whether or not a UPS is used, the AC power source should never be the same as that being used
to power electric motors, such as pumps and winches, on the survey vessel.
4.2.3 Selecting the Power Amplifier Input Power Voltage
To select the Power Amplifier input power voltage, first remove the amplifier from the rack. Then remove
the top cover, locate the board at the lower right corner, and switch it to the required input power voltage
as indicated by the arrow.
4.2.4 Changing to a Non-US Power Plug
An AC power cord is provided for connecting the Deck Unit to a standard U.S. 3-pronged outlet. For nonU.S. power outlets, you can modify this cord by cutting off the 3-pronged plug and attaching the
appropriate plug. For connection information, refer to
AC POWER CORD WIRE COLOR FUNCTION
Black AC line
White AC neutral
TABLE 4-1.
Green Earth ground
Table 4-1: AC Power Cord Wiring
3300 HULL MOUNT SUB-BOTTOM PROFILER 0016732_REV_C
Page 53

4-3
NOTE: Each Deck Unit is shipped configured to country voltage
requirements per each end-user.
4.2.5 Navigation Interface
The 3300-HM SBP system accepts all standard National Marine Electronics Association (NEMA) 0183
message sentence formats from a connected Global Positioning System (GPS) or Integrated Navigation
System.
4.2.6 Deck Unit Placement
The Deck Unit should be set up and situated in a dry, sheltered area that is protected from weather and
water spray. The placement area should also have a temperature that is consistently between 0°C and
40°C (32°F and 104°F). Avoid areas of direct sunlight, especially in tropical environments, as heat buildup
could occur and viewing the LCD monitor and status indicators could prove difficult. The 3300-HM SBP
Topside Unit should be placed in on a surface that is flat and free from vibrational interference.
Secure the Deck Unit in place, using tie-downs if necessary, near the required AC power source. If you are
mounting the 3300-HM SBP Topside Processor and the Power Amplifier in a 19-inch rack other than the
supplied rack mount enclosure, ensure that there is ample room behind the rack for connecting the cables.
Support the components inside the rack using appropriate mounting brackets and secure the front panels
using standard 19-inch rack front panel mounting hardware.
4.3 Hull Mount Array Installation
NOTE: This section is a summarized version of the full installation guide,
provided in EdgeTech document PN 0016695.
The transducer arrays for the 3300-HM SBP system are mounted to the bottom of the survey vessel in a
“Sea Chest.” This chest is filled with fresh water in order to protect the array from corrosion, while
providing a medium for the sub-bottom sonar signal to travel through.
A hatch on the top of the chest allows the deck crew to access the array in order to inspect or remove it
between surveys. The bottom of the Sea Chest (facing the sea floor) is an “acoustic window,” which is
made of a material that allows the signal to pass through it while still protecting the array.
Stainless steel trays are available from EdgeTech for mounting the transducers inside the user-provided
Sea Chest. However, the user may also construct the trays themselves by following the proper spacing
requirements listed below (for transducer array specifications, see sub-section
• Install the transducer array parallel to the sea surface within a flooded steel enclosure
2.3):
Page 54

4.0: INSTALLATION 4-4
• For best results, use an acoustic window made of a material such as a high-quality fiberglass with
no air pockets (e.g., 'G10' glass board), 'Lexan', or a polycarbonate material. Construct the Sea
Chest so the acoustic window can be bolted to the sea chest using a bezel to secure it in place.
• The steel enclosure is a steel box welded to a section of the hull that is flat and parallel to the sea
surface. The sides of the enclosure should be high enough to allow inspection of the array;
EdgeTech recommends the sides of the box be at least 30 cm higher than the top of the
transducers. There should be a minimum of 5 cm between the sides of the transducers and the
sides of the sea chest.
• A sea chest for a 4 x 4 array (of KT-216 transducers) will have the following minimum inside
dimensions:
Inside height: 22 inches / 56 cm
Inside width: 28.25 inches / 72 cm
Inside length: 31.25 inches / 80 cm
• Locate the steel box away from vibrating equipment and sufficiently deep below the water line to
prevent air bubbles passing along the hull and under the array during high sea states.
• Line all four vertical sides and the removable cover plate with a foam material such as ¼ inch (0.64
cm - minimum) diver’s wetsuit neoprene. Attach it with a good neoprene cement (such as 3M
5200 moisture cured) to the sides and top of the Sea Chest.
• Bolt the transducer array to an angle bracket that is welded to the inside of the box so that the
faces of the transducers are within 2 cm of the hull plate, but not touching it. The array is installed
in the box one row (rack) of transducers at a time.
• The steel box should have a removable cover to allow installation and removal of the transducer
array. The cover should bolt to the top of the box and have a gasket to prevent leakage. The Cover
Plate should have a fill pipe to fill the Sea Chest with fluid and a bleeder valve to exit the air from
the Sea Chest. The Sea Chest must be free of any air pockets or bubbles for the transducers to
properly operate.
• Fill the tank with fresh water (preferably distilled) from the ship’s fresh water supply. If the system
will be operated at temperatures near or below fresh water’s freezing point, antifreeze may be
added so that the freezing point is below that of sea water. EdgeTech recommends Propylene
Glycol antifreeze or an equivalent.
• Drain the tank and pipes when the ship is in dry dock if there is a risk of freezing weather. Vent all
air from pipes and tank after filling and before operating the sonar to prevent signal degradation.
• Install a stuffing tube and gland nut to allow a 0.8 cm diameter electrical cable to pass through
the tank. This cable connects the transducer array to a water-resistant T/R Box that is mounted
3300 HULL MOUNT SUB-BOTTOM PROFILER 0016732_REV_C
Page 55

4-5
to a bulkhead within 3 meters of the tank. The T/R Box contains a pre-amp, matching transformer,
and T/R switch. The T/R Box enclosure is plastic and approximately 18 cm high by 18 cm wide by
12 cm deep. A standard 50-meter 3300-HM SBP deck cable connects the T/R Box to the 3300-HM
SBP Topside Processor.
4.4 Connecting the System
WARNING!
Do not attach any cables or wires while the system is connected to the
ship's power, as severe electrical shock may occur.
Once the transducer arrays have been mounted, the Sea Chest has been filled and vented of air, and the
topside unit has been unpacked and secured, the user may proceed with connecting the 3300-HM SBP
system components in preparation for use:
1. Ensure the AC voltage selection switch in the amplifier is set to the proper voltage.
2. Connect the deck cable to the Hull Mount.
3. Connect the underwater cable to the Amphenol connector at the back of the amplifier unit.
4. Connect the video monitor.
5. Connect the keyboard and trackball to the front panel of the system.
6. [Optional] Connect a thermal printer
CAUTION!
Always connect the T/R box end connector before connecting the cable
to the deck unit to prevent connecting an energized connector. This may
cause damage to components in the T/R box.
Page 56

Page 57

5-1
5.0: OPERATION
The purpose of this section is to provide general information on the interface between the 3300-HM SBP
transducers and the 3300-HM SBP topside unit. The interface between the 3300-HM SBP and the
DISCOVER Sub-Bottom software can be found in the DISCOVER Sub-Bottom Software Manual.
5.1 Activating the System
1. Turn on the POWER SUPPLY switch on the back of the Deck Unit. This switch can be left in the on
position at all times if desired.
2. Turn on the POWER switch on the Power Amplifier.
3. Turn on the SYSTEM POWER switch on the 3300-HM SBP Topside Processor.
4. The SYSTEM indicator on the 3300-HM SBP Topside Processor should illuminate and remain on,
and the HARD DISK indicator should flash for two to three minutes while a self-test is run. After
this test is completed, the HARD DISK indicator will flash periodically.
5. Turn on the LCD monitor.
5.2 File Format
Data is archived to the hard drive of the system in two formats, EdgeTech’s native format JSF and the SEGY format. The SEG-Y recording can be turned on or off in the software but the EdgeTech Format is always
recorded. This is because the JSF format stores a much greater amount of information than the standard
SEG-Y.
5.2.1 EdgeTech’s Native JSF Format
Please refer to EdgeTech JSF File Format Manual (document 0004824) for more detailed information.
5.2.2 Standard SEG-Y Format
In the standard SEG-Y format, all sonar data in traces is represented via IEEE 32-Bit floating point numbers
(as per the standard). All fields are byte oriented as per the standard (Big Endian). That is, for a 32-bit
integer, the 8 MSBs are in the first byte. The EBCDIC header is really in EBCDIC (or ASCII).
For Intel based processors, all of the above are not standard and will require conversions. For example,
the sonar data must be converted from IBM to IEEE floating point. Integers must be converted from Big
Endian to Little Endian, and the EBCDIC header must be converted to ascii. ONLY envelope data is saved
(one float per sample).
Page 58

5.0: OPERATION 5-2
5.2.3 Palette File Format
Each display channel can have a color palette, which is specified by a .jsp file. These files are text files with
numbers separated by white space. The numbers must be ordered in groups of 4.
For each group, the values are:
• Index (0 to 255)
• Red Intensity (0 to 255)
• Green Intensity (0 to 255)
• Blue Intensity (0 to 255)
The indices must be increasing in value. If there are gaps in the index then intermediate color values will
be interpolated. Here is an example table for a linear gray step wedge type palette:
0 0 0 0
255 255 255 255
5.3 Triggering and Coupling
To avoid interference, the 3300-HM SBP system supports the following different type of triggering Modes:
Internal Trigger: In this mode, the user may specify the ping rate in Hertz (e.g. 3Hz) or ping range
(in Meters). The system will use the closest available inter-ping interval (e.g.
332.99ms), and repeatedly re-trigger the system at the expiration of this period.
Coupled Mode: This mode only applies to combined sub-bottom and side scan systems. In
coupled mode, the applicable subsystem is triggered when the master subsystem
triggers. The trigger timing for coupled systems takes account of differing
transmit pulse lengths and minimizes inter channel interference.
External Trigger: In this mode, the system is triggered by the external event received via the Trigger
IN BNC connector in the back of the system. When the hardware trigger is
asserted (active log) a new ping occurs.
NOTE: There is a minimum trigger interval (maximum rate) of each
subsystem which is dependent on the Pulse Type used, and is
proportional to the pulse length. That is, a longer pulse will also set a
longer minimum interval, to keep the ON/OFF duty cycle of the Power
Amplifier below the maximum allowed, typically 1:10. The actual trigger
interval used will be the LARGER of the user interval and the Power
Amplifier imposed limit.
3300 HULL MOUNT SUB-BOTTOM PROFILER 0016732_REV_C
Page 59

6-1
6.0: MAINTENANCE
The EdgeTech 3300-HM SBP system is ruggedly designed and built from reliable, long lasting components
to reduce maintenance to a minimum. To insure proper and continuing service of the system some
periodic maintenance is recommended.
6.1 Hard Drive Disk
The system contains a standard SATA hard drive for storing programs and configuration information. An
image of the hard drive is provided on a thumb drive disk. See
6.2 Array Connectors
To extend the life and increase the reliability of the connectors, apply a thin film of silicone dielectric
grease to the entire surface of each male pin. Grease should also be applied at the entrance of each socket.
Re-lubrication is recommended every three to five mating cycles. EdgeTech recommends the use of
Novagard G624 silicone compound or equivalent for lubrication.
A.0: SYSTEM RESTORE for more information.
Inspection should be performed regularly to check for corrosion on the contacts. Oxidation may be
removed from the male contacts by using no less than #800 wet/dry emery paper cut in strips equal to or
less than the width of the contact and rubbing lightly. A pencil eraser can be used instead. Female sockets
may be cleaned using a cotton swab and rubbing alcohol. A .22 caliber bore brush with only nylon bristles
may be used to remove light oxidation.
Connections inside the hull mount chest only need to be checked once every year.
Remember to always install the dummy connectors on the sea cable and the pigtail when not in use.
Page 60

Page 61

7-1
7.0: TROUBLESHOOTING
The following tests and solutions are meant to assist with basic troubleshooting. Contact EDGETECH
CUSTOMER SERVICE if these fixes fail to address the problems with your system.
7.1 Freq. Plots and Raw Data Time Series Analysis Using J-STAR
The ability of the J-STAR program to request and display raw data (directly from the ADC converter) is
invaluable in diagnosing many potential failure modes. Raw data (as opposed to processed and CHIRPed
data) allows direct interpretation (via scope like display). This helps to determine noise levels, and the
proper operation of, transmit power electronics. The J-STAR program also assists interpretation with FFT
analysis that show interfering noise sources by frequency distribution and spectral amplitude.
The J-STAR program may also be used to acquire raw data, and log this data to disk for offline analysis.
Having recorded raw data available for analysis by EdgeTech engineers will often speed up the resolution
of suspected problems. Such files may be sent to EdgeTech in USB or if small as email attachments. Many
system control and setup parameters are recorded in these raw data files which will assist in problem
diagnosis.
The Graph tab on the Control Panel will display any channel of data and its FFT (frequency spectrum).
1. Start J-STAR
2. Turn pinging on
3. Go to the Graph Tab in the Control Panel
4. You should now see something like
FIGURE 7-1 show a typical raw data display for a side scan channel. The left half of the graph display shows
one thousand samples of the raw ADC (analogue to digital converter) output, plotted as time vs. amplitude
on the X –Y axes.
The right half shows a frequency analysis (FFT) of the time series in the top half. The axes are Frequency
(Hz) vs. Amplitude (x - y).
This raw data display was obtained by first setting the sub-bottom system to send raw data (as opposed
to de-CHIRPed envelope data).
FIGURE 7-1.
Page 62

7.0 TROUBLESHOOTING 7-2
Figure 7-1: Graph Display Tab
3300 HULL MOUNT SUB-BOTTOM PROFILER 0016732_REV_C
Page 63

7-3
Display Description: (Refer to
FIGURE 7-1 for item/check box locations).
Channel Selector [Edit Box]: Accessed using mouse / cursor. Type in desired data channel to display:
0 = SB - sub-bottom
2 = SSL - Side Scan Low Port
3 = SSL - Side Scan Low Starboard
4 = SSH - Side Scan High Port
5 = SSH - Side Scan High Starboard
FFT in dB [Check Box]: If checked displays the FFT amplitudes in dB (a logarithmic display scale).
If unchecked displays vertical scale as linear spectral amplitudes.
Autoscale [Check Box]: If checked the displays are re-scaled for EACH redraw / data update, so that the
min / max amplitudes of the current data span the available display range. This can be confusing to the
eye if the amplitudes of the signals vary greatly from ping to ping, as each display will appear to have the
same amplitude unless the axes values are carefully observed. It is SAFEST to leave this unchecked, and
manually ReScale as required.
Rescale [Push Button]: A one-time (for each push) activation of the display re-scale function. (See
description in
FIGURE 7-1).
Save to File [Push button and Edit Window]: The displayed graph data can be saved to a disk file for
sending to EdgeTech Technical Support, for analysis. Enter a file save name in the edit window.
(Hint: Use pause check box to freeze display, to make sure of the data being saved.)
NOTE: ONLY the data being displayed is saved, i.e. channel 3 in this case.
No other channels are saved.
Signal Level Cursor: These 2 yellow lines can be dragged vertically to mark and display amplitude levels.
For raw data, the amplitudes are in A/D counts. The ADC values are represented in 16 bits, which allows
for 65536 discrete levels. These are interpreted as bipolar signals with an amplitude range of +/-32767.
Raw Data Display: All the raw data acquired by the A/D subsystem is displayed in the top window. The
A/D capture sequence begins immediately prior to the start of the Transmit pulse for the channel (τ = 0).
The entire transmit pulse (which is unavoidably coupled into the receive channel) is visible in the early
part of the display.
Following the transmit pulse (τ = 8.3msecs in this case) the lower amplitude received echo data is visible.
The A/D converter is overloaded during the Transmit pulse by the extremely large amplitude signals
injected into the receiver. For this reason, the signal may appear to collapse slightly during the Transmit
pulse, but the display should show +32767 and –32767 amplitudes during the Transmit interval. See the
figure below for raw data display where the Transmit power for the channel is set to zero.
Page 64

7.0 TROUBLESHOOTING 7-4
In this case transmit power for the side scan channel has been set to zero in the SSL control tab. The Power
Amplifier turn on and turn off transients, are still visible in the time record and indicate that the power to
the amplifiers is good, and that the power amplifier on/off control is working correctly. The absence of
transmit energy would indicate a failure in the transmit signal generator, if the power were not
intentionally set to zero.
7.2 System Does Not Operate
This section will guide you through a series of symptoms and actions that you should follow if the sonar is
not operating at all. Go to the second section if performance or image quality is poor.
Before continuing with this section, please check the following setup and connections have been
completed:
• Power the Internal Rear Panel Power Cables from the inside of the power outlet (in the rear of
the system) are connected to both the amplifier and 3300-HM SBP Control Unit.
• The main power cable is installed and connected to a clean power source.
• Power is switched on (power amplifier and control unit).
NOTE: Loose or disconnected cables are the most likely causes of system
failure.
3300 HULL MOUNT SUB-BOTTOM PROFILER 0016732_REV_C
Page 65

7.2.1 Symptom / Probable Cause
Bulb cannot be serviced by the user. Return for
repair. System will operate with a bad bulb.
Check fuse in the Power Input Module on Rear Panel.
Fuse is 12.5.
Check that the power switch is turned on in the rear
of the Amplifier.
Power switch on rear of
LED
Run topside software in the acquire mode. If no
following:
Transmit signal not
getting to T/R box
Confirm that the red banana plug (amplifier output)
the back of the amplifier should be set to Bridge.
Amplifier input
disconnected
Inside 3300-HM SBP
loose
If the Sonar Application doesn’t make the transducer
EDGETECH CUSTOMER SERVICE
Damaged amplifier
Measure each output with scope o-scope
Damaged Tiger SB
acquisition PCB
Tap on the 3300-HM SBP transducers to confirm the
some effect on the display.
Damaged Tiger SB
Acquisition board
Check connections and re-seat/replace Tiger SB
Acquisition board.
Measure both outgoing 12vdc and 5vdc return PA
voltage on Rear Panel.
Based on the symptoms found during the startup process in Chapter 3 check the following items:
SYMPTOM PROBABLY CAUSE(S) TESTS & SOLUTION(S)
Bad lightbulb
Blue Switch on the Power
Amplifier does not turn on
Green POWER light does
not turn on
Bad power outlet fuse
Bad power amplifier
Amp is either off or the
amp is not plugged into
AC
No power or damaged
Check LED connections outside control unit
7-5
No audible heartbeat CHIRP
from 3300-HM SBP
Unit generates audible
pulses, communicates with
the topside, but does not
receive signal
Cable disconnected or
damaged
connectors
processor, connections
Bad connection
Damaged preamplifier
audible CHIRP sound can be heard, perform the
Check deck cable to T/R box
is fully inserted in the Red/Red sockets (not
Red/Black sockets). Confirm that the input to both
amplifier channels is secure. The Configuration LED at
Check all the connections on rear of Amp and
terminations on the hull mount.
chirp, the test pulse may have been corrupted, call
Re-seat and then swap in spare PCB.
problem. Under normal operation, there should be
Table 7-1: Troubleshooting Causes and Solutions
Page 66

7.0 TROUBLESHOOTING 7-6
Bad or loose deck cable or T/R
box and spider connections
Corroded connector pins
Polish the contact using a pencil eraser
Bad cable or spider
Replace
Wiggle deck cable, T/R box cabling and spider splice
fatigue failure of wire near connection or in splice
IN SUB-
SECTION 2.3.
7.2.2 Poor Image Quality or Performance Issues
TABLE 7-2 will guide the user through a series of symptoms and actions that he or she should follow if there
are performance or image quality problems.
SYMPTOM PROBABLE CAUSE(S) TESTS & SOLUTION(S)
Vertical black
streaks in sonar
profile
White Data
Dropout
AC Noise (Periodic
Streaks on screen)
Noise in sonar data
display
Loose or flooded connection
Broken wire in splice or cable
Undergrounded generator casing
Return signal is being clipped
Engine noise is coupling to the
sonar band
Table 7-2: Image Quality or Performance Issues
7.3 Sonar Errors
TABLE 7-3 explains how to troubleshoot sonar errors:
Apply silicone grease and secure connectors
while watching for white streaks in display to check for
Replace or repair cable (see wiring diagram
Reduce preamplifier gain, and/or reduce pulse power
Use a dedicated power source for SB and possibly a UPS
SYMPTOM PROBABLY CAUSE(S) TESTS & SOLUTION(S)
12vdc not getting to T/R box
HMSENSORS
T/R box PCB faulty
SBO_AMP Amp not turned on, plugged in or bad
IF_DIAG Tiger SB Acquisition board issue Check Errors in Sonar, Consult EdgeTech
NO_SONAR_DEVICE Tiger SB Acquisition board cable issue Check PCB and cabling
3300 HULL MOUNT SUB-BOTTOM PROFILER 0016732_REV_C
Check wiring
Swap in spare T/R box
Check all including TX with o-scope
Table 7-3: Troubleshooting Sonar Errors
Page 67

A.0: SYSTEM RESTORE
The following section outlines the procedures for backing up and restoring the system drive.
CAUTION!
All data will be lost upon restoring the system to factory settings. Be
sure to backup all data before preforming the procedure below.
1. Ensure that topside is off.
2. Insert USB3 flash drive in blue USB3 port.
3. Start topside and be prepared to press F⋆⋆ key when prompted:
a. If the topside is rack mount, press F11.
b. If the topside is a laptop, press F12.
A-1
4. Under Please select boot device: By using up/down arrow keys, select EUFI: Corsair Voyager 3.0
000A, then press Enter.
5. Wait for Paragon Backup & Recovery 14 Home screen to appear, then click Restore icon.
6. On Welcome to the Restore Wizard screen click Next.
7. Browse for Archive and click specific image (the file ending
with the extension “.pbf”). When Archive File Details window appears, click Next.
8. At What to restore window, click Basic MBR Hard Disk 0, click Next.
9. At Where to restore window, ensure that Basic MBR Hard Disk 0 is already selected (brown box
around it). If it is not, use up/down arrow keys to select. Click Next.
10. At Restore results window, make no selection and click Next.
11. At the Ready to restore from the archive window, select Yes, apply the changes physically. Click
Next. Restoring will begin.
12. At completing the restore wizard, click Finish. Click Shutdown.
13. Remove USB3 flash drive and restart topside.
14. Re-boot and click on the Windows icon and navigate to Control Panel > System. Activate Windows
using the supplied key code on rear of laptop.
Page 68

Page 69

B-1
B.0: FAQ: FREQUENTLY ASKED QUESTIONS
1. What are the 3300-HM SBP data cable requirements?
Three shielded twisted pairs. One set is used for the transmitter and is 18-gauge wire. Two 20-gauge sets
are used for receiving. The receiver set is used for 12 VDC, pre-amp power, common, signal, and spare.
2. Can you interface DISCOVER Sub-Bottom to a transmit/receive Customer-supplied hull mounted array?
This can be done, but the following special engineering and calibration must be accomplished so that you
will get the very best results from the interface. The output impedance of the DISCOVER Sub-Bottom
power amplifier needs to match the input impedance of the transmitting array. This will maximize power
transmission; otherwise, power is wasted/lost in the amplifier without getting to the transmitters. The
transformer must be supplied with the correct turns ratio. A hydrophone must be placed below
transmitters temporarily so the system can be calibrated. Based on the calibration, the system needs to
be tuned to flatten the spectrum to improve the record resolution. EdgeTech provides engineering
services to do this.
3. How does the system interface to a navigation device?
3300-HM SBP system interfaces to Navigation inputs via one of the available RS-232 communication
ports.
4. How do the environmental conditions affect the performance of the system?
There are several environmental factors that affect performance:
Geological Conditions 3300-HM SBP operating parameters and specifications are greatly affected by
geologic conditions that the 3300-HM SBP’s transmitted acoustic energy
encounters. A very dense geologic interface such as rock, coral, sand, stone, shell
beds, etc., limit sub-bottom penetration. This is caused by density interface
reflecting most, if not, all normal incidence acoustic energy back to transmitter
/ receiver resulting in little penetration.
Air / Water Interface Air/water interface reflects 99.8 percent of all acoustic energy it receives.
Therefore, when air or gas is encountered in the water column or sub-bottom
geology, the acoustic energy transmitted by transducer’s array reflect to the
transducers resulting in little or no penetration into seabed.
Ship's Wake Ship's wake is a very turbulent area just behind the ship. When operating an
acoustic device in or near the wake the transmitted acoustic energy encounters
highly charged aerated water caused by the cavitation of the ship's screws. If the
Page 70

B: FAQ B-2
3300-HM SBP is operated in this area, the acoustic from the aerated water is
reflected back to its source, as in the case discussed in the preceding paragraph.
3300-HM SBP is designed to operate in a horizontal position relative to the sea
floor. Turbulence encountered when operated in or near the ships wake will
cause instability in 3300-HM SBP reducing output energy effectiveness in
penetrating sub-bottom sediments.
Noise Operating other acoustic instruments at frequencies within system bandwidth
simultaneously with 3300-HM SBP system can result in data distortion.
Ship's Motion 3300-HM SBP is designed to work in a relatively stable horizontal plane.
Excessive ship motion can cause instability in the reception of sound waves
resulting in reduced performance. Rough sea conditions, sharp ship turns, and
any similar external induced motions will have a similar effect on the system
operation. For more information, see DISCOVER Sub-Bottom’s Software Manual
- Heave Compensator.
3300 HULL MOUNT SUB-BOTTOM PROFILER 0016732_REV_C
Page 71

C-1
ASCII
HEX
DESCRIPTION
“$”
24
Start of Sentence
aa Dummy characters to start the Address Field (e.g. GP), not used by EdgeTech products.
Sentence Formatter. Mnemonic code identifying the data type and the string format of
the successive fields.
Field Delimiter. Starts each field except Address and Checksum fields. If it is followed by
a null field, it is all that remains to indicate no data in the field.
PARAMETER
DESCRIPTION
Interface
RS-232C
COM Port
User choice limited to installed serial ports Baud Rate: 4800/9600
Data Bits
8
Start Bits
1
Stop Bits
1
Parity
None
Handshaking
None
C.0: NAVIGATION SYSTEMS
Connect any industry-standard NMEA 0183 GPS to the Navigation COM port on the EdgeTech Processor
(Com 1 is default). Most GPS receivers made in the past 5+ years output the NMEA 0183 (version 1.5,
2.0/2.1, or 2.3) data language. GPS receivers can be connected by a serial cable (provided by the GPS
manufacturers) to the EdgeTech topside through a standard 9- pin serial port. Refer to sub-section B.5
Serial Port Connections for the pin out of the 9-pin serial connector.
The following information describes the serial port interface parameters for acquiring navigation strings
from a connected GPS unit or integrated navigation computer to the DISCOVER processor serial port. The
system will also accept Annotation and Event mark strings in accordance.
Several of the messages conform to the NMEA 0183 protocol. For additional information refer to:
NATIONAL MARINE ELECTRONICS ASSOCIATION NMEA 0183
STANDARD FOR INTERFACING MARINE ELECTRONICS NAVIGATIONAL DEVICES
Version 3.01
January 1, 2002
C.1 NMEA Approved Sentence Structure
The following provides a summary explanation of the approved sentence structure:
$aabbb,c---c*hh<CR><LF>
bbb
“,” 2C
Table C-1: NMEA Approved Sentence Structure
C.2 Port Parameters
Table C-2: Port Parameters
Page 72

C: NAVIGATION SYSTEMS C-2
C.3 Port Selection
The port assigned to receive the navigation messages is assigned in a supporting file for the DISCOVER
application or any other user named *.jni file. This is a simple text file with many system settings and
parameters, to set the assigned port, edit the file and make the changes as below:
The section and syntax for the serial port assignment and configuration is:
[Nav0]
Baud=4800
Port=1
Enable=1
The file is large so it is easiest to search for the Keyword [Nav0] to find this section.
The baud rate and port number to use are set here. Valid Baud rates are 4800 to 19200 depending on
your NMEA source.
The DISCOVER software will support up to 3 serial ports for connecting to any sources of these serial data
strings. The messages may come in on any enabled port, or they may all be input via one port. No
distinction or priority is given to any port over another. It is safest to only enable those ports you need
that are supplying valid data.
The format for the remaining ports is as above with the keywords, [Nav1, Nav2].
C.4 Inputs
The following are approved NMEA sentences recommended for use with the DISCOVERY based systems.
The list of NMEA and Edge Tech messages are:
The list of compatible, but not discussed NMEA and Edge Tech messages are:
DBT, DPT, EMA, ETC, GDA, HDT, and MTW.
GLL, GXY, GGU, GGA, RMA, RMC, VTG, ZDA, HDG, EVT, and EMA.
NOTE: The minimum recommended NMEA message that should be used
ought to be a position message such as GGA, GLL, GGU, GXY, or RMC.
RMC is best, as it contains both time and date, whereas the other position
strings do not. If a ZDA message is used as well, this will not matter.
However, for a single message, RMC is the best choice
3300 HULL MOUNT SUB-BOTTOM PROFILER 0016732_REV_C
Page 73

GLL – Geographic Position – Latitude/Longitude
ASCII
DESCRIPTION
Degrees|Minutes.decimal - 2 fixed digits of degrees, 2 fixed digits of minutes and a variable number
to maintain fixed length.
a
N for North Latitude or S for South Latitude
Degrees|Minutes.decimal - 3 fixed digits of degrees, 2 fixed digits of minutes and a variable number
to maintain fixed length.
b
E for East Longitude or W for West Longitude
Time of position fix. Hours|Minutes|Seconds.decimal - 2 fixed digits of hours, 2 fixed digits of
fractions of seconds.
Always pad with leading zeros. This field is optional.
Status. Single character field:
A = Yes, Data Valid, Warning Flag Clear V = No, Data Invalid, Warning Flag Set
ASCII
DESCRIPTION
Double floating point numeric, may have leading negative sign. Represents horizontal axis of plane
(X coord)
a
Character label for X (Must be valid ASCII character, but value is ignored)
Double floating point numeric, may have leading negative sign. Represents
horizontal axis of plane (Y coord)
b
Character label for Y (Must be valid ascii character, but value is ignored)
Time of position fix. Hours|Minutes|Seconds.decimal - 2 fixed digits of hours, 2 fixed digits of
minutes, 2 fixed digits of seconds and a variable number of digits for decimal fractions of seconds.
Always pad with leading zeros.
$--GLL,xxxx.xxx,a,yyyyyy.yyy,b,hhmmss.ss,A*hh<CR><LF>
C-3
xxxx.xxx
yyyyy.yyy
hhmmss.ss
A
of digits for decimal fractions of minutes. Leading zeros always included for degrees and minutes
of digits for decimal fractions of minutes. Leading zeros always included for degrees and minutes
minutes, 2 fixed digits of seconds and a variable number of digits for decimal
Table C-3: GLL Geographic Position – Latitude/Longitude
NOTE: Other supported navigation strings for position are: GGA, RMA,
RMC.
GXY Geographic Position X and Y Coordinates
X and Y coordinates of the present vessel position, time of position fix and status.
$--GXY,xxxxxx.xxx,a,yyyyyy.yyy,b,hhmmss.ss,*hh<CR><LF>
xxxxxx.xxx
yyyyyy.yyy
hhmmss.ss
Table C-4: GXY Geographic Position X and Y Coordinates
NOTE: The hhmmss.ss field is optional.
Page 74

C: NAVIGATION SYSTEMS C-4
ASCII
DESCRIPTION
Double floating point numeric, may have leading negative sign. Represents horizontal axis of plane
(X coordinate).
a
Character label for X (Must be a valid ASCII character, but value is ignored).
yyyyyyyy.y
Double floating point numeric, may have leading negative sign. Represents vertical axis of plane
(Y coordinate).
b
Character label for Y (Must be a valid ASCII character, but value is ignored).
Time of position fix. Hours|Minutes|Seconds.decimal - 2 fixed digits of hours, 2 fixed digits of
Always pad with leading zeros.
ASCII
DESCRIPTION
Double floating point numeric, may have leading negative sign. Represents horizontal axis of
plane (X coordinate).
a
Character label for X (Must be a valid ASCII character, but value is ignored).
yyyyyyyy.y
Double floating point numeric, may have leading negative sign. Represents vertical axis of plane
(Y coordinate).
b
Character label for Y (Must be a valid ASCII character, but value is ignored).
Time of position fix. Hours|Minutes|Seconds.decimal - 2 fixed digits of
decimal fractions of seconds. Always pad with leading zeros.
GUU – Geographic Position – X and Y Coordinates
X and Y coordinates of the present vessel position, time of position fix and status.
NOTE: GGU string has a similar format as GXY but provides support for
larger planes.
$--GGU,xxxxxxxx.x,a,yyyyyyyy.y,b,hhmmss.ss,*hh<CR><LF>
xxxxxxxx.x
hhmmss.ss
minutes, 2 fixed digits for seconds and a variable number of digits for decimal fractions of seconds.
Table C-5: GUU – Geographic Position – X and Y Coordinates
NOTE: The hhmmss.ss field is optional.
GGA – Global Positioning System Fix Data
Time, Position and fix data for a GPS receiver.
$--GGA,hhmmss.ss,llll.ll,a,yyyyy.yy,a,q,nn,d.d,a.a,M,g.g,M,e.e,rrrr,*hh
<CR><LF>
xxxxxxxx.x
hhmmss.ss
hours, 2 fixed digits of minutes, 2 fixed digits for seconds and a variable number of digits for
Table C-6: GGA – Global Positioning System Fix Data
3300 HULL MOUNT SUB-BOTTOM PROFILER 0016732_REV_C
Page 75

C-5
ASCII
DESCRIPTION
x.x
Floating point numeric
T
Degrees True
M
Degrees Magnetic
N
knots
K
Kilometer/hour
RMA – Recommended Minimum Specific Loran-C Data
Position, course, and speed from a Loran-C receiver
$--RMA,A,llll.ll,a,yyyyy.yy,a,d.d,.e.e,f.f,g.g,h.h,j,k*hh<CR><LF>
For fields see NMEA 0183 Specification
RMC – Recommended Minimum Specific GNSS Data
Time, Date, Position, course and speed provided from a GNSS receiver
$--RMC,hhmmss.ss,A,llll.ll,a,yyyyy.yy,a,d.d,e.e,ddmmyy,g.g,j,k*hh<CR>
<LF>
For fields see NMEA 0183 Specification
VTG – Track Made Good and Ground Speed
The actual track made good and speed relative to the ground
$--VTG,x.x,T,x.x,M,x.x,N,x.x,K*hh<CR><LF>
Table C-7: VTG – Track Made Good and Ground Speed
NOTE: Magnetic heading corrected for local deviation and
Easterly/Westerly variation would provide more accurate True vessel
heading in degrees.
Page 76

C: NAVIGATION SYSTEMS C-6
ASCII
DESCRIPTION
Universal Time Coordinated (UTC). Hours|Minutes|Seconds.decimal - 2 fixed digits of hours, 2 fixed
seconds. Always pad with leading zeros.
dd.mm
Day(01 to 31)|.Month(01 to 12)
yyyy
Year
ll
Local zone description, 00 to 13 hour. This field is optional and ignored.
zz
Local zone minutes’ description, same sign as local hours. This field is optional.
ASCII
DESCRIPTION
Magnetic sensor heading, degrees
x.x
Magnetic deviation, degrees E/W1,3
Magnetic variation, degrees, E/W2,3
ZDA – Time & Date
UTC, day, month, year, and local time zone
$--ZDA,hhmmss.ss,dd,mm,yyyy,ll,zz*hh<CR><LF>
hhmmss.ss
digits of minutes, 2 fixed digits of seconds and a variable number of digits for decimal fractions of
Table C-8: ZDA – Time and Date
NOTE: Zone description is the number of whole hours added to local time
to obtain GMT, Zone description is negative for East longitudes. The GLL
string provides a more accurate time reference since it is related to the
position fix.
Time and date from the computer CPU are also recorded and could be
displayed if GPS time and date are not available.
Fix marks are bars across the time zero line in all channels.
HDG - Heading, Deviation and Variation
Heading (magnetic sensor reading), which if corrected for deviation, will produce Magnetic heading,
which if offset by variation will provide True heading.
$--HDG,x.x,x.x,a,x.x,a*hh<CR><LF>
HDG
x.x, a
Table C-9: HDG: Heading, Deviation, and Variation
NOTES: To obtain Magnetic Heading:
- Add Easterly deviation (E) to Magnetic sensor Reading
- Subtract Westerly deviation (W) from Magnetic Sensor Reading
To obtain True Heading:
- Add Easterly variation (E) to Magnetic Heading
- Subtract Westerly variation (W) from Magnetic Heading
3300 HULL MOUNT SUB-BOTTOM PROFILER 0016732_REV_C
Page 77

Variation and deviation fields shall be null fields if unknown.
ASCII
DESCRIPTION
ASCII character status flag.
M = Print and Store event mark
Event annotation or just annotation message up to 80
characters long with a maximum number of messages being 10
EVT – Event * Annotation (EdgeTech Custom)
Event mark and related annotation provided by an integrated navigation system
$EGEVT,S,<Message>,*hh<CR><LF>
S
Message
Table C-10: EVT – Event * Annotation (EdgeTech Custom)
NOTES: This message should only be used if it is imperative that the event
mark number be externally controlled, otherwise the $EGEVT message
should be used. If the mark number sent is the same as the current mark
number the message will be ignored.
A shortcut to the Windows HyperTerminal application is provided to
check the navigation input. You must quit the DISCOVER application
before running, and may need to modify the properties if not running at
4800 baud. A sample display is shown below.
C-7
$GPGLL,2600.0100,N,800000.0000,W,151228.99,A*67
$GPVTG,315.65,T,314.15,M,3.8,N,7.0,K*48
$GPZDA,151229.25,28.08,1997,06,00*45
$EGEVT,M,EventNo,Time,Position,Annotation,*73
$GPGLL,2600.0125,N,8000.0025,W,151229.50,A*84
$GPVTG,316.65,T,315.15,M,3.9,N,7.1,K*33
$GPZDA,151229.75,28.08,1997,06,00*45
$EGEVT,M,EventNo,Time,Position,Annotation,*48
$GPGLL,2600.0150,N,800000.0050,W,151229.99,A*12
$GPVTG,315.85,T,314.65,M,3.8,N,7.0,K*58
$GPZDA,151230.25,28.08,1997,06,00*72
$EGEVT,M,EventNo,Time,Position,Annotation,*48
NOTE: The number of incoming strings should be limited to the four
mentioned above. For accurate fixes, the navigation strings should be
updated once a second (1 Hz) or faster.
Page 78
C: NAVIGATION SYSTEMS C-8
ASCII
DESCRIPTION
NNNNNN
Mark number to use for this event.
Message
Event annotation message up to 23 characters long
EMA: Event, Set Mark & Annotation (EdgeTech Custom)
Event mark number and annotation provided by an integrated navigation system
$ETEMA,NNNNNN, <Message>,**hh<CR><LF>
Table C-11: EMA: Event, Set Mark & Annotation
NOTE: This message should only be used if it is imperative that the event
mark number be externally controlled, otherwise the $EGEVT message
should be used. If the mark number sent is the same as the current mark
number the message will be ignored.
$GPGLL,2600.0100,N,800000.0000,W,151228.99,A*67
$GPVTG,315.65,T,314.15,M,3.8,N,7.0,K*48
$GPZDA,151229.25,28.08,1997,06,00*45
$EGEVT,M,EventNo,Time,Position,Annotation,*73
$GPGLL,2600.0125,N,8000.0025,W,151229.50,A*84
$GPVTG,316.65,T,315.15,M,3.9,N,7.1,K*33
$GPZDA,151229.75,28.08,1997,06,00*45
$EGEVT,M,EventNo,Time,Position,Annotation,*48
$GPGLL,2600.0150,N,800000.0050,W,151229.99,A*12
$GPVTG,315.85,T,314.65,M,3.8,N,7.0,K*58
$GPZDA,151230.25,28.08,1997,06,00*72
$EGEVT,M,EventNo,Time,Position,Annotation,*48
NOTE: The number of incoming strings should be limited to the five
mentioned above. For accurate fixes, the navigation strings should be
updated once a second or faster.
3300 HULL MOUNT SUB-BOTTOM PROFILER 0016732_REV_C
Page 79
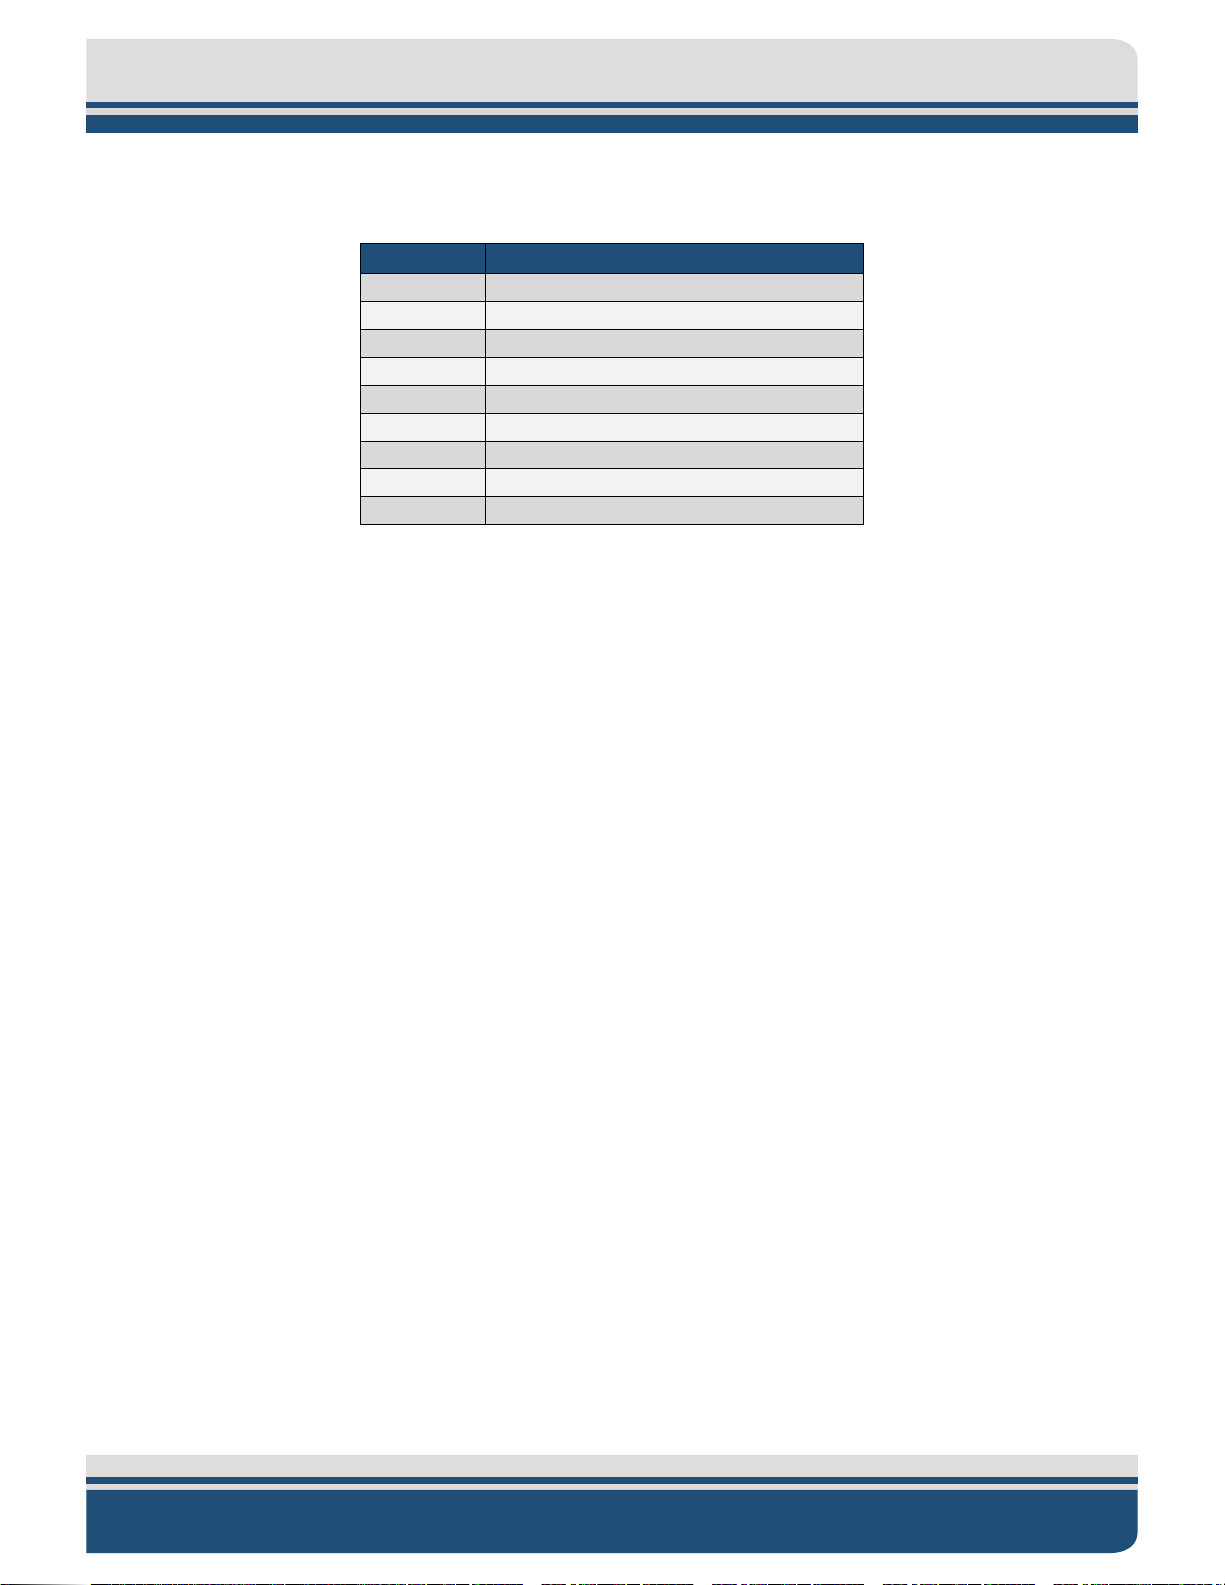
C-9
PIN #
ROLE
Pin 1
Carrier Detect (CD) input
Pin 2
Receive Data (RD) input
Pin 3
Transmitted Data (TD) output
Pin 4
Data Terminal Ready (DTR) output
Pin 5
Signal Ground
Pin 6
Data Set Ready (DSR) input
Pin 7
Request To Send (RTS) output
Pin 8
Clear To Send (CTS) input
Pin 9
Ring Indicator (RI) input
C.5 Serial Port Connections
The following chart depicts the pin out of the male DB9, RS232 connector found on the computer.
Table C-12: 9 Male Pin Out
The following outlines the different pins from the comport connection that EdgeTech processor uses for
communication:
Pin # 2: (usually brown) is Receive (which would connect to the transmit pin on the GPS). This
connection will take the position data from the GPS for use in the DISCOVER software.
This is a necessary connection for GPS communications
Pin # 5: (usually green) is Ground. This can be connected to the common ground from the GPS
wiring. This is a necessary connection for GPS communications
Pin # 3: (usually red) is Transmit. This connection will go back to the GPS. Pin # 3 is not a necessary
connection for using DISCOVER software for Real-Time positioning. Only proper
connections to pins number 2 and 5 are needed for to log navigation data.
C.6 Troubleshooting
Problem: When connected to a GPS, the computer’s trackpad acts erratically and seems to be 'jumping'
around.
Solution: A Windows bug discovered by Microsoft where Windows detects a connected GPS as a mouse-
-this produces a jumping cursor problem. The following are the directions supplied by Microsoft support
to correct the problem:
1. Turn off the GPS and close DISCOVER Software.
2. Right-click on the My Computer icon and select Properties.
3. Select the Hardware tab, and click the Device Manager button.
4. Next to "Mice and other pointing devices," click the plus button to expand this list. You should see
at least two items listed. One is the mouse you normally use, and the other will probably be listed
as "Microsoft Serial Ball Point."
Page 80

C: NAVIGATION SYSTEMS C-10
5. Highlight "Microsoft Serial Ball Point" and click the Disable button at the top of the window (it is
usually the second button from the right; hover the cursor over it and read the Tool Tip to verify).
6. In the confirmation message window that appears, click Yes.
7. Close the Device Manager.
8. Plug in/turn on your GPS.
9. Restart DISCOVER Software.
Problem: No communications between GPS and DISCOVER Software
Solution: When DISCOVER isn't getting the GPS data during data acquisition, it's a good idea to check
outside of DISCOVER to be sure the serial port is receiving the data. If the ports do not see any GPS data
coming in, then DISCOVER will not be able to see the signal. HyperTerminal, one of the programs which
come with Windows, is a useful troubleshooting utility, since it reads any information being received by
the system through any available COM port.
NOTE: DISCOVER and all other programs, especially any that use COM
ports for other connections, should be closed while running the
HyperTerminal program. The GPS should be set to its NMEA mode in its
Interface Setup area for this test. The GPS should be set to its Simulator
mode if indoors or having difficulty obtaining the GPS Sat. fix.
1. Click Start, then Programs, then Accessories, then Communications, then HyperTerminal
2. In the window that opens titled HyperTerminal, double-click on the icon which says "Hyperterm",
the one with the monitor sitting next to a phone.
3. If a window comes up asking if you want to configure a modem now, select "No" or "Cancel".
Otherwise, proceed to the next step.
4. Another window titled "Connection Description" appears. In the Name: box, type in the letter t
for "test". Click on OK.
5. Another window pops up with the title "Phone Number". The only field of interest here is Connect
Using:, which must be set to "Connect to COM1". Click on OK.
6. The window "COM1 Properties" appears. The editable field is Bits per second, which should be
set to "4800", since the NMEA 0183 standard specifies 4800 baud rate. Click on OK.
7. The main white HyperTerminal window becomes completely visible, hopefully with GPS data
scrolling upward. Every sentence must begin with a dollar sign and five letters. If the screen is
blank, this means no data is coming in through the port.
3300 HULL MOUNT SUB-BOTTOM PROFILER 0016732_REV_C
Page 81

C-11
8. When finished viewing the screen, select "Exit" from the File menu. When asked if you want to
disconnect now, click on Yes. When asked if you want to save session, click on No.
Repeat the above steps for other COMs, replacing COM1 with COM2, COM3 and COM4. If none of these
will reveal GPS input, then the problem lies in the physical serial port, the GPS receiver, or the connection
between the two.
At this point, one of three things can happen:
1. An error message appears:
This means that the COM port selected is not available or functioning properly. Close
HyperTerminal and repeat the process, trying a different COM port. If you are certain that you are
selecting the proper COM port, contact
EDGETECH CUSTOMER SERVICE for further troubleshooting
tips.
2. The screen goes blank screen with a flashing cursor.
The chosen COM port is not currently receiving NMEA data. Close HyperTerminal and repeat the
process, trying a different COM port. If you are certain that you are selecting the proper COM
port, check the output settings on the GPS. If you are certain that the GPS is outputting NMEA
strings, use a Null Modem to swap pin 2 and 3 (TX & RX).
3. A screen with text scrolling upward appears.
The GPS unit is successfully connected. Good GPS data will look like the following:
$GPRMC,201502,A,4251.2939,N,07054.4254,W,000.0,000.0,291002,016.3,W*7C
$GPGGA,201502,4251.2939,N,07054.4254,W,1,07,1.7,55.6,M,-32.7,M,,*4A
$GPGLL,2600.0100,N,800000.0000,W,151228.99,A*67
$GPVTG,315.65,T,314.15,M,3.8,N,7.0,K*48
$GPZDA,151229.25,28.08,1997,06,00*45
The data you see scrolling by indicates current position (among other things). Note the COM port used
and exit HyperTerminal. When asked if you want to disconnect now, click on Yes. When asked if you want
to save session "Test", click OK.
 Loading...