

Page 1
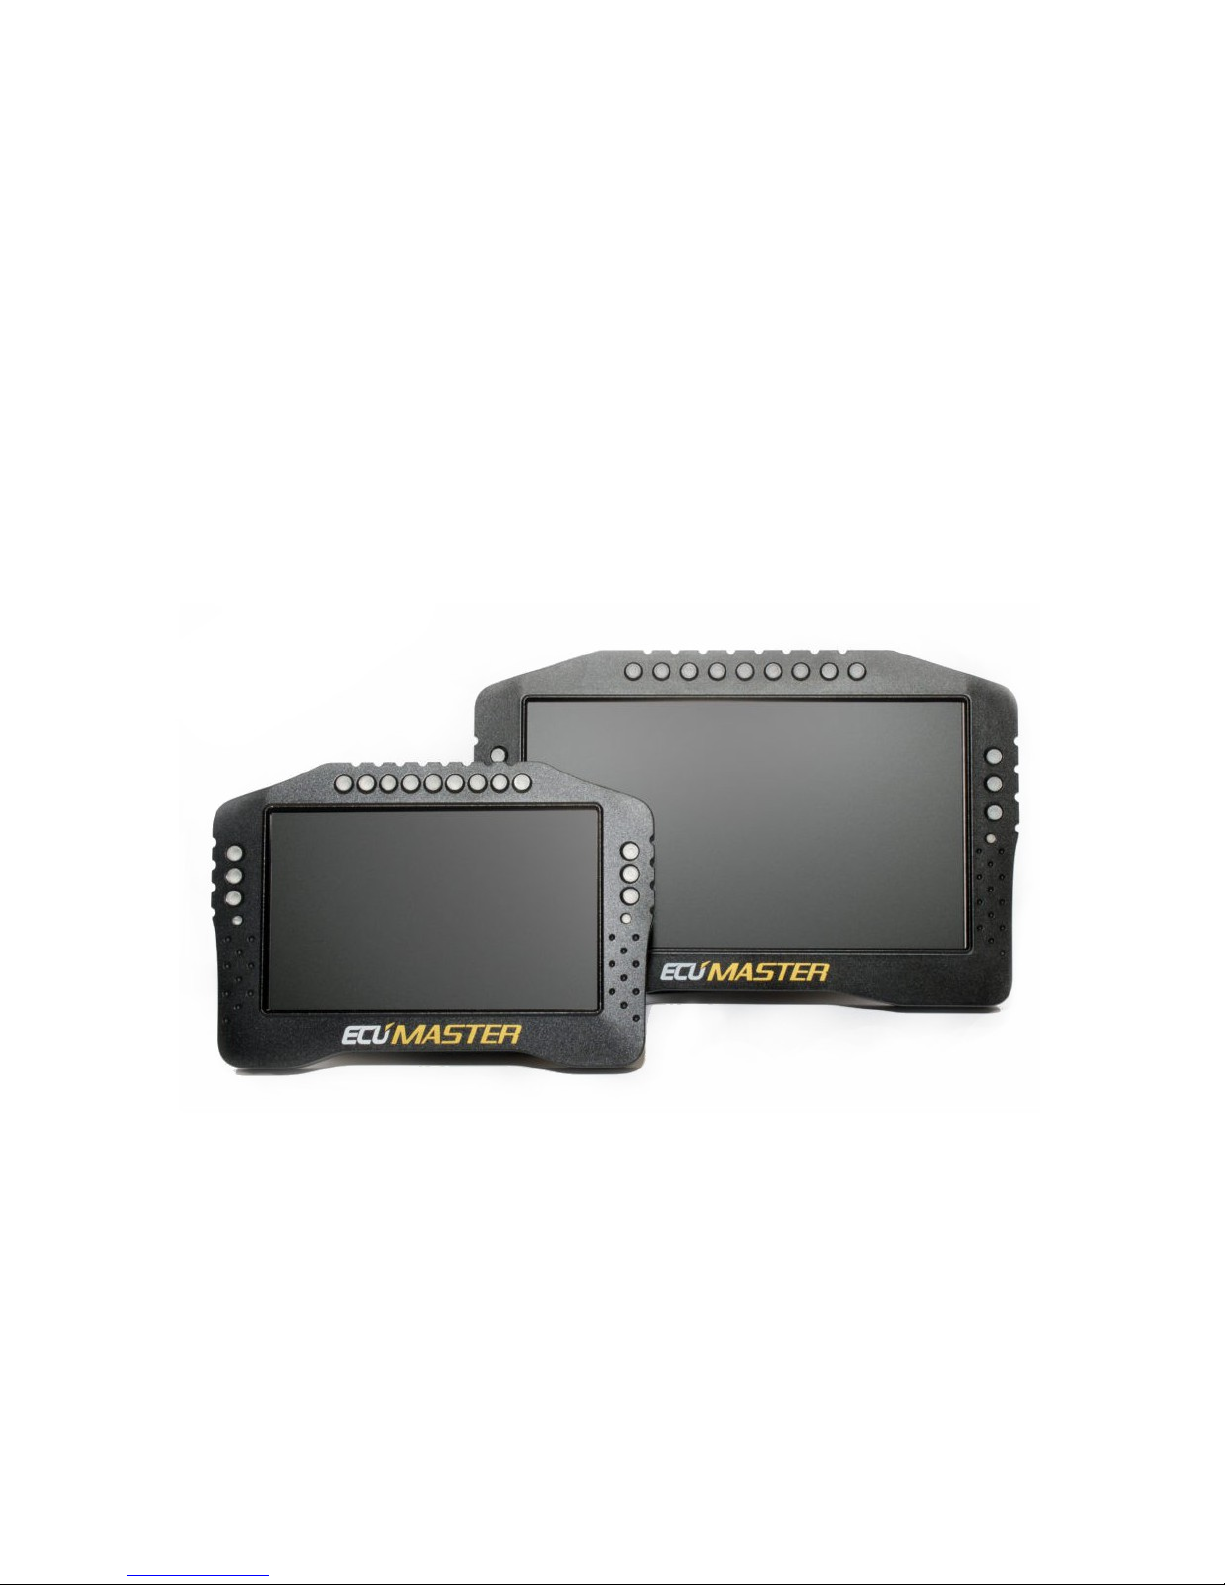
ECUMASTER ADU-5/ADU-7
User Manual
(08/22/2018, version 1.0.101)
Page 2

Contents
Ecumaster ADU....................................................................................................................4
Characteristics...................................................................................................................5
Technical drawing..............................................................................................................6
Device description ............................................................................................................8
Connector..........................................................................................................................9
Connector - description....................................................................................................11
Installation..........................................................................................................................13
CAN bus...........................................................................................................................14
Connecting to ECU..........................................................................................................16
Connecting to CAN bus...................................................................................................16
Connecting using RS232 serial communication..............................................................18
OBD 2..............................................................................................................................19
GPS module.....................................................................................................................20
Ecumaster PMU...............................................................................................................22
Digital inputs....................................................................................................................23
Analogue inputs...............................................................................................................24
USB Flash drive (pen drive).............................................................................................25
Low side outputs..............................................................................................................25
Windows software..............................................................................................................26
Pages ..................................................................................................................................36
Creating a page ..............................................................................................................36
Page elements ................................................................................................................38
Adding page elements ....................................................................................................40
Page switching ................................................................................................................48
Startup screen..................................................................................................................50
Objects ...............................................................................................................................51
Gauge..............................................................................................................................51
Classic gauge..................................................................................................................53
Bar graph.........................................................................................................................56
Simple indicator...............................................................................................................59
Text...................................................................................................................................60
Time.................................................................................................................................62
Image...............................................................................................................................63
RPM Bar..........................................................................................................................64
Gear indicator..................................................................................................................65
G-Force............................................................................................................................66
Predictive time graph.......................................................................................................67
Tire temperature graph....................................................................................................68
Tire temperature gradient................................................................................................69
Track record table............................................................................................................70
Rectangle.........................................................................................................................71
Line..................................................................................................................................72
Circle................................................................................................................................73
Textures ..........................................................................................................................74
Inputs ..................................................................................................................................76
Analogue inputs ..............................................................................................................76
Digital inputs....................................................................................................................80
Outputs................................................................................................................................83
Page 2/137
Page 3

Low side output................................................................................................................83
Analogue output .............................................................................................................83
User lights........................................................................................................................85
User tracks.......................................................................................................................87
Fuel level filter..................................................................................................................89
OBD 2..............................................................................................................................90
Outputs............................................................................................................................91
Working with CAN buses in ADU.....................................................................................92
Using pre-defined streams from CANX files. ..................................................................92
Custom CAN streams - CANbus Message Object .........................................................92
Custom Can streams - CANbus Message Input.............................................................95
Custom CAN streams - saving to a .CANX file...............................................................97
Sending frames by means of the CAN bus (CANbus export).........................................97
Processing information in the ADU ................................................................................99
Timers .............................................................................................................................99
Tables - lookup tables ...................................................................................................100
Switches - virtual switches, counters.............................................................................102
Numbers - mathematical channels................................................................................103
5. Functions...................................................................................................................106
Alarms................................................................................................................................111
User Lights........................................................................................................................113
Logging channels ............................................................................................................114
Logging to USB memory.................................................................................................116
Permanent meters ...........................................................................................................118
Resetting/changing meter status ..................................................................................119
The min/max value for ECU channels............................................................................120
Panels................................................................................................................................121
Buttons...........................................................................................................................121
Shift light........................................................................................................................122
Autobrightness...............................................................................................................124
Configuration..................................................................................................................125
Protection.......................................................................................................................126
Log.................................................................................................................................127
CAN Bus / Serial setup..................................................................................................127
Lap timing ........................................................................................................................129
Configuration of time measurement with a beacon device...........................................130
Configuration of time measurement with a GPS...........................................................130
Data analysis ................................................................................................................131
Appendix 1........................................................................................................................134
Document history.............................................................................................................135
Page 3/137
Page 4
Ecumaster ADU
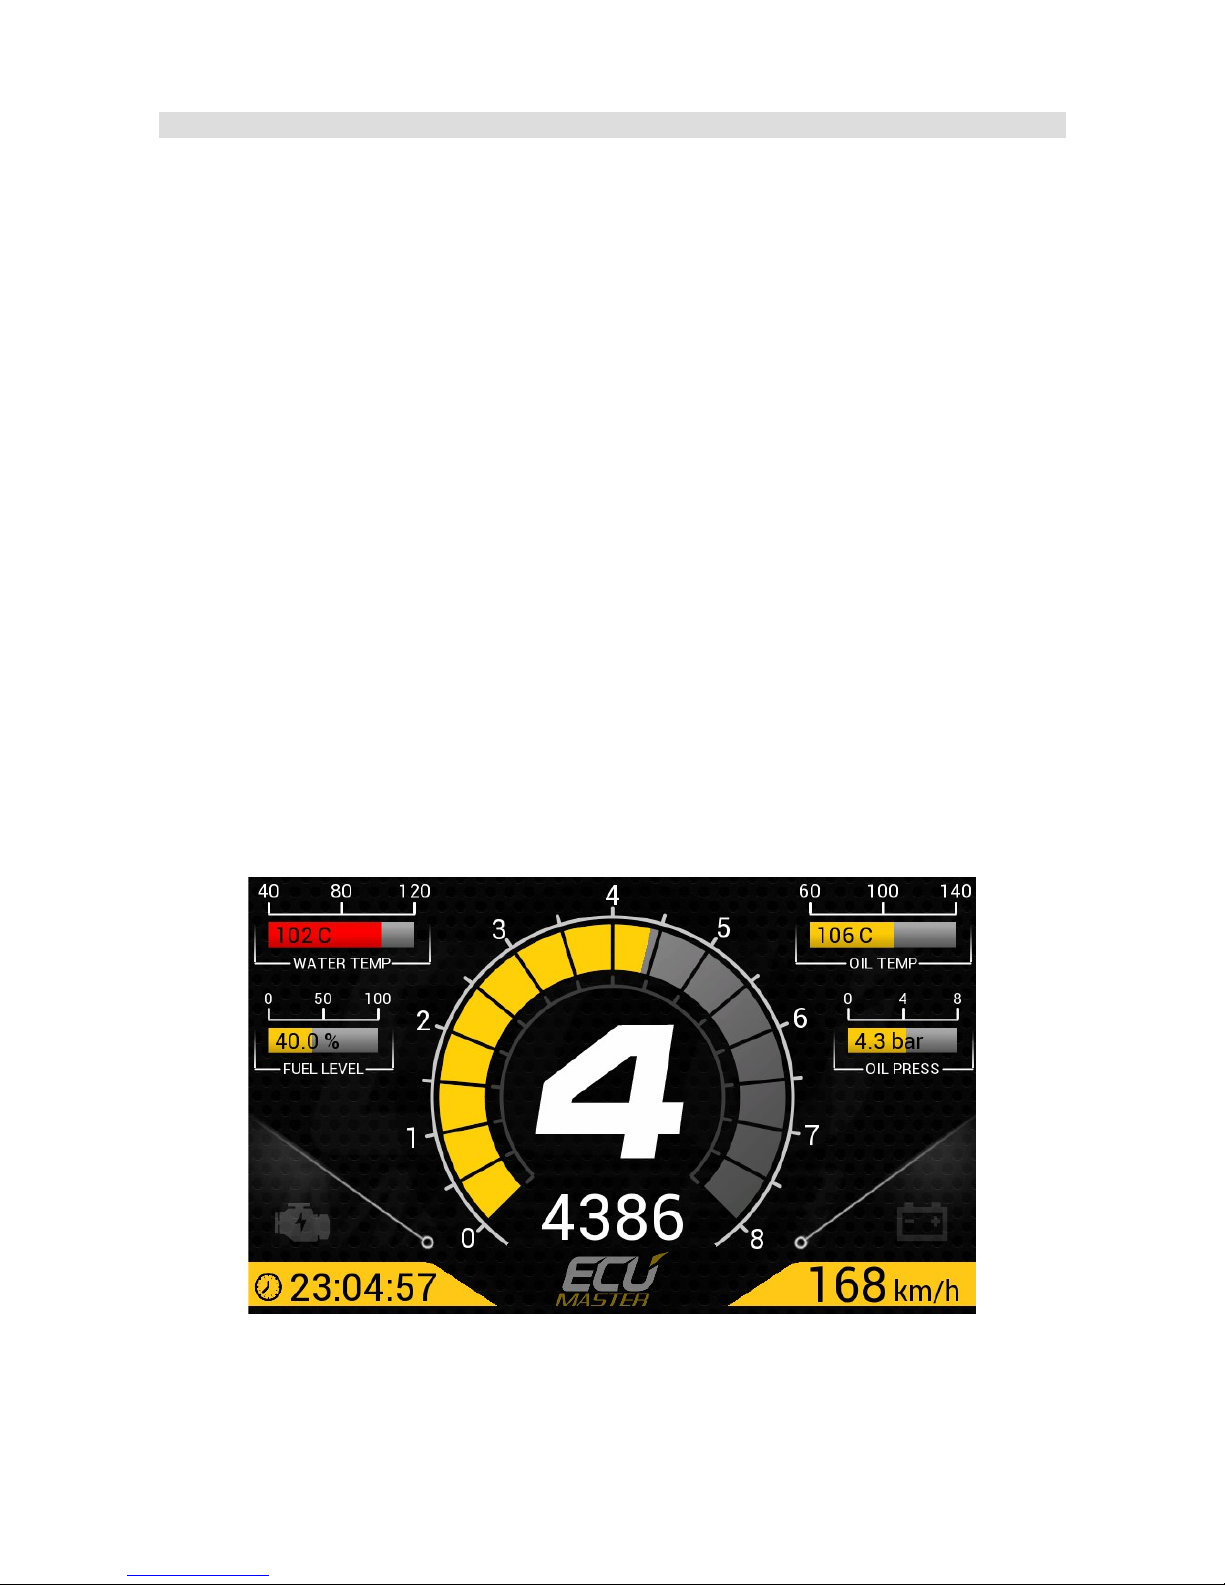
ECUMASTER ADU (Advanced Display Unit) is a universal display designed for motorsports. Unlike
similar devices on the market, the Ecumaster ADU offers a high degree of configurability of the
displayed information and remarkable flexibility for configuring inputs. Equipped with two CAN
buses, the display can easily communicate with other devices (e.g. ECU, GPS, ABS, etc.).
Additionally, up to 8 analogue inputs (e.g. pressure sensors, temperature sensors) and 8 digital
inputs (signals from frequency sensors, beacon etc.) may be connected and configured.
A secondary method of relaying information to the driver is a set of 15 RGB LEDs. These LEDs are
useful for relaying warnings (such as low oil pressure) and as a progressive shift light.
To ensure user comfort in various lighting conditions, a high-quality LCD display was chosen, with
a brightness of 600 cd/m2 for the ADU5 display and 1000 cd/m2 for the ADU7 display. In order to
reduce reflections, the display features an anti-glare coating. The front of the enclosure features
a light sensor that automatically adjusts the brightness of the display to suit current conditions.
The ADU may also be used as a central data logger. All information collected by the display can be
saved on an USB storage device (flash drive, pen drive) recorded at up to 500 Hz per channel. The
ADU features a real-time clock, so all data is stored with the date and time of the recording.
The ADU is a powerful tool for lap timing and driver training. Lap and sector times may be recorded
using an external GPS module, and the driver may be coached in real time using predictive lap
timing. Timing information may be reviewed from logged data after the fact and analyzed.
Page 4/137
Page 5
Characteristics
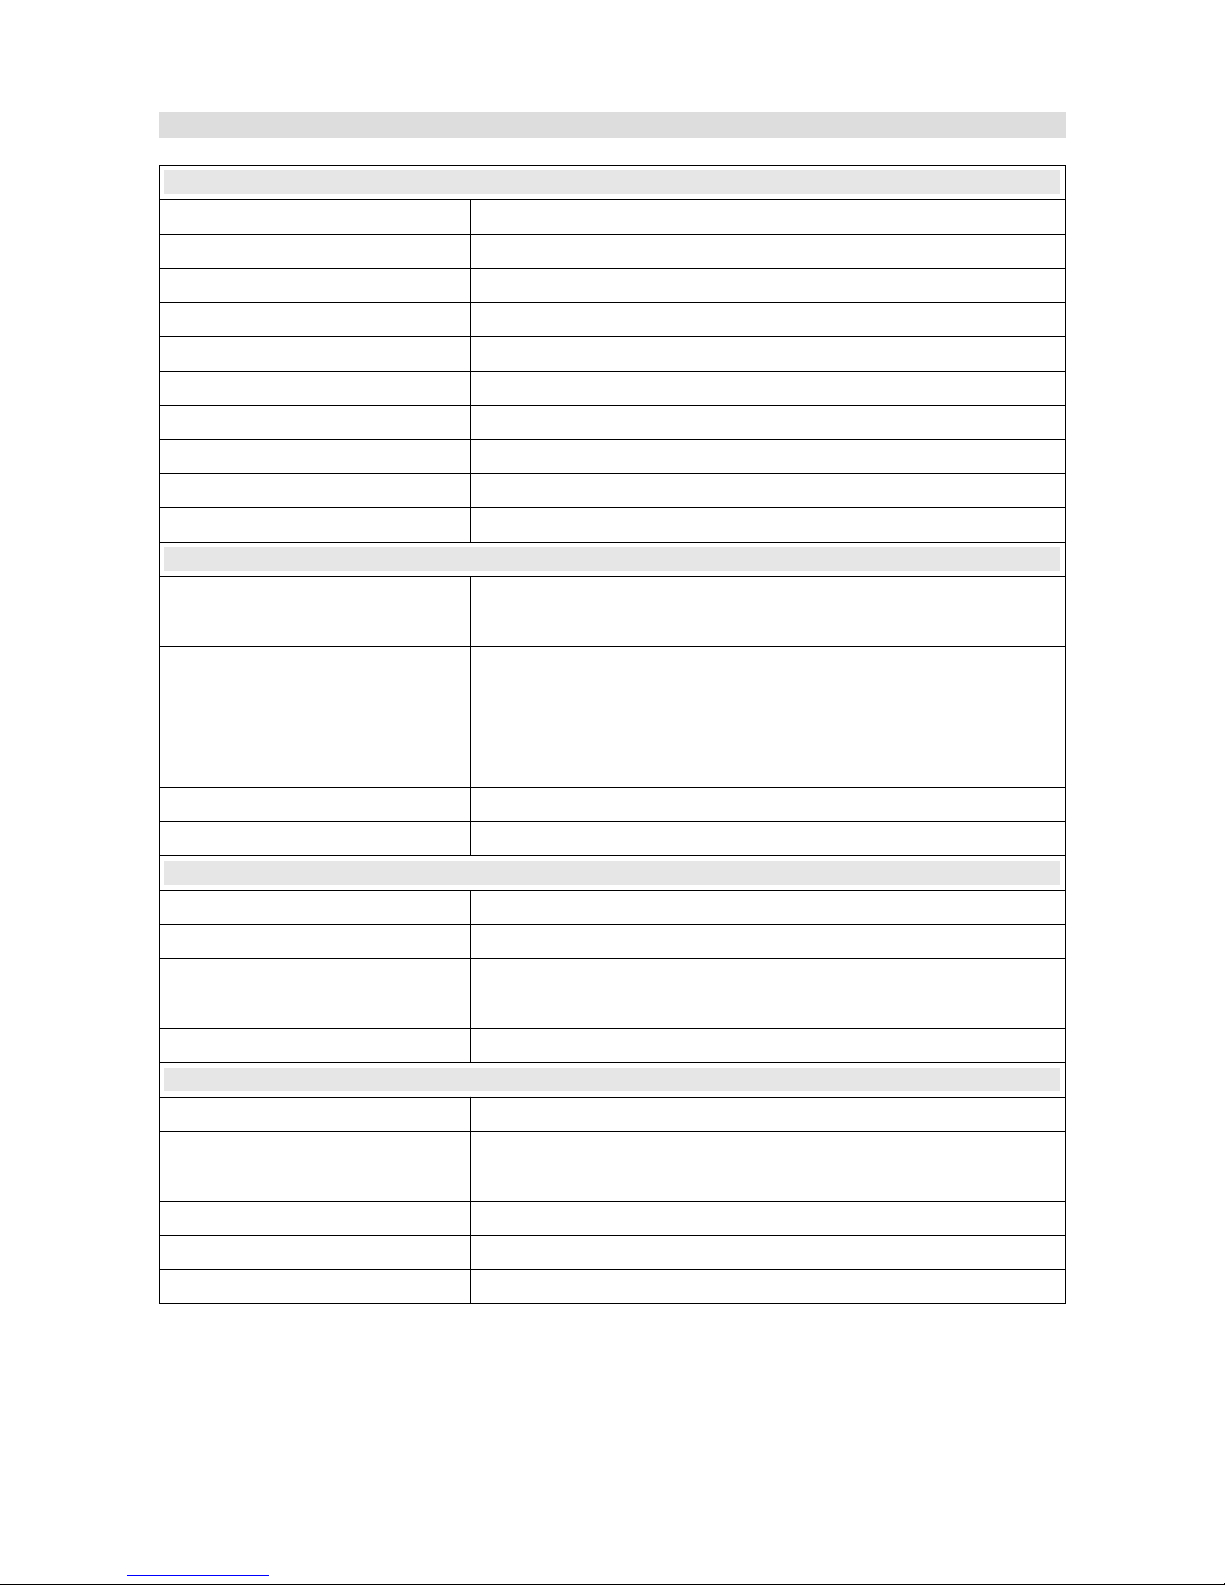
General
Working temperature range ACEQ100 (-40 – 85 C)
CPU 32 bits, automotive, 90 MIPS
Reverse polarity protection Yes, internal
Working voltage range 6-22V, robust supply protection compliant to ISO 7637
Housing Anodized aluminium, CNC-machined
IP code IP 60
Connector 1 x 35 position, AMP automotive
Communication with PC CAN bus Ecumaster interface, Peak or Kvaser
Display type TFT 800x600
Brightness of display 5” - 600 cd/m2, 7” - 1000 cd/m2
Inputs / Outputs
Analogue inputs 8 inputs, 10 bits, 0-5 V, software controlled pull-up/pull-down
10K resistor. Al analog inputs can be used as a switches
Digital inputs 8 digital inputs, software controlled input sensitivity (VR, Hall),
software controlled 4K7 pull-up resistors, used for engine speed
sensors, Flex Fuel, wheel speeds, turbocharger shaft speed. All
digital inputs can be used as a switches
Outputs 2 low side outputs (switch to ground), up to 2A
+ 5V output Monitored 5V output for powering external sensors
Communication
CAN Interface 2 x CAN2.0 A/B, 250, 500, 1000 Kbps
CAN streams User-defined
Serial communication RS232 Rx/Tx, AiM protocols, Ecumaster, Hondata Kpro,
Autronic
USB Used for logging to external USB memory
Others
Light Emitting Diodes 15 ultra bright RGB LEDs
Accelerometer/gyroscope 3D accelerometer + 3D gyroscope for the analysis of vehicle
dynamics
Real-time clock Yes, battery powered
Light sensor Yes, for automatic correction of brightness
Temperature sensor Yes, for monitoring device temperature
Page 5/137
Page 6
Technical drawing
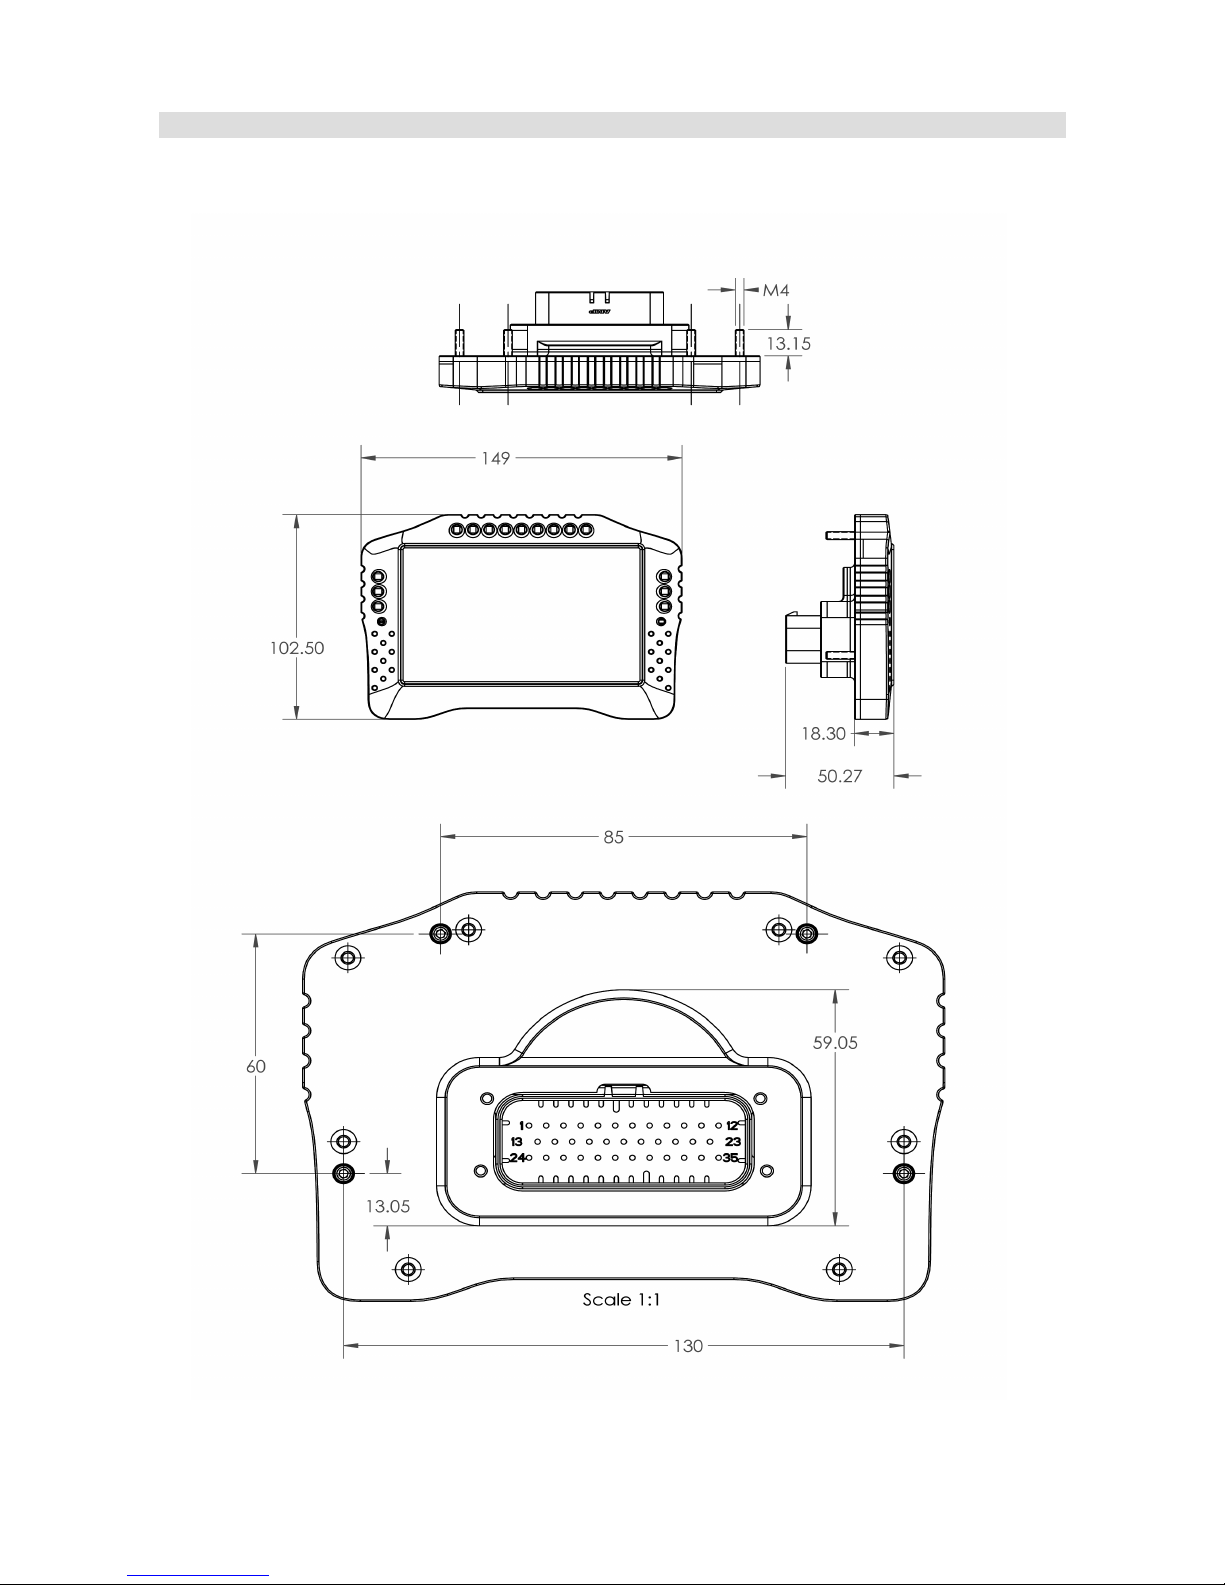
ADU 5 Drawing (all dimensions in mm):
Page 6/137
Page 7
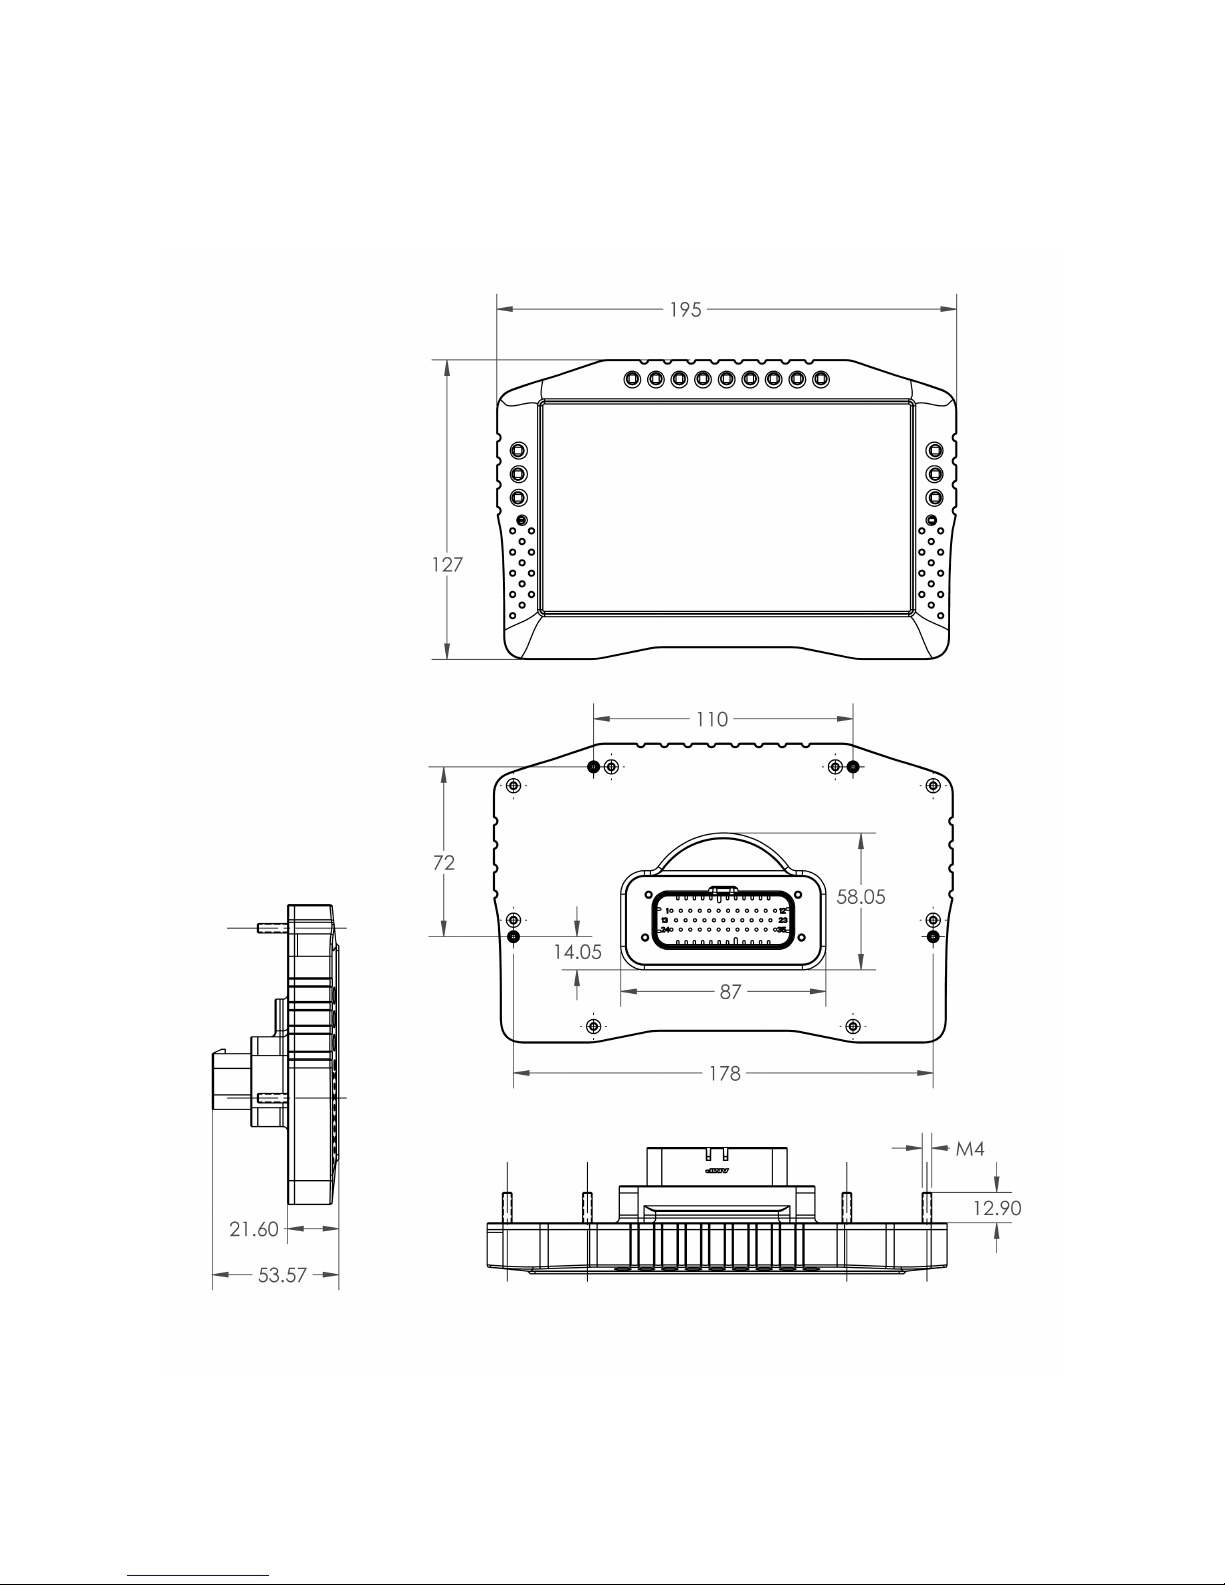
ADU 7 Drawing (all dimensions in mm):
Page 7/137
Page 8
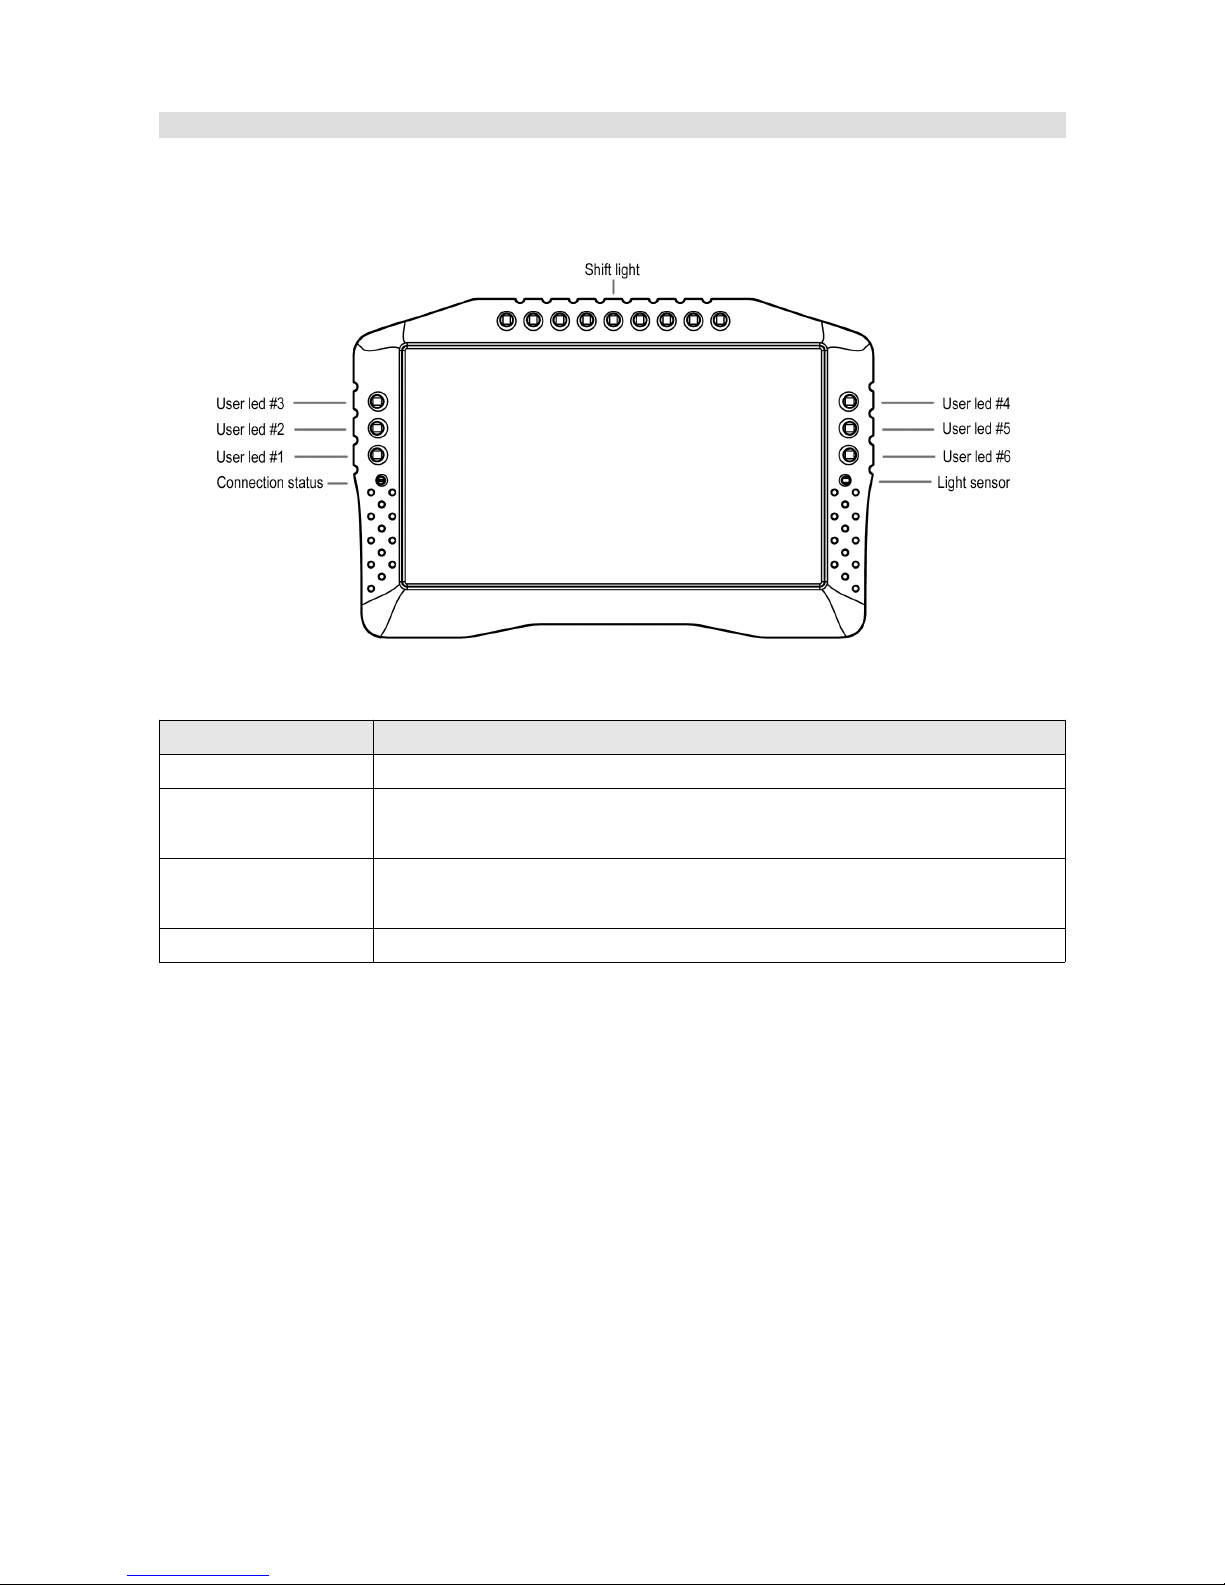
Device description
Front view
Position Description
Connection status LED indicating communication with PC. Flashes green when online
Light sensor Light sensor is used for automatic control of the display and light-emitting
diodes' brightness
User led #1- #6 RGB LEDs that can be controlled by user functions (e.g. Alarms,
indicators, etc.)
Shift light Gear change indicator (user configurable)
Page 8/137
Page 9
Connector
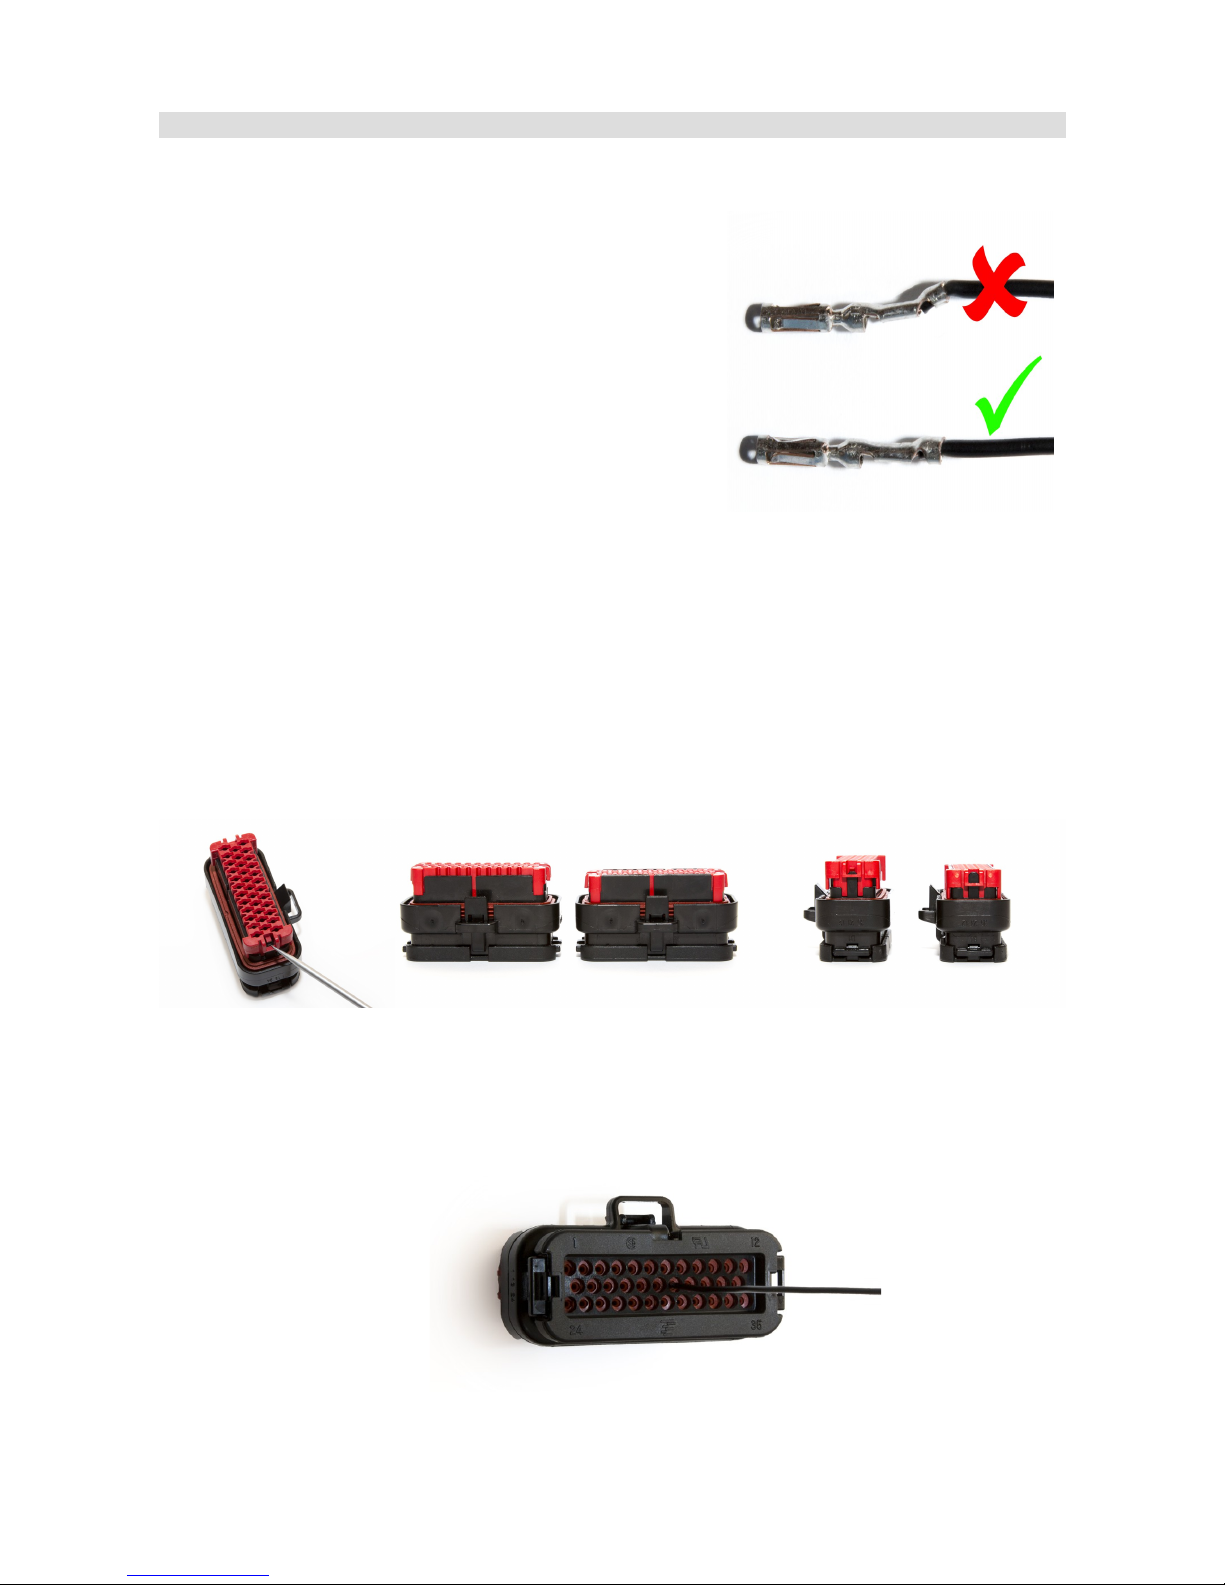
A single 35 position AMPSEAL connector on the rear of the display is used to connect the power
supply, CAN buses and additional sensors or buttons.
A connector and terminals are included with the device. In
order to crimp the terminals, use an appropriate crimping
tool. We do not recommend soldering the wire to the
terminal! If replacement terminals are required, the part
number is AMP 770520-1.
It is critical that terminals are crimped correctly. This type of
connector is very sensitive to the straightness of the
terminal. If excessive force or improper tooling is used, the
terminal will deform and will be difficult to install or remove. The portion of the crimp that supports
the insulation must be circular and of a diameter equal to or smaller than the terminal.
In order to insert or remove terminals, the red terminal lock must be released to the halfway
position, but not removed completely. To eject the red terminal lock, pry the two black latches using
a sharp tool and gently pull the lock. The lock should extend by about 0.5 cm. The teeth prevent
total removal of the red lock from the connector housing. In this position the connector housing is
ready to have terminals inserted or removed.
Terminals should be inserted from the back side of the connector. The mat seal is designed to
allow for the insertion of terminals. Do not attempt to disassemble the back of the connector
housing.
Page 9/137
Page 10

Insert the terminal until you hear a click. Take care to only insert the terminal far enough to click.
If the terminal is inserted too far (until it touches the front of the red terminal lock) the lock will be
unable to return to its locked position.
After all terminals have been inserted, push the red terminal lock back to its locked position.
If excessive resistance is encountered, check to ensure that no terminals are inserted too far
forward.
In order to remove a terminal, move the red terminal lock to the halfway position as described
before. Grasp the wire near the connector, and rotate it left and right over a half turn each way to
release the locking tabs, then pull the terminal out of the connector housing.
A video showing the proper assembly and disassembly of this connector can be found here:
https://www.youtube.com/watch?v=uXTkm_XV2OY
Page 10/137
Page 11
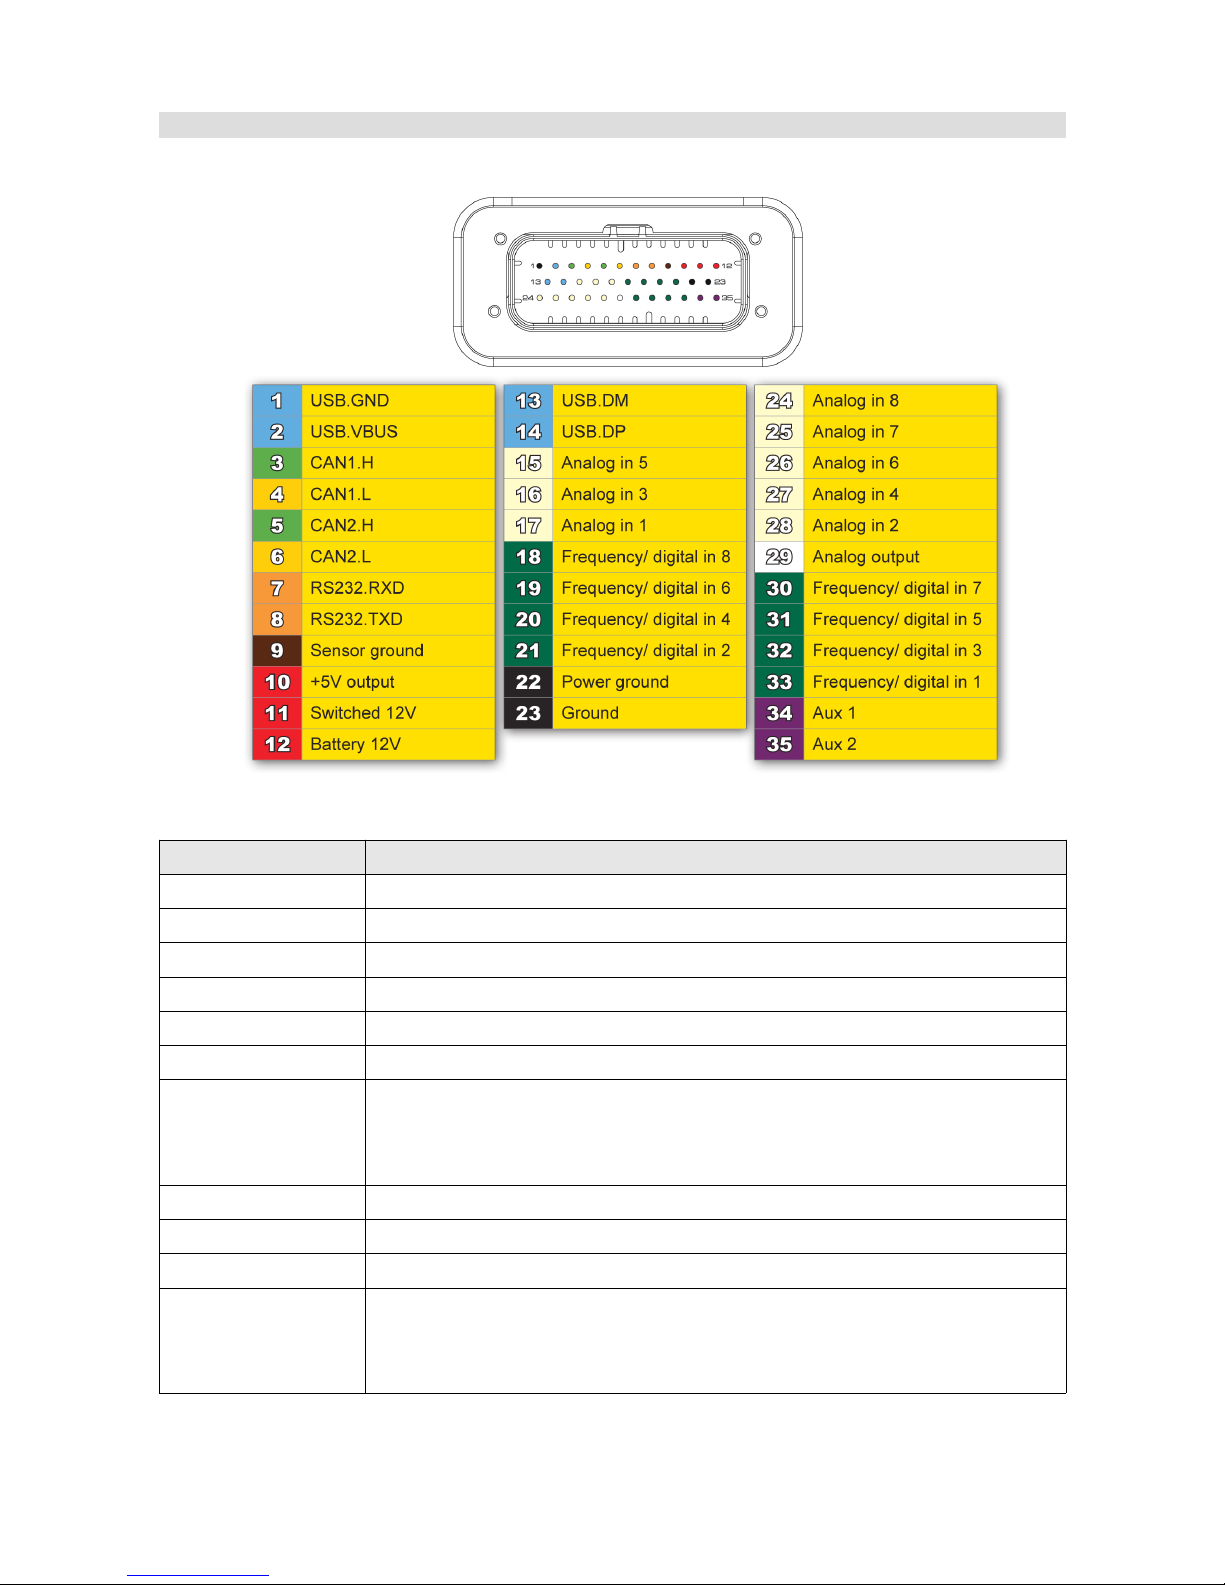
Connector - description
Terminal Description
1. USB.GND Ground for the USB port
2. USB.VBUS VBUS signal for the USB port
3. CAN1.H CAN H signal for CAN BUS 1
4. CAN1.L CAN L signal for CAN BUS 1
5. CAN2.H CAN H signal for CAN BUS 2
6. CAN2.L CAN L signal for CAN BUS 2
7. RS232.RXD RXD (receiving) signal for RS232 serial communication. Used for
connection to EMU, Classic, Hondata, Autronic SM4 and AIM compatible
ECUs.
8. RS232.TXD TDX signal (transmitting) for serial RS232
9. Ground sensor Ground for external sensors (e.g. Oil pressure sensor)
10. +5V output +5 power supply for external sensors. Maximum load 400mA
11. Switched 12V +12V signal to switch on the device. The device is internally powered by
the 12 terminal (Battery 12V).
Page 11/137
Page 12
12. Battery 12V Power supply and backup for the real-time clock when the device is turned
off (when no +12V signal at terminal 11). In the case that there is no 12V
battery power, the real-time clock is powered by an internal battery.
13. USB.DM D- signal to the USB port
14. USB.DP D+ signal to the USB port
15. Analog in 5 Analogue input 5. Measuring range 0-5V
16. Analog in 3 Analogue input 3. Measuring range 0-5V
17. Analog in 1 Analogue input 3. Measuring range 0-5V
18. Digital in 8 Digital input 8
19. Digital in 6 Digital input 6
20. Digital in 4 Digital input 4
21. Digital in 2 Digital input 2. The only input that can be used by a Flex fuel sensor
22. Power ground Device ground used by the AUX outputs and LEDs
23. Ground Device ground
24. Analog in 8 Analogue input 8. Measuring range 0-5V
25. Analog in 7 Analogue input 7. Measuring range 0-5V
26. Analog in 6 Analogue input 6. Measuring range 0-5V
27. Analog in 4 Analogue input 4. Measuring range 0-5V
28. Analog in 2 Analogue input 2. Measuring range 0-5V
29. Analog out Analogue output 0-5V
30. Digital in 7 Digital input 7
31. Digital in 5 Digital input 5
32. Digital in 3 Digital input 3 .This is the only input that will read an AIM beacon
33. Digital in 1 Digital input 1. This is the only input that will support an RPM sensor
34. Aux 1 Low side output. Maximum load 2A
35. Aux 2 Low side output. Maximum load 2A
Page 12/137
Page 13
Installation
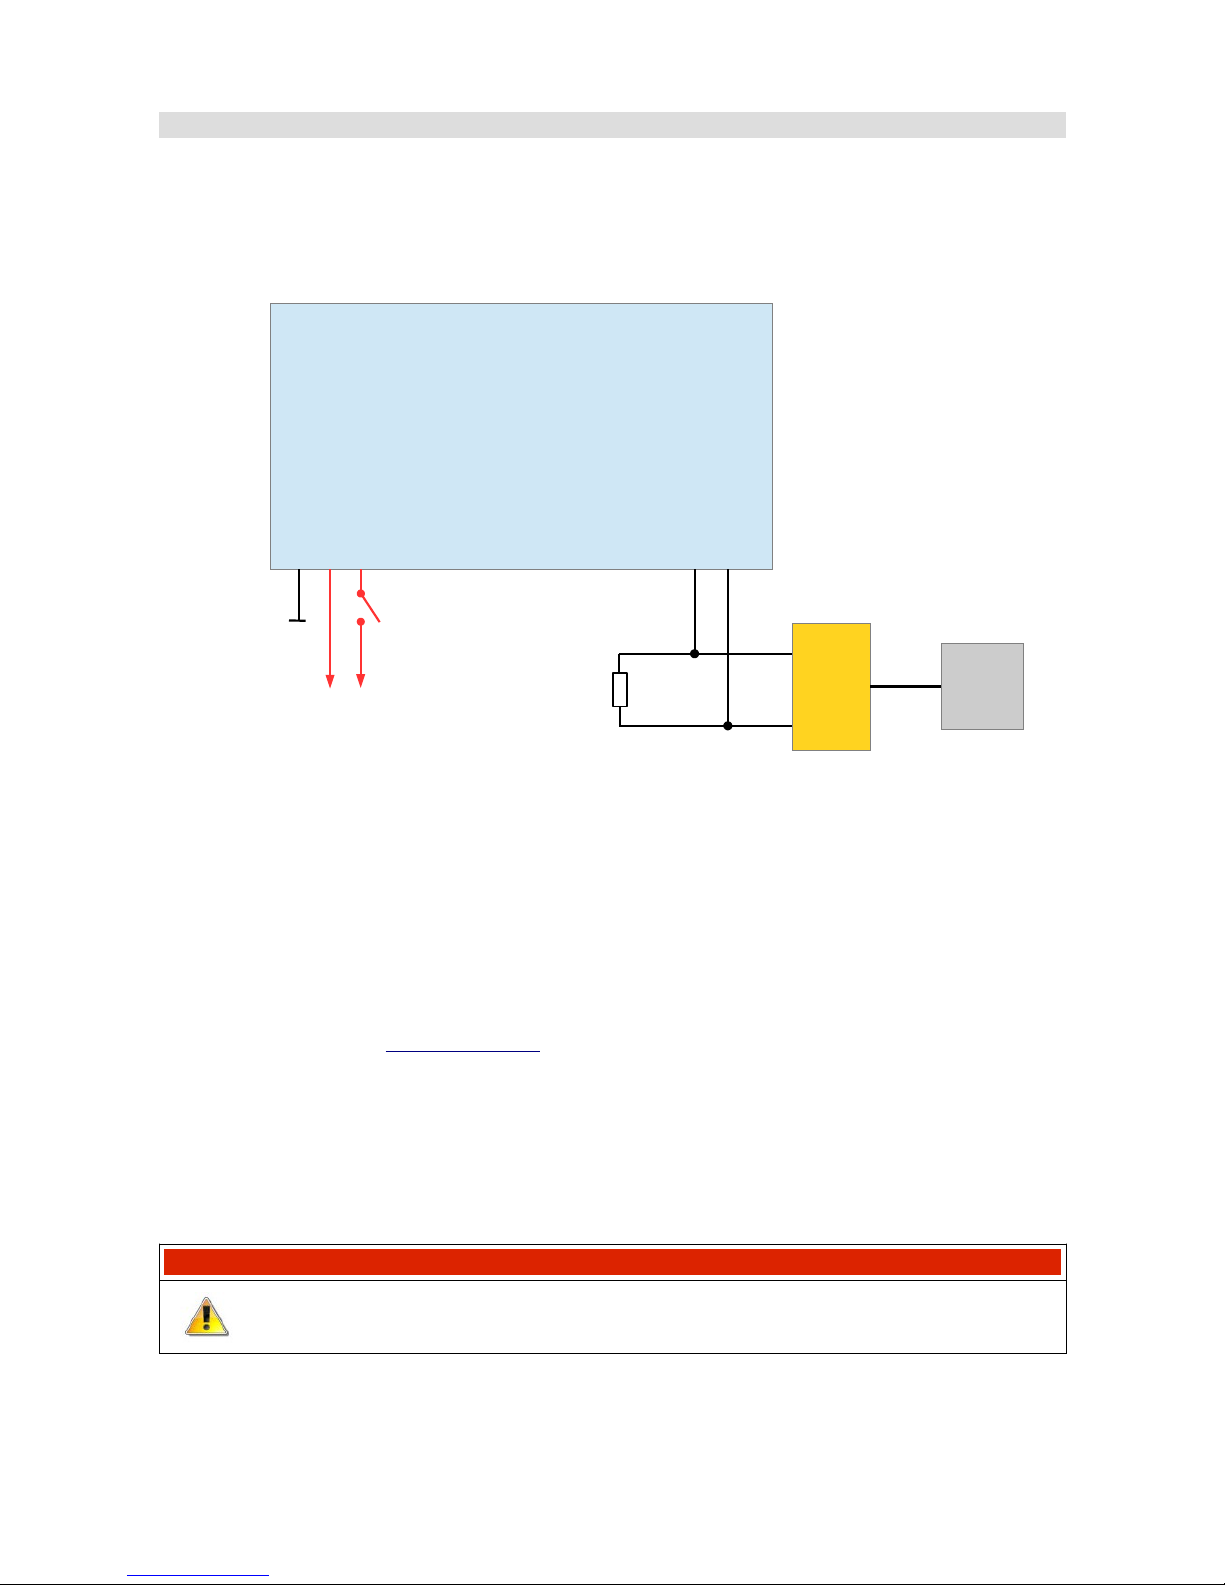
To start the device and communicate with a PC, connect the device's power supply and the
USB2CAN interface to CAN1.
This bus has a constant speed of 1Mbps and one of its functions is communication with a PC.
The above figure shows the minimum connections required to power the device and enable
communication with a PC.
The ADU is programmed through a USB to CAN adapter. Any of these three devices may be used
to enable communication between PC and ADU:
– Ecumaster USBtoCAN (www.ecumaster.com)
– Peak Systems PCAN USB (www.peak-system.com)
– Kvaser USBcan (www.kvaser.com)
All of these interfaces are equipped with DB9 connectors, where CANL and CANH signals are on
terminals No. 2 and No. 7 respectively.
The diagram also includes a 120Ohm terminator, which is necessary for the correct operation of
the bus (for more information about the terminators see the CAN-BUS section).
IMPORTANT !
Do not connect the +5V output from the CAN interface to +5V ADU!
Page 13/137
ADU
3 CAN1.H
4 CAN1.L
23 Ground
12 Battery
11 Switched 12V
CAN BUS
120 Ohm
USBtoCAN
2
7
USB
PC
Page 14
It is recommended to use an interface with galvanic isolation. The CAN bus is a differential signal
bus and in most cases there is no need to connect the interface ground to the vehicle/ADU ground.
If you want to connect an interface ground, measure the potential difference of the interface and
the vehicle. Too large a potential difference can damage the device.
CAN bus
The CAN (Control Area Network) bus was developed to communicate between devices in
automotive environments. Its construction is very simple (only two wires) and its immunity to
interference is very high. In a modern car, there may be dozens of different electronic modules
communicating with the use of the CAN bus.
The ADU device has two CAN buses: the CAN1 bus is used for communication with a PC (requires
an additional interface) and devices that support 1Mbps speed.
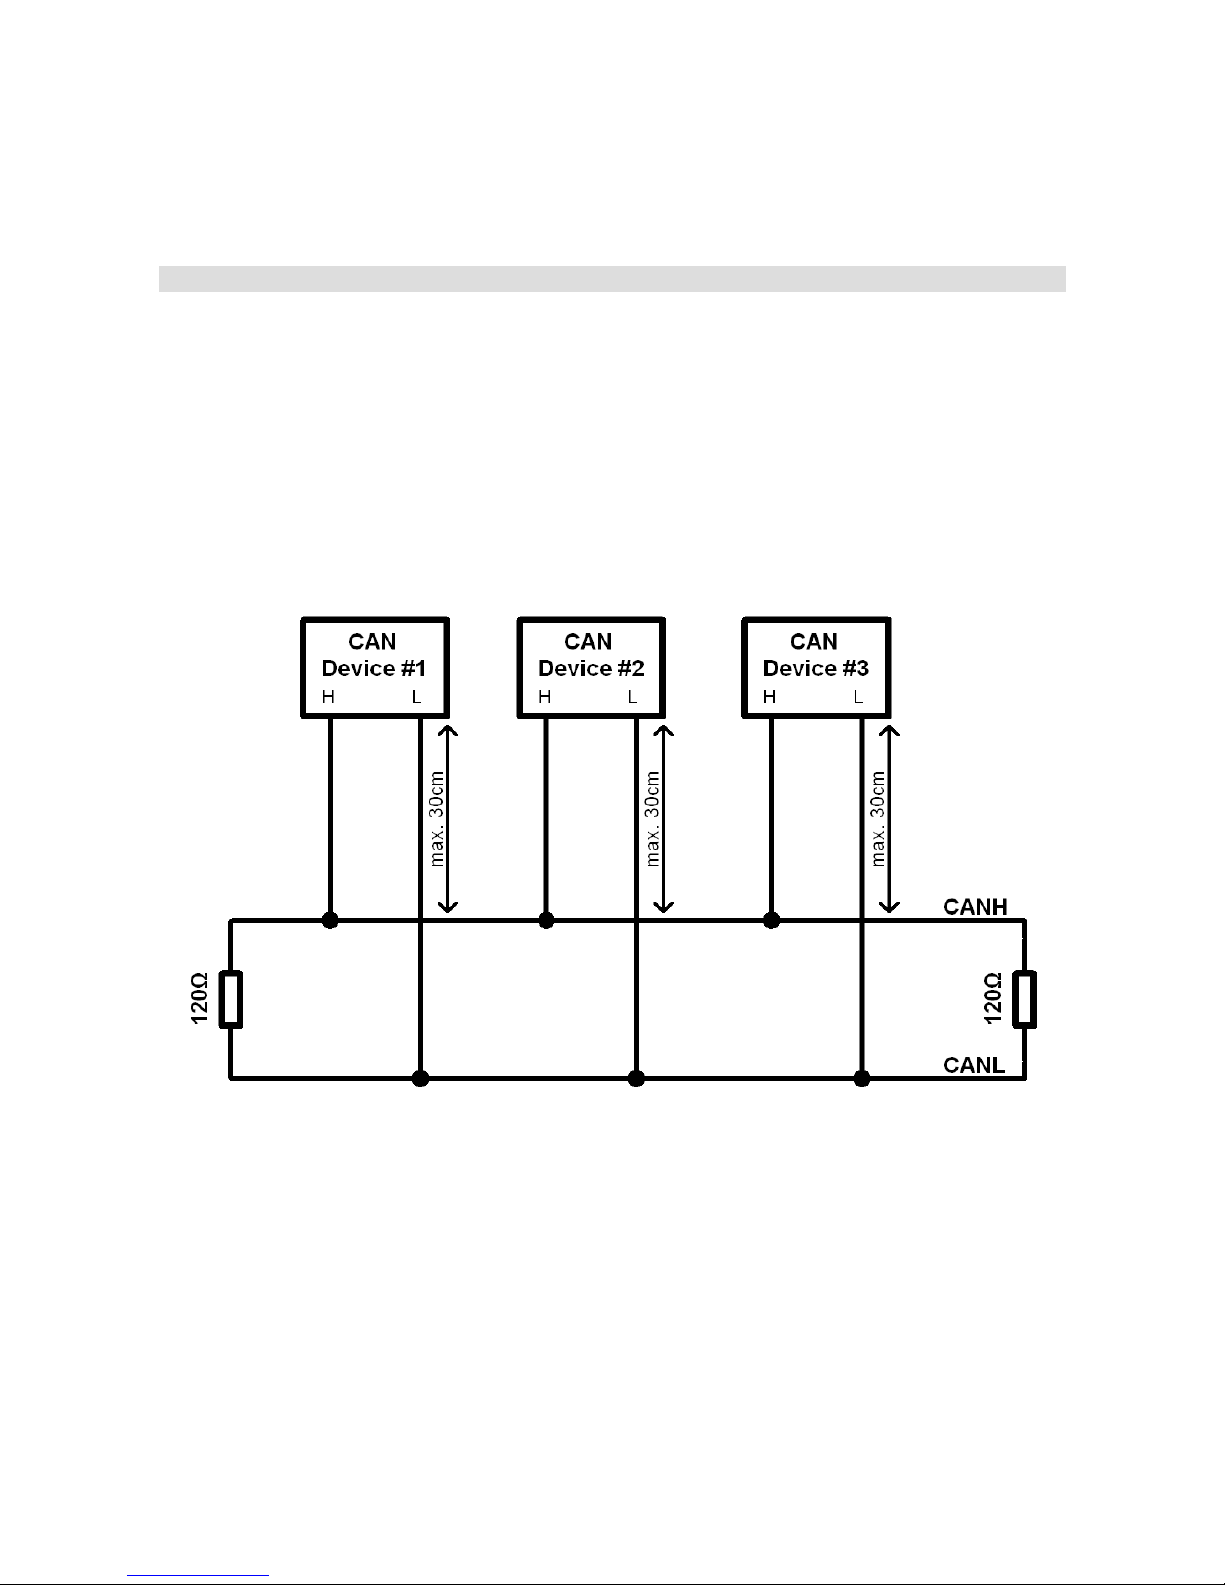
Data frames are sent on the network. The network topology should look like the following:
In automotive applications, typical data transmission speeds on the CAN bus are 1Mbps, 500 Kbps
and 250 Kbps. Depending on the speed, the following conditions must be met:
For a speed of 1Mbps:
– the length of the connection cable between the bus and the node must not exceed 30 cm.
– the maximum bus length is 40 m
– the maximum number of nodes is 30
Page 14/137
Page 15
For a speed of 500kbps:
– the length of the connection cable between the bus and the node must not exceed 30 cm.
– the maximum bus length is 100m
– the maximum number of nodes is 30
Regardless of the speed, the CAN bus must have 120 Ohm termination resistors at both ends.
Additionally, all connections within the bus must be made using twisted pair wires.
It is important that the data transfer speed on a bus is identical for all devices.
WARNING!
Failure to follow these rules will lead to a malfunctioning CAN bus and problems
with communication.
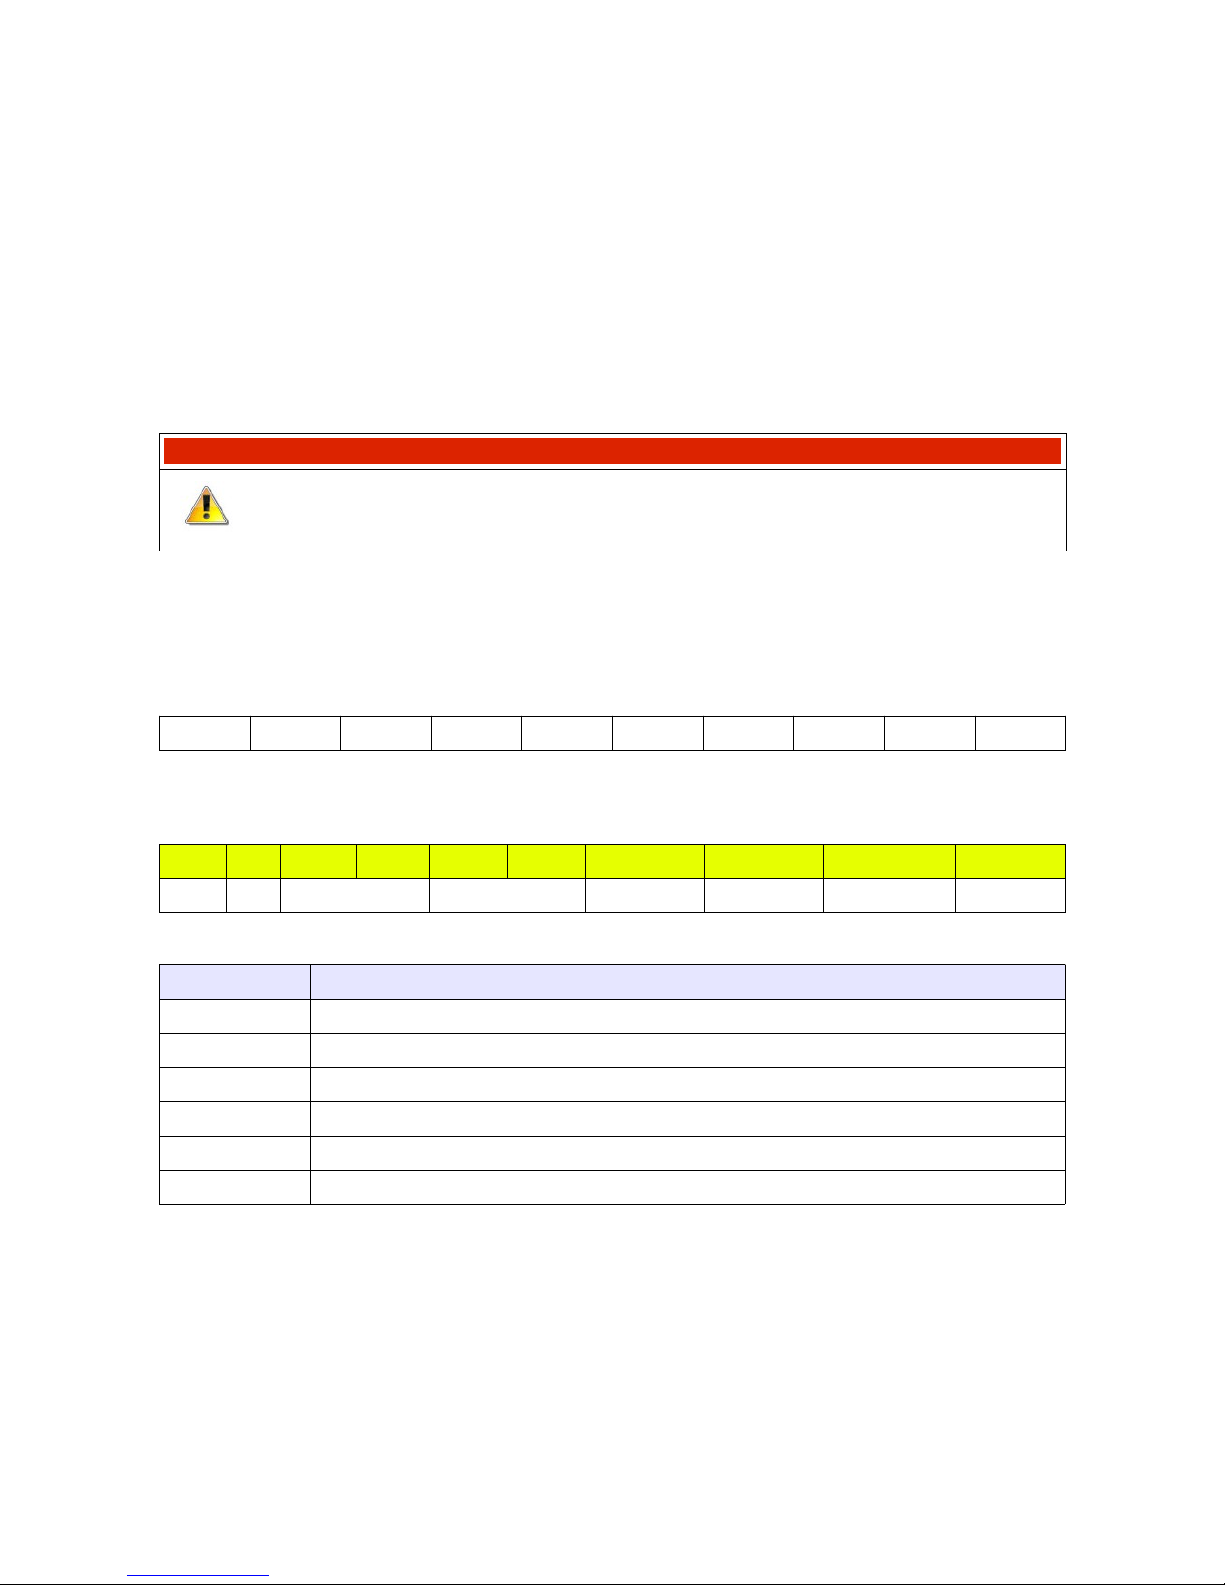
The CAN frame consists of an identifier (ID), the number of transmitted bytes (DLC), and the data.
Depending on the bus type, the identifier may be 11 bits (0x0-0x7ff) or 29 bit (0x0-0x1fffffff). The
number of data bytes may range from 0 to 8
ID DLC Byte 0 Byte 1 Byte 2 Byte 3 Byte 4 Byte 5 Byte 6 Byte 7
Below is a sample CAN frame from a CAN Switchboard device.
ID DLC Byte 0 Byte 1 Byte 2 Byte 3 Byte 4 Byte 5 Byte 6 Byte 7
0x666 8 Analog#1(mV) Analog#2 (mV) CALPOT 1 CAL POT 2 Switch mask Heartbeat
Parameter Description
Analog#1 The voltage for the analogue input #1 0-5000mV, big endian
Analog#2 The voltage for the analogue input #2 0-5000mV, big endian
Switch mask Bitmap of the pressed buttons (1 means pressed)
CAL POT #1 Discrete value of the position of the rotary switch connected to analogue input #1
CAL POT #2 Discrete value of the position of the rotary switch connected to analogue input #2
Heartbeat The counter increases its value by 1 after sending each frame
Page 15/137
Page 16
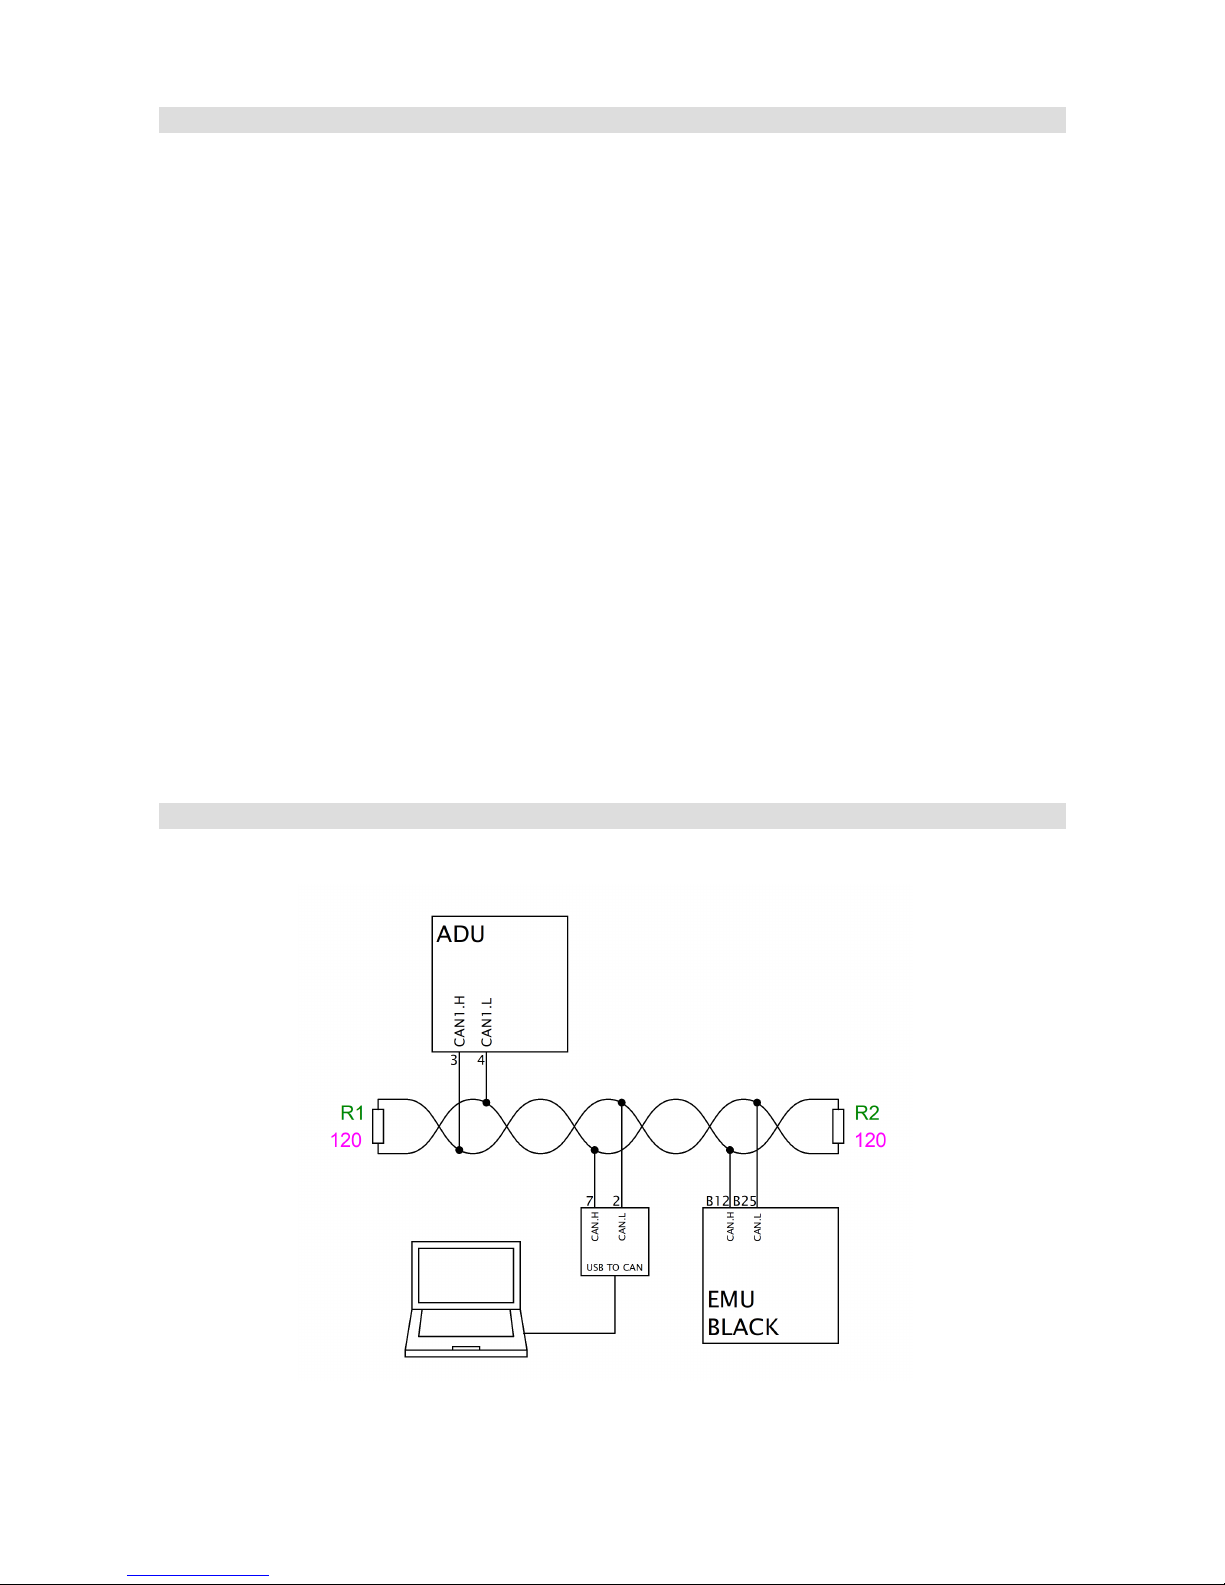
Connecting to ECU
To be able to display and log data from the engine management unit, connect the ADU to the CAN
bus of the ECU or its serial port.
When using a CAN bus, you may connect the ECU to the CAN1 (where the ECU CAN bus speed
is 1 Mbps) or to the CAN2 bus where you can define the speed of the CAN bus.
When connecting to an OEM ECU, the typical speed is 500 Kbps (units with a 250 Kbps bus are
rare), which forces us to use a CAN2 bus connection.
Some aftermarket engine management units used in motor sports do not have a CAN bus, but are
equipped with a serial output. This is the case for the EMU, EMU CLASSIC, or Hondata. ADU
supports the following serial formats: AIM, Ecumaster serial protocol, Autronic SM4 and Hondata
serial protocol. For additional information, go to the Serial communication section.
In the case of factory controllers equipped with an OBD2 connector using the CAN BUS (all
vehicles since 2008) it is possible to use the OBD connector to read basic engine operation
parameters. For more information, see OBD2 manual section.
External sensors may be connected to the ADU using the analogue and digital input channels (e.g.
TPS, temperature and oil/fuel pressure sensors, crankshaft position sensor, etc.). As a result, you
can monitor and log parameters that are not supported by the original engine control module.
Connecting to CAN bus
The following diagram shows an example connection of an ECU to the ADU using the CAN1 bus.
Page 16/137
Page 17
WARNING!
Engine control CAN bus driver speed must be at least 1Mbps. This is due to the
fact that the ADU CAN1 bus supports only this communication speed.
IMPORTANT!
Please ensure the correct bus topology and its proper termination. For more
information see the CAN BUS section.
If the CAN bus speed is different than 1Mbps or if you want to isolate the ECU from the ADU CAN1
bus, please use the CAN2 bus.
Detailed information on connecting specific ECU brands to ADU can be found in the application
notes at www.ecumaster.com. Information about the channel configuration with CAN stream data
can be found in the CAN inputs section.
Page 17/137
Page 18
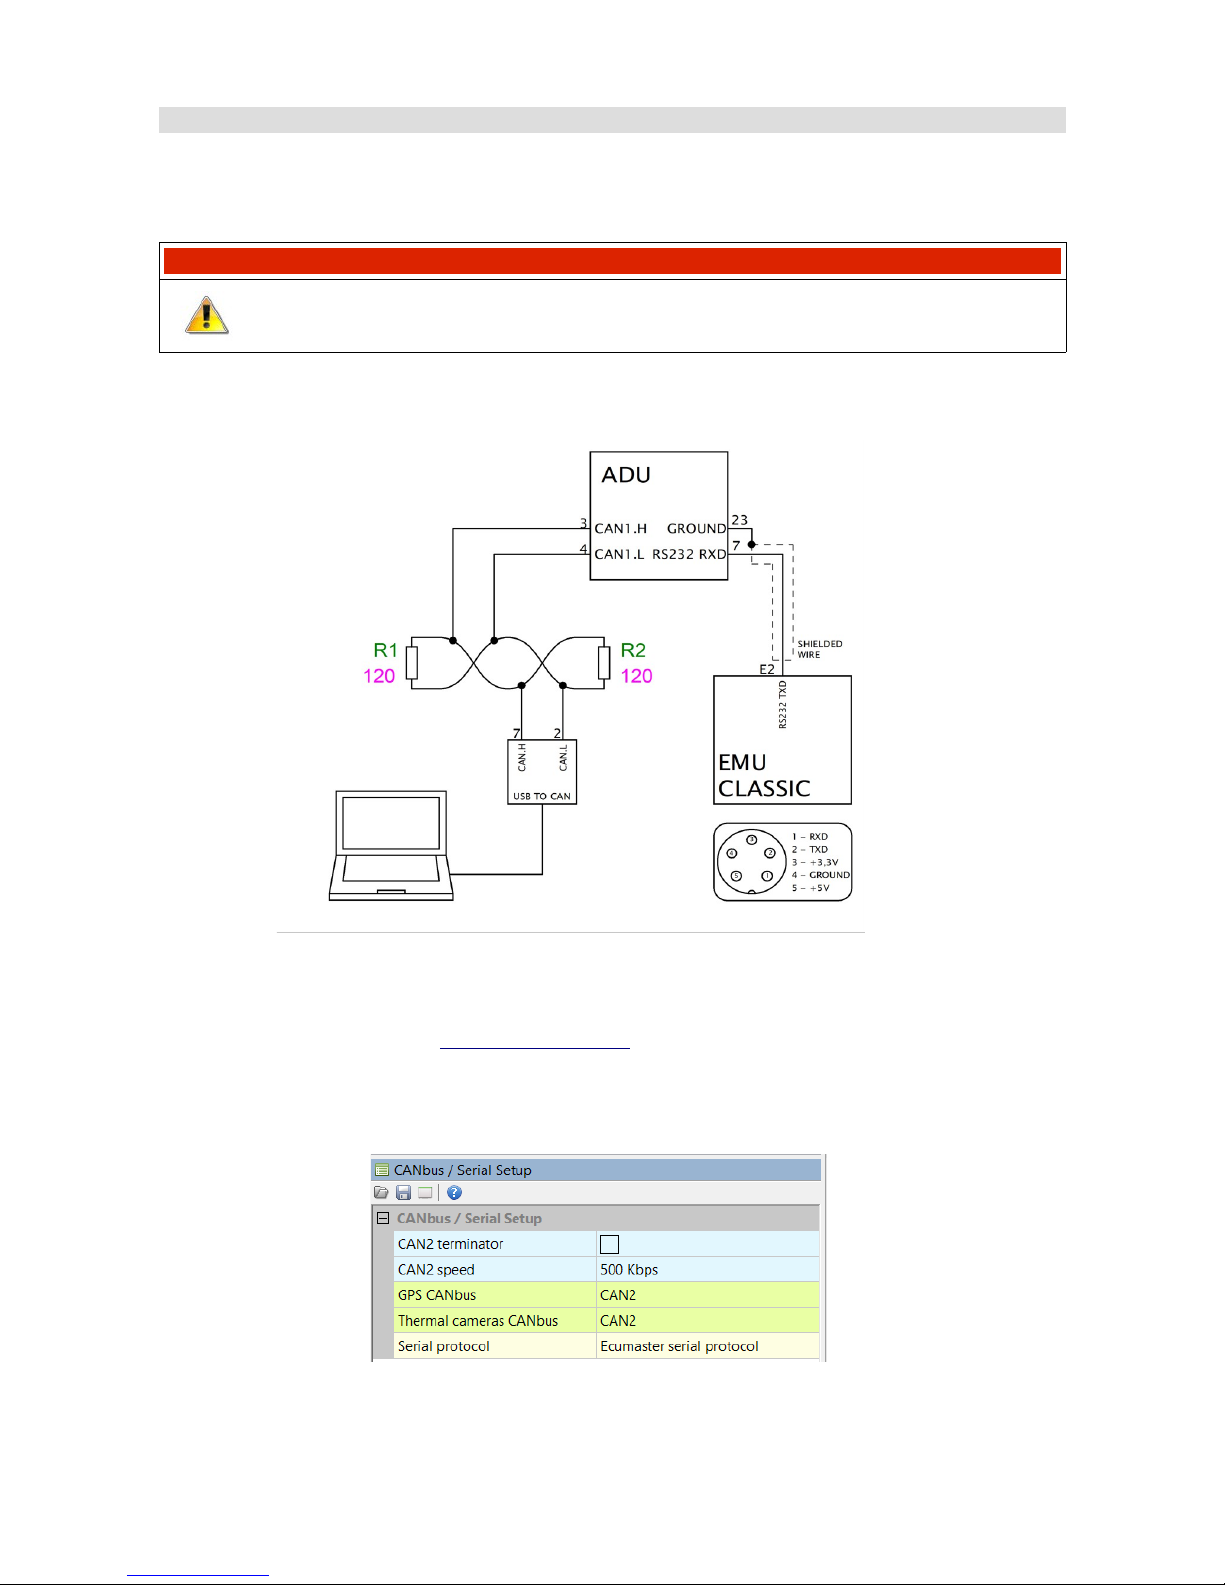
Connecting using RS232 serial communication
The ADU display has a built-in RS232 serial bus. In order to connect the ECU via a serial
connection, connect the ECU output (Tx) to the ADU input (Rx) .
IMPORTANT!
To transfer data via serial communication please use a shielded cable.
The diagram below shows an example of the connection.
Detailed information on connecting specific ECU brands to ADU can be found in the application
notes at www.ecumaster.com. www.ecumaster.com.
To configure the serial protocol (which depends on the ECU connected), select the appropriate
protocol in the CAN Bus/Serial window (Ecumaster serial protocol, AIM, Hondata, Autronic SM4).
Page 18/137
Page 19
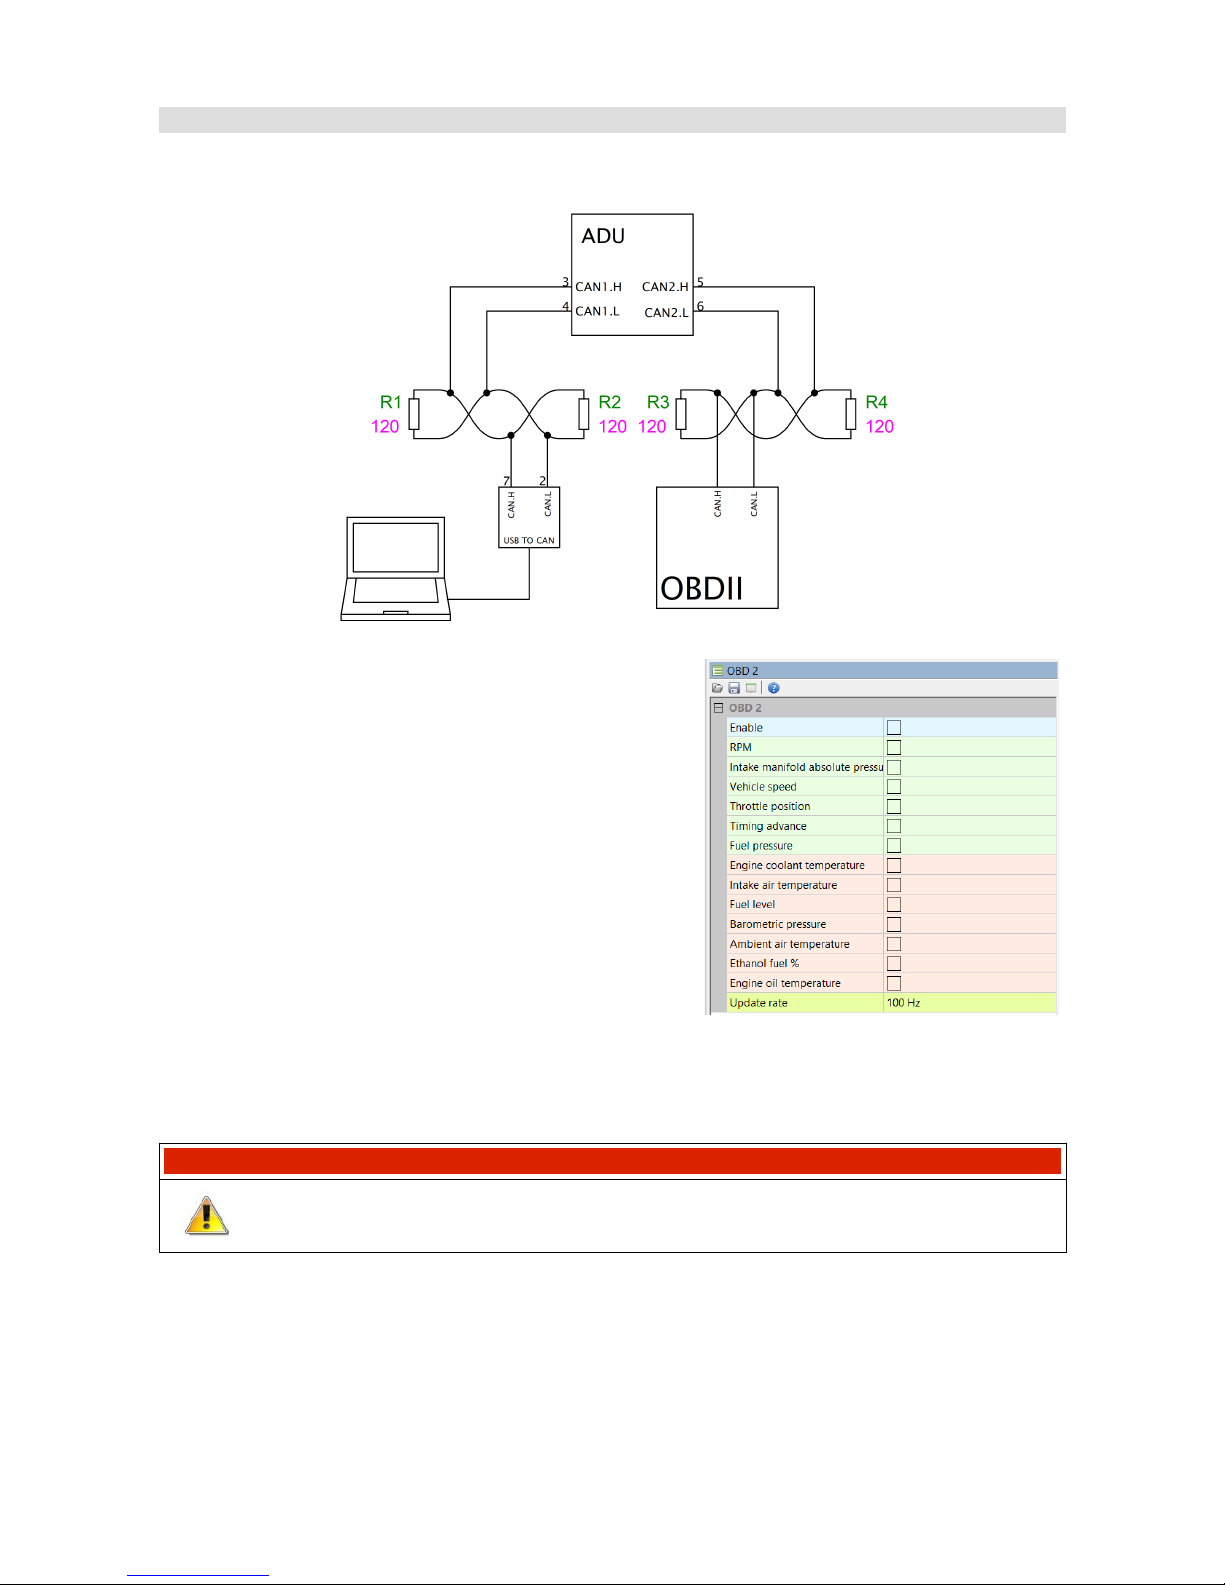
OBD 2
The following diagram shows the connection of the CAN2 bus to the OBD2 bus of the vehicle.
Set the correct CAN bus speed in the CAN Bus/Serial
set-up window (it will usually be 500 Kbps). Then, select
the desired channels in the OBD 2 window.
The channels are divided into two groups: quick (green)
and slow (orange). Quick channels use 66% of the
bandwidth (update rate) while the slow channels use
34%. This means that in the case of an Update rate equal
to 100Hz (data is downloaded by OBD2 at 100Hz) and
when the RPM channel is selected, it will be refreshed 66
times per second (66Hz). If you select an additional
channel (e.g. Throttle position) the refresh rate for both channels will be 33Hz. It should be noted
that not all ECUs are able to refresh the data at a frequency of 100 Hz. In such a case, lower the
“Update rate” parameter.
IMPORTANT!
Not all channels found in the OBD2 window are available for different ECUs.
It is also possible to read a mix of parameters from an OEM ECU, e.g. throttle position and RPM
can be read directly from the CAN bus and the remaining parameters from the OBD2 port. For
further information go to CAN inputs section.
Page 19/137
Page 20
GPS module
The ADU display allows you to use the Ecumaster GPS module to measure lap times on track and
allows data analysis based on the vehicle’s position on the track.
To measure current position of the vehicle, the module uses information from GPS/Glonass
satellites and a built-in accelerometer and gyroscope. The position is refreshed at a frequency of
20Hz.
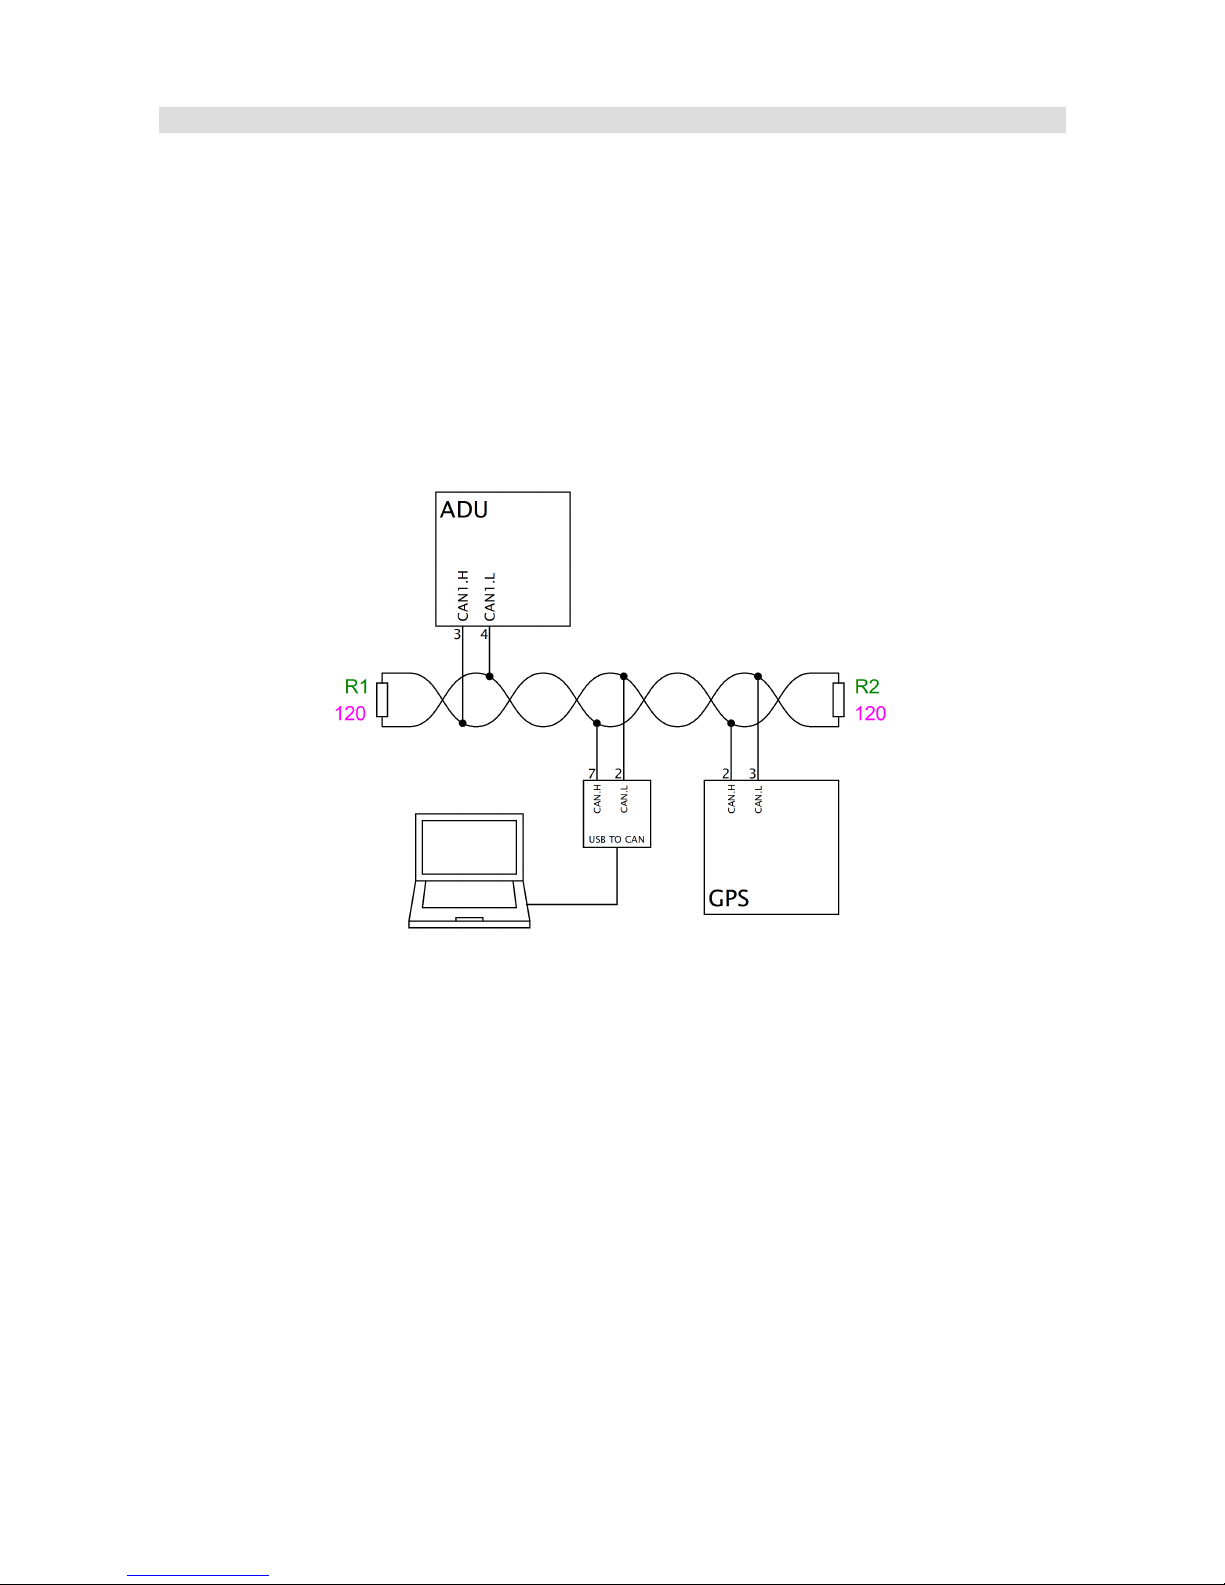
By default, the GPS module speed is set to 1Mbps. Because of this, it is recommended to connect
the GPS module to the CAN1 bus. A sample connection diagram is presented below:
After wiring the GPS module, it is necessary to configure the ADU. In the CAN bus/Serial setup
options, select the CAN bus that the GPS module is connected to (GPS, CANBus).
The GPS module’s channels are listed in the channel list, beginning with gps.
When using the GPS module, care must be taken to properly mount and calibrate the module.
Due to the use of both a gyroscope and accelerometer for increased accuracy, the GPS module
should be mounted using the supplied anti-vibration pads. The orientation of the module does not
matter, but it must be calibrated after installation. The calibration happens automatically during the
first few hundred meters of driving. Changing the location of the calibrated module should be
followed by a short calibration drive.
For more information about measuring lap times with the GPS module, go to the Lap times
section.
Page 20/137
Page 21
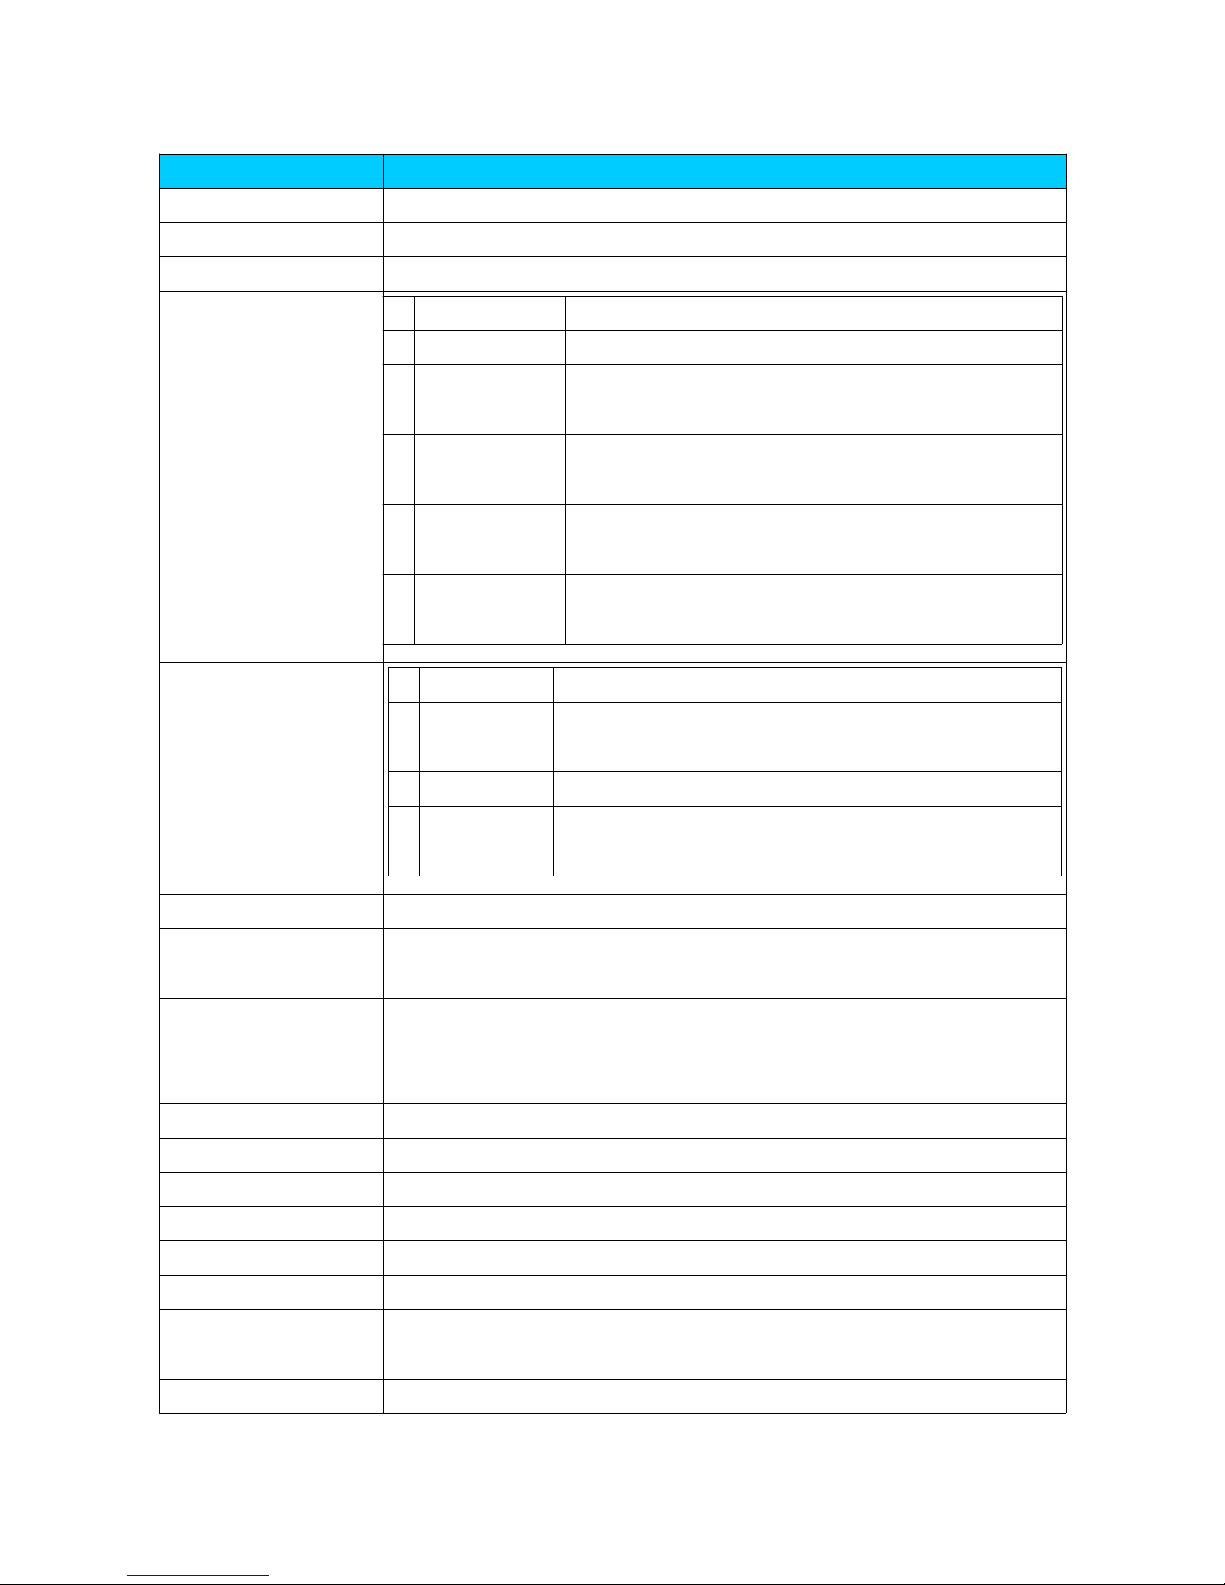
GPS channel list:
Channel Description
gps.latitude Latitude
gps.longitude Longitude
gps.height Height above sea level
gps.status
0 Disconnected no GPS module data (no connection)
1 No fix unable to fix position
2 IMU position is fixed using the built-in accelerometer and
gyroscope
3 GPS 2d position is fixed in 2D space using GPS/Glonass
satellite data
4 GPS 3d position is fixed in 2D space using data from GPS or
Glonass satellites
5 GPS + IMU position is fixed in 3D space and corrected using the
built-in accelerometer (the highest accuracy)
gps.fusionStatus
0 Initialization initialization and calibration of inertial sensors
1 Fusion the device is using inertial sensors to correct the
vehicle’s position
2 Suspend temporary error of the inertial sensors
3 Disabled error of the inertial sensors; they are not taken into
account when determining the vehicle’s position
gps.speed Speed of the vehicle in km/h
gps.headingMotion Direction of the vehicle motion. When the vehicle is skidding, the
headingMotion value will be different from the headingVehicle value.
gps.headingVehicle The direction in which the vehicle is heading. When the vehicle is
skidding, the headingMotion value will be different from the
headingVehicle value.
gps.accX The longitudinal acceleration (longitudinal g)
gps.accY The lateral acceleration (lateral g)
gps.accZ The vertical acceleration (vertical g)
gps.gyroX The angular velocity of the vehicle’s longitudinal axis
gps.gyroY The angular velocity of the vehicle’s lateral axis
gps.gyroZ The angular velocity of the vehicle’s vertical axis
gps.noise The average noise level of the satellite signal. The lower the value the
better
gps.numSatelites The number of satellites used to fix position
Page 21/137
Page 22
Ecumaster PMU
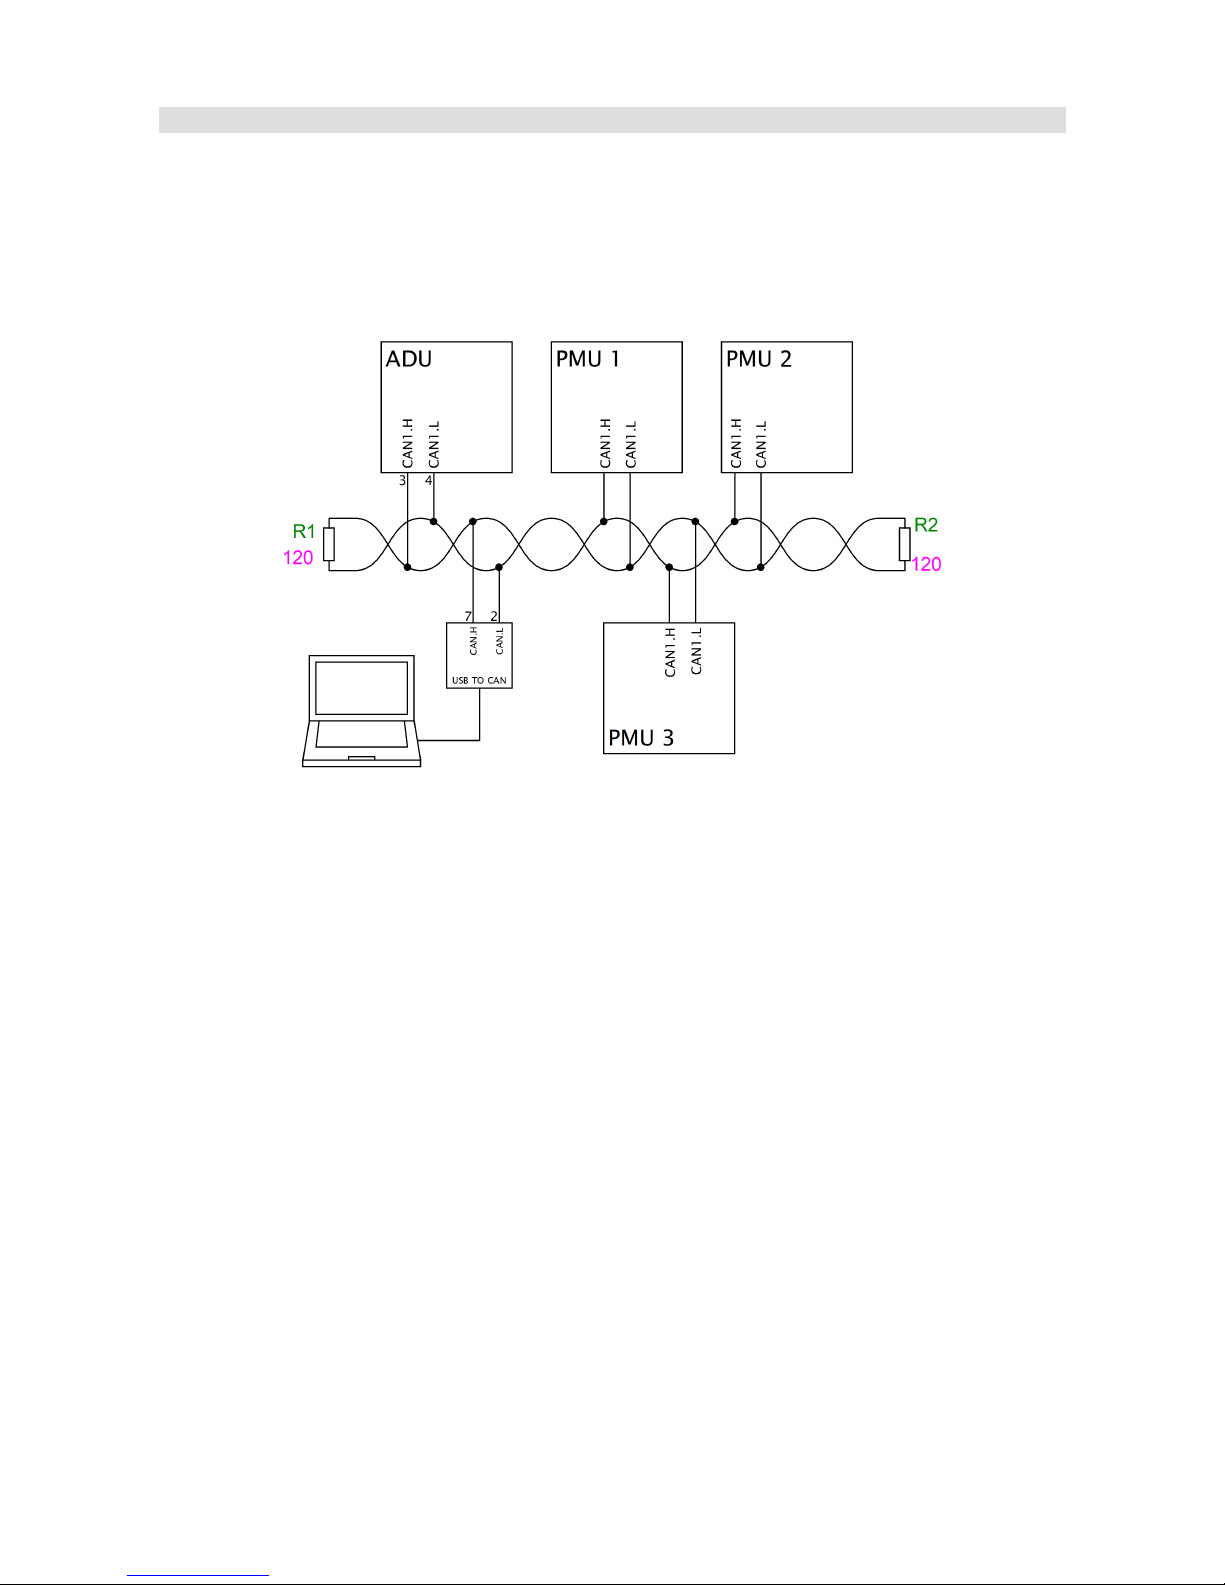
If connecting the ADU to a system that includes a PMU, it is recommended to connect CAN1 of the
PMU with the CAN1 bus of the ADu. This allows for easy communication with a PC and between
the devices.
A sample connection diagram is presented below:
Page 22/137
Page 23
Digital inputs
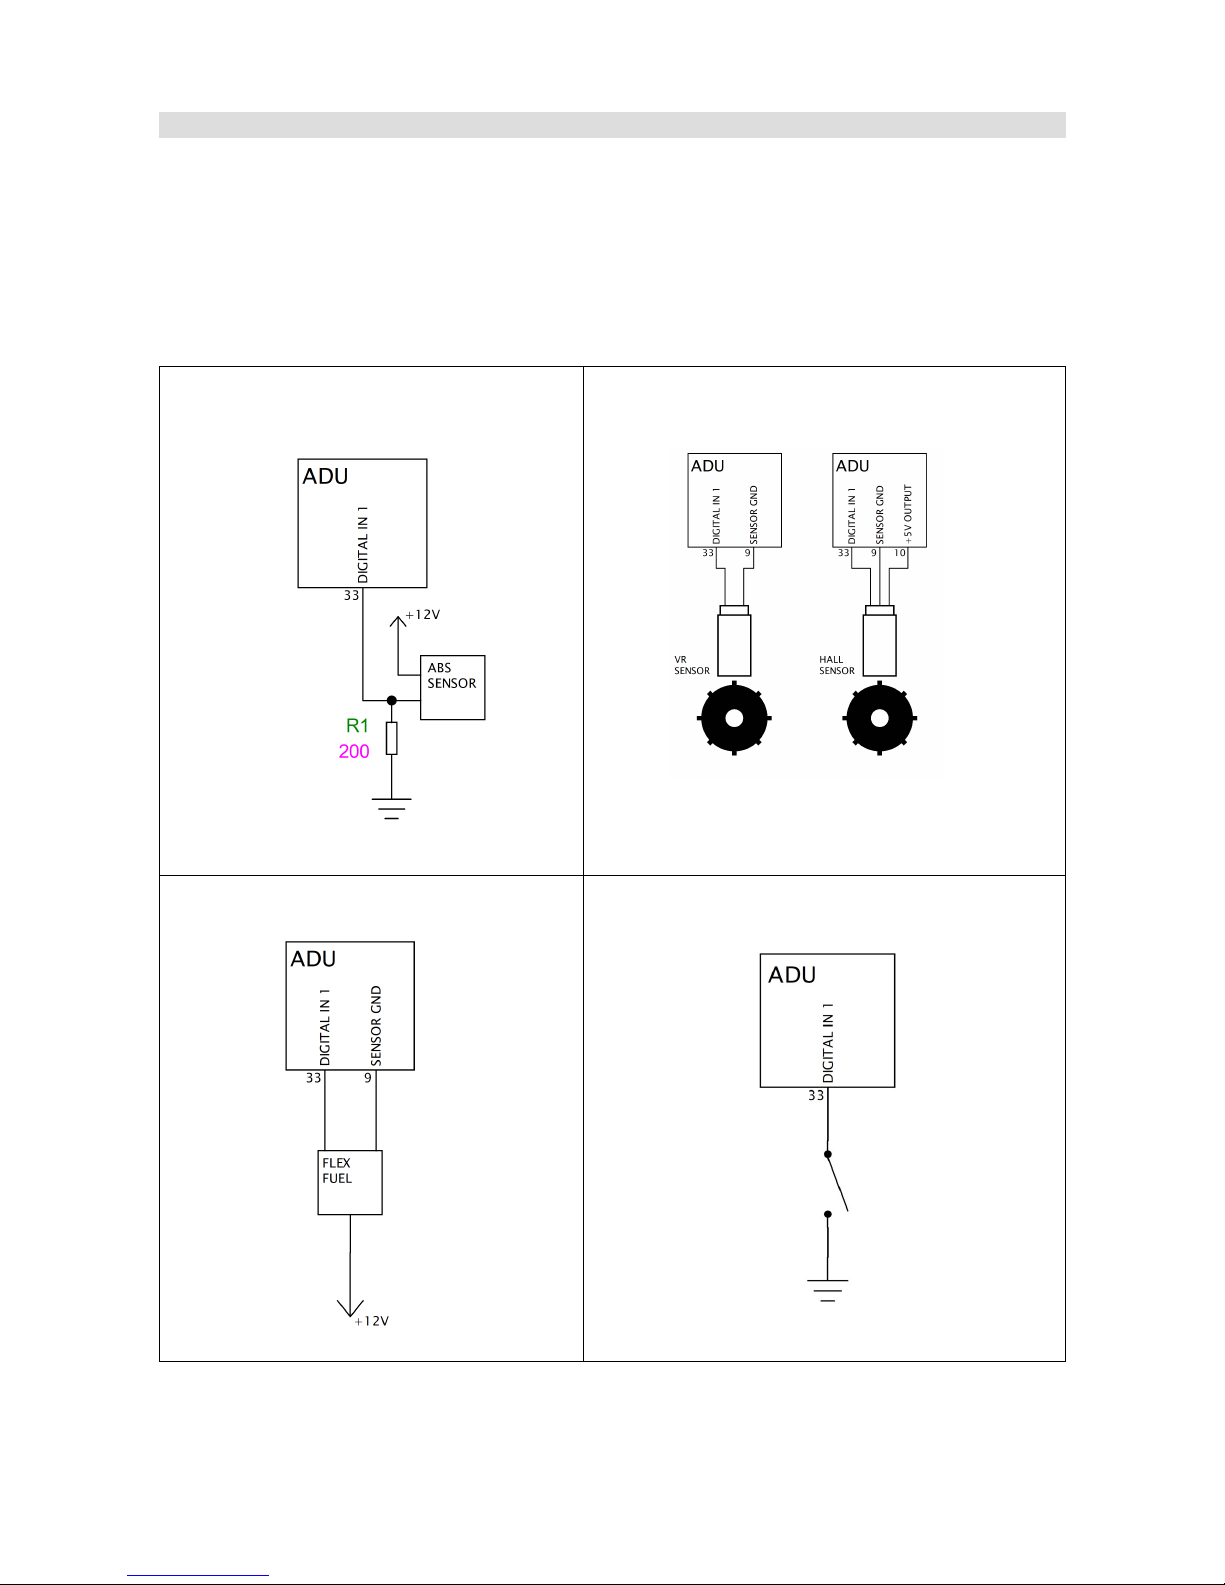
Digital inputs are used to process frequency signals (e.g. engine speed sensors, turbocharger
speed sensors, Flex Fuel sensors) and beacons, as well as switches.
It is possible to read signals from inductive sensors (VR sensors), Hall effect sensors or optical
sensors. The digital inputs have built-in switchable 2k2 pull-up resistors (pull-up to +5V), which
may be used for Hall sensors or switches shorted to ground.
Magnetoresistive ABS sensor connection
example
Connection example for crankshaft position
sensor (Hall and VR sensor).
If an VR sensor is used, it is recommended to
use shielded wires.
Flex Fuel sensor connection example Example of switch connection
Page 23/137
Page 24
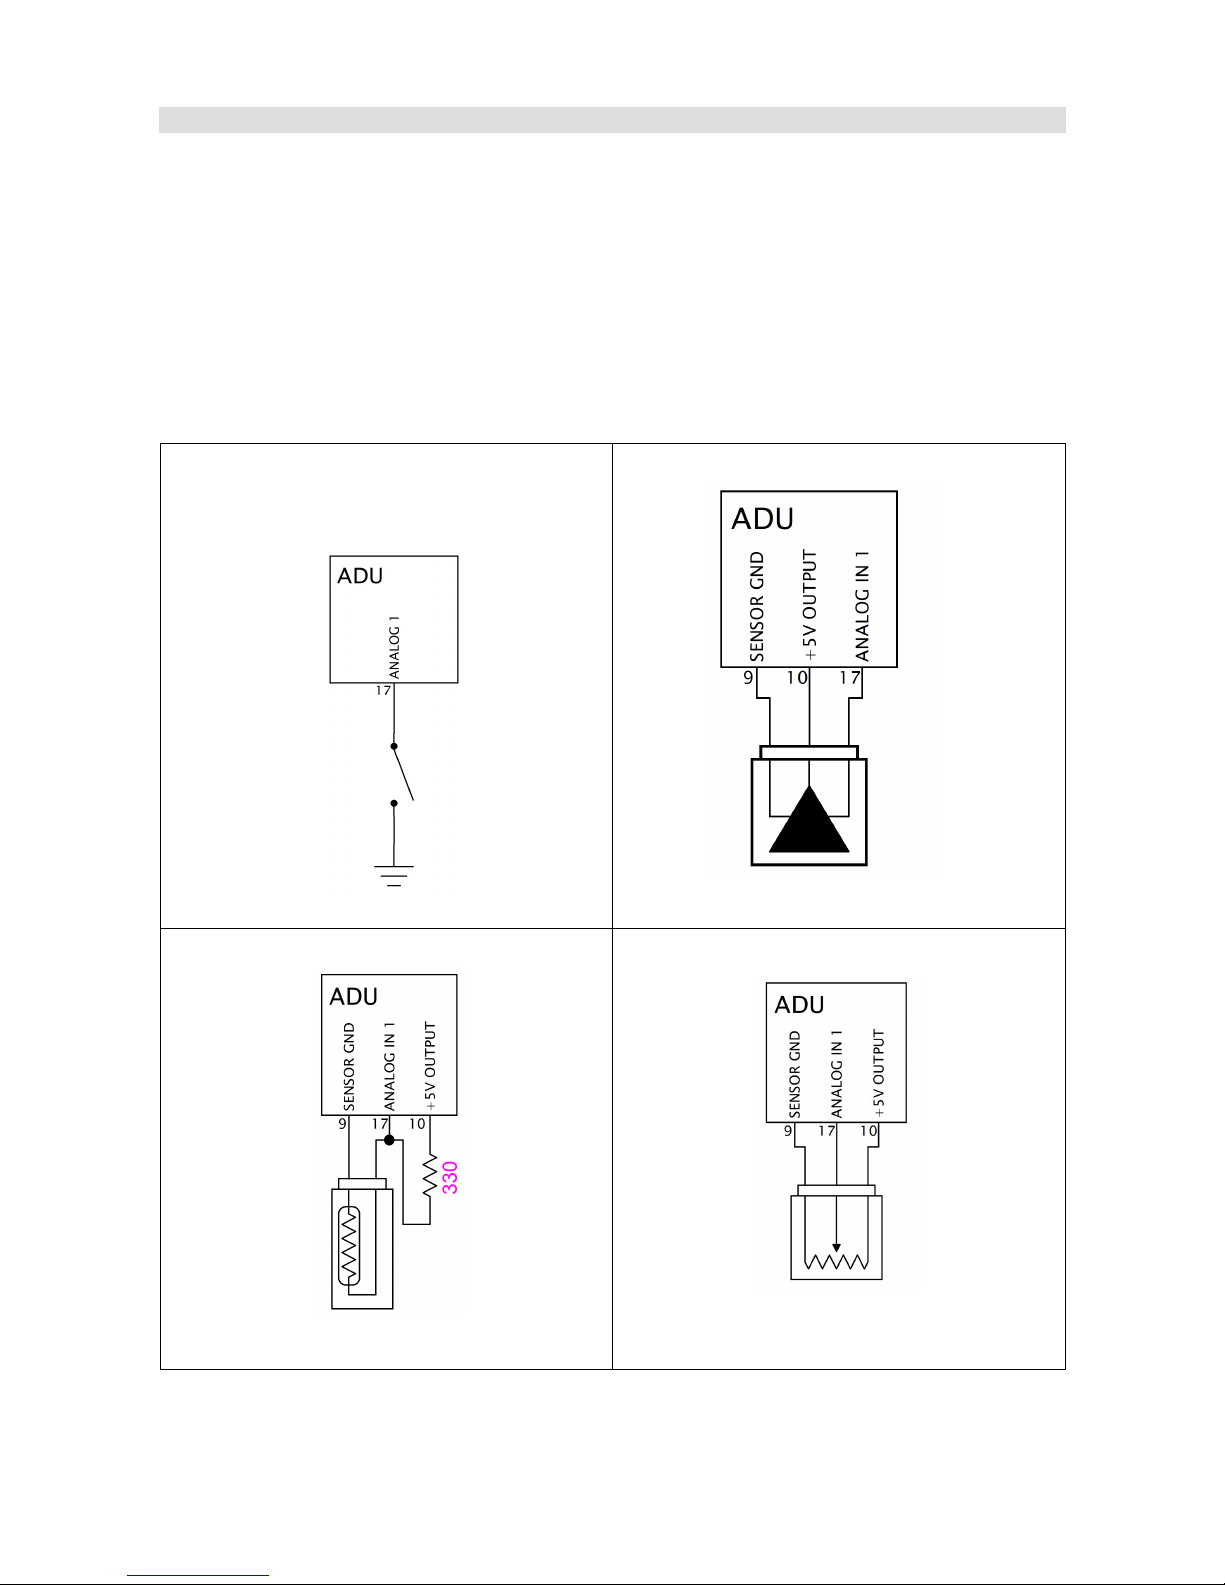
Analogue inputs
Analogue inputs are designed to measure signals from 0-5V (voltages above 5V are read as 5V) at
a frequency of 500Hz.
The primary use for these inputs is to display and log signals from analogue sensors such as
pressure sensors (oil, fuel, water, etc.) or thermistors (e.g. oil temperature sensor, fuel level
sensor.). These inputs can also used to connect switches.
The voltage of all analogue inputs may be transmitted to other devices (e.g. EMU, EMU BLACK)
using the CAN bus.
Switch connection to analogue input
example
Oil pressure sensor connection example
Oil temperature sensor connection example Potentiometer
Page 24/137
Page 25
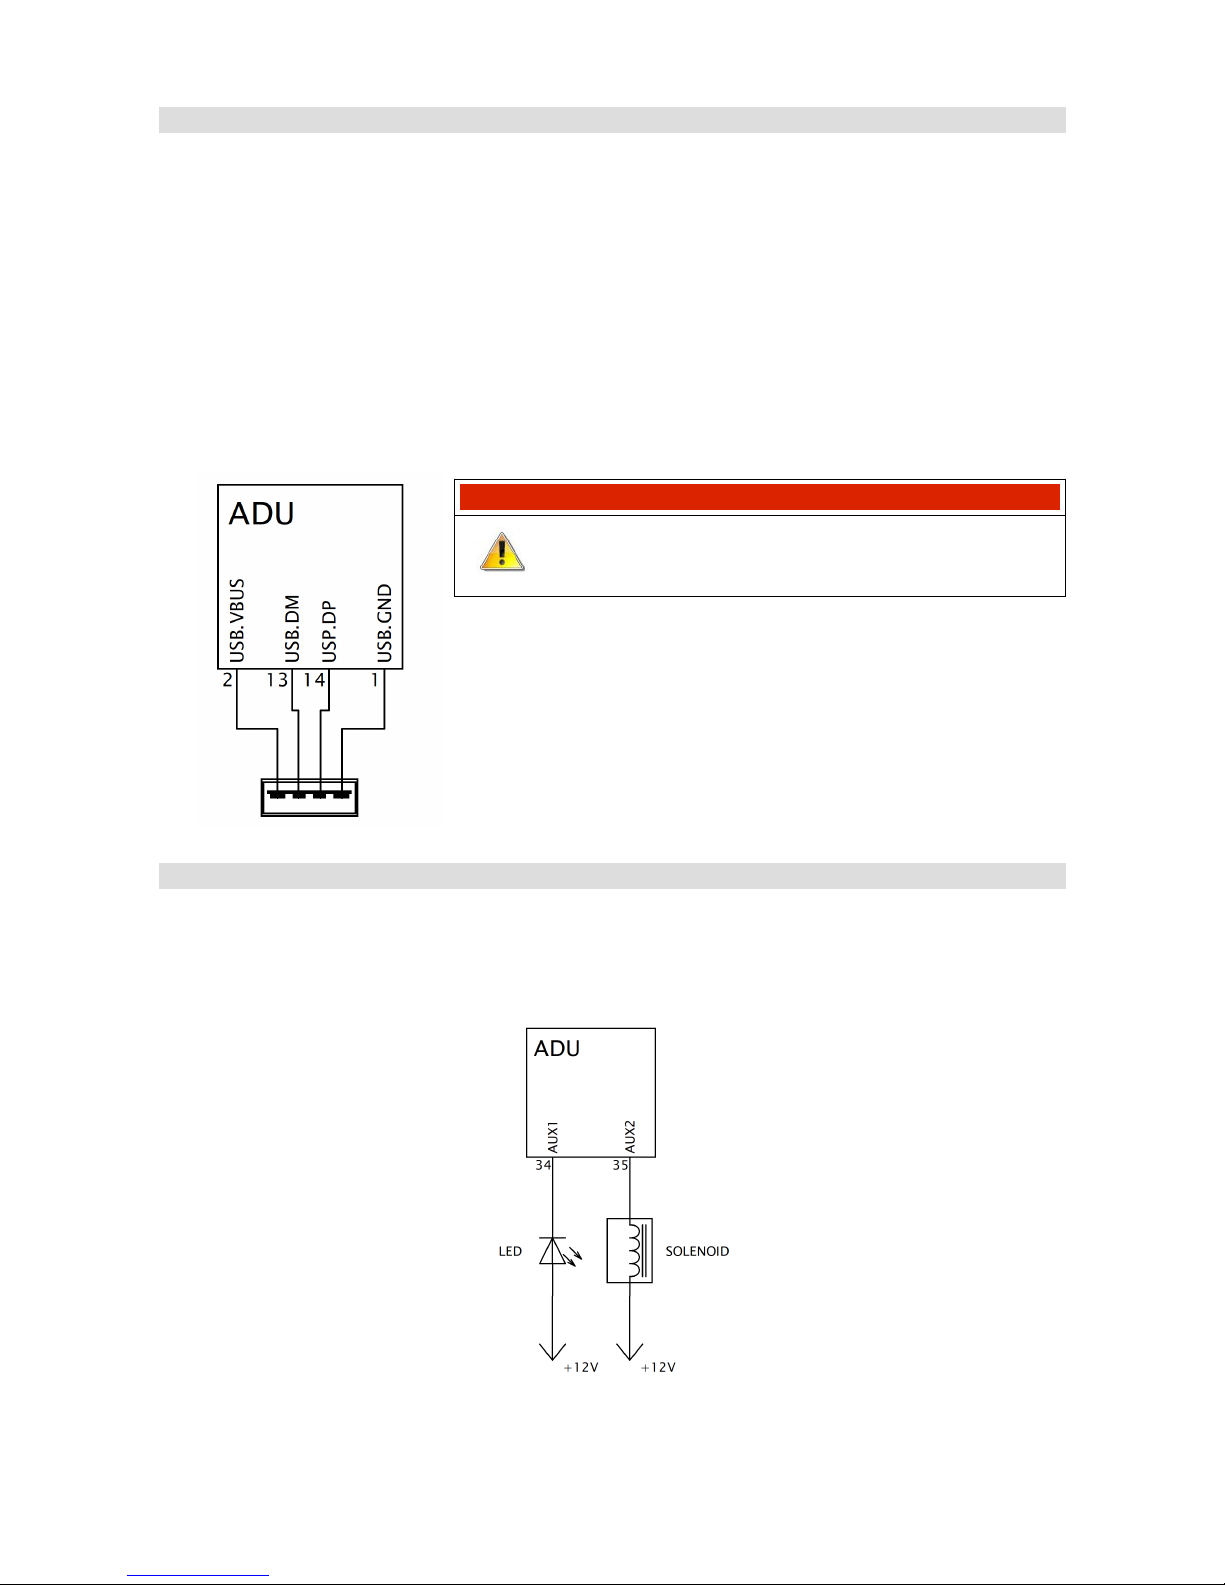
USB Flash drive (pen drive)
The ADU features the ability to log data to a commonly available USB flash drive. The built-in real
time clock (battery powered) is used for recording the date and time to each file. The supported file
system is FAT32. File size depends on the number of channels defined and the frequency with
which they are stored. For more information on data logging see the Logging section.
It is recommended to use name brand flash memory sticks compatible with USB 3.0 (e.g. Sony
USM8W3, USM16W3, USM32W3). Using USB flash drives with poor specifications can lead to
data recording interruptions.
USB Connection Example
IMPORTANT!
Please note: D+ and D- cables should be twisted
pair wires and the cable must be shielded.
Low side outputs
Built-in low side outputs (shorting to ground) may be used to control passive components (e.g.
LEDs, solenoid valves, relays) according to user-defined parameters (e.g. radiator fan activation,
signaling).
Page 25/137
Page 26
Windows software
Configuring the display requires the Windows based software available at www.ecumaster.com.
Hardware requirements to run the software:
– Windows XP, VISTA, 7, 8 and 10 (32 or 64 bit)
– Minimum screen resolution of 1366x768
– Open GL-supporting graphics card
– 2GB RAM
– A USB port
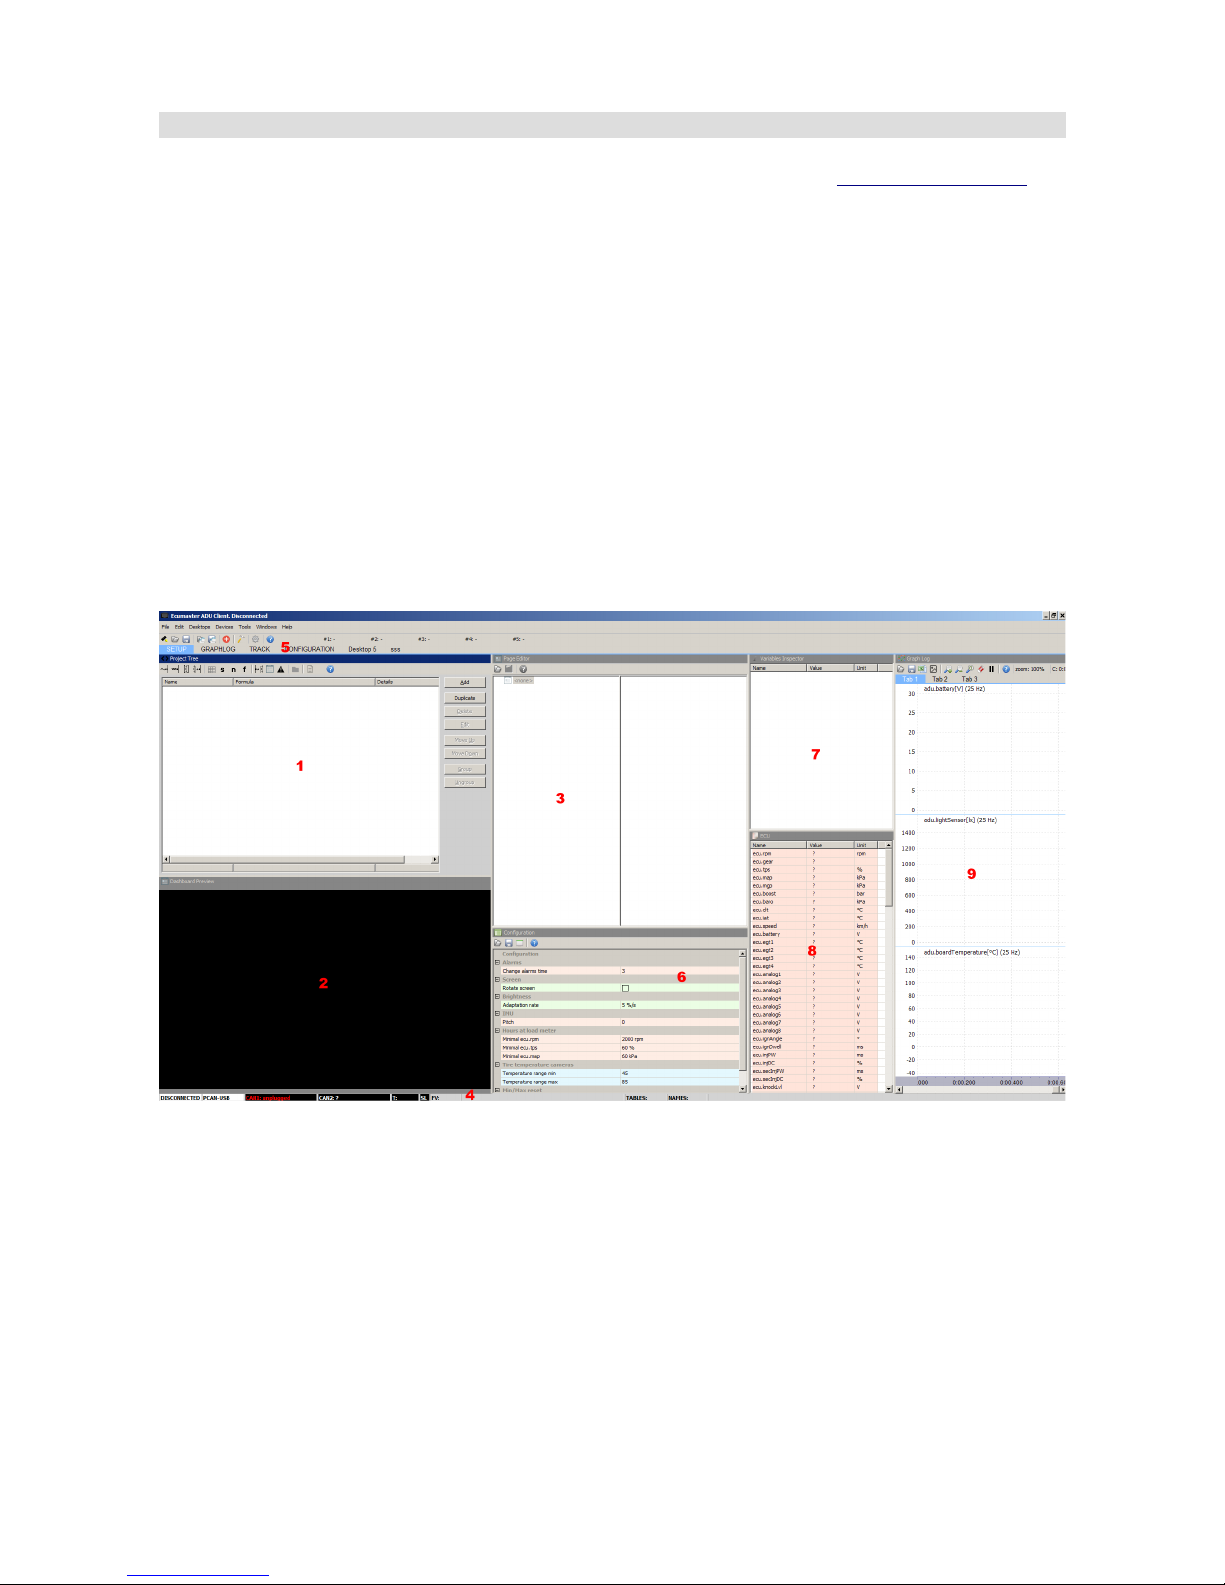
After installing and opening the software, you should see the following screen:
The primary window is the Project tree (1) pane. Use this pane to define all project items. Click
Add to add a new item.
You may choose from:
– Analog input – an analog input, where parameters can be defined, such as the input
channel, the name of the variable, the type (temperature, pressure), pullup etc.
– Digital input – a digital input whose properties can be defined, such as type, sensitivity,
variable name, pullup, etc.
Page 26/137
Page 27

– CAN Bus message object – a CAN message, where individual CAN frames will be
located. A CAN message object contains enough data for several individual messages.
– CAN Bus input – An input message used to receive and format data via CAN
– Table – a user definable table used to interpret data (e.g. transform an analog input voltage
into temperature)
– Switch – a switch input
– Number – enables you to define a mathematical function to convert variable values (e.g.
Converting a raw voltage from an analog input voltage to represent pressure)
– Function – enables you to create complex logic functions
– CAN Bus export - enables you to send CAN frames with variable and fixed values
– Page – a single page displaying data. If more pages are added, they can be switched on
and off or cycled through using conditional functions (warning page when a temperature or
pressure value is exceeded) or user switches (page up/down switches)
– Alarm - a display item showing any alarms, regardless of the current page
– Group – intended for grouping items. This allows for prioritization when working on larger
or complex projects.
– Import .CANX file – this function is used for downloading predefined CAN streams for
devices (e.g. EMU BLACK, MOTEC M1, etc.)
When adding items to a project take care to group them into logical categories. Attention should be
paid to giving proper names to items and variables to facilitate managing a project in the future.
You can also duplicate project items easily by means of the Duplicate button.
Page 27/137
Page 28
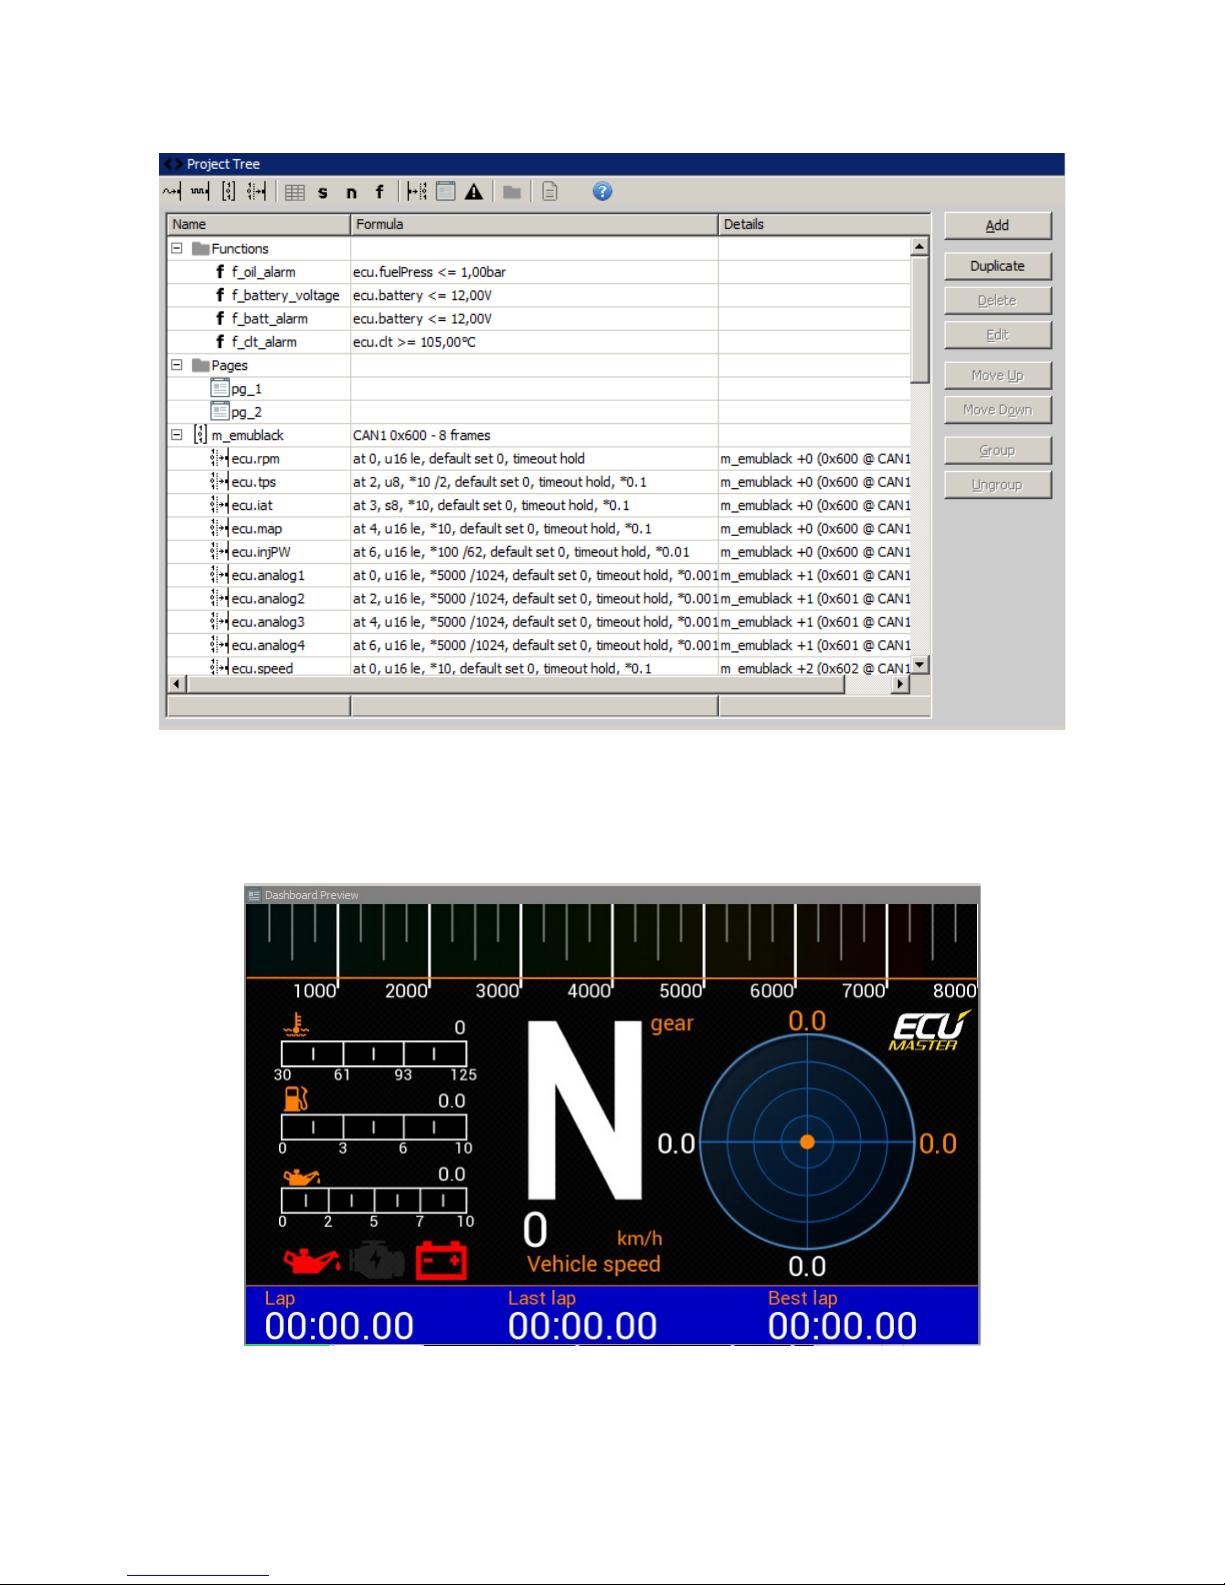
Example project shown below
The page preview screen (2) allows you to preview and edit the currently selected page. If your
PC is connected to the ADU, all changes to a page are sent to the device in real time.
Page 28/137
Page 29
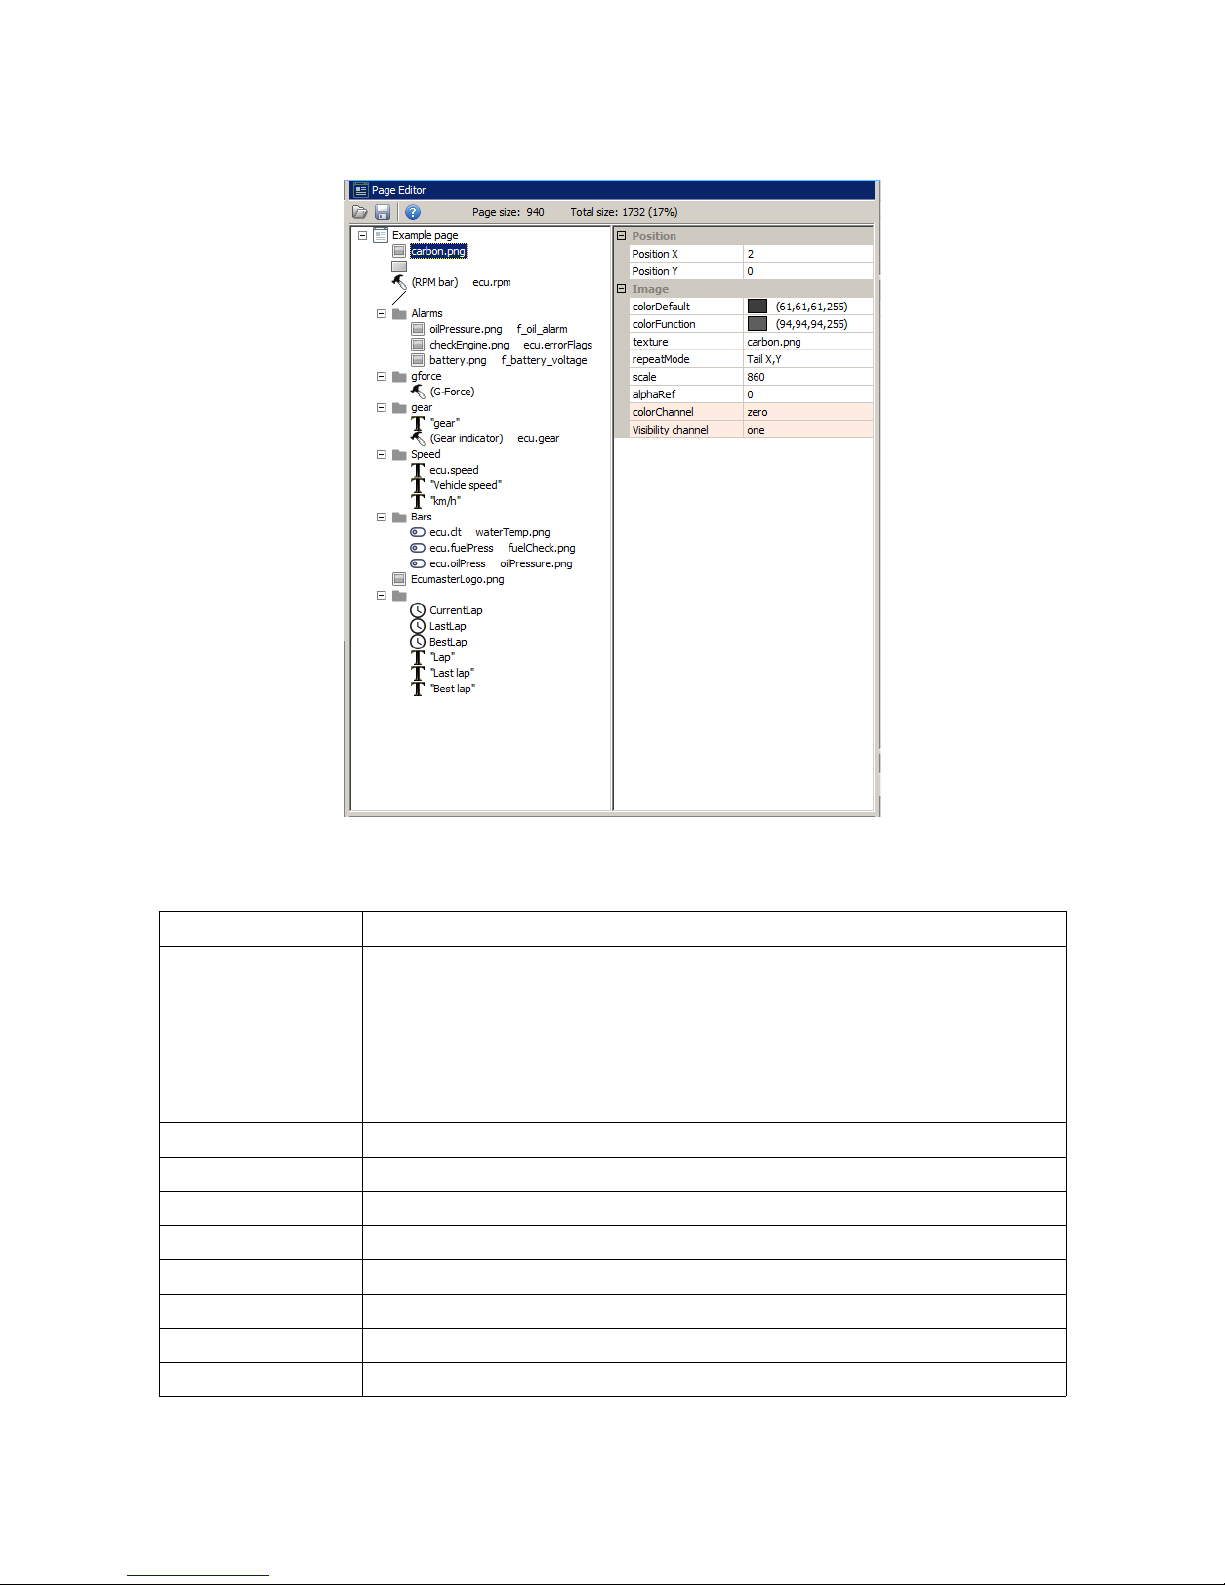
The preview screen works in conjunction with the page editor (3) which allows you to add and edit
the graphic elements on a page. More information about pages is provided in the Pages chapter.
Another important element of the interface is the status bar (4), which contains important
information on the status of a connected device.
Connection status Specifies, whether a device is connected.
CAN interface Shows the CAN to USB interface type. The following interface types are
supported:
- USBtoCAN - an interface by ECUMASTER
- PCAN-USB - a interface by Peak System
- Kvaser - an interface by Kvaser
CAN 1 status The status of the CAN 1 bus from the USB to CAN interface
CAN 2 status The status of the CAN 2 bus read from Can controller of the ADU display
Board temperature Device temperature
FV Version Internal firmware version
Device type Device type - 5” or 7”
Used resources The number of functions used
Tables The memory available for 2D and 3D user maps
Names The memory available for item names (can inputs, functions, etc.)
Page 29/137
Page 30
If the Can bus (1 or 2) status differs from OK, it means there are errors along the bus. The most
frequent problems include:
1) A device on the CAN bus is the wrong speed
2) The device is not connected to the CAN bus
3) CANL and CANH are connected incorrectly
4) Incorrect or missing network termination
5) Bus damage (short circuit between CANL and CANH, or a short circuit along a GND or
power cable)
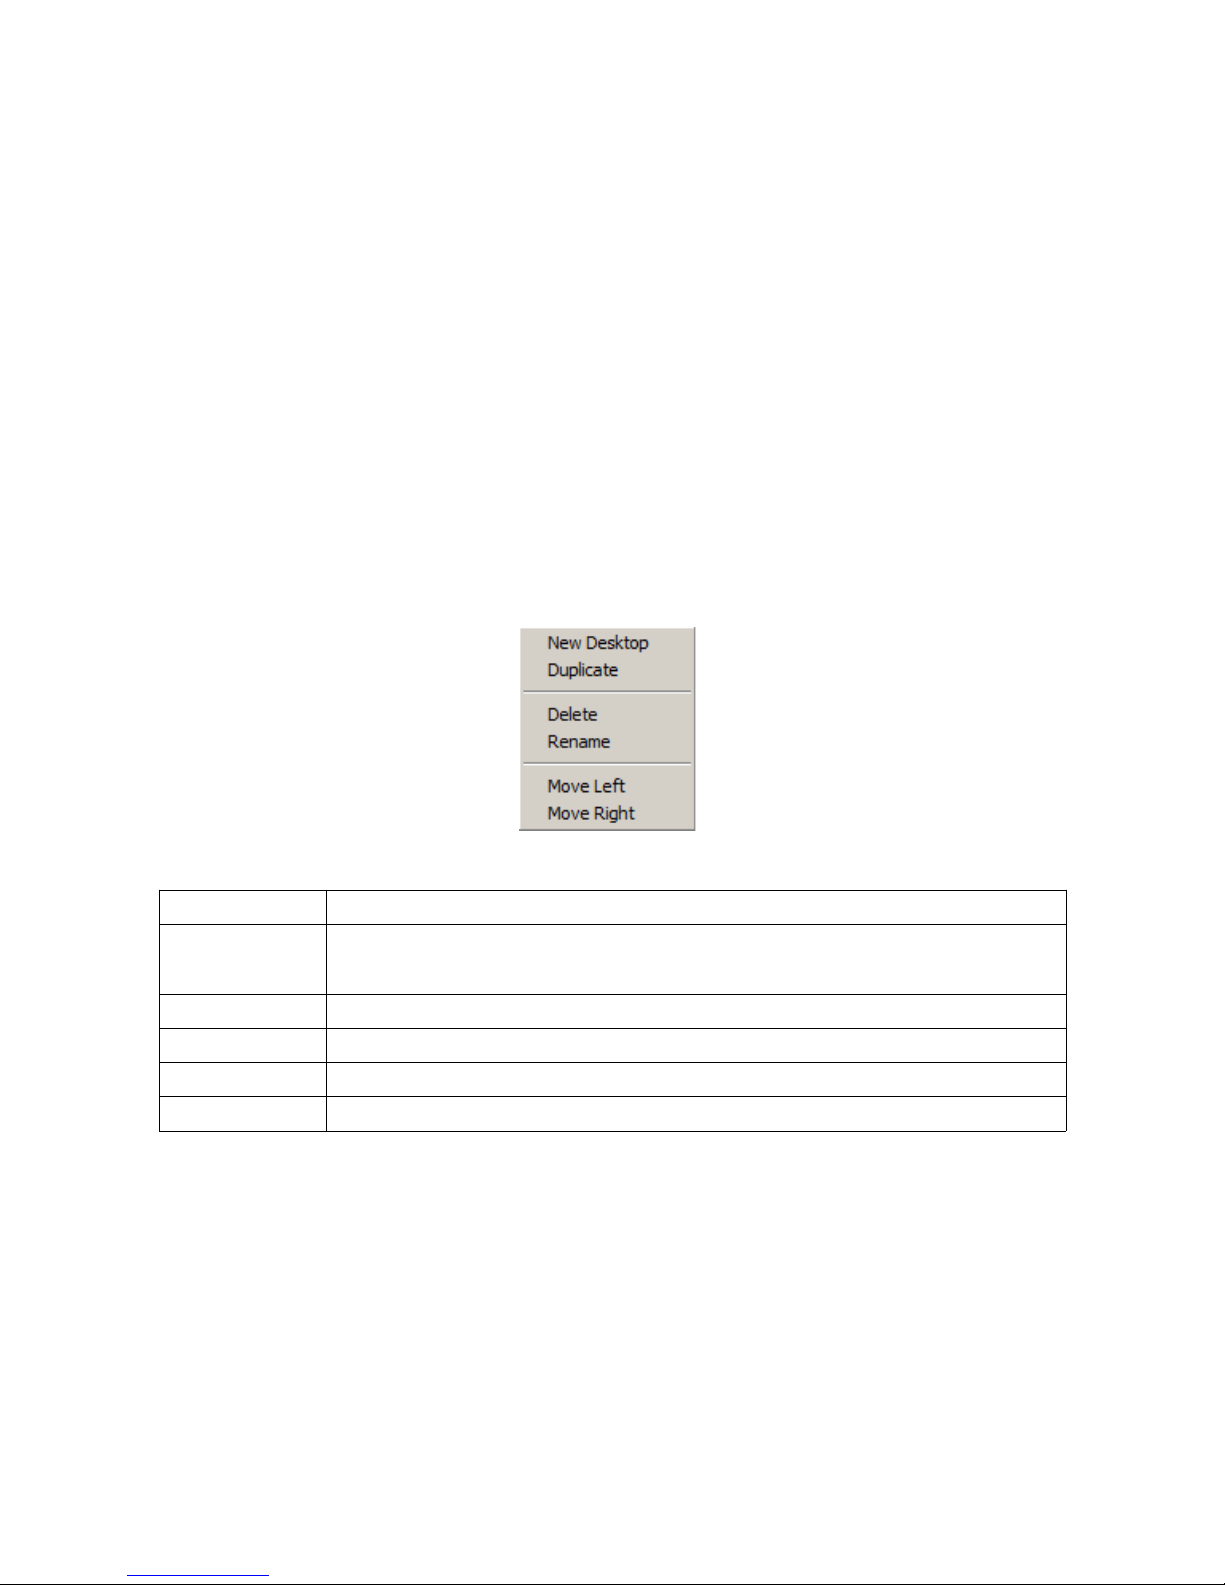
Desktops are an important component of the interface. They enable you to create your own sets of
panes, which speeds up the configuration process. Right click and the following menu will on a
tab:
New desktop Create new desktop. The new desktop will appear on the far right.
Duplicate Duplicate a desktop. This option creates a new desktop copying the contents of
the original desktop.
Delete Delete a desktop.
Rename This function enables you to change the name of a desktop.
Move Left Moves a desktop to the left.
Move Right Moves a desktop to the right.
To save the current desktops to your computer, press F2 (Make permanent). Desktops are also
saved when the ADU application is closed. Desktops may also be saved as a file and used on
another computer. To do this, click the Desktops/Save desktops template option. To return to
the default settings select Desktops/Open desktop template and load programDefault.adulayout
file.
Page 30/137
Page 31
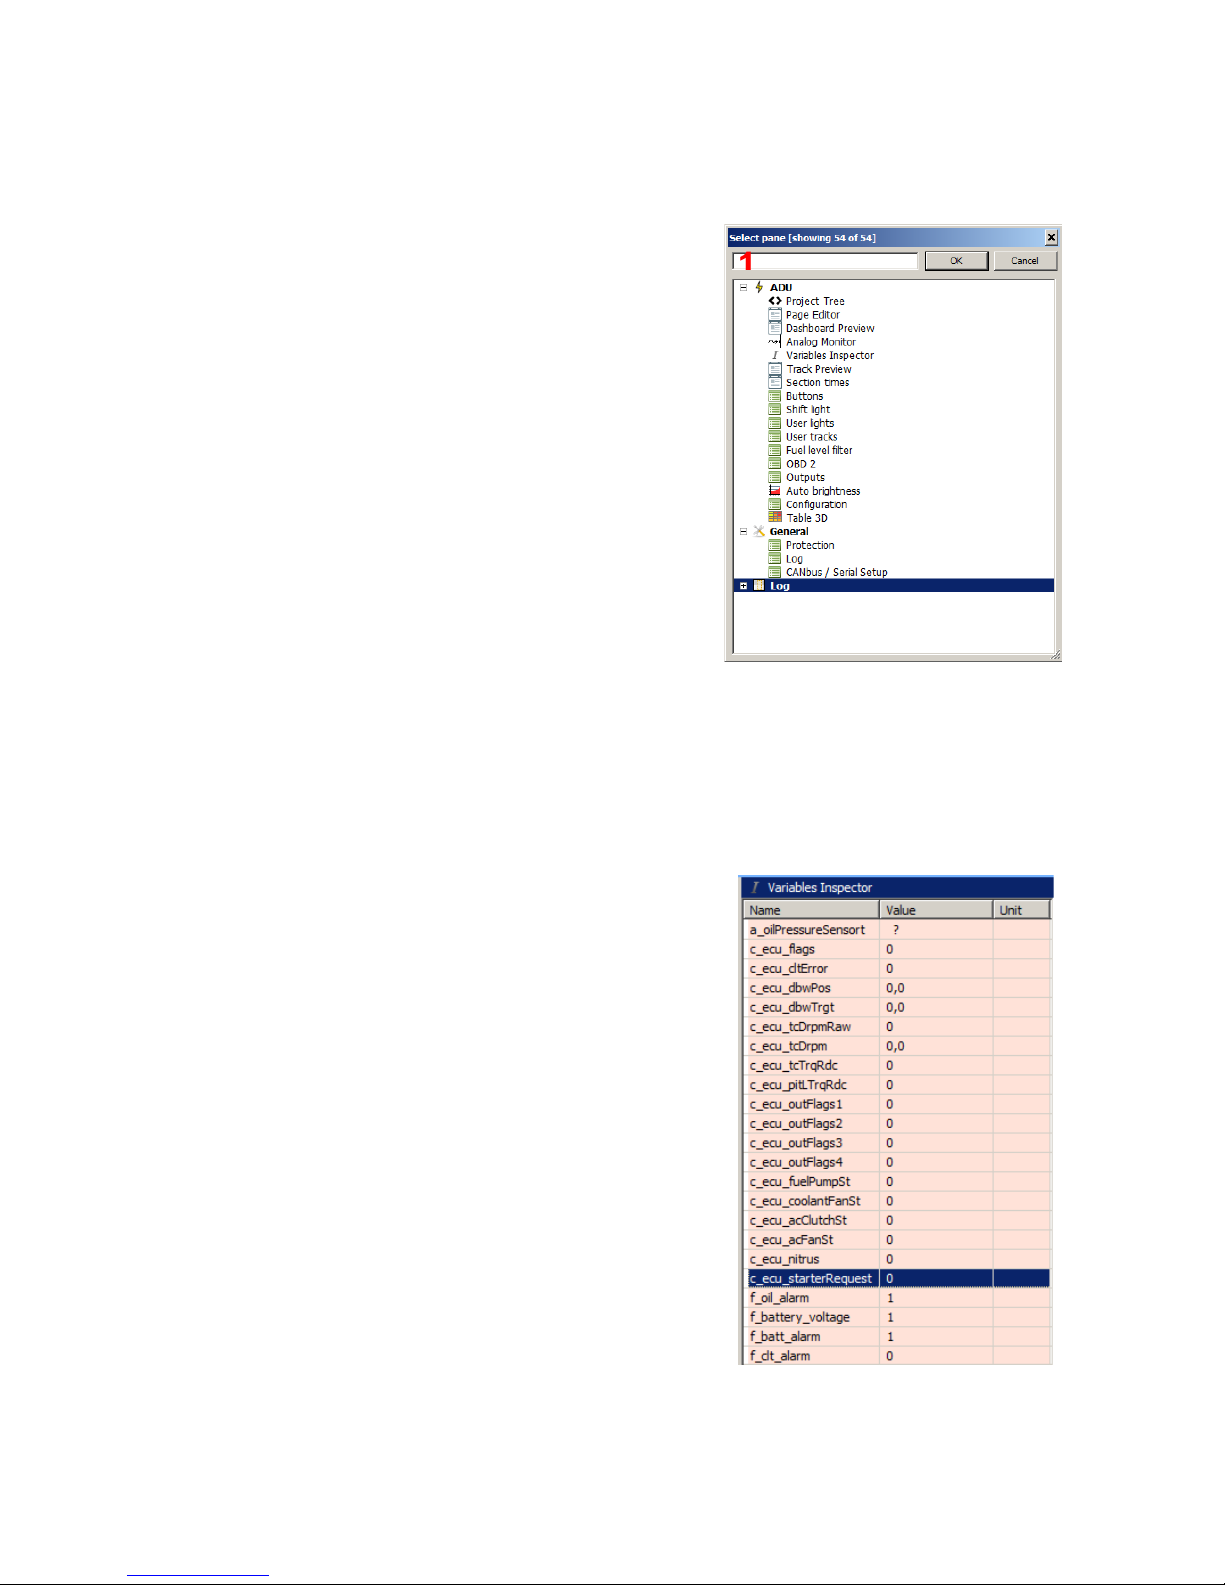
Panes are an important element of the interface, containing all of the data and parameters you will
be working with. All device configuration will be done in panes. Press F9 (or click the + icon on
the toolbar) to add a new pane with parameters. A dialog box with all available panes will appear.
At this point you may manually locate the pane you want to
add, or you can start typing in the search prompt at the top
of the dialog box(1). The results will be filtered as you type,
showing only the panes that contain your search term as a
parameter. Double-clicking on a pane, or clicking it once
and hitting 'Okay' will cause it to appear on the desktop.
New panes always appear on the right-hand side. Panes
may be moved by left-clicking on the title bar and dragging
the pane to a new location. To remove a pane from the
desktop, right click on its title bar and select 'Close Pane'
from the drop-down menu.
There are different pane types. Configuration panes contain settings. Another pane types are used
for viewing data in real time, such as the Variables inspector (7), the log channels preview (8) or
the graphic log (9).
The Variable Inspector pane is used for previewing values of the variables defined in a device.
These variables include functions, numbers, Can (CAN) inputs, etc.
When a value displays the ? Symbol instead of a numeric
value, that means the log function for this channel is
deactivated. To activate logging or change the log frequency
of a given channel, right click on a given variable and select
'Set log frequency' then choose the desired frequency from
the drop down menu. There are several panes available that
group common channels together, such as: Analog inputs
(displays the analog input values), Digital inputs (displays
digital input values), CAN BUS message objects, CAN
BUS inputs, Tables (values from the tables), Numbers
(mathematical function values) or Functions (logical function
values).
Page 31/137
Page 32
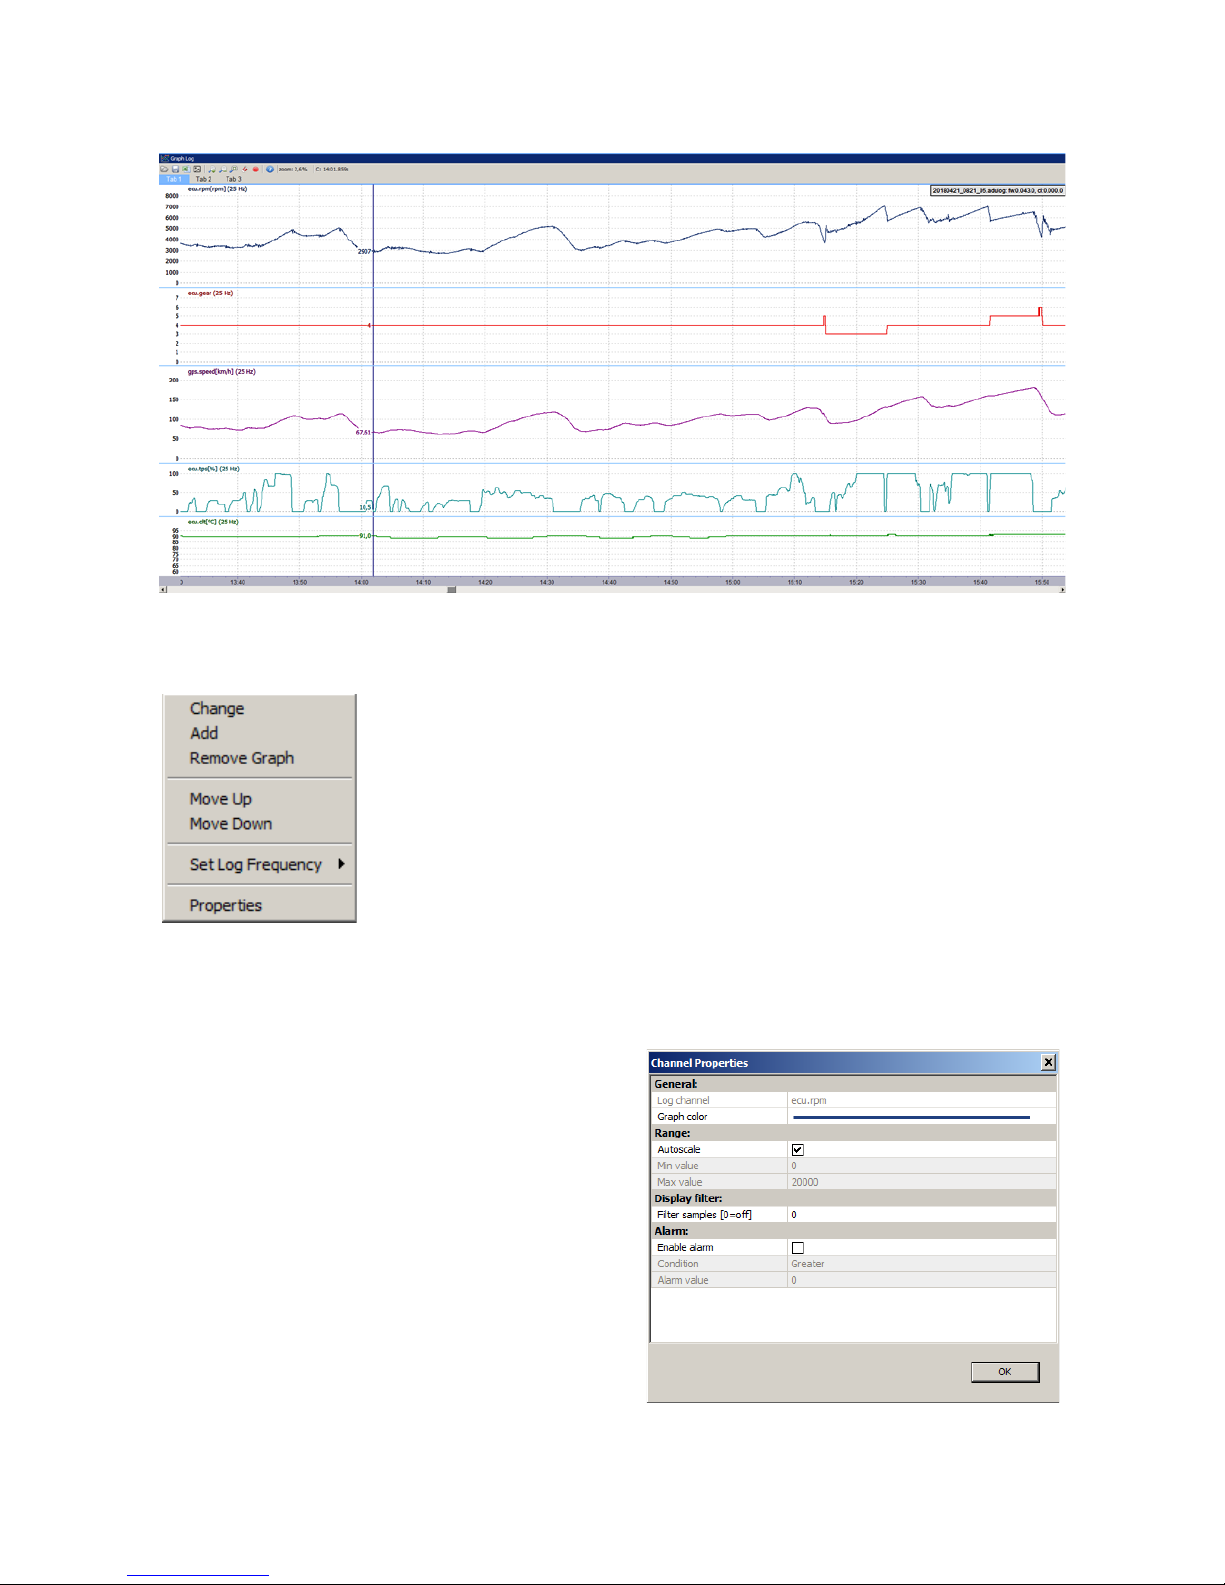
Another pane type is the Graph log. The Graph log displays values over time.
The following menu appears after right clicking on the log area:
Here you can add a new log channel (Add), remove an existing log channel
(Remove Graph), change a log channel (Change), or relocate a channel
(Move Up, Move Down). You may also change the log frequency (Set log
frequency) and change the display settings for a given channel
(Properties).
Just like the main desktop of the application, the log pane has tabs that are used for displaying
different log channel groups (e.g. engine, track, etc.). These tabs work exactly the same way as
the main desktop tabs.
To alter settings for a logged channel, right click on
the channel name and click 'Properties'. In this
meny you may choose the colour (Graph Colour)
and the range of values for the channel (Min. and
max. value). The Autoscale option performs an
automatic calculation of the display range based on
logged data. In this menu you may also enable the
Filter samples option, which defines the number of
data samples that will be averaged to generate the
displayed value. The 0 value means no filtering.
Page 32/137
Page 33
On the Graph Log toolbar there are icons that allow you to save or open a log file from your
computer, save the displayed channels as a cvs file, save the currently displayed log as a png file,
change the scale, and stop/resume a log. Keyboard shortcuts allow you to navigate the Graph
Log pane without a mouse. The shortcut keys are as follows:
Right / left arrow Move a log right or left. To move a log faster, hold the Shift key while
pressing an arrow key
Up arrow or q Zoom in
Down arrow or a Zoom out
Z Zoom all (scales entire log to fit in current window)
Mouse scroll Scroll up- zoom in, scroll down, zoom out
Left mouse button Click and drag to select an area
Middle mouse button Move the log area
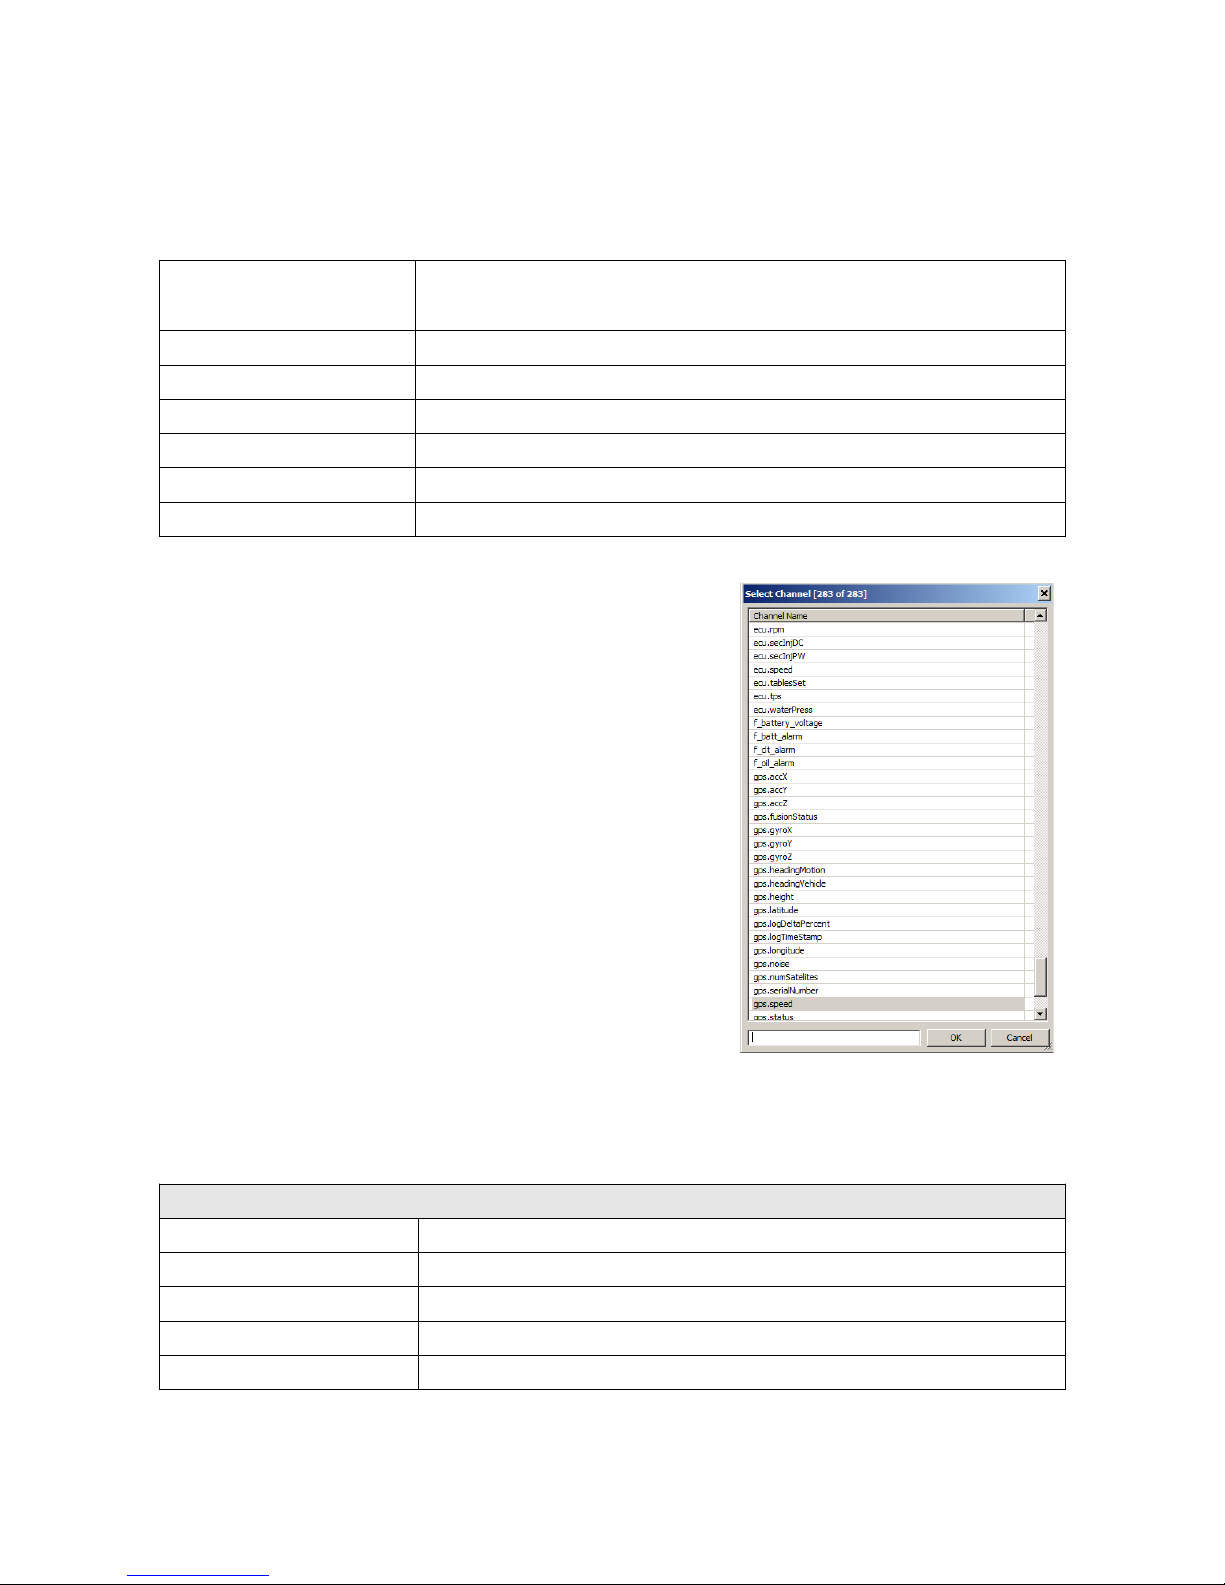
When changing or adding a channel, a channel selection
pane appears on the graph. In order to search, enter the
channel name in the search box to filter the available
channels. e.g. entering the word ‘gps’ will cause only the
channels containing the word ‘gps’ to be displayed.
Some functions are available in the application’s menu. The following is a description of all
available Menu functions
File
Open project... Open a previously saved project (CTRL + O)
Save project Save to a recently opened / saved file (CTRL + S)
Save project as... Save a project to a new file (CTRL + SHIFT + S)
Import log... Import a log from a pendrive (SHIFT + F4)
Show full screen Activate full screen mode to increase the available screen space for
Page 33/137
Page 34
the application (CTRL + F)
Upgrade firmware... Update the internal software of the device
Restore to defaults Restore a device to the default settings Deletes all settings
Make permanent Saves changes to the Flash memory of a device Additionally, a file
containing the current settings is saved to the
MyDocuments/ADU/DeviceName/QuickSave catalogue (F2)
Exit Exit the application. The desktop arrangement is saved upon exiting
(ALT + X)
Edit
Undo Undo the most recent operation (CTRL+Z)
Redo Redo a previously undone operation (CTRL+Y)
Show undo list Displays a pane with all operations performed
Toggle debug log Displays the console logging the program operations (SHIFT + F9)
Desktops
Restore desktops Reads desktops layout from
MyDocuments/ADU/Default/desktops.adulayout file
Store desktops Saves desktops layout to
MyDocuments/ADU/Default/desktops.adulayout file
Open desktop
templates...
Reads desktop configurations to a selected file. This allows to
transfer configurations between computers
Save desktop
templates...
Saves desktop configurations to a selected file. This allows to
transfer configurations between computers
Add new pane Adds a new pane to the desktop (F9)
Switch to desktop This option allows to switch between desktops
Previous desktop Switch back to the previous desktop (CTRL+PGUP)
Next desktop Switch to the next desktop (CTRL+PGDWN)
Devices
Device selector If one or more ADU devices are connected, a pane enabling
switching between the devices will pop up. After switching to a
device, the data between the PC and the device will be automatically
synchronized. The names of particular devices are shown on the
right hand side of the application toolbar. The currently connected
device is shown in bold type
Set device #n Automatic switching to the connected device no. #n. After switching
to a device, the data between the PC and the device will be
automatically synchronized. The names of particular devices are
shown on the right hand side of the application’s toolbar. The
Page 34/137
Page 35
currently connected device is shown in bold type. (CTRL+SHIFT+1
do 5)
Set device name This function allows to give a name to a connected ADU device.
Reboot device Reboots a connected device (CTRL + SHIFT +R)
Reconnect Reconnects a device (CTRL + SHIFT + B)
Receive log file Read logs from USB memory connected to the PC (SHIFT+F4)
Set real time clock Setting the real-time clock of ADU according to the current PC time
This time is used to date the files of a log saved into an external USB
memory. It can also be displayed on the screen of a device
Generate pinout This option generates an html file with a device port documentation (it
shows the terminals in use and the functions assigned to them). It
also generates CAN message objects for CAN and CAN2
Send data to ADU Sends data to ADU and restarts all functions
Tools
Texture manager
dialogue
Displays a dialogue for managing the dashboard textures (graphics).
You will find more information regarding texture management further
in the manual
Customize keys Changing the shortcut keys
Reset track data Resets all times for a given track. It is possible to reset track data
using an internal button connected to an ADU device
Logged channels Display a dialogue with a list of all log channels and their frequency.
Current size of the log data is visible at the bottom of the pane
(number of channels and bites) (F8)
Project tree Displays the project pane (SHIFT+F7)
Analogue monitor Displays the analogue channel monitoring pane.
(SHIFT + F10)
Variables inspector Displays the variables monitoring pane (SHIFT + F11)
Options Displays a dialogue with the application options
2D tables colour – colour map 2D
3D tables colour scheme – colour scheme for 3D maps
Auto save logs – automatic saving of logs onto the disc
Use mouse wheel to zoom on Graph log – activates the log scaling
function by means of the mouse wheel
Page 35/137
Page 36
Pages
Pages represent what will be displayed on the ADU screen. The ADU software allows you to
create multiple pages (the number allowed depends on their complexity and memory usage).
You can switch between pages by means of an external button or a function (e.g. a different page
is displayed when the car is stationary than when it is moving).
There are 3 types of pages:
– Page – a standard page
– Overlay – a page which can be overlaid on another page.
– Overlay with background – a page similar to the Overlay page, but with a non-
transparent background
Additionally, an alert or warning can be displayed regardless of the current page (more information
in the Alerts chapter).
Creating a page
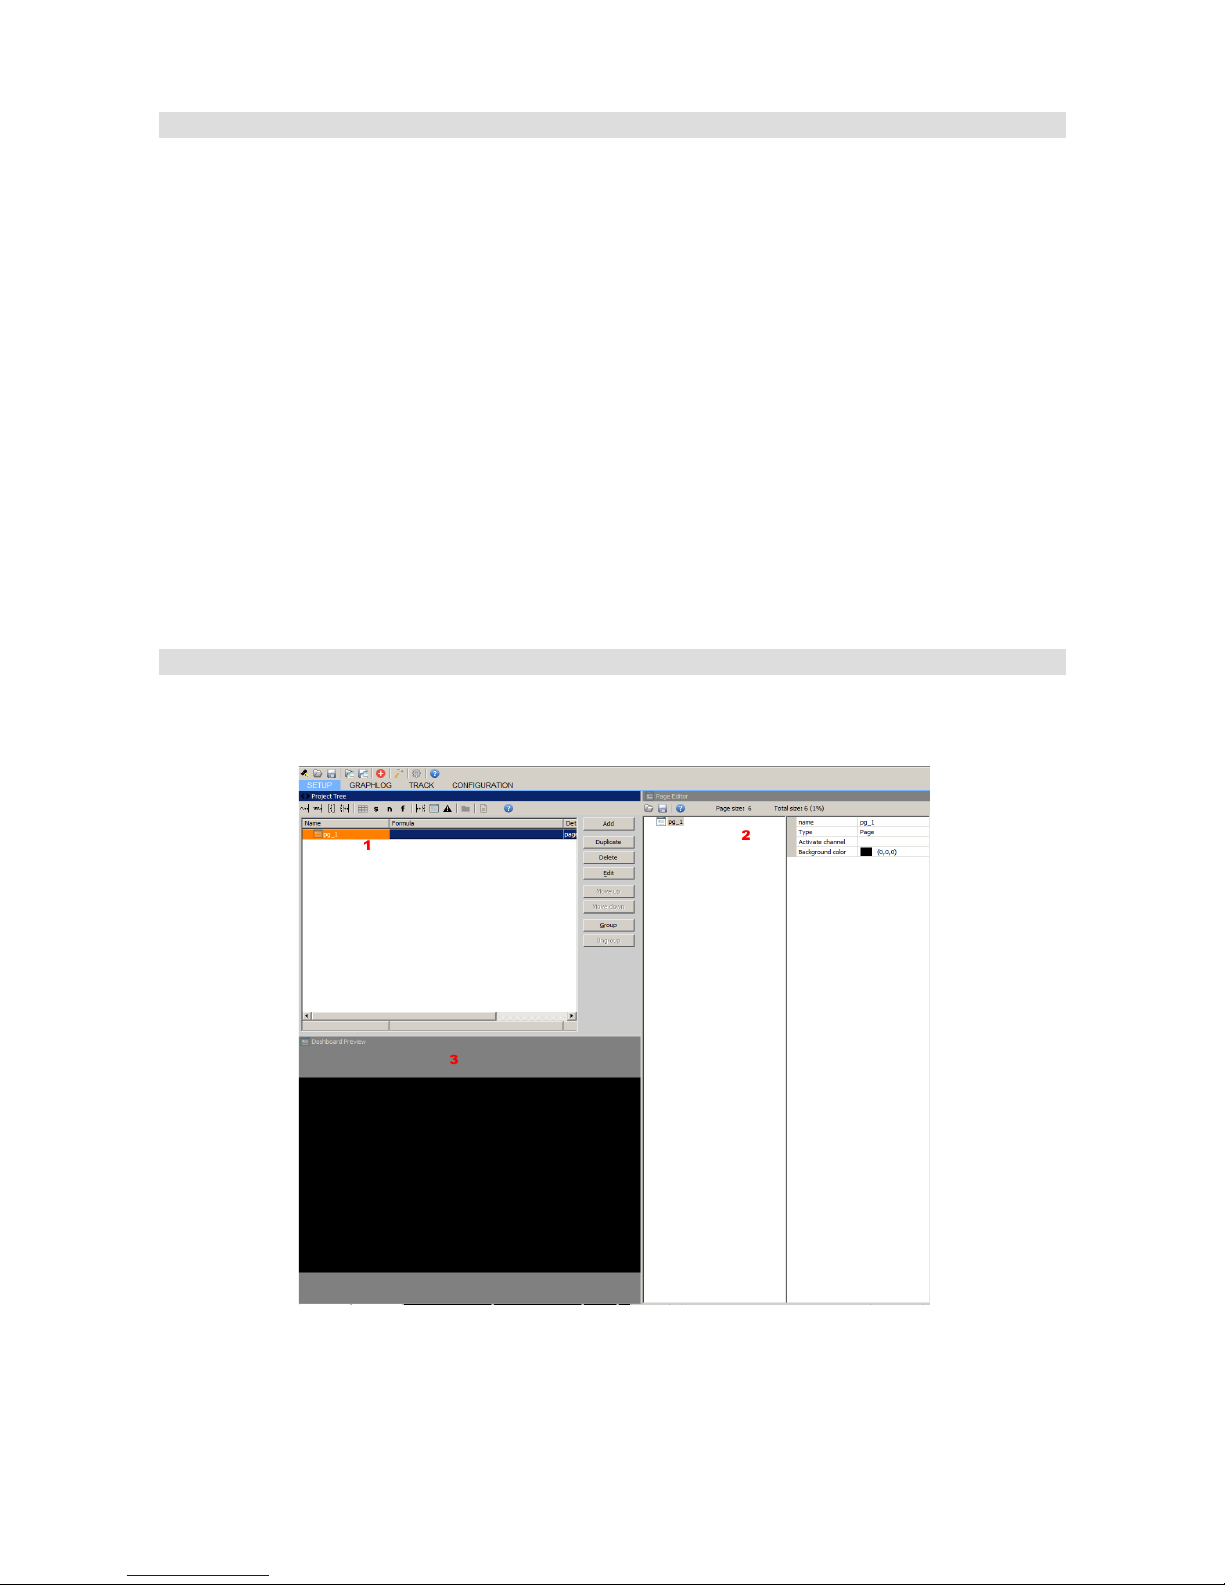
To create a page click Add in Project tree and select Page. A pg_1 (1) page should appear in the
project.
The currently selected page with its elements and configuration will appear in Page editor (2). At
this point we don’t have any elements defined for the page shown, but we can set the following
page attributes:
Page 36/137
Page 37
Attribute Description
Name Page name in the Project view
Type Page type:
- Page - a standard page
- Overlay – a page than can be overlaid on another page
- Overlay with background – a page similar to the Overlay page, but with
a non-transparent background
Activation channel Name of the channel or function that can automatically activate the page
Background style
Solid color – the background is a solid color defined by the Background
Color field,
Theme – the background is a predefined graphic stored in the device
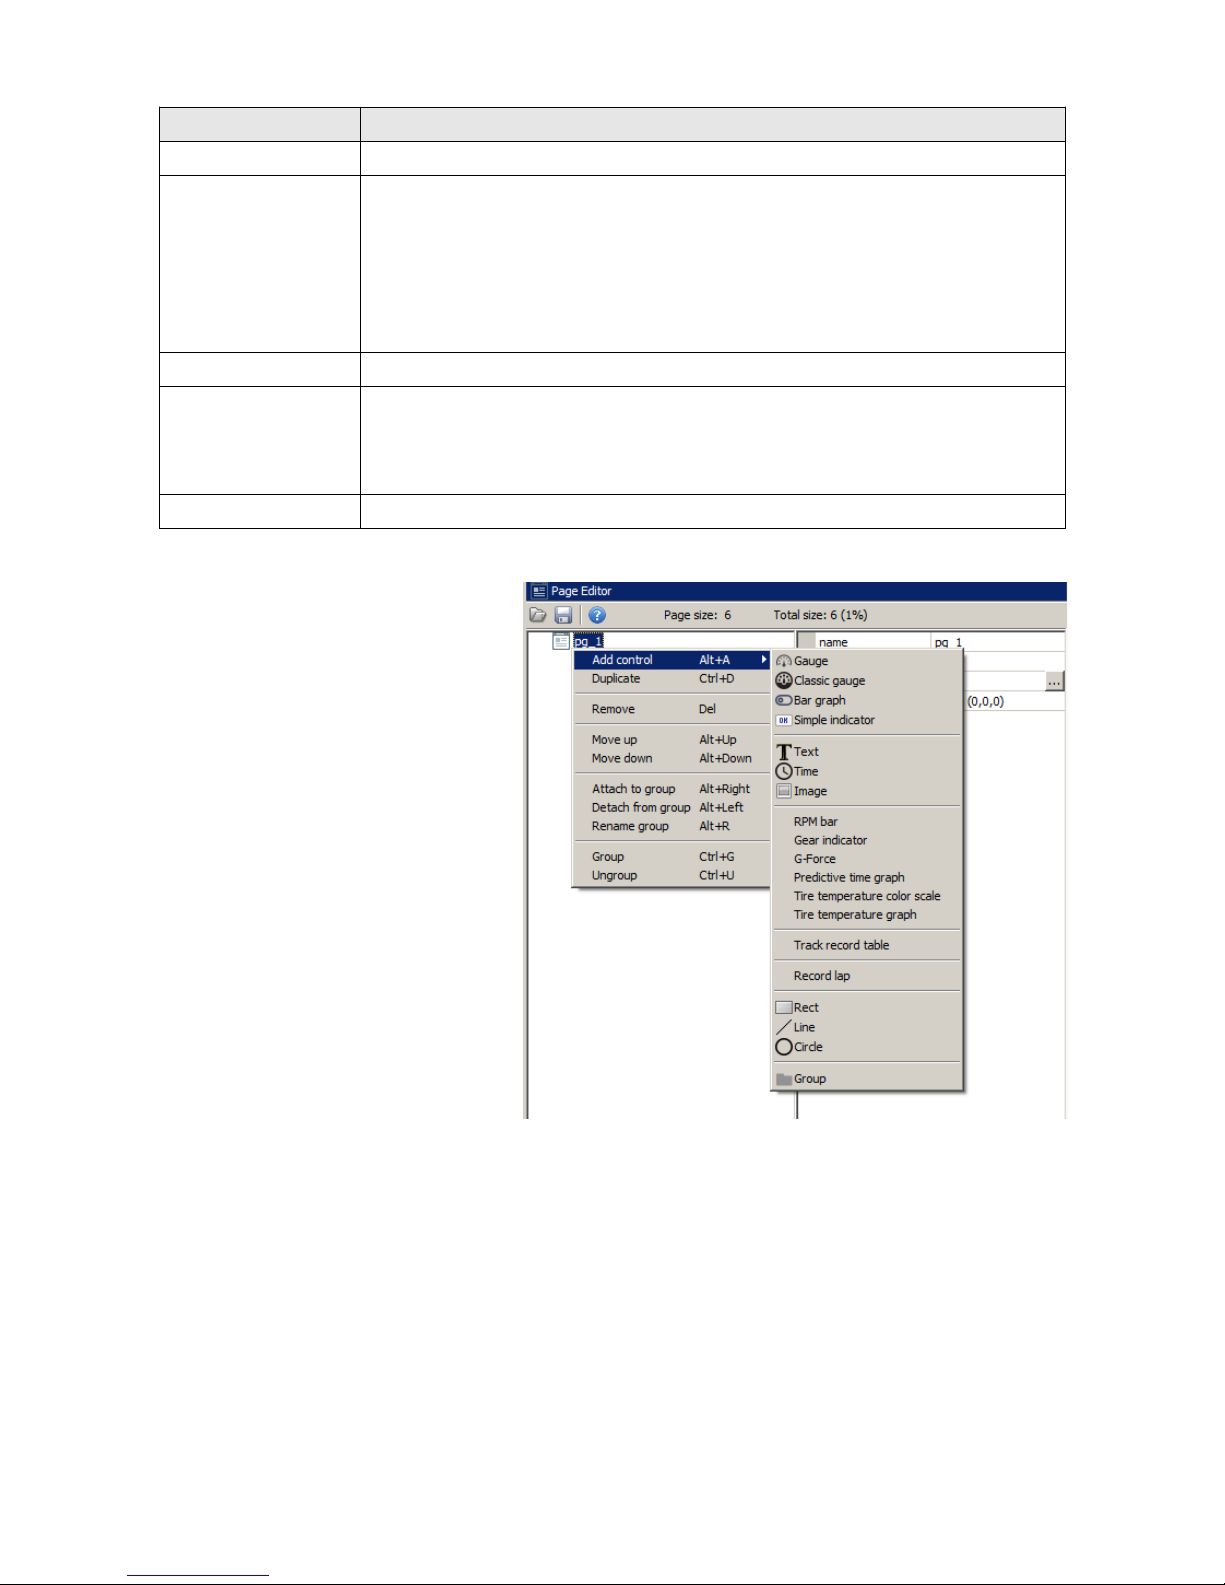
Background color The colour of a page background
To add an element to a page, right-
click the page name in the page
editor, select Add control, and
choose the desired element from the
menu. You may also open the menu
by pressing Alt + A.
Page 37/137
Page 38
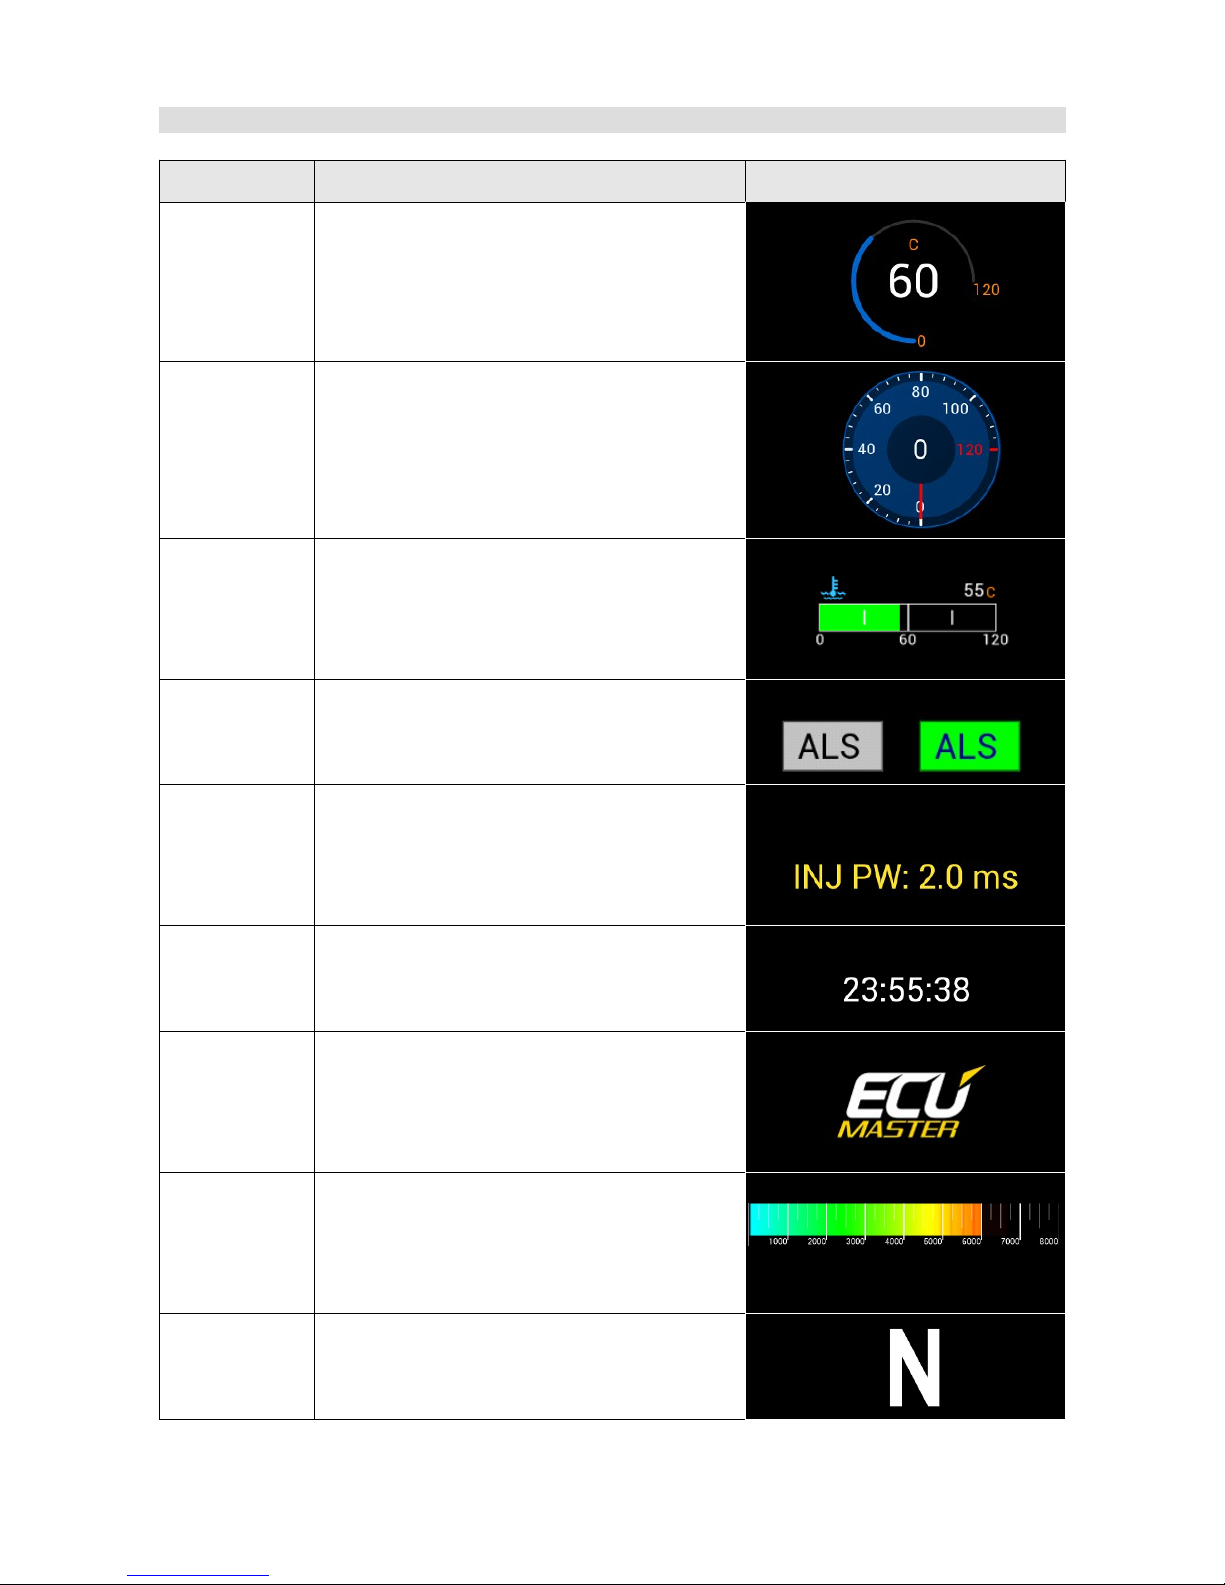
Page elements
Element Description Preview
Gauge A round gauge displaying a numerical value,
visualized with a circular segment.
Classic gauge A classic gauge resembling a car gauge.
Visualized with a numerical value and a
pointer with hashmarks.
Bar graph A numerical value visualized using a moving
bar (horizontal or vertical). It is also possible
to display an icon representing the measured
value.
Simple
indicator
An icon using two texts in two different colour
sets, switched using a log channel or
function.
Text Displays text in different font sizes and
colours. You can also attach a log channel
(e.g. injection time, cooling liquid
temperature, etc.) to the text.
Time Displays formatted time. You can choose
from the following times: real time, lap time,
last lap time, best time, and session time.
Image Displays one of the following graphic
elements on the page: background, logo,
icon. You may use the graphics available in
the device or load one of your own from a file.
RPM bar This indicator is dedicated to displaying
engine speed. There are three ways in which
it can be displayed - a horizontal bar, a
curved bar and a round gauge.
Gear indicator Indicates the current gear selected and uses
a special, enlarged font.
Page 38/137
Page 39
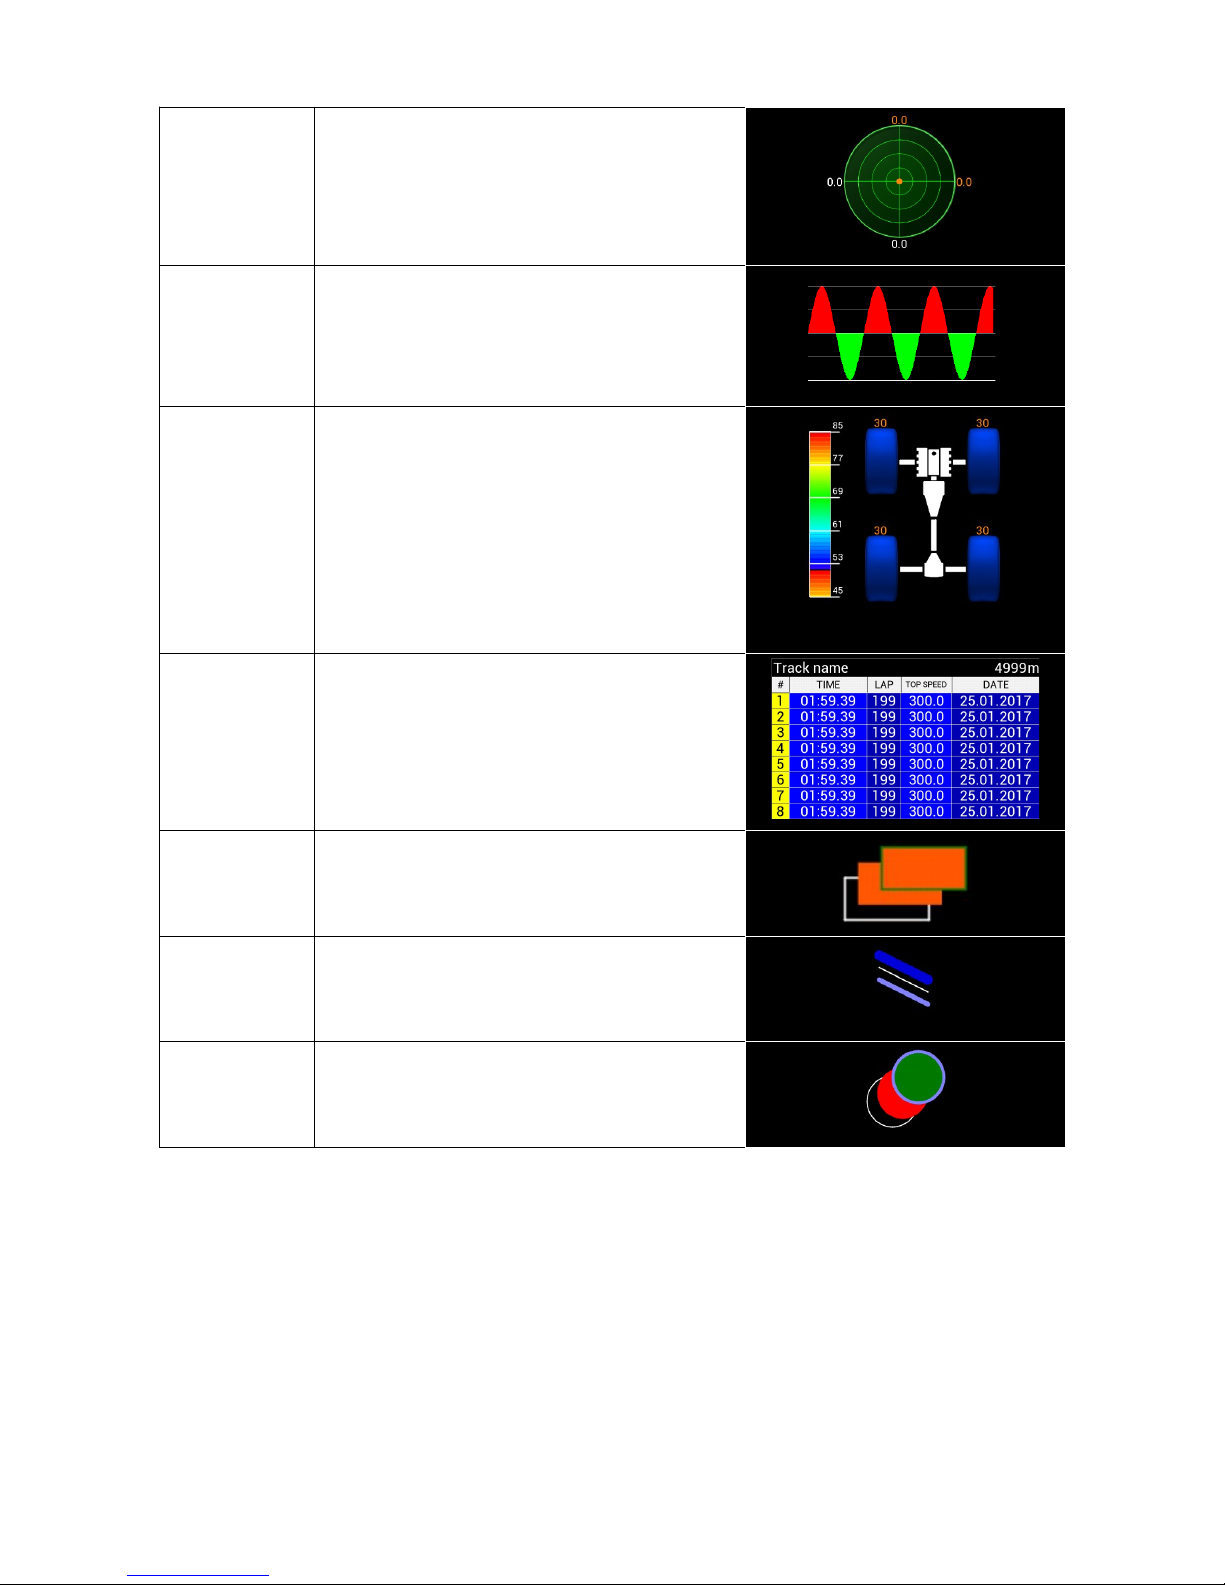
G-Force The g-force indicator uses the internal
accelerometer of the device.
Predictive
time graph
A graph displaying the current difference
between a lap time and the best time. Green
indicates a faster time, while red indicates
slower.
Tire
temperature
graph and
tire
temperature
scale
Displays tire temperature from thermal
imaging cameras and indicates their
maximum temperature. This indicator can
also display tire temperature in the form of
horizontal bars with a temperature gradient
(16 values for each tire).
Track record
table
Indicates 8 best times recorded on a given
track. These times are saved in the device
memory.
Rect Displays a rectangle in the form of a frame or
a filled-in shape.
Line Displays a line of any colour or thickness as
selected.
Circle Creates a circle of any colour, with or without
a fill color.
Page 39/137
Page 40
Adding page elements
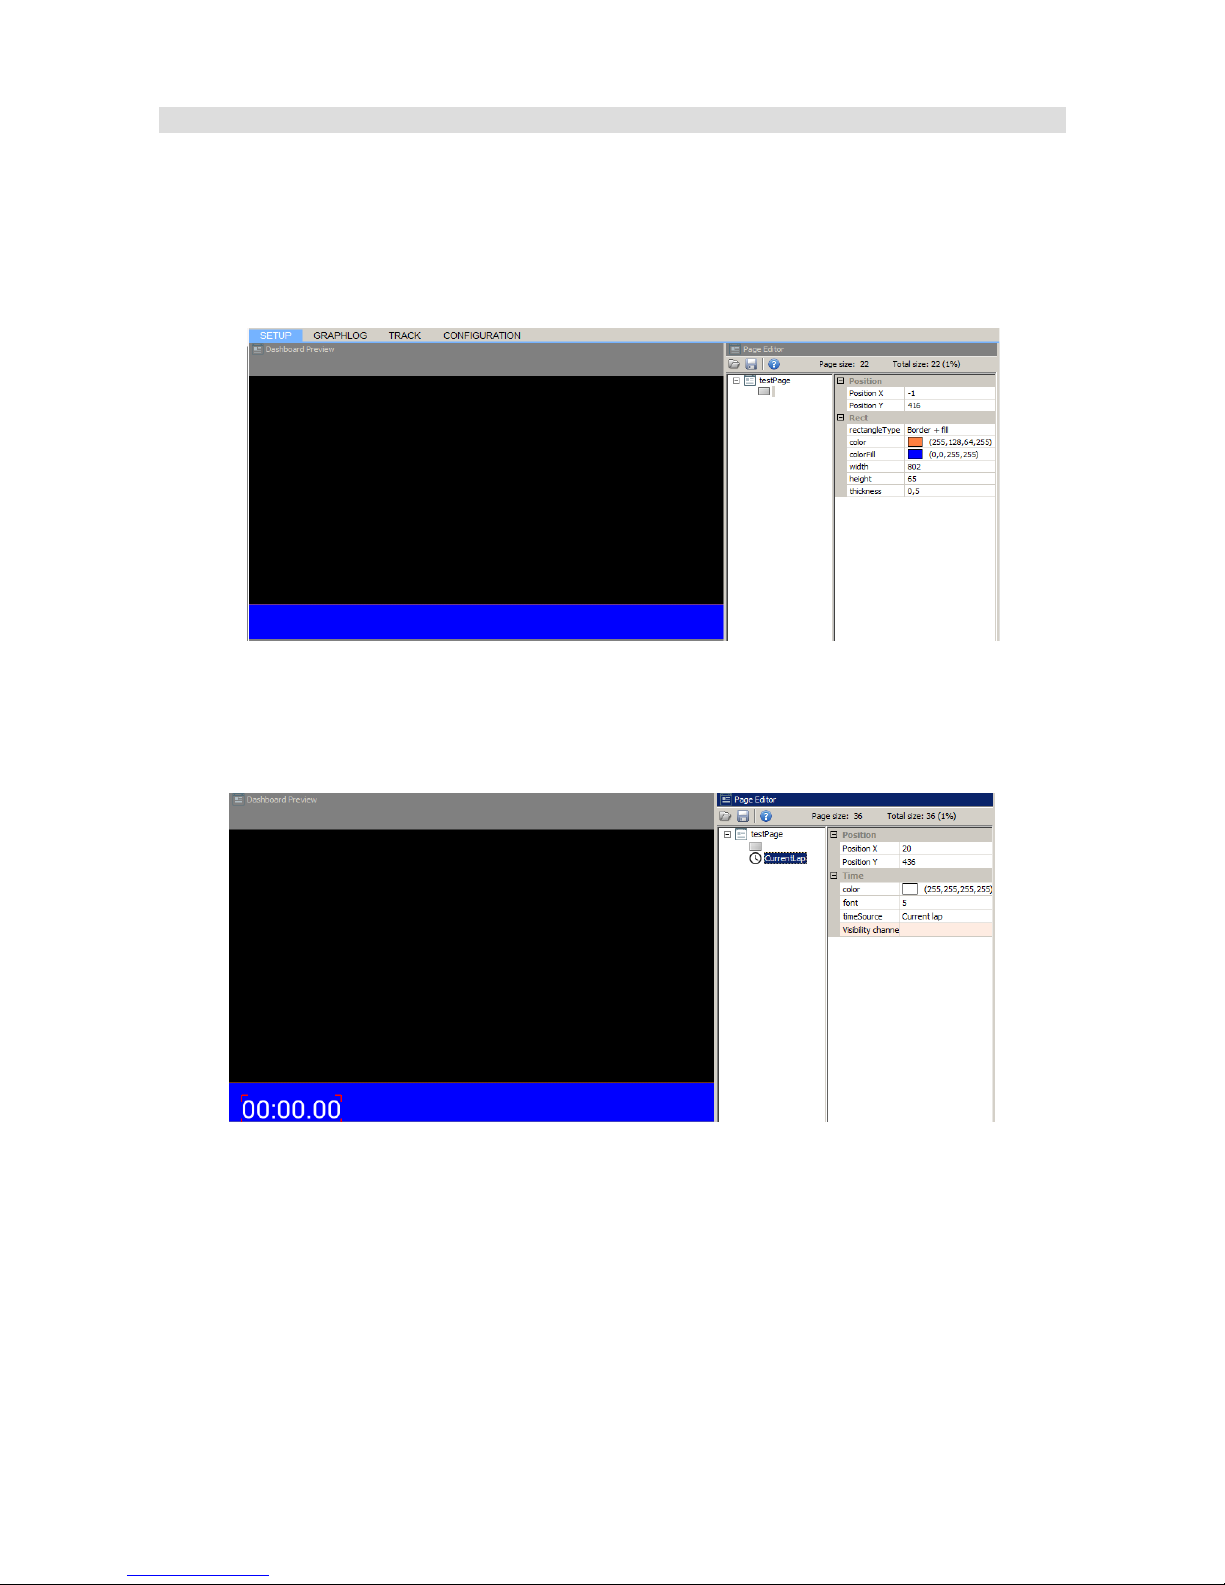
We will now create an example page. Let’s start with placing a Rect item on it. You may position
the item by left clicking and dragging it. If you are connected to your ADU device, the item will also
move on the display. You can change the Rect item parameters in the Page editor. After entering
the parameters shown below, the page will look as follows:
Now, we will add the current lap time. To do this, a Time item should be added.
We will use a Text item to visually represent the time function we just created. In the Text field,
type what you want to display, then choose the text colour. When creating a Text item, you may
define both the static and dynamic elements of the displayed text. This will be discussed in more
detail further in the chapter.
Page 40/137
Page 41
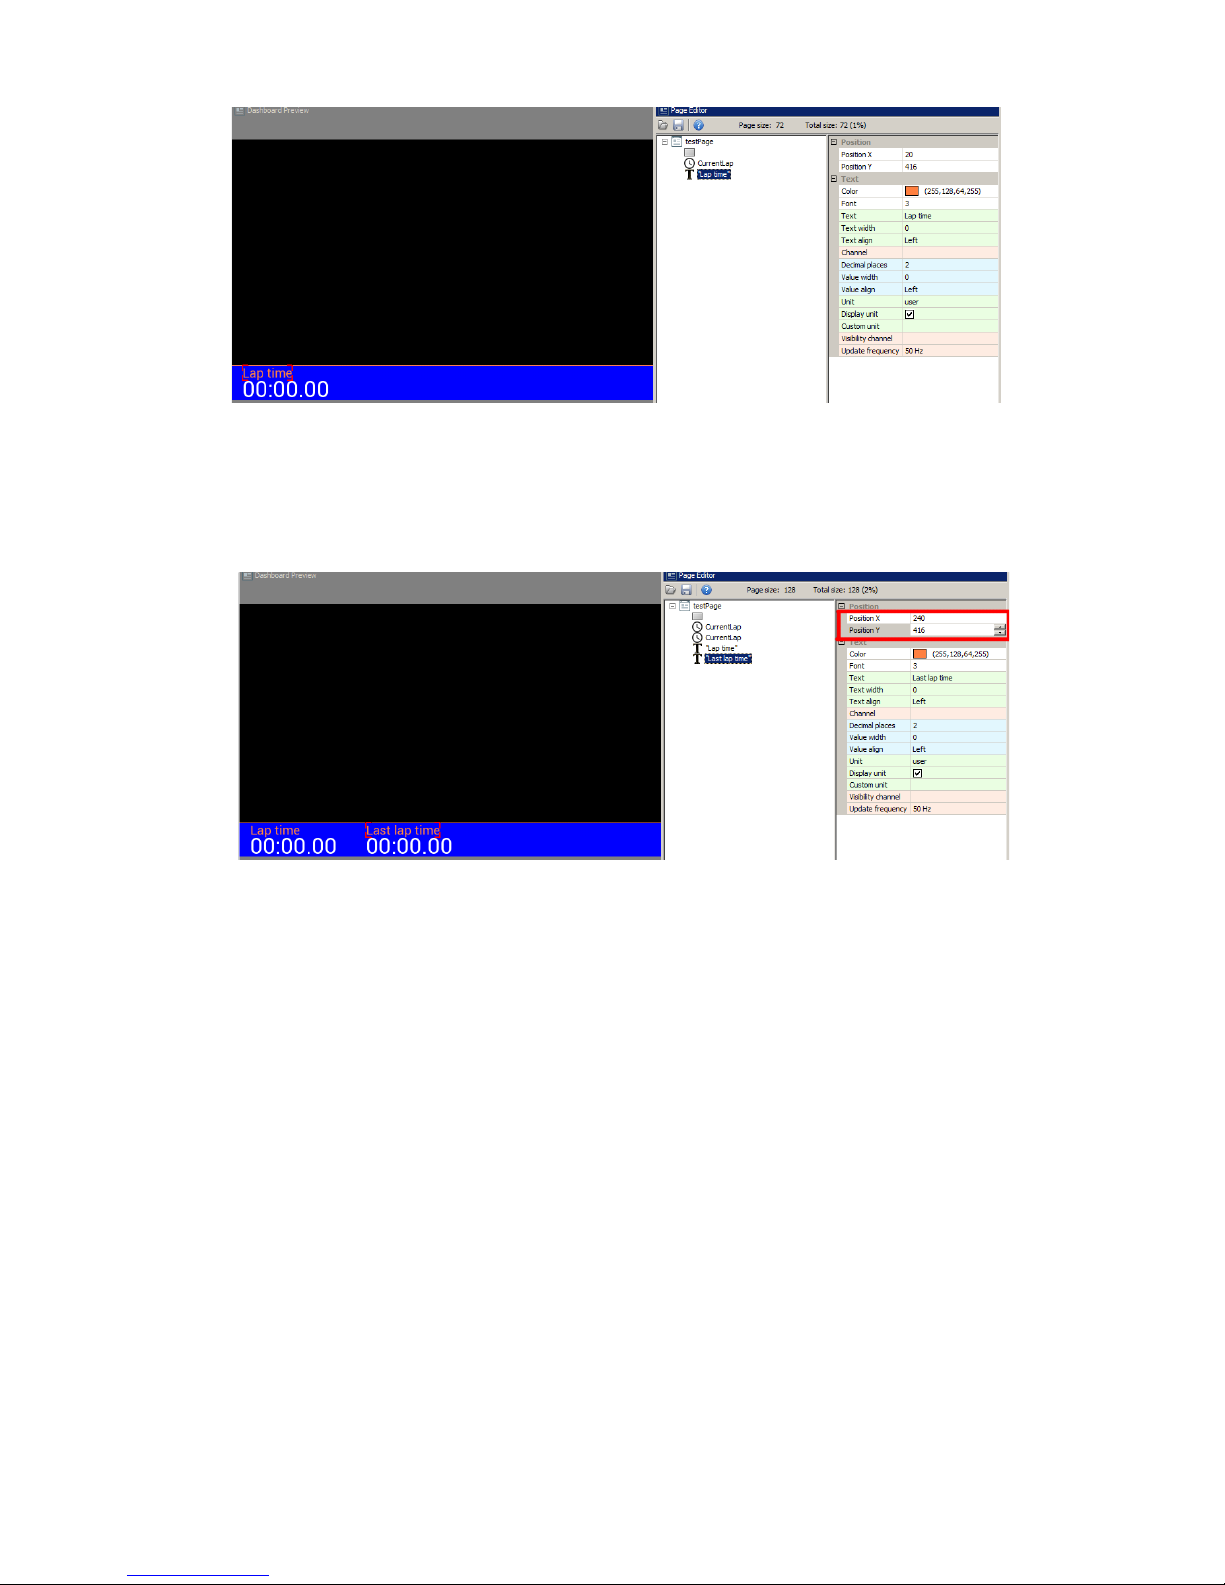
It is possible to duplicate items on the page. To do this, select an item in the Page editor and
press CTRL+D. In this example we will duplicate the Current lap and the Lap time item to show the
last lap time next to it.
To accurately set an item's position on the page, you can enter values into the Position X and
Position Y fields. Related items are best organized using the 'Grouping' function. This allows you
to organize several functions and move them as a single group. You can also automatically
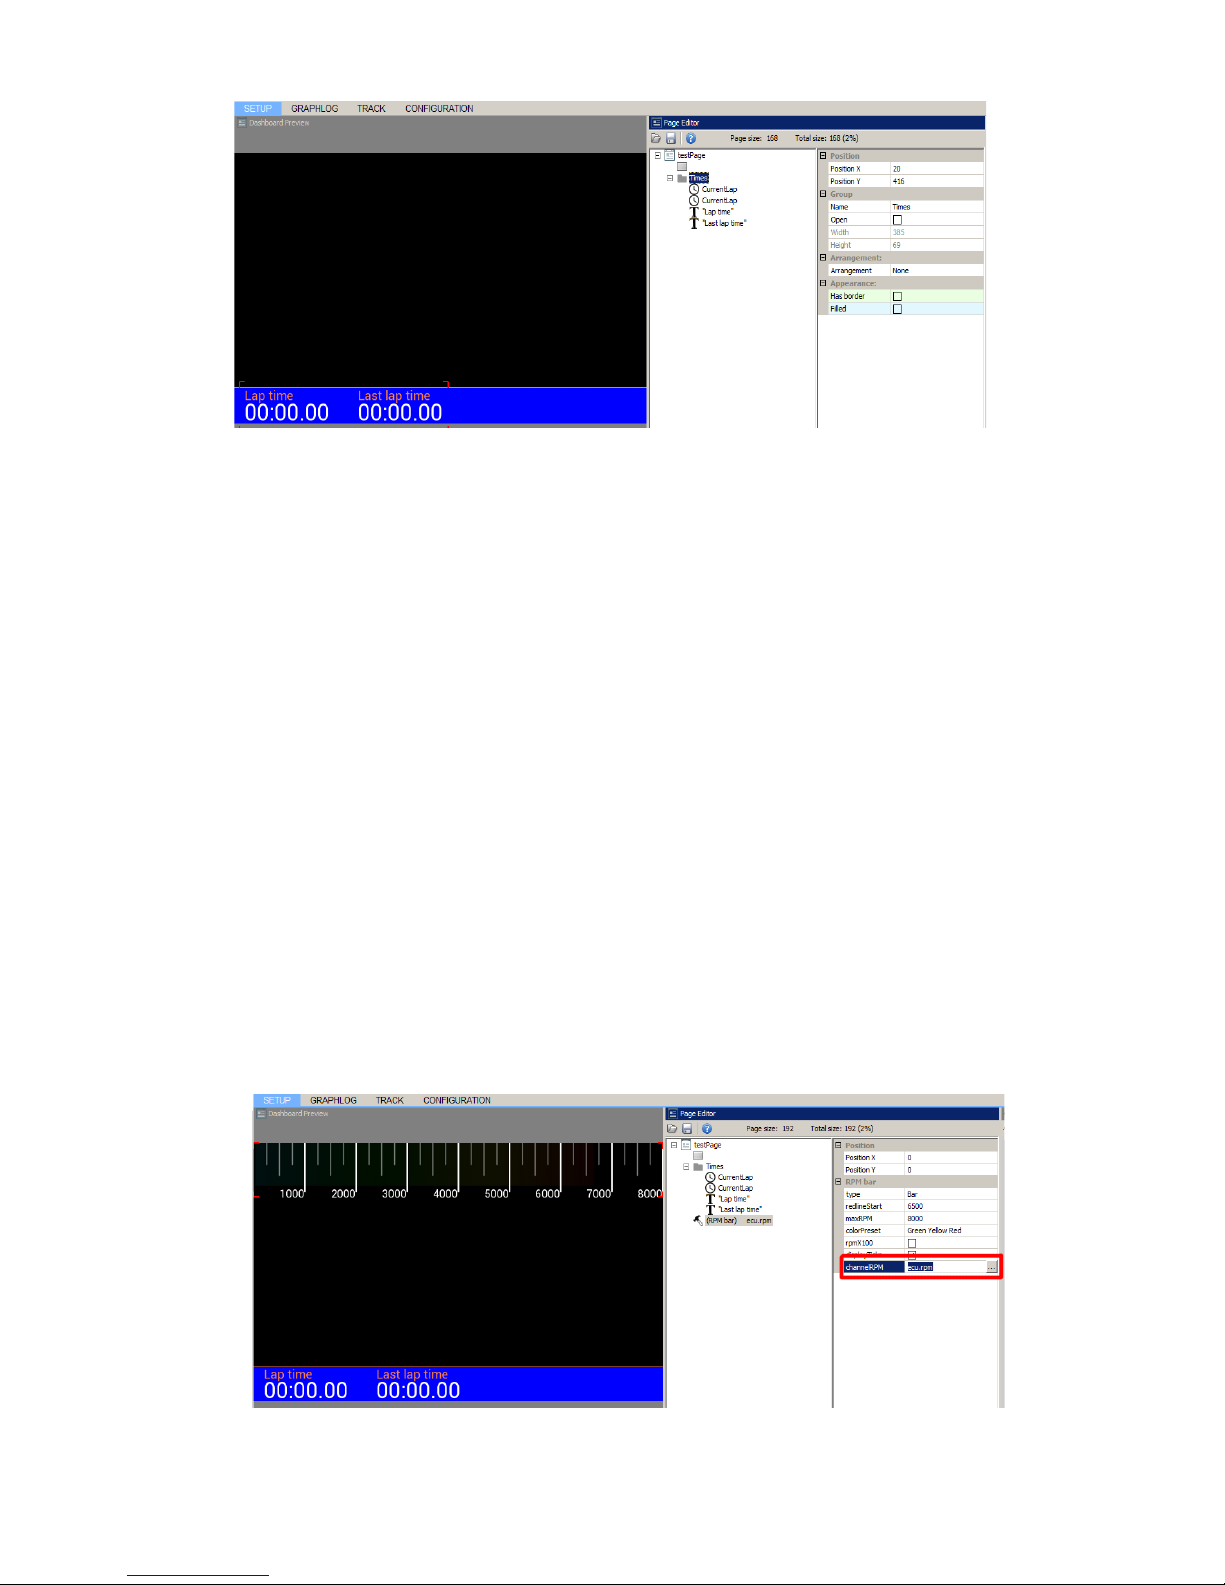
arrange the position of items relative to one another (this will be discussed detail further on). To
group items, select them in the editor and press CTRL+G. At this point you may name your group.
In our example we have created a group for our text and time items and have named it Times.
Page 41/137
Page 42
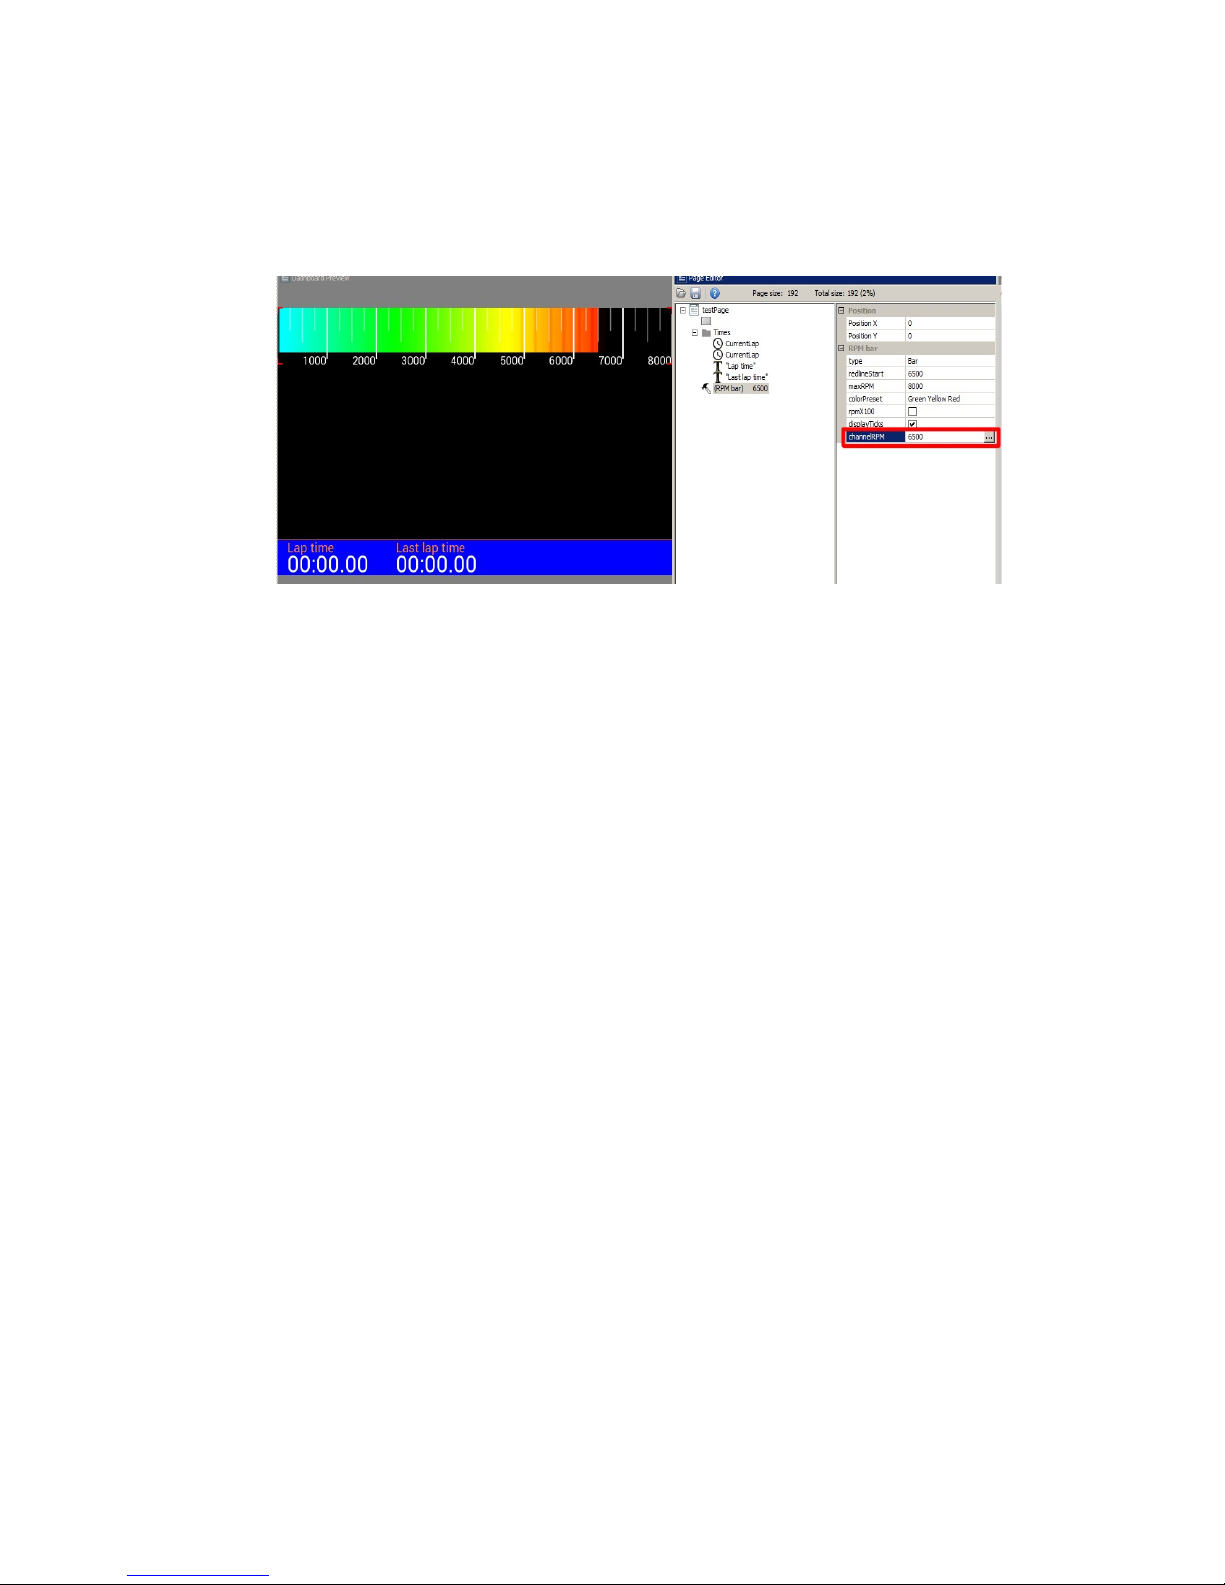
The next item we will add is an engine speed indicator. To do this, an RPM Bar item should be
added to the page. When a page object displays a changing value, you must define the channel
that drives the displayed value. This may be information from the CAN bus, a function, an
analogue or digital input value, or a fixed value. For engine speed this information will usually come
from the engine control unit via CAN bus or serial communication. A crankshaft position sensor
may also be connected directly to Digital Input 1. Most ECUs on the market transmit common data
via CAN (e.g. RPM, lambda, cooling liquid temperature, etc.) and this data is represented in the
ADU software by the ecu.* channels.
After loading the proper CANX file for the connected computer or configuring the serial
connection, the ecu.rpm channel will display the value sent by the ECU. For information specific to
your ecu, check the application notes files. Application notes also contain information about the
available log channels. If the ECU sends specific channels not included in the ecu.* channels, they
are assigned unique names. These can be previewed in the Project tree or found in the
application notes.
The pre-defined ECU channels are advantageous, as your page layouts can be used with
any ecu without needing revision (revolutions will always be ecu.rpm, the cooling liquid
temperature will be ecu.clt, etc.).
Page 42/137
Page 43
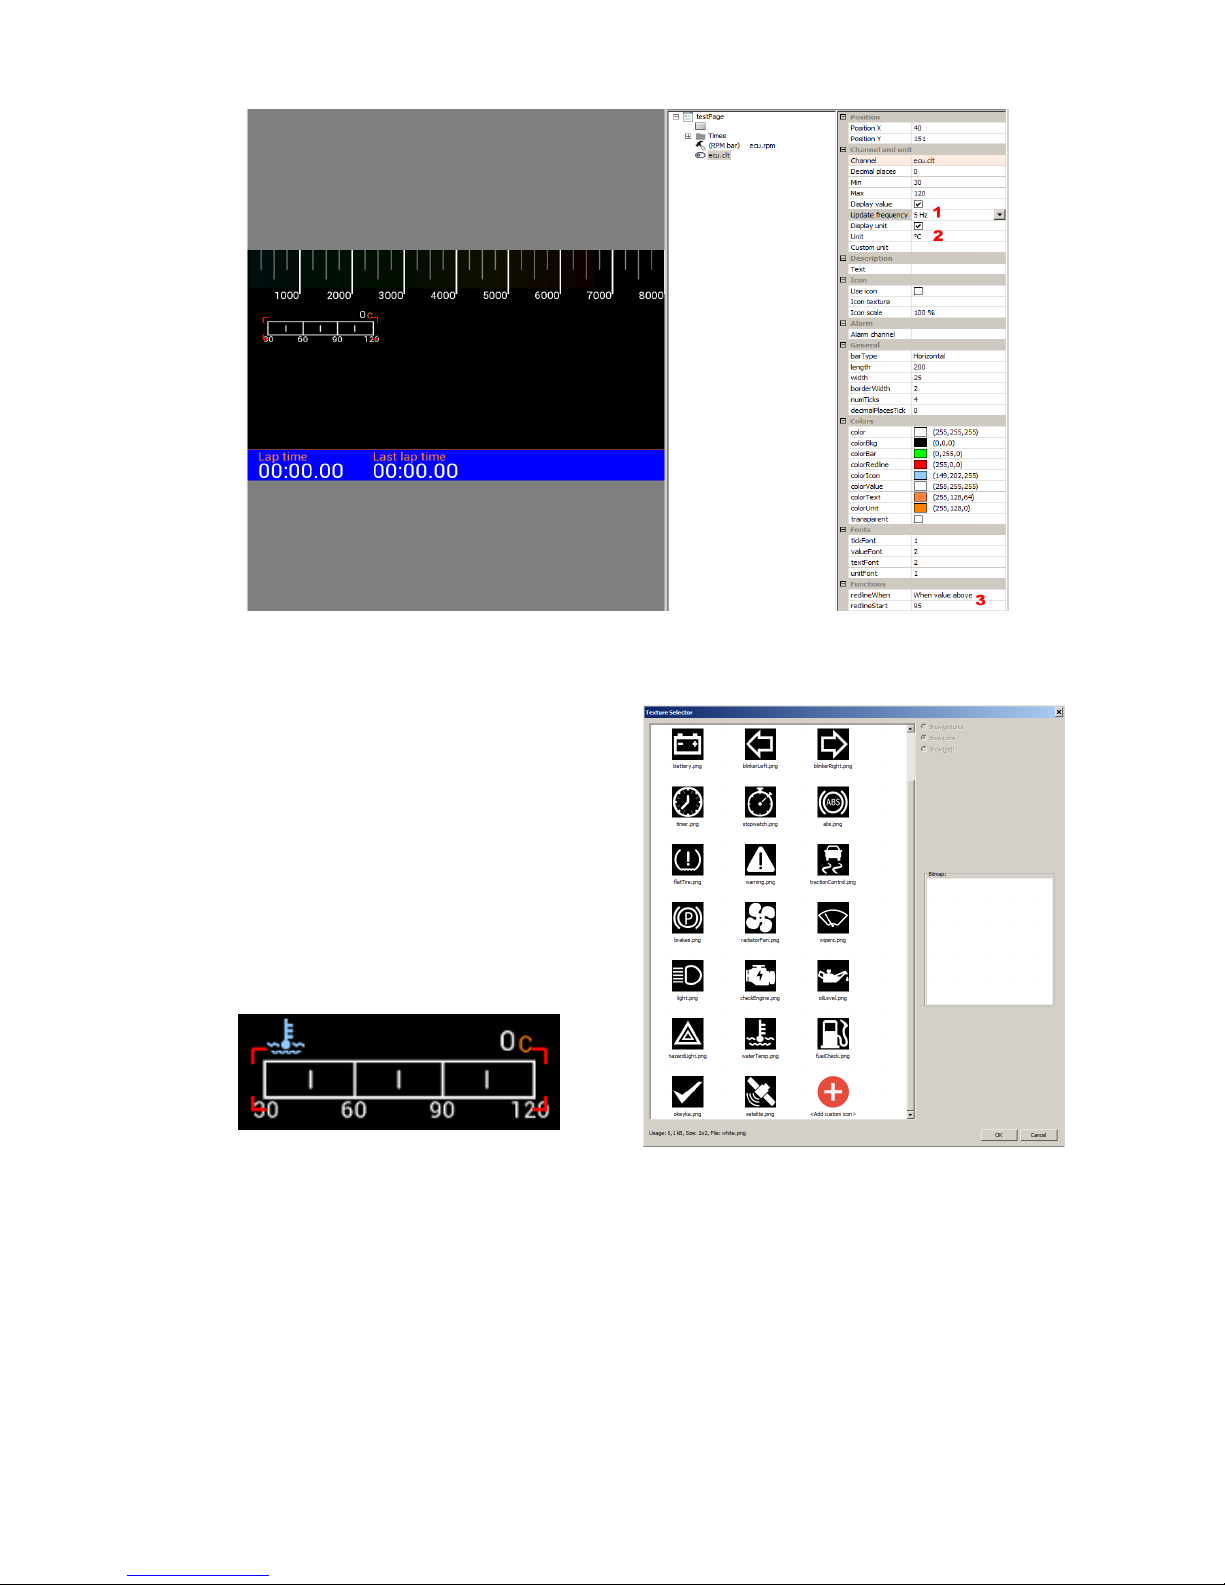
To test the operation of the indicator you can enter a numerical value (only integer values) in the
Channel field. In the example below, we typed 6500 in the channelRPM field and the engine
speed indicator appears.
Next we will add a horizontal coolant temperature indicator to our page using a Bar graph
indicator. Bar graph indicators have several configuration options. The first important parameter to
consider is the Update frequency (1). This parameter is the refresh rate of the displayed value.
The ADU screen refreshes at a rate of 50Hz, so this is the max frequency for any value. Values
with some degree of instability (e.g. oil or fuel pressure pulsation) are very difficult to read as they
change rapidly. Limiting the update frequency acts as a filter. Measurement units are configurable.
In our case, we want to the display temperature in degrees Celsius. If we change the unit to
Fahrenheit in the Units field, the displayed value will immediately be converted accordingly.
Another important function is the “redline” (3), which changes the indicator appearance if the
predetermined value is exceeded. In the redlineWhen field you may select the condition (i.e. warn
when exceeds or warn when below), and in the redlineStart field you may enter value at which the
indicator will change. The “redline” status will be indicated by the color selected in colorRedline.
Page 43/137
Page 44
You may display an icon to identify a Bar graph indicator field. To apply an icon, select the Use
icon option and select the desired icon from the
Icon texture field (by left-clicking the ‘...’ icon).
A graphics selection pane will pop up. Select or
load your own icon (you will find more information
on icons further in the manual). After selecting the
waterTemp.png icon, the indicator will look like the
example below.
Next we will copy the created indicator twice in order to create a fuel level and oil pressure
indicator. After copying, set their new position, select the appropriate icons and assign the
appropriate channels in the Channel field. These will be ecu.fuelLevel for fuel level and
ecu.oilPress for oil pressure, respectively. It is also worthwhile to group the indicators to facilitate
their editing in the future. After copying the page your screen will look like the example below.
Page 44/137
Page 45
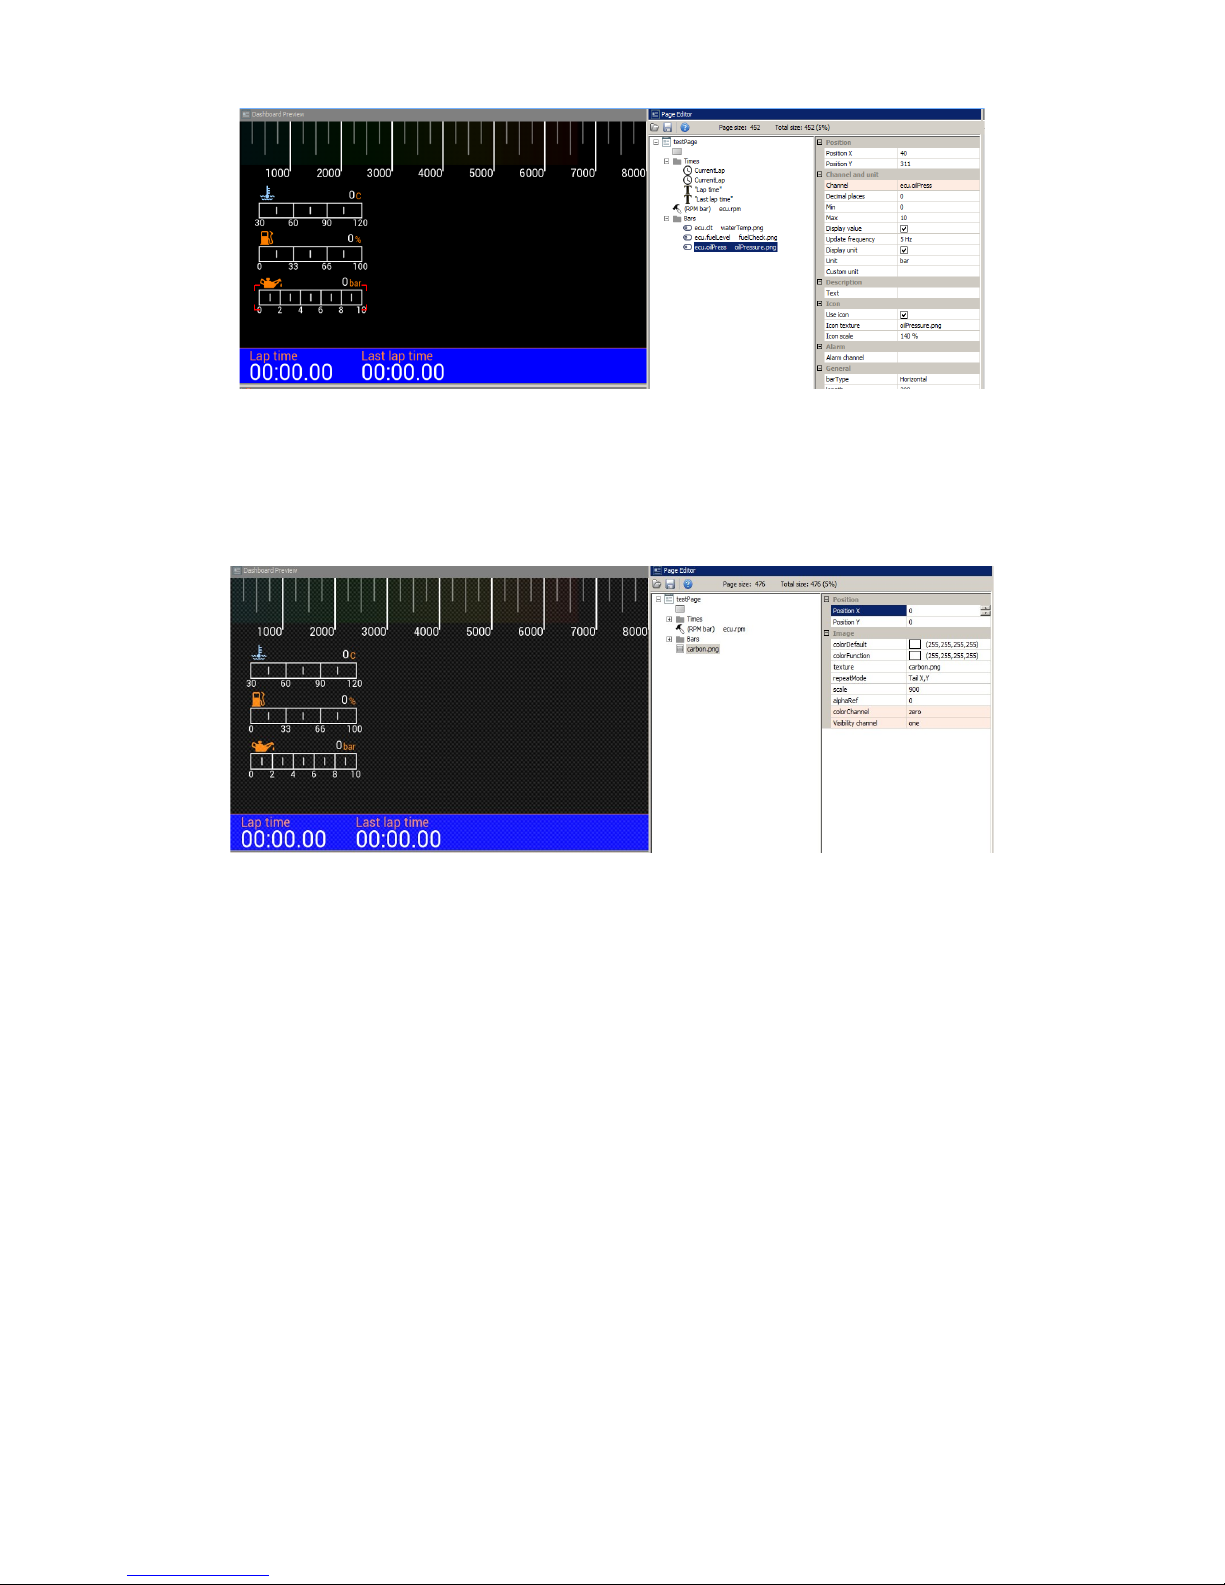
You may also add a background texture. For our example we will create a carbon fibre-style
background. To do this, use the Image item and choose carbon.png. To cover the entire screen
background, select Repeat mode Tile X, Y option and set Scale to 900%.
Note that our texture is displayed “over” the existing elements. To move it “underneath” we should
rearrange it as the first element on the page. The order of application of elements is determined by
their order on the list. To change their position on the list, select an element and move it by holding
ALT + up arrow or ALT + down arrow. Let’s change the colour of our background to dark blue, too.
Page 45/137
Page 46
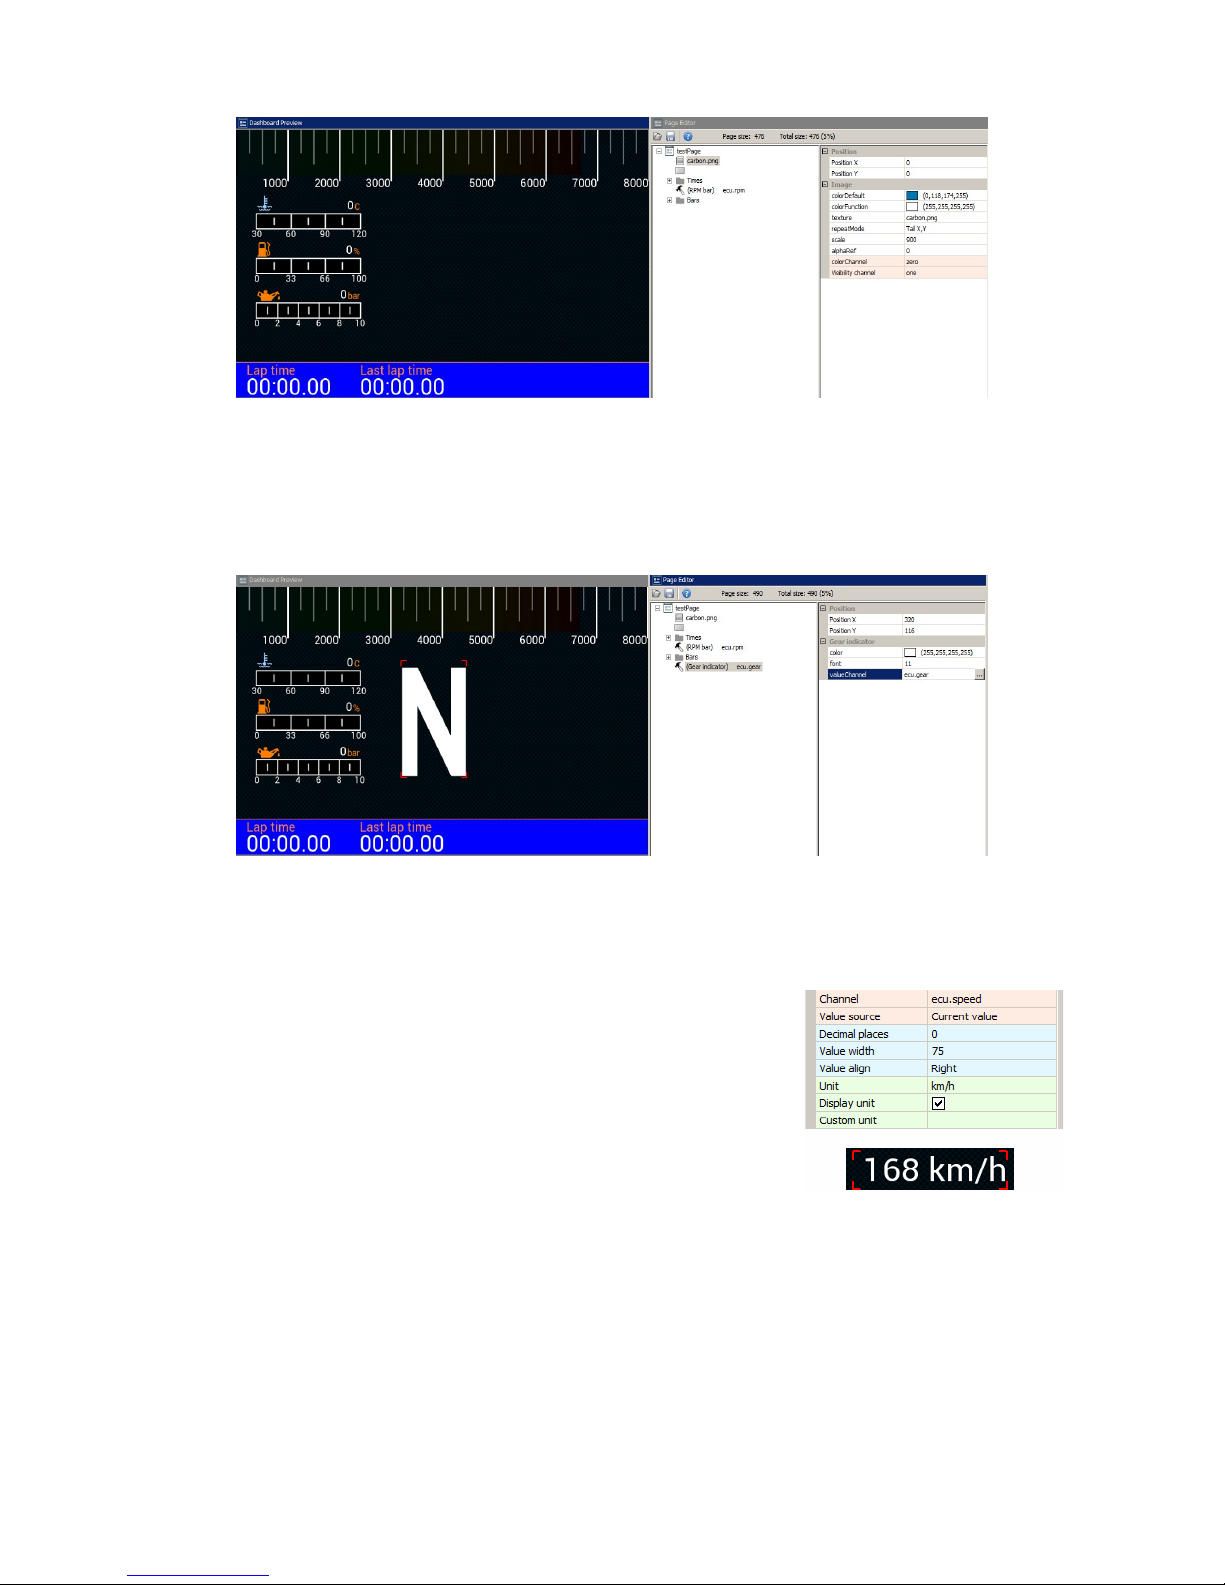
To insert an indicator for the current gear use Gear indicator. You should select a channel
(ecu.gear in our case) and a font size. The indicator for the currently selected gear has a special
font allowing to display large digits.
Under the gear indicator we will now display a numerical value representing the speed of the
vehicle. We will use the Text indicator for this purpose. In addition to displaying static text, you
may use a Text indicator to show values of channels and variables.
Enter the name of a channel or variable in the Channel field. In
addition to the current value of the channel, the measurement unit
may also be displayed. Pay careful consideration to the width given
to Text indicators. To prevent the text from shifting as the displayed
value increases (e.g. From 7 km/h to 11km/h) we have set the text
width at 75 pixels to allow for 2 and 3 digits to be displayed. To change the unit from km/h to mph
choose your desired unit from the Unit field. Under speed we will also add a Text indicator
showing “Vehicle Speed” as the channel description.
Page 46/137
Page 47
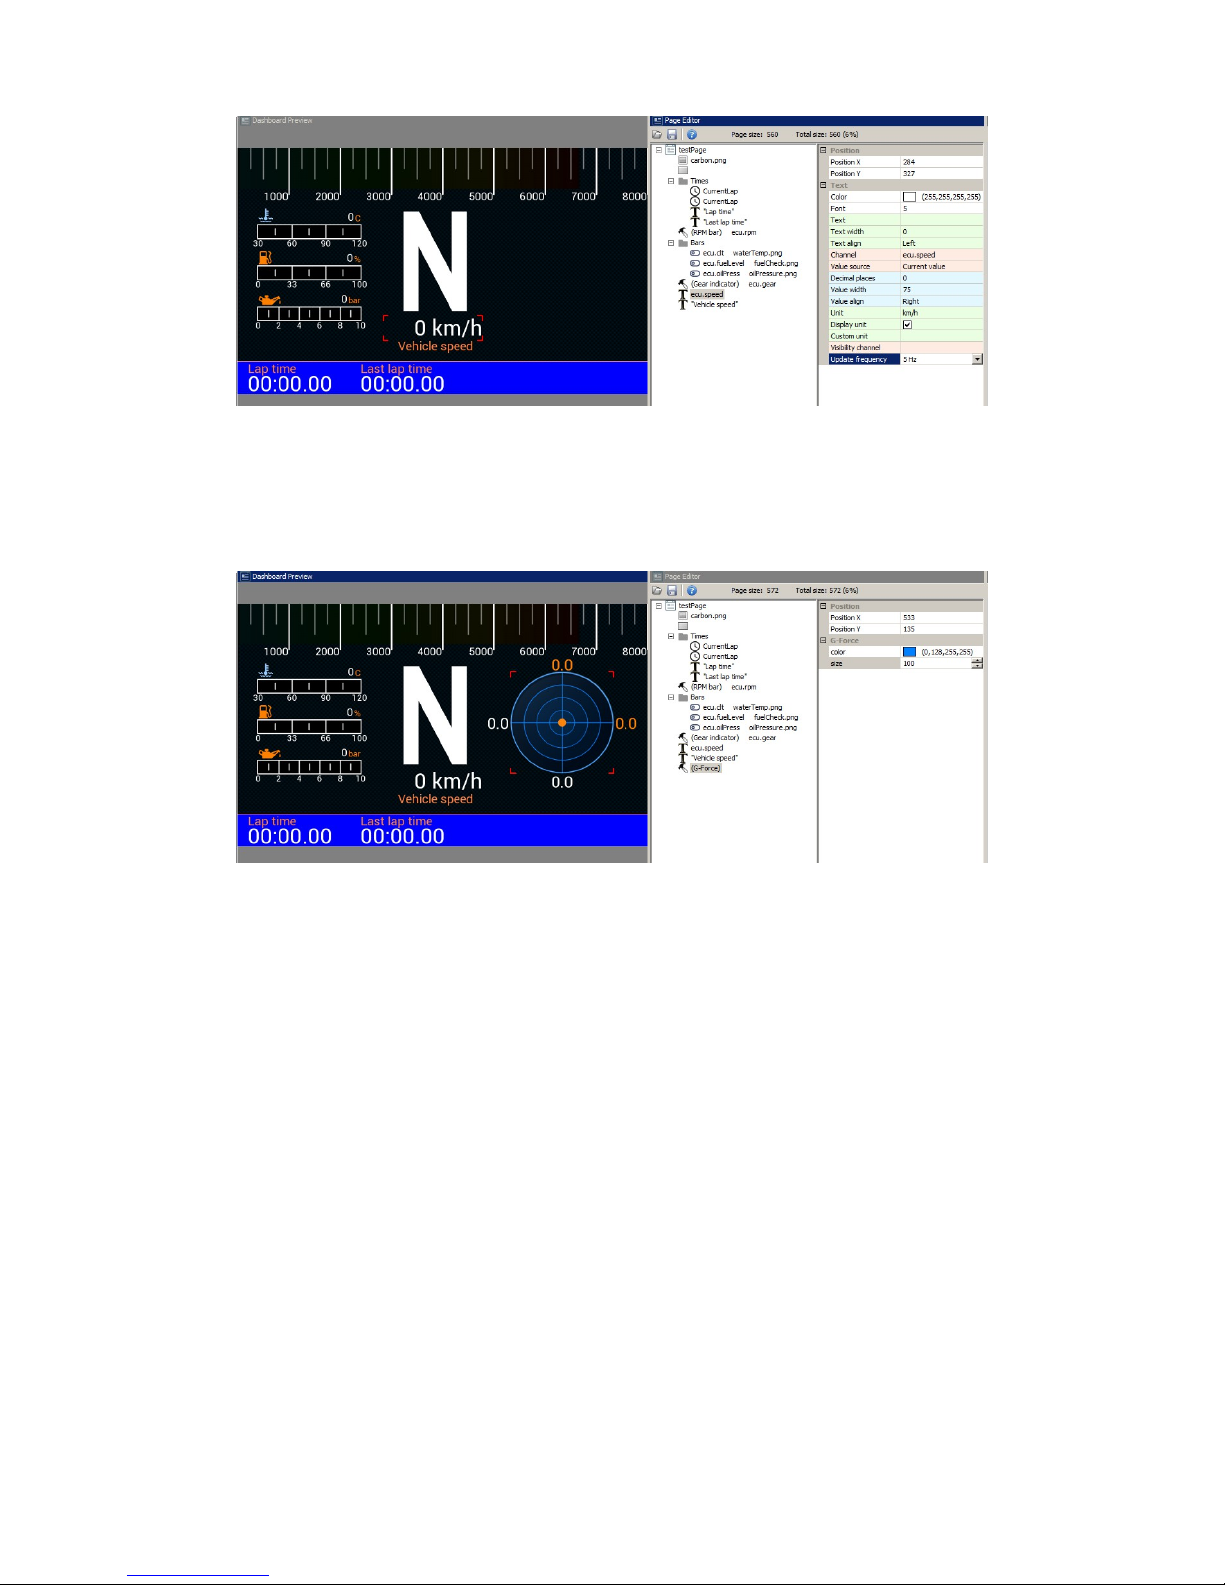
Next we will add a G-force indicator (G-Force). This shows the current G-force acting on the
vehicle. The ADU has a built-in accelerometer which may require calibration after the device is
installed (setting the 0g point). You will find more information about the accelerometer later in the
manual.
When using a GPS module, it is important that the user is able to see its status. To facilitate this,
we will add a GPS status indicator. We will use two channels - gps.status, which shows us the
GPS operation mode, and gps.numSatelites to show the number of satellites that the module is
currently using.
The first step is to add a satellite icon (satelite.png) to the page using an Image indicator.
The indicator color may be assigned to a channel or function. We set red as the default colour
(GPS not working) changing to green when GPS is functioning properly. We also have to create a
function driven by the gps.status channel. We will create a function that outputs 3 states: 0 -
means that GPS is disconnected, 1 – means no synchronization with satellites, 2 - means that
GPS is functioning and has fixed our position. Add the function in the Project tree using the Add
(function) button. We will name the function f_isGPSValid and add a condition using the Add
button. We will select Greater as Operation, gps.status as Channel and set the value for
comparison (Constant) to 1. We have created the condition f_isGPSValid = gps.status > 1. You will
find more information regarding the functions later in the manual.
Page 47/137
Page 48
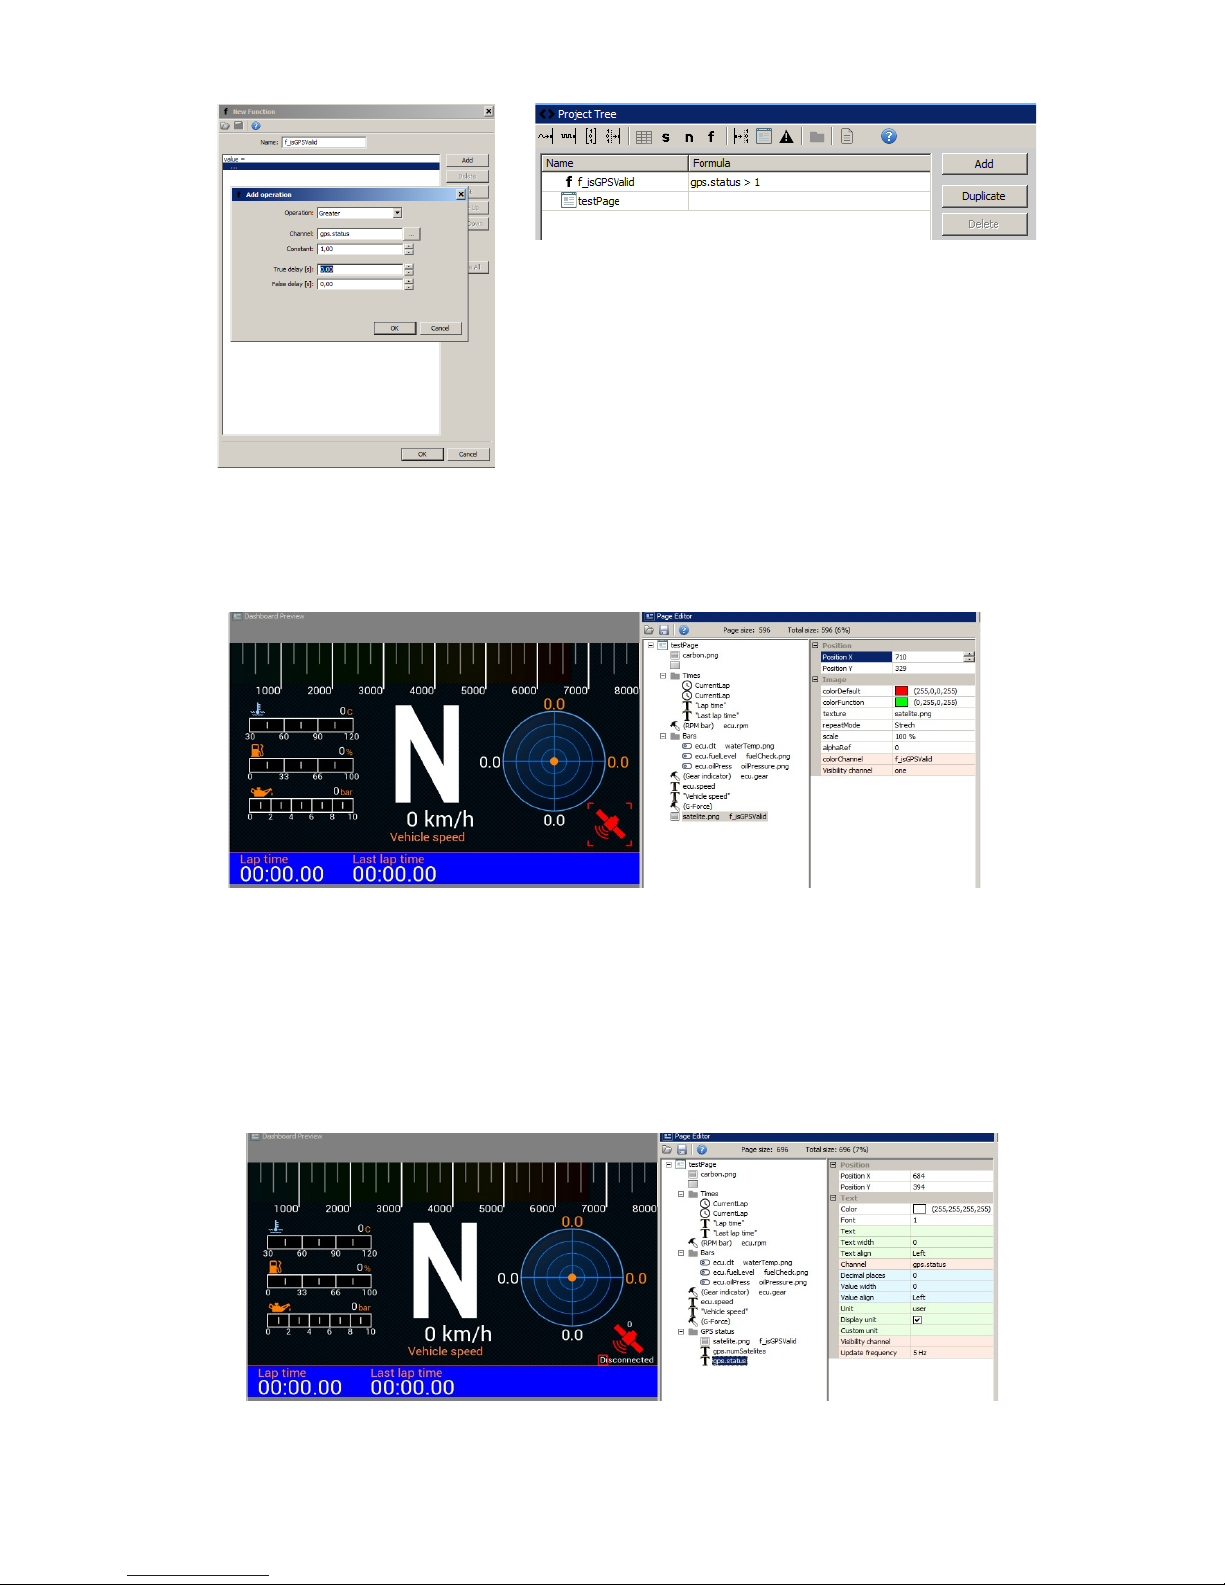
Enter f_isGPSValid in the ColorChannel field of our satellite icon. We can also test the colour
change by manually entering 0 (basic colour) or 1 (alternative colour) in that field.
We will place two text fields over and under the icon. The upper field will indicate the number of
satellites (gps.numSatelites channel), while the lower field will display the current GPS module
status. For the gps.status channel, the text field will automatically transform the value into text
(e.g. disconnected, gps 3D, etc.). We will group all elements of the indicators into a GPS status
group.
Page 48/137
Page 49
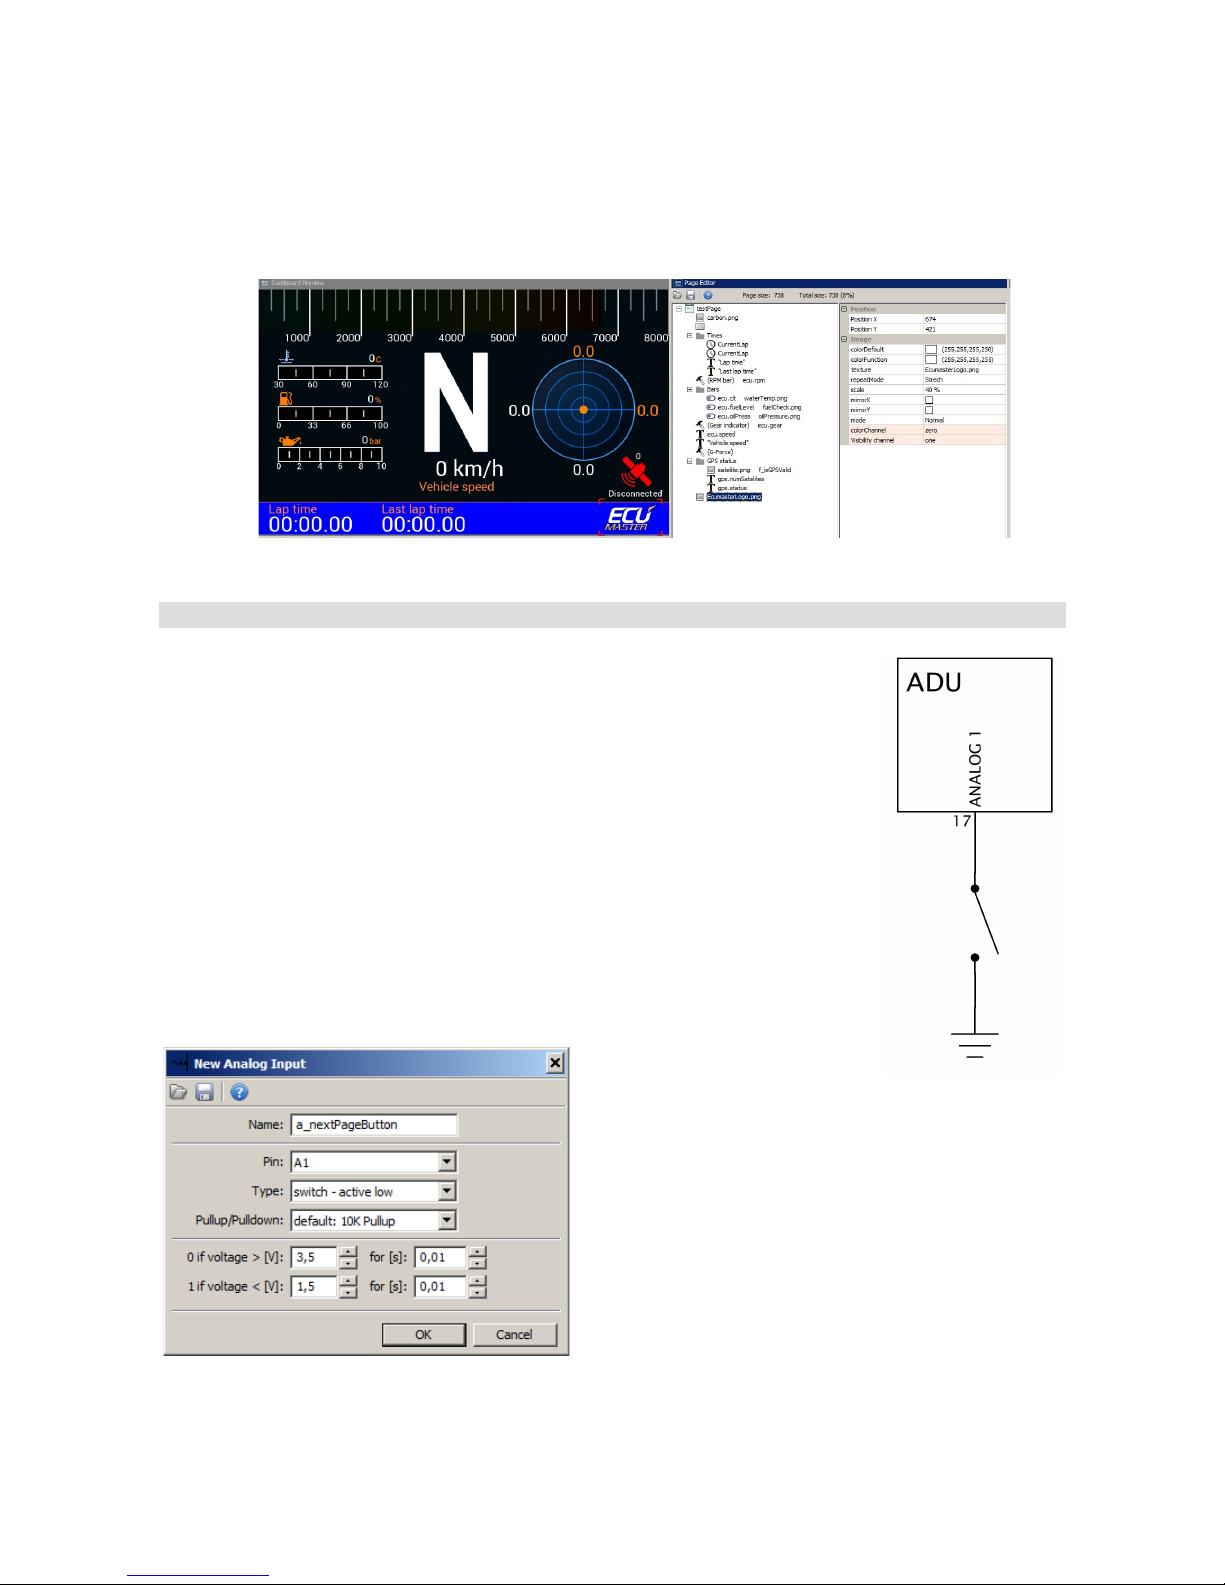
The last element to be added to the page will be the company logo. In this example we will use the
logo of Ecumaster embedded in the device. However, you can add your own graphics and display
the logo of your own company. You will find more information about this later in the manual. In
order to add graphics, select the Image indicator and then the desired logo (in the Texture field).
Page switching
There are two methods of switching between pages. The first method is
using a button connected directly to the ADU (by means of analogue or
digital inputs) or to another device (e.g. a CAN switch board) and then sent to
ADU via CAN bus. The button to be used for switching between the pages
must be defined in the Buttons panel.
The following example shows how to connect and configure a page-switching
button. The button is connected to the analogue input Analog #1 and shorts
to ground.
In the Project tree the button must be defined as an analogue input. To do
this, press Add and then select Analog input.
The following pane should pop up:
Name determines the name of
the input that will be visible in the project. In the Pin
field define the analogue input to which the button is
connected (Analog #1 in our case). Choose
Switch - active low (which means that the button
is activated at a low state). You also need to select
a 10K pullup resistor.
To preview the button state, open the Analog inputs panel, in which you will be able to track all
Page 49/137
Page 50
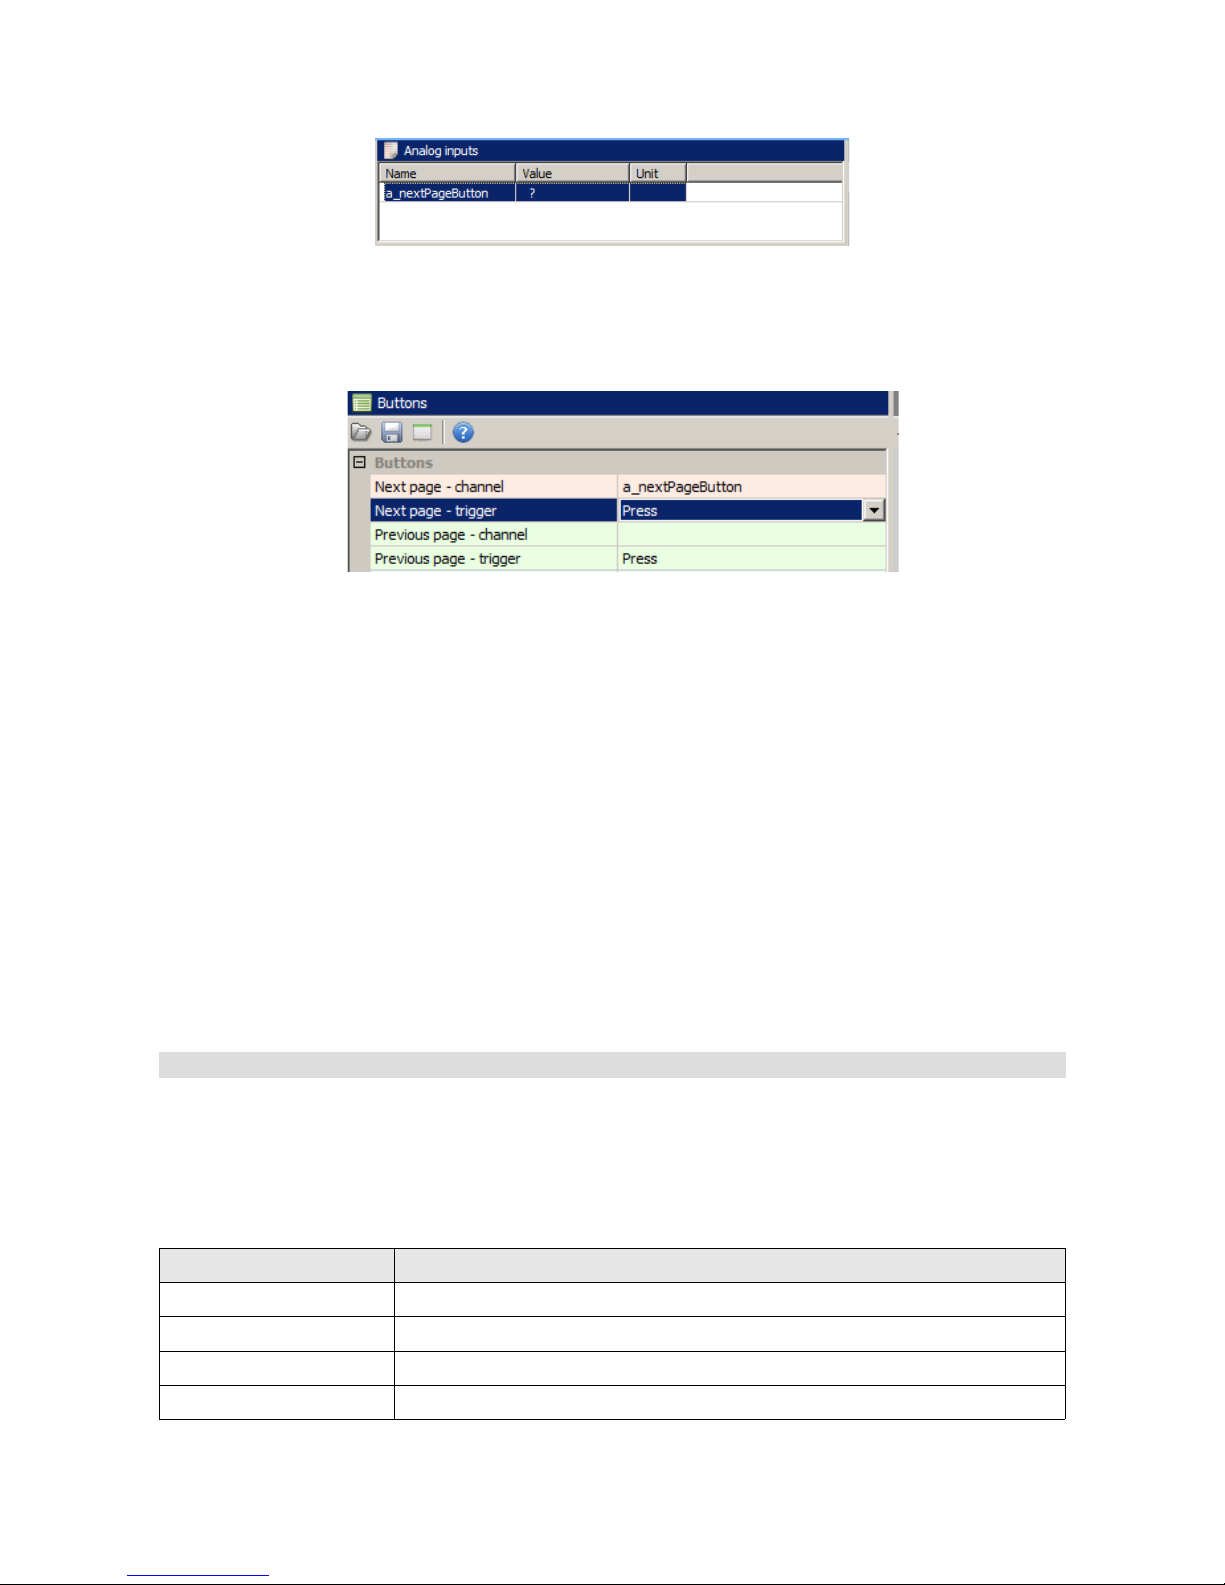
Analogue inputs). The value of the button should equal 0 when not pressed and 1 when pressed.
Before a defined button can be used, it must be assigned in the Buttons panel for switching from
one page to the next (Next page - channel). It should be noted that after pressing the button the
last page switches to the first one. You can use the buttons only to switch between the Page-type
pages. Overlay pages are ignored.
Similarly, you can connect another button and assign it to the function of switching to the previous
page (Previous page)
Another method of switching between pages is to use the Activation channel page attribute. It is
available after selecting a page in the Page editor together with the attributes such as the name,
background colour or type.
The main use for this type of switching is Overlays. They allow the application of an overlay (of
another page) on the currently displayed page whenever an event occurs. To do this, a function
that will activate the overlay needs to be created. It will be visible as long as the function result
differs from 0.
Another method of switching between pages is to use a Rotary switch. You can define a function
and assign it to the Activation channel attribute for each of its positions.
Startup screen
You can create a startup screen that will appear immediately after switching the device on and will
be displayed for a defined time. To do this, configure the Startup Screen parameters in the
Configuration pane.
Parameter Description
Enable Activates the startup screen
Texture The texture that will be displayed on the startup screen (centred)
Scale The scale of the displayed texture
Duration The duration which the startup screen will be displayed
Page 50/137
Page 51
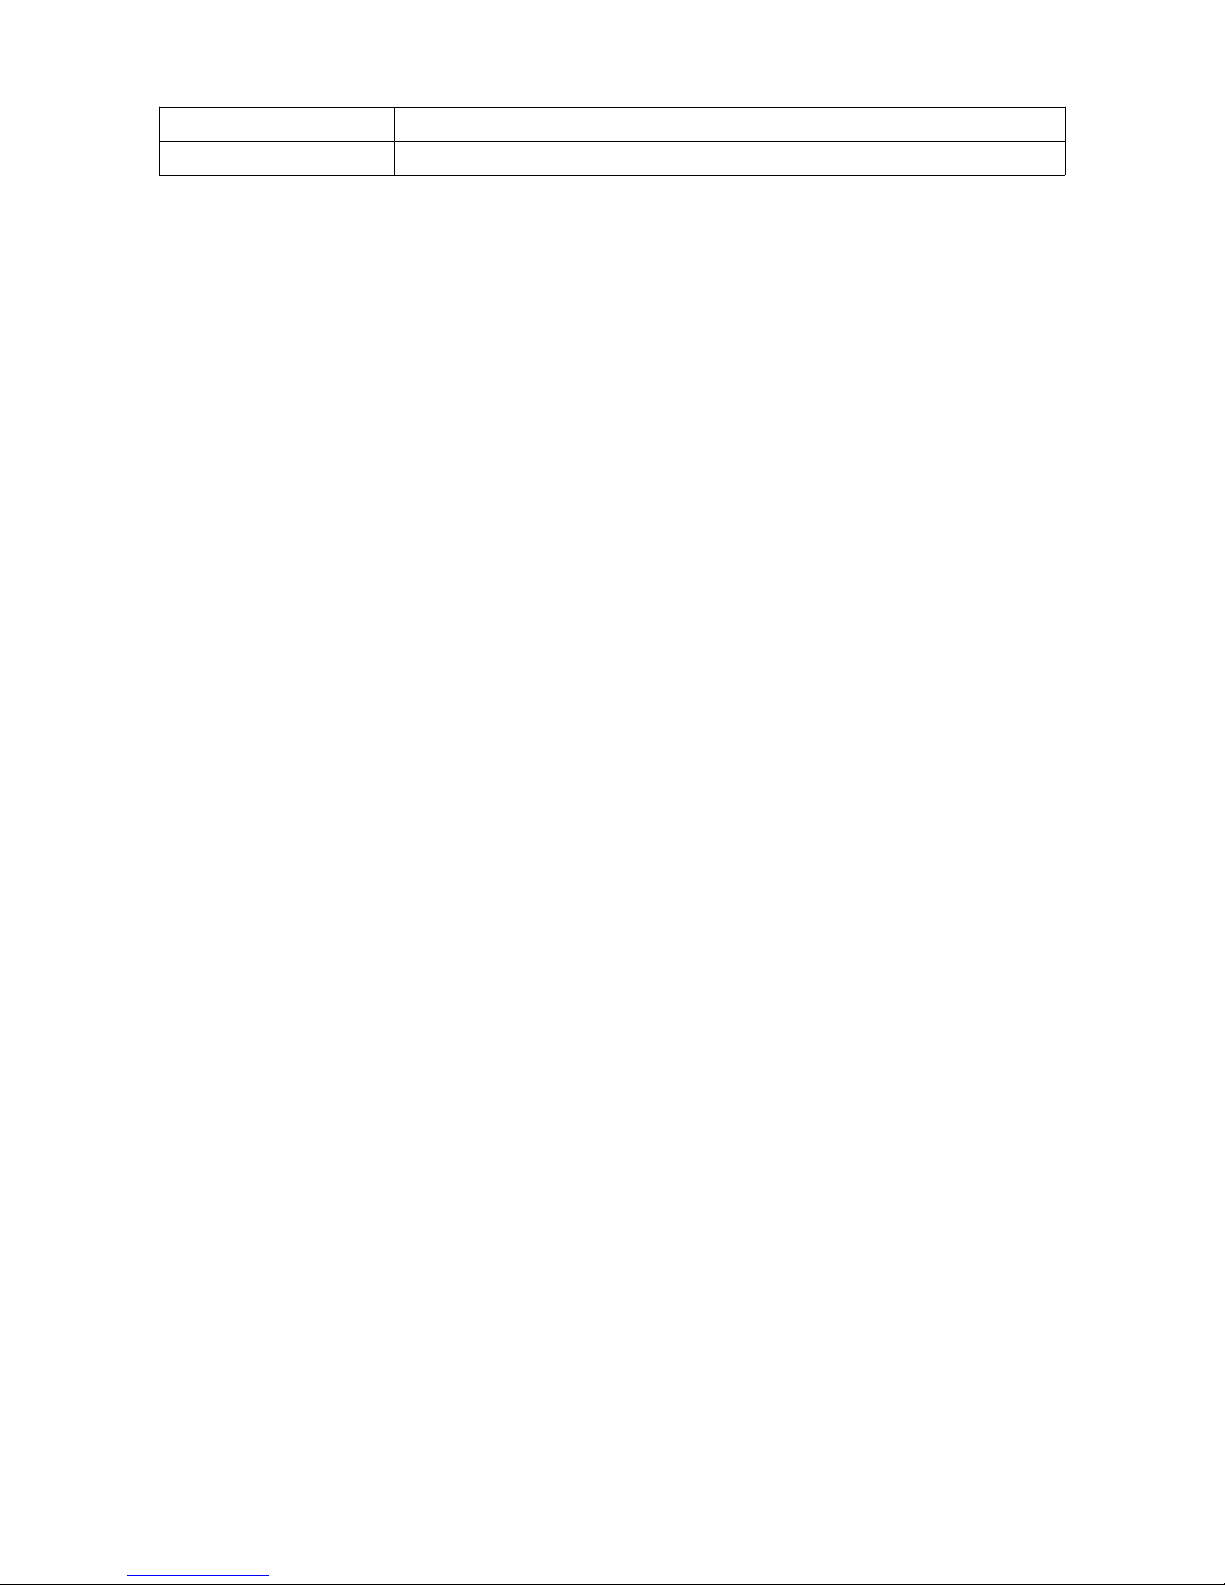
Color The colour of the displayed texture
Background color The colour of the background
Page 51/137
Page 52
Objects
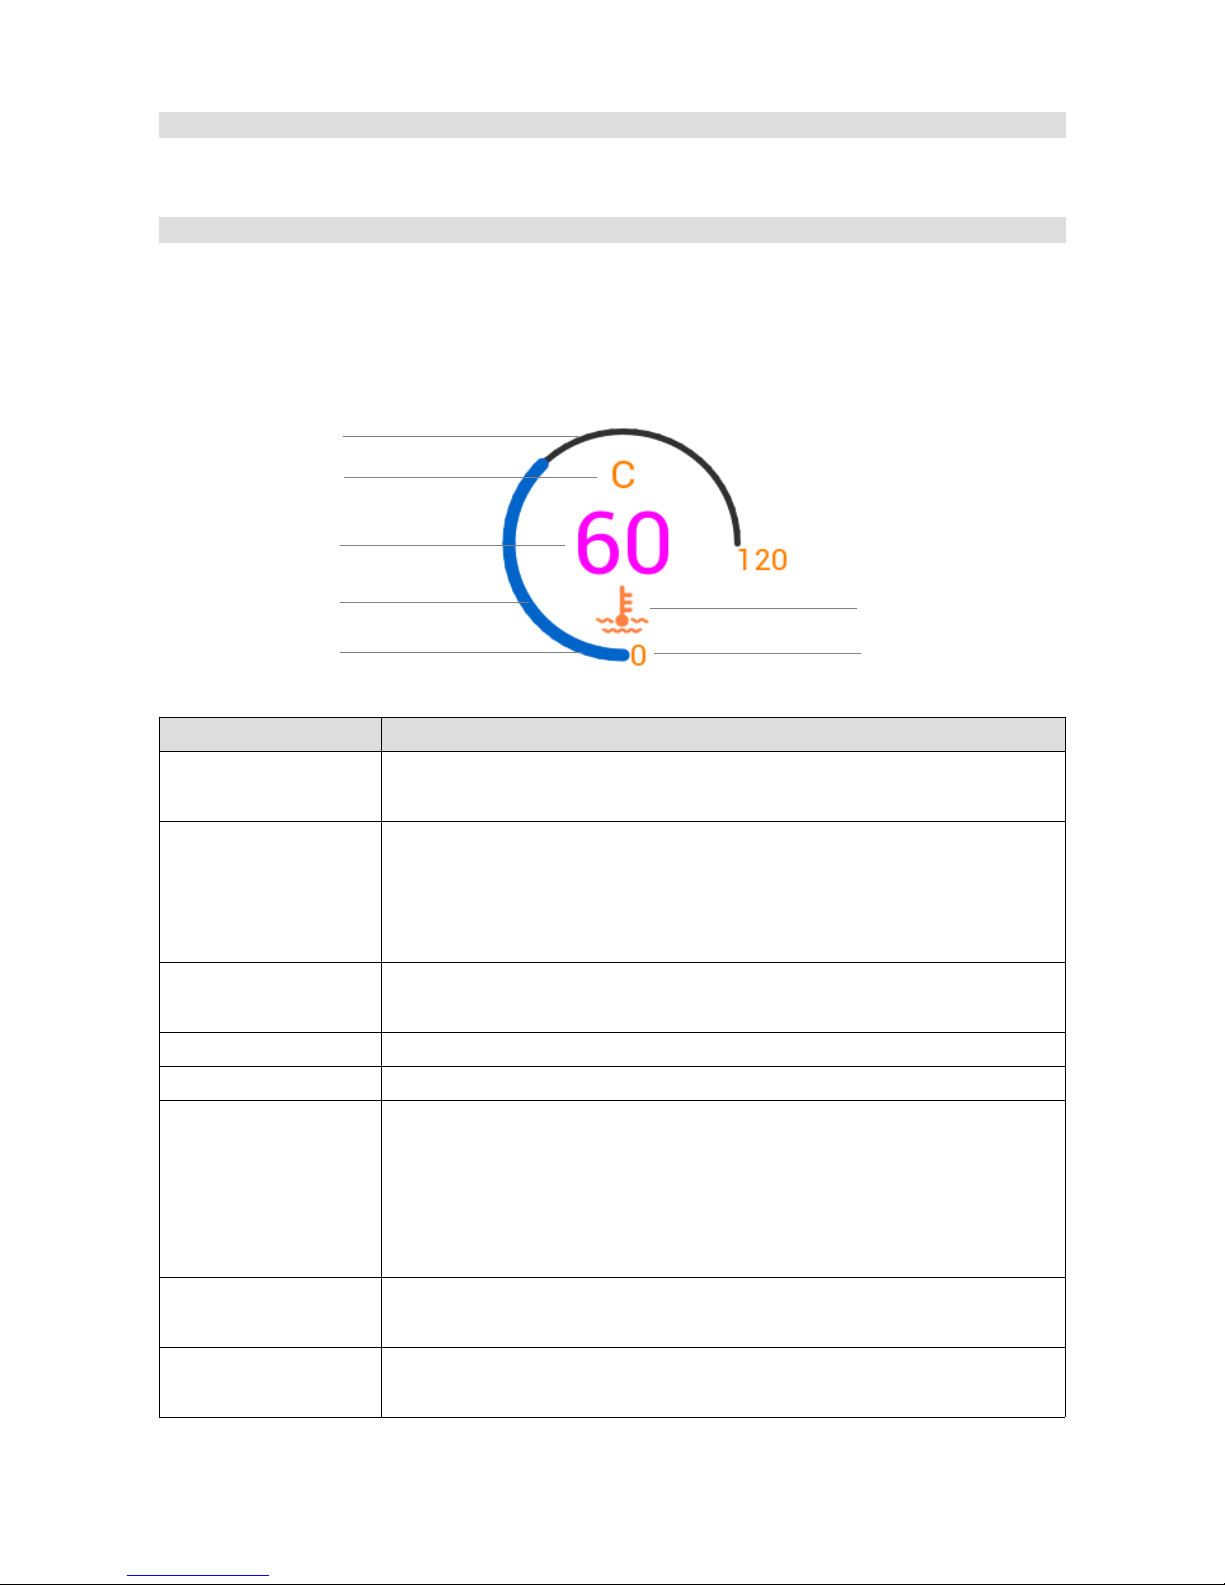
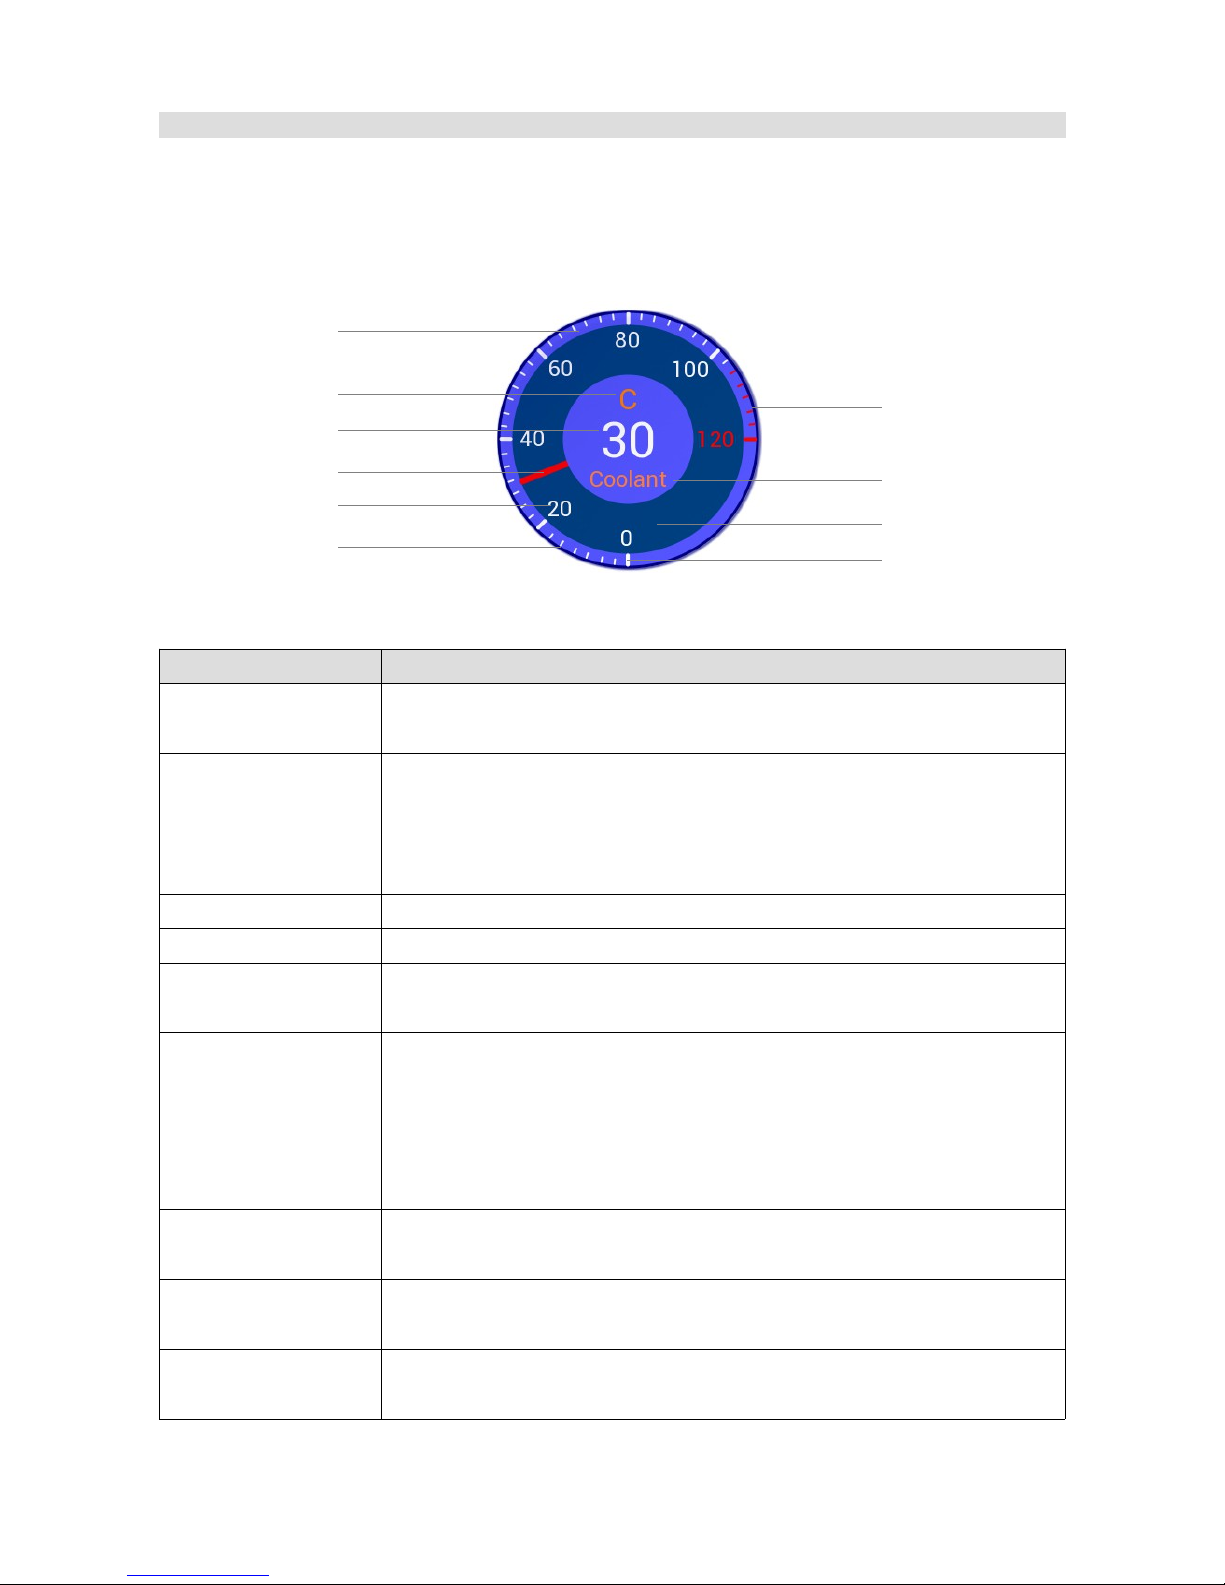
Gauge
Gauge objects display data by means of a circular segment. You may further modify a gauge with
a numerical value, a description, an icon and a unit in which the value is expressed.
Parameter Description
Position X,Y Object position on the page. The reference point is the upper-left corner
of a projected rectangular boundary around the gauge.
Channel Name of a channel or a variable that will be displayed in the Value field
and that will be represented on the gauge. Here you can also enter a
numerical value without a decimal separator to test the operation of the
gauge.
Decimal places The number of decimal places displayed for the Value and Legend
parameters
Min, Max The minimum and maximum value displayed by the indicator
Display value This option allows you to show or hide the displayed Value parameter
Update frequency The update frequency on the Value parameter screen. The screen is
updated 50 times per second (50Hz). Quickly changing variables are
very difficult to read at this frequency. This parameter allows to decrease
the frequency (e.g. to 5Hz), which makes the Value parameter easier to
read.
Display unit This option allows to display a unit (Unit) A unit is displayed above the
Value parameter.
Unit Selection of a unit for displaying a value (e.g. kPa, Bar, Psi). You can
define your own unit in the Custom unit field. To do this, select User in
Page 52/137
Value
Color
Background color
Unit
Line witdh
Icon or Text
Legend
Object
description
Gauge
Page 53
the Unit field.
Custom unit This field is used for entering a user-defined measurement unit. To use it,
select User in the Unit field.
Text Defines the text displayed below the Value parameter.
Use icon This parameter allows you to display an icon instead of text.
Icon texture Allows you to select an icon from the texture menu. You can add a
custom icon (more information about managing textures is provided
further in the manual)
Icon scale The icon size is automatically adapted to the indicator size. You may
change its size using the Icon Scale parameter.
Alarm channel A channel / function to change the indicator colour when its value differs
from 0. The alarm colour is defined in the Alarm Color field.
Radius The indicator diameter in pixels.
Line width The indicator line width in pixels. Decimal values are possible.
Color The indicator line colour
Value color The displayed value colour
Text color The text or icon colour
Unit color The measurement unit colour
Alarm color The colour to which the indicator and the displayed value will change if
the value of the variable used in Alarm channel differs from 0.
Background color The indicator background line colour
Value font The size of the font used for displaying values
Text font The size of the font used for displaying text
Unit font The size of the font used for displaying measurement units
Legend font The size of the legend font
Page 53/137
Page 54
Classic gauge
A Classic gauge allows you to display a numerical value similar to classic car gauges.
A numerical value is displayed in the center, along with a hand on the dial.
Parameter Description
Position X,Y Object position on the page The reference point is the upper-left corner
of a rectangular boundary around the object.
Channel Name of a channel or a variable that will be displayed in the Value field
and that will be represented on the gauge. Here you can also enter a
numerical value without a decimal separator to test the operation of the
gauge.
Decimal places The number of decimal places displayed for Value and Legend
Min, Max The minimum and maximum value displayed by the indicator
Display value This parameter allows you to hide the Value displayed in the gauge
center
Update frequency The update frequency on the Value parameter screen. The screen is
updated 50 times per second (50Hz). Variables that change quickly are
very difficult to read at this frequency. This parameter allows you to
decrease the frequency (e.g. to 5Hz) to make the Value parameter easier
to read.
Display unit This option allows you to display a unit (Unit) A unit is displayed above
the Value parameter.
Unit Selection of a unit to display (e.g. kPa, Bar, Psi). You can define your own
unit in the Custom unit field. To this end, select User in the Unit field.
Custom unit This field is used for entering a user-defined measurement unit. To use it,
select User in the Unit field.
Page 54/137
Value
Highlight
Background color
Unit
Border
Text
Object
description
Classic gauge
Tick
Indicator
Legend
Redline
Page 55
Text Defines the text displayed below the Value parameter.
Use icon This parameter allows to display an icon instead of a text.
Icon texture Allows to select an icon from a texture menu. You can add a custom icon
(more information about managing textures is provided further in the
manual)
Icon scale The icon size is automatically adapted to the indicator size. It is possible
to change its size using the Icon Scale parameter.
Alarm channel A channel / function allowing to change the indicator colour when its
value differs from 0. The alarm colour is defined in the Alarm Color field.
Radius The indicator diameter in pixels.
Border Size The width of the line surrounding the indicator in pixels. Decimal values
are possible.
Highlight percent Indicates the part of the indicator that is to be filled with Highlight color.
0 means that the entire indicator is filled with the Background color
Num ticks This value defines the number of parts into which the indicator area is to
be divided. For each part a respective value and marker in the form of a
section will be displayed.
Num subticks This value defines the number of divisions between the main markers
Indicator width The width of the hand showing the current value
Angle span The range in degrees within which the indicator is to be divided (the
example shows 270 degrees).
Angle offset The initial angle of the first marker (0 in our example)
Color The colour of the value, legend and markers displayed
Border color The indicator frame colour
Highlight color The “highlight” area colour
Indicator color The “hand” colour
Background color The background colour
Text color The text or icon colour
Unit color The measurement unit colour
Alarm color The colour to which the indicator and the displayed value will change if
the value of the variable used in Alarm channel differs from 0.
Tick font The size of the font used for displaying the legend
Value font The size of the font used for displaying the size of the font used for
displaying values
Text font The size of the font used for displaying the text
Unit font The size of the font used for displaying the measurement units
Redline when The condition for displaying the indicator in the “redline” mode.
Page 55/137
Page 56
Never - never display in the “redline” mode,
When value above – display the bar in Redline color when the Value
parameter is greater than the Redline start value,
When value below – display the bar in Redline color when the Value
parameter is lower than the Redline start value
Redline start This parameter defines the value for a condition defined by the Redline
when parameter
Page 56/137
Page 57
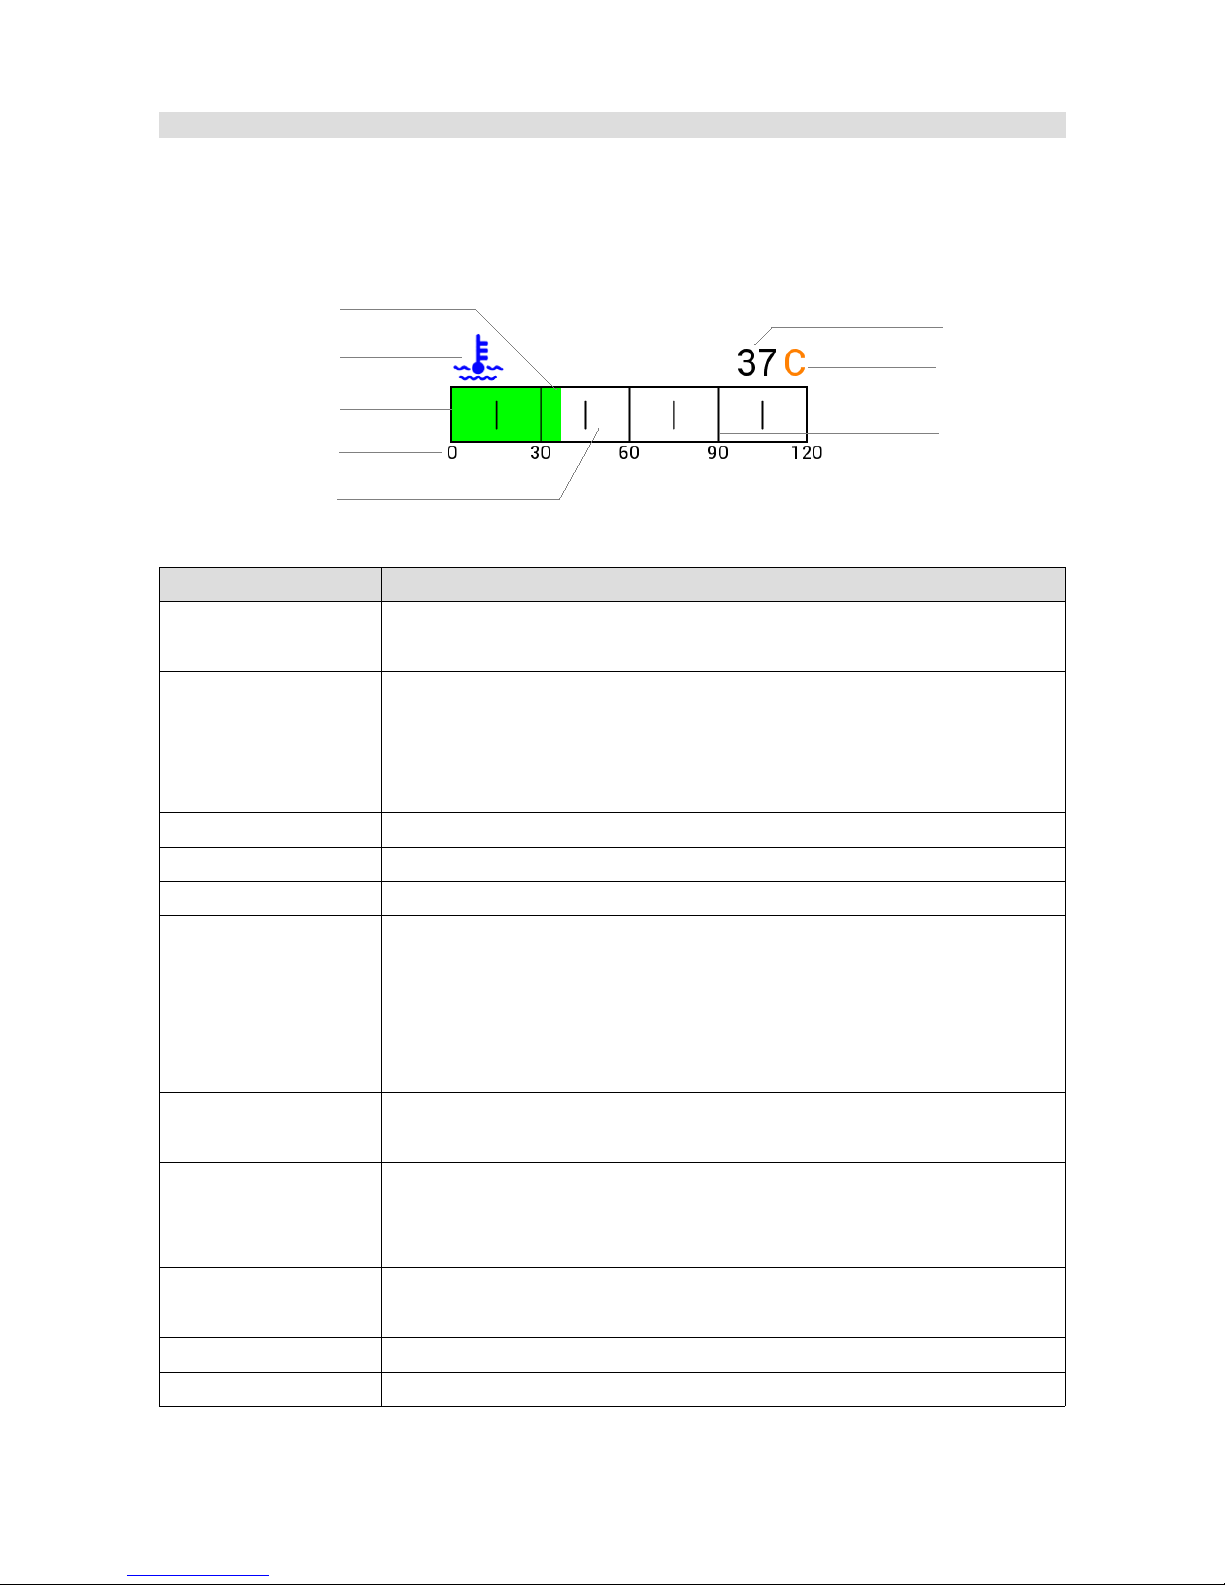
Bar graph
This indicator allows to display values in the form of a moving bar (horizontal or vertical). It is also
possible to display an icon symbolising the measured value.
Parameter Description
Position X,Y Object position on the page The reference point is the upper-left corner
of a rectangle around the object.
Channel Name of a channel or a variable that will be displayed in the Value field
and that will be represented on the gauge. Here you can also enter a
numerical value without a decimal separator to test the operation of the
gauge.
Decimal places The number of decimal places displayed for Value and Legend
Min, Max The minimum and maximum value displayed by the indicator
Display value This parameter allows to hide the Value displayed
Update frequency The update frequency on the Value para meter screen. The screen is
updated 50 times per second (50Hz). Quickly changing variables are very
difficult to read at this frequency. This parameter allows to decrease the
frequency (e.g. to 5Hz), which makes the Value parameter easier to
read.
Display unit This option allows to display a unit (Unit) A unit is displayed above the
Value parameter.
Unit Selection of a unit for displaying a value (e.g. kPa, Bar, Psi). You can
define your own unit in the Custom unit field. To this end, select User in
the Unit field.
Custom unit This field is used for entering a user-defined measurement unit. To use it,
select User in the Unit field.
Text Defines the text (description) displayed along the indicator.
Use icon This parameter allows to display an icon instead of a text.
Page 57/137
Value
Background
Unit
Border
Icon/text
Object
description
Bar graph
Tick
Bar
Legend
Page 58
Icon texture Allows to select an icon from a texture menu. You can add a custom icon
(more information about managing textures is provided further in the
manual)
Icon scale The icon size is automatically adapted to the indicator size. It is possible
to change its size by means of the Icon Scale parameter.
Alarm channel A channel / function that changes the indicator colour when its value
differs from 0. The alarm colour is defined in the Alarm Color field.
Bar type Indicator type Horizontal, Vertical
Bar style The graphical presentation of the bar
Length Indicator length in pixels
Width Indicator width in pixels
Border width The width of the line surrounding the indicator in pixels
Num ticks This value defines the number of parts into which the indicator area is to
be divided. For each part a respective value and marker will be displayed.
An additional section is drawn automatically between the markers.
Decimal places for
tick
This value defines the number of decimal places drawn for the indicator
description
Color The indicator frame colour
Background color The indicator background colour
Bar color The indicator bar colour
Redline color The indicator bar colour when the displayed value meets the Redline
condition
Icon color Icon colour
Value color The displayed value colour
Text color The text or icon colour
Unit color The measurement unit colour
Alarm color The colour to which the indicator will change if the value of the variable
used in Alarm channel differs from 0.
Transparent Decides if the indicator background is to be displayed
Tick font The size of the font used for displaying the legend
Value font The size of the font used for displaying the size of the font used for
displaying values
Text font The size of the font used for displaying the text
Unit font The size of the font used for displaying the measurement units
Redline when The condition for displaying the indicator in the “redline” mode.
Never - never display in the “redline” mode,
When value above – display the bar in Redline color when the Value
Page 58/137
Page 59
parameter is greater than the Redline start value,
When value below – displays the bar in Redline color when the Value
parameter is lower than Redline start
Redline start This parameter defines the value for a condition defined by the Redline
when parameter
Page 59/137
Page 60
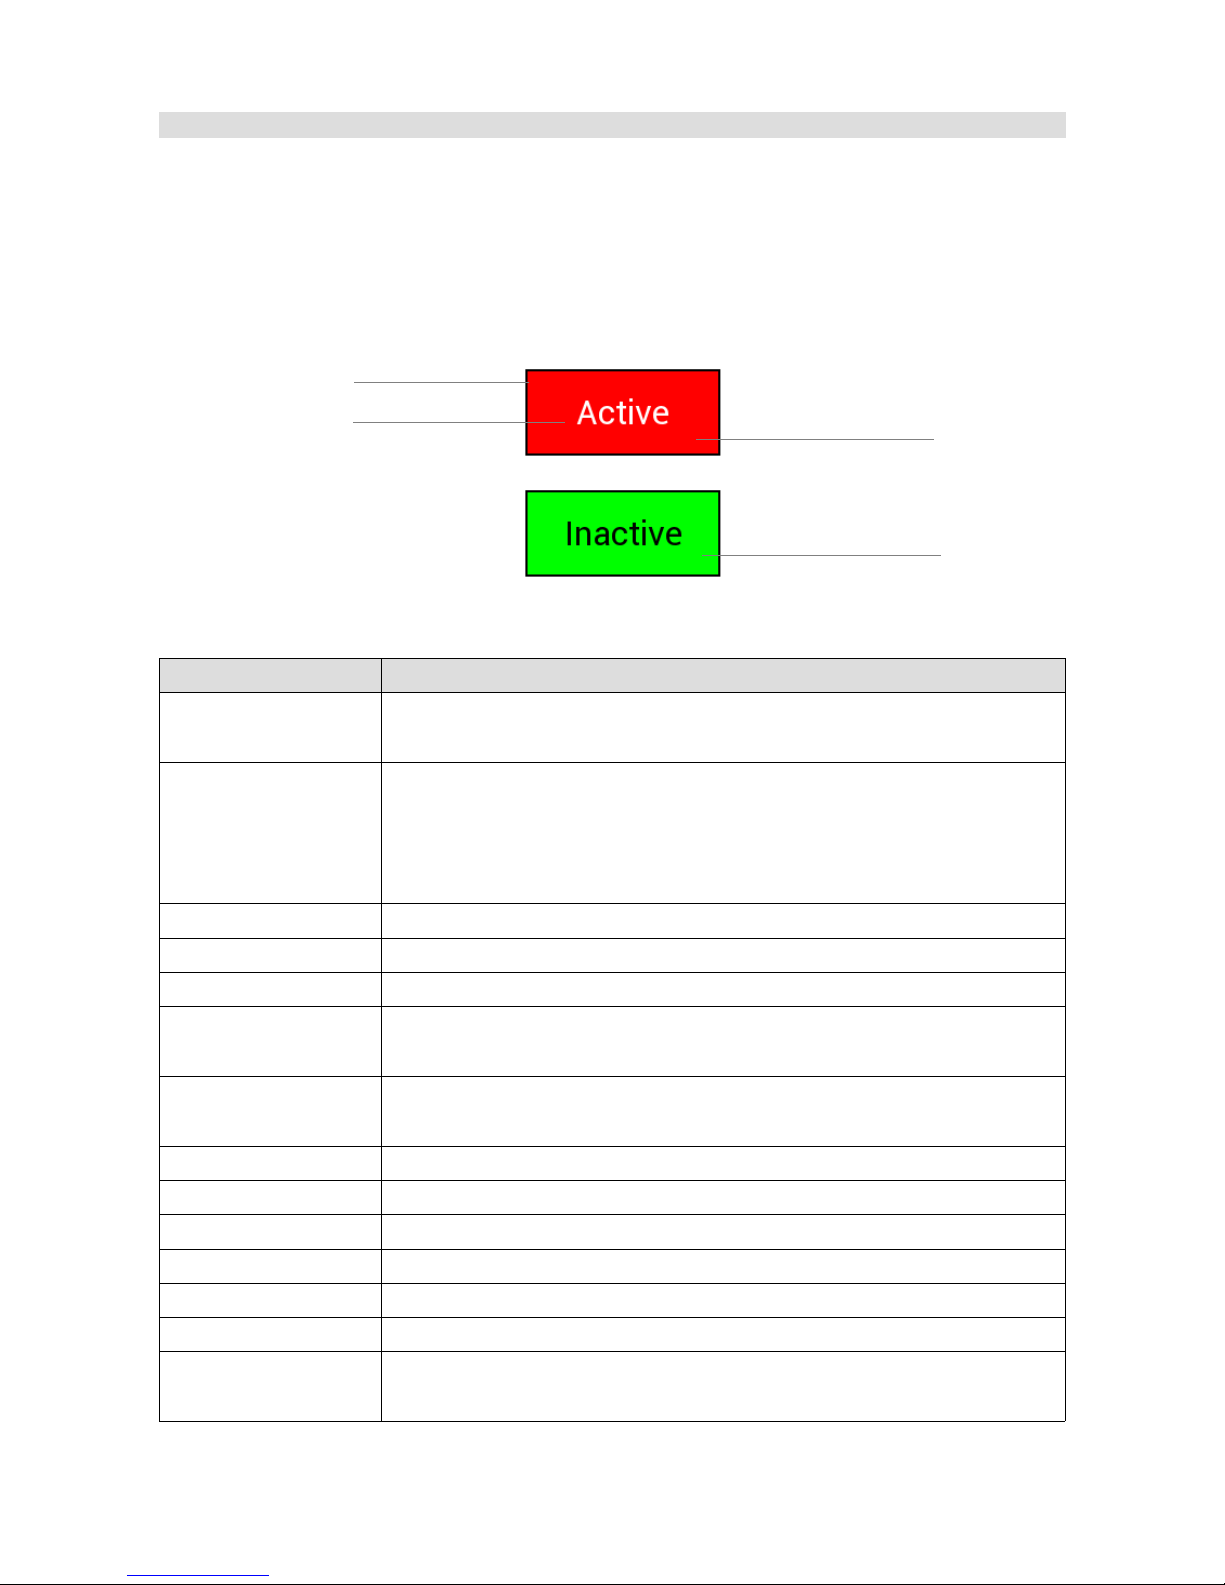
Simple indicator
This indicator shows the current state of the assigned function (e.g. ALS). You may show two
different texts in two different background colours depending on the state of the function assigned
in the Channel active field
Parameter Description
Position X,Y Object position on the page The reference point is the upper-left corner
of a rectangle around the object.
Channel Name of a channel or a variable that will be displayed in the Value field
and that will be represented on the gauge. You may also enter a
numerical value without a decimal separator to test the operation of the
gauge.
Width Indicator width in pixels
Height Indicator height in pixels
Border width The width of the line surrounding the indicator in pixels
Background color
default
Inactive indicator background colour
Background color
active
Active indicator background colour
Default text color The colour of the text displayed by the indicator when inactive
Active text color The colour of the text displayed by the indicator when inactive
Border color The indicator frame colour
Text The text displayed by the indicator when inactive
Active text The text displayed by the indicator when active
Text font The size of the font used for displaying the text
Channel active Channel/function/variable defining if the indicator is to be displayed in the
inactive mode (0) or active mode (a value different from zero)
Page 60/137
Border
Active text
Object
description
Simple indicator
Active
Active background
Inactive
Inactive background
Page 61
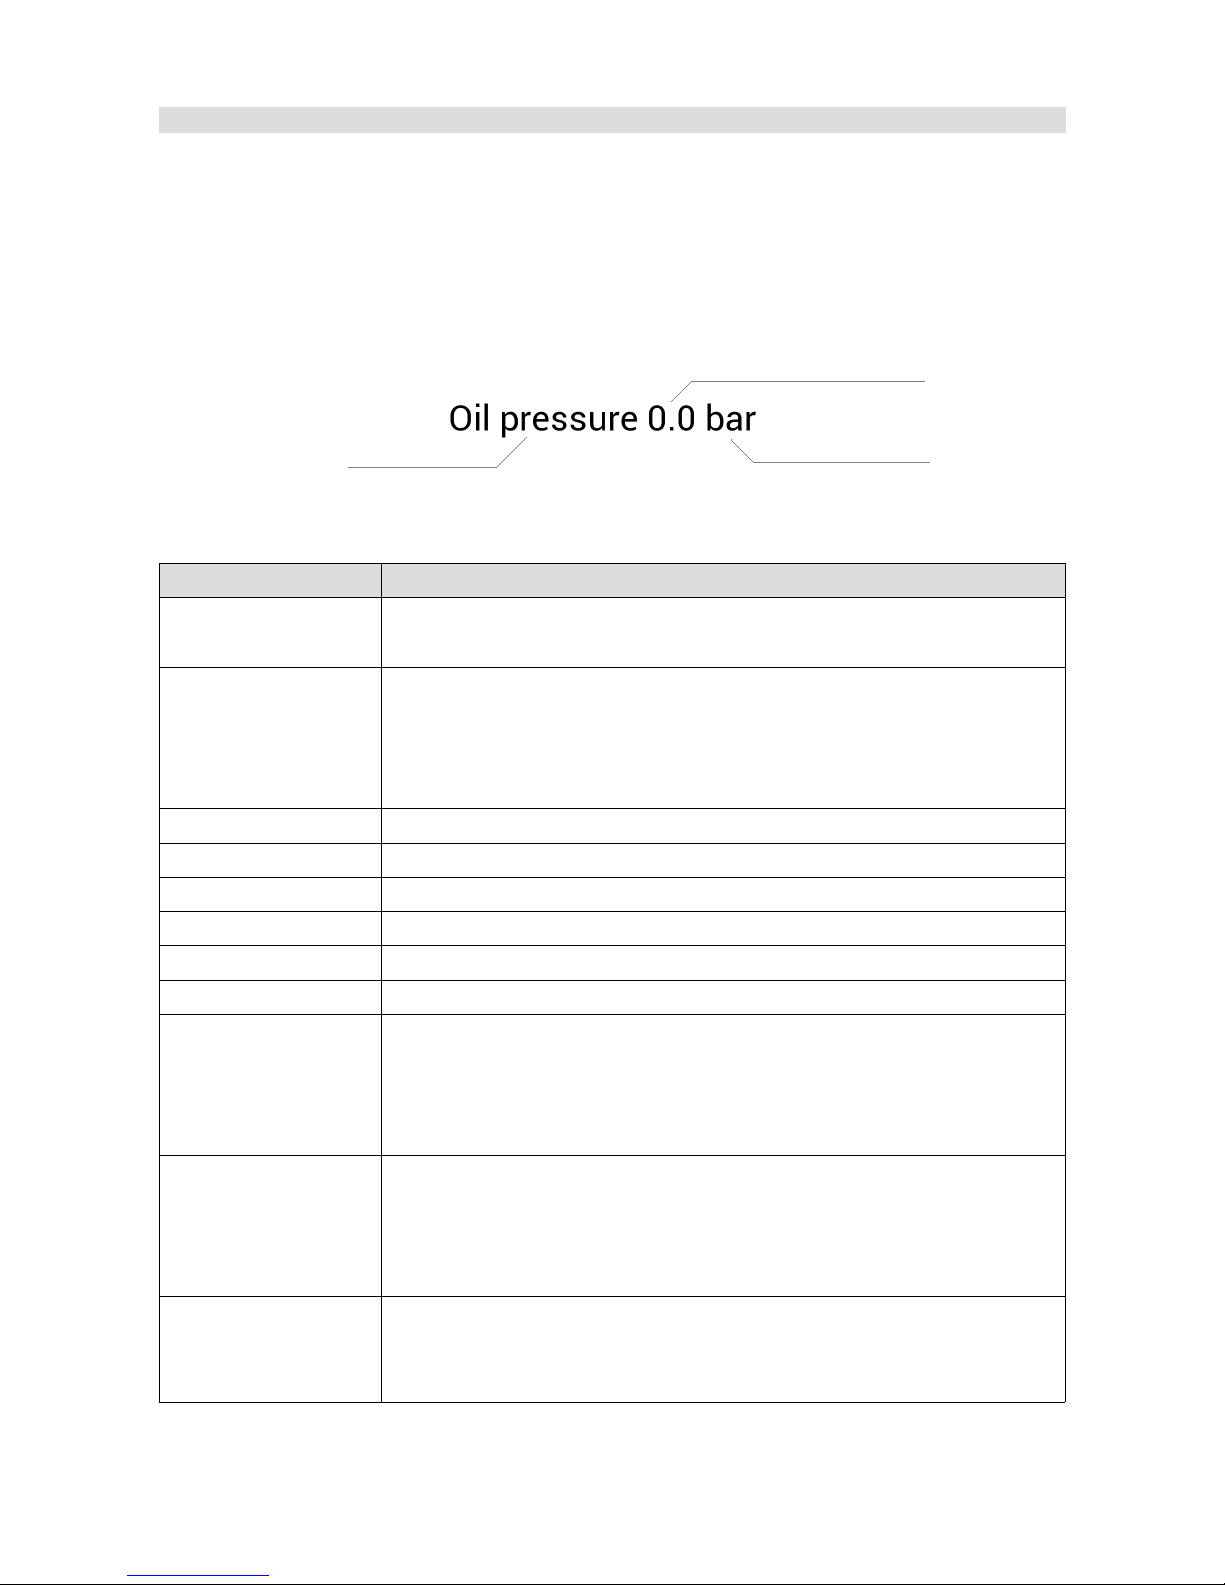
Text
This indicator allows you to display text with data from a log channel or function, along with a
measurement unit. The user can also hide the object using a function or a log channel.
Parameter Description
Position X,Y Object position on the page The reference point is the upper-left corner
of a rectangle around the object.
Channel Name of a channel or a variable that will be displayed in the Value field
and that will be represented on the gauge. Here you can also enter a
numerical value without a decimal separator to test the operation of the
gauge.
Color Displayed text colour
Font Displayed font size
Italic Activates the italic mode
Two lines Displays channel value in separate line
Second line font Font size for secont text line
Text A field containing the displayed text
Text width The area width used by the Text align functions. For example, by
entering 800 (screen width), setting the position X as 0 and selecting
appropriate alignment, you can display the text to the left side of the
screen, in the centre of the screen and to the right side of the screen.
Text align Defines text alignment in the Text width area.
Left – aligning the text to the left
Center – center alignment,
Right – aligning the text to the right
Channel Name of a channel or a variable that will be displayed in the Value field
and that will be represented on the gauge. Here you can also enter a
numerical value without a decimal separator to test the operation of the
Page 61/137
Value
Text
Object
description
Text
Unit
Inactive
Page 62
gauge.
Value source Determines the value that is to be displayed for the selected channel:
Current – the current channel value
Min value- the minimum registered value
Max value- the maximum registered value
Decimal places The number of decimal places displayed for the Value parameter
Value width The width of the area of the displayed value used by the Value align
function.
Value align Defines text alignment in the Value width area.
Left – aligning the text to the left
Center – centre alignment,
Right – aligning the text to the right
Display unit This option allows you to display a unit (Unit) A unit is displayed above
the Value parameter.
Unit Selection of a unit for displaying a value (e.g. kPa, Bar, Psi). You can
define your own unit in the Custom unit field. To do this, select User in
the Unit field.
Custom unit This field is used for entering a user-defined measurement unit. To use it,
select User in the Unit field.
Visibility channel Name of the channel or variable that will control the text visibility. 0
means that the text will be hidden, a value different from zero or no
assigned channel means that the text is visible.
Update frequency The update frequency on the Value parameter screen. The screen is
updated 50 times per seconds (50Hz). Variables that change quickly are
very difficult to read at this frequency. This parameter allows you to
decrease the frequency (e.g. to 5Hz), which makes the Value parameter
easier to read.
Page 62/137
Page 63
Time
This indicator allows you to display the built-in timers of the device, such as Real Time, Lap Time,
Best lap time etc.
Parameter Description
Position X,Y Object position on the page The reference point is the upper-left corner
of a rectangle around the object
Color The text colour displayed
Font The font size displayed
Time source RTC – the device internal clock time. To set the RTC clock select the
Devices/Set real time clock from the application menu
Current lap - the current lap time
Last lap - the last lap time
Best lap – the best lap time
Session time – an internal clock measuring the current session time. You
can reset it using the external button
Predictive time – predicted lap time based on the best lap time on a
given track. It requires using a GPS module
Visibility channel Name of the channel or variable that will control the text visibility.
0 means that the text will be hidden, a value different from zero or no
assigned channel means that the text is visible.
Page 63/137
Page 64
Image
This object allows you to display a texture (image) or an icon on the screen. You may scale it,
choose the colour, mirror and tile. In addition to the textures contained in the device memory, you
can upload your own textures / icons.
Parameter Description
Position X,Y Object position on the page The reference point is the upper-left corner of
a rectangle around the object.
Default color Displayed text colour
Function color Displayed font size
Texture Allows you to select a texture and an icon that will be displayed
Repeat mode Texture repetition mode.
Stretch – allows you to stretch the texture out (the scale parameter)
Tile X – repeats a texture along the X axis
Tile Y – repeats a texture along the Y axis
Tile X,Y – repeats a texture along the Y axis
In the case to the Tile modes, in order to duplicate a texture enter 200%
in the Scale parameter, 400 % in order to quadruplicate it, etc.
Scale This parameter determines the scale of a texture or the number of its
copies for the Tile modes.
Mirror X/Y It allows you to mirror image along the X and/or Y axis.
Mode Texture drawing mode. In the Screen mode a texture is displayed by
means of adding it to the current image. In the Normal mode a texture
overwrites the current image, referencing the alpha channel (alpha
channel is an image property defining transparency). You will find more
information regarding textures further in the manual.
Color channel Name of the channel or variable that will control the colour of the texture
displayed. If the channel / function value is equal to 0, the colour defined
in the Default color field is used. Otherwise the Function color will be
used.
Visibility channel Name of the channel or variable that will control the text visibility.
0 means that the text will be hidden, a value different from zero or no
assigned channel means that the text is visible.
Page 64/137
Page 65
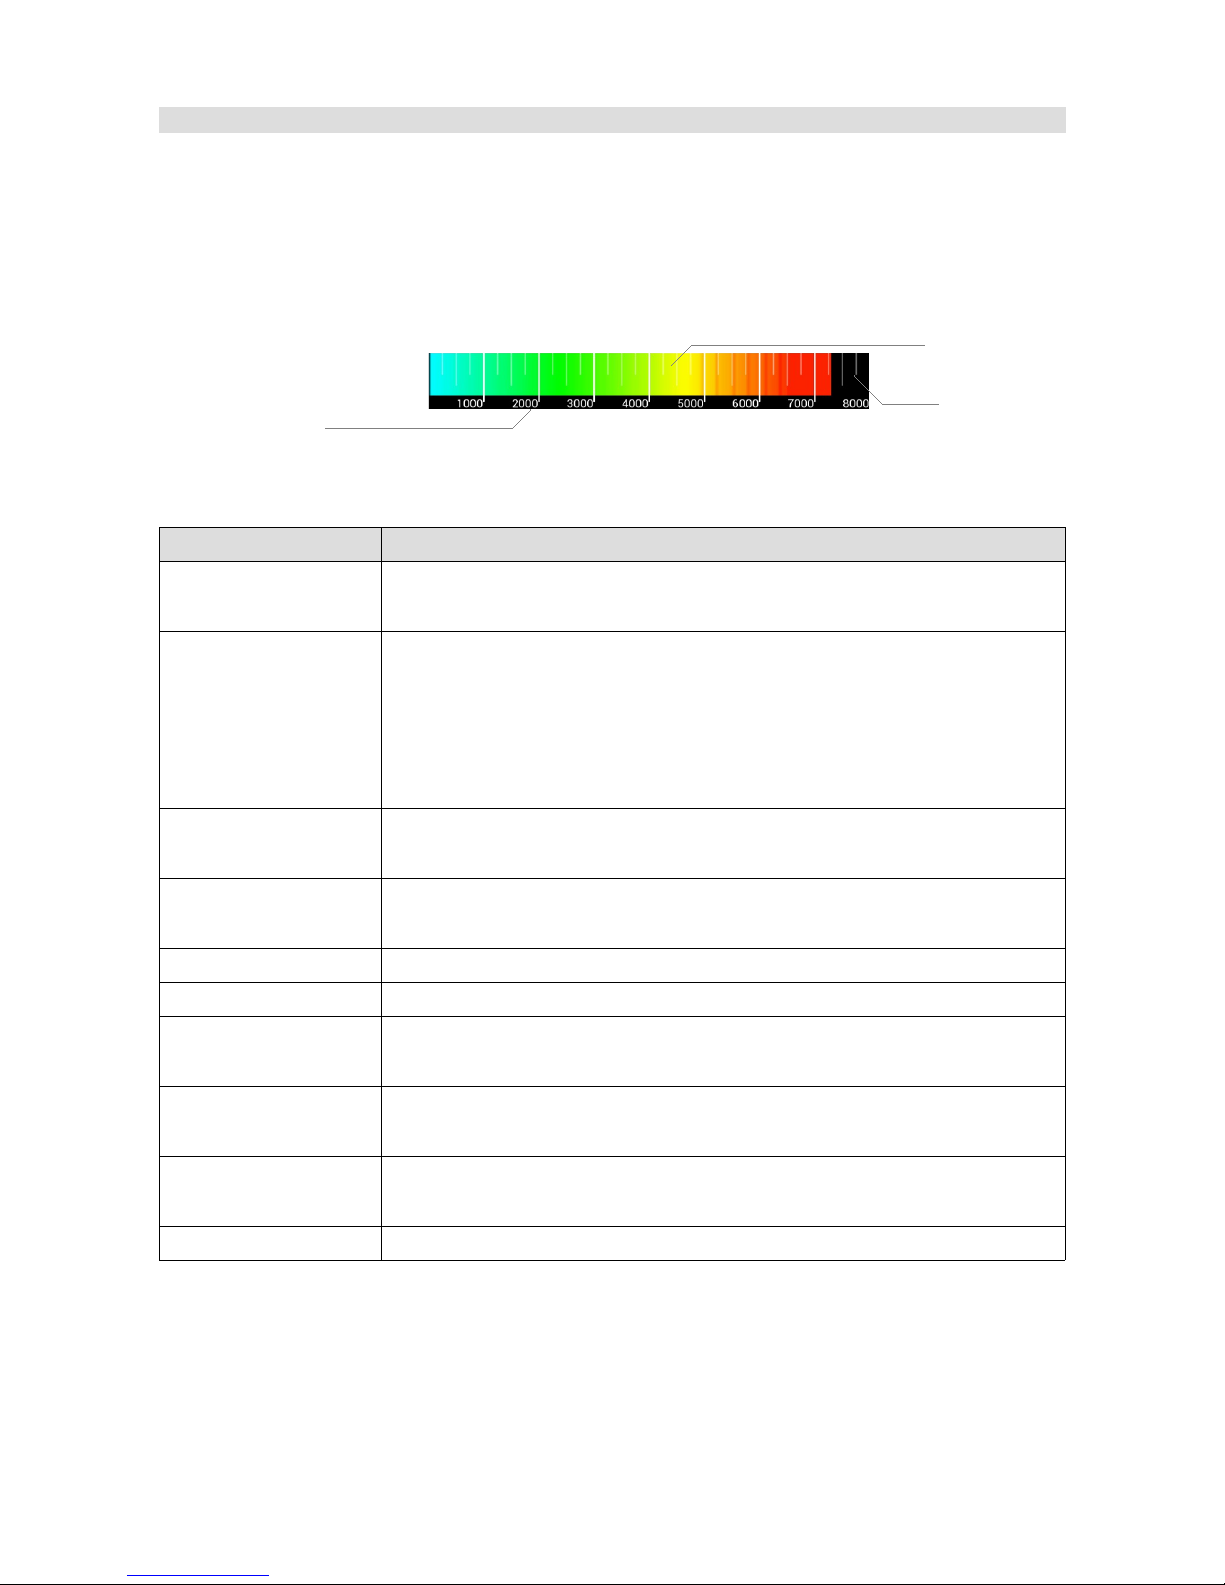
RPM Bar
This object allows you to display the engine speed in the form of a horizontal bar or a round
indicator.
Parameter Description
Position X,Y Object position on the page The reference point is the upper-left corner
of a rectangle around the object.
Type The type of engine speed indicator displayed:
Classic bar – displayed in the form of a “curved” bar
Bar – displayed in the form of a horizontal bar (as shown in the above
visualisation)
Round – displayed in the form of a round gauge
Color When using the Classic bar, this determines the colour of the bar
indicating the engine speed.
Color redline When using the Classic bar, this determines the colour of the indicator
bar above the Redline start value
Redline start A value specifying the beginning of the engine speed limit area .
Max rpm The maximum engine speed value displayed on the indicator
Color preset When using a Bar type indicator, this determines the colour gradient that
will be used for
RPM x 1000 When using a Bar type indicator, this determines whether the engine
speed is displayed in the legend in full or divided by one thousand
Display ticks When using a Bar type indicator, this determines if additional division
lines (Ticks) are to be displayed
Channel RPM A channel or a function containing the current engine speed
Page 65/137
RPM indicator
Object
description
RPM bar
Ticks
Inactive
Legend
Page 66
Gear indicator
This object displays the currently selected gear. This indicator is unique in that it has a specially
prepared, bigger font containing numbers and R marks (Reverse) and N marks (Neutral). The
value of a displayed gear is -1 for the reverse gear, 0 for the neutral gear, 1 for the first gear, etc.,
respectively.
Parameter Description
Position X,Y Object position on the page The reference point is the upper-left corner
of a rectangle around the object.
Color Displays gear colour
Font Displays font size (maximum size is 15)
Value channel A channel or a function containing the currently selected gear
Page 66/137
Current gear
Object
description
Gear indicator
Page 67
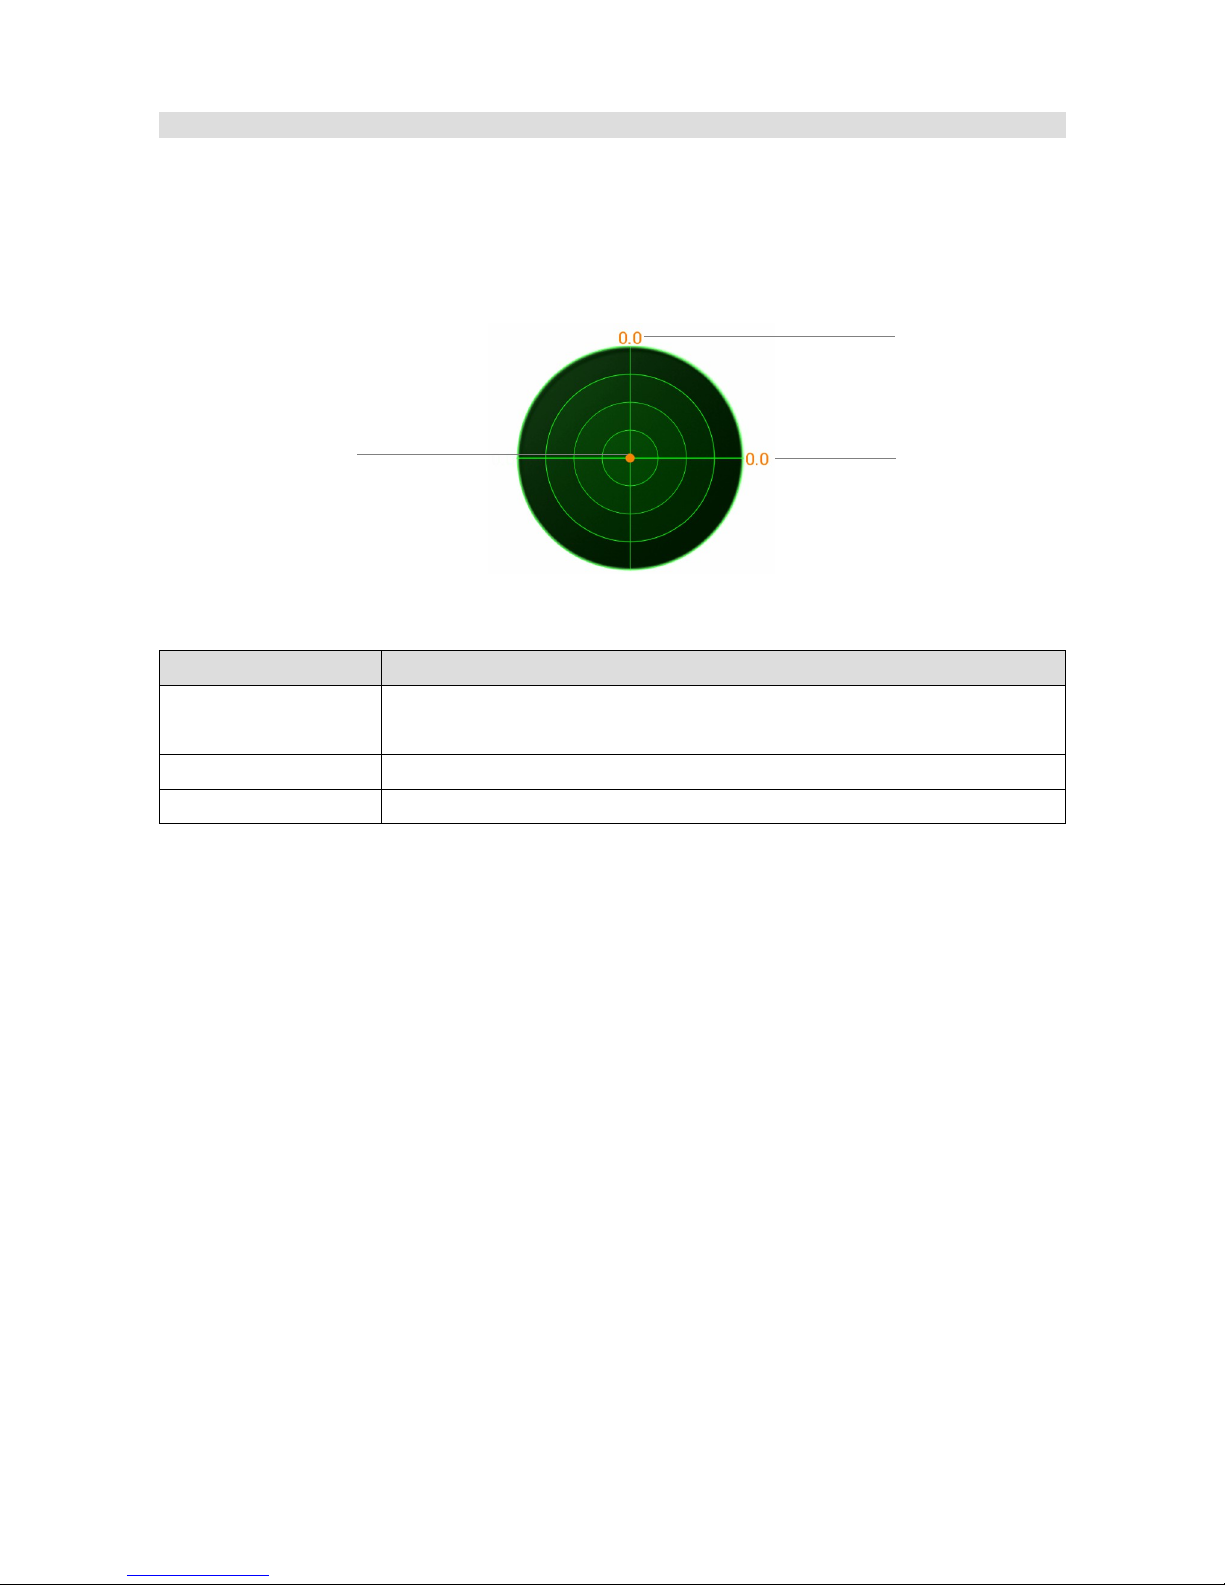
G-Force
The G-Force object indicates the current G-force acting on the vehicle by means of an
accelerometer built into the display The accelerometer requires calibration after installing the
device.
Parameter Description
Position X,Y Object position on the page The reference point is the upper-left corner
of a rectangle around the object.
Color Displays gear colour
Size Indicator diameter
Page 67/137
Object
description
G-Force
G-Force indicator
Lateral-g
Longitudinal-g
Page 68
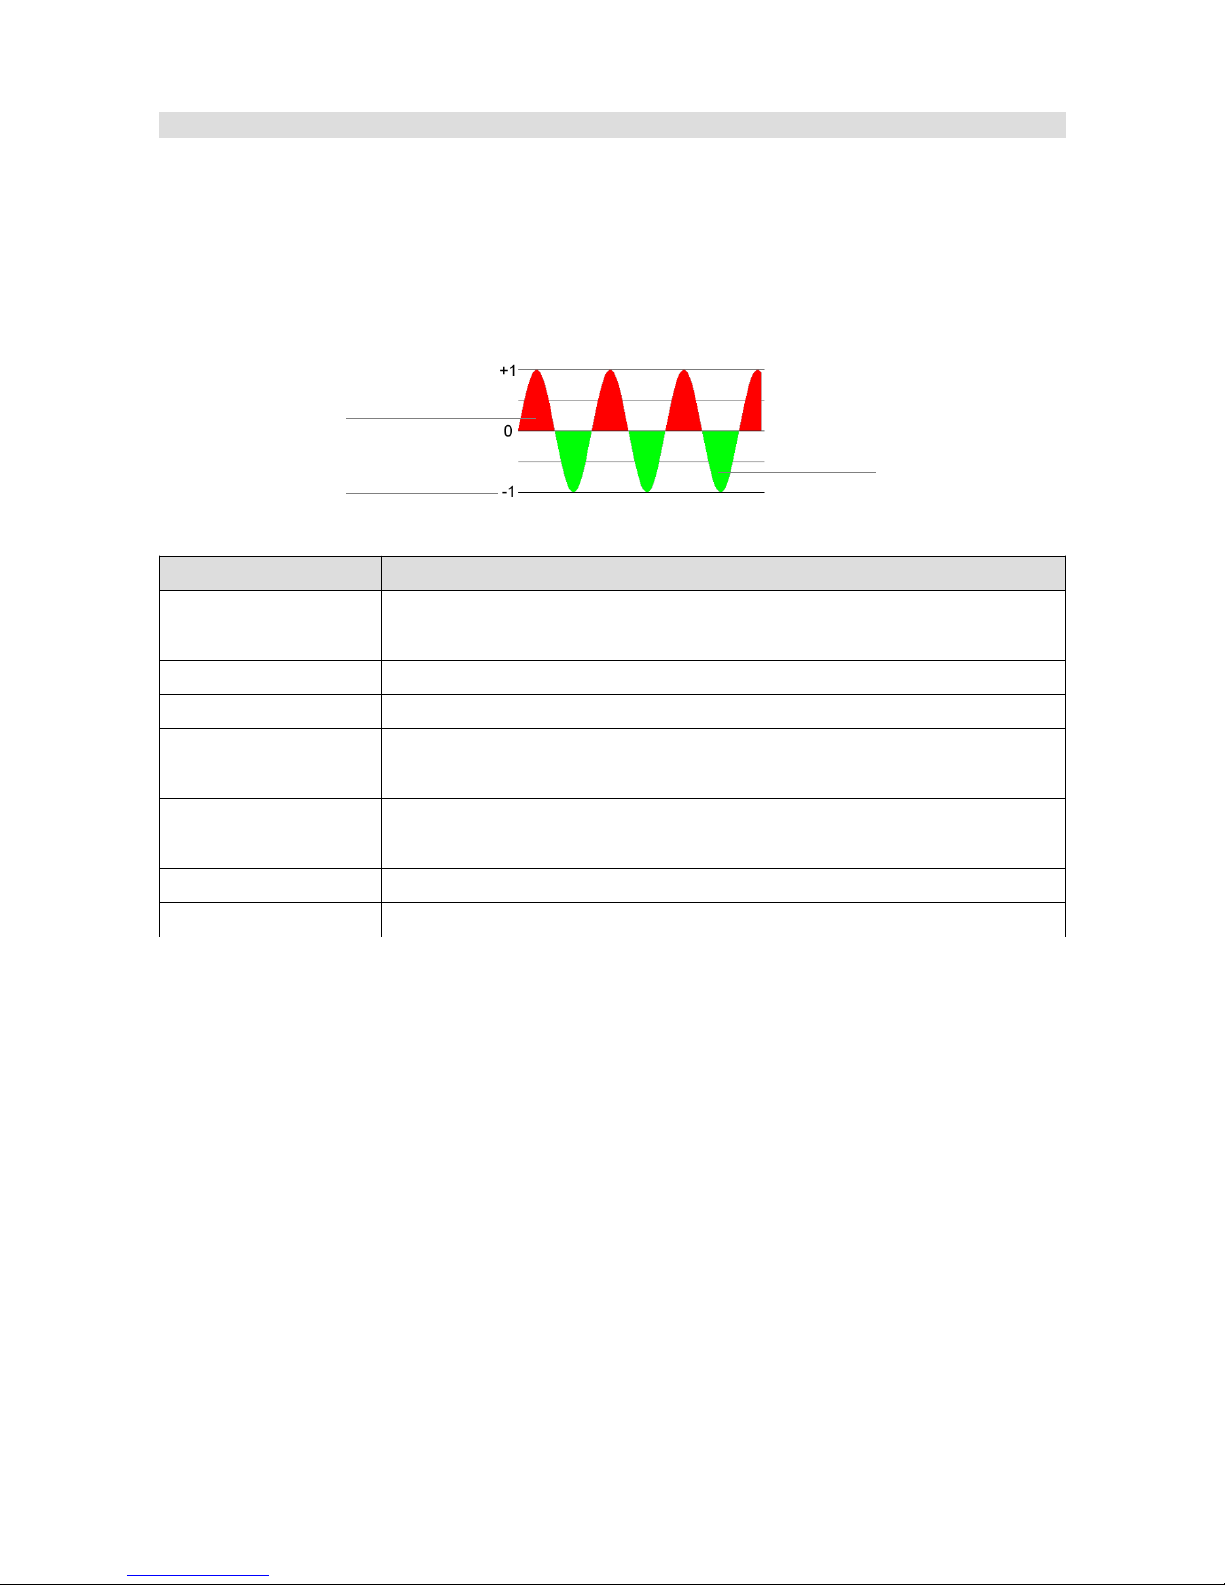
Predictive time graph
The Predictive time graph object indicates the time difference between the best reference lap and
the current position on the track. This object requires a GPS module and a correct configuration of
the racing track.
Parameter Description
Position X,Y Object position on the page The reference point is the upper-left corner
of a rectangle around the object.
Width Object width
Height Object height
Gain color The colour of the graph when the current time is faster than the reference
time
Loss color The colour of the graph when the current time is slower than the
reference time
Lines color The graph line colour
Font size The font size
Page 68/137
Loss
Object
description
Predictive
time graph
Gain
Legend
Page 69
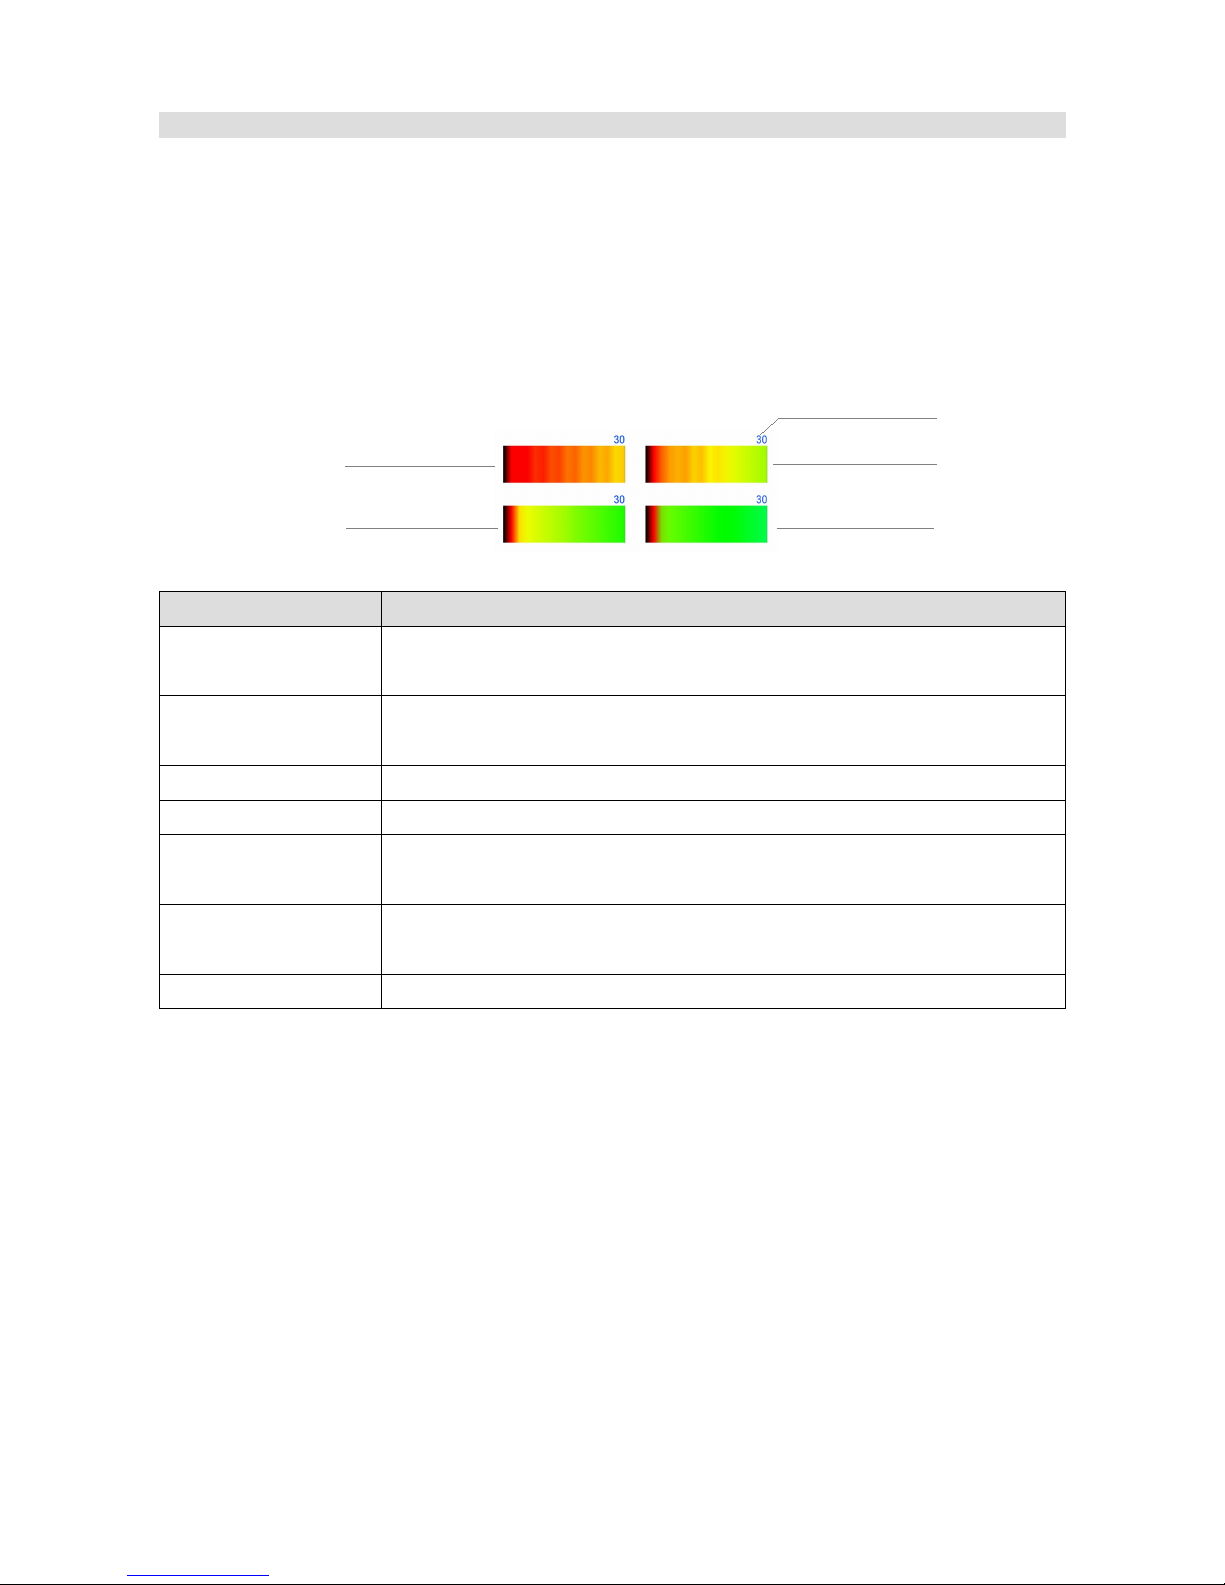
Tire temperature graph
The Tire temperature graph object displays the tire temperature gradient from thermal imaging
cameras. The tire temperature can be presented as gradients or tires. Configuration of the
measurement range of the cameras can be found in: ADU/Configuration/Tire temperature
cameras
Parameter Description
Position X,Y Object position on the page The reference point is the upper-left corner
of a rectangle around the object.
Style Tires – temperature displayed as tires
Bar – temperature displayed as gradients
Width Object width (available only for the Bar style)
Height Object height (available only for the Bar style)
Spacing X The distance on the horizontal axis between gradients representing tires
(available only for the Bar style)
Spacing Y The distance on the vertical axis between gradients representing tires
(available only for the Bar style)
Scale Object size (available only for the Tires style)
Page 69/137
Front left tire
Object description
Tire temperature
graph
Rear right tire
Rear left tire
Front right tire
Max temperature
Page 70
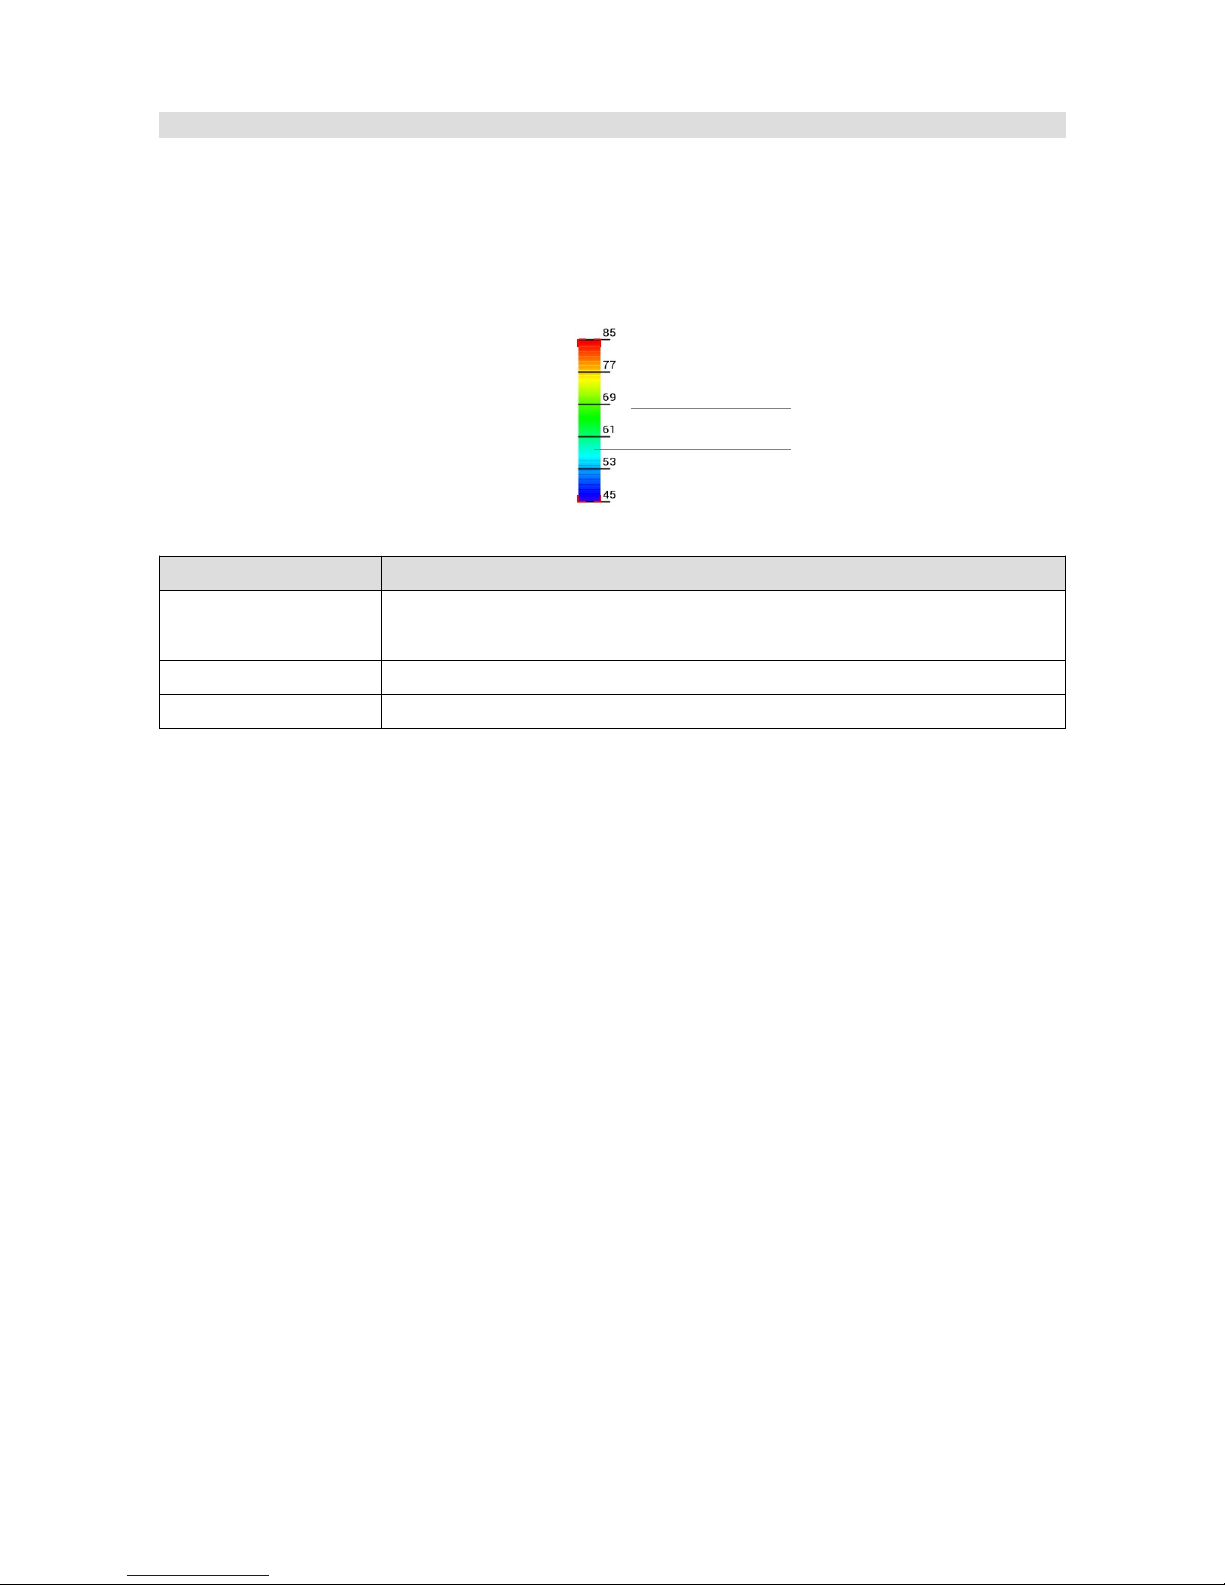
Tire temperature gradient
The Tire temperature gradient displays the temperature gradient and the temperature values
assigned to a given colour. Configuration of the measurement range of the cameras is in the
ADU/Configuration/Tire temperature cameras panel.
Parameter Description
Position X,Y Object position on the page The reference point is the upper-left corner
of a rectangle around the object.
Scale Defines the gradient size
Legend color Defines the description colour
Page 70/137
Object description
Tire temperature
gradient
Temp. gradient
Legend
Page 71
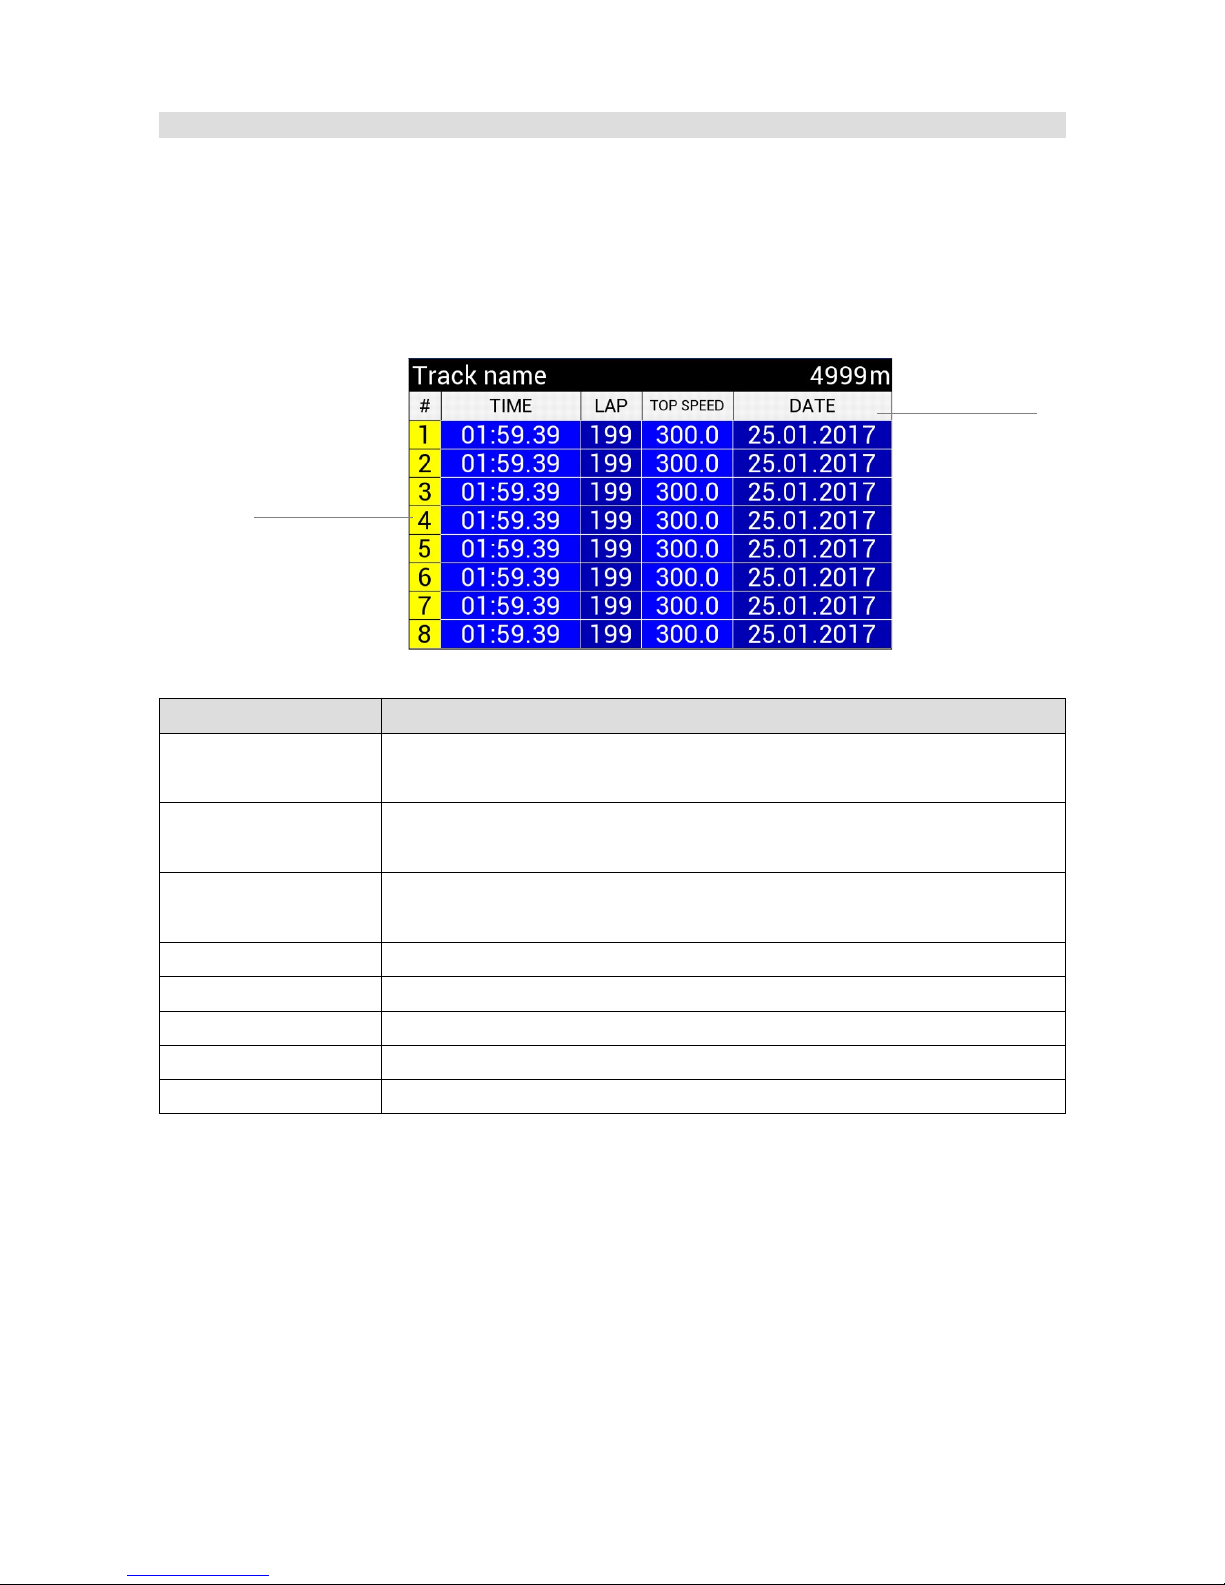
Track record table
The Track record table object allows to display the 8 best times for a given racing track. A track is
recognized by means of GPS position. You will find more information regarding GPS further in the
manual.
Parameter Description
Position X,Y Object position on the page The reference point is the upper-left corner
of a rectangle around the object.
First column bkgrd
color
The first column background colour
First column Text
color
The first column text colour
Table bkgrd color 1 The background colour for odd columns
Table bkgrd color 2 The background colour for even columns
Table text The table text colour
First row bkgrd color The first row background colour
First row tekst color The first row text colour
Page 71/137
Object description
Track record
table
First column
First row
Page 72
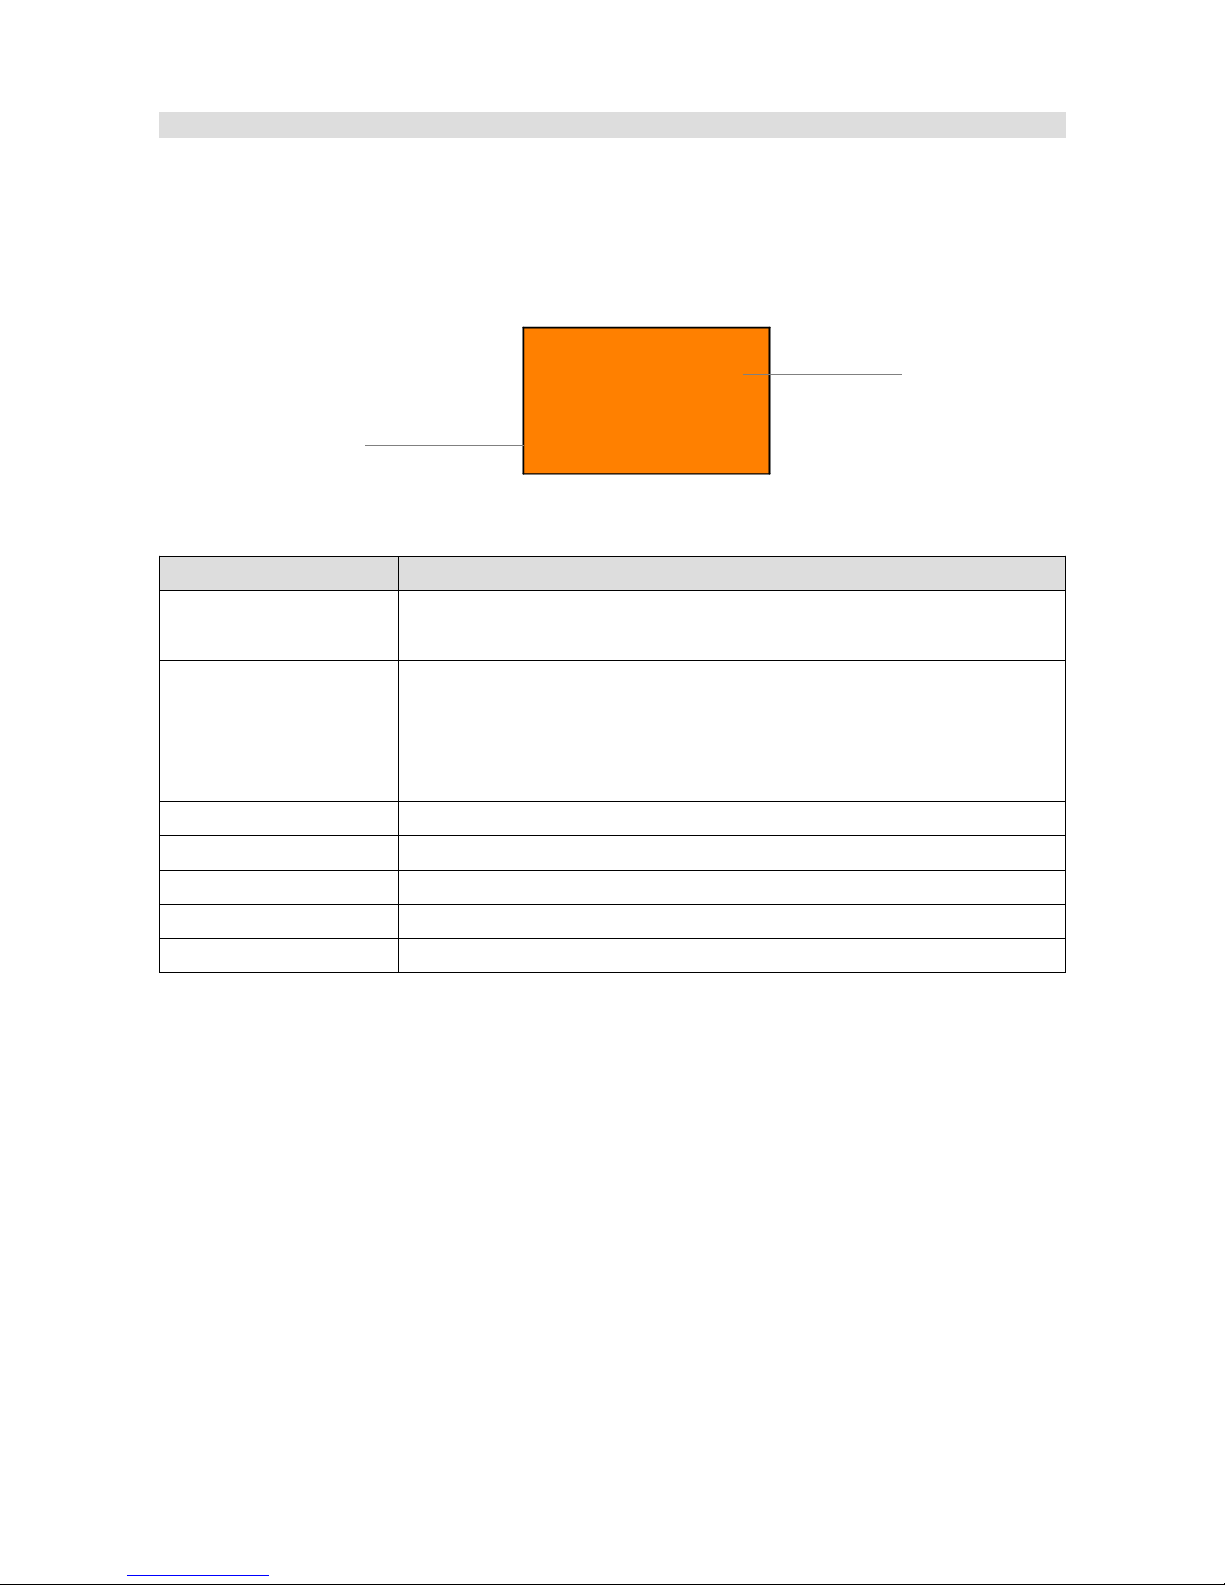
Rectangle
The Rectangle object allows you to draw a rectangle on the page. You may define the width of the
frame line and the fill colour.
Parameter Description
Position X,Y Object position on the page. The reference point is the upper-left
corner.
Rectangle type The type rectangle displayed.
Border – displays only the rectangle frame,
Border + fill – displays the frame and its filling (fill)
Only fill - displays only the fill (fill)
Color The frame colour
Fill color The fill colour
Width The rectangle width
Height The rectangle height
Thickness The width of the frame in pixels
Page 72/137
Object description
Rectangle
Border
Fill
Page 73
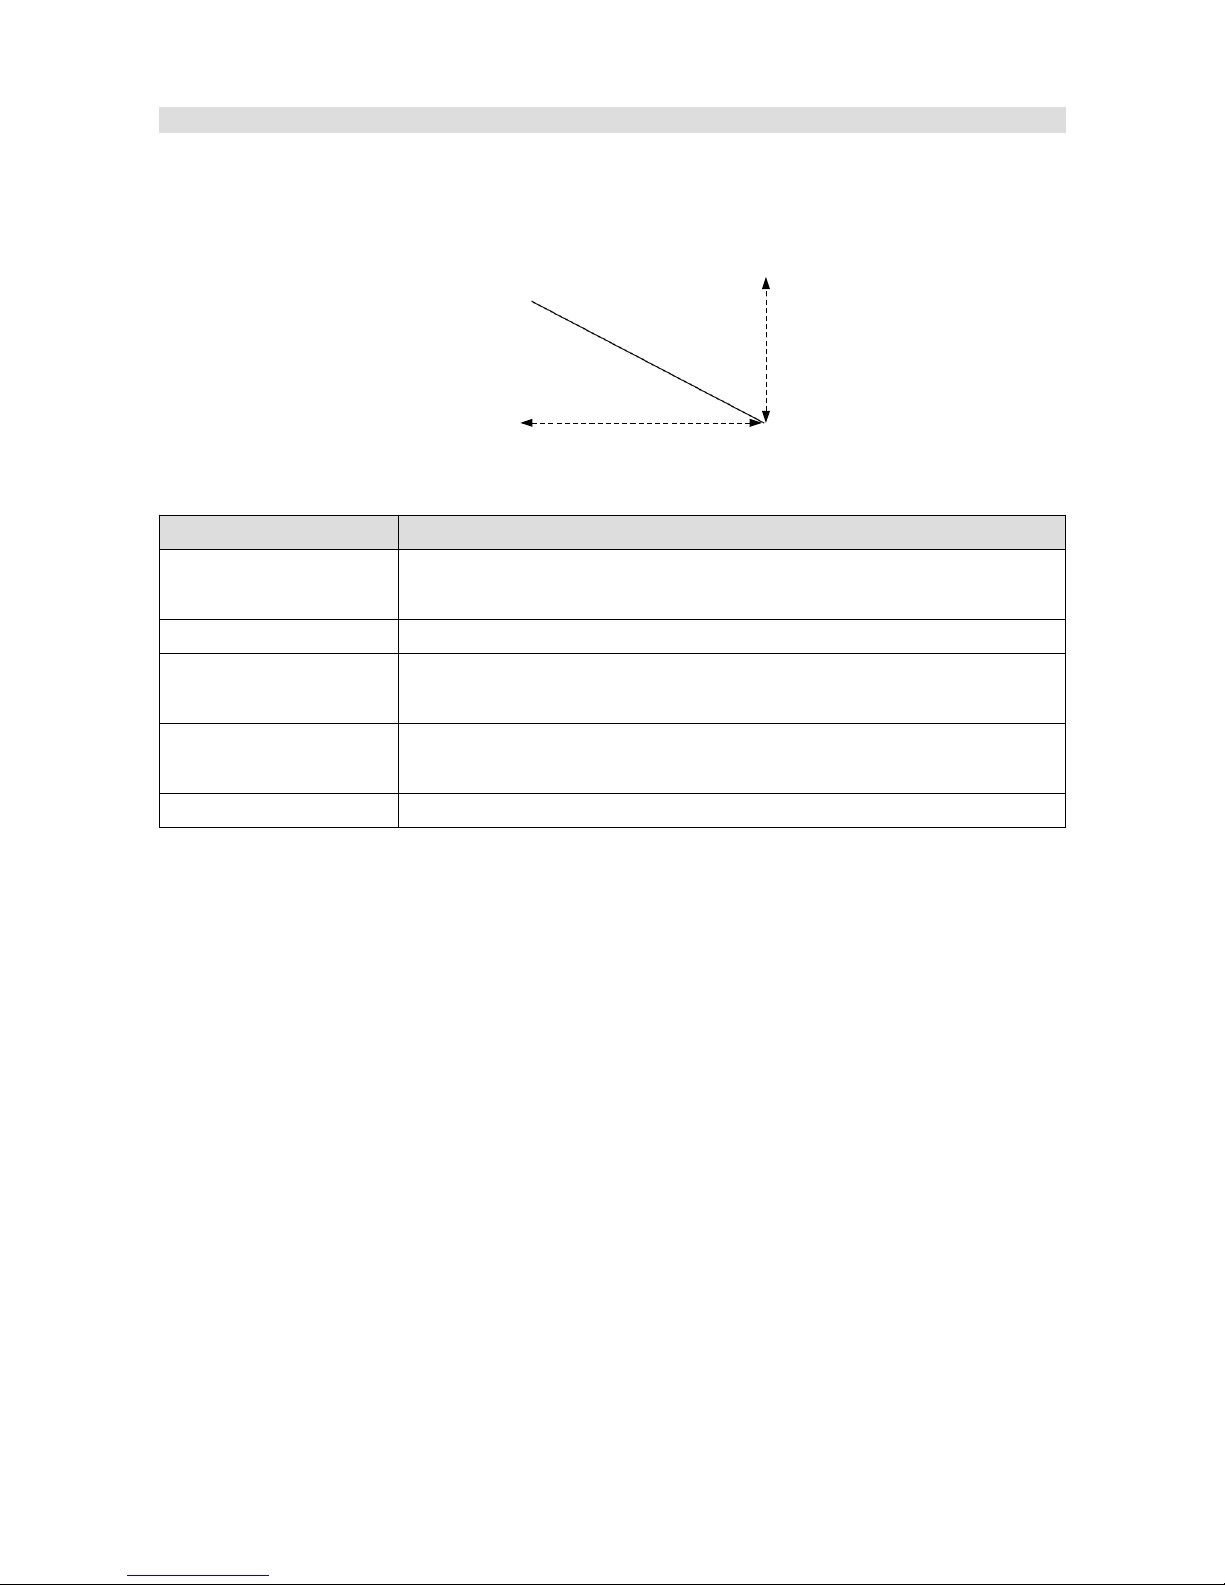
Line
The Line object allows you to draw lines on the page.
Parameter Description
Position X,Y Object position on the page The reference point is the upper-left corner
of a rectangle around the object.
Color The line colour
Width The line width (the distance between the beginning and the end of the
line along the X axis)
Height The line height (the distance between the beginning and the end of the
line along the Y axis)
Thickness The width of the line in pixels
Page 73/137
Object description
Line
Width
Height
Page 74
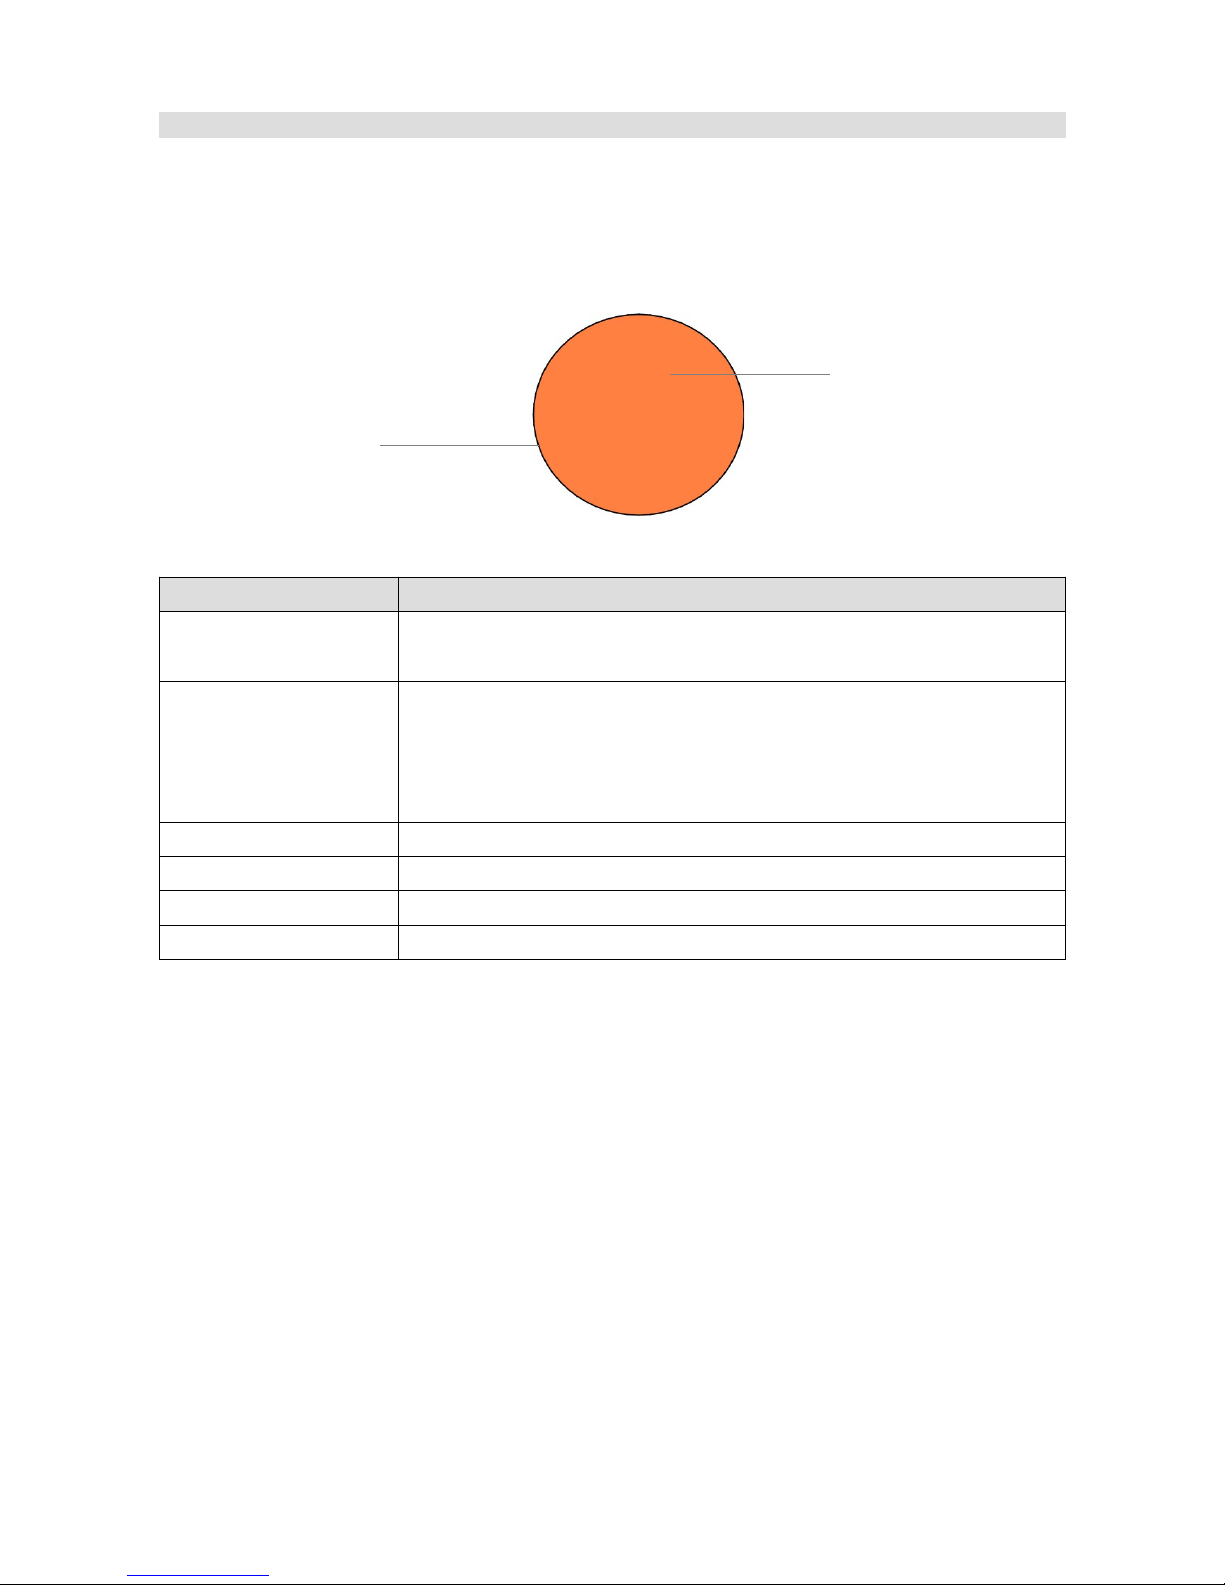
Circle
The Circle object allows you to draw a circle on the page. You may define the circle diameter,
border width, and fill colour.
Parameter Description
Position X,Y Object position on the page The reference point is the upper-left corner
of an rectangle around the object.
Circle type The type of circle displayed.
Border – displays only the rectangle frame,
Border + fill – displays the frame and its fill (fill)
Only fill - displays only the fill (fill)
Color The frame colour
Fill color The fill colour
Thickness The width of the frame in pixels
Radius The circle radius
Page 74/137
Object description
Circle
Border
Fill
Page 75
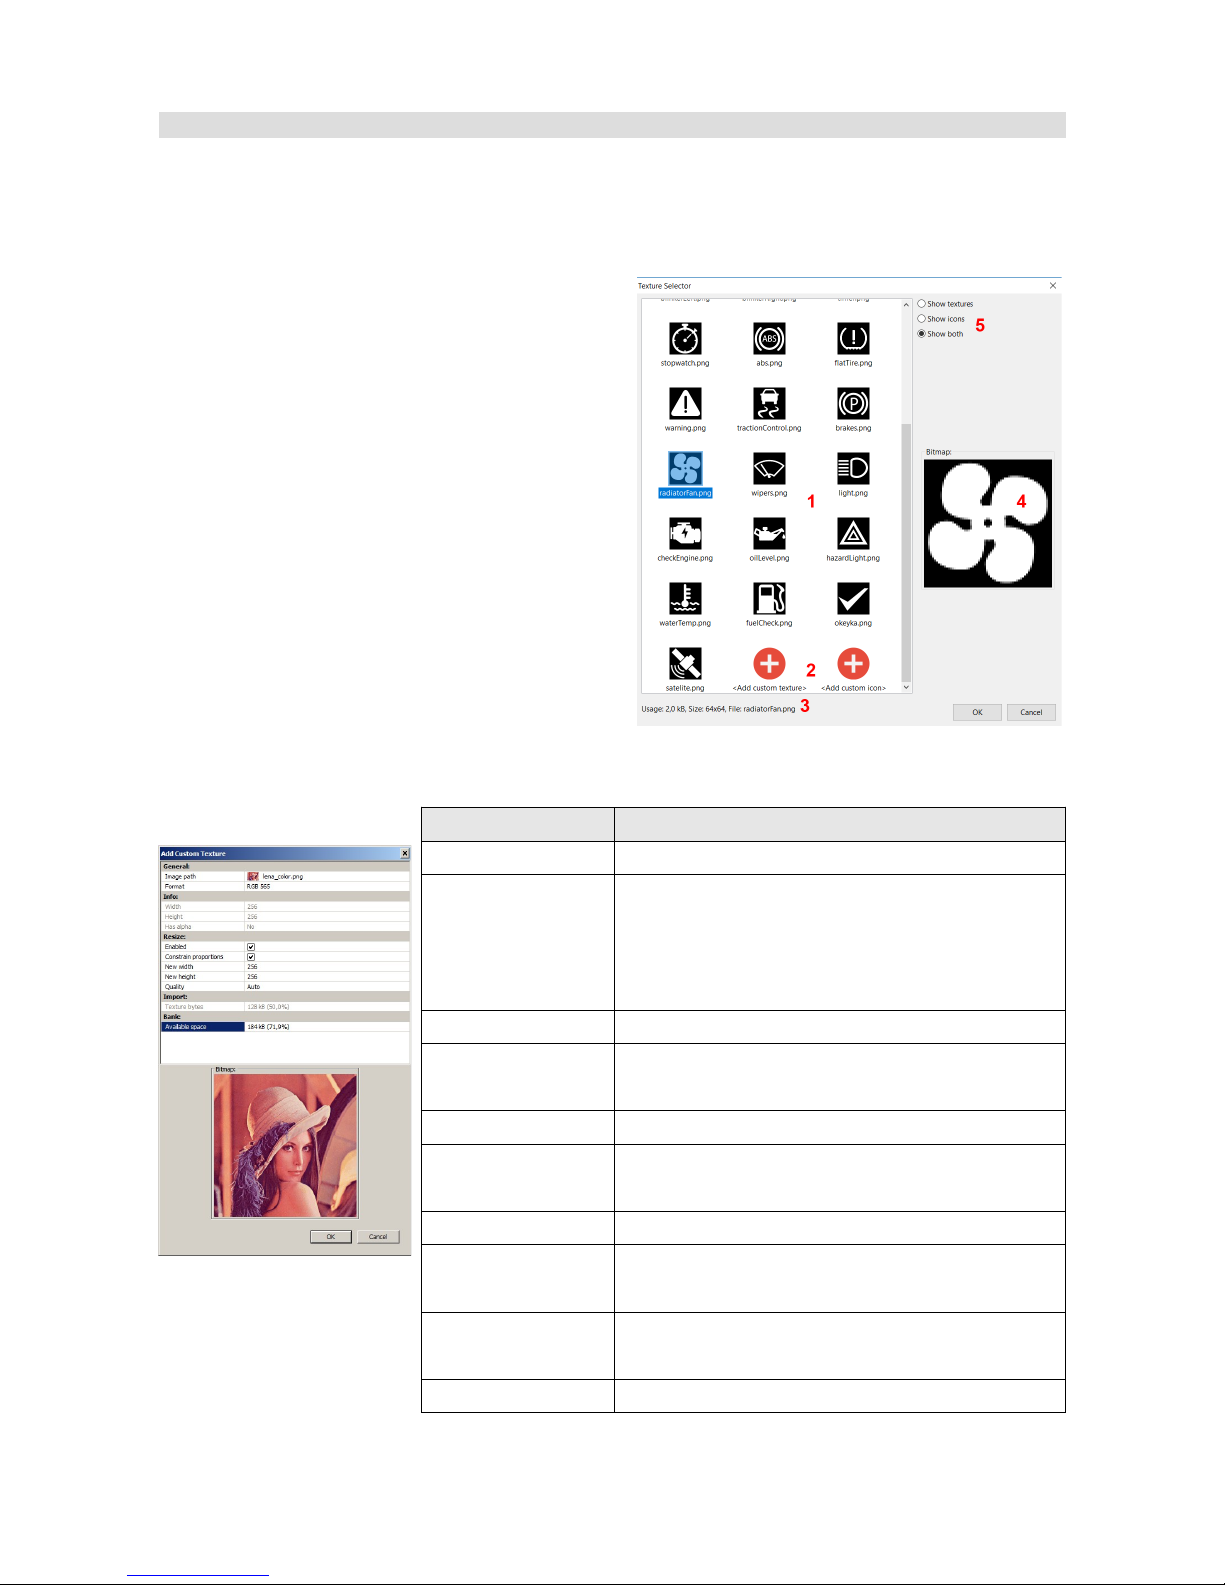
Textures
Textures are bitmaps (images) that can be used as Image objects. The ADU device has built-in
textures dedicated for displaying as icons or backgrounds. The user is also able to add their own
textures (e.g. background, icon, etc.).
The textures are managed by means of the
Texture Manager (Menu/Tools/Texture manager
dialogue). This dialogue is displayed also when
you select a texture for the objects that display it
(e.g. Image, Bar graph, etc.) Using the Texture
Manager you may preview the available textures.
After selecting a texture in the lower part of the
window, information about the selected image (3)
will be displayed along with its preview (4). You
can also use the filtering option to have only
textures or icons (5) displayed. An icon differs
from a texture in that it has to be 64x64 pixels. To
add your own icon or texture, select Add custom
texture or Add custom icon. After selecting a file with a graphics (png, jpg and bmp formats are
supported), a dialogue will be displayed that will enable you configure the texture.
Parameter Description
Image path File name on the disc
Format The texture target format. The format influences
the quality of the texture and the amount of the
memory it takes up. Detailed information about
the formats is presented on the next page.
Width, height Information about the size of the source bitmap
Has alpha Information whether the bit map has a separate
alpha channel
Resize enabled It activates the scaling of the source texture
Constrain
proportions
When activated, this option automatically keeps
the proportion of the texture during scaling
New width, height The new width and height of the texture
Quality The filtering that will be used during scaling. We
suggest using the Auto filtering option.
Texture bytes The size of the texture in the memory of the
device.
Available space The available free memory for textures
Page 75/137
Page 76
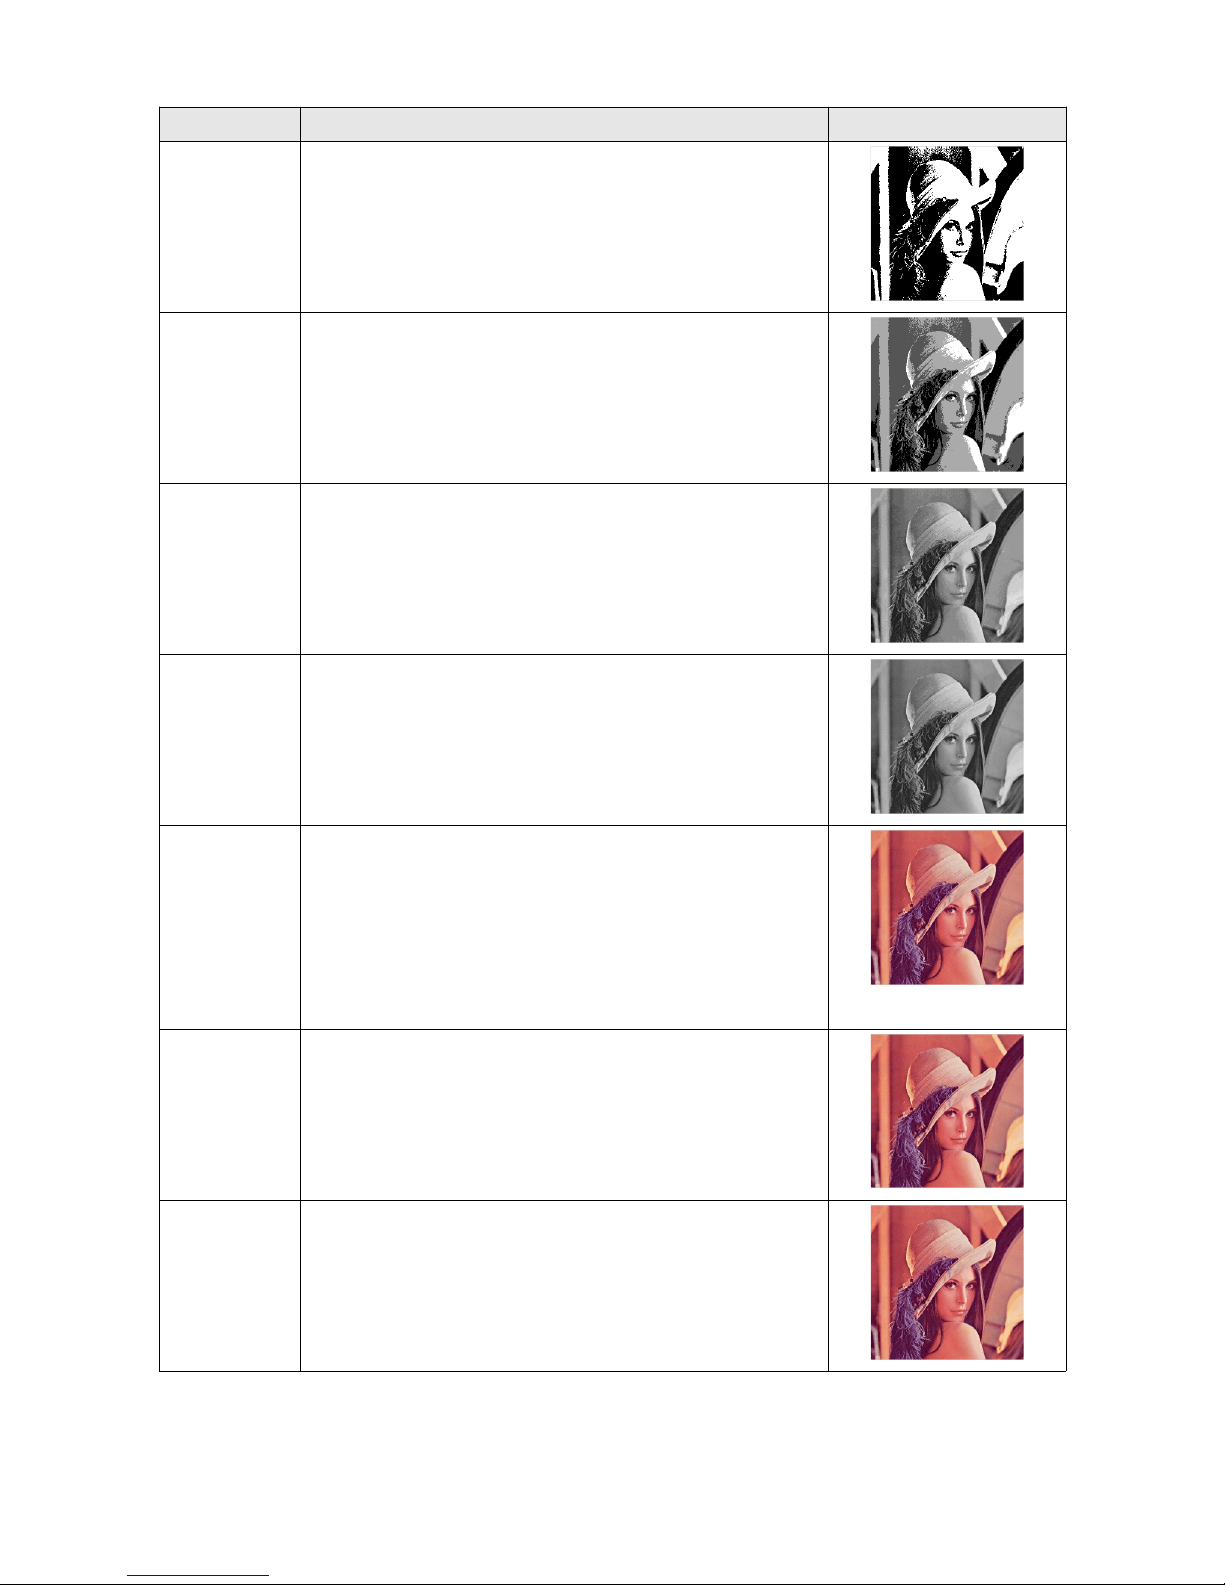
Format Description Preview
A1
(256x256) 8kB
1-bit format. A pixel of the texture can assume only 2
values. It takes up less memory
A2
(256x256)
16kB
2-bit format. A pixel of the texture can assume 4 values.
A4
(256x256)
32kB
4-bit format. A pixel of the texture can assume 16 values.
This format is recommended for icons. It guarantees a
good quality while using little memory
A8
(256x256)
64kB
8-bit format. A pixel of the texture can assume 256 values
Indexed
RGBA8
(256x256)
64kB
An 8-bit colour format with an alpha channel. The texture is
quantized to 256 unique colours. This format is suitable for
coloured textures (e.g. a company logo). It uses little
memory, however, it displays a low rendering efficiency
and results in a visible quality deterioration in the case of
tonal transitions
RGB 565
(256x256)
128kB
A 16-bit colour format without an alpha channel. It has a
very good quality and rendering efficiency. A downside of
this format is that it uses twice the memory of an indexed
format
ARGB 1555
(256x256)
128kB
A 16-bit colour format with an alpha channel. It has a very
good quality and rendering efficiency. A downside of this
format is that it uses twice the memory of an indexed
format
Page 76/137
Page 77
Inputs
As we explained at the beginning of the manual, the ADU device is equipped with 8 analogue and
8 digital inputs.
Analogue inputs
The analogue inputs are used for measuring sensor voltages (e.g. oil pressure sensor) or can be
used as inputs for buttons or switches. To add an analogue input, add the Analog input object in
the Project tree. The configuration pane is comprised of the following options:
Parameter Description
Name The name of the analogue input that will be used as the channel name in the
project
Pin The number of the analogue input to which the configuration relates
Type The function that the analogue input is to perform:
Switch – active low – the analogue input will function as a switch (button)
activated with a low state,
Switch – active high – the analogue input will function as a switch (button)
activated with a high state,
Rotary switch – the input assumes a value consistent with the position of
the Rotary switch. The number of the positions of the rotary switch is
defined as Min value / Max value.
Linear analog sensor – this type of input is used for measuring voltage
(you select Voltage as a Unit) or any type of linear sensors (e.g. MAP
sensor).
Calibrated analog sensor – this type of input is used for measuring the
values from sensors with a non-liner scale (e.g. temperature sensors NTC /
PTC). A 2D map is used for defining the values.
Pullup / Pulldown This function allows to activate the internal 10K resistor connected to the
ground (Pulldown) or +5V (Pullup). These resistors are activated mainly
when buttons are connected to the analogue inputs. In the case of a button
activated with a low state, you should activate Pullup 10K and the button
should connect the analogue input to ground. In the case of analogue
sensors or in the case of measuring voltage, choose the 1M Pulldown
option.
Quantity / Unit Defines the measured physical value and its unit for Linear and Calibrated
analog sensor types
Decimal places Defines the number of decimal places of the measured value for Linear and
Calibrated analog sensor types
Page 77/137
Page 78
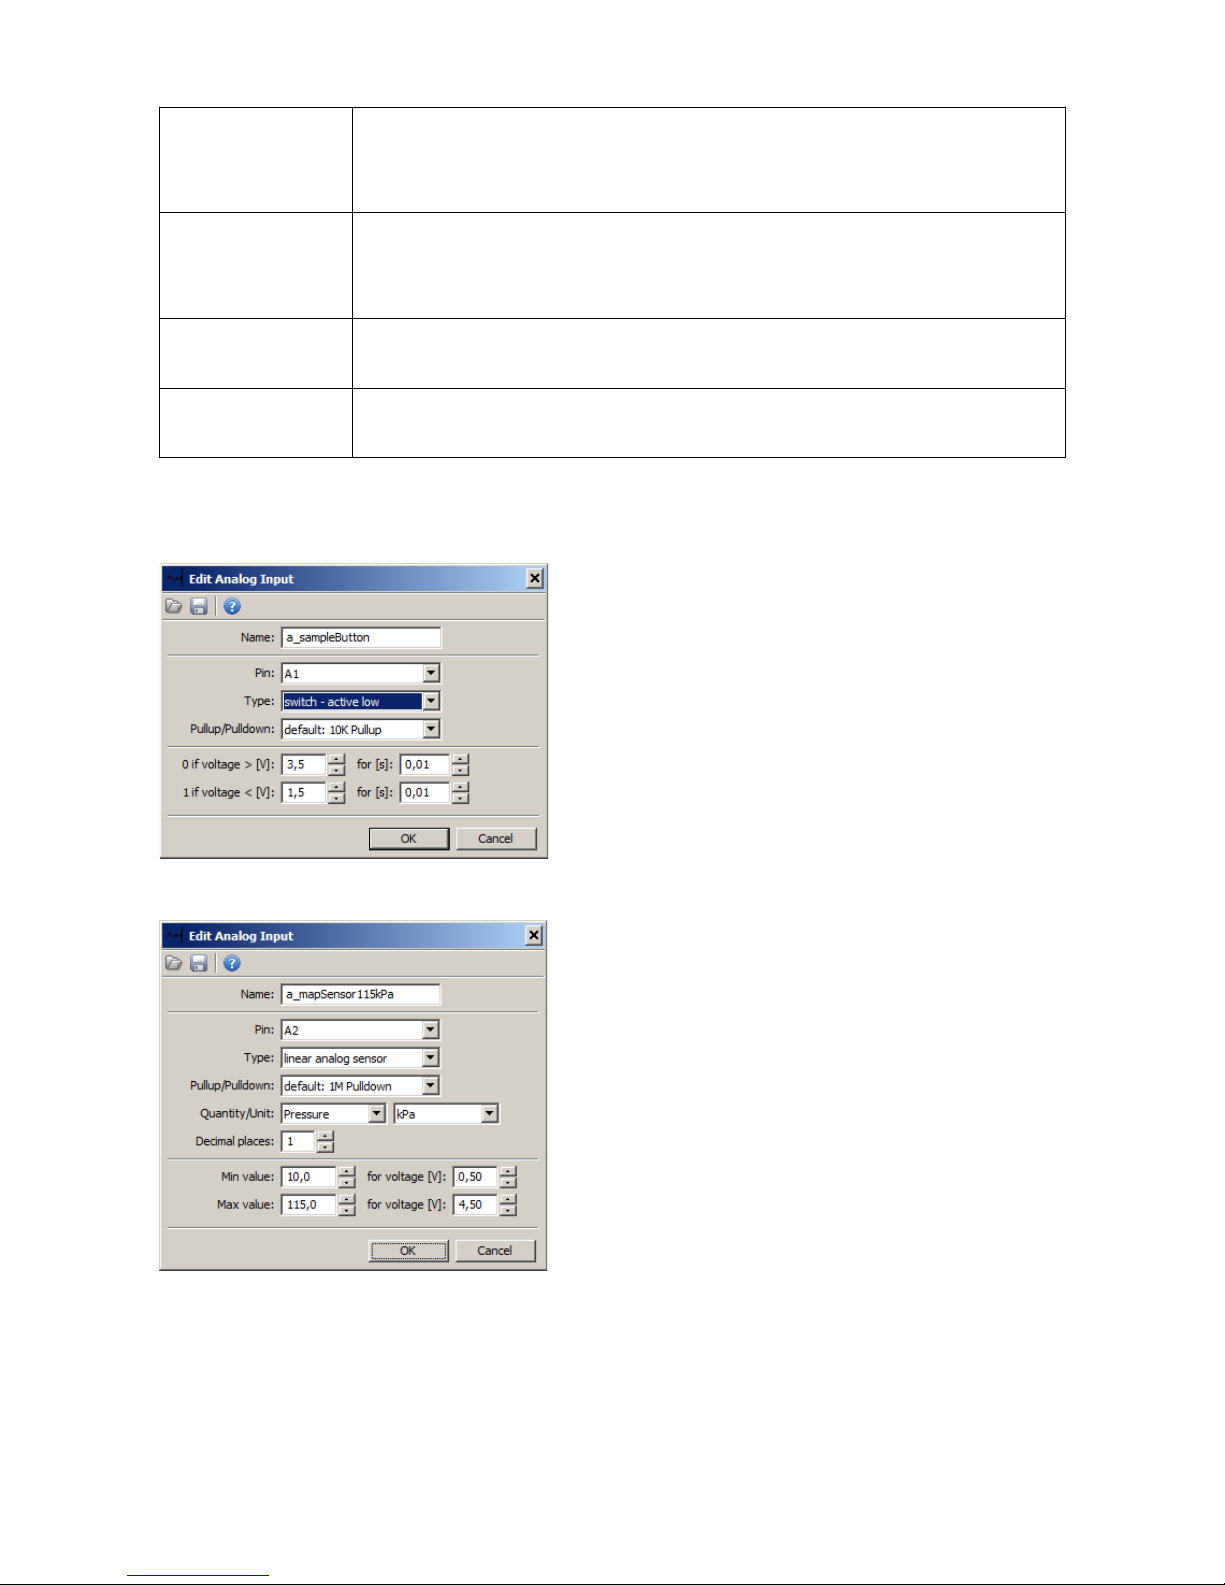
1 if voltage > [V] Defines the voltage representing the value 1 for the Switch type. In order for
this condition to be fulfilled, the voltage needs to be greater than that defined
by the time from the field for [s]
0 if voltage < [V] Defines the voltage representing the value 0 for the Switch type. In order for
this condition to be fulfilled, the voltage needs to be smaller than that defined
by the time from the field for [s]
Min value for
voltage
This value defines the minimum sensor value for the defined Voltage when
using a Linear analog sensor
Max value for
voltage
This value defines the maximum sensor value for the defined Voltage when
using a Linear analog sensor
Example configurations:
A configuration for a button connected to ground and
to analogue input 1. The value a_sampleButton will
be 0 when the button is not pressed and 1 when it is.
Configuration for a pressure sensor in the intake
manifold (MAP) connected to analogue input 2. The
value a_mapSensor115kPa will assume values
ranging from 10.0kPa to 115.0kPa
Page 78/137
Page 79
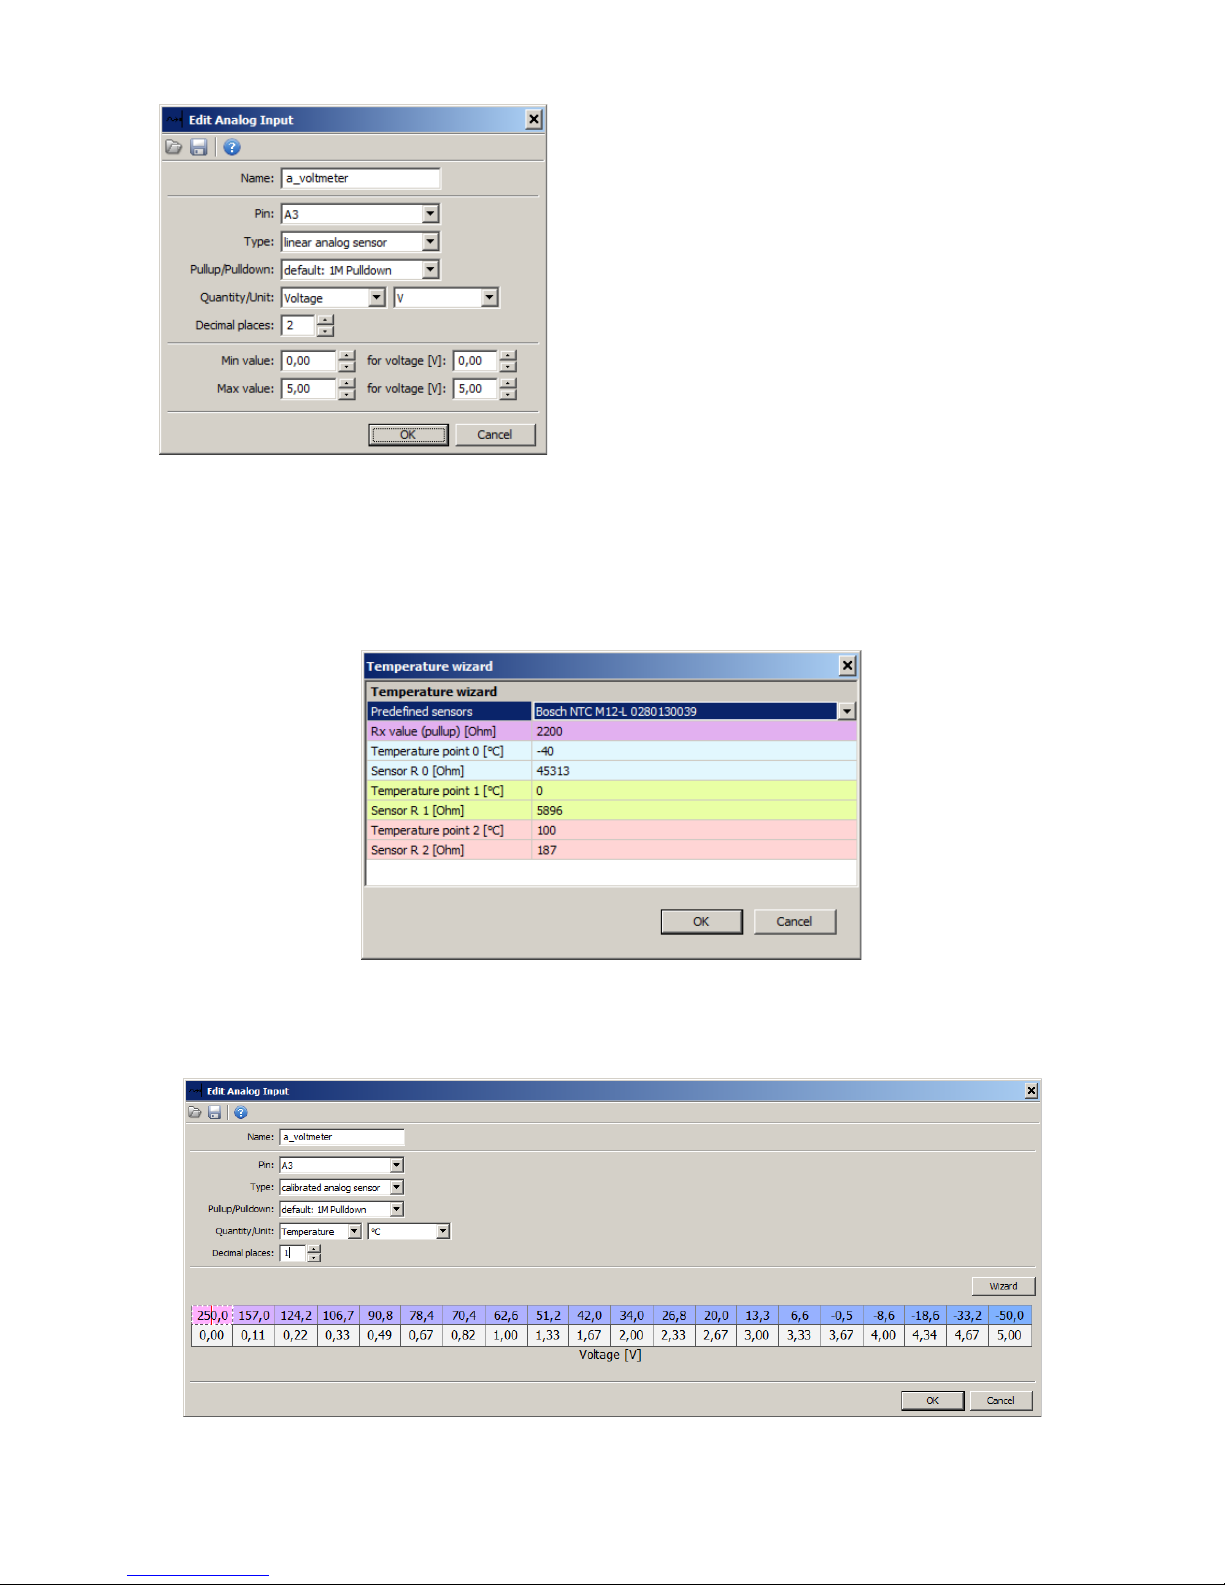
Configuration for measuring a voltage of 0-5V for
a signal connected to analogue input 3.
The value a_voltmeter will assume values ranging
from 0.00V to 5.00V.
When using non-linear temperature sensors, the simplest method of calibration is to use the
Wizard. After pressing the Wizard button, a dialog window will pop up allowing you to define
a sensor using 3 temperature values and the corresponding sensor resistance. You may select
a calibration for common sensors in the Predefined sensor field.
The Rx value field means the value of the pullup resistor used when connecting the sensor.
If the sensor characterization data is correct, a 2D map describing the sensor characteristics will be
generated automatically:
Page 79/137
Page 80

If you want to create a calibration map manually, you can input the values in the particular cells.
To change the table size, right click on it and select one of the Modify bins options.
You can preview the analogue input values in the Analog monitor panel showing a channel value,
voltage and information about the pullup resistor connected.
Page 80/137
Page 81
Digital inputs
Digital inputs are used for reading digital signals such as signals from crankshaft position
sensors, wheel speed sensors or an ethanol sensor (FlexFuel). They can also be used as inputs
for buttons connected to ground.
To add an digital input, add the Digital input object in Project tree. The configuration pane is
comprised of the following options:
Parameter Description
Name The name of the digital input that will be used as the channel name in the
project
Input pin The number of the analogue input to which the configuration relates
Type The function that the analogue input is to perform:
Switch – active low – the digital input will function as a switch (button)
activated with a low state,
Switch – active high – the digital input will function as a switch (button)
activated with a high state,
Frequency – the digital input will measure the signal frequency
RPM – the digital input will decode the signal from the crankshaft /camshaft
position sensor in order to measure the vehicle engine speed. Only D1
input can be used to measure the engine speed.
Flex Fuel – a digital input used for reading the content of ethanol in fuel and
the fuel temperature from the FlexFuel sensor. Only the D2 input can
cooperate with the FlexFuel sensor. The values read from the sensor are
stored in the following channels: adu.ff.ethanolContent,
adu.ff.fuelTemperature, adu.ff.sensorStatus
Beacon - a digital input used for decoding the signal from an AIM Beacon.
The D2 input is compatible with an AIM beacon.
Enable pullup Activates an internal pullup resistor for a given input.
Threshold A reference voltage which, when exceeded, results in a change of the input
state from 0 to 1 (and the other way around). When using VR sensors this
value will be smaller than 1V. When using the Hall effect / optical sensors
this value will equal 2.5V.
Debounce time When using a Switch-type input, this parameter determines the time
needed to stabilize the switch contacts
Trigger edge The signal edge to be used when reading a signal
Number of teeth When using an RMP signal - a physical number of teeth on a toothed wheel
Page 81/137
Page 82
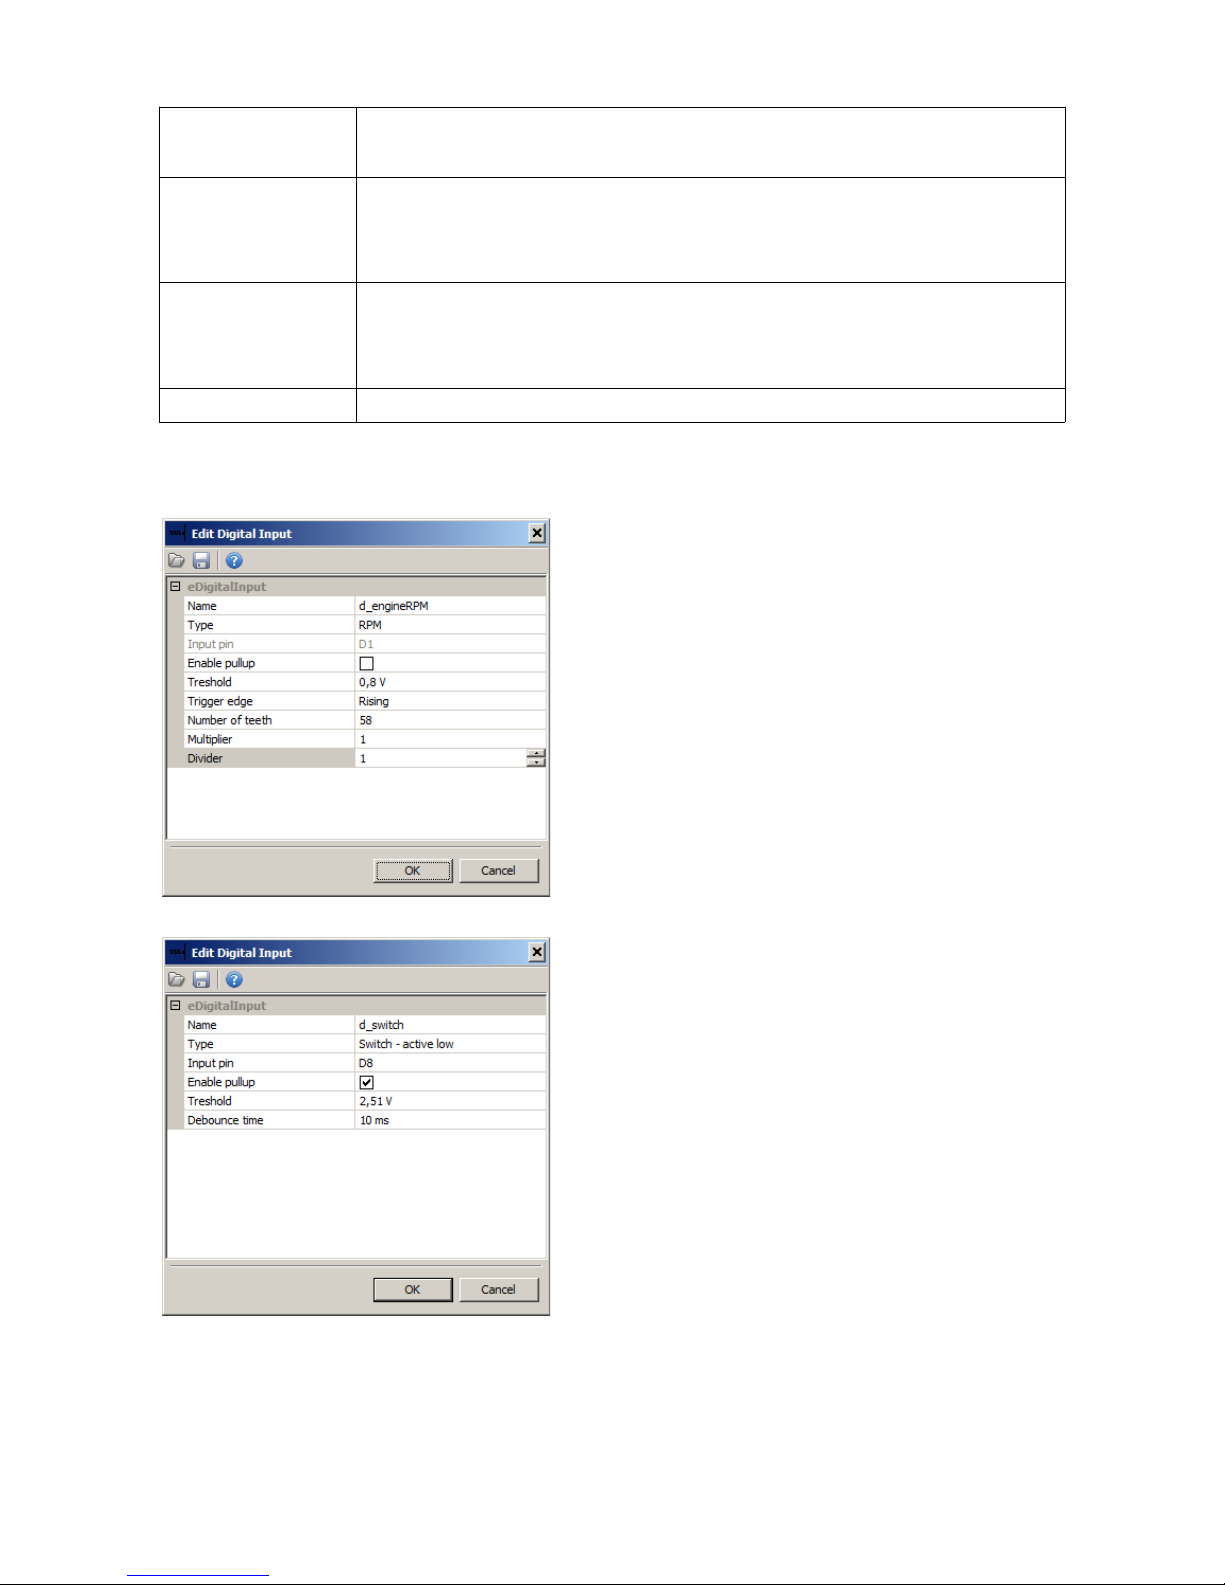
used by the crankshaft/ camshaft position sensor. For a 60-2 toothed wheel
the number will be 58, for a 12+1 wheel - 13, etc.
Multiplier The value by which the input frequency (Frequency) or the engine speed
(RPM) will be multiplied. This allows you to calibrate values such as
turbocharger speed or vehicle speed.
Divider The value by which the input frequency (Frequency) or the engine speed
(RPM) will be divided. This allows for the calibration of values such as
turbocharger speed or vehicle speed.
Timeout Time to reset freqency if there is no incoming signal pulse
Example configurations:
Engine speed (RPM) read-out configuration from an
inductive crankshaft position sensor and a 60-2 trigger
wheel. When using the engine speed read-out, the
sensor must be connected to Digital Input 1
Configuration of the status read-out of the button
connected to Digital Input 8. The button must
connect the signal to ground. The d_switch variable
assumes a value of 0 when the button is not pressed
and 1 when it is.
Page 82/137
Page 83
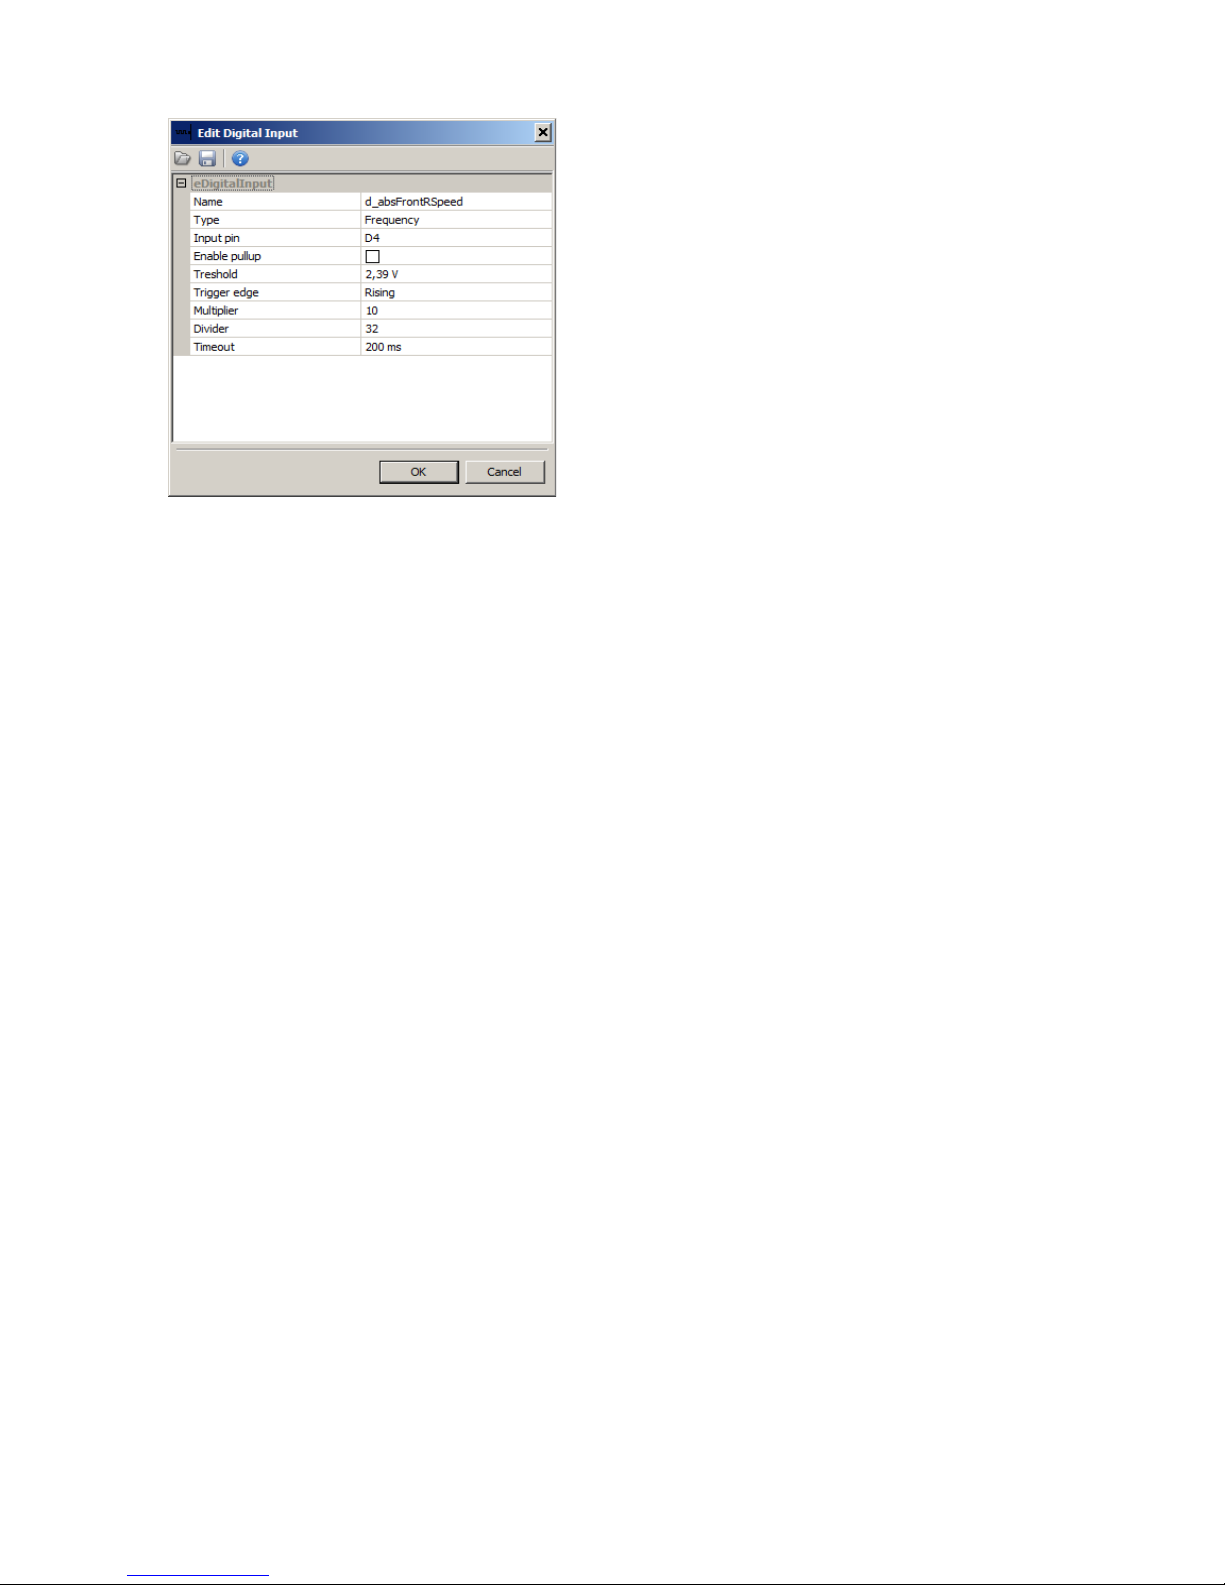
Configuration of a wheel speed read-out from an ABS
sensor connected to Digital Input 4. The
d_absFrontRSpeed variable value equals the input
frequency multiplied by 10 and divided by 32
(multiplier, divider).
Page 83/137
Page 84
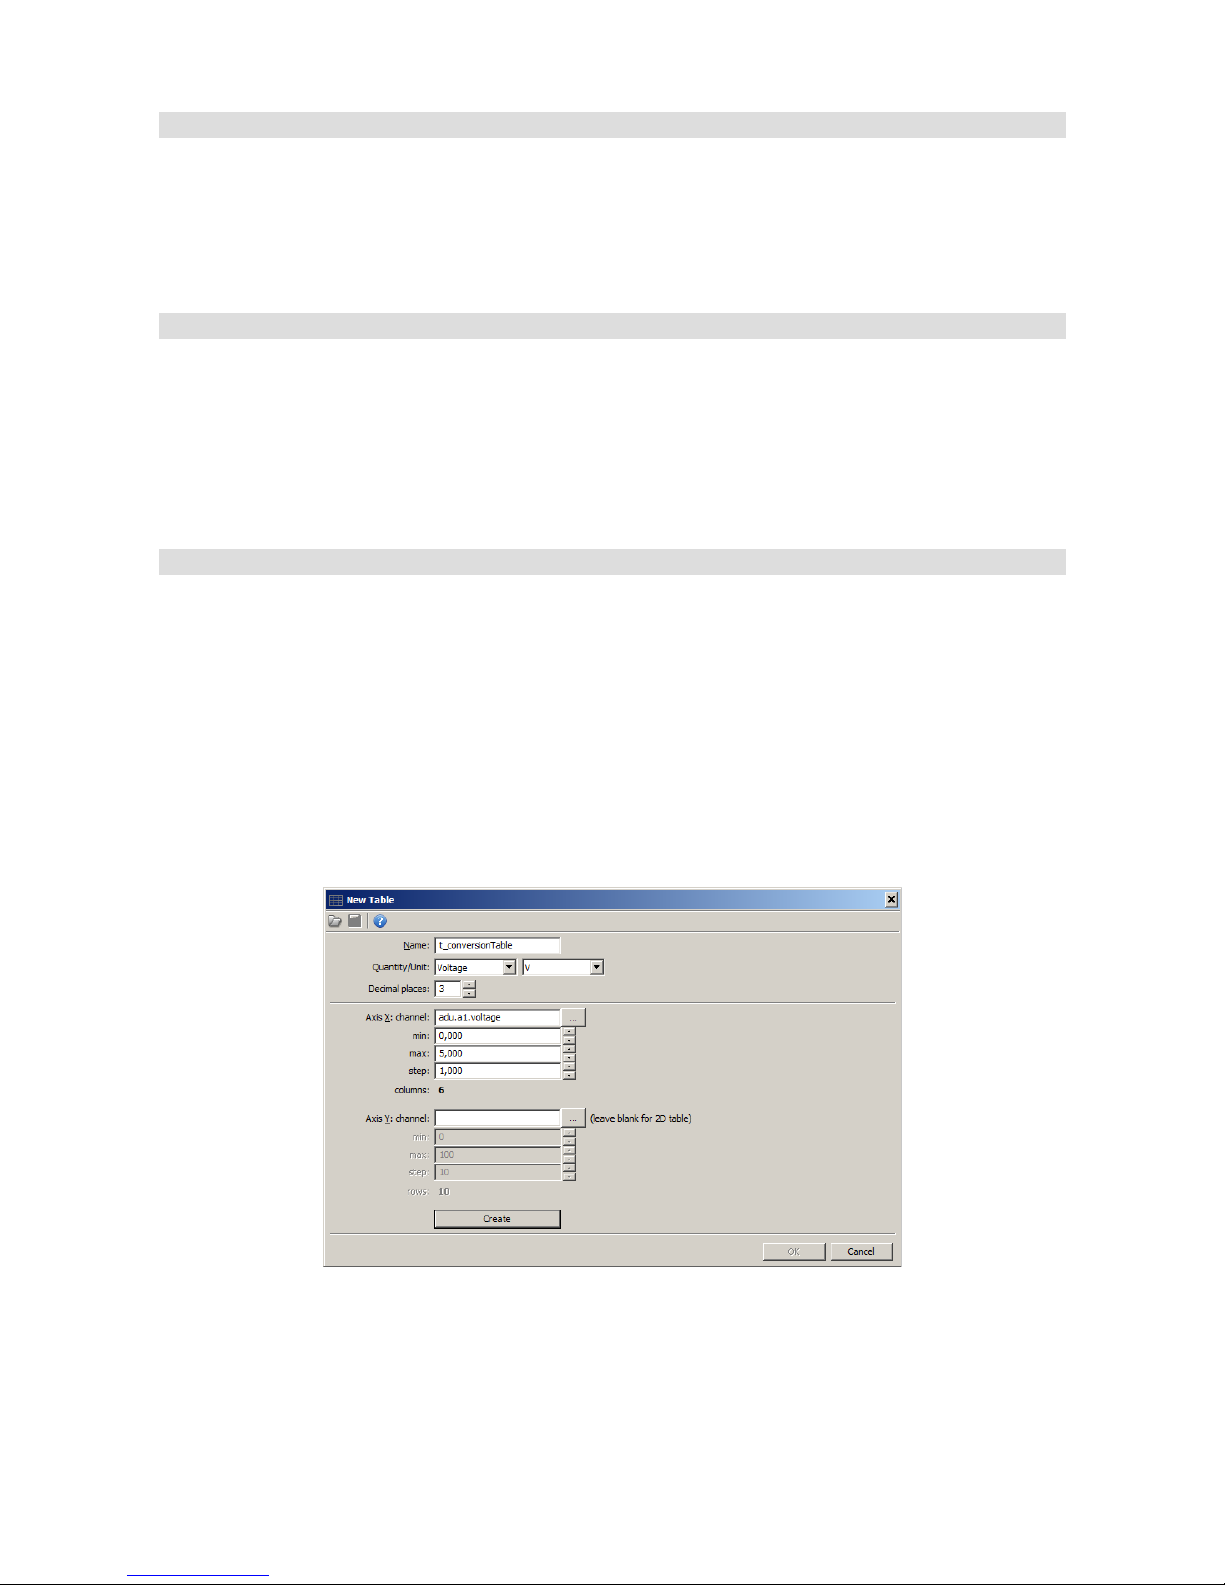
Outputs
The ADU device is equipped with two low-side outputs rated at 2A each. Additionally, an analogue
output with a signal ranging from 0 to 5V is available, which can be used to send a voltage signal
to another device.
Low side output
Configuration of low side outputs is available in the Outputs panel. You can choose between two
output channels Aux1.channel and Aux2.channel, where you can define the variables/functions
that will control the output. When their value equals 0, a given output is inactive (open), when the
value differs from 0, the output is active (connected to ground)
Analogue output
The analogue output control channel is available in the Outputs panel as AOut.channel.
It should be assigned a variable representing a value in V with a 0.001V accuracy, resulting in the
actual value ranging from 0 to 5000 (0-5V).
The following example shows how to change a signal from the 0-5V analogue input to a 5-0V
signal and how to set the voltage at the Analog output.
We will use a 2D map for this purpose. In order to create it in the project, select the Add button
and then Table. The configuration dialogue should look as follows:
A 2D Table will be created after pressing the Create button. The table should be modified so that
0V from the table is 5V, and for 5V - 0V.
Page 84/137
Page 85
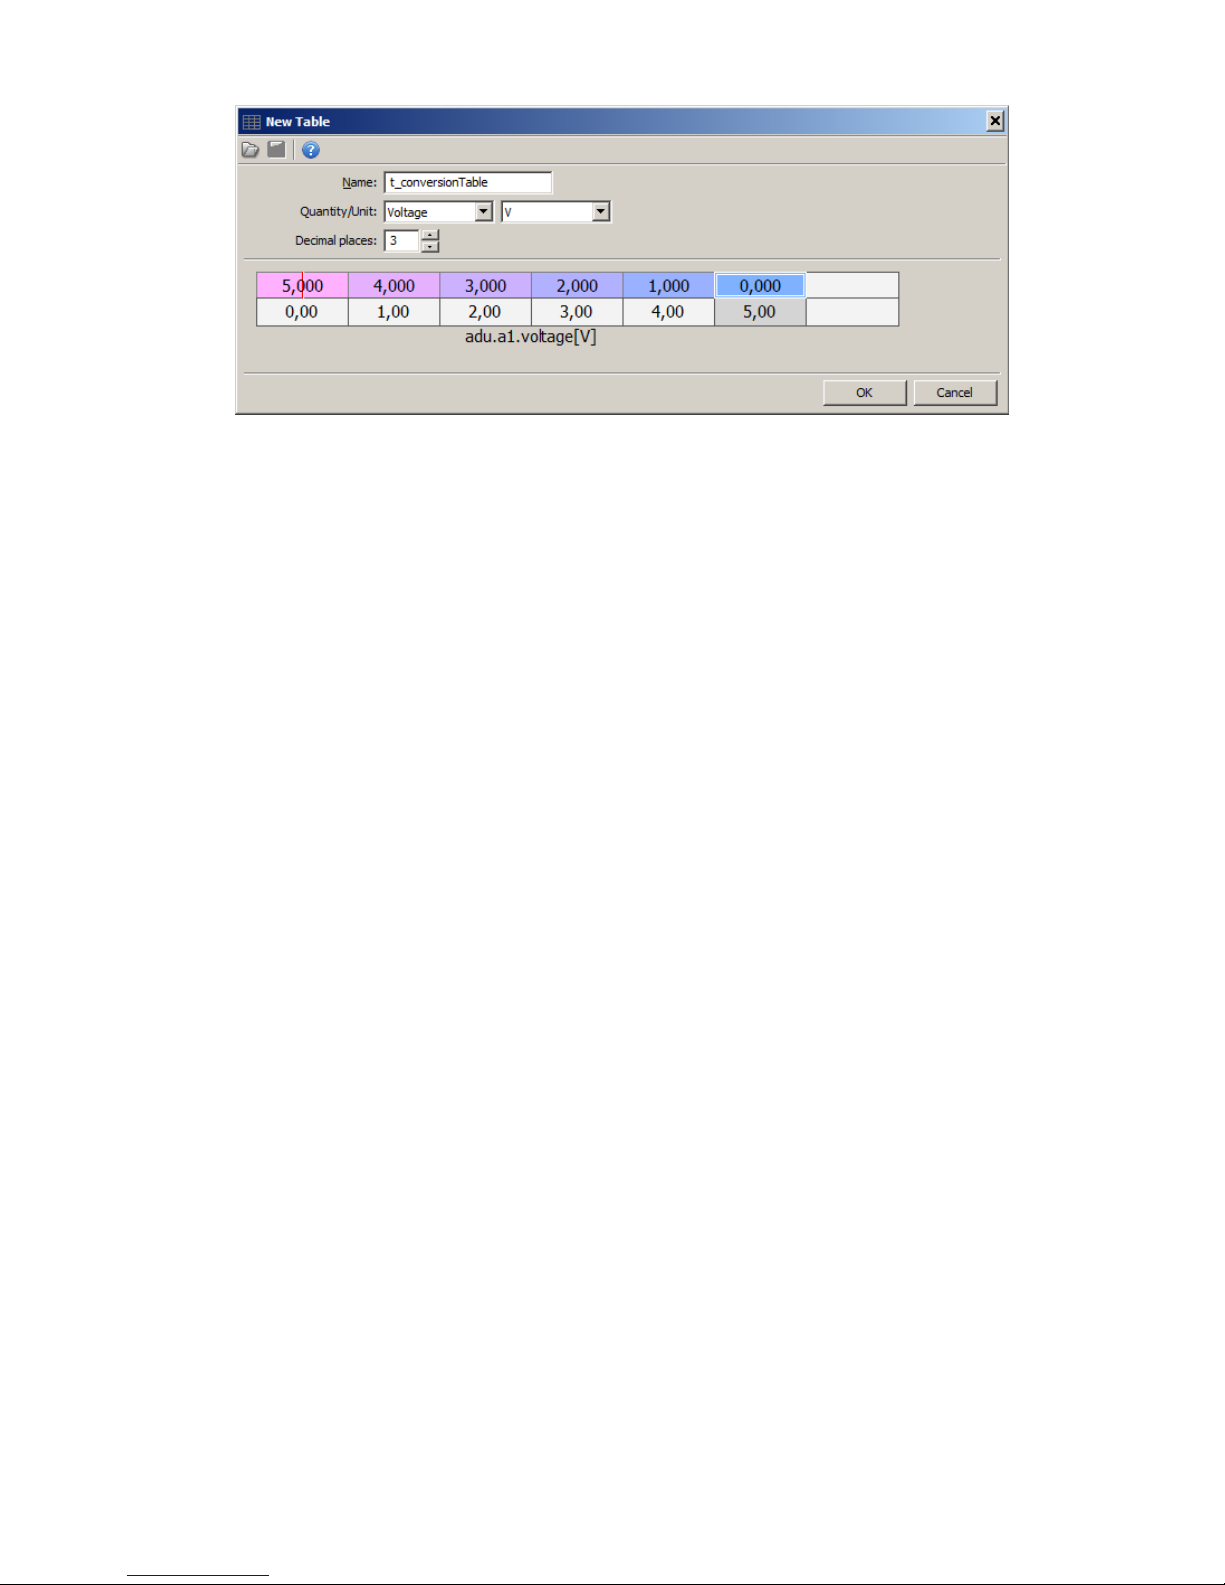
The value of the t_conversionTable should be assigned to the AOut.channel field in the
Outputs panel.
Page 85/137
Page 86
User lights
The User lights functions allow to control the LEDs on both sides of the device. This way they can
be assigned their own functions (e.g. Indicators, alarms).
Parameter Description
Master brightness The LED brightness scale. Each LED can be a assigned a brightness
ranging from 0-100%. The Master brightness parameter influences the
brightness of all LEDs.
Led 1 function Selection of a function for LED no. 1.
User LED1 – LED no. 1 behaves like the other LEDs and can be assigned a
user function
USB logger state still – LED no. 1 displays the state of logging into the
memory connected to the USB port.
USB logger state flashing - LED no. 1 displays the state of logging into
the memory connected to the USB port.
Type We can select the control method for each LED:
On/Off – the simplest control where an LED assumes two states: off (if the
value of the variable assigned in the Channel field equals 0) or on (if the
value of the variable in the Channel field differs from 0). If a LED is on, its
colour is defined as Color 1
Choose – an LED assumes two states whose colour is defined in the Color
1 and Color 2 fields. The state depends on the value of the variable in the
Channel field.
Choose + override – an LED can assume three states whose colour is
defined in the Color 1, Color 2 and Color 3 fields. The two first states are
controlled the same way as in the Choose type. The third state is
controlled by means of a variable assigned to the Channel 3 field. When
this variable assumes a value different from zero, the LED colour will
change to the value from the Color 3 fields irrespective of the value of the
variable in the Channel field
Channel A variable defining the state of a given LED.
Page 86/137
Page 87
Color 1 When using the On/Off type, it defines the colour when the variable in the
Channel field assumes a value different from zero, When using the Choose
and Choose + override type, it defines the colour when the variable in the
Channel field equals zero
Color 2 When using the Choose and Choose + override type, it defines the colour
when the variable in the Channel field differs from zero
Channel 3 A variable defining the third state When using the Choose + override type
Color 3 When using the Choose + override type, it defines the colour when the
variable in the Channel 3 field differs from zero
Brightness The brightness of individual LEDs
Page 87/137
Page 88
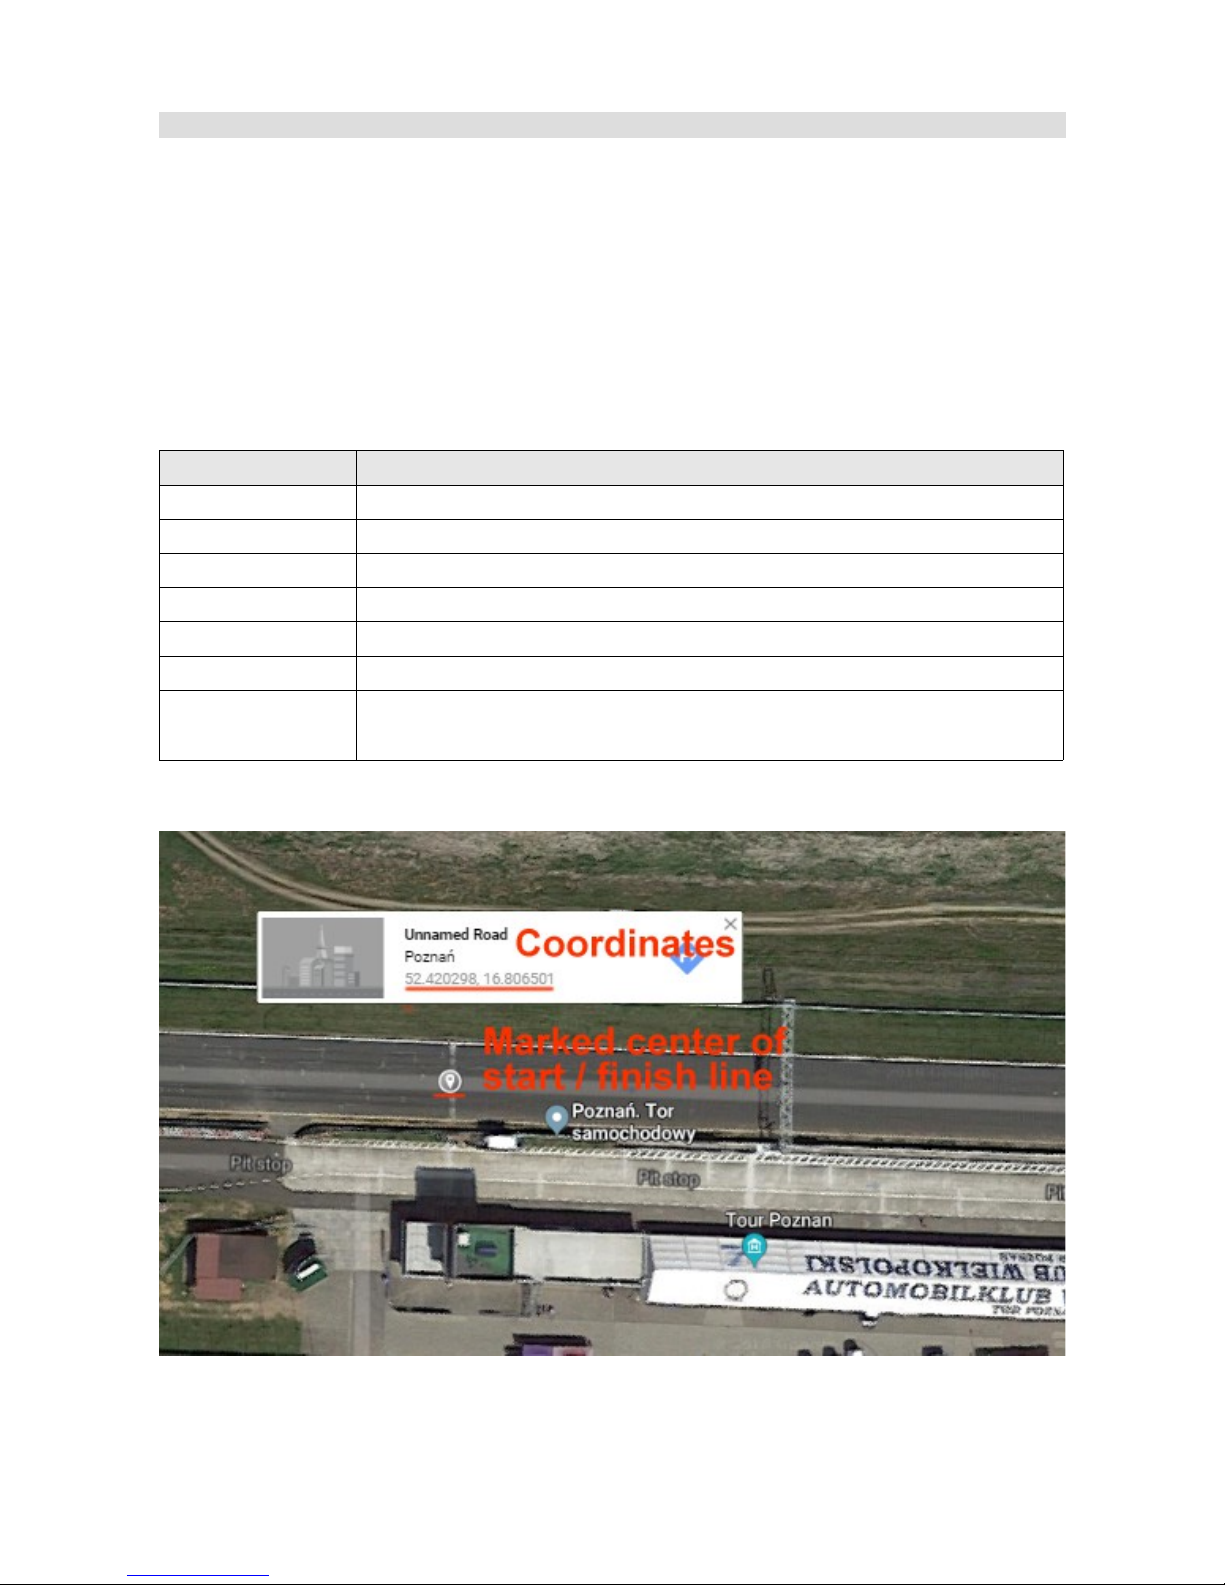
User tracks
The ADU device has a built-in set of popular car racing tracks worldwide. This set continues to
grow with each new version of the software. The currently available tracks are listed in Appendix
no.1 hereto. If a track is not available or if a track configuration differs from that assumed by us,
you can define a track yourself. You should enter the coordinates (latitude and longitude) of the
centre of the start/finish line.
You can define up to 5 tracks of your own. If the track area coincides with a track area defined in
the device, the one defined by the user will have the priority.
Parameter Description
Enable Enables a given track
Name Track name
Latitude The latitude of the centre of the start/finish line
Longitude The longitude of the centre of the start/finish line
Track length The track length in meters
Track width The track width
Track radius The radius of a circle defining the track area. The centre of the circle is
defined as the centre of the start/finish line
The following drawings are a graphical representation of the track in Poznań.
Page 88/137
Page 89
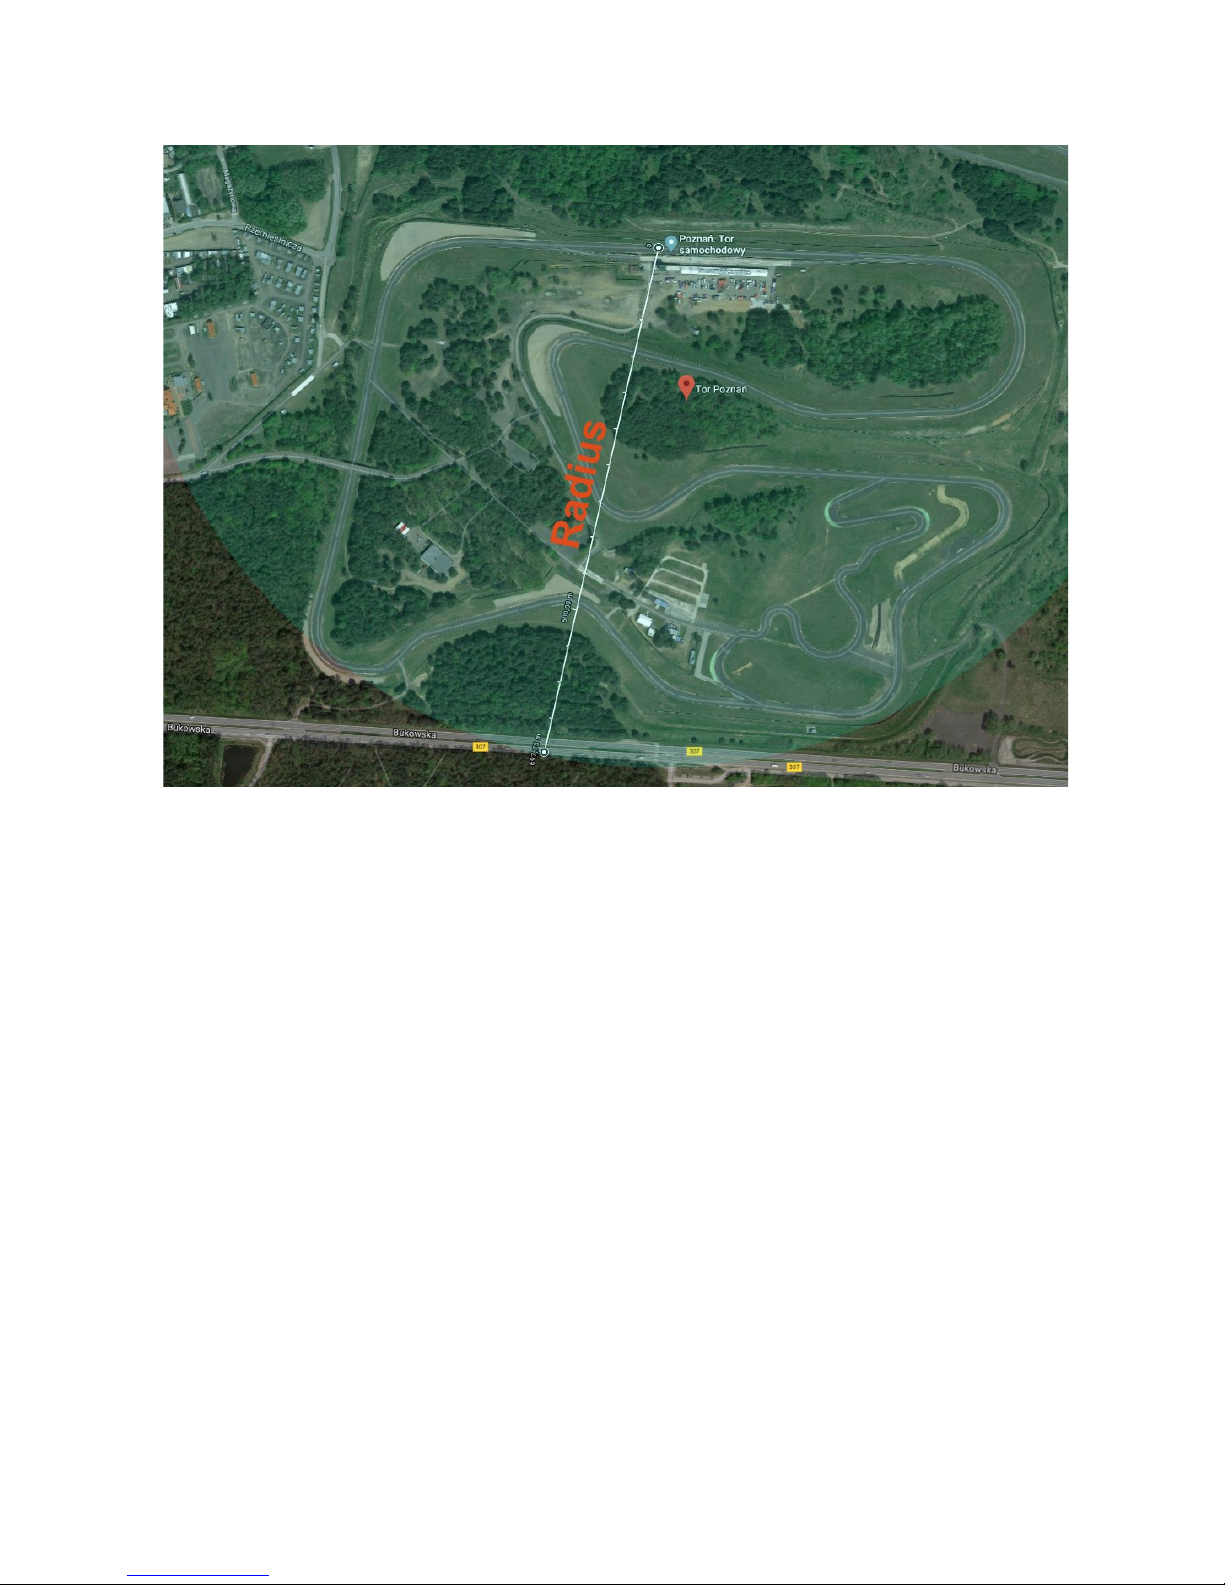
Page 89/137
Page 90
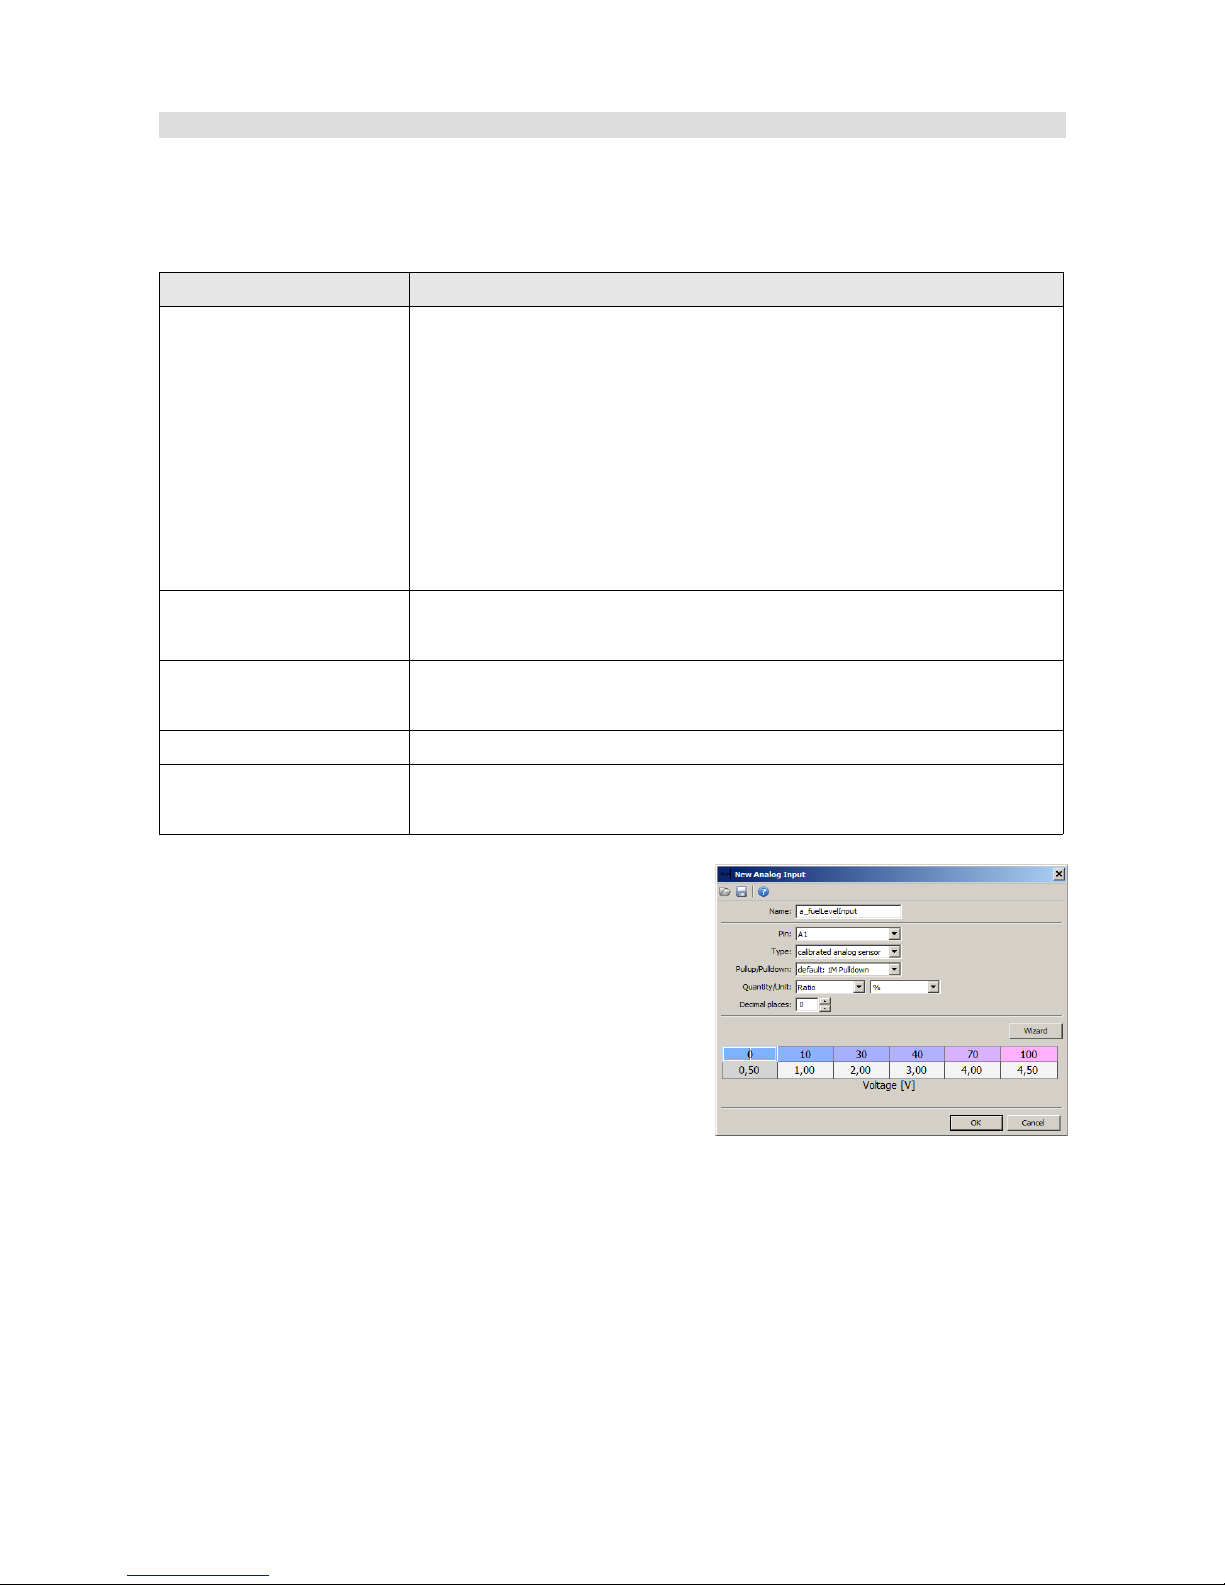
Fuel level filter
The Fuel level filter function is used for filtering the signal from the fuel level sensor in the fuel
tank.
The value produced by this function is output to the ecu.fuelLevel. channel.
Parameter Description
Fuel level mode One fuel level sensor – use one fuel level sensor, the result is stored
in ecu.fuelLevel channel,
Two fuel level sensors (average) – use two fuel level sensors, the
result is avarage value of both sensors, and it is stored in
ecu.fuelLevel channel,
Two fuel level sensors (separate levels) – use two fuel level
sensors, and results are stored in ecu.fuelLevel and ecu.fuelLevel2
channel
Fuel level 1 -
Source channel
A channel/variable determining the amount of fuel in the tank.
Usually, a 2D table with calibration is used for this purpose.
Fuel level 2 -
Source channel
A channel/variable determining the amount of fuel in the tank.
Usually, a 2D table with calibration is used for this purpose.
Maximum step change The maximum allowed fuel level change during one second.
Filter time The time based on which samples are to be averaged. The longer the
time, the greater the filtering.
In a typical car the fuel level sensor is a potentiometer that
requires an additional pullup resistor (these are usually
small values ranging between 100 and 200 Ohms).
Connect this signal to an analogue input and select
Calibrated analog sensor. This will allow you to calibrate
the amount of fuel for a given voltage in the table.
If you need to resize the table, right click on the table cells
and select Modify Bins/Insert cell (to add a cell) or
Modify Bins/ Delete cell (do delete a cell).
Then enter the name of your channel (a_fuelLevelInput) in the Source field. After filtering, the
value is available in the ecu.fuelLevel channel.
Page 90/137
Page 91
OBD 2
The OBD 2 panel is used for configuring communication using the OBD 2 communication protocol.
The read channels are divided into two groups. The fast ones (such as RPM, TPS) are marked
green, while the slow ones (such as CLT and Fuel Level) are marked pink. The more channels
that are used from a given group, the lower their logging frequency. The read channels are
mapped to ecu.* channels. It should be pointed out that not every ECU allows you to read all of
the following channels.
Parameter Description
Enable Activates support for the OBD 2 protocol over CAN BUS 2
RPM The engine speed readout. Shown in the log as ecu.rpm
Intake manifold absolute
pressure
The absolute pressure in the intake manifold. Shown in the log as
ecu.map
Vehicle speed The vehicle speed. Shown in the log as ecu.speed
Throttle position The throttle position. Shown in the log as ecu.tps
Timing advance The ignition timing angle. Shown in the log as ecu.ignAngle
Fuel pressure The fuel pressure. Shown in the log as ecu.fuelPress
Engine coolant temperature The engine coolant temperature. Shown in the log as ecu.clt
Intake air temperature The temperature in the intake manifold. Shown in the log as
ecu.iat
Fuel level The fuel level. Shown in the log as ecu.fuelLevel
Barometric pressure The barometric pressure. Shown in the log as ecu.baro
Ambient air temperature The temperature outside the vehicle. Shown in the log as
ecu.ambientAirTemp
Ethanol fuel % The content of ethanol in the fuel. Shown in the log as
ecu.ethanolContent
Engine oil temperature The engine oil temperature. Shown in the log as ecu.oilTemp
Update rate A parameter determining the frequency of sending inquiries to the
engine control unit. The higher the frequency, the higher the
frequency of logging you can obtain. Unfortunately, not all control
units are capable of responding with the frequency of 100Hz and
may require a lower frequency.
Page 91/137
Page 92
Outputs
The Outputs panel is used for the configuration of controlling the ADU outputs (AUX1, AUX2,
Analog out).
Parameter Description
Aux1.channel A channel/variable controlling the AUX 1 output. A value of 0 means an
inactive output, a value of 1 means an output connected to ground
Aux2.channel A channel/variable controlling the AUX 2 output. A value of 0 means an
inactive output, a value of 1 means an output connected to ground
AOut.channel A channel / variable controlling the AUX2 output. A value of 0
corresponds to 0V, while a value of 5000 corresponds to 5V (on the mV
scale)
Page 92/137
Page 93
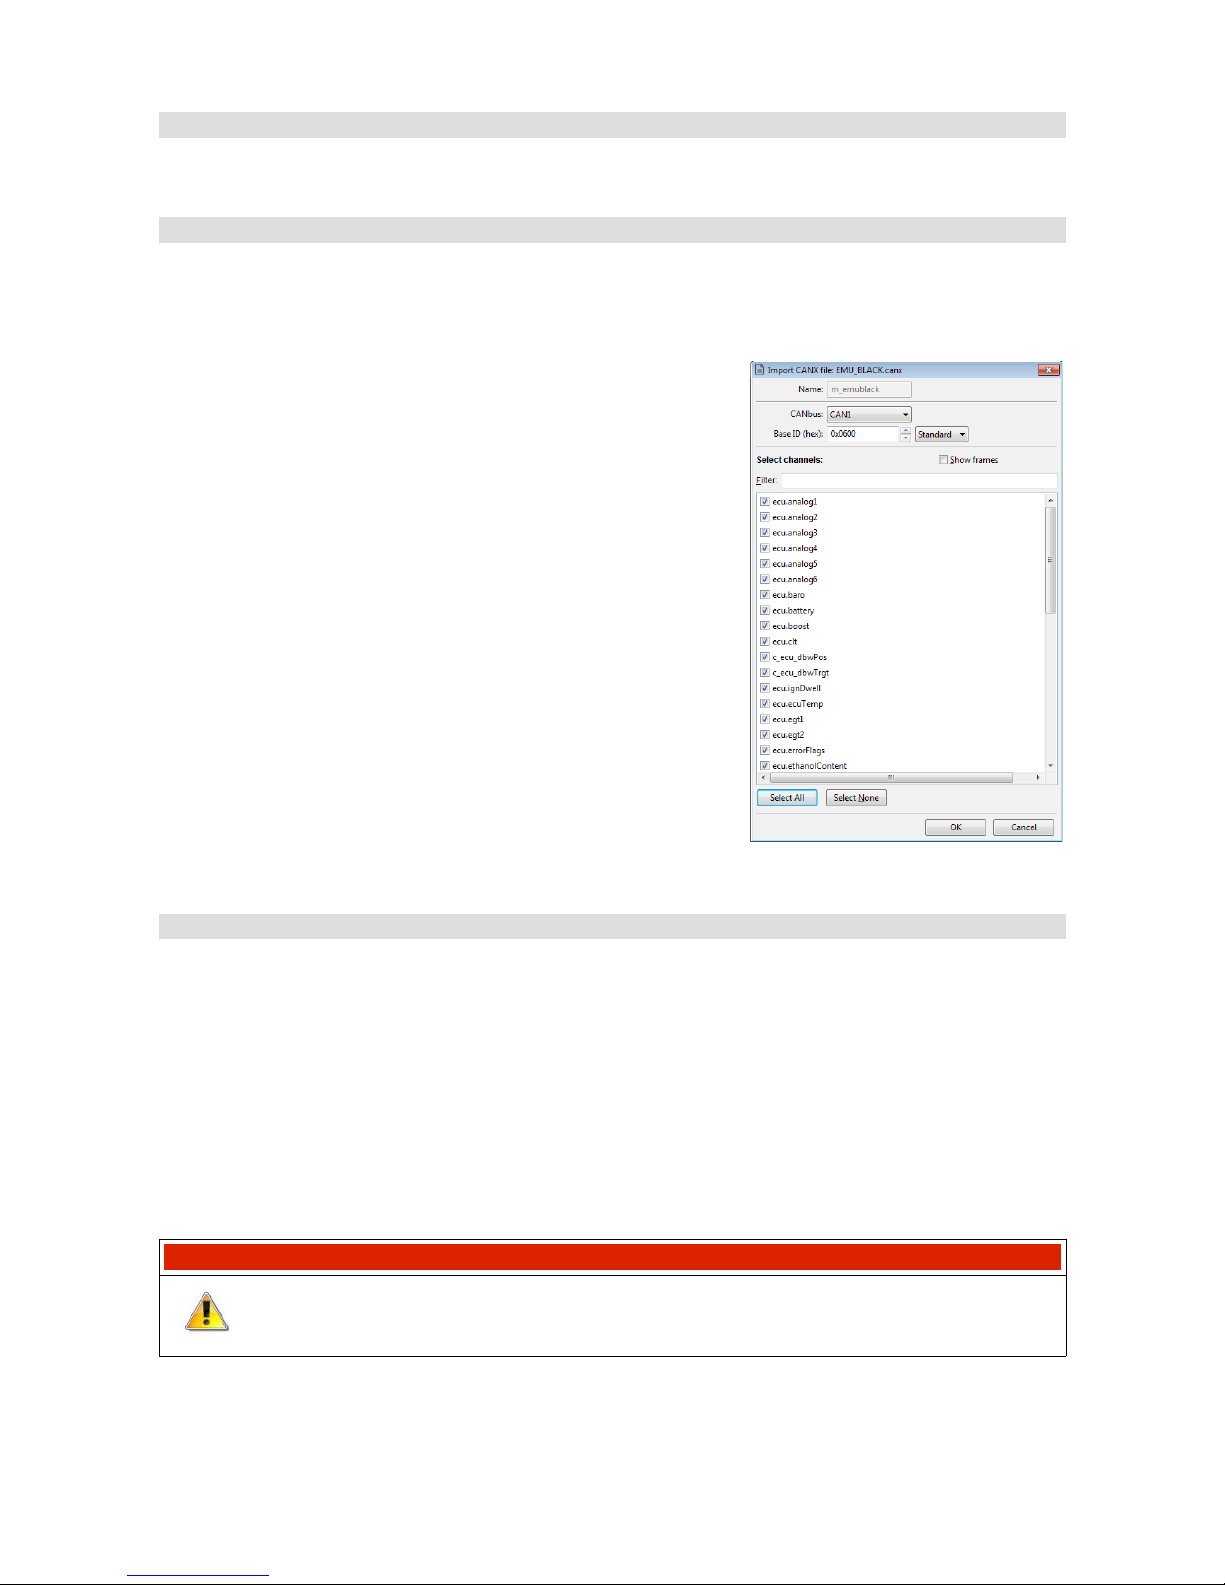
Working with CAN buses in ADU
Using pre-defined streams from CANX files.
The simplest way of working with a CAN bus is to use pre-formatted templates in the ADU Client.
These templates are available as files with a CANX extension.
Open the Project tree / Add / Import CANX dialog and select
a file with a CANX extension, then a pane with import settings
will open. For starters, choose the CAN bus from which you
will receive data. The ADU device has two CAN buses - CAN1
and CAN2. Next select the channels to be imported.
You can use a filter to select only particular channels. You can
also select all using the ‘Select all’ button.
You should remember that the ADU device supports up to 100
CAN channels on both buses.
After confirming with the OK button, the selected channels will
be added to the Project Tree. In addition, one or more
CANbus Massage Objects responsible for receiving frame
groups will be created.
Custom CAN streams - CANbus Message Object
Access to a CAN bus in the ADU device is completely open. You can create your own streams or
modify the existing ones supplied together with the package.
Configuration begins with the creation of a CANbus Message Object (Mob) element in the
Project tree. Each mob receives 1, 2, 4 or 8 CAN frames. After choosing a CAN bus you should
select a base ID (Base ID), as well as the type (Type) and the number of received frames (the Size
parameter. If the device in connected, a preview of the stream in real time ( Live Capture) will be
shown, which facilitates diagnostics and accelerates work.
IMPORTANT!
Active logging is required for Live Capture to work properly. In other words, logging
cannot be in the pause mode.
Page 93/137
Page 94
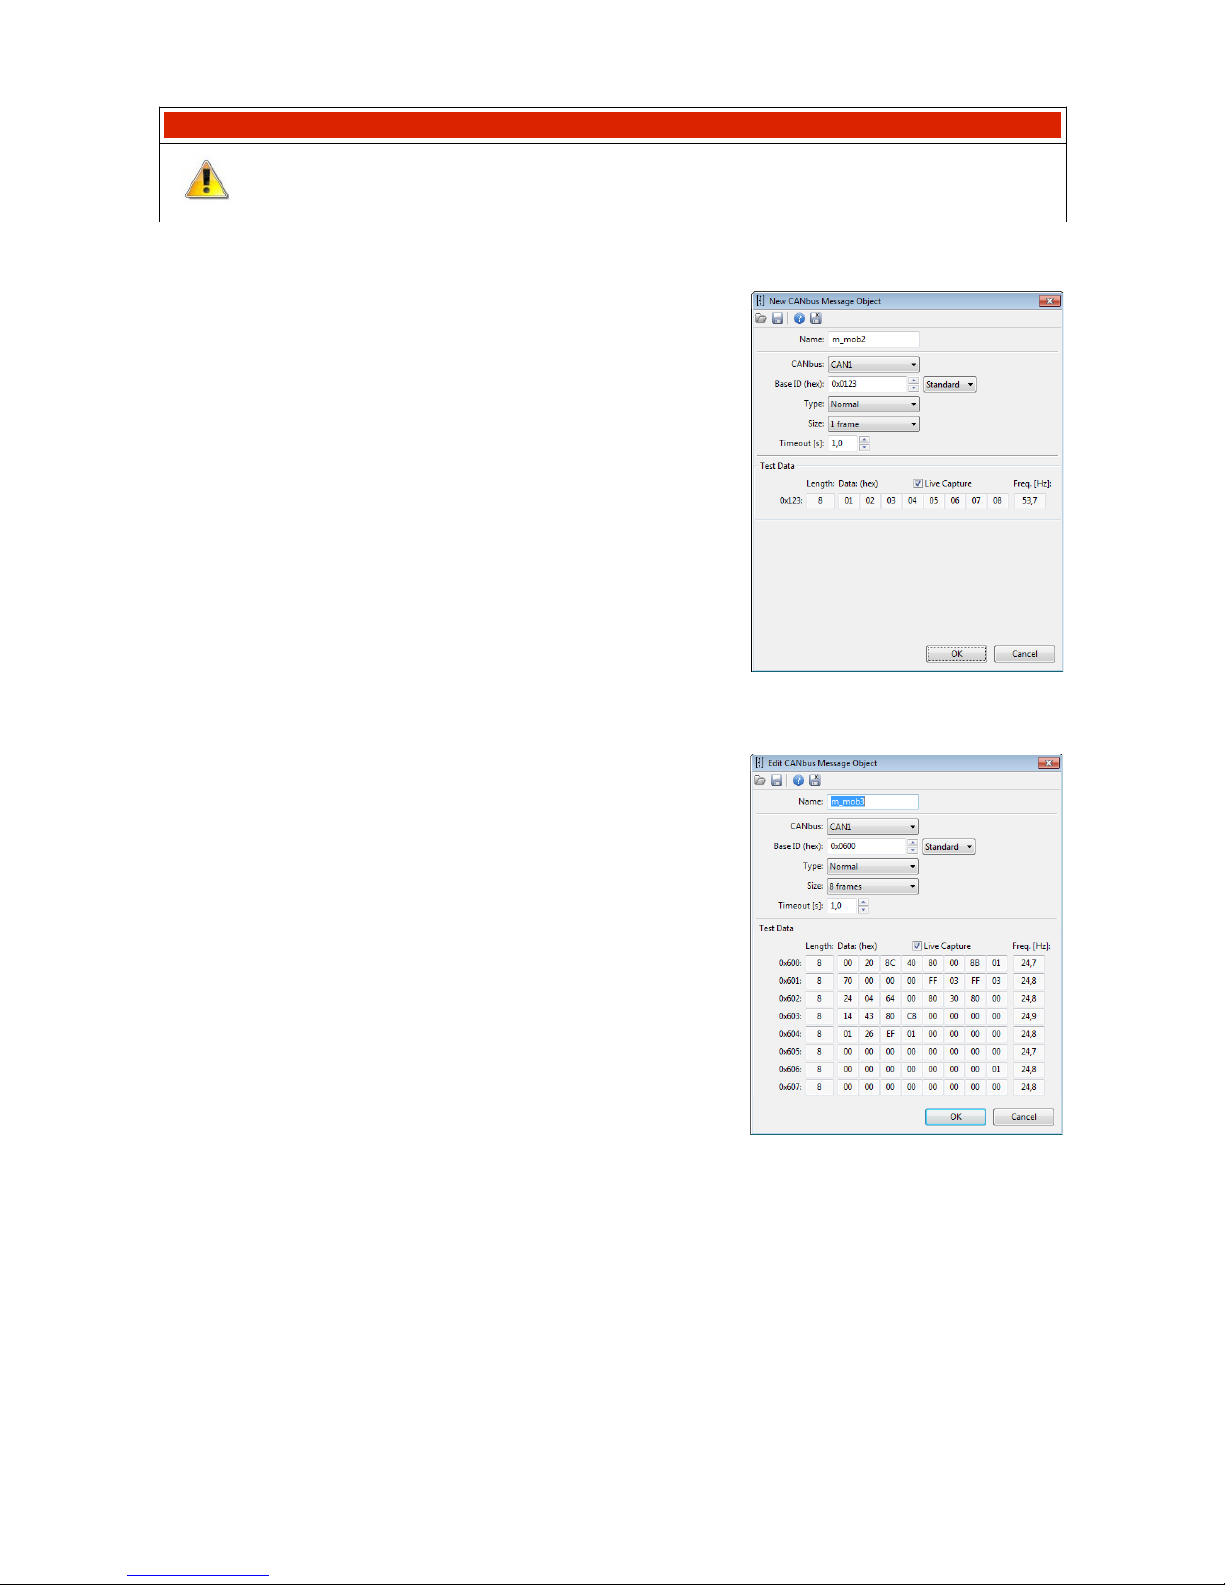
IMPORTANT!
Frame CAN IDs in the ADU Client are always presented in hexadecimal notation (they
usually begin with the 0x prefix, which is a symbol of hexadecimal notation).
Receiving 1 frame ID 0x123 Standard
• Base ID: 0x123 Standard
• Type: Normal
• Size: 1 frame
Receiving 8 frames from the range of ID 0x600 - 0x607 Standard.
• Base ID: 0x600 Standard
• Type: Normal
• Size: 8 frames
Remember that for regular frames (Type: Normal), the Base
ID must be divisible by Size without a remainder. For example,
you can receive 8 frames from the range of 0x600..607 using
one mob. However, it is not permitted to receive frames from
the range of 0x601..608 using one mob. If this is the case, this
should be divided into two mobs of 0x600..607 and 0x608.
To check if the Base ID is suitable, pay attention to the last digit in the hexadecimal notation:
– If the number is 0 or 8, then it is divisible by 8 (Size: 8)
– If the number is 0, 4, 8, C, then it is divisible by 4 (Size: 4)
– If the number is 0, 2, 4, 6, 8, A, C, E, then it is divisible by 2 (Size: 2)
– Each number is divisible by 1 (Size: 1)
Page 94/137
Page 95
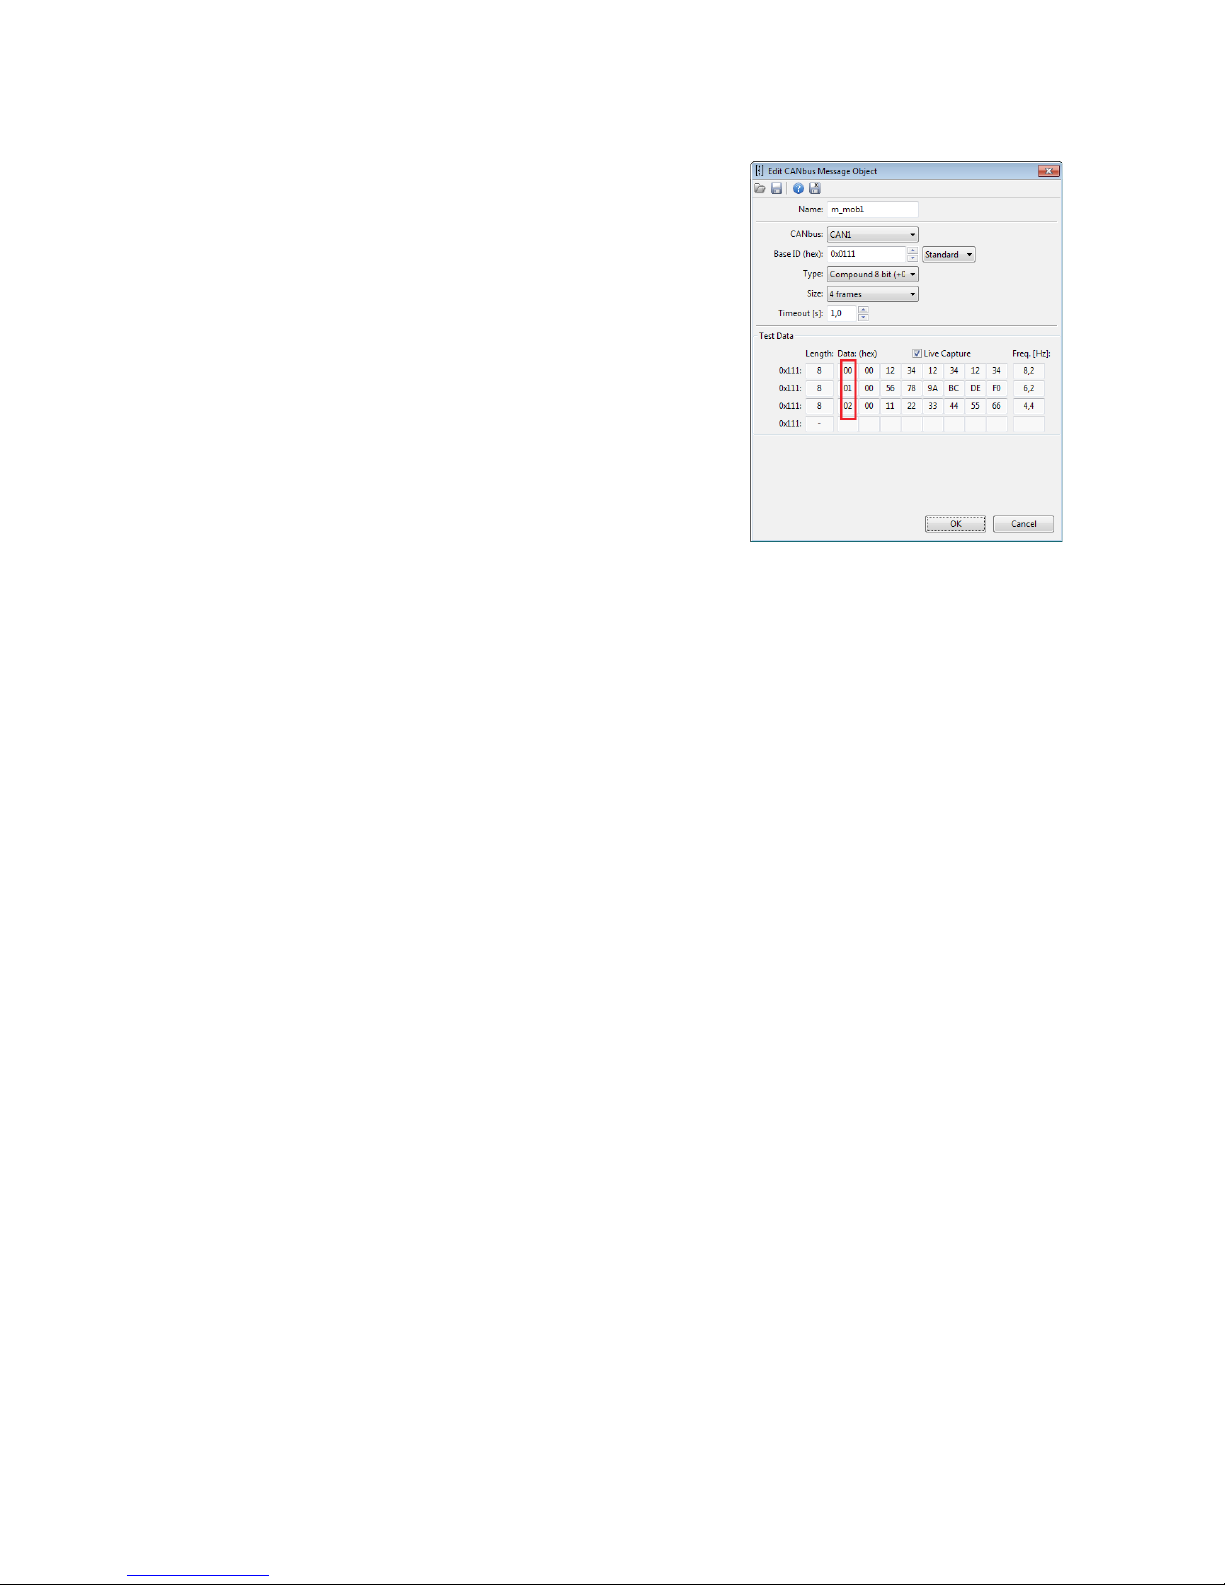
Receiving 3 Compound 8 bit frames from ID 0x111 Standard.
• Base ID: 0x111 Standard
• Type: Compound 8 bit (+0)
• Size: 4 frames
When using Compound frames the Base ID address doesn't
have to be divisible by the Size. This results from the fact that
the communication takes place using only one CAN ID.
Compound frames are characterized by containing an index on
the first 4, 8 or 16 bits (for the Compound types 4 bit, 8 bit and
16 bit, respectively). In the dialogue pane nearby you can see
the first byte in a sequence 00, 01, 02.
Page 95/137
Page 96
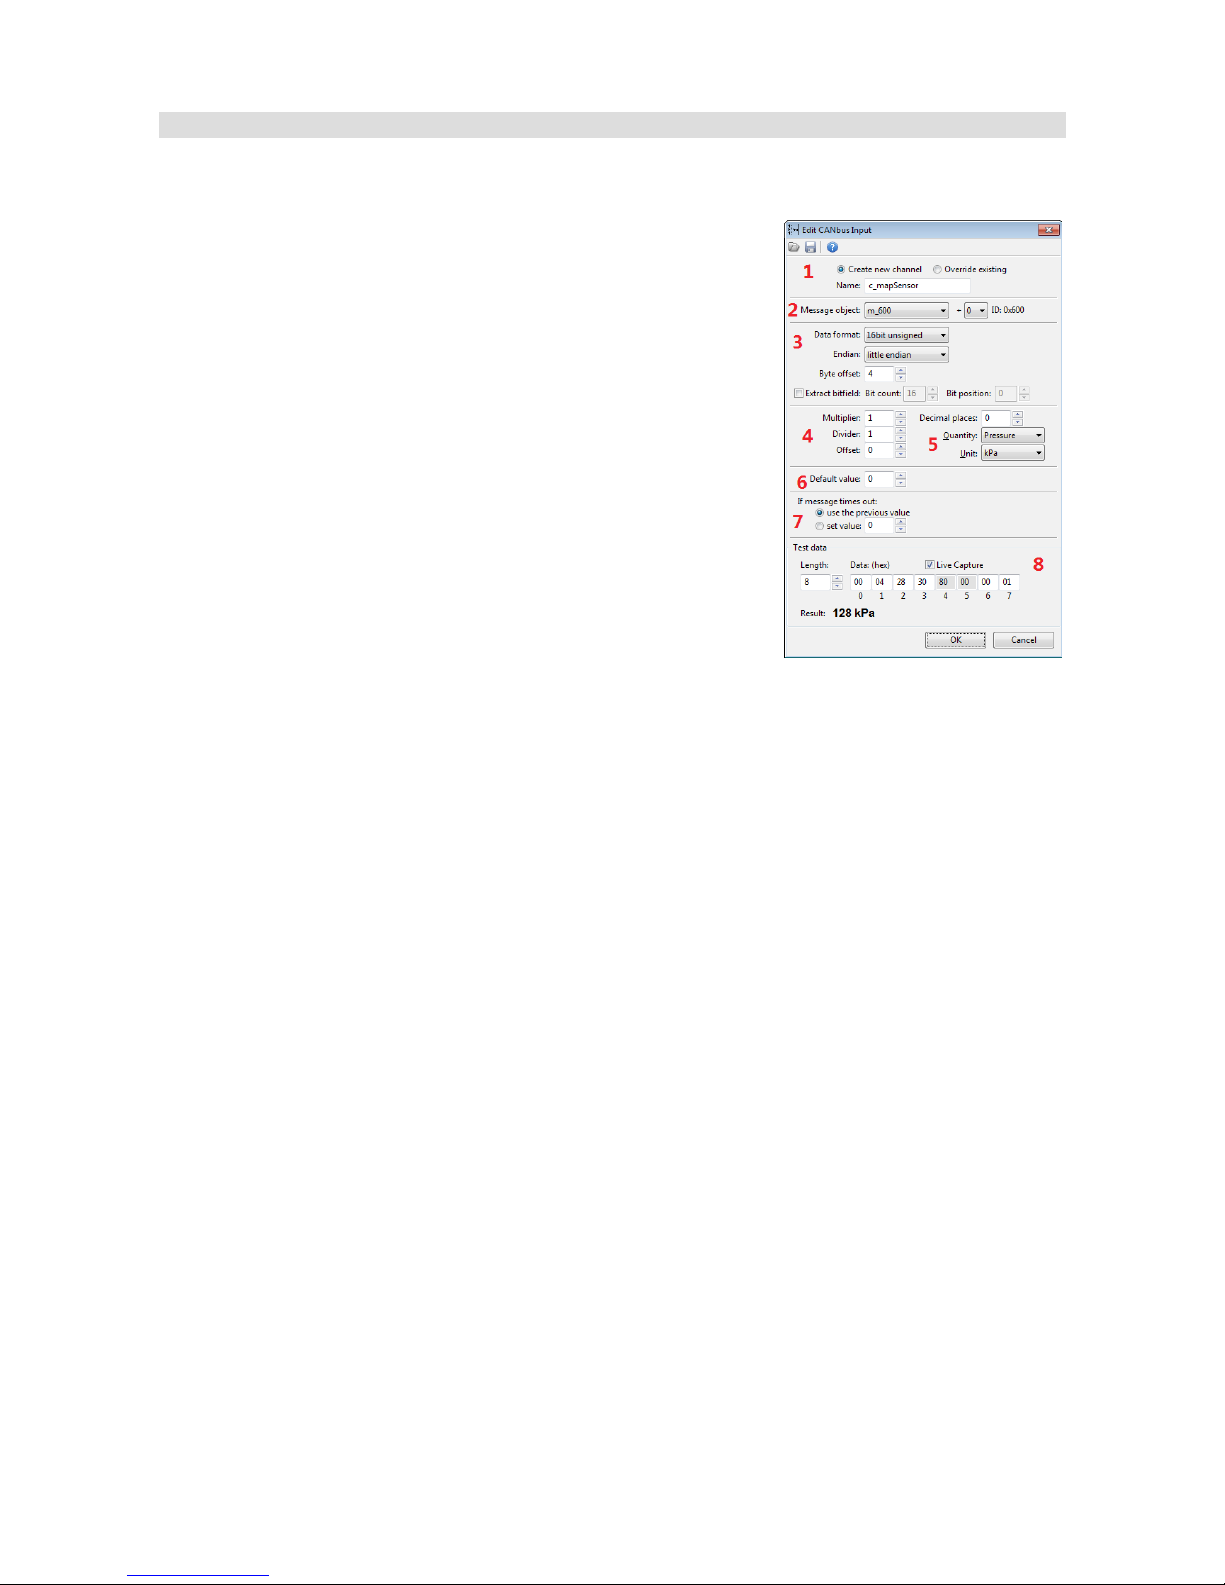
Custom Can streams - CANbus Message Input
After a Can Message Object has been created, you can start defining CANbus Input channels.
(1) For starters, decide whether you will be creating a new channel
(option: Create new channel) or whether you will be overriding an
existing channel (option: Override existing).
When creating a new channel, you should choose a unique name
so that it can be identified.
When overriding, you must choose an existing channel from the
“ecu.” group. (e.g. ecu.rpm). Additionally, you should match the
decimal places and a unit to such selected channel.
(2) Next, select the prepared mob and select offset in frames from
the list marked '+'. The scope of this parameter depends on the
selected Size in the parameters of the used Message object.
(3) The next step is setting the Byte offset parameter. It marks the location of our values in the
CAN frame (0-7).
You should select the interpretation of the number:
• signed/unsigned – signed is a number with a sign (it can receive positive and negative
values, as well as zero). An example of such value is the value from the cooling liquid
temperature sensor. Unsigned – numbers zero and above. For example engine speed
(RPM)
• 8 bit / 16 bit - number width in bits; 1 byte / 2 bytes, respectively
– signed 8 bit - scope of numbers -128..127
– signed 8 bit - scope of numbers 0..255
– signed 16 bit– scope of numbers -32768..32767
– unsigned 16 bit– scope of numbers 0..65535
• big endian / little endian - i.e. the “sequence” of bytes for 16-digit numbers. It shows how
a number stored in two consecutive bytes is to be interpreted. E.g. numbers 0x12, 0x13
can be interpreted as 0x1234 for the big endian or 0x3412 for the little endian.
Page 96/137
Page 97
• You can also define “Extract bitfield”, i.e. take only a part of an 8- or 16-bit number. For
example, to check the setting of a bit of a 0x80 mask the following settings should be used:
Bit count: 1, Bit position: 7.
(4) Next scaling / moving values, decimal places.
„Raw” (raw) value interpreted in item (3) may be scaled.
For example, Lambda in the EMU stream is saved as the value 0..255, where:
- raw value 0 means Lambda=0.0,
- raw value 128 means Lambda=1.0,
- raw value 255 means Lambda= app. 2.0,
Hence, such value should be scaled. You can use Multiplier=1000, Divider=128 and move the
decimal places using Decimal places = 3. This way, you will add the end value of 1.000 to the raw
value of 128.
(5) Selection of a physical value and the unit.
You can choose from typical units from the SI system, as well as those applied in the automotive
industry. If a unit is not on the list, you can also use the User unit.
(6) Choosing a default value.
A default value is used from starting the device until receiving the first frame containing the
channel.
IMPORTANT!
You should take into account decimal places in this constant. For example, if Decimal
places = 2 has been selected, and the default value is to be 1.0, enter the value 100 into
the field. The same requirement relates to the following fields: Offset and Timeout value.
(7) Defining behaviour in the case of a loss of frame reception in the CAN bus.
If a given frame cannot be received for a time longer than that defined in Message Object (Timeout
parameter in seconds), two options are available:
a) the last value can stay (alternatively, the default value, if a frame has never been received)
b) a specific value can be set
(8) The last element of the CANbus input defining window are Test data fields. These fields are
used only during editing. You can observe a received frame in real time (active Live capture) or
enter test data (Live capture deactivated). In both cases the calculated final value is visible, which
accelerates configuration.
Page 97/137
Page 98
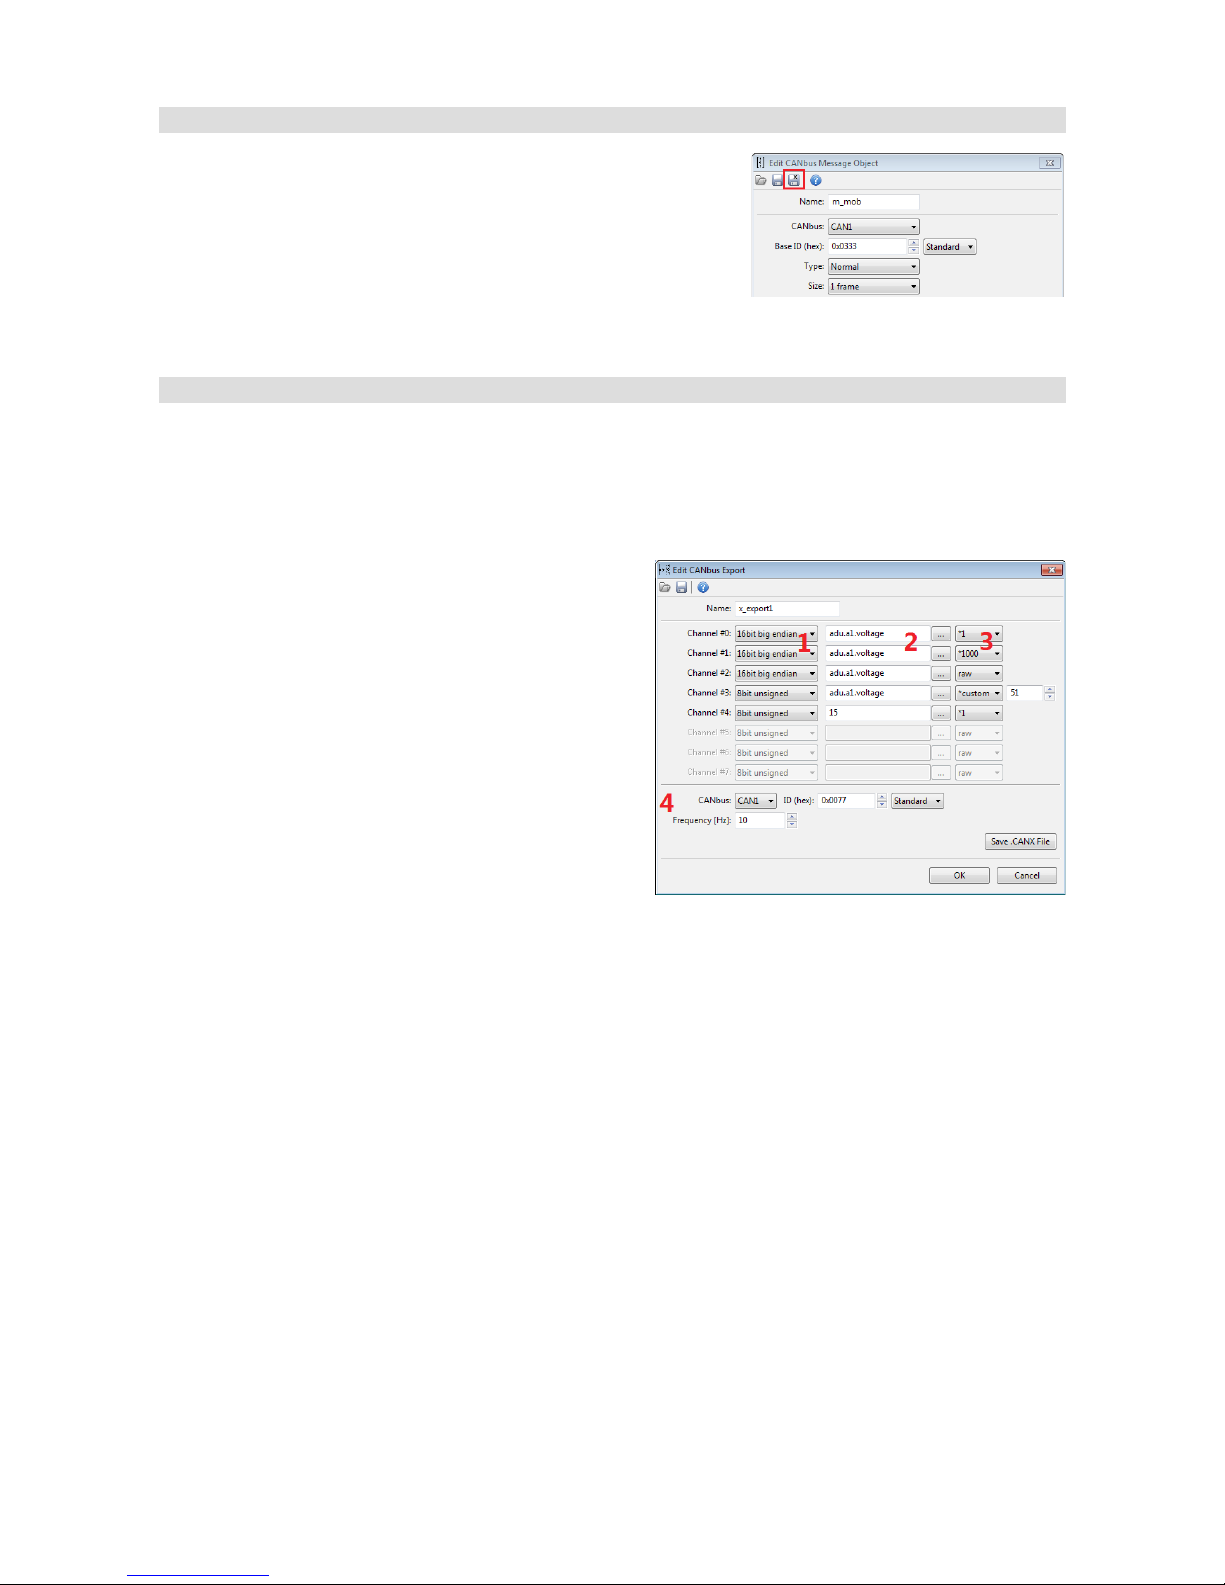
Custom CAN streams - saving to a .CANX file
A configured Message Object together with all CANbus input
channels can be saved into a .CANX file using a toolbar
button.
Sending frames by means of the CAN bus (CANbus export)
Access to the CAN bus in the ADU device is completely open, and allows sending any available
channel of the device. You can send frames of any CAN ID into one of two CAN buses.
The CANbus Export configuration pane is comprised of the following sections:
(1) Selection of the type of the data sent
There are four options available:
• 8bit unsigned - the value of the channel is
limited to a range of 0..255 and sent as a
single byte in a frame
• 8bit signed - the value of the channel is
limited to a range of -128..127 and sent as a
single byte in a frame
• 16bit big endian - the value is sent with the
most significant byte first, and least significant byte second (for example the value 0x1234
will be sent as two consecutive bytes 0x12, 0x34)
• 16bit little endian - the value is sent with the least significant byte first and most significant
byte second (for example the value 0x1234 will be sent as two consecutive bytes 0x34,
0x12)
(2) Selected channels or constants
You should select a channel from the list or enter a constant. In addition to the decimal notation, a
constant can also be saved in hexadecimal notation. For this, the prefix 0x should be used (e.g.
0xE3 or 0xe3).
(3) Selection of a multiplier or a raw value
It is possible to multiply the real values by a constant from the range of 1..1000 or, alternatively, to
send a raw value. For example - from the above figure:
Page 98/137
Page 99
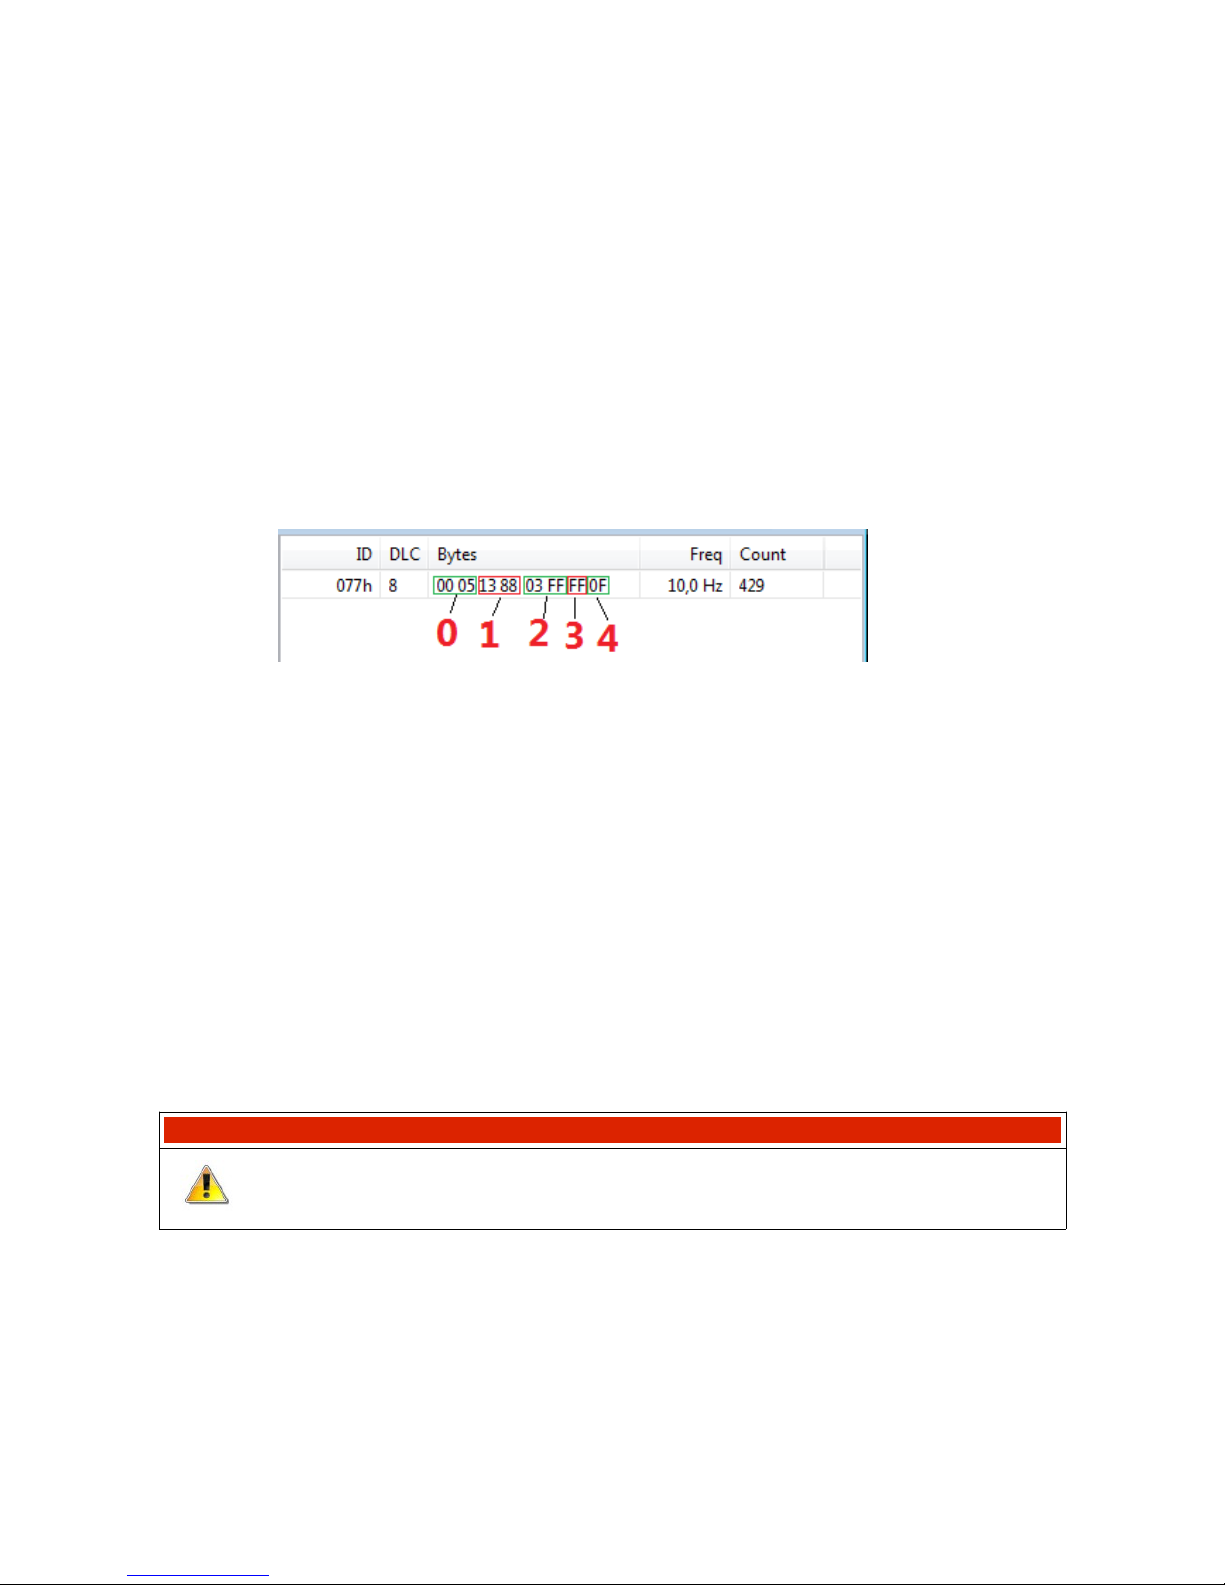
• Channel #0 - voltage value at input A1 will be sent as one from the range of 0, 1, 2, 3, 4, 5
(i.e. in volts, but without the fractional part).
• Channel #1 - voltage value at input 1A will be sent as a number from the range 0..5000 (i.e.
in milivolts)
• Channel #2 -voltage value at input 1 A will be sent as a raw value from the ADC converter,
a number from the range ..1023
• Channel #3 - voltage value at input 1A will be sent as a number from the range 0..255
• Channel #4 – a constant value will be sent - 15 decimal
Below is a frame preview as seen in the ECUMASTER Light Client application. At the A1 analogue
input the voltage is exactly 5V. Channel #0 - Channel #5, respectively, as in the above example:
• Channel #0 - value 0x0005, i.e. 5 [V]
• Channel #1 - value 0x1388, i.e. 5000 [mV]
• Channel #2 - value 0x03FF, i.e. 1023 [adc]
• Channel #3 - value 0xFF, i.e. 255
• Channel #4 - value 0x0F, i.e. 15
(4) Selection of a bus, CAN ID, sending frequency.
Select a sending frequency ranging from 1..100 Hz.
Select a CAN ID. Make sure you don’t collide with other communications in the network.
WARNING!
It is not permitted for two devices in the CAN network to send frames of
the same CAN ID !
Page 99/137
Page 100
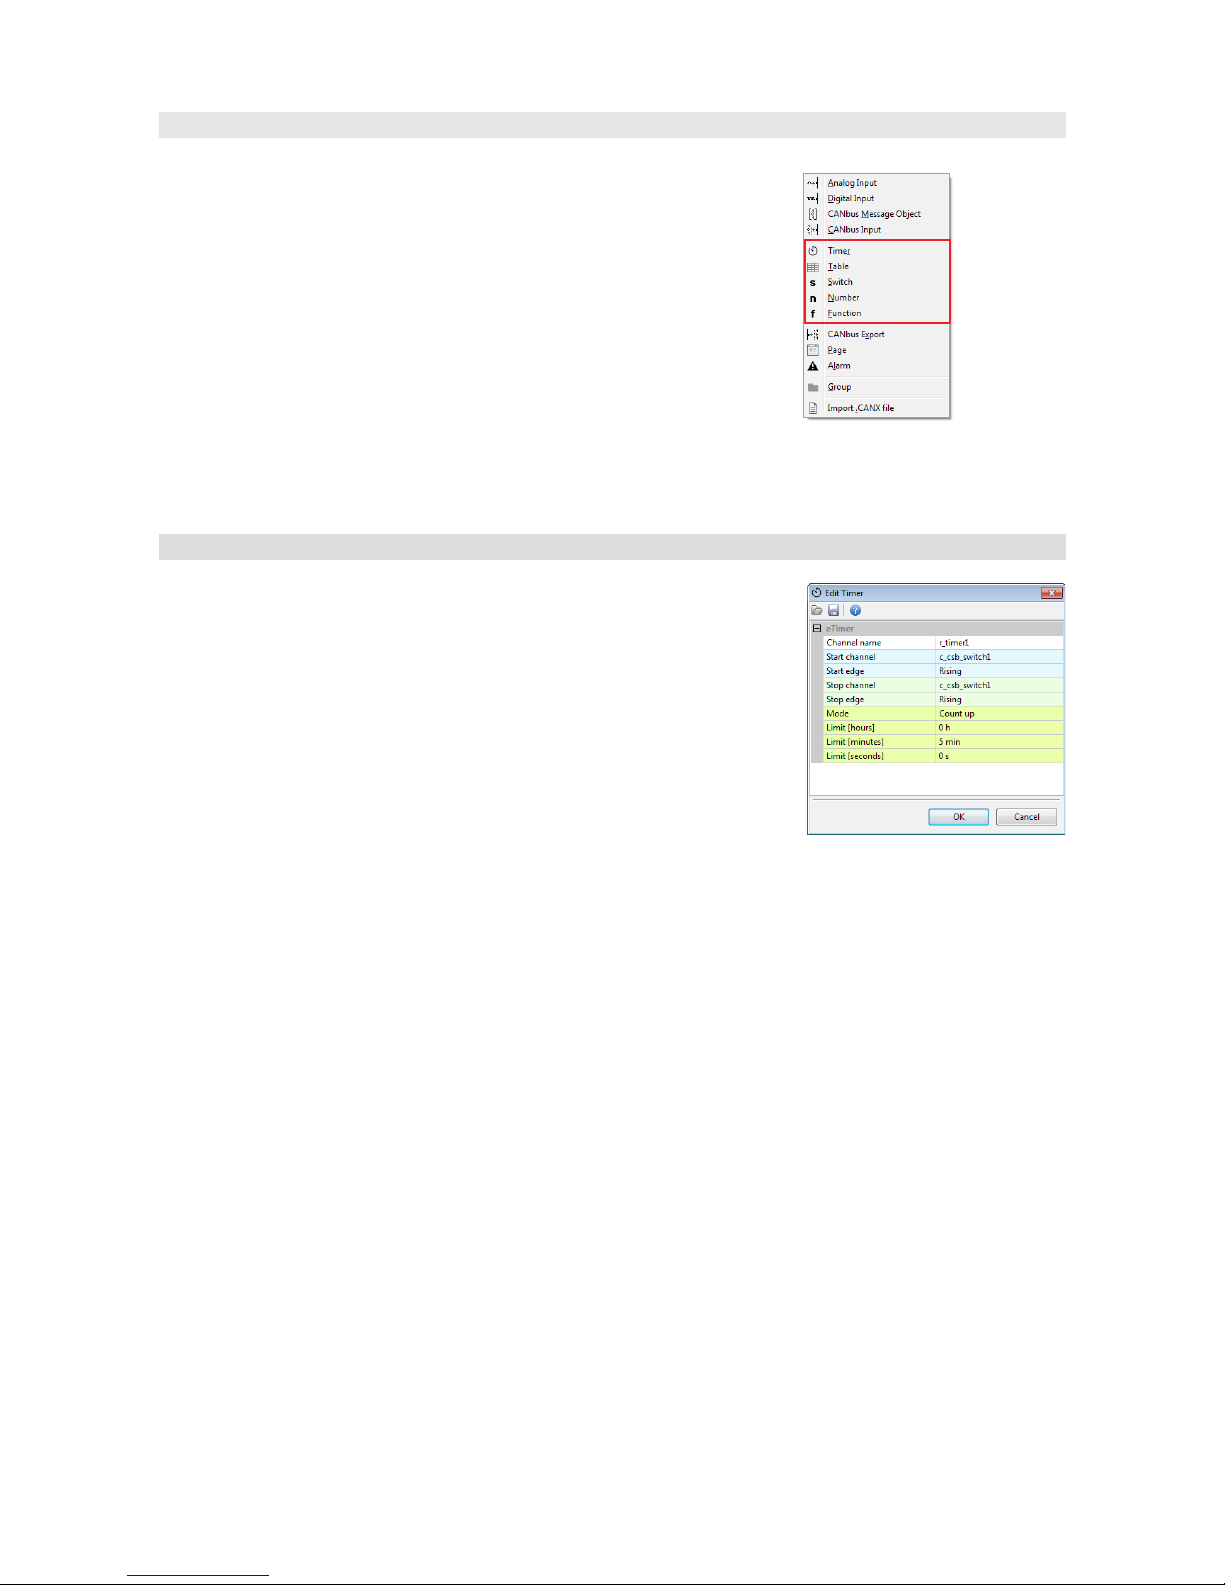
Processing information in the ADU
ADU has 5 information processing elements:
1. Timers - counting time
2. Tables - lookup tables
3. Switches - virtual switches, counters
4. Numbers - mathematical channels
5. Functions - logic functions
These elements are processed the same way as all elements in the ADU at 500 Hz (every 2 ms).
These elements are processed in the listed above order (Timers first, then Tables, and so on).
Timers
Timers are used for counting time. It is possible to count time from
zero to a predefined value (Count up) or down from predefined value
to zero (Count down).
Timers can store time up to 200 hours with an accuracy of up to 0.01
seconds.
Timers are started by means of a channel defined by Start Channel
and an edge defined by Start edge (Rising or Falling).
Similarly, Timers are stopped by means of a channel defined by Stop Channel and an edge
defined by Stop edge (Rising or Falling).
When a timer is stopped, the starting edge appearing in the Start Channel will always result in
moving to the initial value. When a timer is already started, the starting edge is ignored. A timer
will react to a starting edge only after stopping or counting to the end. This allows starting and
stopping by means of the same channel and edge.
Each created timer has 3 subchannels:
• .value - value of time in seconds (up to 0.01 seconds)
• .elapsed - has a value of “1” when the time has elapsed; it will change to “0” after another
start.
• .running - has a value of “1” when a timer is counting time
Page 100/137
 Loading...