


Dynatest
1295 PAVEMENT FRICTION TESTER
OPERATION MANUAL
Version 1.07
®
Dynatest 1295 Version 1.07 i Sep 2017
Dynatest North America, Inc.
11415 Old Roswell Road Suite 100
Alpharetta, Georgia USA
PHONE: +1 678-781-1799
FAX: +1 678-823-9952
E-mail: MI@dynatest.com

TABLE OF CONTENTS
SECTION DESCRIPTION PAGE
Section 1 Introduction
1.1 Introduction .....................................................................................1
1.2 Model 1295 System Description .......................................................1
1.3 Principles of Operation .....................................................................1
1.4 Daily Start-up Procedures ................................................................3
1.5 Model 1295 Electrical Systems Components ....................................4
1.5.1 Control Console ................................................................4, 5, 6
1.5.2 Portable Computer ............................................................7
1.5.3 Embedded Data Acquisition System .................................7
1.5.4 Operator Pendant Push Button Control .............................7
1.5.5 Printer ................................................................................7
1.5.6 Vehicle Speed Display Meter .............................................7
1.6 Tow Vehicle Rear Bed Components .................................................8
1.6.1 250/300 Gallon Baffled Water Tank ...................................9
1.6.2 12 Volt DC Battery ............................................................9
1.6.3 750 Watt Power Inverter ....................................................9
1.6.4 Inverter Bracket..................................................................9
1.6.5 12 Volt DC Air Compressor ................................................9
1.6.6 Air Preparation Unit ...........................................................9
1.6.7 External Retractable AC Power Cord .................................9
1.6.8 Four-Way AC Outlet Box ....................................................9
1.7 Tow Vehicle Underside .....................................................................10
1.7.1 Positive Displacement Water Pump ...................................10
1.7.2 Water Tank Dump Valve ...................................................10
1.8 Tow Vehicle Rear Bumper ...............................................................11
1.8.1 Continuously Adjustable Ball Hitch .....................................11
1.8.2 Water Hose Quick Disconnect ...........................................11
1.8.3 Signal Cable ......................................................................12
1.8.4 Power Cable ................................................................ .....12
1.8.5 Air Hose Quick Disconnect ................................................12
1.9 Two Wheel Trailer Components .......................................................13
1.9.1 Single/Dual Model 1270 Two-Axis Force Transducer(s) .....14
1.9.2 Digital Encoders ................................................................14
1.9.3 Laminar Flow Water Nozzle(s) ...........................................14
1.9.4 Power Disc Brakes .............................................................14
1.9.5 Brake Actuator Units ..........................................................14
1.9.6 Test Brake Pressure Regulator ..........................................14
1.9.7 Electric Lift Jacks ...............................................................15
1.9.8 Electric Lift Jack Raise/Lower Switch .................................15
1.9.9 Rear Trailer LED Lights ......................................................15
1.9.10 Air Shocks ..........................................................................15
Section 2 Calibration
2.1 Calibration menu ..............................................................................16
2.2 Force Transducer Calibration ...........................................................17
2.2.1 How to perform the Daily Force Transducer(s) Calibration ....17
Dynatest 1295 Version 1.07 ii Sep 2017

TABLE OF CONTENTS
SECTION DESCRIPTION PAGE
Section 2 2.2.2 Editing the Transducer Platform Calibration Values ...............18
2.2.3 The Two types of Force transducer(s) Calibrations ................18
2.2.4 Understanding How Friction is Calculated .............................18
2.2.5 How often Should the Force Transducer(s) be Calibrated .....19
2.2.6 Description of All Force calibration Fields ..............................19
2.2.6.1 View .........................................................................19
2.2.6.1.1 Un-calibrated ..........................................19
2.2.6.1.2 Calibrated ...............................................19
2.2.6.2 Calibrated Values ....................................................19
2.2.6.2.1 Traction Calibration .................................19
2.2.6.2.2 Load Calibration ................................ ......19
2.2.6.2.3 Trailer Weight..........................................19
2.2.6.2.4 Traction Gain ..........................................20
2.2.6.2.5 Load Gain ...............................................20
2.2.6.2.6 Traction Offset ........................................20
2.2.6.2.7 Load Offset .............................................20
2.2.6.3 Calibration Resistors ................................................20
2.2.6.4 Calibration Status ....................................................20
2.2.6.5 Calibrate Button .......................................................20
2.3 Distance and Velocity Calibration .....................................................21
2.3.1 How to Perform Automatic Distance and Speed Calibration 21
2.3.2 How to Manually Enter a Distance & Speed Calibration Value 22
2.3.3 How Often Should the Distance & Speed be Calibrated .........22
2.3.4 What Happens if the Distance & Speed Values are Incorrect .22
2.3.5 How Does Distance and Speed Calibration Function .............22
2.3.6 Description of the Distance Calibration Fields ........................23
2.3.6.1 Distance Calibration Length ......................................23
2.3.6.2 Right Wheel Encoder Calibration Value ....................23
2.3.6.3 Left Wheel Encoder Calibration Value ......................23
2.3.6.4 Vehicle Encoder Calibration Value ...........................23
2.3.6.5 Calibration Status Box ..............................................23
2.3.6.6 Calibration Button .....................................................24
2.3.6.7 Distance Traveled .....................................................24
2.3.6.8 Left Encoder Count ...................................................24
2.3.6.9 Right Encoder Count ................................................24
2.3.6.10 Vehicle Encoder Count .............................................24
2.3.6.11 Left Calibration Value ...............................................24
2.3.6.12 Right Calibration Value ............................................. 24
2.3.6.13 Vehicle Calibration Value ..........................................24
2.3.6.14 Last Calibration Value ...............................................24
2.3.6.15 Left Timer Count .......................................................24
2.3.6.16 Right Timer Count .....................................................25
2.3.6.17 Vehicle Timer ............................................................25
2.3.6.18 Left Wheel Speed .....................................................25
2.3.6.19 Right Wheel Speed ...................................................25
2.3.6.20 Vehicle Speed ..........................................................25
Dynatest 1295 Version 1.07 iii Sep 2017

TABLE OF CONTENTS
SECTION DESCRIPTION PAGE
Section 2 2.4 Temperature Sensor Calibration .......................................................26
2.4.1 Temperature Sensor Calibration ..........................................26
2.4.1.1 Air Temperature ................................................26
2.4.1.1.1 Gain .............................................26
2.4.1.1.2 Offset ...........................................27
2.4.1.2 Surface Temperature .........................................27
2.4.1.2.1 Gain .............................................27
2.4.1.2.2 Offset ...........................................27
2.4.1.3 Tire Temperature ...............................................27
2.4.1.3.1 Gain .............................................27
2.4.1.3.2 Offset ...........................................27
2.5 Flow and Level Sensor Calibration ....................................................28
2.5.1 Flow Meter and Sensor Calibration ......................................28
2.5.1.1 Flow Meter 1 ......................................................28
2.5.1.1.1 Gain .............................................28
2.5.1.1.2 Offset ...........................................28
2.5.1.2 Flow Meter 2 ......................................................28
2.5.1.2.1 Gain ............................................. 28
2.5.1.2.2 Offset ...........................................29
2.5.1.3 Water Tank Sensor ............................................29
2.5.1.3.1 Gain .............................................29
2.5.1.3.2 Offset ...........................................29
2.6.1 How to Use the Meter and DAC Calibration ...................................30
2.6.2 Meter DAC Field Descriptions .............................................31
2.6.2.1 DAC 1 – Speed DVM ........................................31
2.5.2.1.1 Gain .............................................31
2.5.2.1.2 Offset ...........................................31
2.6.2.2 DAC 2 – Left Load DVM ...................................31
2.5.2.2.1 Gain .............................................31
2.5.2.2.2 Offset ...........................................31
2.6.2.3 DAC 3 – Right Load DVM .................................31
2.5.2.3.1 Gain .............................................31
2.5.2.3.2 Offset ...........................................31
Section 3 Setup
3.1 Initial Setup of the Tow Vehicle and Trailer .......................................32
3.2 Initial Setup of the Computer For Testing .........................................33
3.3 General Software Organization ........................................................34
3.4 Software Setup Process Outline .......................................................36
Dynatest 1295 Version 1.07 iv Sep 2017

TABLE OF CONTENTS
SECTION DESCRIPTION PAGE
Section 4 Operation
4.1 Test Information Menu ......................................................................37
4.1.1 Editing Information .................................................................38
4.1.2 Loading Default .....................................................................38
4.1.3 Recalling a Template .............................................................38
4.2 Settings ............................................................................................39
4.2.1 Control Parameter Overview .................................................40
4.2.1.1 Test Type........................................................................40
4.2.1.1.1 Standard ...........................................................40
4.2.1.1.2 Chirp .................................................................40
4.2.1.1.3 Target Speed ....................................................40
4.2.1.1.4 Speed Range ....................................................40
4.2.1.1.5 Test Suspension Speed ....................................40
4.2.1.2 Test Cycle Sequence ......................................................40
4.2.1.2.1 Manual ..............................................................41
4.2.1.2.2 Auto ..................................................................41
4.2.1.3 Test Wheel Sequence ....................................................41
4.2.1.3.1 Left ....................................................................41
4.2.1.3.2 Right..................................................................41
4.2.1.3.3 Alternate (L-R) ...................................................41
4.2.1.3.4 Alternate (R-L) ....................................................41
4.2.1.4 Test Start .......................................................................42
4.2.1.4.1 Start Test by Pendant at DMI Start ....................42
4.2.1.4.2 Start Test by Pendant after DMI ........................42
4.2.1.4.3 Start Test on Distance From DMI ......................42
4.2.1.4.4 Auto Test Start Distance....................................42
4.2.1.5 Test Stop .......................................................................42
4.2.1.5.1 Pendant .............................................................42
4.2.1.5.2 Distance ............................................................42
4.2.1.6 Test Time Parameters ...................................................43
4.2.1.6.1 Time parameter 1 ..............................................43
4.2.1.6.2 Time Parameter 2..............................................43
4.2.1.6.3 Time Parameter 3..............................................43
4.2.1.6.4 Time Parameter 4..............................................43
4.2.1.6.5 Time Parameter 5..............................................43
4.2.1.7 DMI – Distance Measuring Instrument ...........................43
4.2.1.7.1 DMI (Units) .........................................43
4.2.1.7.2 DMI Starting Distance .........................43
4.2.1.7.3 Count UP or Down ..............................43
4.2.1.8 Miscellaneous ...............................................................
4.2.1.8.1 System Units..............................................................44
4.2.1.8.1.1 US/English .....................................................44
4.2.1.8.1.2 Metric .............................................................44
4.2.1.9 Test Watering ................................................................44
4.2.1.9.1 Wet ...................................................................44
4.2.1.9.2 Dry ....................................................................44
4.2.1.9.3 Pre-wet ..............................................................44
Dynatest 1295 Version 1.07 v Sep 2017

TABLE OF CONTENTS
SECTION DESCRIPTION PAGE
Section 4
4.2.1.10 Data Average Filter ..............................................44
4.2.1.11 Display Settings…………………………………….45
4.2.1.11.1 Speed ...............................................45
4.2.1.11.2 DMI ...................................................45
4.2.1.11.3 SN ....................................................45
4.2.1.11.4 SN Display Value ..............................45
4.2.1.12 Cycle Options ......................................................45
4.2.1.12.1 Water Control Options ......................45
4.2.1.12.2 Nozzle control Options ...................... 45
4.2.1.12.3 Air Compressor Options ...................45
4.2.1.13 GPS Settings .......................................................45
4.2.1.13.1 GPS Bearing ....................................45
4.2.1.13.2 GPS Coordinate display ...................46
4.2.1.14 ROW Camera Settings ........................................46
4.2.1.14.1 Mounted upside down .......................46
4.2.1.14.2 Image Inspector ................................46
4.2.1.14.3 Image Inspector Duration..................46
4.2.1.15 Vehicle Dashboard Display Settings ....................46
4.3.1 Trend Graph Description ....................................................47
4.3.2.1 Trend Chart Field Definitions ..........................................48
4.3.2.1 SN Interval – Friction Trend Chart .......................48
4.3.2.1.1 SN Average .......................................48
4.3.2.1.2 SN Max .............................................48
4.3.2.1.3 SN Min ..............................................48
4.3.2.1.4 Y-Scale Min .......................................48
4.3.2.1.5 Y-Scale Max ......................................48
4.3.2.1.6 X-Scale .............................................48
Dynatest 1295 Version 1.07 vi Sep 2017

TABLE OF CONTENTS
SECTION DESCRIPTION PAGE
Section 4 4.3.2.2 SN Interval – Traction Force Trend Chart .............49
4.3.2.2.1 Traction Average ...............................49
4.3.2.2.2 Traction Max .....................................49
4.3.2.2.3 Traction Min ......................................49
4.3.2.2.4 Y-Scale Min .......................................49
4.3.2.2.5 Y-Scale Max ......................................49
4.3.2.2.6 X-Scale .............................................49
4.3.2.2.7 Auto Y-Scale .....................................49
4.3.2.2.8 Manual Y-Scale ..................................49
4.3.2.3 SN Interval – Load Force Trend Chart ................49
4.3.2.3.1 Load Force Average ..........................49
4.3.2.3.2 Load Force Max ................................50
4.3.2.3.3 Load Force Min .................................50
4.3.2.3.4 Y-Scale Min .......................................50
4.3.2.3.5 Y-Scale Max .......................................50
4.3.2.3.6 X-Scale .............................................50
4.3.2.3.7 Auto Y-Scale .....................................50
4.3.2.3.8 Manual Y-Scale .................................50
4.3.2.4 SN Interval – Speed Trend Chart ........................50
4.3.2.4.1 Vehicle Speed Average .....................50
4.3.2.4.2 Vehicle Speed Max ...........................50
4.3.2.4.3 Vehicle Speed Min ............................50
4.3.2.4.4 Y-Scale Min .......................................50
4.3.2.4.5 Y-Scale Max .......................................50
4.3.2.4.6 X-Scale .............................................51
4.3.2.4.7 Auto Y-Scale .....................................51
4.3.2.4.8 Manual Y-Scale .................................51
4.3.2.5 SN Interval – Flow Trend Chart ...........................51
4.3.2.5.1 Flow Average ....................................51
4.3.2.5.2 Flow Max ...........................................51
4.3.2.5.3 Flow Speed Min .................................51
4.3.2.5.4 Y-Scale Min .......................................51
4.3.2.5.5 Y-Scale Max .......................................51
4.3.2.5.6 X-Scale .............................................51
4.3.2.5.7 Auto Y-Scale .....................................51
4.3.2.5.8 Manual Y-Scale .................................51
4.3.2.6 SN Interval – Standard Deviation Trend Chart ....52
4.3.2.6.1 Friction SN Standard Deviation .........52
4.3.2.6.2 Traction Force Standard Deviation ....52
4.3.2.6.3 Load Force Standard Deviation .........52
4.3.2.6.4 Vehicle Speed Standard Deviation ....52
4.3.2.6.5 Flow Rate Standard Deviation ...........52
4.3.2.6.6 Y-Scale Min ......................................52
4.3.2.6.7 Y-Scale Max .......................................52
4.3.2.6.8 X-Scale .............................................52
4.3.2.6.9 Auto Y-Scale .....................................52
Dynatest 1295 Version 1.07 vii Sep 2017

TABLE OF CONTENTS
SECTION DESCRIPTION PAGE
Section 4 4.3.2.6.10 Manual Y-Scale ...................................52
4.3.2.7 Locking Interval – Friction Trend Chart ...............53
4.3.2.7.1 SN at Peak ........................................53
4.3.2.7.2 SN Max .............................................53
4.3.2.7.3 SN Min ..............................................53
4.3.2.7.4 Y-Scale Min .......................................53
4.3.2.7.5 Y-Scale Max .......................................53
4.3.2.7.6 X-Scale .............................................53
4.3.2.7.7 Auto Y-Scale .....................................53
4.3.2.7.8 Manual Y-Scale .................................53
4.3.2.8 Locking Interval – Traction Trend Chart ..............53
4.3.2.8.1 Traction at Peak ................................53
4.3.2.8.2 Traction Max .....................................53
4.3.2.8.3 Traction Min ......................................53
4.3.2.8.4 Y-Scale Min .......................................54
4.3.2.8.5 Y-Scale Max .......................................54
4.3.2.8.6 X-Scale .............................................54
4.3.2.8.7 Auto Y-Scale .....................................54
4.3.2.8.8 Manual Y-Scale .................................54
4.3.2.9 Locking Interval – Load Trend Chart ...................54
4.3.2.9.1 Load Force Average ..........................54
4.3.2.9.2 Load Force Max ................................54
4.3.2.9.3 Load Force Min .................................54
4.3.2.9.4 Load Force @ Peak ..........................54
4.3.2.9.5 Y-Scale Min ........................................54
4.3.2.9.6 Y-Scale Max .......................................54
4.3.2.9.7 X-Scale .............................................55
4.3.2.9.8 Auto Y-Scale .....................................55
4.3.2.9.9 Manual Y-Scale .................................55
4.3.2.10 Locking Interval – Speed Trend Chart ................55
4.3.2.10.1 Vehicle Speed Average ....................55
4.3.2.10.2 Vehicle Speed Max .........................55
4.3.2.10.3 Vehicle Speed Min ..........................55
4.3.2.10.4 Vehicle Speed @ Peak ....................55
4.3.2.10.5 Wheel Speed @ Peak .....................55
4.3.2.10.6 Y-Scale Min .....................................55
4.3.2.10.7 Y-Scale Max .....................................55
4.3.2.10.8 X-Scale ............................................55
4.3.2.10.9 Auto Y-Scale ...................................56
4.3.2.10.10 Manual Y-Scale .............................56
4.3.2.11 Locking Interval – Flow Rate Trend Chart ...........56
4.3.2.11.1 Flow Rate Average ...........................56
4.3.2.11.2 Flow Rate Max ................................56
4.3.2.11.3 Flow Rate Min .................................56
4.3.2.11.4 Flow Rate Peak ...............................56
Dynatest 1295 Version 1.07 viii Sep 2017

TABLE OF CONTENTS
SECTION DESCRIPTION PAGE
Section 4 4.3.2.11.5 Y-Scale Min ................................ 56
4.3.2.11.6 Y-Scale Max .....................................56
4.3.2.11.7 X-Scale ...........................................56
4.3.2.11.8 Auto Y-Scale ...................................56
4.3.2.11.9 Manual Y-Scale ...............................56
4.3.2.12 Locking Interval – Misc. Trend Chart ...................57
4.3.12.1 % Slip at Peak .....................................57
4.3.12.2 Time to Peak .......................................57
4.3.12.3 Time to Lockup ....................................57
4.3.12.4 Y-Scale Min ........................................57
4.3.12.5 Y-Scale Max ........................................57
4.3.12.6 X-Scale ..............................................57
4.3.12.7 Auto Y-Scale ......................................57
4.3.12.8 Manual Y-Scale ..................................57
4.4 Installed hardware field descriptions ..................................58
4.4.2 Force Transducers ..................................................59
4.4.2.1 Left Wheel ...........................................59
4.4.2.2 Right Wheel .........................................59
4.4.3 Water Equipment and Sensors ...............................59
4.4.3.1 Flow Meters .........................................................59
4.4.3.2 Water Pumps .......................................................59
4.4.3.3 Water Tanks ........................................................59
4.4.4.1 DMI Distance Measuring Instrument ....................59
4.2.4.4.1 Left Wheel ........................................59
4.2.4.4.2 Right Wheel ......................................59
4.2.4.4.3 Vehicle .............................................59
4.4.5 Test Start/Stop Devices
4.4.5.1 Pendant ...............................................60
4.4.5.2 Photocell .............................................60
4.4.6 Temperature Sensors
4.4.6.1 Air Temperature Sensor ......................60
4.4.6.2 Surface Temperature Sensor...............60
4.4.6.3 Left Tire Temperature Sensor..............60
4.4.6.4 Right Tire Temperature Sensor ...........60
4.4.6.5 TankTemperature Sensor ....................60
4.4.7 Additional Equipment
4.4.7.1 Printer .................................................60
4.4.7.2 GPS ....................................................61
4.4.7.3 Right of Way Camera ..........................61
4.4.7.4 Vehicle Dash Display ..........................61
4.4.7.5 Inclinometer .........................................61
4.4.7.6 Accelerometer .....................................61
4.4.7.7 Texture Sensor ....................................61
Dynatest 1295 Version 1.07 ix Sep 2017

TABLE OF CONTENTS
SECTION DESCRIPTION PAGE
Section 4 4.5 Storage and Printing Field Descriptions ............................................62
4.5.1 Data Storage ...........................................................62
4.5.2 File Name ..............................................................62
4.5.3 File Directory ...........................................................63
4.5.4 Test Set Number .....................................................63
4.5.5 Default File Setting……………………………………63
4.5.6 Output Files ............................................................63
4.6 Miscellaneous .................................................................................63
4.6.1 Test Printing ............................................................63
4.6.2 Print Disk Files ........................................................64
4.7 F Key Events ......................................................................................65
4.8 SN Correction ....................................................................................66
4.9 Diagnostics ........................................................................................67
4.9.1 Encoders and Timers ..........................................................67
4.9.1.1 dt meters and measurement theory ....................67
4.9.1.2 Speed Meters ....................................................68
4.9.1.3 Encoder Count Meters .......................................68
4.10.1 Analog I/O ........................................................................70
4.10.2 Analog Hardware Overview.................................70
4.10.3 Trace Select ........................................................71
4.11.1 Digital I/O ..........................................................................72
4.11.2 Digital Inputs:Port1,Port2,Port3 ...........................72
4.11.3 Digital Outputs:Port1,Port2 .................................73
4.12 Testing ...........................................................................................75
4.12.1 Test Screen Layout ...........................................................75
4.12.2.1 SN Average .....................................................76
4.12.2.2 SN Max ................................ ............................76
4.12.2.3 SN Min .............................................................76
4.12.2.4 SN Standard Deviation .....................................76
4.12.2.5 Traction Average ..............................................76
4.12.2.6 Traction Max ....................................................76
4.12.2.7 Traction Min .....................................................76
4.12.2.8 Traction Standard Deviation .............................77
4.12.2.9 Load Average...................................................77
4.12.2.10 Load Max .........................................................77
4.12.2.11 Load Min ..........................................................77
4.12.2.12 Load Standard Deviation ..................................77
4.12.2.13 Speed Average ................................................77
4.12.2.14 Flow Average ...................................................77
4.12.2.15 Peak SN (PSN) ................................................77
4.12.2.16 Time To Peak (TTP).........................................77
Dynatest 1295 Version 1.07 x Sep 2017

TABLE OF CONTENTS
SECTION DESCRIPTION PAGE
Section 4
4.12.2.17 % Slip ..............................................................77
4.12.2.18 Time To Lockup (TTL) ......................................77
4.13 Setups……………………………………………………………………..78
Section 5 Troubleshooting
5.1 Troubleshooting ................................................................................79
5.2 Troubleshooting the Software ...........................................................79
5.2.1 Rebooting the 1295 Operating Software ............................81
5.2.2 Troubleshooting the 1295 Electronics ................................81
Section 6 Maintenance
6.1 Preventative Maintenance ................................................................82
6.2 Service Schedule (Tow Vehicle) .......................................................82
6.3 Service Schedule (Trailer) ................................................................83
6.3.1 Replacing the Trailer Wheel Bearings ................................86
6.3.2 Measure Wheel Bearing Endplay .......................................86
6.3.3 Brake Bleeding Procedure (Trailer) ....................................87
6.3.4 Verifying/Adjusting Trailer Brake Pressures .......................87
6.3.4.1 Safety Brakes ......................................................88
6.3.4.2 Left Or Right Wheel Lockup Brakes .....................88
6.3.4.2.1 Safety Brakes ....................................88
6.3.4.2.2 Test Brake(s) .....................................89
6.3.5 Aligning the Water Pump Gearbox with the Drive Shaft .....90
6.3.6 Adjusting the Water Pump Belts (Tow Vehicle) .................90
6.3.7 Adjusting the Electric Clutch (Water Pump) .......................91
Dynatest 1295 Version 1.07 xi Sep 2017

SECTION 1 INTRODUCTION
1.1 INTRODUCTION
This manual contains the descriptive information, operation, setup, and service instructions for the 1295
Computer Controlled Pavement Friction Tester manufactured by Dynatest. (Figure 1-1)
The purpose of this manual is to provide the instructions necessary to insure the proper operation and
maintenance of the 1295. Adherence to the instructions will insure satisfactory operation.
1.2 1295 SYSTEM DESCRIPTION
The 1295 Pavement Friction Tester has been developed to perform dry or self-wetted locked wheel
(skid) and peak incipient (slip) friction testing for paved surfaces (see Figure 1-1). The 1295 is designed
to operate at speeds between 20 to 70 MPH (30 to 110 km/hr) while computing the dynamic skid
number FN(t).
The computerized 1295 consists of a fully instrumented tow vehicle and two wheel trailer which uses
one or two M1270 two-axis force transducer(s) mounted on the axle assembly. All electronic
instrumentation is solid state, including a Portable laptop computer and a printer. Windows software
provided with the system allows the operator perform friction testing, enter test information, configure
test settings, calibrate the system and perform system diagnostics .
The on-board computer calculates the dynamic skid number FN(t) from the two-axis force transducer
in real time, and displays the friction and speed traces on the laptop test screen. Test headers, skid
numbers, as well as curves and peak incipient friction, if desired, can be printed or stored on a laptop
hard drive/ SSD. Additional software capabilities include automatic system calibration, full system
diagnostics, and adjustable test cycle timing (within ASTM E274 specifications).
1.3 PRINCIPLES OF OPERATION
Friction testing on pavement is accomplished by using one of two recognized methods. These methods
are the Continuous Peak Friction Test and the Locked Wheel Friction Test. The 1295 Pavement
Friction Tester utilizes the Locked Wheel Friction Test method.
First, the operator selects whether the test is to be dry or wet. Next, the two wheel trailer is brought up
to test speed prior to reaching the test site. The brake on the right or left test wheel is applied until it is
locked. The wheel must achieve lock-up within the pre-programmed limit, while the test vehicle is
held at a constant speed (+/- 1 MPH). Tire braking traction force, vehicle speed, and all other desired
parameters are recorded when the brake is first applied during the test cycle. Those parameters continue
to be recorded until the test tire is unlocked. Peak and locked wheel sliding forces are calculated by
the computer for each specific test run. The test results are displayed both graphically and numerically
on the laptop, and are stored on hard disk drive.
Dynatest 1295 Version 1.07 1 Sep 2017

SECTION 1 INTRODUCTION
Figure 1-1. Model 1295 Pavement Friction Tester
Dynatest 1295 Version 1.07 2 Sep 2017

SECTION 1 INTRODUCTION
1.4 DAILY START-UP PROCEDURES
1. Some mechanical checks are required to maintain the accuracy of the test vehicle and trailer. It is
recommended that the tow vehicle tire pressure be checked daily to avoid excessive wear on the
tires. The tire manufacturer’s tire pressure recommendations are listed on the tire. The tires
should be inflated to the maximum pressure listed due to extreme weight conditions.
2. Check the trailer tires daily. Prior to each series of tests, warm up the tires by traveling for at least
5 miles (10 km) at normal traffic speeds. Replace the tire if it has been worn beyond the wear
line(s). Set the E501 and E524 test tire inflation pressure at 24 0.5 psi (165 3 kPa) at ambient
temperature just before the 5 mile (10 km) warm-up. (See ASTM E 274).
3. A daily check of the air shocks should be done to verify the proper amount of air pressure is
maintained in them. 50 psi (345 kPa) of air is needed to maintain level and to provide a stable
ride.
4. Proper maintenance of the tow vehicle (as described in the owner's manual) DOES NOT eliminate
the need for daily fluid level checks, belt inspections, etc.
5. A daily visual inspection of the trailer and under the cover should consist of the areas where fluid
leaks may occur. This includes such areas as the brake caliper area on both spindles, the hose
connections, and also in the area of the master cylinder. Detection of leaks may occur early with
the observation of areas with excessive moisture, and/or areas where dirt begins to collect.
6. The water tank, can be filled to its capacity. Verify first that the drain valve is closed. An internal
overflow tube will allow the tank to fill to capacity without flowing over the tank fill tube.
7. If the pneumatic lines are disconnected from the trailer, the tow vehicle pneumatic storage tanks
will maintain their pressure. If the pneumatic lines are NOT disconnected from the trailer, the
system will deplete itself of air pressure. This is due to the design of the valves on the trailer to
continuously exhaust. If the system becomes depleted, the tow vehicle compressor may be used
to recharge the pneumatic system, or the system may be recharged by an external compressor
source.
8. Inspect the trailer jacks to see that they are fully retracted. Inspect the trailer attaching points to
see that the trailer is properly coupled to the tow vehicle, and that the safety chain, water, air, and
electrical connectors are properly connected.
9. It is necessary to calibrate of the DYNATEST 1295 system each time power has been turned off.,
Perform calibration on a level surface, with the tow vehicle in park, and your foot off the brake.
All power must be on (AC and DC). Allow the system to warm-up 15 minutes prior to
calibration. To perform system calibration, refer to Initial Setup.
10. When traveling to and from test sites it is recommended that the DC power and compressor power
be ON to allow the test trailer's service brakes to assist in stopping.
Dynatest 1295 Version 1.07 3 Sep 2017

SECTION 1 INTRODUCTION
1.5 1295 ELECTRICAL SYSTEM COMPONENTS
All electric power for the 1295 is provided by a single 135 amp. alternator driven off the tow vehicle's
engine. The following information is designed to familiarize the operator with the 1295's electrical
system components located inside the tow vehicle's cab.
1.5.1 CONTROL CONSOLE
This console is located between the driver and the passenger seats inside the tow vehicle's cab (see
Figure 1-3). Located on the top of the console are a series of electronic rocker switches and status
lights. The console layout is shown below in figure 1-2.
Figure 1-2. Console Layout
Dynatest 1295 Version 1.07 4 Sep 2017

SECTION 1 INTRODUCTION
1.5.1 CONTROL CONSOLE
AC Power On/Off Switch
Turns power ON and OFF for the 1295's power inverter supplies 120 Volt AC power for the portable
PC and printer.
DC Power On/Off Switch
Turns 12 Volt DC battery power ON and OFF for the 1295's solid state logic, meters, and switching
functions within the main console. This 12 Volt DC battery is located in the rear bed of the tow
vehicle.
Compressor On/Off Switch
Turns 12 Volt DC power ON and OFF to the pressure switch which energizes the air compressor in
the rear bed of the tow vehicle. The compressor is responsible for operating the 1295's air system,
which raises and lowers the Laminar flow water nozzle(s), and controls the air over hydraulic brakes
on the two wheel trailer.
Flasher On/Off Switch
Turns the the alternating flashers on top of the two wheel trailer.
Emergency Stop Button
For immediately terminating the Automatic Test cycle in case of an emergency. Press the button one
(1) time to end the Automatic Test cycle, and release the test brakes. Pressing the emergency button
will abort the pavement friction test in progress.
Operator Pendant Jack
For plugging in the operator hand pendant. The hand pendant is responsible for STARTING the test
cycle. The operator programs the computer to automatically stop the test cycle. This hand pendant is
also used to start and stop the distance calibration of the digital encoders on the two wheel trailer, and
to START and STOP the distance testing.
Compressor Status Light
Indicates when the air compressor in the rear bed of the tow vehicle is pumping air into the air system
on the two wheel trailer. The compressor is automatically controlled by a pressure switch to maintain
approximately 80 PSI (552 kPa). The compressor will not operate during a test run.
Dynatest 1295 Version 1.07 5 Sep 2017

SECTION 1 INTRODUCTION
IMPORTANT
Processor Ready Status Light
Indicates that the embedded data acquisition computer is running and is ready for Ethernet
communication to the laptop. The laptop should NOT be turned on until the Status light blinks. Once
blinking the light indicates that the communications for the software are ready for use.
If the compressor light comes on during a test, that indicates there is
inadequate pressure to conduct the test, and a test fault may occur.
Figure 1-3. Laptop PC and Control Console
Dynatest 1295 Version 1.07 6 Sep 2017

SECTION 1 INTRODUCTION
1.5.2. LAPTOP COMPUTER
The current model 15 inch laptop computer is equipped at minimum with:
Intel Core I7processor @ 2.70 GHz or better
Minimum 8 GB Random Access Memory (RAM).
Ethernet communication ports.
Minimum of a 500 Gb hard disk drive or SSD
The computer operating system is Windows 7 or 10 that includes option to down grade to
Windows 7.
The 1295 Windows software is used for friction testing and data analysis
1.5.3 EMBEDDED DATA ACQUISITION SYSTEM
The data acquisition system is equipped with::
16 channel, 16 bit Analog to Digital Converter
4 channel, 12 bit Digital to Analog Converter.
Optically Isolated Digital I/O.
Ethernet Communication Port.
Serial Communication Ports
1.5.4. OPERATOR PENDANT PUSH BUTTON CONTROL
This control allows the operator to start the automatic test cycle without taking their eyes off the road.
The control can easily be held in one hand during the entire testing procedure.
1.5.5. PRINTER
The printer is supplied for printing hardcopy test results and report printouts.
1.5.6. VEHICLE SPEED DISPLAY
This dashboard mounted meter allows the operator to view the accurate vehicle test speed. The meter
is connected to the system's computer. The right or left test wheel, whichever is not locked during
friction testing, supplies the digital speed and distance pulses to the computer.
Dynatest 1295 Version 1.07 7 Sep 2017

SECTION 1 INTRODUCTION
1.6 TOW VEHICLE REAR BED COMPONENTS
The following information is designed to help the operator identify the electrical and mechanical
components located in the rear bed of the tow vehicle (see Figure 1-4).
Figure 1-4. Tow Vehicle Rear Bed Components
Dynatest 1295 Version 1.07 8 Sep 2017

SECTION 1 INTRODUCTION
1.6.1 250/300 GALLON BAFFLED WATER TANK
This corrosion resistant water tank has interior baffling to minimize the effects of water motion, and a
vent to ensure continuous water flow. At the bottom of the tank is a serviceable water filter to ensure
the self-watering system does not plug. The tank is filled through the screw-on cap located on top of
the tank. Optional larger tank systems available.
1.6.2 12 VOLT DC BATTERY
Operates the 1295's 12 Volt DC electronics. This battery is isolated from the tow vehicle's 12 Volt DC
battery during shut-down.
1.6.3 POWER INVERTER
Supplies 120 Volt AC power to the monitor, computer, printer, and electronic power supplies.
1.6.4 INVERTER BRACKET
This bracket supports the power inverter. Mounted on the outside of the bracket are several relays; one
relay starts the power inverter, and another to starts the air compressor.
1.6.5 12 VOLT DC AIR COMPRESSOR
This compressor is responsible for operating the air system on the two wheel trailer. This air system
raises and lowers the Laminar flow water nozzles and supplies air to the air over hydraulic brakes on
the two wheel trailer.
1.6.6 AIR PREPARATION UNIT
This unit is mounted on the water tank and includes the air filter, dryer, pressure switch, and pressure
gauge for the air system. The drying agent used in the dryer is desiccant. Its condition can be
determined by the color code on the side of its container. New desiccant is blue and turns pink when it
needs to be replaced.
1.6.7 EXTERNAL RETRACTABLE AC POWER CORD
This power cord supplies external 120 Volt AC power to the power inverter for operating the computer
and printer on AC power and for charging the rear battery.
1.6.8 FOUR-WAY AC OUTLET BOX
This AC outlet box allows the operator to plug in the power inverter, used for external AC power-up
of the computer and printer.
Dynatest 1295 Version 1.07 9 Sep 2017

SECTION 1 INTRODUCTION
1.7 TOW VEHICLE UNDERSIDE
Underneath the cab of the tow vehicle are several components for the self-watering system.
1.7.1 POSITIVE DISPLACEMENT WATER PUMP
There is one (1) pump mounted on a steel bracket directly underneath the tow vehicle's cab. The pump
is gear belt driven off the drive shaft and idler assembly by means of a 12 Volt DC electric clutch and
gearbox assembly. This gearbox and idler assembly, along with the gear belt pulleys, provides the
necessary gear reduction to drive the pump at the proper speed for the desired water flow.
1.7.2 WATER TANK DUMP VALVE
This valve is located directly underneath the driver’s door on the tow vehicle's cab. The valve allows
the operator to quickly dump water from the baffled water tank in the rear bed of the tow vehicle.
NOTE
Underneath the tow vehicle are two (2) nine (9) gallon (40 liter) air storage tanks,
for the pneumatic system.
Dynatest 1295 Version 1.07 10 Sep 2017

SECTION 1 INTRODUCTION
Air Connection
P/N 002318
Water Connection
P/N 002323
Adjustable Hitch
P/N 016420
Trailer Signal
Connector
P/N 001715
Trailer Power
Connector
P/N 001714
Safety Chains
Trailer Jack
P/N 002631
1.8 TOW VEHICLE REAR BUMPER
The following information is designed to familiarize the operator with the various connections between
the tow vehicle and the two wheel trailer (see Figure 1-5).
Figure 1-5. Tow Vehicle Rear Bumper
1.8.1 CONTINUOUSLY ADJUSTABLE BALL HITCH
This feature allows the operator to vertically raise and lower the ball hitch which levels the tongue on
the two wheel trailer. Leveling the two wheel trailer is required in order to properly align the two-axis
force transducer(s) with the test pavement.
1.8.2 WATER HOSE QUICK DISCONNECT
This feature allows the operator to quickly disconnect the 1.5 inch (3.5mm) diameter water hose(s), for
the 1295's self-watering system, from the tow vehicle.
Dynatest 1295 Version 1.07 11 Sep 2017

SECTION 1 INTRODUCTION
Air Connection
P/N 002318
Water Connection
P/N 002323
Adjustable Hitch
P/N 016420
Trailer Signal
Connector
P/N 001715
Trailer Power
Connector
P/N 001714
Safety Chains
Trailer Jack
P/N 002631
1.8.3 SIGNAL CABLE
This cable connects the two-axis force transducer(s) on the two wheel trailer with the tow vehicle's
electronics. An environmental connector on the rear bumper of the tow vehicle is provided for this
connection.
1.8.4 POWER CABLE
This cable allows the 12 Volt DC power from the tow vehicle to be transferred to the 12 Volt DC
electronics on the two wheel trailer. An environmental connector on the bumper of the tow vehicle is
provided for this connection.
1.8.5 AIR HOSE QUICK DISCONNECT
This connector allows the operator to quickly disconnect the 1/4 inch (6 mm) diameter air line, for the
two wheel trailer's air system, from the tow vehicle.
Figure 1-6. Tow Vehicle / Trailer Hookup Illustration.
Dynatest 1295 Version 1.07 12 Sep 2017

SECTION 1 INTRODUCTION
Air Connection
P/N 002318
Water Connection
P/N 002323
Adjustable Hitch
P/N 016420
Trailer Signal
Connector
P/N 001715
Trailer Power
Connector
P/N 001714
Safety Chains
Trailer Jack
P/N 002631
1.9 TWO WHEEL TRAILER COMPONENTS
This information is designed to familiarize the operator with the various mechanical and electrical
components on the two wheel trailer. The trailer is constructed of 2 x 4 inch (50 x100 mm) rectangular
box sectional steel tubing with a 2 inch (50 mm) ball coupler. The suspension uses a parallelogram
trailing arm design with upper and lower control arms mounted on each side of the trailer. Coil springs,
air adjustable shock absorbers, and an anti-sway bar are used in the trailer's suspension.
Figure 1-7. Two Wheel Trailer and Components
Dynatest 1295 Version 1.07 13 Sep 2017

SECTION 1 INTRODUCTION
1.9.1 SINGLE/DUAL M1270 TWO-AXIS FORCE TRANSDUCER(S)
Depending upon customers specifications, one (1) or two (2) force transducers are mounted next to the
test wheels. These transducers provide the dynamic vertical load and horizontal tractive force
measurements and their outputs are fed into the computer to provide the Dynamic Friction Number
FN(t) in real time.
1.9.2 DIGITAL ENCODERS
There are two (2) encoders on the 1295. They are mounted on the axle assembly by both test tires.
These encoders provide accurate distance and tow vehicle velocity pulses, as well as instantaneous
locked wheel velocities.
1.9.3 LAMINAR FLOW WATER NOZZLE(S)
Depending upon customer specifications, one (1) or two (2) 7 inch (178 mm) water nozzles are mounted
directly in front of the trailer's test wheel(s), and are controlled by the computer. During testing, the
right or left nozzle, whichever the operator has selected, will provide a uniform .020 inch flow of water
on the pavement at any speed during self-wetted testing. When the operator selects self-wetted testing
in the Auto Cycle Setup menu, the Laminar flow nozzle selected will remain in the down position
throughout testing.
NOTE
The Laminar Flow Nozzle will retract upward when the 1295 is NOT in
the TEST MODE or the 1295 system is in reverse. This feature is
provided to prevent damage to the nozzle(s).
1.9.4 POWER DISC BRAKES
Located on both trailer wheels, these hydraulic brakes are capable of providing lock-up for the left or
right test wheel. Safety brakes are applied on the trailer when the tow vehicle's brakes are applied.
1.9.5 BRAKE ACTUATOR UNITS
Located on the panel directly behind the electrical enclosure (underneath the front trailer cover), these
two (2) units consist of a truck style brake chamber mounted to an automobile brake master cylinder.
One brake actuator unit per test wheel is connected to a disc brake caliper. The braking system is air
over hydraulic. Valves located directly below the master cylinder apply the brakes. Brakes can be
applied by depressing the tow vehicle brakes and also by computer control.
1.9.6 TEST BRAKE PRESSURE REGULATOR
An adjustable air pressure control is provided to adjust the desired brake line pressure for wheel lockup. To increase brake line pressure, screw the adjustment knob IN, to decrease pressure, screw the
adjustment knob OUT.
NOTE
Brake Line Pressure On The hydraulic pressure gauge must be adjusted
to 1000 psi (6895 kPa) of hydraulic pressure 55 to 60 psi (345 kPa to 415
kPa) air pressure on test brake regulator gauge).
Dynatest 1295 Version 1.07 14 Sep 2017

SECTION 1 INTRODUCTION
1.9.7 ELECTRIC LIFT JACKS
These two (2) jacks operate off the 12 Volt DC battery located in the rear bed of the tow vehicle.
Located on either side of the two wheel trailer, these jacks lift the trailer off the ground during test tire
changeover. Manual handles are also provided in case of power jack failure.
1.9.8 ELECTRIC LIFT JACK RAISE/LOWER SWITCH
This switch is mounted on an electrical cabinet underneath the two wheel trailer's cover. There are
three (3) positions to this switch:
UP = Raise
MIDDLE = Locked
DOWN = Lower
1.9.9 REAR TRAILER LED LIGHTS
The rear of the trailer is fitted with dual (2) tail, brake, and turn signal lights. Four (4) red alternately
flashing safety lights are mounted on the trailer for use during testing. They are turned ON by the
Flashers On Switch on the Main Console.
1.9.10. AIR SHOCKS
The axle is suspended on air shocks. For proper operation the shocks should be inflated to 50 PSI (344
kPa). This will also be necessary to keep the trailer level.
Dynatest 1295 Version 1.07 15 Sep 2017

SECTION 2 CALIBRATION
2.1 CALIBRATION MENU
Locate the CALIBRATION menu button on the main menu screen.
1. Press the ‘Calibration’ button with the mouse to enter the CALIBRATION section of the program.
Figure 2-1: Main Menu Screen
2. There are five (5) calibration pages which are listed below.
To access any of the calibration pages press the calibration tab of interest with the mouse
1 Force Transducer
2 Distance and Velocity
3 Temperature
4 Flow and Level
5 Meters and DAC
Dynatest 1295 Version 1.07 16 Sep 2017

SECTION 2 CALIBRATION
2.2 FORCE TRANSDUCER Calibration
Figure 2-2: Force Transducer Calibration Screen (dual transducer system shown)
2.2.1 How to perform the Daily Force Transducer(s) Calibration
1. Verify that the trailer is level by putting a level on the trailer tongue
2. Verify that the traction, load and trailer weight platform calibration values are correct
3. Press the ‘Calibrate’ button with the mouse
4. Wait for the computer to calculate the gain and offset trim values.
5. View the corrected calibration force values by selecting the view / calibrated selection. The traction and
load offset meters should read close to zero.
Dynatest 1295 Version 1.07 17 Sep 2017

SECTION 2 CALIBRATION
2.2.2 Editing the Transducer Platform Calibration Values
To change the force transducer platform calibration values it is necessary to press the ‘Edit’ button with the
mouse. The calibration values are saved by pressing ‘Save’ button with the mouse .
NOTE: Dynatest has supplied the customer with a copy of the master platform calibration values
for the two-axis force transducer(s) when the 1295 was shipped.
2.2.3 The Two Types of Force Transducer(s) Calibration
To fully understand the calibration process it is important to understand the different types and aspects of how a
friction measurement system is calibrated. There are two different types of force transducer calibration.
Calibration Type I
The first type of calibration is called a daily ‘trim calibration’ it is performed before each test session.
This is the calibration process described in the above calibration section. This calibration usually takes about five
minutes to perform and dos not require any special equipment. Each time the system is turned on this ‘trim
calibration’ must be performed.
Calibration Type II
The second type of calibration is called a ‘platform’ calibration. This is a long term calibration that is usually
performed at an annual or semi-annual interval. This calibration is used to determine the traction, load and trailer
weight calibration values that are used in the ‘trim calibration’ described in ‘Calibration Type I’ above. This
calibration is performed in about one hour. This calibration requires an air bearing platform, a floor mounted air
bearing platform anchor, an air compressor source, and air bearing electronic signal conditioning hardware.
2.2.4 Understanding How Friction is Calculated
The measurement system requires an accurate force calibration to produce accurate friction measurements.
The force transducer is used to measure the applied force in the traction and load axis. The trailer must be level to
achieve an accurate calibration. The calibration process involves taking force transducer measurements with the
system computer
Friction (F) is calculated as mu = traction / load Skid Number (SN) is calculated as SN = mu x 100
Meters are used to display the transducer forces in pounds or kilograms. The meters are positioned in a left and
right force transducer grouping. If the system has a left force transducer the left meter grouping will be visible
If the system has a right force transducer the right meter grouping will also be visible
The traction force meter displays the traction force. (horizontal axis)
The traction force offset meter displays the traction offset force. (horizontal axis)
The load force meter displays the load force (vertical axis)
The load force offset meter displays the load offset force (vertical axis)
Dynatest 1295 Version 1.07 18 Sep 2017

SECTION 2 CALIBRATION
2.2.5 How Often Should the Force Transducer(s) be Calibrated?
A ‘Platform’ Calibration should generally be performed on an annual or semi-annual basis. It should also be
performed whenever a force transducer is removed for any reason from the trailer system.
The daily calibration must be performed each time the operator starts up the 1295 friction testing software. You
cannot perform a friction test unless the operator has performed a daily calibration.
2.2.6 Description of All Force Calibration Fields
2.2.6.1 View
The view selections let the operator view calibrated or un-calibrated transducer force values
2.2.6.1.1 Uncalibrated
This selection allows the force meters to display un-calibrated force values
2.2.6.1.2 Calibrated
This selection allows the force meters to display calibrated force values
2.2.6.2 Calibration Values
The calibration values are entered into this section. This section also displays the computer generated
calibration gain and offset numbers.
2.2.6.2.1 Traction Calibration
The traction calibration value is the force that is electronically applied to the force
transducer by inserting a resistive shunt across the traction resistive bridge
circuit. The resistive shunt is automatically connected by the computer system.
The traction calibration value is shown on the traction force meter.
2.2.6.2.2 Load Calibration
The load calibration value is the force that is electronically applied to the force
transducer by inserting a resistive shunt across the load resistive bridge
circuit. The resistive shunt is automatically connected by the computer system.
The load calibration value is shown on the load force meter.
2.2.6.2.3 Trailer Weight
The trailer weight calibration value is the actual weight of the trailer in pounds or
kilograms. The trailer weight value is also shown on the load force meter.
Dynatest 1295 Version 1.07 19 Sep 2017

SECTION 2 CALIBRATION
2.2.6.2.4 Traction Gain
The traction gain number is a computer generated value that is calculated from
the automated system calibration. The traction gain number has units of
pounds / volt or kilograms / volt
2.2.6.2.5 Load Gain
The load gain number is a computer generated value that is calculated from the
automated system calibration. The load gain number has units of pounds / volt
or kilograms / volt
2.2.6.2.6 Traction Offset
The traction offset number is a computer generated value that is calculated from
the automated system calibration. The traction offset number has units of
pounds or kilograms
2.2.6.2.7 Load Offset
The load offset number is a computer generated value that is calculated from the
automated system calibration. The load offset number has units of pounds or
kilograms
2.2.6.3 Calibration Resistors
The calibration resistors can be manually turned on and off for diagnostic purposes
by pressing the ‘Resistor On or Off’ with the mouse. When the calibration
resistors are turned on the ‘Calibrate’ indicator will turn red.
2.2.6.4 Calibration Status
This display line is used to guide the operator through the force transducer calibration
process. Follow the instructions given on this line to perform the calibration.
2.2.6.5 Calibrate Button
The system can be calibrated by pressing the calibration button. Follow the instructions in
the upper right instruction box. The ‘Calibrate’ button can be selected by the
mouse. The computer will automatically calibrate the system calibration values.
The calibration time and date are recorded after each calibration is performed and is saved
in the data storage header information.
NOTE: It is very important that the proper traction gain, load gain and trailer weight
calibration values have entered into the system. If these calibration values are
not correct the system calibration will be in error.
Dynatest 1295 Version 1.07 20 Sep 2017

SECTION 2 CALIBRATION
2.3 DISTANCE AND VELOCITY
Figure 2-3: Distance and Velocity calibration
2.3.1 How to Perform an Automatic Distance and Speed Calibration
1) Press the ‘Calibrate’ button with mouse . This will initialize the calibration.
2) While moving at a steady speed, press the operator pendant at the test section starting location.
3) Drive the vehicle in a straight line and press the operator pendant when reaching the test section stop
location. (The vehicle must be moving at all times during the calibration, do not stop )
Note: The system will now calculate the distance and velocity calibration value.
4) Press the ‘Save’ button with the mouse.
Dynatest 1295 Version 1.07 21 Sep 2017

SECTION 2 CALIBRATION
2.3.2 How to Manually Enter a Distance and Speed Calibration Value
1) Press the ‘Edit’ button with mouse.
2) Enter the calibration value into the appropriate encoder box.
3) Press the ‘Save’ button with the mouse.
2.3.3 How Often Should the Distance and Speed be Calibrated?
1) If an encoder has been repaired or replaced or removed for service
2) If new tires have been installed on the trailer or vehicle
3) If you notice that your speed differs from your vehicle speedometer by more than 3 mph (5 kph)
4) If you have accidentally modified your calibration value and are not sure what the original value should be.
5) Before and after any critical project where data accuracy is critical. It is strongly recommended that a
distance and speed calibration be performed before and after performance related testing is performed to
bracket the test data as proof that the distance and speed related measurements are accurate and documented.
2.3.4 What Happens if the Distance and Speed Calibration Values are Incorrect?
1) The DMI reading will not be correct. If the test is setup for auto testing based on distance the start of the
test will not correspond with the correct DMI mark
2) The vehicle measured speed will not be correct. Friction values vary with test speed. If your speed is not
correct, your friction values will not represent true values for the specified test speed.
2.3.5 How Does Distance and Speed Calibration Function ?
The system uses a device called an ‘Encoder” to generate pulses when the vehicle tire rotates. Encoders are
mounted on each trailer wheel axle and in some systems also on the test vehicle. A digital pulse train is generated
as the encoder is turned.
___ ___ ___
The digital trace looks like this __| |__| |___| |___
To calibrate the encoder it is necessary to count the number of encoder pulses over a known distance interval.
Then a unit distance value can be calculated for a single encoder pulse.
Distance Per Encoder Pulse = Total Distance Traveled / Encoder Pulses Counted
The Distance Per Encoder Pulse value measured in Inches or Millimeters is call the “Distance and Speed
calibration Factor”
When the operator pendant is pressed at the start of the measured distance test section the computer then begins to
count the pulses. When the operator pendant is pressed at the end of the measured test section the computer stops
counting the pulses.
Dynatest 1295 Version 1.07 22 Sep 2017

SECTION 2 CALIBRATION
2.3.6 Description of the Distance Calibration Fields
To manually enter the calibration values, it is necessary to press the ‘Edit’ button with the mouse. The selections
can be saved by pressing ‘Save’ with the mouse.
If the distance scale factor is not known then a distance calibration must be performed.
After completion of the distance calibration, this field will be automatically updated with
the new distance scale factor after the ‘Save’ button is pressed by the mouse.
2.3.6.1 Distance Cal Length
This is the known distance length that the distance calibration test will be conducted over. This known
distance must be accurately measured. The distance calibration accuracy is only as good as the accuracy
of this measured distance.
This value is entered in Feet if English Measurement Units are used.
This value is entered in Meters if Metric Measurement Units are used.
Note 1: Short distance calibration site lengths are not as accurate as longer calibration site lengths. A
minimum of 1000 feet (304.8 meters) should be used
Note 2: The distance calibration should generally be conducted at the vehicle speed the skid testing is
to be performed at, to minimize the effects of tire growth.
2.3.6.2 Right Wheel Encoder Calibration Value
This is the calibrated distance value for the right wheel encoder. The calibration value has units of in
inches or millimeters per encoder pulse.
2.3.6.3 Left Wheel Encoder Calibration Value
This is the calibrated distance value for the left wheel encoder. The calibration value has units of in inches
or millimeters per encoder pulse.
2.3.6.4 Vehicle Encoder Calibration Value
This is the calibrated distance value for the vehicle encoder. The calibration value has units of in inches or
millimeters per encoder pulse.
2.3.6.5 Calibration Status Box
This display line is used to guide the operator through the distance calibration process. Follow the
instructions given on this line to perform the distance calibration.
Dynatest 1295 Version 1.07 23 Sep 2017

SECTION 2 CALIBRATION
2.3.6.6 Calibration Button
This button is used to start and/or stop the distance calibration if the button selection is active for the start
or stop method. The calibration ‘Calibrate’ button can be actuated by the mouse. Follow the instructions
in the calibration status box
2.3.6.7 Distance Traveled
The distance travel during the calibration test is displayed in this field. The distance units are feet or
meters.
2.3.6.8 Left Encoder Count
This field displays the number of encoder pulses counted for the left encoder.
2.3.6.9 Right Encoder Count
This field displays the number of encoder pulses counted for the right encoder.
2.3.6.10 Vehicle Encoder Count
This field displays the number of encoder pulses counted for the vehicle encoder.
2.3.6.11 Left Calibration Value
This field displays the new encoder calibration value for the left encoder.
2.3.6.12 Right Calibration Value
This field displays the new encoder calibration value for the right encoder.
2.3.6.13 Vehicle Calibration Value
This field displays the new encoder calibration value for the vehicle encoder.
2.3.6.14 Last Calibration – Stored in data file header
Time - Recorded Time of Last Calibration
Date - Recorded Date of Last Calibration
2.3.6.15 Left Timer Count
This field displays the measured time value used for generating the timing parameters for the calculation
of the left wheel speed or vehicle speed. The time value is measure for the duration of each encoder pulse.
Dynatest 1295 Version 1.07 24 Sep 2017

SECTION 2 CALIBRATION
2.3.6.16 Right Timer Count
This field displays the measured time value used for generating the timing parameters for
the calculation of right wheel speed or vehicle speed. The time value is measure for the
duration of each encoder pulse.
2.3.6.17 Vehicle Timer Count
This field displays the measured time value used for generating the timing parameters for the calculation
of vehicle speed. The time value is measure for the duration of each encoder pulse. This is used for
systems that have dual force transducers.
2.3.6.18 Left Wheel Speed
This field displays the calculated wheel speed. The left wheel speed units are miles per hour or kilometers
per hour.
2.3.6.19 Right Wheel Speed
This field displays the calculated wheel speed. The right wheel speed units are miles per hour or
kilometers per hour.
2.3.6.20 Vehicle Speed
This field displays the calculated wheel speed. The vehicle speed units are miles per hour or kilometers
per hour.
Dynatest 1295 Version 1.07 25 Sep 2017

SECTION 2 CALIBRATION
2.4 TEMPERATURE SENSOR CALIBRATION
Figure 2-4: Temperature calibration
2.4.1 Temperature Sensor Calibration
This calibration page is for entering calibration values for temperature sensors. To enter the calibration values it is
necessary to press the ‘Edit’ button by using the mouse. To save the calibration values press the ‘Save’ button by
using the mouse.
2.4.1.1 Air Temperature
The air temperature sensor values are displayed in voltage and Fahrenheit or Celsius degree units.
2.4.1.1.1 Gain
The air temperature gain calibration value has units of (Fahrenheit degree/volt)
(Celsius degree/volt)
Dynatest 1295 Version 1.07 26 Sep 2017

SECTION 2 CALIBRATION
2.4.1.1.2 Offset
The air temperature offset calibration value has units of (Fahrenheit degrees) or
(Celsius degrees)
2.4.1.2 Surface Temperature
The surface temperature sensor values are displayed in voltage and Fahrenheit or Celsius degree units.
2.4.1.2.1 Gain
The surface temperature gain calibration value has units of (Fahrenheit degree/volt) or
(Celsius degree/volt)
2.4.1.2.2 Offset
The surface temperature offset calibration value has units of (Fahrenheit degrees) or
(Celsius degrees)
2.4.1.3 Tire Temperature
The tire temperature sensor values are displayed in voltage and Fahrenheit or Celsius degree units.
2.4.1.3.1 Gain
The tire temperature gain calibration value has units of Fahrenheit degree/volt) or
(Celsius degree/volt)
2.4.1.3.2 Offset
The tire temperature offset calibration value has units of (Fahrenheit degrees) or (Celsius degrees)
Dynatest 1295 Version 1.07 27 Sep 2017

SECTION 2 CALIBRATION
2.5 FLOW SENSOR CALIBRATION
This calibration page is for entering calibration values for flow meters and water tank sensors. To enter the
calibration values it is necessary to press the ‘Edit’ button by using the mouse. To save the calibration values
press the ‘Save’ button by using the mouse.
2.5.1.1. Flow Meter 1
The flow meter 1 values are displayed in voltage and flow rate units of gallons per minute
or liters per minute. The flow meter calibration values are described below.
2.5.1.1.1 Gain
The flow rate gain calibration value has units of (gpm/volt) or (lpm/volt)
2.5.1.1.2 Offset
The flow rate offset calibration value has units of (gpm) or (lpm)
2.5.1.2 Flow Meter 2
The flow meter 2 values are displayed in voltage and flow rate units of gallons per minute
or liters per minute. The flow meter calibration values are described below.
2.5.1.2.1 Gain
Dynatest 1295 Version 1.07 28 Sep 2017

SECTION 2 CALIBRATION
The flow rate gain calibration value has units of (gpm/volt) or (lpm/volt)
2.5.1.2.2 Offset
The flow rate offset calibration value has units of (gpm) or (lpm)
2.5.1.3 Water Tank Sensor
The water tank sensor values are displayed in voltage and units of gallons
or liters. The water tank sensor calibration values are described below.
2.5.1.3.1 Gain
The volume gain calibration value has units of (gallons/volt) or (liters/volt)
2.5.1.3.2 Offset
The water tank sensor offset calibration value has units of (gallons) or (liters)
Dynatest 1295 Version 1.07 29 Sep 2017

SECTION 2 CALIBRATION
2.6 METER AND DAC CALIBRATION
Figure 2-5: Meter Calibration
2.6.1 How to Use the Meter and Digital to Analog Converter (DAC) Calibration Screen
The meter and DAC calibration page is used for calibrating the force and speed display meters.
The computer uses a digital to analog converters to drive the dash mounted speed meter and the transducer force
readout meters located in the bed of the vehicle. The computer needs to know how to convert speed units of
miles per hour or kilometers per hour into analog voltage values to drive the speed meter. The computer also
needs to know how to convert force values in pounds or kilograms into analog voltage values to drive the force
meters. The values entered into the DAC gain fields provide the computer with the proper conversion numbers.
Different meters will require different gain conversion values. Some meters will require a voltage offset or ‘null’
value which can be entered into the ‘Offset’ fields for each meter. To change values it is necessary to press the
‘Edit’ button by using the mouse. The entered calibration values are saved by pressing the ‘Save’ button by using
the mouse.
Dynatest 1295 Version 1.07 30 Sep 2017

SECTION 2 CALIBRATION
2.6.2 Meter DAC Fields Descriptions.
2.6.2.1 DAC 1 – Speed DVM
The speed DAC controls the speed display meter.
2.6.2.1.1 Gain
The speed DAC gain calibration value has units of (mph/volt) or (kph/volt)
2.6.2.1.2 Offset
The speed DAC offset calibration value has units of (mph/volt) or (kph/volt)
2.6.2.2 DAC 2 – Left Load DVM
The left load DAC controls the trailer load display meter.
2.6.2.2.1 Gain
The left load DAC gain calibration value has units of (lbs/volt) or (kgs/volt)
2.5.2.2.2 Offset
The left load DAC offset calibration value has units of (lbs/volt) or (kgs/volt)
2.6.2.3 DAC 3 – Right Load DVM
The Right load DAC controls the trailer load display meter.
2.6.2.3.1 Gain
The right load DAC gain calibration value has units of (lbs/volt) or (kgs/volt)
2.6.2.3.2 Offset
The right load DAC offset calibration value has units of (lbs/volt) or (kgs/volt)
Dynatest 1295 Version 1.07 31 Sep 2017

SECTION 3 SETUP
3.1 INITIAL SETUP OF THE TOW VEHICLE AND TRAILER
The following information is designed to familiarize the operator with the initial setup procedures on
the 1295 before a test run.
1. Position the tow vehicle and two wheel trailer on a level section of pavement.
2. Fill the 250/300 gallon water tank on the tow vehicle until it is approximately half full of water.
The water level can be viewed on the monitor in the TEST menu screen.
3. Make sure the tongue of the trailer is parallel to the pavement. A carpenters level placed on top of
the two wheel trailer's tongue will verify the trailer is parallel with the pavement. If the tongue is
not parallel with the pavement:
4. Use a 3/4 inch box end wrench to loosen the four (4) lock nuts on the continuously adjustable ball
hitch.
5. Loosen the four (4) 1/2 inch Allen head cap screws which lock the continuously adjustable ball
hitch in position.
6. Use a 3/4 inch socket to slip over the main screw on the continuously adjustable ball hitch. Adjust
the ball up or down in order to level the two wheel trailer's tongue.
7. Once the trailer's tongue is level, tighten the four (4) 1/2 inch Allen head cap screws until they are
secure.
8. Use the 3/4 inch box end wrench to re-tighten the four (4) lock nuts until they are secure. The two
wheel trailer is level and ready for testing.
9. Check the ball hitch connection on the two wheel trailer to verify it is secure.
10. Check all the connections between the tow vehicle and the two wheel trailer to make sure they are
the same
11. Verify that both electric lift jacks on the two wheel trailer have been raised.
12. You can now finish filling the water tank. Replace the fill cap and hand tighten.
13. Start the engine on the tow vehicle to run the charging system. This charging system is
responsible for charging both the tow vehicle's 12 Volt DC battery and the system's 12 Volt DC
battery independently.
NOTE
An external retractable power cord and AC power outlets are provided in the
rear bed of the tow vehicle for indoor operation.
14. Energize the system by turning the DC Power switch ON, the AC Power switch ON, and the
Compressor Power switch on the Main Console ON.
15. The MAIN MENU screen will appear on the laptop (see Figure 4-1).
Dynatest 1295 Version 1.07 32 Sep 2017

SECTION 3 SETUP
3.2 Initial Setup Of The Computer For Testing
This information is designed to familiarize the operator with the initial setup of the computer for testing.
A detailed discussion for changing the menu options will be outlined in the next sections section of the
manual. All software settings are persistent in that the software retains the settings last entered.
It is recommended that you backup all test result files on a removable media at regular intervals. Do
not rely on the laptop computers hard drive as a long range storage solution. If the laptop computers
hard drive experiences a problem your data may be lost.
After turning the AC and DC power on wait for the ‘Processor Ready’ status light to begin flashing at
a one second interval before entering the Windows testing software. The status light is located in the
lower right corner of the embedded control console box. When the status light flashes it indicates that
the data acquisition hardware is running and is read to communicate with by Ethernet to the laptop
computer systems Windows Software.
If you do not wait for the embedded system to establish Ethernet communication with the laptop
computer you will experience Ethernet connection errors and a pop up error message box will be
displayed in the center of the test software screen. If you experience Ethernet connection errors, exit
the Windows testing software and cycle the AC and DC power on the embedded control console and
wait until it flashes before entering the Windows friction testing software.
Dynatest 1295 Version 1.07 33 Sep 2017

SECTION 3 SETUP
3.3 General Software Organization
Figure 3-1: Main Menu
The 1295 Pavement Friction Tester is an automated skid measurement device. The measurement system has been
designed to automate the task of making skid friction measurements. The system utilizes a high speed data
acquisition system connected to a portable computer by an Ethernet connection.
The general process steps for conducting a friction test are described below:
1) Enter all run related information in the ‘INFORMATION’ section of the program
2) Enter the ‘SETUP’ section of the program and configure all test parameters that define how the
test will be conducted
3) Calibrate the force transducers by using the ‘CALIBRATION’ section of the program.
4) Verify the distance, flow and DAC calibration values are correct
5) Enter the ‘TEST’ screen and perform the friction tests
The measurement system consists of several subsystems, which are described below.
Two Axis Force Transducer
The basic friction measurement principle behind friction measurement is to measure vertical axis load force and
the horizontal axis traction force. The resulting friction (F) is mu = traction / load
Dynatest 1295 Version 1.07 34 Sep 2017

SECTION 3 SETUP
Distance and Speed Measurement System
The distance measurement subsystem is used for accurate distance measurement and vehicle speed measurement.
Computer Controlled Measurement System Software
The measurement software is organized into the operational sections listed below:
Testing
This module performs the Friction Testing
Information
Used for entering test related information
Settings
Setting up the measurement system configuration parameters for the hardware and software.
Calibration
Used for calibrating the distance measurement system, Displacement measurement system and the accelerometer
system.
Diagnostics
Displays various sensor and control signals
Setups
Pre-defined test setups using the settings to allow fast switching for data collection without changing settings.
Help
Each software page has a help button that will give specific help information to assist the operator
Dynatest 1295 Version 1.07 35 Sep 2017

SECTION 3 SETUP
3.4 Software Setup Process Outline
The following description is what a typical operator would do to setup the system before testing.
Step 1: Enter all test specific information in the ‘INFORMATION’ section of the program.
Step 2: Enter all test configuration parameters into the ‘SETUP’ section of the program.
Step 3: Enter the ‘CALIBRATION’ section and verify that all the platform calibration values are correct
Step 4: Calibrate the force transducer(s)
Step 5: Check the distance calibration values to make sure they are correct.
Step 6: Check the flow and related sensor calibration values and make sure they are correct.
Dynatest 1295 Version 1.07 36 Sep 2017
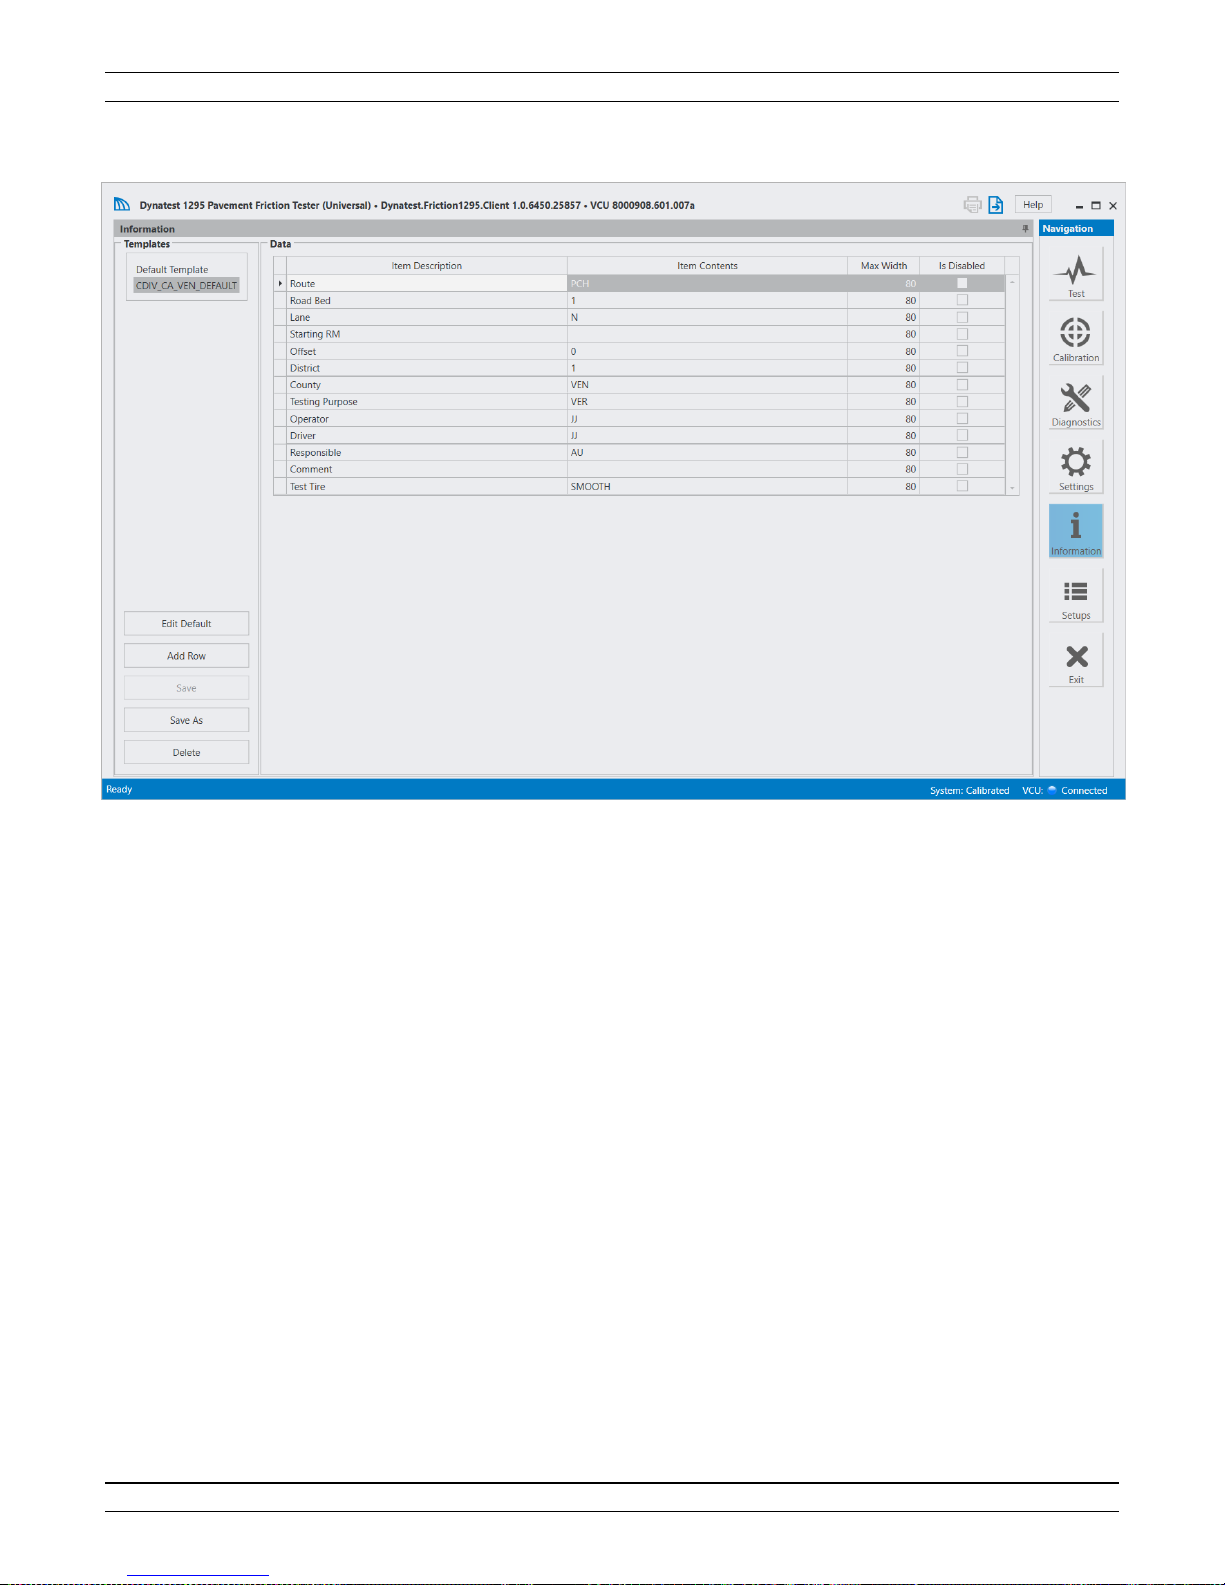
SECTION 4 OPERATION
SECTION 4: TEST INFORMATION
Figure 4-1: Test Information Menu
4.1 Information
The information section is organized into a default template and two user defined Custom templates. The user
defines the both the description of the field and its size to a maximum of 80 characters.
Each line on each page can have a user defined title. All text lines on page one can be enabled (turned on) or
disabled (turned off) by the user. When a text line is enabled it will be printed and stored, if the print and storage
options are turned ‘ON’. If a text line is disabled (turned off) the information will not be printed or stored for that
line. Each of the templates can be modified to meet the user’s needs.
Dynatest 1295 Version 1.07 37 Sep 2017

SECTION 4 OPERATION
4.1.1 Edit a Template
To edit a template choose the template using the mouse and click on the name of the template to be edited.
All editing is by typing in information and then click Save.
4.1.2 Loading The Default Title Template
The default template loads a set of pre-defined field titles. To load the default template click on the ‘default
template’ in the left side list.
4.1.3 Recalling a Stored Title Template
To recall a stored template click on the name of the template.
Dynatest 1295 Version 1.07 38 Sep 2017

SECTION 4 OPERATION
4.2 Settings
Figure 4-2a: Control Parameters
Dynatest 1295 Version 1.07 39 Sep 2017

SECTION 4 OPERATION
4.2.1 Control Parameter Overview
The control parameter section contains the settings used for control the operation of the test system. The control
parameter selections are described below. To edit the control parameters, it is necessary to select the entry to be
modified. Once a change is made and the cursor is moved to a new entry the data is automatically saved. The
‘Restore’ allows the user to revert to the factory default settings.
4.2.1.1 Test Type
The ‘Test Type” setting defines how the braking cycle is to operate.
The two selections affecting braking operation are ‘Standard Test SN’ and ‘PBC Test’.
To make the selections used the mouse to make the selection.
4.2.1.1.1 Standard
The ‘Standard’ test type selection will perform a test in conformance with ASTM E274.
4.2.1.1.2 PBC Test
The ‘PBC’ test type (Peak Braking Coefficient) selection will perform a test were braking action is only
applied until the wheel reaches lockup and is then released. The ‘PBC’ test is used primarily when
peak friction information is required.
NOTE: The ‘PBC’ test selection cannot be used to obtain skid friction information. The
brake is applied only until the test wheel reaches lockup and is then released.
4.2.1.1.3 Target Speed
The ‘Target Speed’ field is used to record the test speed at which the testing will be conducted. The speed
label on the main test screen will change color based on whether the vehicle speed is at the ‘Target Speed’
within the ASTM E274 specified speed tolerance band. If the vehicle speed is outside the ‘Target Speed’
tolerance band the speed label will turn ‘YELLOW’. If the vehicle speed is inside of the ‘Target Speed’
tolerance band the label will turn ‘GREEN’.
4.2.1.1.4 Speed Range +- (mph)
The ‘Speed Range’ selection will use the value entered to determine if the speed at the time of test is
acceptable. This is typically a number less than 2 mph (3.2 kph).
4.2.1.1.5 Test Suspension Speed (mph)
The ‘Test Suspension Speed’ is the speed at which the test will be terminated if the test speed is below the
Target Speed and Range parameters.
4.2.1.2 Test Cycle Sequence
The ‘Test Cycle Sequence’ defines the cycle sequence used for test measurement.
Dynatest 1295 Version 1.07 40 Sep 2017

SECTION 4 OPERATION
4.2.1.2.1 Manual
The ‘Manual’ selection is to be used when the operator wants to manually initiate each
test using the operator pendant.
4.2.1.2.2 Auto
The ‘Auto’ selection is to be used to when consecutive test starts are to be controlled by
the system. When ‘Auto’ testing is used the system will start the next test a predefined
distance from the start of the last test. This distance interval between tests is defined as
the dwell distance, which is described below.
Note: Left and Right designations are defined relative to the driver being seated in the vehicle.
4.2.1.3 Test Wheel Sequence
The ‘Test Wheel Sequence’ defines which test wheel(s) will be used for test measurement
4.2.1.3.1 Left
If the system is only equipped with measurement capability for one wheel path and the measurement
wheel path is on the left, then the ‘Left’ selection must be used.
If the system has measurement capability for both the left and right wheel paths but measurements are to
be made only in the left wheel path, then the ‘Left’ selection is used
4.2.1.3.2 Right
If the system is only equipped with measurement capability for one wheel path and the measurement
wheel path is on the right, then the ‘Right’ selection must be used.
If the system has measurement capability for both the left and right wheel paths but measurements are to
be made only in the right wheel path, then the ‘Right’ selection is used
4.2.1.3.3 Alternate (L-R)
Note: This selection can only be used for systems that have measurement capability in
both the left and right wheel paths.
This selection allows systems with two wheel path measurement capability to alternate
testing between the left and right wheel paths, starting the sequence in the left wheel path.
4.2.1.3.4 Alternate (R-L)
Note: This selection can only be used for systems that have measurement capability in
both the left and right wheel paths.
This selection allows systems with two wheel path measurement capability to alternate
testing between the right and left wheel paths, starting the sequence in the right wheel path.
4.2.1.4 Test Start
Dynatest 1295 Version 1.07 41 Sep 2017

SECTION 4 OPERATION
The test start selections are used to configure how the DMI and test start will be implemented.
The selection can be changed by using the mouse.
4.2.1.4.1 Start Test by Pendant at DMI Start
This selection will cause the first friction test to start when the DMI is started.
4.2.1.4.2 Start Test by Pendant after DMI Start
This selection will cause the first friction test to start after the DMI has been started.
The operational sequence is as follows.
1) The DMI is started by pressing the operator pendant.
2) The first test is then started by pressing the operator pendant a second time to start
the test.
4.2.1.4.3 Auto Test Start on Distance from DMI Start
This selection is used for starting the first test by an elapsed distance from the point of the DMI starting
reference. A distance must be entered into the distance edit box below this selection.
4.2.1.4.4 Auto Test Start Distance
This is the distance from the start of the DMI to the start of the first test. This distance must be entered in
the distance units defined next to the entry box. If a distance of zero is used in this field this will be the
same as the “Start Test by Pendant at DMI Start”.
4.2.1.5 Test Stop
The ‘Test Stop’ selections define how the test will be stopped.
4.2.1.5.1 Pendant
The test will be terminated by the operator pushing the pendant.
4.2.1.5.2 Distance
During testing, once the distance reaches the entered value the sequence will stop.
Dynatest 1295 Version 1.07 42 Sep 2017

SECTION 4 OPERATION
4.2.1.6 Test Time Parameters
The ‘Test Time Parameters’ define the characteristics of the test cycle. The time parameters are time intervals
with the units of ‘seconds’. The time parameters are defined below.
4.2.1.6.1 Test Time Parameter T1
The time parameter T1 is defined as the length of time in seconds between actuation of the water ‘ON’
signal and the brake ‘ON’ actuation signal. A typical value for T1 is 0.5 seconds.
4.2.1.6.2 Test Time Parameter T2
The time parameter T2 is defined as the brake lock failure limit in seconds. If the brake does not achieve
lockup before the time T2 expires, the test will be aborted and a brake lockup error will be generated. A
typical value for T2 is 1.5 to 2.0 seconds.
4.2.1.6.3 Test Time Parameter T3
The time parameter T3 is defined as the brake lockup stabilization settling time. This allows the locked
test wheel some stabilization time before start of the SN Measurement. A typical value for T3 is 0.5
seconds.
4.2.1.6.4 Test Time Parameter T4
The time parameter T4 is defined as the length of time in seconds for the measurement of data to
determination of the Skid Number (SN). The ASTM E274 specification recommends that this time period
be to set to a value from 1.0 to 3.0 seconds.
4.2.1.6.5 Test Time Parameter T5
The time parameter T5 is defined as the time in seconds for monitoring the wheel spin-up period from the
brake unlock signal to the test wheel rotation at vehicle speed.
4.2.1.7 DMI – Distance Measuring Instrument
4.2.1.7.1 DMI Units
This selection allows the choice of Feet or Miles, or Meters or Kilometers depending on the System Units
being used.
4.2.1.7.2 DMI Starting Distance (Ft)
This selection specifies the starting point for the DMI.
4.2.1.7.3 DMI Up or Down
This selection specifies that the DMI will count up or down.
Dynatest 1295 Version 1.07 43 Sep 2017

SECTION 4 OPERATION
4.2.1.8 Miscellaneous
4.2.1.8.1 System Units
The system units selection defines the units to be used for measurement.
The units of US (English) or Metric (SI) can be selected.
The selection can be changed by using the mouse.
4.2.1.8.1.1 US (English)
If the ‘US’ units are selected the basic units used are outlined below.
Speed = miles per hour (mph)
Force = pounds (lbs)
Distance = feet (ft) , miles (mi)
Flow Rate = gallons per minute (gpm)
Temperature = Fahrenheit degree’s
4.2.1.8.1.2 Metric
If the ‘Metric’ units are selected the basic units used are outlined below.
Speed = kilometers per hour (kph)
Force = kilograms (kgs)
Distance = meters (M) , kilometers (km)
Flow Rate = liters per minute (lpm)
Temperature = Celsius (C)
4.2.1.9 Test Watering
The ‘Test Watering’ selections define how the test water will be applied to the test surface.
4.2.1.9.1 Wet
The ‘Wet’ selection is used when the water is to be applied by the on-board water delivery system.
4.2.1.9.2 Dry
The ‘Dry’ selection is used when no water is to be applied to the measurement surface by
the on board water delivery system or any external watering source.
4.2.1.9.3 Pre-Wet
The ‘Pre-Wet’ selection is to be used when water is to applied to the measurement
surface by a watering source other than the on board water delivery system.
4.2.1.10 Data Averaga Filter
The ‘Data Average Filter’ selections determine how the raw test data will be filtered.
Dynatest 1295 Version 1.07 44 Sep 2017

SECTION 4 OPERATION
This is a software ‘moving average filter’. The averaging sample is default set to 5 sample points. The operator
can choose to change this to a value between 2 and 11. Caution: One should not mix data with different averaging
filters. The default value of 5 has been found to be an excellent general use setting.
Note: The data acquisition system utilizes a hardware anti-aliasing filter placed before the analog
to digital converter module.
4.2.1.11 Display Settings
The ‘Settings’ selections determine how the values are displayed on the screen.
4.2.1.11.1 Speed Format
The number of decimal places to be shown for Speed is entered.
4.2.1.11.2 DMI Format
The number of decimal places to be shown for distance is entered.
4.2.1.11.3 SN Format
The number of decimal places to be shown for SN is entered.
4.2.1.11.4 Display Test Value
The user has a choice of data to display on the Test screen including SN Average, SN Maximum, SN
Minimum, SN Standard Deviation, Peak and Percent Slip at Peak.
4.2.1.12 Cycle Options
The ‘Cycle Options’ selections are used to control equipment during testing
4.2.1.12.1 Water Control Options
The ‘Water Control Option’ selection defines if the water flow is continuous or the pump is to shut off
between tests.
4.2.1.12.2 Noozle Control Options
The ‘Nozzle Control Option’ selection defines if the nozzle is raised between tests or if the nozzle is lifted
on backup.
4.2.1.12.2 Air Compressor Options
The ‘Air Compressor Option’ selection defines if the air compressor is on or off during testing. NOTE:
for close spacing between tests compressor should be left on.
4.2.1.13 GPS Settings
4.2.1.13.1 GPS Bearing Minimum Update Travel Distance
Dynatest 1295 Version 1.07 45 Sep 2017

SECTION 4 OPERATION
GPS Bearing Minimum Update Travel Distance defines the unit of measure for distance before the
bearing is updated. A larger number smooths the jitters in updates.
4.2.1.13.2 GPS Coordinates Display Format
The three choices for display are Degree Lat/Log or Degree Minutes or Degree Minutes/Second
4.2.1.14 Right of Way (ROW) Camera Settings (if equipped)
4.2.1.14.1 ROW Camera is mounted Upside Down
Click the check box for yes. If selected images are flipped prior to being saved
4.2.1.14.2 ROW Camera Image Inspector is Enabled
Click the check box for yes. If selected the image will be displayed during the test for the duration
entered.
4.2.1.14.3 ROW Camera Image Inspector Duration (seconds)
Enter the number of seconds that the image will be displayed during the test.
4.2.1.15 Vehicle Dashboard Display Settings (if equipped)
The display can display a maximum of five of the following choices chosen by the check box for yes:
Speed
SN Left
SN Right
PBC Left
PBC Right
TTP Left (Time to Peak)
TTP Right
DMI
The final selection must be checked if the changes are to be used. Click checkbox for Yes.
Dynatest 1295 Version 1.07 46 Sep 2017

SECTION 4 OPERATION
4.3 Trend Chart Settings
Figure 4-3: Trend Charts
4.3.1 Trend Chart Description
This section contains the settings used to control specific display characteristics on the main test screen trend
chart graph. To edit the trend chart parameters, it is only necessary to select the parameter using the mouse and
either check the box or enter a value. The edited field contents are saved automatically. A reset button allows
the user to return to the factory default settings.
IMPORTANT: The trend chart settings are divided into two main setting groups.
The ‘SN Interval’ group and the ‘Locking Interval’ group.
It is important to understand the definition of each group to make sure the values
are interpreted correctly.
Dynatest 1295 Version 1.07 47 Sep 2017

SECTION 4 OPERATION
1) ‘SN Interval’ Group – All selections for parameters within this grouping are
values that are obtained during the ‘SN’ Calculation period within the test cycle.
2) ‘Locking Interval’ group – All selections for parameters within this group are
values that are obtained during the test period between the start of brake
actuation, until the time that the brake reaches lockup. This grouping does not
include any values obtained after the wheel has reached lockup.
4.3.2 Trend Chart Field Definitions
4.3.2.1 SN Interval – Friction Trend Chart
4.3.2.1.1 SN Avg
The average SN value calculated during the ‘SN measurement period’
4.3.2.1.2 SN Maximum
The maximum SN value obtained during the ‘SN measurement period’
4.3.2.1.3 SN Minimum
The minimum SN value obtained during the ‘SN measurement period’
4.3.2.1.4. X-Scale (samples)
X-graph scale units in SN samples
4.3.2.1.5 Y-Scale Min (Mu x 100)
Y-graph minimum traction force scale force units in used for the manual scale selection
4.3.2.1.6 Y-Scale Max (Mu x 100)
Y-graph maximum scale force units in used for manual scale selection
Dynatest 1295 Version 1.07 48 Sep 2017

SECTION 4 OPERATION
4.3.2.2 SN Interval – Traction Force Trend Chart
4.3.2.2.1 Traction Force Avg
The maximum traction average value obtained during the ‘SN measurement period’
4.3.2.2.2 Traction Force Maximum
The maximum traction force value obtained during the ‘SN measurement period’
4.3.2.2.3 Traction Force Minimum
The minimum traction force value obtained during the ‘SN measurement period’
4.3.2.2.4 Y-Scale Min (lbs or kgs)
Y-graph minimum traction force scale force units in used for the manual scale selection
4.3.2.2.5 Y-Scale Max (lbs or kgs)
Y-graph maximum scale force units in used for manual scale selection
4.3.2.2.6 X-Scale (samples)
X-graph scale units in Traction Force samples
4.3.2.2.7 Auto Y-Scale
This selection will turn ‘ON’ auto scaling for the Y-scale
The selection can be changed by using the mouse.
4.3.2.2.8 Manual Y-Scale
This selection will turn ‘ON’ manual scaling for the Y-scale
The selection can be changed by using the mouse.
4.3.2.3 SN Interval – Load Force Trend Chart
4.3.2.3.1 Load Force Avg
The average load force value obtained during the ‘SN measurement period’
4.3.2.3.2 Load Force Maximum
The maximum load force value obtained during the ‘SN measurement period’
Dynatest 1295 Version 1.07 49 Sep 2017

SECTION 4 OPERATION
4.3.2.3.3 Load Force Minimum
The minimum load force value obtained during the ‘SN measurement period’
4.3.2.3.4 Y-Scale Min (lbs or kgs)
Y-graph minimum scale force units in used for manual scale selection
4.3.2.3.5 Y-Scale Max (lbs or kgs)
Y-graph maximum scale force units in used for manual scale selection
4.3.2.3.6 X-Scale Samples
X-graph scale units in load force samples
4.3.2.3.7 Auto Y-Scale
This selection will turn ‘ON’ auto scaling for the Y-scale
The selection can be changed by using the mouse.
4.3.2.3.8 Manual Y-Scale
This selection will turn ‘ON’ manual scaling for the Y-scale
The selection can be changed by using the mouse.
4.3.2.4 SN Interval – Vehicle Speed Trend Chart
4.3.2.4.1 Vehicle Speed Avg
The average vehicle speed value obtained during the ‘SN measurement period’
4.3.2.4.2 Vehicle Speed Maximum
The maximum vehicle speed value obtained during the ‘SN measurement period’
4.3.2.4.3 Vehicle Speed Minimum
The minimum vehicle speed value obtained during the ‘SN measurement period’
4.3.2.4.4 Y-Scale Min (mph or kph)
Y-graph minimum scale speed units in used for the manual scale selection.
4.3.2.4.5 Y-Scale Max (mph or kph)
Y-graph maximum scale speed units in used for the manual scale selection.
Dynatest 1295 Version 1.07 50 Sep 2017

SECTION 4 OPERATION
4.3.2.4.6 X-Scale Samples
X-graph scale units of vehicle speed samples.
4.3.2.4.7 Auto Y-Scale
This selection will turn ‘ON’ auto scaling for the Y-scale
The selection can be changed by using the mouse.
4.2.3.4.8 Manual Y-Scale
This selection will turn ‘ON’ manual scaling for the Y-scale
The selection can be changed by using the mouse.
4.3.2.5 SN Interval – Flow Rate Trend Chart
4.3.2.5.1 Flow Rate Avg
The average flow rate value obtained during the ‘SN measurement period’
4.3.2.5.2 Flow Rate Maximum
The maximum flow rate value obtained during the ‘SN measurement period’
4.3.2.5.3 Flow Rate Minimum
The minimum flow rate value obtained during the ‘SN measurement period’
4.3.2.5.4 Y-Scale Min (gpm or lpm)
Y-graph minimum flow rate units in used for the manual scale selection.
4.3.2.5.5 Y-Scale Max (gpm or lpm)
Y-graph maximum flow rate units in used for the manual scale selection.
4.3.2.5.6 X-Scale (samples)
X-graph scale units of flow rate samples.
4.3.2.5.7 Auto Y-Scale
This selection will turn ‘ON’ auto scaling for the Y-scale
The selection can be changed by using the mouse.
4.3.2.5.8 Manual Y-Scale
This selection will turn ‘ON’ manual scaling for the Y-scale
The selection can be changed by using the mouse.
Dynatest 1295 Version 1.07 51 Sep 2017

SECTION 4 OPERATION
4.3.2.6 SN Interval – Standard Deviation Trend Chart
4.3.2.6.1 Friction SN STDEV
The standard deviation value of the friction SN obtained during the ‘SN measurement period’
4.3.2.6.2 Traction Force STDEV
The standard deviation value of the traction force obtained during the ‘SN measurement period’
4.3.2.6.3 Load Force STDEV
The standard deviation value of the load force obtained during the ‘SN measurement period’
4.3.2.6.4 Vehicle Speed STDEV
The standard deviation value of the vehicle obtained during the ‘SN measurement period’
4.3.2.6.5 Flow Rate STDEV
The standard deviation value of the flow rate obtained during the ‘SN measurement period’
4.3.2.6.6 Y-Scale Min (standard deviation)
Y-graph scale units of minimum standard deviation of samples.
4.3.2.6.7 Y-Scale Max (standard deviation)
Y-graph scale units of maximum standard deviation of samples.
4.3.2.6.8 X-Scale (samples)
X-graph scale units of standard deviation samples
4.3.2.6.9 Auto Y-Scale
This selection will turn ‘ON’ auto scaling for the Y-scale
The selection can be changed by using the mouse.
4.3.2.6.10 Manual Y-Scale
This selection will turn ‘ON’ manual scaling for the Y-scale
The selection can be changed by using the mouse.
Dynatest 1295 Version 1.07 52 Sep 2017

SECTION 4 OPERATION
4.3.2.7 SN Locking Interval – Friction Trend Chart
4.3.2.7.1 SN at Peak
The Peak SN value obtained during the wheel locking interval.
4.3.2.7.2 SN Maximum
The maximum SN value obtained during the wheel locking interval.
4.3.2.7.3 SN Minimum
The minimum SN value obtained during the wheel locking interval.
4.3.2.7.4 Y-Scale Min (mu x 100)
Y-graph scale units of minimum SN value of samples.
4.3.2.7.5 Y-Scale Max (mu x 100)
Y-graph scale units of maximum SN value of samples.
4.3.2.7.6 X-Scale (samples)
X-graph scale units of SN samples.
4.3.2.7.7 Auto Y-Scale
This selection will turn ‘ON’ auto scaling for the Y-scale
The selection can be changed by using the mouse.
4.3.2.7.8 Manual Y-Scale
This selection will turn ‘ON’ manual scaling for the Y-scale
The selection can be changed by using the mouse.
4.3.2.8 SN Locking Interval – Traction Force Trend Chart
4.3.2.8.1 Traction Force at Peak
Peak traction force value measured during the wheel locking period.
4.3.2.8.2 Traction Force Maximum
Maximum traction force value measured during the wheel locking period.
4.3.2.8.3 Traction Force Minimum
Minimum traction force value measured during the wheel locking period.
Dynatest 1295 Version 1.07 53 Sep 2017

SECTION 4 OPERATION
4.3.2.8.4 Y-Scale Min (lbs or kgs)
Minimum Y-graph scale units of traction force.
4.3.2.8.5 Y-Scale Max (lbs or kgs)
Maximum Y-graph scale units of traction force.
4.3.2.8.6 X-Scale (samples)
X-graph scale units of traction force samples.
4.3.2.8.7 Auto Y-Scale
This selection will turn ‘ON’ auto scaling for the Y-scale
The selection can be changed by using the mouse.
4.3.2.8.8 Manual Y-Scale
This selection will turn ‘ON’ manual scaling for the Y-scale
The selection can be changed by using the mouse.
4.3.2.9 SN Locking Interval – Load Force Trend Chart
4.3.2.9.1 Load Force Avg
The average load force measured during the wheel locking period.
4.3.2.9.2 Load Force Maximum
The maximum load force measured during the wheel locking period.
4.3.2.9.3 Load Force Minimum
The minimum load force measured during the wheel locking period.
4.3.2.9.4 Load Force at Peak
The peak load force measured during the wheel locking period.
4.3.2.9.5 Y-Scale Min (lbs or kgs)
Minimum Y-graph scale units of load force samples.
4.3.2.9.6 Y-Scale Max (lbs or kgs)
Maximum Y-graph scale units of load force samples.
Dynatest 1295 Version 1.07 54 Sep 2017

SECTION 4 OPERATION
4.3.2.9.7 X-Scale (samples)
X-graph scale units of load force samples.
4.3.2.9.8 Auto Y-Scale
This selection will turn ‘ON’ auto scaling for the Y-scale
The selection can be changed by using the mouse.
4.3.2.9.9 Manual Y-Scale
This selection will turn ‘ON’ manual scaling for the Y-scale
The selection can be changed by using the mouse.
4.3.2.10 SN Locking Interval – Speed Trend Chart
4.3.2.10.1 Vehicle Speed Avg
The average vehicle speed measured during the wheel locking period.
4.3.2.10.2 Vehicle Speed Maximum
The maximum vehicle speed measured during the wheel locking period.
4.3.2.10.3 Vehicle Speed Minimum
The minimum vehicle speed measured during the wheel locking period.
4.3.2.10.4 Vehicle Speed at Peak
The peak vehicle speed measured during the wheel locking period.
4.3.2.10.5 Wheel Speed at Peak
The peak wheel speed measured during the wheel locking period.
4.3.2.10.6 Y-Scale Min (mph or kph)
Minimum Y-graph scale units of vehicle speed.
4.3.2.10.7 Y-Scale Max (mph or kph)
Maximum Y-graph scale units of vehicle speed.
4.3.2.10.8 X-Scale (samples)
X-graph scale units of vehicle speed samples.
Dynatest 1295 Version 1.07 55 Sep 2017

SECTION 4 OPERATION
4.3.2.10.9 Auto Y-Scale
This selection will turn ‘ON’ auto scaling for the Y-scale
The selection can be changed by using the mouse.
4.3.2.10.10 Manual Y-Scale
This selection will turn ‘ON’ manual scaling for the Y-scale
The selection can be changed by using the mouse.
4.3.2.11 SN Locking Interval – Flow Rate Trend Chart
4.3.2.11.1 Flow Rate Avg
The average flow rate measured during the wheel locking period.
4.3.2.11.2 Flow Rate Maximum
The maximum flow rate measured during the wheel locking period.
4.3.2.11.3 Flow Rate Minimum
The minimum flow rate measured during the wheel locking period.
4.3.2.11.4 Flow Rate at Peak
The flow rate value at the peak friction during the wheel locking period.
4.3.2.11.5 Y-Scale Min (gpm or lpm)
Minimum Y-graph scale units of flow rate.
4.3.2.11.6 Y-Scale Max (gpm or lpm)
Maximum Y-graph scale units of flow rate.
4.3.2.11.7 X-Scale (samples)
X-graph scale units of flow rate samples.
4.3.2.11.8 Auto Y-Scale
This selection will turn ‘ON’ auto scaling for the Y-scale
The selection can be changed by using the mouse.
4.3.2.11.9 Manual Y-Scale
This selection will turn ‘ON’ manual scaling for the Y-scale
The selection can be changed by using the mouse.
Dynatest 1295 Version 1.07 56 Sep 2017

SECTION 4 OPERATION
4.3.2.12 SN Locking Interval – Misc. Trend Chart
4.3.2.12.1 % Slip at Peak
The percent slip at the peak friction value measured between brake actuation
and wheel lockup.
4.3.2.12.2 Time to Peak
The elapsed time in seconds from the start of brake actuation to the peak SN
Friction value.
4.3.2.12.3 Time to Lockup
The elapsed time in seconds from brake actuation to brake lockup.
4.3.2.12.4 Y-Scale Min (% or seconds)
Minimum Y-scale in percent or seconds.
4.3.2.12.5 Y-Scale Max (% or seconds)
Maximum Y-scale in percent or seconds.
4.3.2.12.6 X-Scale (samples)
X-graph scale units of test samples.
4.3.2.12.7 Auto Y-Scale
This selection will turn ‘ON’ auto scaling for the Y-scale
The selection can be changed by using the mouse.
4.3.2.12.8 Manual Y-Scale
This selection will turn ‘ON’ manual scaling for the Y-scale
The selection can be changed by using the mouse.
Dynatest 1295 Version 1.07 57 Sep 2017

SECTION 4 OPERATION
4.4 SETTINGS (continued)
Figure 4-4: Installed Hardware
4.4.1 Installed Hardware Field Description
The installed physical hardware setup page is used to define the specific hardware that has been installed
in your 1295 pavement friction tester.
IMPORTANT: It is very important for the operation of your system that only items that are
installed in your system be selected.
To make selections it is necessary to select the item button with the mouse and the changes are stored
instantly. The hardware selections are defined below.
Dynatest 1295 Version 1.07 58 Sep 2017

SECTION 4 OPERATION
4.4.2 Force Transducers
The force transducer options define the number and location of force transducers installed on the system.
4.4.2.1 Left Wheel
This item is selected when a left wheel force transducer is installed on the system.
4.4.2.2 Right Wheel
This item is selected when a right wheel force transducer is installed on the system.
4.4.3 Water Equipment and Sensors
4.4.3.1 Flow meters
The flow meter options define the number and location of the flow meters installed on the system.
The option is for one or two flow meters.
4.4.3.2 Water Pumps
The water pump options define the number and location of the flow meters installed on the system.
The three options are to use both pumps, only the left pump, or only the right pump
4.4.3.3 Water Tanks
The water tank option is for either one tank or two. Once chosen the volume of the tank(s) is entered in
gallons (liters). The selection of a water tank sensor(s) is also enabled.
4.4.4.1 Distance Measuring Devices (DMI)
The DMI (encoder) options define the number and location of the encoders installed on the system.
Note: The ‘left’ side of the system is defined relative to an observer positioned in vehicle seat.
4.4.4.2 Left Wheel
This item is selected when an encoder is installed on the left side of the system.
4.4.4.3 Right Wheel
This item is selected when an encoder is installed on the right side of the system.
4.4.4.4 Vehicle
This item is selected when a NiteStar encoder is installed on the vehicle system.
Dynatest 1295 Version 1.07 59 Sep 2017

SECTION 4 OPERATION
4.4.5 Test Start/Stop Devices
This option defines the device(s) that are installed on the system to start and stop the
friction testing and calibration.
4.4.5.1 Pendant
This item is selected to designate the operator pendant as the device to be used to start and stop
operational aspects of the system.
4.4.5.2 Photocell
This item is selected to designate an optional photocell as the device to be used to start and stop
operational aspects of the system.
4.4.6 Temperature Sensors
This option defines Temperature Sensor(s) that are installed on the system.
4.4.6.1 Air Temperature Sensor
This item is selected when a ambient air temperature sensor is installed on the system.
4.4.6.2 Surface Temperature Sensor
This item is selected when a surface temperature sensor is installed on the system.
4.4.6.3 Left Tire Temperature Sensor
This item is selected when a tire surface temperature sensor is installed on the system.
4.4.6.4 Right Tire Temperature Sensor
This item is selected when a tire surface temperature sensor is installed on the system.
4.4.6.5 Tank (1) Temperature Sensor
This item is selected when a water tank temperature sensor is installed on the system. The number
is dependent on the number of water tanks on the system
4.4.7 Additional Equipment
This option defines additional device(s) that are installed on the system.
4.4.7.1 Printer
This item is selected when a printer is installed on the system.
Dynatest 1295 Version 1.07 60 Sep 2017

SECTION 4 OPERATION
4.4.7.2 GPS Receiver
This item is selected when a global positioning system is installed on the system.
4.4.7.3 Right of Way (ROW) Camera
This item is selected when a Right of way (ROW) camera is installed on the system.
4.4.7.4 Vehicle Dashboard Display
This item is selected when a vehicle dashboard display is installed on the system.
4.4.7.5 Inclinometer (future addition)
This item is selected when a inclinometer system is installed on the system.
4.4.7.6 Accelerometer (future addition)
This item is selected when a accelerometer sensor is installed on the system.
4.4.7.7 Texture Sensor (future addition)
This item is selected when a texture laser is installed on the system.
Dynatest 1295 Version 1.07 61 Sep 2017

SECTION 4 OPERATION
4.2 SETTINGS (continued)
Figure 4-5: Storage and Printing
4.5 Storage and Print Setting Field Descriptions
The storage and print settings selections control data file storage and printing control.
To change a selection it is necessary click on the item to be entered or changed.
4.5.1 Storage
On - Used for turning the data storage feature ON
Off - Used for turning the data storage feature OFF
4.5.2 File Name
This is the file name that the friction data will be stored in.
Note: Do not include the file extension as part of the name.
Dynatest files automatically have the extension assigned.
Example: 1 File Management Details
File Name: DATA
File Directory: C:\locationA
Test Set Number: 1 - nnn 1
Dynatest 1295 Version 1.07 62 Sep 2017

SECTION 4 OPERATION
Test #1 Skid Summary Data File C:\locationA\Data.SKS
Test #1 Skid Raw Data File C:\locationA\DataR1.SKR
. . .
. . .
Test #10 Skid Summary Data File C:\locationA\Data.SKS
Test #10 Skid Raw Data File C:\locationA\DataR10.SKR
4.5.3 File Directory
This is the directory location that the test data will be stored in.
4.5.4 Test Set Number
This feature will append the numeric test sequence number to the end of the
file name. After each test the test run number is incremented by one.
4.5.5 Default File Setting
This selection may be used by owners with multiple units. When selected the ‘File Name’ and ‘File
Directory’ entries will be over ridden by a new required entry of the ‘Truck ID’ which is then used
as a prearranged file name format.
4.5.6 Output Files
4.5.6.1 Output Summary Data
This selection turns ‘ON’ the summary data file storage.
4.5.6.2 Output Raw Data
This selection turns ‘ON’ the raw data file storage.
The raw data stored includes, but not limited to, the following:
1) Traction Force
2) Load Force
3) Vehicle Speed
4) Locked Wheel Speed
5) Flow Rate
4.6 Miscellaneous
4.6.1 Test Printing
On
This selection turns test printing ‘ON’
Off
Dynatest 1295 Version 1.07 63 Sep 2017

SECTION 4 OPERATION
This selection turns test printing ‘OFF’
4.6.2 Print Disk Files
This area allows the user to select a particular file or a group of files and send them to the
onboard printer. The ‘Add File’ button enables a windows search to find data files for printing.
The ‘Clear List’ button clears the selected files from the printing cue. The ‘Remove Selected’
button allows the user to remove a file from the selected list of files. The ‘Print’ button allows the
list of files to be printed.
Dynatest 1295 Version 1.07 64 Sep 2017

SECTION 4 OPERATION
4.2 SETTINGS (continued)
Figure 4-6: F Key Events
4.7 F Key Events
The ‘F Key Event’ Setup allows the operator to designate an event or observation to the laptop Function
Keys numbers F1 to F9. This option works best with the DGPS Option.
To select a Key the cursor should be placed in the text box to the right of the desired F key and an item
or description typed in. Once completed, and the cursor is moved, the change will be stored
automatically. These can be changed as desired. During data collection when the F1 key is pressed, the
words “Bridge Joint”, as shown in the above example, are stored with the GPS coordinates in the
summary data file. This does not interrupt the data collection.
Dynatest 1295 Version 1.07 65 Sep 2017

SECTION 4 OPERATION
Figure 4-7: SN Correction
4.8 SN Correction
The SN Correction allows the user to enter values obtained from the FHWA Calibration center allowing
correlation of the unit data back to the FHWA reference device.
When use of the equation is selected three options are available:
Corrected SN storage – The user can choose to store the corrected SN.
Corrected SN graphing – The user can choose to graph the corrected data.
Equation Selection Method – The user may choose automatic which chooses the equation
for the appropriate test speed. The option is to choose manual and choose which of the
three equations available are used for the correction.
Dynatest 1295 Version 1.07 66 Sep 2017

SECTION 4 OPERATION
4.9 Diagnostics: Encoders and Timers
Figure 4-6: Diagnostics: Encoders and Timers
4.9.1 Encoders and Timers
This section is to be used as a hardware and software diagnostics tool for monitoring the devices used that
measure, count and calculate distance and speed parameters. The enc
oders used in the settings are reflected on the
screen
It can be used as a technical tool to localize problems in the distance and speed measurement equipment.
4.9.1.1 dt Meters and Measurement Theory
The meters labeled left dt, right dt and vehicle dt display the time count values measured between rising and
falling edges of an encoder pulse. It is effectively a measurement of the frequency of the encoder pulses being
generated by the encoder. The faster you drive the shorter the encoder pulse time becomes and hence lower time
count value. Speed is calculated by the following formula speed = dx/dt . Each dt time count represents 0.5 microseconds. The graph to the right of the dt meters is a dt sample based strip chart showing the dt values of the left,
right and vehicle dt count values. If a problem exists with the dt measurement of the left, right or vehicle dt the
corresponding speed calculation for that particular channel will be erroneous.
Dynatest 1295 Version 1.07 67 Sep 2017

SECTION 4 OPERATION
4.9.1.2 Speed Meters
The meters labeled left wheel speed, right wheel speed and vehicle speed display the calculated speed for the left,
right and vehicle speed channels. The speed values have units of miles per hour or kilometers per hour. The
formula for the speed calculation is speed = dx/dt. To get the proper speed to be calculate both the encoder
calibration faction dx and the measure dt value described above must be correct. If an improper distance scale
factor has been entered for a particular channel it will generate an incorrect speed calculation. The strip chart
graph to the right of the speed meters displays the calculated speed values for each channel. The values shown on
the graph should match the vehicle speedometer.
4.9.1.3 Encoder Count Meters
The left count, right count and vehicle count represent the encoder pulses counted for each encoder measurement
channel. Each counter display will count up to one million encoder pulses. The graph to the right of the encoder
count meters is used for display a strip chart of the counted values. This section can be used to see specifically if a
particular channel of the distance measurement counting system is operating properly. As you travel down the
road the encoder count values should increase.
The following combinations of encoders are used for different system configurations.
Case 1 : A left wheel only force transducer instrumented system
Number of encoders used: a left wheel and a right wheel encoder
Left wheel encoder usage: used for measurement of locking wheel speed
Right wheel encoder usage: use for measurement of vehicle speed
NOTE: a vehicle mounted encoder is not required
Case 2 : A right wheel only force transducer instrumented system
Number of encoders used: a left wheel and a right wheel encoder
Left wheel encoder usage: used for measurement of vehicle speed
Right wheel encoder usage: use for measurement of locking wheel speed
NOTE: a vehicle mounted encoder is not required
Case 3 : A left wheel and right wheel force transducer instrumented system
that will only lock one wheel at a time.
Number of encoders used: a left wheel and a right wheel encoder
Left wheel encoder usage: 1) when the left wheel is locked the left encoder is used
for measurement of locking wheel speed
2) when the right wheel is locked the left encoder is used
for the measurement of vehicle speed
Right wheel encoder usage: 1) when the right wheel is locked the right encoder is
used for measurement of locking wheel speed
2) when the left wheel is locked the right encoder is used
for the measurement of vehicle speed
NOTE: a vehicle mounted encoder is not required
Dynatest 1295 Version 1.07 68 Sep 2017

SECTION 4 OPERATION
Case 4 : A left wheel and right wheel force transducer instrumented system
that will lock both wheels at a the time.
CAUTION: Locking both wheels is not recommended except under
controlled test track conditions by experienced operators
Number of encoders used: a left wheel encoder, right wheel encoder and a vehicle encoder
Left wheel encoder usage: 1) when the left wheel is locked the left encoder is used
for measurement of locking wheel speed
2) when the right wheel is locked the left encoder is not used
Right wheel encoder usage: 1) when the right wheel is locked the right encoder is
used for measurement of locking wheel speed
2) when the left wheel is locked the right encoder is not used
Vehicle encoder usage: used for vehicle speed measurement
NOTE: a vehicle mounted encoder is not required
How can I use the above information to determine how to isolate the problem?
If one of the channels is calculating the incorrect speed value what could wrong?
1) Verify the encoder calibration value is correct for the problem channel.
2) Verify that the problem channel is showing the correct dt value and the encoder count for that channel is
accumulating. If the dt value is incorrect and the encoder count is not accumulating the problem is most likely
a defective encoder on that channel or the encoder for that channel has lost power. if the dt looks correct but
the encoder count is not accumulating then the problem is in the dt measurement timer. If the dt value looks
correct but the encoder is not accumulating then the problem is with the encoder counter. The encoder timer
and counter reside on one PC-104 counter timer board.
Dynatest 1295 Version 1.07 69 Sep 2017

SECTION 4 OPERATION
4.10 Diagnostics: Analog I/O
Figure 4-6: Diagnostics: Analog I/O
4.10.1 Analog I/O
The analog diagnostics page is a set of tools used to localize problems in the Analog to Digital or Digital to
Analog Conversion equipment. Additional display tools are provided to view the vehicle speed, actuate force
transducer calibration resistors, and view various analog sensors use for temperature and flow measurement. The
trace select area allows you to view just the analog to digital converter channels that you are interested in. The
values displayed for the analog to digital converter are shown in A/D converter bits.
4.10.2 Analog Hardware Overview
The measurement system converts the analog voltage signals from the force transducers, flow meters and
temperature sensors to digital values that can be used by the computer software.
The measurement system uses a 16 channel 16 bit analog to digital converter. The measurement system uses a
four channel 12 bit digital to analog converter.
Dynatest 1295 Version 1.07 70 Sep 2017

SECTION 4 OPERATION
A 16 bit converter represents 65536 bits of resolution.
A 12 bit converter represents 4096 bits or resolution.
The A/D converter channels are assigned as listed below.
The channel assignments are shown on the trace select buttons.
A/D Channel 1 : Left traction force
A/D Channel 2 : Left load force
A/D Channel 3 : Right traction force
A/D Channel 4 : Right load force
A/D Channel 5 : Left flow rate
A/D Channel 6 : Right flow rate
A/D Channel 7 : Air temperature
A/D Channel 8 : Surface temperature
A/D Channel 9 : Tire temperature
A/D Channel 10 : Inclinometer
A/D Channel 11 : Not used
A/D Channel 12 : Not used
A/D Channel 13 : Not used
A/D Channel 14 : Not used
A/D Channel 15 : Not used
A/D Channel 16 : Not used
4.10.3 Trace Select
The trace select buttons are used to turn ‘ON’ or ‘OFF’ individual A/D graph display channels. The numeric
values shown to the right of the trace select buttons are the numeric values in bits for the graph channel.
NOTE: Controls that are ‘grayed out’ represent hardware that has not been selected in the
hardware settings section as being installed on your 1295 system.
Dynatest 1295 Version 1.07 71 Sep 2017

SECTION 4 OPERATION
4.11 Diagnostics: Digital I/O
Figure 4-7: Diagnostics: Digital I/O
4.11.1 Digital I/O
This digital input/output page provides diagnostics tools used to localize problems in the Digital Input and
Digital Output hardware. The digital I/O is what the computer uses to control valves, pumps, relays and
determine switch positions. The computer +5 vdc I/O lines are optically isolated for improved system reliability.
The signals are described below:
4.11.2 Digital Inputs : Port 1, Port 2, Port 3
The system uses 24 digital inputs for monitoring system status signals and switched inputs. The digital input
channels are assigned below:
Dynatest 1295 Version 1.07 72 Sep 2017

SECTION 4 OPERATION
Port 1
Channel 1: Operator pendant
Channel 2: E-Stop
Channel 3: Photocell
Channel 4: Spare
Channel 5: Spare
Channel 6: Encoder
Channel 7: RW Encoder
Channel 8: LW Encoder
Port 2
Channel 1: Spare
Channel 2: Spare
Channel 3: Spare
Channel 4: Spare
Channel 5: Spare
Channel 6: Air Compressor ‘ON’ switch
Channel 7: Spare
Channel 8: Spare
Port 3
Channel 1: Event 1 switch (Not used on all systems)
Channel 2: Event 2 switch (Not used on all systems)
Channel 3: Event 3 switch (Not used on all systems)
Channel 4: Event 4 switch (Not used on all systems)
Channel 5: Spare
Channel 6: Spare
Channel 7: Spare
Channel 8: Spare
4.11.3 Digital Outputs : Port 1, Port 2
The system uses 16 digital outputs for controlling system devices. The digital output lines can be turned on and
off by using the buttons ‘A’ – ‘R’. Which can be selected by using the mouse.
The digital input channels are assigned below:
Port 1
Channel 1: Calibration resistor control
Channel 2: Oscillator control
Channel 3: Tank 1
Channel 4: Spare
Channel 5: Spare
Channel 6: Tank 2
Channel 7: Trailer Lock pin
Channel 8: Blinking LED
Dynatest 1295 Version 1.07 73 Sep 2017

SECTION 4 OPERATION
Port 2
Channel 1: Compressor cut off switch
Channel 2: Right water clutch control
Channel 3: Water nozzle control
Channel 4: Left brake control
Channel 5: Right brake control
Channel 6: Safety brake control
Channel 7: Left Pump control
Channel 8: Right Pump control
Dynatest 1295 Version 1.07 74 Sep 2017

SECTION 4 OPERATION
4.12 TESTING
Figure 4-8: Test Screen
4.12.1 Test Screen Layout
The test screen is divided into four primary areas. Across the top third is the test ‘Dashboard’. Above the
Dashboard is the DGPS output – if the unit has DGPS installed. The Dashboard includes large displays of Speed,
Distance and the SN. On the lower edge of the SN display square there are three small controls: Left to right, the
left side is the ‘Test Count’ which keeps track of the number of tests. The center button allows the user to reset
the test count. The right button is a virtual pendant. This button when clicked on has the same action as pressing
the actual pendant.
Caution: Below describes changes that can be done while testing without returning to the test setup area
of the software. Users are cautioned about doing this while driving. Care should be taken that driver
distraction does not interfere with safety.
Directly below these three numeric display boxes are some operator information to change the data being
displayed. In order, left to right:
Water Level – shows the volume of water remaining in the tank in gallons or liters.
Display Mode – This drop down list allows the user to select between three main display formats:
Test Graph, Mu-Slip curve, and Test Data Summary – text grid format.
Test Type – This drop down list allows the user to switch between the Standard Test (SN) and the
PBC Test (Peak Braking Coefficient)
Surface – This drop down list allows the user to select between Dry, Wet (using on board water)
and Pre-Wet (using pre wet pavement)
Dynatest 1295 Version 1.07 75 Sep 2017

SECTION 4 OPERATION
Test Cycle – This drop down list allows the user to select between a ‘Manual’ test setup and an
‘Automatic’ test. (See test setup chapter)
Test Wheel – This drop down list allows the user to select which wheel to use if both wheels are
equipped to test. The default is left wheel.
Target Speed – The user is able to change the target test speed
Test Distance – The user is able to change the distance between tests
To the right of the SN display square, are four rectangles. The top one shows the current setup being used during
the testing. (see ‘Setups’ discussion directly following this chapter.) Below this are three indicators for Water,
Brake and Air which indicate if the item is on or off.
The left lower area of the Test screen shows ‘Sensor and Statistics data’
This area displays live test data and sensor data for each test. This area can be closed by clicking on the ‘X’ in the
upper right corner of this panel. To re-open the Statistics and data display panel there will be a grey triangle in the
upper left corner of the data plot area. Click on this to reveal the Statistics and Data display area.
The lower right two thirds of the Test screen accommodate two different plots. The larger plot area displays one
of three types of information as selected by the ‘Display Mode’ drop down.
The second graph is along the base of the primary display and when open allows ‘Trend Displays’ to be shown.
On each end of the trend display area are arrows to allow the user to maneuver through the variety of ‘Trend
Displays’.
Using the mouse, the display areas can be re-sized, hidden, and pinned in an area.
The Data and Statistics are described below.
4.12.2.1 SN Avg
This is the average SN value calculated during the SN period when the brake is full locked and the tire is
skidding.
4.12.2.2 SN Max
This value is the maximum SN value that was measured during the SN period
4.12.2.3 SN Min
This value is the maximum SN value that was measured during the SN period
4.12.2.4 SN Std
This value is the standard deviation of SN calculated during the SN period
4.12.2.5 Trac Avg
The average traction value measured during the SN period
4.12.2.6 Trac Max
The maximum traction value measured during the SN period
4.12.2.7 Trac Min
Dynatest 1295 Version 1.07 76 Sep 2017

SECTION 4 OPERATION
The minimum traction value measured during the SN period
4.12.2.8 Tract Std
The standard deviation of the traction values measured during the SN period
4.12.2.9 Load Avg
The average load value measured during the SN period
4.12.2.10 Load Max
The maximum load value measured during the SN period
4.12.2.11 Load Min
The minimum load value measured during the SN period
4.12.2.12 Load Std
The standard deviation of the load values measured during the SN period
4.12.2.13 Speed Avg
The average speed value measured during the SN period
4.12.2.14 Flow Avg
The average flow value measured during the SN period
4.12.2.15 PSN
The peak SN value measured during the locking interval. The locking interval is the period between start of brake
actuation and wheel brake lock
4.12.2.16 TTP
The time to peak values is the time in seconds to the PSN described above
4.12.2.17 % Slip
The % slip is measured at the PSN value
4.12.2.18 TTL
The time to lockup is the time in seconds measured from the start of the brake actuation to the time to brake
lockup.
Dynatest 1295 Version 1.07 77 Sep 2017

SECTION 4 OPERATION
4.13 Setups
This menu selection is used to store system variable settings into “Setup Files” Up to thirty-two (32) Setup Files
are provided for storing system settings. The setup files can be recalled to load the system variables with values
that
have been stored in the setup files. Each Setup File has a description field that can be used for identifying a
particular Setup File.
The Current Setup Loaded indicates which one of the 32 Setup Files has been recalled to provide the current
system settings. The Setup Files are numbered from 1 to 32.
For each setup there is a description, and button to Load, Save or Delete.
To assign one of the setups, the user must first go through the settings page to select the details and procedures to
be used for data collection. Once these have been chosen, a return to the ‘Setups’ page will allow a setup to be
described and saved.
“D> Description” - This label sets the cursor focus on the selected Setup File description field.
The description can be changed at any time. The description is just a label used to identify a Setup File.
“L> Load” – This button is used to recall the stored settings from the selected Setup File and load them
into the system variables.
CAUTION: If your current system settings have not been saved in a Setup File they will be overwritten by the
loaded setup variables.
Note: If you have not performed a save operation at least once before performing a load operation, then
No variables will be loaded.
“S> Save” – This button is used to save the current system variable settings into the selected “Setup File”
for later recall by use of the load button.
Dynatest 1295 Version 1.07 78 Sep 2017

SECTION 5 TROUBLESHOOTING
Table 5-1. Troubleshooting Software
Trouble
Probable Cause
Corrective Action
Operating software is lost from hard
disk.
1. Electrical transient spike.
2. Hard disk crash.
1. Reboot system with operating
system on a CD-ROM.
2. Repair hard disk, re-install
operating system, reboot system.
Digital voltmeter not functioning.
1. Digital voltmeter cable
disconnected from VCU.
2. DC power switch on the VCU is
OFF.
3. Improper distance scale factor
entered.
1. Re-connect the cable.
2. Turn the DC power switch to the
ON position.
3. View and/or correct incorrect
scale factor.
Temperature sensor not functioning
1. Temperature sensor cable is
disconnected from the VCU.
2. DC power switch on the VCU is
OFF.
3. Heat radiating from engine.
1. Re-connect the cable to the VCU.
2. Turn the DC power switch to the
ON position.
3. Put vehicle in motion to allow air
flow over engine.
Operator pendant does not function.
1. Operator pendant connection
loose in the connection jack on
the VCU.
1. Re-connect the cable.
Two-axis transducers fail to calibrate.
1. Trailer tongue not level.
2. Obstruction under wheel(s) on
trailer.
3. Brake pedal on the tow vehicle
pressed.
4. Transducer connections on trailer
axle are loose.
5. Transducer connections on the
VCU are loose.
6. Calibration numbers are too high.
7. Connector’s on the bumper are
loose.
1. Level tongue.
2. Remove obstruction.
3. Release tow vehicle brake.
4. Check connections.
5. Check connections.
6. Check calibration numbers.
7. Check bumper connection.
5.1 TROUBLESHOOTING
The following information is designed to lead the operator through a quick remedy for certain 1295
software, electrical, and mechanical problems which may arise during operation.
5.2 Troubleshooting the Software
Refer to Table 5-1 for the Software Troubleshooting information.
Dynatest 1295 Version 1.07 79 Sep 2017

SECTION 5 TROUBLESHOOTING
Table 5-1. Troubleshooting Software (continued)
Trouble
Probable Cause
Corrective Action
Test Cycle aborted
1. Distance scale factor is incorrect.
2. DC power switch on the VUC is
OFF.
3. Compressor switch on the main
console is OFF.
4. Tachometer(s) on test wheel(s) not
working.
5. Mechanical error in test brake
system.
6. Distance scale factor incorrect.
7. Cycle timing of test brake(s) to
lockup is greater than 2.0
seconds.
1. Check the distance scale factor.
2. Turn the DC power switch to the
ON position.
3. Turn Compressor switch on.
4. Run distance diagnostic test on
tachometer.
5. Check brake system for
hydraulic/air leaks.
6. Check distance scale factor.
7. Check cycle timing.
8. Check brake(s) pads.
Test data will not transfer to printer.
1. Printer off line.
2. Printer cable disconnected from
Laptop.
3. Printer cable disconnected from
printer.
4. Printer has failed.
1. Turn printer on line.
2. Reconnect printer cable.
3. Reconnect printer cable.
4. Repair or replace printer.
Dynatest 1295 Version 1.07 80 Sep 2017

SECTION 5 TROUBLESHOOTING
Table 5-2 - Troubleshooting (Electronics)
TROUBLE
PROBABLE CAUSE
CORRECTIVE ACTION
Laptop not functioning.
1. Laptop unplugged from AC outlet
in the tow vehicle.
1. Plug in the power cord.
Printer not printing.
1. Printer is not on line.
2. Printer out of paper.
3. Printer cables disconnected.
1. Turn printer ON.
2. Load paper into printer.
3. Check cable connections.
Test data lost from hard disk drive
1. In the main program storage and
printing, check target Die is
entered correct.
1. If incorrect type in correct Dir
name. If correct open Explorer and
look for that Dir.
All DVM digits do not light.
1. Faulty DVM.
1. Replace DVM.
External AC power does not power
printer.
1. AC inverter is not plugged into
regular connection on the four
way AC outlet box in the rear bed
of tow vehicle.
1. Plug in the inverter.
Four way AC outlet box has no
power.
1. Retractable AC power cord in rear
of tow vehicle not properly
plugged into external AC outlet.
1. Plug in the cord.
5.2.1 REBOOTING THE 1295 OPERATING SOFTWARE
The following information is designed to help the operator reboot the 1295's operating software
program if it is lost from hard disk.
1. Place the 1295 operating software program CD into CD drive.
2. Located install file on CD.
3. Run Install Wizard.
4. Run Friction testing executable file software MAIN MENU should appear on the screen.
5. Verify all setup parameters, calibration numbers, and the distance scale factor are correct before
running a friction test.
5.2.2 TROUBLESHOOTING THE 1295 ELECTRONICS
Refer to Table 5-2 for the Electronics Troubleshooting information.
NOTE
Verify all connecting cables to the laptop, tow vehicle and two wheel
trailer are secure and properly connected.
Dynatest 1295 Version 1.07 81 Sep 2017

SECTION 6 MAINTENANCE
Table 6-1 - Service Schedule (Tow Vehicle)
DESCRIPTION
OPERATION
FREQUENCY
Water Pump Gear belt
Check Tension and Wear.
2 Weeks
Water Pump Bearing
Grease Fitting Under Drivers Door
1 Month
Water Pump Strainer
Clean
3 Months
Air Drier Desiccant
Replace With Fresh Desiccant
(If Color is Pink)
As Required
Air System Filter
Clean Out or Replace Filters
As Required
Air Storage Tanks
Drain Condensation From Tanks By
the ¼ inch Pipe Plugs
2 Weeks
Air Compressor
Dust or Replace Filters
As Required
SECTION 6 MAINTENANCE
6.1 PREVENTATIVE MAINTENANCE
The following information is designed to provide the operator with a routine maintenance schedule for
the special components mounted on the tow vehicle and the two wheel trailer.
6.2 SERVICE SCHEDULE (TOW VEHICLE)
Routine maintenance for the tow vehicle is specified in the Vehicle owner's/drivers manual supplied
with the vehicle. An additional vehicle service manual may have been included for more detailed
vehicle service instructions.
The service schedule for the special equipment installed on the tow vehicle is given in Table 6-1. The
schedule is a recommended aide to maintenance personnel. It may be modified to meet your particular
maintenance schedule.
Dynatest 1295 Version 1.07 82 Sep 2017

SECTION 6 MAINTENANCE
Table 6-3. Service Schedule (Trailer)
DESCRIPTION
OPERATION
FREQUENCY
Hydraulic Brake System
Check All Connections for Signs of
Leaks
Each Month
Brake Fluid Reservoirs
Check Levels. Refill with DOT 3
Brake Fluid
Each Month
Brake Pads
Check for Signs of Wear
Each Month
Water Nozzle
Grease Fittings With Water Resistant
DP Chassis Grease(#GM6031M)
Specifications
Each Month
Check Spindle End Play
Use Dial Indicator. (See Replacing
The Wheel Bearings)
30 Days
Control Arms (2)
Grease the 1 fittings On Each Control
Arm
Each Month
Sway Bars (2)
Grease the 2 fittings On Each Sway
Bar
Each Month
Wheel Bearings
Replace
10,000 Miles and/or Annually
Water Solenoid Valves (If Equipped)
Clean Out
6 Months
Pneumatic Lubricator
Fill with 10 weight Non-detergent Oil
Weekly
6.3 SERVICE SCHEDULE (TRAILER)
The service schedule for the two wheel trailer is given in Table 6-2. The schedule is a recommended
aide to maintenance personnel. It may be restructured to meet your particular maintenance schedule.
Dynatest 1295 Version 1.07 83 Sep 2017

SECTION 6 MAINTENANCE
6.3.1 REPLACING THE TRAILER WHEEL BEARINGS
Proper assembly and disassembly of the trailer wheel spindles to replace the tapered wheel bearings
require special tools, shims, and assembly procedures. These spindles are modified General Motors
Corporation Corvette spindles, and Dynatest recommends that the spindles be removed and taken to an
authorized General Motors Dealer for service.
NOTE
After assembly, these tapered wheel bearing spindles should have an
end play (axial movement) of .001 to .008 inches. Dynatest prefers to
have .004 to .008 inches of end play. Check this carefully to verify both
spindles have been shimmed properly. The spindle nut should have a
cotter key installed on it, and be tightened to 120 ft/lbs.
If replacing the wheel bearing yourself,
1. Disconnect the air hose from the rear bumper of the tow vehicle.
2. Lift the two wheel trailer off the ground and secure it with two jack stands underneath the trailer
frame. This will allow the axle to hang down and access gained to the rubber plugs at the rear of
the axle housing.
3. Remove the five lug nuts which hold the test wheel onto the spindle adapter plate and remove the
wheel. This will partially expose the spindle, the wheel adapter plate on the end of the spindle,
and the brake rotor.
4. Remove the brake caliper from the two wheel trailer. The caliper is mounted on the trailer by two
7/16 inch bolts.
5. The caliper is hard plumbed to a manifold block on the axle. Take the screw out of the manifold
block so that the block is loose, and place the caliper out of the way on the trailer's control arm.
DO NOT OPEN LINE TO LET BRAKE FLUID LEAK OUT.
6. Remove the five lug nuts which hold the wheel adapter plate onto the spindle. Then remove the
adapter plate and brake rotor.
7. To remove the spindle and wheel bearings only:
A. Located on the back of the axle is a rubber plug. Using a ½ inch socket loosen the nut and
remove the plug.
B. With plug removed, look into the axle housing and locate the tachometer coupling. Loosen
the set screw on the spindle side of the coupling. Two turns is adequate.
C. Remove the four 7/16 inch bolts located on the face of the spindle dust shield.
D. Remove the spindle, bearings, and bearing housing.
8. Remove the cotter pin and nut from the end of the spindle and the flat washer and drive flange.
9. Use the Kent Moore bearing remover #J24489 to remove the press fit inner wheel bearing from
the drive spindle.
10. Inside the bearing housing is a groove supplied for pushing the bearing races out of the housing.
Place a drift pin in the groove against the O.D. edge of the bearing races and tap both of them out
of the housing with a hammer.
Dynatest 1295 Version 1.07 84 Sep 2017

SECTION 6 MAINTENANCE
6.3.1 REPLACING THE TRAILER WHEEL BEARINGS (continued)
11. Thoroughly clean the inside of the bearing housing with a part cleaning solvent.
12. The new bearing races are supplied with the new wheel bearings. Identify the inner and outer
bearing races by fitting them in the housing. The proper bearing race must be press fit into the
proper end of the bearing housing.
13. Using a soft material against the top of the bearing race, use an arbor press to press both bearing
races into the bearing housing. Verify that the O.D. edge of the race is properly seated in the
bearing housing all the way around.
14. Install Kent Moore #J-24626 into the jaws of a vice so that the nut is facing up in the air. Remove
the nut and flat washer from the end of the Tool.
15. Place the ungreased outer wheel bearing over the tool #J-24626, in the proper mounting position.
16. Place the bearing housing, outer bearing race end down, over the wheel bearing.
17. Place the spacer over the tool #J-24626 with the flared end down.
18. Select a shim, on the average .140 inch in width, and place it over tool #J-24626.
19. Place the ungreased inner wheel bearing over the Tool, in the proper mounting position. Press the
inner wheel bearing down into the bearing housing and feel for any end play. If there is no end
play, increase the width of the shim.
20. Place the tool #J-24626 flat washer and nut on the Tool and tighten the nut down to 120 foot/lbs.
21. Using a magnetic base and a dial indicator, place the tip of the dial indicator against the machined
surface on the flange of the bearing housing.
A. Move the bearing housing side to side by hand to seat the bearings in the bearing races.
B. Lift the bearing housing by hand to check the end play. The end play should be between
.001 inch to .006 inch. If it is not, either select another shim or grind the one you have.
22. Take the whole assembly apart and grease both wheel bearings with a high-melting point wheel
bearing grease.
23. To reassemble the wheel spindle assembly:
A. Place the brake dust shield over the spindle so that the flange on the shield is facing up.
B. Place the caliper support bracket over the spindle so that the cuts in the dust shield line up
with the legs on the caliper support bracket.
C. Place the outer wheel bearing, after greasing, in the bearing housing.
D. Install the outer bearing grease seal into the bearing housing by tapping around the outside
of the seal with a hammer. Lubricate the seal contact points.
E. Place the bearing housing over the spindle, outer wheel bearing facing down, and work the
wheel bearing in place on the spindle.
F. Using a Kent Moore J-24490, press the wheel bearing onto the spindle with an arbor press,
pressing on the inner bearing race only. Support the spindle by the pilot diameter, NOT the
wheel studs.
G. Install the spacer over the spindle (flare side down) and slide on the shim that was selected
to obtain the .001 inch to .006 inch end play.
Dynatest 1295 Version 1.07 85 Sep 2017

SECTION 6 MAINTENANCE
6.3.1 REPLACING THE TRAILER WHEEL BEARINGS (continued)
H. Slide the inner greased wheel bearing onto the spindle and press it onto the spindle with an
arbor press. Make sure the wheel bearing has bottomed on the shim.
I. Install the inner bearing grease seal into the bearing housing by tapping around the outside
of the seal with a hammer. Lubricate the contact points.
J. Install the drive flange over the spindle.
K. Place the flat washer over the spindle and screw the nut on the threads of the spindle.
L. Use a socket and socket wrench to tighten the nut to 120 foot/lbs. and install the cotter pin
through the nut and spindle.
M. The wheel bearing changeover procedure is complete and the spindle assembly is ready to
be reinstalled onto the two wheel trailer.
24. Reverse steps c through g (above) to reinstall the spindle assembly on the two wheel trailer, being
careful to properly align the tachometer drive coupling with the spindle drive pin. Remember the
set screw should fasten on the flat of the drive pin.
6.3.2 MEASURE WHEEL BEARING ENDPLAY
The amount of wheel bearing endplay can be measured periodically to keep track of the wheel bearings
condition. This is by no means a way to rate the condition of the grease in the bearings. It is only an
attempt to evaluate the condition of the spindle in order to schedule service. Normal wear will normally
permit in excess of 15,000 miles of testing. It is a normal practice of our current customers to try and
schedule regular maintenance during inclement weather, such as the winter months.
1. Jack the trailer up off the ground with the power jacks, and remove the test tire and the wheel
spacer. Replace two of the lug nuts so the brake rotor is secure. This will allow you to push and
pull on the rotor to move the spindle in and out to create endplay.
2. Mount a dial indicator on the brake rotor. Push on the brake rotor and read the dial indicator. Pull
on the brake rotor and read the indicator again. This amount of change on the indicator is the
bearing endplay. An acceptable amount of endplay is form 0.001 inches to 0.010 inches. If the
regular service schedule is not in the near future, it is recommended that the service schedule be
altered to perform the proper maintenance before damage to the spindle occurs.
3. After measuring the spindle you should remove the two lug nuts that were put on to secure the
brake rotor and replace the wheel spacer, tighten the lug nuts and then put the tire on also using
five lug nuts. You are now ready to continue testing. Lower the trailer to the ground.
Dynatest 1295 Version 1.07 86 Sep 2017

SECTION 6 MAINTENANCE
6.3.3 BRAKE BLEEDING PROCEDURE (TRAILER)
This information is designed to familiarize the operator with the proper procedure for bleeding the air
over hydraulic brakes on the two wheel trailer. Bleeding may be required when the disc brakes do not
achieve total lockup in the two (2) seconds required for a valid test during the test cycle.
CAUTION
Brake fluid will cause extensive damage to the transducer(s). Be
sure to completely cover the transducer(s) during the brake
bleeding operation.
The most convenient method for bleeding the brakes is with a pressure bleeder. The following
procedure assumes a pressure bleeder is available.
1. Remove the master cylinder filler cap for the left hand disc brake, and mount the proper size
bleeder adapter in its place.
2. Fill the pressure bleeder's reservoir with enough DOT 3 brake fluid to ensure that no air will be
forced into the brake system during bleeding.
3. Attach the pressure bleeder adapter and pressurize the bleeder with approximately 15 psi of shop
air. Your foot on the trucks brake pedal will also apply brake pressure to the trailer brakes.
4. Attach one end of the four (4) foot long piece of Tygon tubing over the brake bleed fitting (located
on the inside of the disc brake caliper) make sure the fit is tight.
5. Place the other end of the Tygon tubing into a can to collect the expended brake fluid from the
bleeding process.
6. Loosen the bleed fitting and watch for leaks around the Tygon tube.
A. With the bleed fitting open, gently tap the caliper housing with a rubber mallet.
B. The bleed fitting should be opened and closed at short intervals (approximately 10 second
intervals).
7. When the bubbles in the brake fluid stop appearing inside the Tygon tubing, close the bleed
fitting.
8. Remove the air pressure from the pressure bleeder before disconnecting it from the bleeder
adapter.
9. Remove the bleeder adapter from the master cylinder and replace it with the master cylinder filler
cap.
10. Follow the same procedure (above) to bleed the right hand disc brake.
11. Check the brake system for air by selecting the DIAGNOSTICS menu on the computer, and
going to the DIGITAL I/O screen and turning on the SAFETY BRAKE I/O line.
6.3.4 VERIFYING / ADJUSTING TRAILER BRAKE PRESSURES
This information is designed to lead the operator through the correct procedure for verifying and, if
necessary, adjusting the trailer brake pressures. The trailer is equipped with an air over hydraulic brake
system. All the brake system components are located underneath the cover on the trailer.
There are two modes of brake actuation on the two wheel trailer.
Dynatest 1295 Version 1.07 87 Sep 2017

SECTION 6 MAINTENANCE
6.3.4.1 SAFETY BRAKES
When the operator applies the brakes on the tow vehicle, the brakes are applied on the two wheel trailer.
6.3.4.2 LEFT OR RIGHT WHEEL LOCKUP BRAKES
To verify and/or adjust trailer brake pressures:
1. Enter the ‘Diagnostics’ Menu.
2. Select the ‘Digital I/O ’ Page.
3. Turn of the ‘Safety Brake’ I/O line.
6.3.4.2.1 SAFETY BRAKES
The safety brake mode will supply between 200-250 psi (1379-1724 kPa) of hydraulic pressure at each
brake caliper on the two wheel trailer. To achieve a hydraulic pressure between 200-250 psi (13791724 kPa) , 7 to 10 psi (50-69 kPa) of air pressure is required. To view the air pressure:
1. Locate the safety brake regulator's gauge. This gauge is positioned on the right side of the
solenoid valve manifold.
2. If the safety brake regulator's gauge does not read 7 to 10 psi (50-69 kPa),
A. Locate the safety brake air regulator, positioned just below the safety brake air pressure
gauge.
B. Lift the red lock ring below the regulator's knob to unlock the knob.
C. Turn the knob on the regulator counter-clockwise to decrease the air pressure until the gauge
reads 7 to 10 psi.
D. Turn the knob clockwise to increase the air pressure until the gauge reads less than 7 psi.
E. The hydraulic pressure gauges, mounted on both brake master cylinders, should read
between 200-250 psi (1379-1724 kPa) when the air pressure gauge reads 7 to 10 psi (50-69
kPa)
F. Turn on the SAFETY BRAKE sub-menu.
Dynatest 1295 Version 1.07 88 Sep 2017

SECTION 6 MAINTENANCE
6.3.4.2.1 SAFETY BRAKES (continued)
NOTE
The safety brakes must be removed and re-applied to obtain the correct
reading, due to a hysteresis in the trailer's braking system.
G. Turn ‘ON’ the SAFETY BRAKE.
H. Press the operator hand pendant to apply the safety brakes on the two wheel trailer.
I. Turn the knob on the air pressure regulator until the gauge reads 7 to 10 psi (50-69 kPa).
J. The hydraulic pressure gauges should read between 200-250 psi (1379-1724 kPa).
K. Press the red lock ring down to lock the safety brake air regulator in the adjusted position.
l. Turn ‘OFF’ the SAFETY BRAKE .
6.3.4.2 TEST BRAKE(S)
The left or right test brake lockup mode will supply approximately 1000 psi (6895 kPa) of hydraulic
pressure at each brake master cylinder(s) on the two wheel trailer. To achieve a hydraulic pressure of
1000 psi (6895 kPa) , air pressure between 50-55 psi (345-379 kPa) is required. To view the air
pressure:
1. Enter the DIAGNOSTIC menu and enter the ‘Digital I/O Page.
2. Press the operator hand pendant to apply the left wheel test brake.
3. Locate the test brake air pressure regulator and gauge, mounted beneath the air valve manifold.
4. The air gauge should read approximately 50 to 55 psi (6895 kPa).
5. If the air gauge does not read approximately 50 to 55 psi (6895 kPa).
A. Pull the knob on the regulator out to unlock the knob.
B. Turn the knob counter-clockwise to decrease the air pressure until the gauge reads 50 to 55
psi (6895 kPa).
C. Turn the knob clockwise to increase the air pressure until the gauge reads 50 to 55 psi (6895
kPa).
D. The left wheel hydraulic pressure gauge, mounted on the left brake master cylinder, should
read 1000 psi of hydraulic pressure. Turn the air regulator knob until the hydraulic pressure
is 1000 psi (6895 kPa).
E. Push the knob on the air regulator in to lock the knob in the adjusted position.
F. Turn ‘ON’ LEFT BRAKE digital I/O line.
Dynatest 1295 Version 1.07 89 Sep 2017
 Loading...