

Page 1

SFC3
OPERATORS MANUAL
Smart F l o w C o m p uter
Liqui d P u l s e V e r s i on
11 1 0 4 W . A i r p o rt Blvd , S u i t e 1 0 8 & 1 4 8
Staf f o r d , T e x as 77 4 7 7 U S A
(2 81 ) 5 6 5 -1118
Fa x ( 2 8 1 ) 5 6 5 -11 1 9
Date: 8/1/2019
Page 2

WARRANTY
Dynamic Fluid Measurement warrants to the owner of the Flow Computer that the
product delivered will be free from defects in material and workmanship for one (1) year
following the date of purchase.
This warranty does not cover the product if it is damaged in the process of being installed
or damaged by abuse, accident, misuse, neglect, alteration, repair, disaster, or improper
testing.
If the product is found otherwise defective, Dynamic Fluid Measurement will replace or
repair the product at no charge, provided that you deliver the product along with a return
material authorization (RMA) number from Dynamic Fluid Measurement.
Dynamic Fluid Measurement will not assume any shipping charge or be responsible for
product damage due to improper shipping.
THE ABOVE WARRANTY IS IN LIEU OF ANY OTHER WARRANTY EXPRESS
IMPLIED OR STATUTORY. BUT NOT LIMITED TO ANY WARRANTY OF
MERCHANTABILITY, FITNESS FOR PARTICULAR PURPOSE, OR ANY
WARRANTY ARISING OUT OF ANY PROPOSAL, SPECIFICATION, OR SAMPLE.
LIMITATION OF LIABILITY:
DYNAMIC FLUID MEASUREMENT SHALL HAVE NO LIABILITY FOR ANY
INDIRECT OR SPECULATIVE DAMAGES (INCLUDING, WITHOUT LIMITING
THE FOREGOING, CONSEQUENTIAL, INCIDENTAL AND SPECIAL DAMAGES)
ARISING FROM THE USE OF, OR INABILITY TO USE THIS PRODUCT.
WHETHER ARISING OUT OF CONTRACT, OR UNDER ANY WARRANTY,
IRRESPECTIVE OF WHETHER DFM HAS ADVANCED NOTICE OF THE
POSSIBILITY OF ANY SUCH DAMAGE INCLUDING, BUT NOT LIMITED TO
LOSS OF USE, BUSINESS INTERRUPTION, AND LOSS OF PROFITS.
NOTWITHSTANDING THE FOREGOING, DFM’S TOTAL LIABILITY FOR ALL
CLAIMS UNDER THIS AGREEMENT SHALL NOT EXCEED THE PRICE PAID
FOR THE PRODUCT. THESE LIMITATIONS ON POTENTIAL LIABILITY WERE
AN ESSENTIAL ELEMENT IN SETTING THE PRODUCT PRICE. DFM NEITHER
ASSUMES NOR AUTHORIZES ANYONE TO ASSUME FOR IT ANY OTHER
LIABILITIES
Date: 8/1/2019
Page 3

CHAPTER 1: QUICK START.................................................................................................................... 1-1
Introduction: ............................................................................................................................................ 1-1
Technical Data ......................................................................................................................................... 1-2
Parts List .................................................................................................................................................. 1-3
Smart Flow Computer : Dimensions ....................................................................................................... 1-4
Starting and Installing the Software: ....................................................................................................... 1-5
System Minimum Requirements ......................................................................................................... 1-5
Website - DFC Configuration Software .................................................................................................. 1-6
Getting acquainted with the flow computer wiring: ................................................................................ 1-8
Back terminal wiring: .......................................................................................................................... 1-8
Back Panel Jumper .............................................................................................................................. 1-9
Memory Jumper................................................................................................................................. 1-10
INPUT/OUTPUT: Assignment, Ranging, Wiring, and Calibration ................................................. 1-14
Input/Output Assignment .................................................................................................................. 1-14
How to assign a transmitter to an I/O point: ...................................................................................... 1-14
Ranging the Transmitter Inputs: ........................................................................................................ 1-14
WIRING: ............................................................................................................................................... 1-16
Wiring the analog inputs: .................................................................................................................. 1-16
Wiring the Analog Inputs 1-4 : .......................................................................................................... 1-17
RTD Wiring ....................................................................................................................................... 1-18
Wiring Analog Output: ...................................................................................................................... 1-19
Turbine input wiring .......................................................................................................................... 1-20
Turbine input wiring for passive (dry contact) pulse generators ....................................................... 1-23
Density input wiring: ......................................................................................................................... 1-24
RS-232 Connection ........................................................................................................................... 1-25
RS-485 Connection ........................................................................................................................... 1-26
Wiring of Status Inputs: ..................................................................................................................... 1-27
Wiring of Switch/Pulse Outputs: ....................................................................................................... 1-28
I/O Expansion: ................................................................................................................................... 1-29
Wiring of Brooks Prover ................................................................................................................... 1-32
Wiring of Calibron Prover ................................................................................................................. 1-33
CALIBRATION ................................................................ ................................................................ .... 1-34
Analog Input 4-20mA or 1-5 volt signal: .......................................................................................... 1-34
RTD calibration: ................................................................................................................................ 1-35
Calibration of analog output: ............................................................................................................. 1-36
Multi-Variable Transmitters (Model 205)- DP and Pressure ............................................................ 1-36
Multi-Variable Transmitters (Model 205)- RTD ............................................................................... 1-37
Verifying Digital Inputs and Outputs .................................................................................................... 1-38
Pulse Interpolation: ................................................................................................................................ 1-39
Double Chronometry: ................................................................................................ ............................ 1-39
Calculations and Terminology: ............................................................................................................. 1-40
Liquid pulse units .............................................................................................................................. 1-40
Terms ................................................................................................................................................. 1-40
CHAPTER 2: Data Entry ............................................................................................................................ 2-1
Introduction to the Smart Flow Computer Software................................................................................ 2-1
Introduction to the Flow Computer Software ......................................................................................... 2-1
ABOUT ................................................................................................................................................... 2-1
FILE ........................................................................................................................................................ 2-2
Open a File .......................................................................................................................................... 2-2
Open a New File .................................................................................................................................. 2-2
Delete a File ......................................................................................................................................... 2-2
Load File.............................................................................................................................................. 2-3
View File ............................................................................................................................................. 2-3
Save As ................................................................................................................................................ 2-3
Save ..................................................................................................................................................... 2-4
Date: 8/1/2019
Page 4

Save and Exit ....................................................................................................................................... 2-4
Exit ...................................................................................................................................................... 2-4
PORT ....................................................................................................................................................... 2-5
PC Communication Set Up.................................................................................................................. 2-5
Flow Computer Communication Set Up ............................................................................................. 2-6
Dial ...................................................................................................................................................... 2-7
Phone Book ......................................................................................................................................... 2-8
Modem Setup ...................................................................................................................................... 2-8
Hang-up Phone .................................................................................................................................... 2-8
DIAG ....................................................................................................................................................... 2-9
Read Single Flow Computer Communication Setup ........................................................................... 2-9
Diagnostic Data ................................................................................................................................... 2-9
PROVER ............................................................................................................................................... 2-10
Prove Request .................................................................................................................................... 2-10
Prover Temperature Override ............................................................................................................ 2-10
Prover Pressure Override ................................................................................................................... 2-10
Prover Gravity Override .................................................................................................................... 2-10
Prover Shaft Temperature Override ................................................................................................... 2-10
CTL or CPL Override ........................................................................................................................ 2-10
Prove Data ......................................................................................................................................... 2-10
Prover Diagram ................................................................................................................................. 2-14
Previous Prove Report ................................................................ ................................ ....................... 2-14
Single Prove Report ........................................................................................................................... 2-14
Prove Abort Report ............................................................................................................................ 2-14
METER ................................................................................................................................................. 2-15
Batch and Stream Data ...................................................................................................................... 2-15
METER DATA ................................................................................................................................. 2-16
PRODUCT DATA ............................................................................................................................ 2-19
OTHER PARAMETERS ...................................................................................................................... 2-20
Day Start Hour (0-23) ........................................................................................................................ 2-20
Company Name ................................................................................................................................ . 2-20
Flow Rate Average Second ............................................................................................................... 2-20
Old Table Gravity Unit ...................................................................................................................... 2-20
Disable Alarms .................................................................................................................................. 2-20
Print Intervals in Minutes .................................................................................................................. 2-20
GM/CC Conversion Factor ................................................................................................................ 2-20
Weight of H2O in Vac @60 Deg.F ................................................................................................... 2-20
Atmospheric Pressure ................................................................................................ ........................ 2-20
Pulse Output Width ........................................................................................................................... 2-20
Date and Time ................................................................................................................................... 2-20
End Batch .......................................................................................................................................... 2-20
Overrides: .......................................................................................................................................... 2-20
Security Code .................................................................................................................................... 2-21
INPUT/OUTPUT .................................................................................................................................. 2-22
Transducer Input Assignment ............................................................................................................ 2-22
Transducer Override .......................................................................................................................... 2-22
Calibration ................................................................ ................................................................ ......... 2-22
Status Input Assignment .................................................................................................................... 2-23
Switch Output Assignment ................................................................................................................ 2-26
Pulse Output and Pulse Output Width ............................................................................................... 2-26
Analog Output Assignment ............................................................................................................... 2-30
Flow Computer Display Assignment ................................................................................................. 2-32
Modbus Shift ..................................................................................................................................... 2-34
REPORTS ............................................................................................................................................. 2-35
Current Data - Snapshot Totalizer Updates ....................................................................................... 2-35
Previous Batch Data .......................................................................................................................... 2-35
Date: 8/1/2019
Page 5

Previous Hourly Data ........................................................................................................................ 2-35
Previous Daily Data ........................................................................................................................... 2-35
Previous Alarm Data ......................................................................................................................... 2-35
Audit Trail Report ............................................................................................................................. 2-36
Build User Report .............................................................................................................................. 2-36
View User Report .............................................................................................................................. 2-36
Formatted Ticket Report .................................................................................................................... 2-36
Auto Data Retrieval ........................................................................................................................... 2-36
WIRING ................................................................................................................................................ 2-37
PRINT ................................................................................................................................................... 2-38
Print "Help" File ................................................................................................................................ 2-38
Print Modbus Registers ..................................................................................................................... 2-38
Print Schematic .................................................................................................................................. 2-38
Print Calibration Data ........................................................................................................................ 2-38
Print Files .......................................................................................................................................... 2-38
CHAPTER 3: Flow Equations ..................................................................................................................... 3-1
FLOWRATES ......................................................................................................................................... 3-1
Mass Flowrate (MASS) ....................................................................................................................... 3-1
PROVE EQUATION .............................................................................................................................. 3-3
DENSITY EQUATIONS ........................................................................................................................ 3-6
Sarasota Density GM/CC .................................................................................................................... 3-6
UGC Density GM/CC ......................................................................................................................... 3-7
Solartron Density GM/CC ................................................................................................................... 3-8
CHAPTER 4: MODBUS DATA ................................................................................................................. 4-1
MODBUS PROTOCOL .......................................................................................................................... 4-1
TRANSMISSION MODE ................................................................................................................... 4-1
ASCII FRAMING ............................................................................................................................... 4-1
RTU FRAMING .................................................................................................................................. 4-1
FUNCTION CODE ............................................................................................................................. 4-2
ERROR CHECK ................................................................................................................................. 4-2
EXCEPTION RESPONSE .................................................................................................................. 4-2
BROADCAST COMMAND ............................................................................................................... 4-2
MODBUS EXAMPLES ...................................................................................................................... 4-3
FUNCTION CODE 03 (Read Single or Multiple Register Points) ..................................................... 4-3
Scaled Data Area (N: 1-meter1, 2-meter2, … 6-meter6) ................................................................... 4-13
Stream Data Area (N=: 1=Stream #1, 2=Stream#2, 3=Stream#3) .................................................... 4-14
Last Batch/Daily/Hourly Data Area .................................................................................................. 4-21
Stream Data Area - Last Batch/Daily/Hourly Data Area ................................................................... 4-22
Stream Data Area (N=: 1=Stream #1, 2=Stream#2, 3=Stream#3) .................................................... 4-24
Last Prove Data Area ......................................................................................................................... 4-27
Current Prove Data Area ................................................................................................................... 4-32
Last Single Prove Report Data Area .................................................................................................. 4-33
Last Abort Prove Report Data Area................................ ................................................................ ... 4-34
Alarms and Status Codes ................................................................................................................... 4-37
Previous Audit Data Area: ................................................................................................................. 4-39
CURRENT ALARM STATUS ......................................................................................................... 4-43
FLOATING POINT DATA AREA................................................................................................ ... 4-46
Date: 8/1/2019
Page 6

Dynamic Fluid Measurement SFC3 Liquid Pulse Manual Quick Start — 1-1
CHAPTER 1: QUICK START
Introduction:
A good flow computer must be:
User friendly
Flexible
Easy to understand and configure
Rugged
Economical to install and maintain
Accurate
The model SFC332 Smart Flow Computer incorporates all these features. We hope that your experience
with the Smart Flow Computer will be a very pleasant and friendly experience and not intimidating in any
way.
General Description: The SFC332 is a dual meter run bi-directional flow computer for the measurement
of liquid products. Twelve days of previous daily data, twelve previous batch data, and twelve previous
hourly data are stored in the full format type reports. The previous 50 audit trail reports and 50 alarm
reports are stored. User formatted reports and user formatted ticket reports are available. Sixteen different
product files are user-configurable with easy switch feature and product scheduling for batch operation.
Inputs/Outputs: 2 serial connections, RS-232 and RS-485, both of them Modbus ready. The RS-232 can
also be used with serial printer. Inputs: two 4 wire RTD; 4 single ended analog inputs; , 4 status inputs;
and density frequency. Outputs: 2 pulse/switch outputs; 3 switch outputs; and 2 analog outputs.
Programmable plasma display.
Date: 8/1/2019
Page 7

Dynamic Fluid Measurement SFC3 Liquid Pulse Manual Quick Start — 1-2
POWER
VOLTAGE RANGE
12-30 VDC
WATTAGE
4 WATT
OPERATING CONDITIONS
TEMPERATURE
- 40 TO 185 °F
HUMIDITY
100%
HOUSING
NEMA 4X CLASS 1 DIV. 1
FEATURES
DISPLAY
PLASMA 2 LINES 16 CHARACTER
PROCESSOR
32-BIT MOTOROLA 168332 @ 16.7 MHz
FLASH ROM
4 MB @ 70 NANO SECONDS
ROM
2 MB @ 30 NANO SECONDS
FREQUENCY INPUT
3 CHANNELS
0 - 5000 Hz
>70 mV FOR SIN WAVE
> 6 VOLTS FOR SQUARE WAVE
ANALOG INPUT
FOUR 24-BIT CHANNEL
RTD INPUTS
2 CHANNELS 4 WIRES
ANALOG OUTPUT
2 CHANNELS 12 BIT SINGLE ENDED
DIGITAL OUTPUT
OUTPUTS 1 & 2 PULSE/SWITCH 0.5 AMPS RATING
OUTPUTS 3 TO 5 ARE SWITCH OUTPUTS 0.25 AMPS
RATING
STATUS INPUTS
4 ON/OFF TYPE SIGNAL
ALL INPUTS AND OUTPUTS ARE OPTICALLY ISOLATED
SERIAL
1 RS485 @ 9600 BAUDS VARIABLE
1 RS232 @ 9600 BAUDS VARIABLE
COMMUNICATION PROTOCOL
MODBUS
Technical Data
Date: 8/1/2019
Page 8

Dynamic Fluid Measurement SFC3 Liquid Pulse Manual Quick Start — 1-3
Part
Description
332-01P
Controller (CPU) Board for SFC332/1000 w/prover option.
332-02
Terminal (BP) Board for SFC332/1000.
332-03
Analog Board for SFC332/1000.
332-04
Display (LCD) for SFC332/1000.
332-05
Rosemount Interface Board for SFC1000.
332-06
Prover Option for SFC332/1000.
332-07
Enclosure for SFC332/1000.
332-08
Mounting Bracket w/captive screws for SFC332/1000 Boards.
332-09
Adapter between SFC1000 and Rosemount 205.
332-10
Center portion of housing for SFC332/1000 enclosure.
332-11
Glass Dome Cover for SFC332/1000 Enclosure.
332-12
Blank Dome Cover for SFC332/1000 Enclosure.
332-13
O'ring for SFC332 Enclosure.
332-14
External I/O Expansion.
332-15
Battery Replacement for SFC332/1000.
332-16
1/2 Amp 250V Fuse for SFC332/1000.
332-17
EPROM for SFC332/1000 (set of two).
RS232
External RS232 Connection for all models.
Parts List
Date: 8/1/2019
Page 9
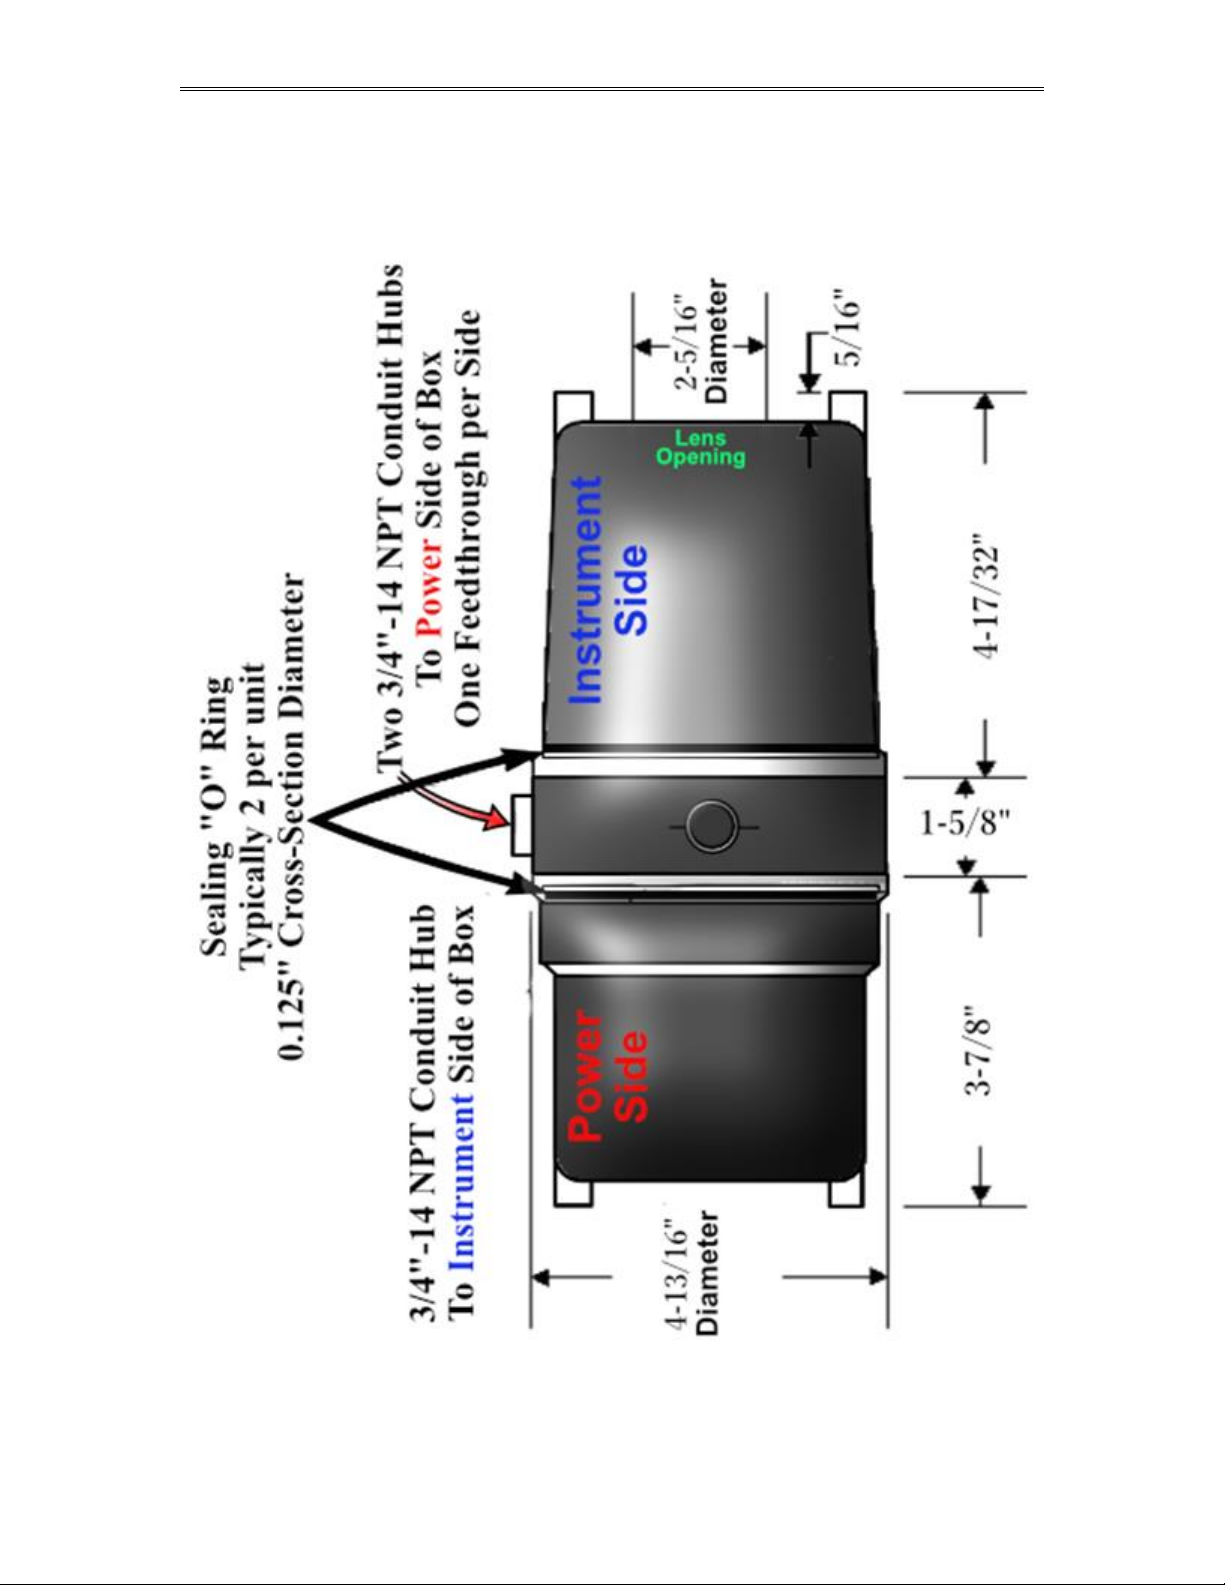
Dynamic Fluid Measurement SFC3 Liquid Pulse Manual Quick Start — 1-4
Smart Flow Computer : Dimensions
Date: 8/1/2019
Page 10

Dynamic Fluid Measurement SFC3 Liquid Pulse Manual Quick Start — 1-5
Starting and Installing the Software:
First make sure your computer has the minimum requirements to install Dynamic’s Dynacom software.
System Minimum Requirements
In order to install this software product the following requirements must be met:
Windows Operating System (Win95, Win98, Win98SE, win2000, WinNT, WinXP, Vista,
Windows 7, Windows 8, Windows 10)
For Windows NT, 2000, XP or Vista: Administrator level access to create an ODBC system DNS.
Minimum disk space available: 16 MB.
1 Serial Communication Port
If your computer meets these requirements, you can run the setup file downloaded from our website
Date: 8/1/2019
Page 11
Dynamic Fluid Measurement SFC3 Liquid Pulse Manual Quick Start — 1-6
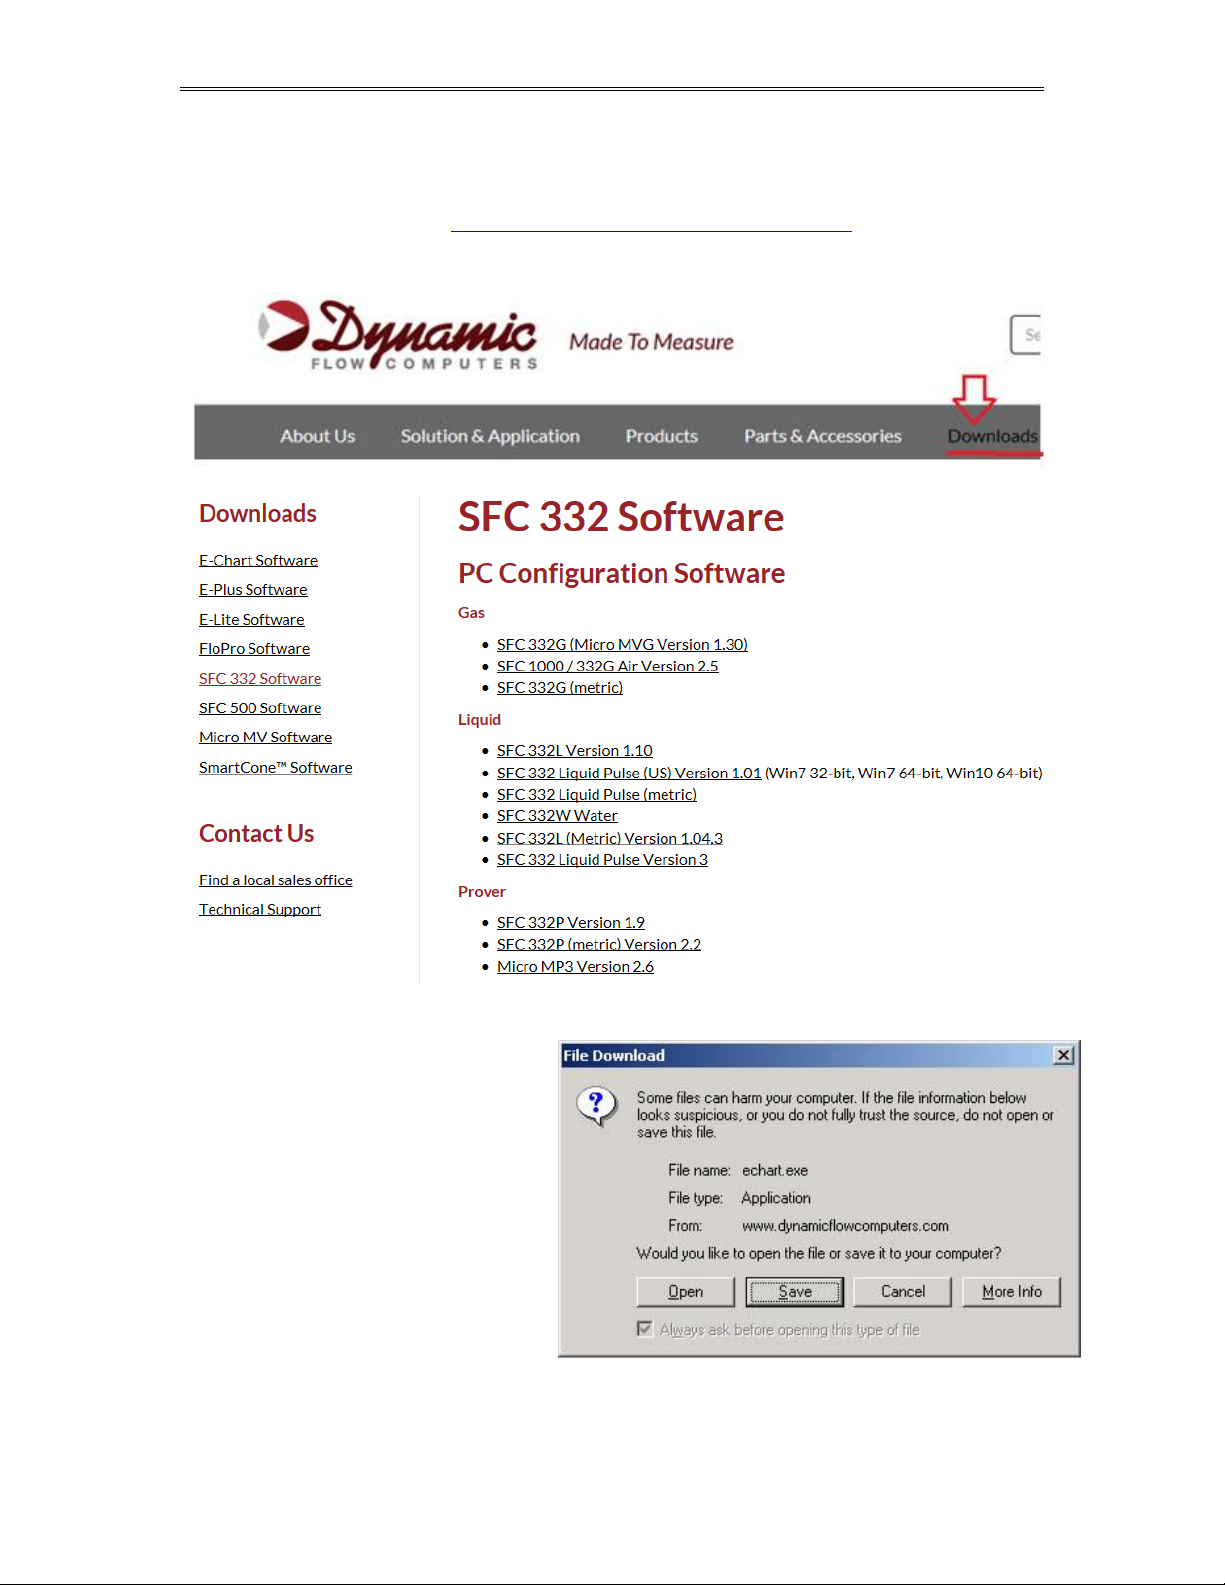
Website - DFC Configuration Software
Step 1. Go to our website WWW.DYNAMICFLOWCOMPUTERS.COM
Step 2. Click on the “Downloads”
Step 3. Select either Windows or
DOS software based on Step 2.
Step 4. On the new screen
presented to you click on the
application that you are trying to
download. Once you hit the link it
will ask you if you want to run or
save the file in your computer.
Select SAVE. (See illustration 1)
Date: 8/1/2019
Page 12
Dynamic Fluid Measurement SFC3 Liquid Pulse Manual Quick Start — 1-7
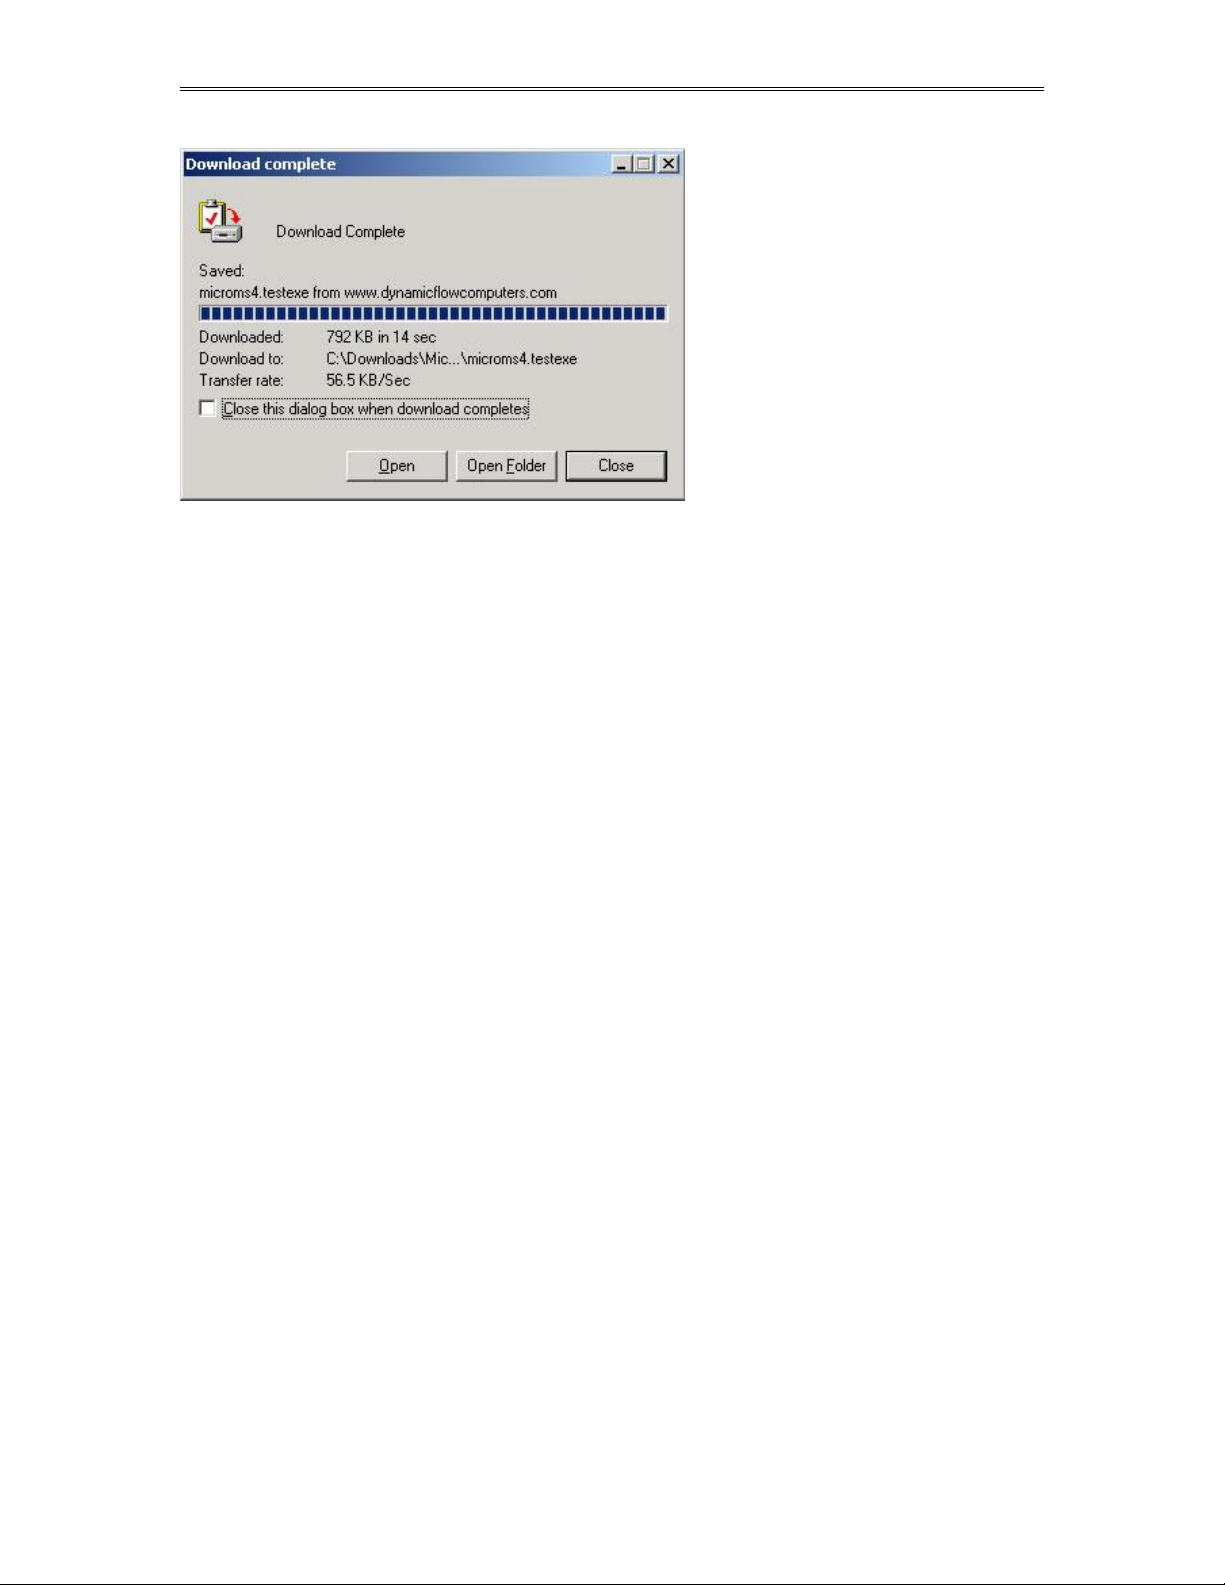
Step 5. The file will start to
transfer to your computer. The
download time depends on your
Internet connection speed and the
type of application that being
downloaded.
Step 6. When the download if
finish. Press the OPEN button to
start the setup process. (See
Illustration)
Step 7. Follow the steps in the
application setup.
Date: 8/1/2019
Page 13
Dynamic Fluid Measurement SFC3 Liquid Pulse Manual Quick Start — 1-8
Getting acquainted with the flow computer
wiring:
To wire the flow computer, get familiar with the drawings provided in the software’s Wiring menu. Use
the arrow left and right keys to move to and select Wiring, then press ENTER.
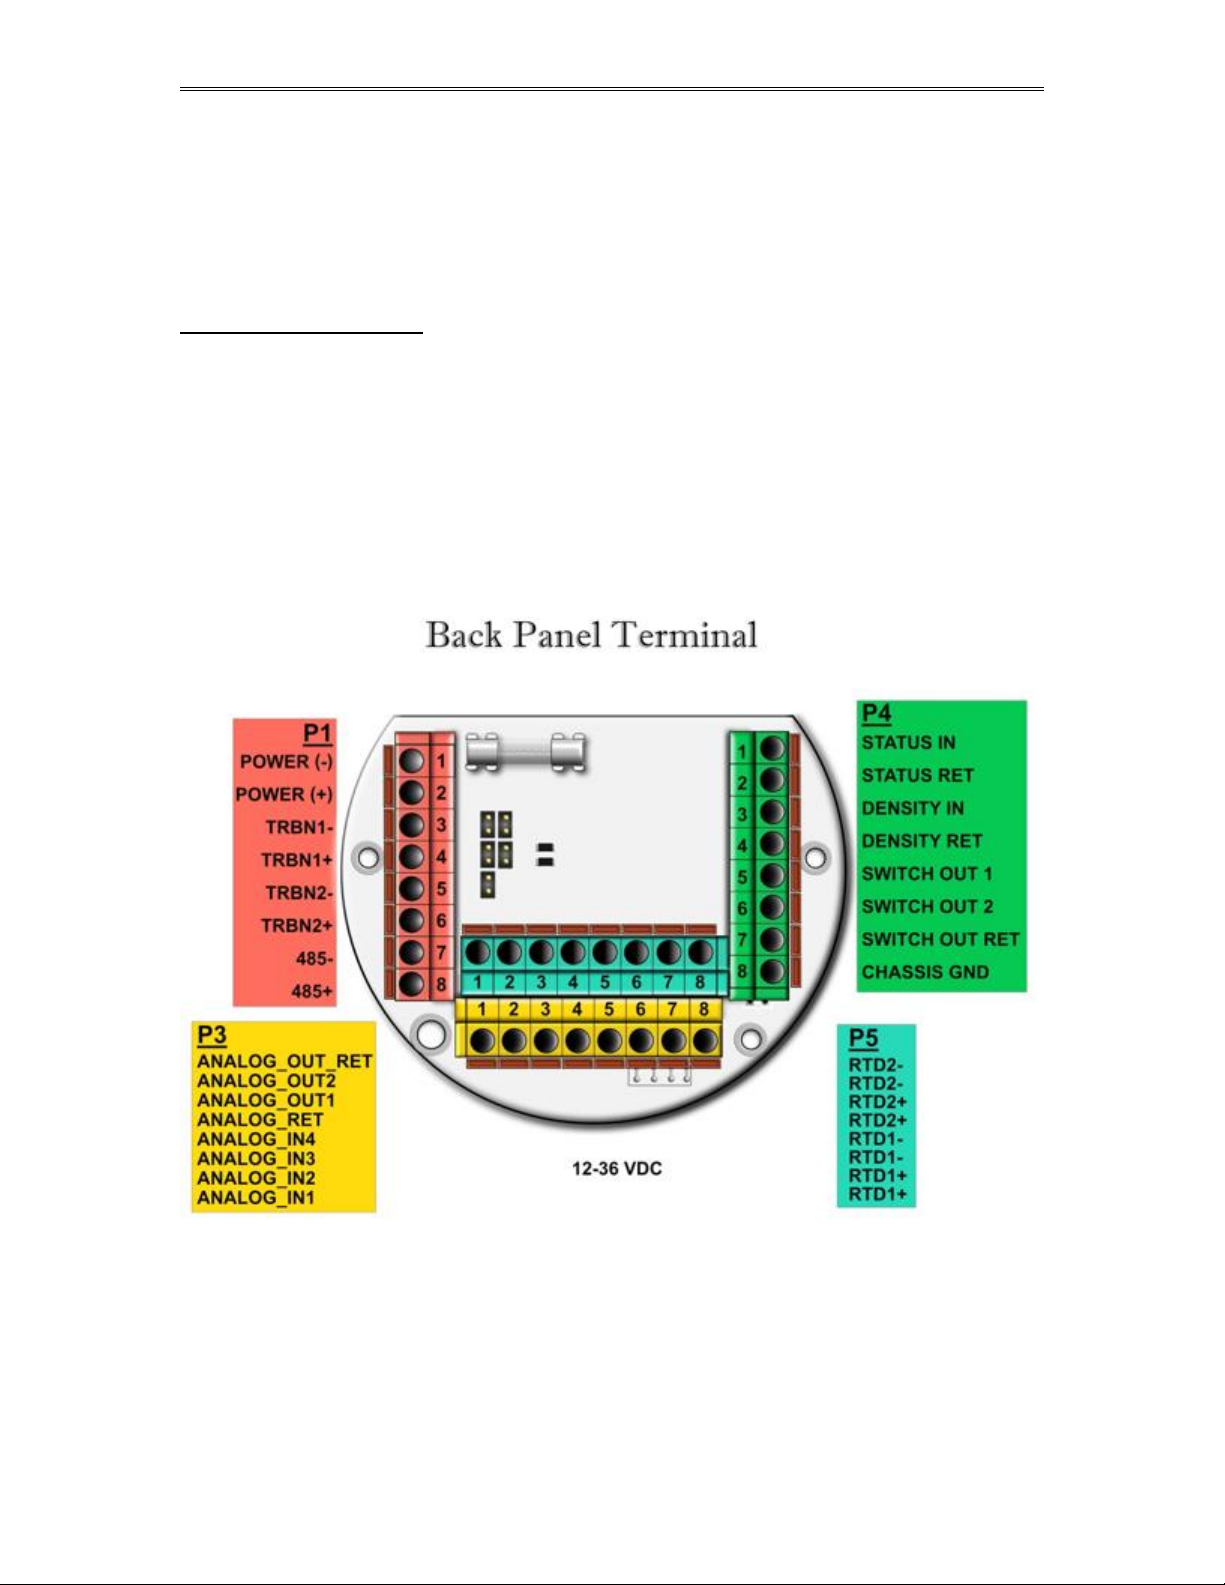
Back terminal wiring:
The back terminal wiring indicates the overall positions of the terminal plugs and their functions. Though
the back panel’s jumpers are also shown, refer to the next drawing, “Back Panel Jumpers”, for information
on their settings and functions.
The Smart Flow Computer receives its power via the two topmost pins on Terminal P1, on the left of the
terminal board. Also on Terminal P1 are, from top to bottom, inputs from the two turbines and the RS-485
serial connection.
To the right (P4), from top to bottom, is status input 1, density frequency input, and switch output 1 and 2.
Terminal P3, at the lower bottom, handles analog inputs and outputs. These are, in order from right to left,
analog inputs 1-4 and analog outputs 1 and 2.
Terminal P5, top middle, is the RTD terminal block, "100 platinum RTD input".
Date: 8/1/2019
Page 14
Dynamic Fluid Measurement SFC3 Liquid Pulse Manual Quick Start — 1-9
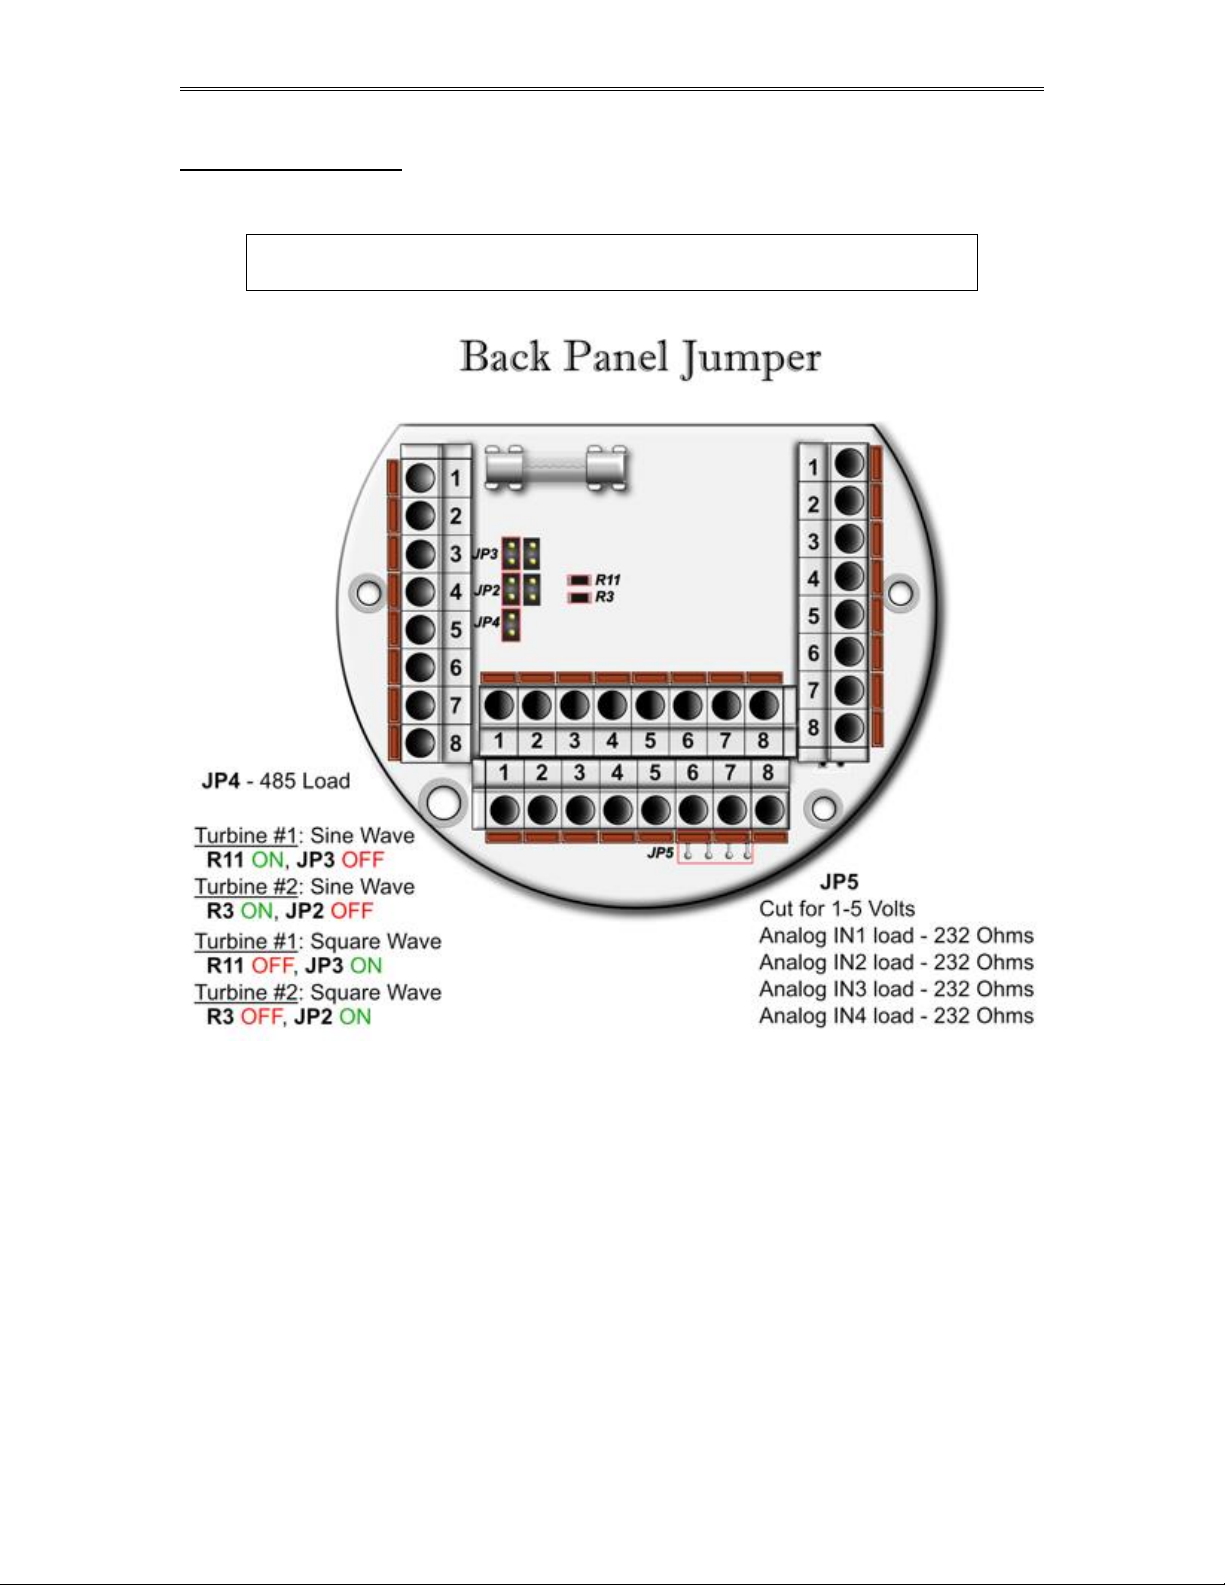
Back Panel Jumper
In this illustration, a jumper is “ON” when the jumper block is used to connect the jumper’s to wire prongs.
“OFF” means the jumper block is completely removed or attached to only one of the two wire prongs.
Note: R11 and R3 could have a vertical orientation instead of a
horizontal orientation on certain Smart Flow Computer models.
Date: 8/1/2019
Page 15

Dynamic Fluid Measurement SFC3 Liquid Pulse Manual Quick Start — 1-10
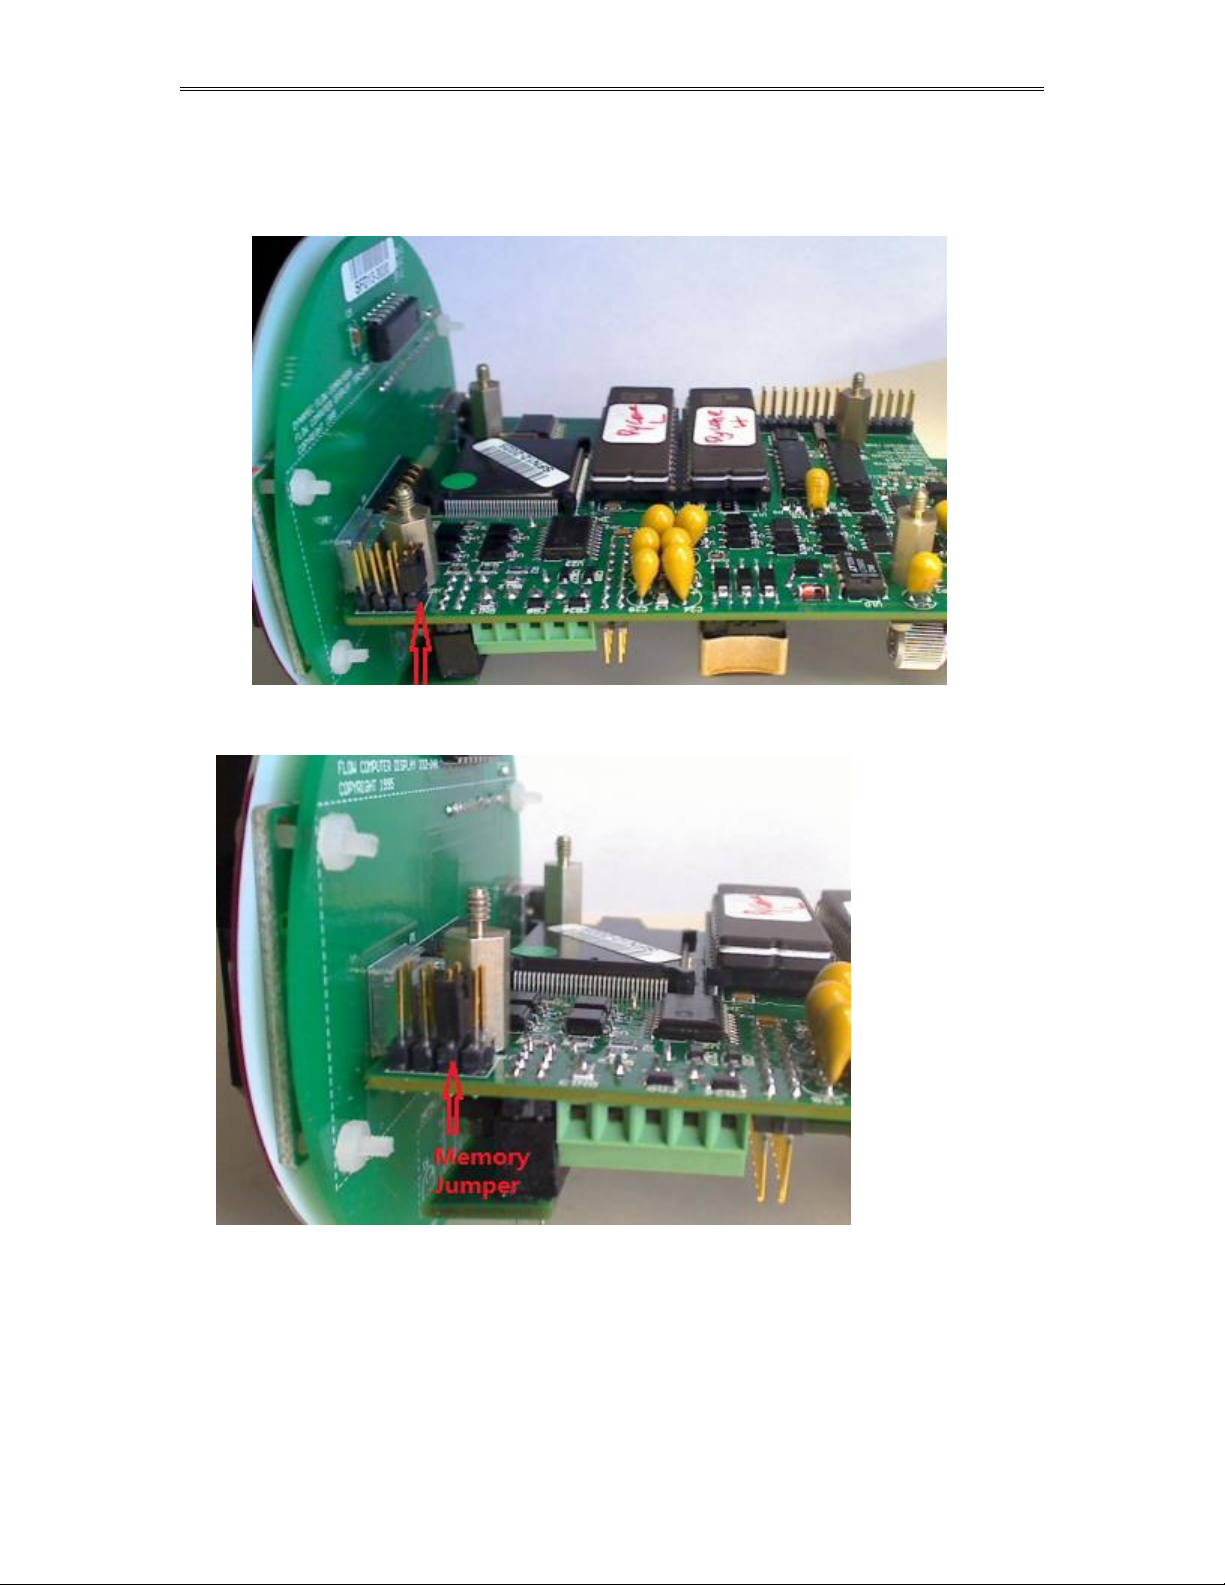
Memory Jumper
Date: 8/1/2019
Page 16
Dynamic Fluid Measurement SFC3 Liquid Pulse Manual Quick Start — 1-11
Steps to clear memory through removing the memory jumper
(1) Turn off the power, move the jumper to the next two pins, wait for 5 seconds
(2) Put the jumper back
Memory cleared and Flow Computer ID is set to 1, 9600 baud rate, RTU mode
Date: 8/1/2019
Page 17
Dynamic Fluid Measurement SFC3 Liquid Pulse Manual Quick Start — 1-12
Date: 8/1/2019
Page 18
Dynamic Fluid Measurement SFC3 Liquid Pulse Manual Quick Start — 1-13
Date: 8/1/2019
Page 19

Dynamic Fluid Measurement SFC3 Liquid Pulse Manual Quick Start — 1-14
INPUT/OUTPUT: Assignment, Ranging, Wiring, and Calibration
Input/Output Assignment
We will now configure your Smart Flow Computer’s inputs and outputs. The flow computer allows the
user to configure the inputs and outputs. i.e. Analog #1 is pressure for Meter #1. Unassigned inputs are not
used by the flow computer.
How to assign a transmitter to an I/O point:
Before beginning the procedure of assigning inputs and outputs, it is advisable to set up the meter (Meter
| Set Up). This is because certain parameters on the Transducer Input Assignment page
change (or may not appear, etc.) based on Meter | Set Up.
1 Use your arrow keys to scroll to menu item I/O (between Meter and Report). Its first
entry is Transducer Input Assignment. Press <ENTER>.
2. Use the down/up arrow key to scroll through this menu. The first four parameters are used to
set the number of decimals you would like to see in your live inputs (these numbers do not
affect the precision of your calculated data). Spare inputs are inputs that the flow computer
will read and display in the diagnostic data but are not used in the calculations. Spare inputs
high and low limit alarms are documented in the historical alarm report.
3. After the parameters used for setting the number of decimals come a series of parameters
ending with the words Assignment (1-n). Assignments 1-4 are analog
inputs attached to terminal P3 of the back panel. These
inputs accept 4-20mA or 1-5 volts input and are suitable for temperature, pressure,
density, BS&W, or spare inputs. Assignments 5 and 6 are strictly RTD (temperature) inputs
only for the meter, prover, densitometer or spare; temperatures are inputted via terminal P5
on the back panel. Assignment 7 indicates a density frequency input; it is assigned
automatically once you choose live density frequency input in the setup menu at density type
selection (and it can only be assigned via Meter | Set Up | Density #n, where n = 1 to
4). Assignment 10 (module 1) and assignment 11 (module 2) are used for Rosemount multivariable module only. DP, pressure, and temperature for the meter can be assigned.
Ranging the Transmitter Inputs:
1. Enter the range values: after assigning the inputs scroll down the transducer inputs
assignment menu to scale the 4-20mA. Enter the value at …@4mA and …@20mA. Enter both
values similar to the way the transmitter is ranged. 1-5 volts is equivalent to 4-20mA. Enter
the 1 volt value at the 4mA, and 5 volt value at 20mA.
2. Enter the high and low limits: high limits and low limits are simply the alarm points in
which you would like the flow computer to flag as an alarm condition. Enter these values
with respect to the upper and lower range conditions. Try to avoid creating alarm log when
conditions are normal. For example: If the line condition for the pressure is between 0 to 500
PSIG. then you should program less than zero for low pressure alarm, and 500 or more for
high pressure alarm. High and low limits are also used in the scale for the Modbus variables.
3. Set up the fail code: Maintenance and Failure Code values tell the flow computer
to use a default value in the event the transmitter fails. The default value is stored in
Maintenance. There are three outcomes: the transmitter value is always used, no matter
what (Failure Code = 0); the Maintenance value is always used, no matter what
(Failure Code = 1); and the Maintenance value is used only when the transmitter’s
value indicates that the transmitter has temporarily failed (Failure Code = 2).
Date: 8/1/2019
Page 20

Dynamic Fluid Measurement SFC3 Liquid Pulse Manual Quick Start — 1-15
RTD inputs will skip 4-20mA assignments because RTD is a raw signal of 50 (ohms) to 156. Readings
beyond that range require a 4-20mA signal to the flow computer.
Density coefficients for raw frequency inputs are programmed in this menu. The menu will only show
parameters relevant to the live density selected (i.e., Solartron or UGC, etc.).
NOTE: Solartron density input requires values in US units, i.e. PSI, and
F. Request a calibration sheet in US units from the densitometer
manufacturer.
Date: 8/1/2019
Page 21

Dynamic Fluid Measurement SFC3 Liquid Pulse Manual Quick Start — 1-16
WIRING:
Wiring to the flow computer is very straightforward and simple. But still it is very important to get familiar
with the wiring diagram.
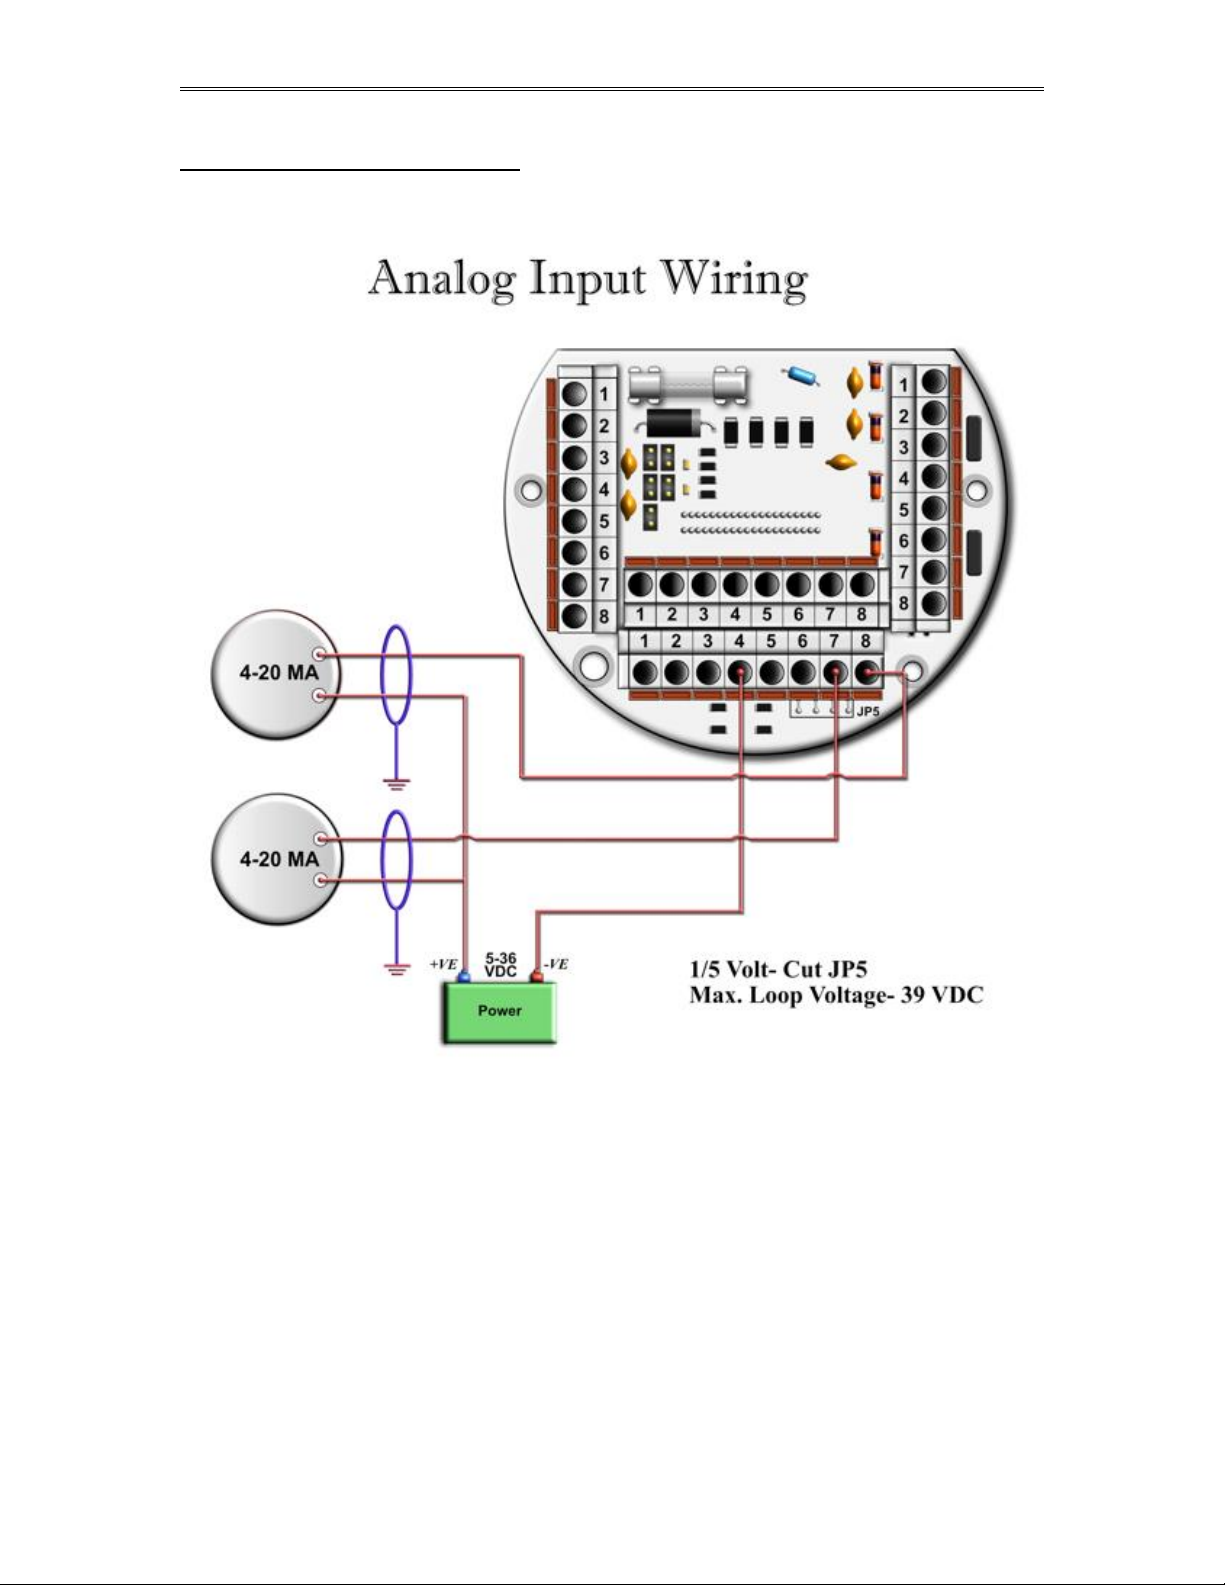
Wiring the analog inputs:
Use your arrow keys to move the cursor to the menu item Wiring and then use up/down arrow keys to
select Analog Wiring. Press <ENTER>. Typical wiring for analog inputs 1 and 2 are shown in the
drawing. Analog inputs 3 and 4 are to the left of analog 1 and 2. Note that the analog input has only one
common return, which is the -ve signal of power supply powering the transmitters.
When wiring 1-5 volts, make sure to calibrate the flow computer for the 1-5 volt signal because the flow
computer calibration defaults for the 4-20mA, which is different from the 1-5 volts. JP5 must be cut for 15 volt inputs. The jumpers for analog 1-4 are in order from right to left. It is possible to cut the first two
jumpers for analog 1 & 2 in for 1-5 volts signal and have analog in 3 & 4 as 4-20mA signal. Signal line
impedance provided by our flow computer is less than 250. Therefore, when using a smart transmitter
that requires a minimum of 250 resistance in the loop, an additional resistor at the flow computer end
needs to be installed in series with the 4-20mA loop in order to allow the hand held communicator to talk to
the transmitter.
NOTE: The 4-20mA or 1-5 volt DOES NOT source power to the transmitters. You can use
the DC power feeding the flow computer to power the 4-20mA loop IF that power
supply is FILTERED.
Date: 8/1/2019
Page 22
Dynamic Fluid Measurement SFC3 Liquid Pulse Manual Quick Start — 1-17
Wiring the Analog Inputs 1-4 :
Date: 8/1/2019
Page 23
Dynamic Fluid Measurement SFC3 Liquid Pulse Manual Quick Start — 1-18
RTD Wiring
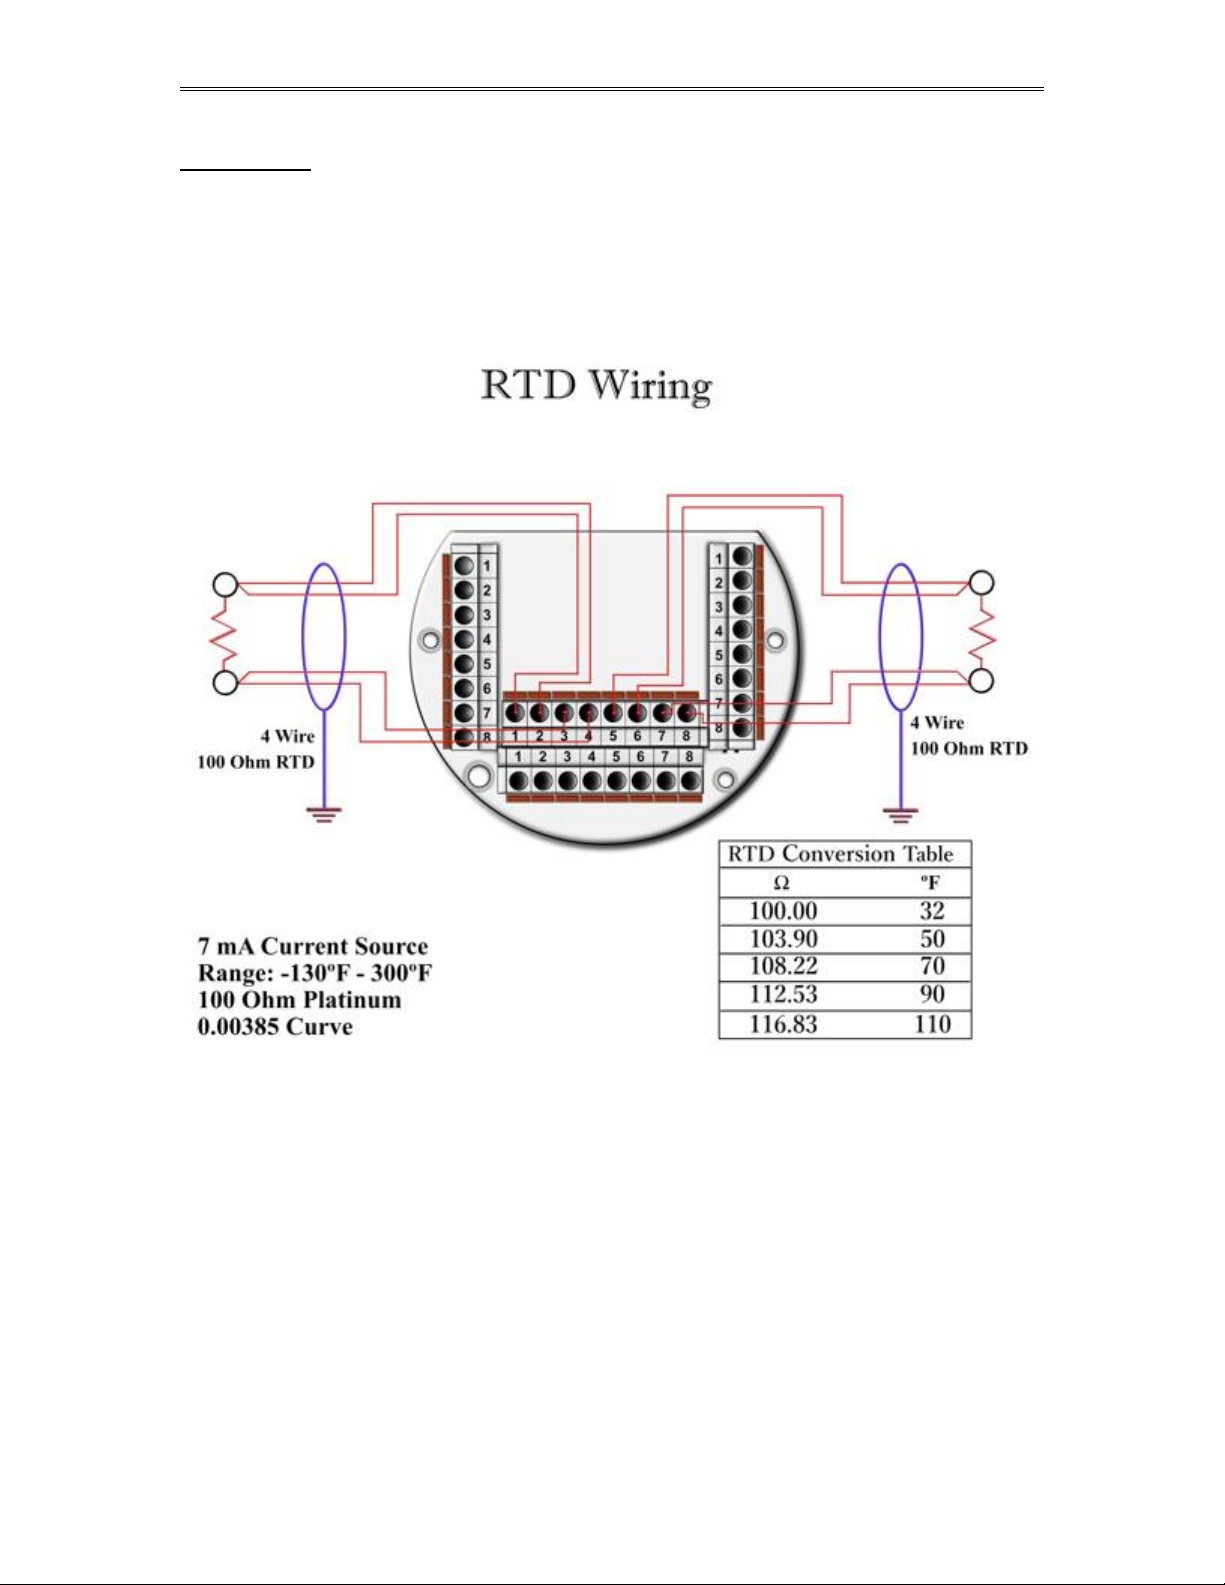
When ‘Flow Computer’ is configured as 4 analog inputs and 2 RTD inputs, go to the wiring menu where it
says RTD and press <ENTER>. The flow computer shows wiring to RTD 1 and RTD 2. 100 platinum
can be used; a temperature range of -43F to +300F can be measured. RTD 1 is to the right where P5
designation is. In the figure below notice that each side of the RTD requires two wire connections. When
using less than 4 wires a jumper must be used to make up for the missing lead. Internal excitation current
source generated is approximately 7mA. .
Date: 8/1/2019
Page 24
Dynamic Fluid Measurement SFC3 Liquid Pulse Manual Quick Start — 1-19
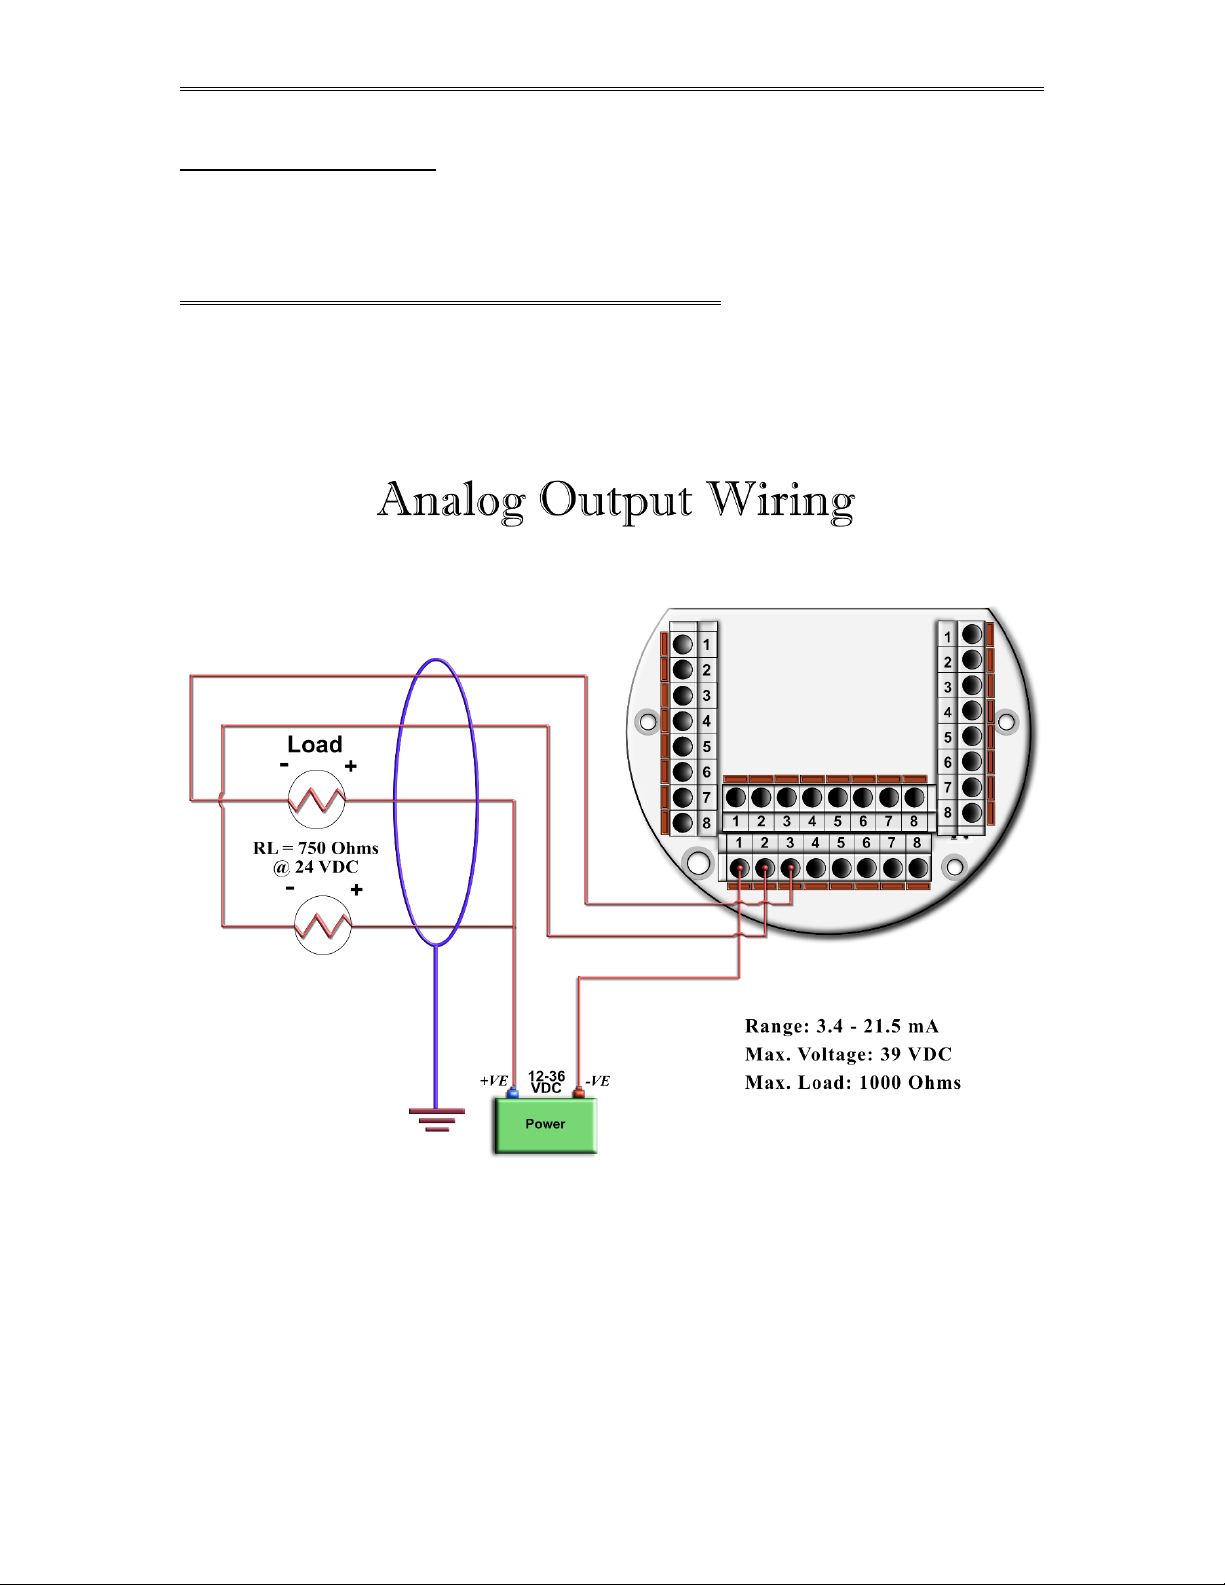
Wiring Analog Output:
The analog outputs are located on the left side of P3 connector. Go to the wiring diagram and scroll down
to Analog Output and press <ENTER>. Wiring diagram shows typical Analog output wiring. Notice
that analog output will regulate 4-20mA current loop but DOES NOT source the power for it. External
power is required.
ASS IGNING/RANGING THE 4-20MA AN ALOG OUT PUTS :
Go to the I/O assignment main menu and scroll to Analog Output Assignment. Press
<ENTER>. A selection menu is prompted. Select the analog output number and then enter what the 4mA
output will indicate and the 20mA. Make sure that the 20mA assignment value exceeds the upper range
limit of what you assigned the Analog output for, otherwise the analog output will not update beyond
20mA.
Date: 8/1/2019
Page 25

Dynamic Fluid Measurement SFC3 Liquid Pulse Manual Quick Start — 1-20
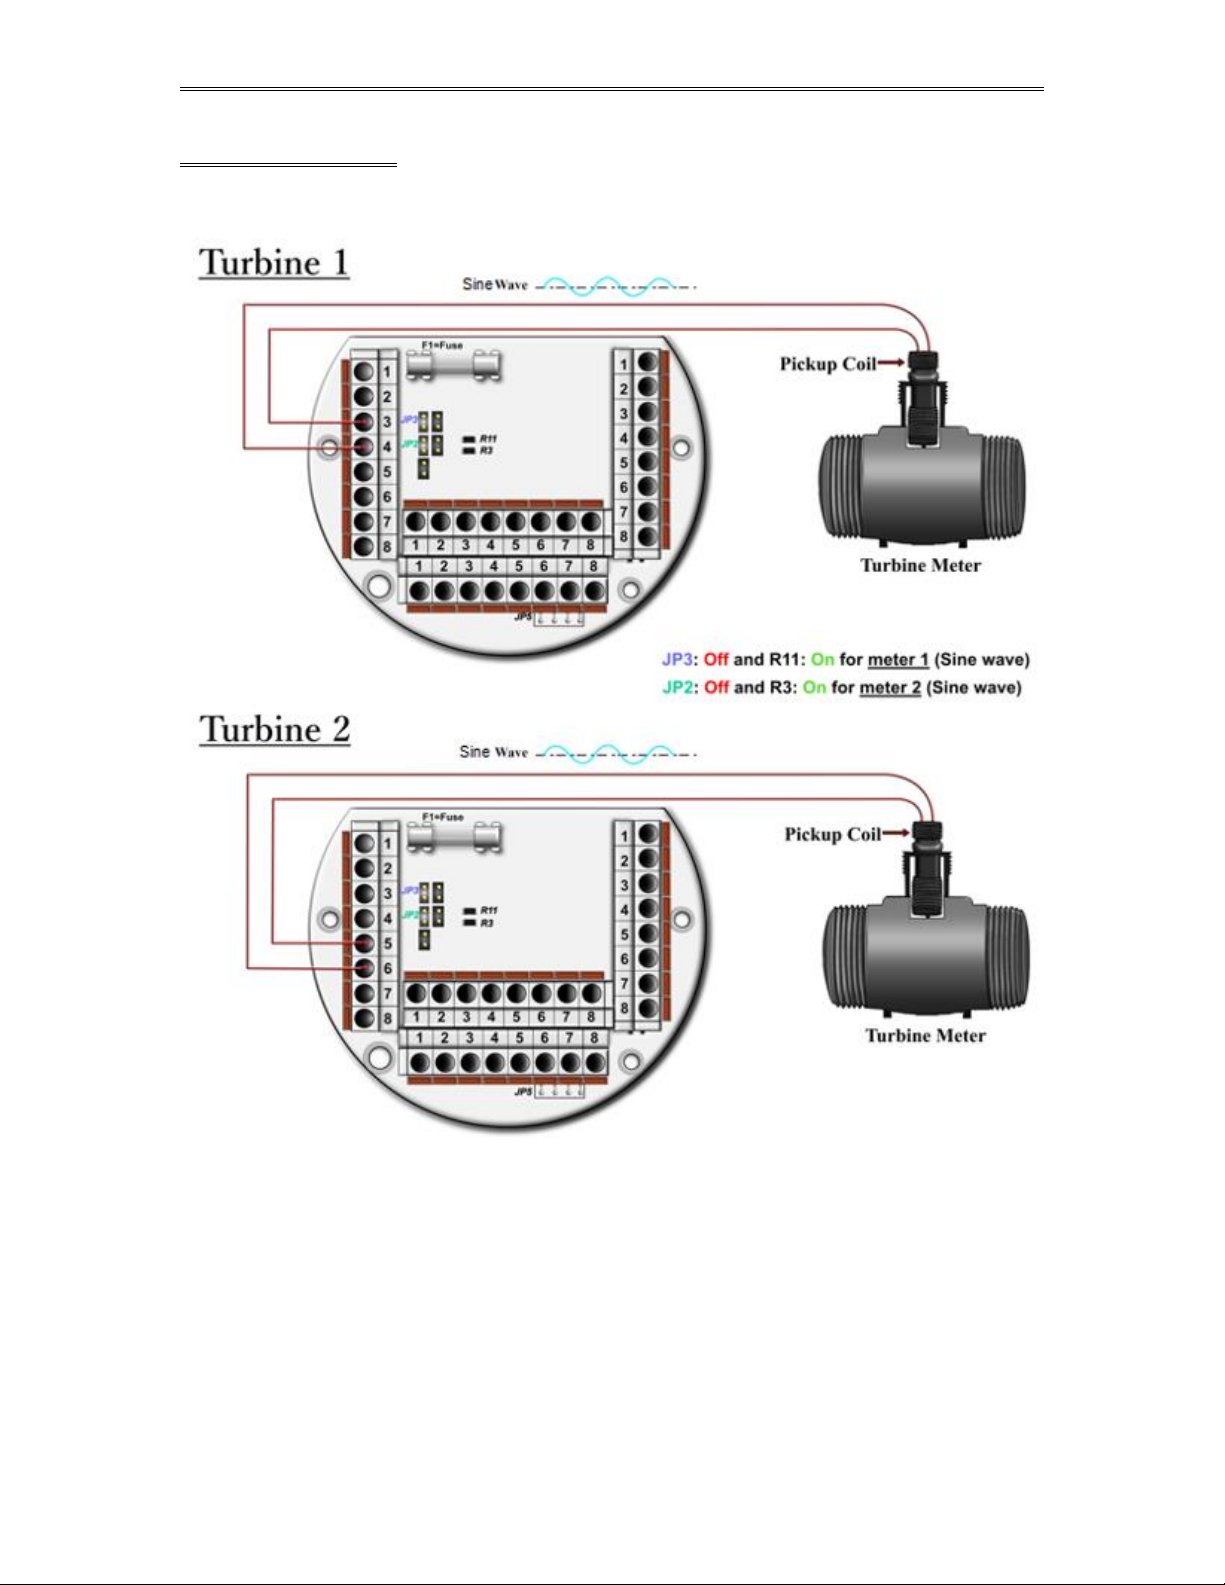
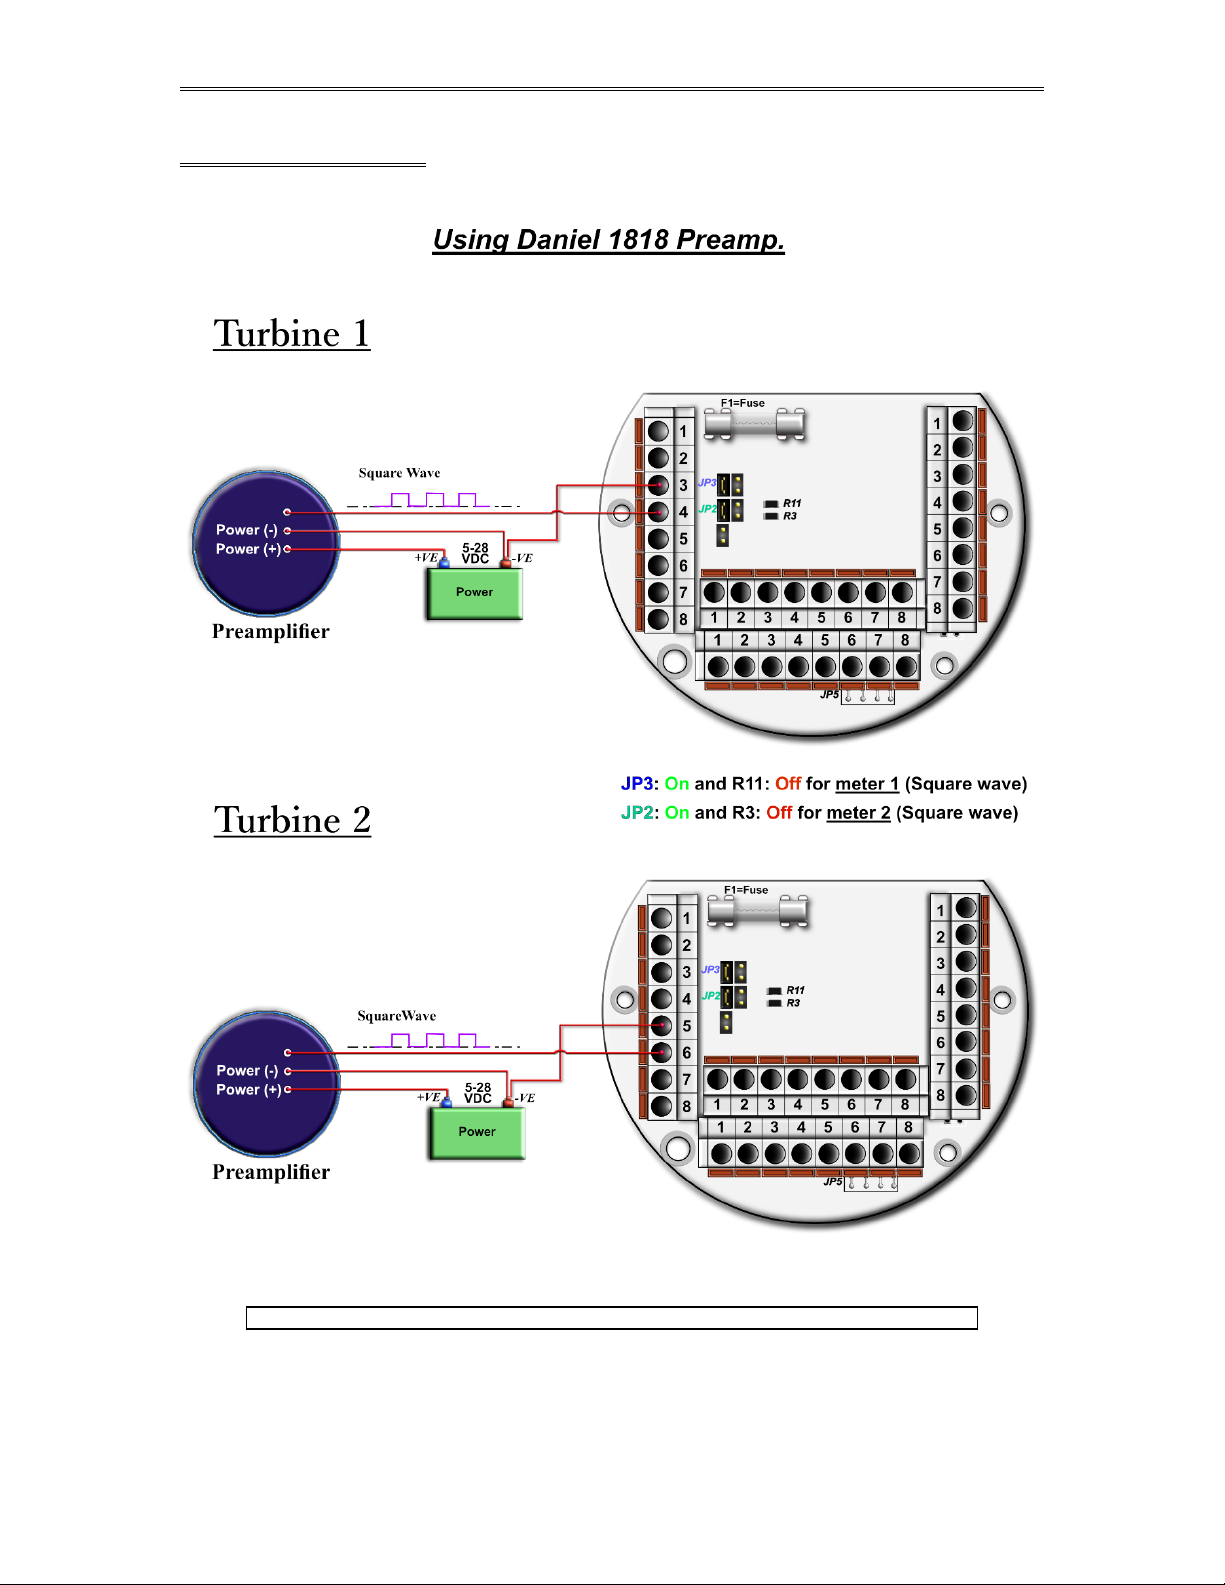
Turbine input wiring
Scroll to Turbine under Wiring and press <ENTER>. Two drawings above each other will show
typical wiring for turbine meter 1 and turbine meter 2. When dual pick ups from the same turbine are
connected, use the inputs for turbine 1 for pickup 1 and turbine 2 for the second pickup coil. When
connecting sine wave directly from the pickup coil make sure the distance from the pickup coil to the flow
computer is very short--less than 50 feet with shielded cable. In the event there is presence of noise, the
distance must be shortened. When connecting sine wave signal, the R11 jumper for meter 1 must be
installed and R3 jumper for meter 2 must be installed. (JP3 and JP2 must be off when using sine wave).
On the other hand, when using square wave, the square wave signal can be sinusoidal but has to be above 5
volts peak to peak with less than 0.4 volts offset in order for the flow computer to read it. R11 and R3 must
be off and JP3 on for meter 1; JP2 must be on for meter 2.
Note: When connecting square wave input, the JP3 and JP2 connect the turbine return to the
flow computer power return. Therefore, signal polarity is very important. Reverse polarity
could result in some damage or power loss. When sine wave is used the signal polarity is
usually of no significance.
The turbine input is immediately under the power input on terminal P1. The third pin down from the top is
Turbine/PD "minus", and below it is Turbine plus. The second pulse input for Turbine/PD meter 2 or the
second pickup coil is below turbine one input on P1. The fifth pin down from the top is turbine 2 "minus"
signal and below it is Turbine/PD 2 plus signal.
Date: 8/1/2019
Page 26
Dynamic Fluid Measurement SFC3 Liquid Pulse Manual Quick Start — 1-21
TUR BINE- SINE WAVE
Date: 8/1/2019
Page 27
Dynamic Fluid Measurement SFC3 Liquid Pulse Manual Quick Start — 1-22
TUR BINE-SQUARE WAVE
Note: R11 and R3 are oriented vertically in some flow computers.
Date: 8/1/2019
Page 28

Dynamic Fluid Measurement SFC3 Liquid Pulse Manual Quick Start — 1-23
Turbine input wiring for passive (dry contact) pulse generators
Some mass flow meters have pulse outputs that do not provide power but instead require
external power, they are referred to as passive outputs, dry outputs, open collector, etc. (For
example the Krohne UFM 3030 Mass meter).
In these cases the wiring should be as shown on the below diagram. The pull up resistor can be
adjusted to limit the current sink by the Mass meter. For Turbine Input 1 JP3 must be ON and
R11 OFF and if using Turbine Input 2 then JP2 must be ON and R3 OFF.
Date: 8/1/2019
Page 29
Dynamic Fluid Measurement SFC3 Liquid Pulse Manual Quick Start — 1-24
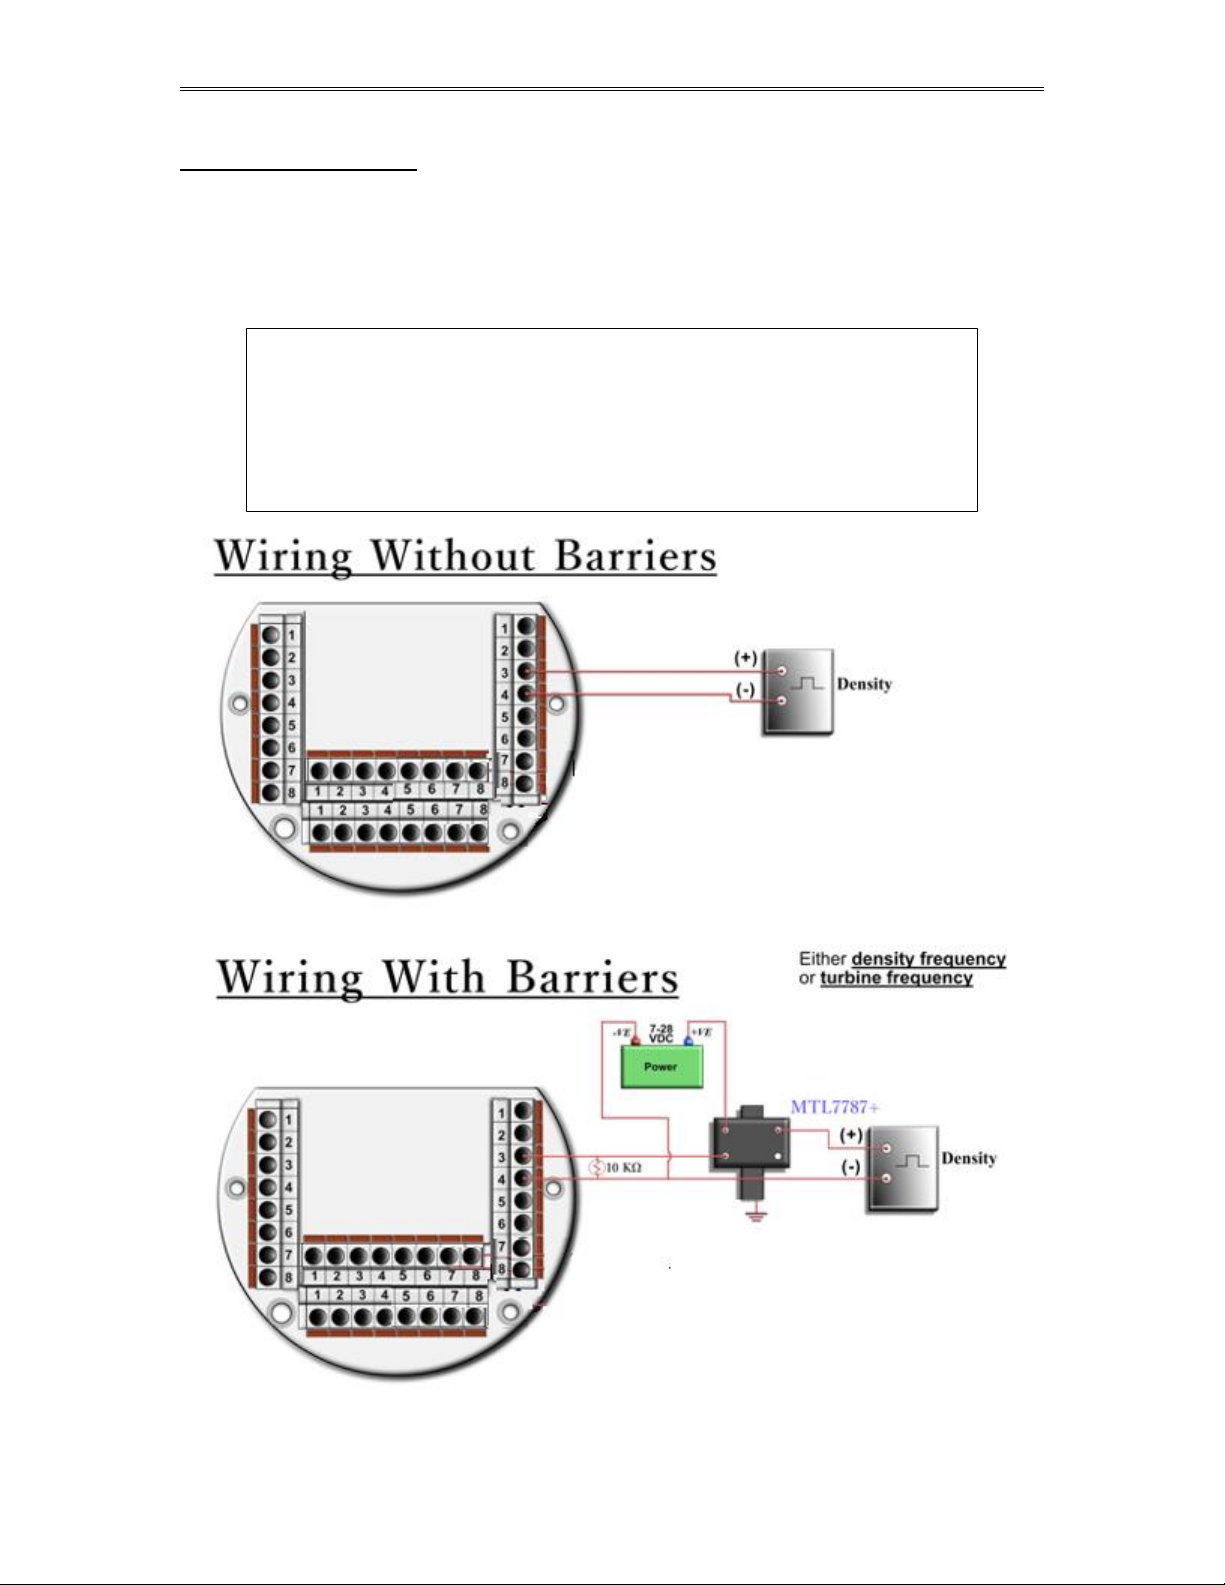
Density input wiring:
When using a live densitometer input with frequency signal, the signal can be brought into the Smart Flow
Computer in its raw form. The Smart Flow Computer accepts a sine wave or square with or without DC
offset. Example for density wiring can be seen in the wiring diagram. Use the arrow keys to get to
Wiring | Density and press ENTER. Find two drawings, one with barrier and the other without.
Barriers are used for area classification. Notice that the RTD wiring is also drawn to show how to hook the
density RTD signal.
Note: When wiring the density input polarity is of significance and
reverse polarity could result in some damage or power loss. The
density signal is on connector P4, the third and fourth pin down
from the top. The third pin down is density plus, the fourth down is
density minus. When Density input is 4-20mA it should be
connected as a regular 4-20mA signal to the analog input and not
the density frequency input.
Date: 8/1/2019
Page 30
Dynamic Fluid Measurement SFC3 Liquid Pulse Manual Quick Start — 1-25
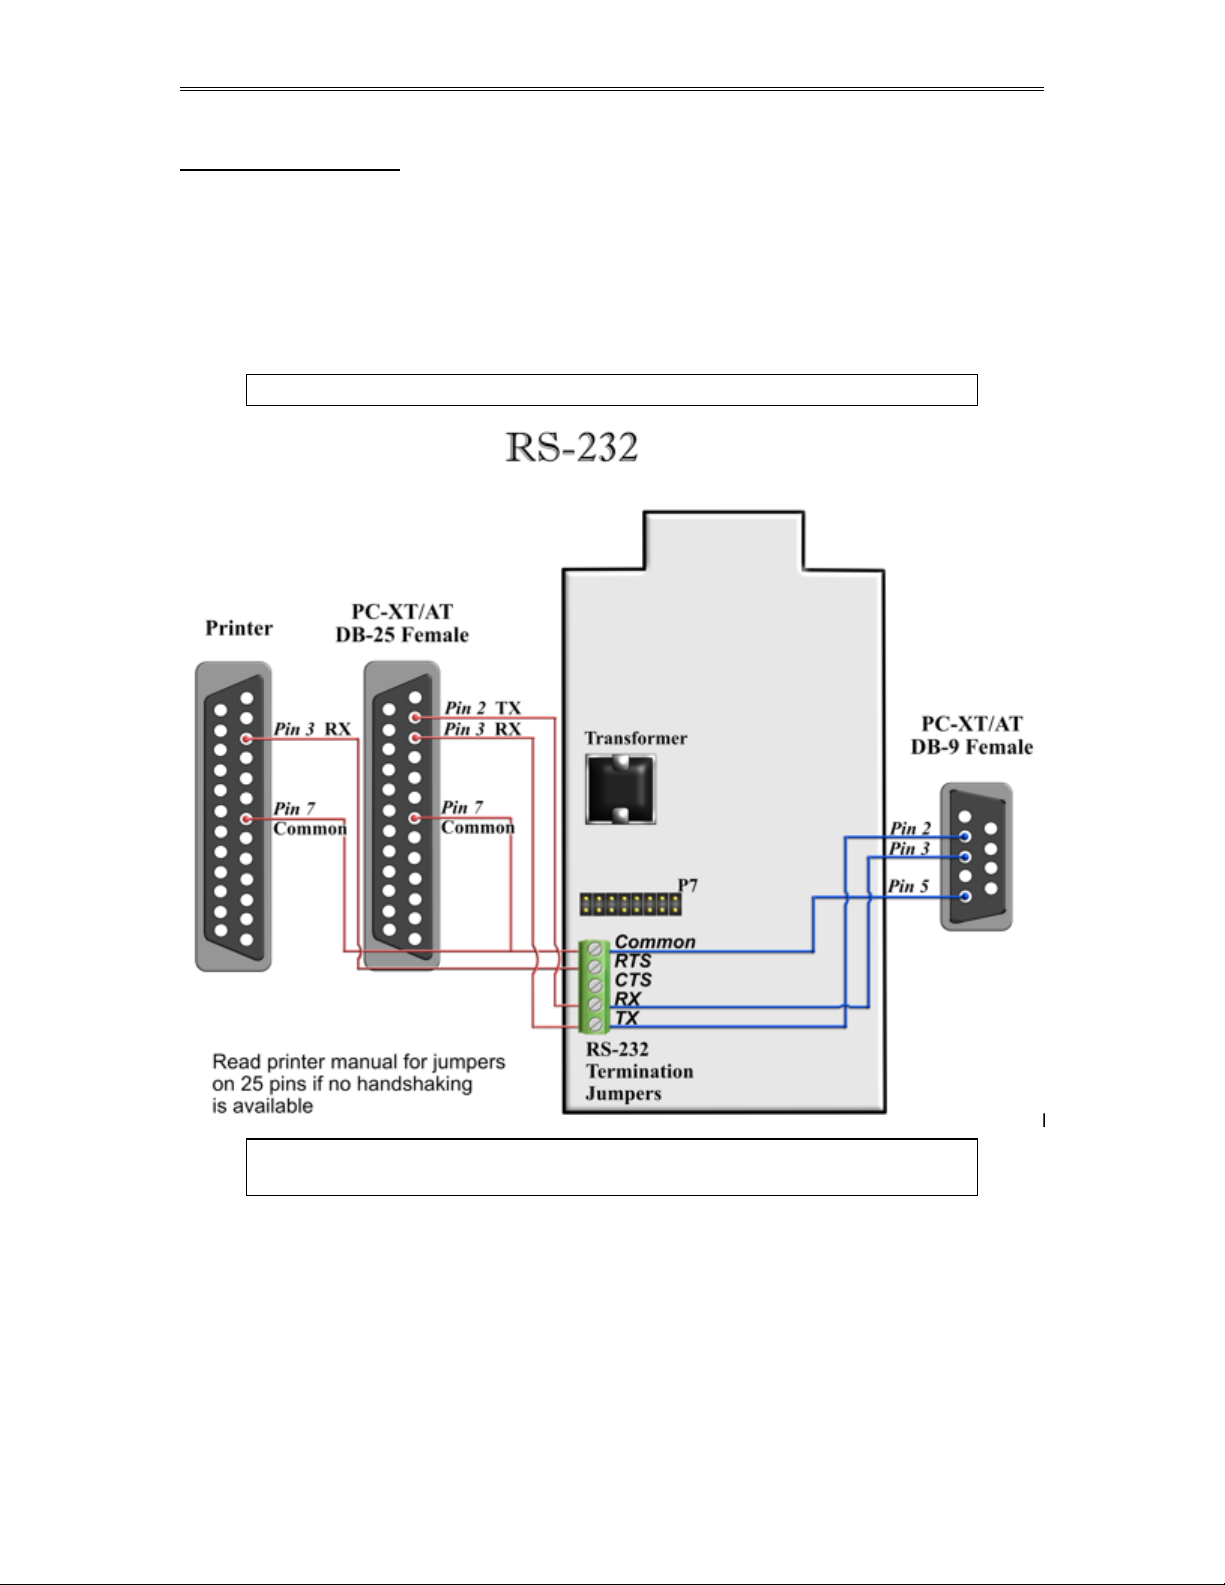
RS-232 Connection
The RS-232 is not located on the terminal board. The RS-232 is a green 5 pin terminal block with screw
type connector located on the display side of the enclosure. Scroll to Wiring | New RS-232 and press
ENTER. Termination jumpers for the RS-232 are located at the top corner of the board on the same side of
the RS-232 connector. The two jumpers at the top are for terminating the transmit line and below it is the
receive line.
The RS-232 port can be used for printing reports, Modbus communication, or interfacing to the
configuration program. If the port is configured as printer port in the flow computer communication setup,
then reports get printed (i.e. interval and daily reports).
Note: Twisted shielded cable is required.
WARNING: When the RS-232 terminal is used with a modem, external
protection on the phone line is required.
Date: 8/1/2019
Page 31

Dynamic Fluid Measurement SFC3 Liquid Pulse Manual Quick Start — 1-26
RS-485 Connection
RS-485 wiring is shown in the wiring diagram under RS-485. The RS-485 termination jumper is JP4
located on the back terminal. The maximum distance when 18 gauge wire is used would be 4000 feet.
Note: Twisted shielded cable is required.
WARNING: When the RS-485 terminal is used, external transient
protection and optical isolation is required, especially for long
distance wiring.
Date: 8/1/2019
Page 32

Dynamic Fluid Measurement SFC3 Liquid Pulse Manual Quick Start — 1-27
Wiring of Status Inputs:
There is one status input standard and an optional three more on the back of the CPU board. The standard
status input is shown in the wiring diagram under Status Input. It has 4 volts of noise hysteresis,
with a trigger point of 5 volts and an off point of 1 Volt. Status inputs 2, 3, and 4 require the I/O expansion
connector and its wires be installed; refer to wiring drawing IO-Exp. Connection numbers 6, 7, and 8 are
the status in (positive) for inputs 2, 3, and 4, respectively, and 11 is the return for all three inputs.
Date: 8/1/2019
Page 33

Dynamic Fluid Measurement SFC3 Liquid Pulse Manual Quick Start — 1-28
Wiring of Switch/Pulse Outputs:
Scroll to Switch output under Wiring and press <ENTER>. The wiring diagram shows switch 1
and 2 and the return. Please note that switches 3, 4, and 5 cannot be used for pulse output; switches 1 and 2
can be used for pulse or switch output. See also I/O Expansion. Notice that the switch outputs are
transistor type outputs (open collector type with maximum DC rating of 350 mA continuous at 24 VDC)
and require external power.
Date: 8/1/2019
Page 34

Dynamic Fluid Measurement SFC3 Liquid Pulse Manual Quick Start — 1-29
Connection
Purpose
Comments
1
detector switch 1
Requires prover option CPU to operate.
Rating: 5-36 Vdc
2
detector switch 2
3
switch output 3
Maximum rating: 75mA @24 volts
Range: 5-36 Vdc
4
switch output 4
5
switch output 5
6
status input 2
Rating: 6-36 Vdc
7
status input 3
8
status input 4
9
Return: detector switches
10
Return: switches 3, 4, 5
11
Return: status 2, 3, and 4
I/O Expansion:
The I/O expansion is 16-pin connector next to the RS-232 terminal. Eleven pins of the 16-pin connector
are utilized. When the flow computer is ordered with the I/O expansion feature, the wires and the plug are
provided with the flow computer. There will be 11 wires with the wire number tag at the outer end of the
wire. The tag will indicate the wire number. The following is the sequence for the wires. On the top right
edge of the connector towards the top outer side of the CPU board is pin 1, across from it is pin 9.
Date: 8/1/2019
Page 35

Dynamic Fluid Measurement SFC3 Liquid Pulse Manual Quick Start — 1-30
Date: 8/1/2019
Page 36

Dynamic Fluid Measurement SFC3 Liquid Pulse Manual Quick Start — 1-31
Connection No.
Purpose
Comments
1
detector switch 1
Requires prover option CPU to operate.
Rating: 5-36 Vdc
2
detector switch 2
3
switch output 3
Maximum rating: 75mA @24 volts
Range: 5-36 Vdc
4
switch output 4
5
switch output 5
6
status input 2
Rating: 6-36 Vdc
7
status input 3
8
status input 4
9
Return: detector switches
10
Return: switches 3, 4, 5
11
Return: status 2, 3, and 4
12
RS232 TX
13
RS232 RX
14
RS232 RTS
15
RS232 ret
Prover/Expansion
Date: 8/1/2019
Page 37

Dynamic Fluid Measurement SFC3 Liquid Pulse Manual Quick Start — 1-32
Wiring of Brooks Prover
Date: 8/1/2019
Page 38

Dynamic Fluid Measurement SFC3 Liquid Pulse Manual Quick Start — 1-33
Wiring of Calibron Prover
Date: 8/1/2019
Page 39

Dynamic Fluid Measurement SFC3 Liquid Pulse Manual Quick Start — 1-34
CALIBRATION
Analog Input 4-20mA or 1-5 volt signal:
Calibrations are performed under I/O | Calibration. Use the arrow keys to scroll to
Calibration and press <ENTER>. After you press <ENTER> the screen should show
COMMUNICATION STATUS : OK.
OFF SET CALIBRATION:
For simple offset type calibration simply induce the signal into the analog input and make sure the flow
computer is reading it. After you verify that the flow computer recognized the analog input press <F8>.
The screen will freeze. Scroll down to the analog input you are calibrating and enter the correct mA
reading. Then press <ENTER> followed by pressing F3 function key to download. The screen will stay in
the freeze mode. To bring the live readings press <F2> key , and then the flow computer will display the
new calibrated readings. The offset type calibration is mainly used when a small offset adjustment needs to
be changed in the full-scale reading. The offset will apply to the zero and span.
FULL CALIBRATION METHOD:
To perform full calibration be prepared to induce zero and span type signal.
1. Induce the low end signal i.e. 4mA in the analog input.
2. Press <F8> and scroll down to the reading then press <ALT><R> (alternate key and the letter
R simultaneously). Then immediately enter the analog input value i.e. 4mA. Follow that by
< ENTER> and then press <F3> function key to download data.
3. Now be ready to enter the full-scale value. Simply induce the analog signal and then enter
the value i.e. 20mA, and then download by pressing <ENTER>, then press <F3> function key.
4. Induce live values to verify the calibration.
DEF AULT CALIBRATION
Simply press <F8> and scroll to the analog Input and press <ALT><R> followed by <F3 function key.
Date: 8/1/2019
Page 40

Dynamic Fluid Measurement SFC3 Liquid Pulse Manual Quick Start — 1-35
RTD calibration:
RTD Calibration is a 2-step process. The first step is a one time procedure to verify transducer
linearity and is done at the time the meter is being setup. The second step is the routine calibration
sequence.
Step 1 – Linearity Verification
1. Use a Decade box with 0-150 °F settings.
2. Connect RTD cable to this resistive element for verification of linearity. Verify low and high points.
It must be within ½ degree.
3. Connect the actual RTD element and compare with a certified thermometer.
4. If not within ½ degree do a Full Calibration (See Full Calibration below). If problem persists verify
other elements such as RTD Probe, connections, shield, conductivity of connectors, etc.
The purpose of the above procedure is to verify zero and span and make sure that the two points
fall within the expected tolerance.
Step 2 – Routine Calibration
Once Linearity has been verified through Step 1, the routine calibration procedure is reduced to
simply connecting the actual RTD and doing an offset point calibration (see offset calibration
below).
Calibration after that will be simple verification for the stability of the transmitter. If it drifts abnormally
then you need to verify the other parts involved.
RESET TO DEFAULT CALIBRATION
To go back to the default calibration simply press <F8> and scroll to the RTD input, and press
<ALT> <R> key followed by <F3> function key.
OFFSET CALIBRATION:
For offset calibration simply go to I/O | Calibration and press < ENTER>. Once the flow
computer shows communication status OK press <F8> function key and scroll to RTD. Induce a
live value and wait for 10 seconds for the reading to stabilize. Then enter the live value followed
by <F3> function key to download the direct reading. The value entered must be in ohms only.
FULL SCALE CALIBRATION:
1. Prepare low range resistive input (i.e., 80) and High range resistive input (i.e., 120). Go to
the calibration menu and press <F8> function key. Scroll to the RTD input you are calibrating
and press <ALT> <R> (key <ALT> and the letter R at the same time). Induce the low end
(80) resistive signal and then wait 10 seconds and enter 80 followed by pressing the <F3>
function key.
2. Induce higher range signal (120) and wait 10 seconds, then enter the number 120 ohm and
press the <F3> key.
3. Now verify the live reading against the flow computer reading.
Date: 8/1/2019
Page 41

Dynamic Fluid Measurement SFC3 Liquid Pulse Manual Quick Start — 1-36
Calibration of analog output:
To calibrate the analog output against the end device follow the following steps:
1. Go to the calibration menu and press <F8>. Scroll down to analog output and press <ENTER>
and then <ALT><R>. This will cause the flow computer to output the minimum possible
signal 3.25 mA. Enter the live output value reading in the end device i.e. 3.25 mA and press
<F3> function key. Now the flow computer will output full scale 21.75 mA. Enter the live
output i.e. 21.75 then press the <F3> key.
2. Now verify the output against the calibration device.
Multi-Variable Transmitters (Model 205)- DP and Pressure
OFF SET CALIBRATION
1. Induce live value for temperature, pressure, or DP.
2. Go to Calibration - Multi-Variable menu.
3. Press <F8>, point to the value being calibrated, enter the correct value followed by
<ENTER>, and then press <F3> to download data.
4. Now read induce live values to verify the calibration.
FULL SCALE CALIBRATION
1. Press <F8>. Scroll to the parameter to be calibrated, and then press <ALT><R>
2. Induce the low range signal, then press <ENTER> followed by <F3>.
3. Induce the high range signal, then press <ENTER> followed by <F3>.
4. Now verify the live reading against the flow computer reading.
TO USE DEFAULT CALIBRATION
1. Select Multivariable DP or pressure
2. Select Reset calibration method
3. Now verify the live reading against the flow computer reading
Date: 8/1/2019
Page 42

Dynamic Fluid Measurement SFC3 Liquid Pulse Manual Quick Start — 1-37
Multi-Variable Transmitters (Model 205)- RTD
Calibrations are performed under I/O | Calibration. Use the arrow keys to scroll to
Calibration-Multi-Variable and press < ENTER>. After you press < ENTER> the screen
should show COMMUNICATION STATUS : OK.
RTD Calibration is a 2-step process. The first step is a one time procedure to verify transducer
linearity and is done at the time the meter is being setup. The second step is the routine calibration
sequence.
Step 1 – Linearity Verification
1. Use a Decade box with 0-150 °F settings.
2. Connect RTD cable to this resistive element for verification of linearity. Verify low and high points.
It must be within ½ degree.
3. Connect the actual RTD element and compare with a certified thermometer.
4. If not within ½ degree do a Full Calibration (See Full Calibration below). If problem persists verify
other elements such as RTD Probe, connections, shield, conductivity of connectors, etc.
The purpose of the above procedure is to verify zero and span and make sure that the two points
fall within the expected tolerance.
Step 2 – Routine Calibration
Once Linearity has been verified through Step 1, the routine calibration procedure is reduced to
simply connecting the actual RTD and doing an offset point calibration (see offset calibration
below).
Calibration after that will be simple verification for the stability of the transmitter. If it drifts abnormally
then you need to verify the other parts involved.
RESET TO DEFAULT CALIBRATION
To go back to the default calibration simply press <F8> and scroll to the RTD input, and press
<ALT> <R> key followed by <F3> function key.
OFFSET CALIBRATION:
For offset calibration simply go to I/O | Calibration and press < ENTER>. Once the flow
computer shows communication status OK press <F8> function key and scroll to RTD. Induce a
live value and wait for 10 seconds for the reading to stabilize. Then enter the live value followed
by <F3> function key to download the direct reading. The value entered must be in degrees only.
FULL SCALE CALIBRATION:
1. Prepare low range resistive input (i.e., 80) and High range resistive input (i.e., 120). Go to
the calibration menu and press <F8> function key. Scroll to the RTD input you are calibrating
and press <ALT> <R> (key <ALT> and the letter R at the same time). Induce the low end
(80) resistive signal and then wait 10 seconds and enter the equivalent temperature in
degrees followed by pressing the <F3> function key.
2. Induce Higher range signal (120) and wait 10 seconds, then enter the temperature degrees
equivalent to 120 followed by pressing the <F3> function key.
3. Now verify the live reading against the flow computer reading.
Date: 8/1/2019
Page 43

Dynamic Fluid Measurement SFC3 Liquid Pulse Manual Quick Start — 1-38
Verifying Digital Inputs and Outputs
Use the diagnostic menu. Scroll down by using the arrow keys to Diag | Diagnostic Data and
press <ENTER>. A live input and output is displayed. On the top of the screen pulse inputs and density
frequency input are shown. Compare the live value against the displayed value on the screen. Failure to
read turbine input could be a result of a bad preamplifier or the jumper selection for sine and square wave
input are not in the right position. Refer to wiring diagram Wiring | Turbine for proper turbine
input wiring. Density input can be sine or square wave with or without DC offset. Minimum accepted
signal has to be greater than 1.2 volt peak to peak. Status input is shown below the frequency input to the
left of the screen. When the status input is on, the live diagnostic data will show ON. Minimum voltage to
activate the status is 7 volts with negative threshold of 2 volts. Switch outputs are to the right of the status
inputs. Press <F8> in the diagnostic menu to manually activate the switch outputs to the on and off
position. After the screen freeze the cursor will point to switch output one. Use the space bar to toggle the
switch on/off and the <ENTER> key to advance to the next switch. Press <ESC> to exit diagnostic screen.
The switch outputs are open collector and require external voltage.
Date: 8/1/2019
Page 44

Dynamic Fluid Measurement SFC3 Liquid Pulse Manual Quick Start — 1-39
D
C
BTime
ATime
K
_
_
Pulse Interpolation:
When interfacing with Small Volume Provers (SVP), Dynamic uses Dual chronometry as the pulse
interpolation method which is required for provers providing less then 10,000 unaltered pulses.
Pulse interpolation is a pulse counting technique used to calculate the total number of meter pulses between
two detectors, including fractional pulses. A conventional pipe prover requires a minimum of 10,000
unaltered pulses to ensure an accurate test. This minimum is based upon the assumption there is a potential
error of 1 pulse each time a detector is passed, which equates to a 2-pulse error per run. The value of 2 pulses
per 10,000 equates to a potential 0.02 % error. SVPs require less than 10,000 pulses, which would equate to
a potential error greater than 0.02 %.
To enhance the meter's pulse output, Small Volume Provers use pulse interpolation for fractional meter pulse
counting. To interpolate fractional meter pulses or to mathematically interpolate partial pulses, Dynamic uses
the double chronometry method for this purpose since it is the method most widely used.
Double Chronometry:
Double chronometry pulse interpolation increments time precisely every millisecond. A high frequency
master oscillator operates two time counters referred to as Time A and Time B. Time A starts when the first
detector switch is tripped, and Time B starts with the leading edge of the first flow meter pulse after Time A
has started. Time A is stopped when the final detector is tripped and Time B is stopped with the leading edge
of the first flow meter pulse after Time A has stopped (see figure below). Using the ratio of Time A and Time
B allows for counting of a fraction of the flow meter pulse.
K = K Factor, or counts per unit Volume, from the flow meter.
A = Time for displaced volume.
B = Time for whole meter pulses.
C = Total number of whole meter pulses.
D = Displaced Volume
Double Chronometry Figure
Date: 8/1/2019
Page 45

Dynamic Fluid Measurement SFC3 Liquid Pulse Manual Quick Start — 1-40
)%1(
3600
BSWLMFCPLCTLIV
LMFCPLCTLIV
CPLCTLIV
L)(Pulses/BBFactor K Nominal
es/sec)Total(Puls
NSV VolumeStandard Net
GSV VolumeStandard Gross
ISV VolumeStandard Indicated
IV VolumeIndicated
Correction Rate Flow Linearized Factor Meter
WaterWeight of
SG-BSW)%(LMFCPLCTL IV
WaterWeight of
.
Density
-BSW)%(LMF IV
LMF
density) live (without
MASS
applied) is density live (if
MASS
1000
1
10009990120
1
Calculations and Terminology:
Liquid pulse units
Crude refined products use API 2540 equation 5, 6 A & B, 23, 4 A & B, 11-2-1, and 11-2-2. Table 24 C is
used when thermal expansion coefficient is known. Old tables 23 and 24 with GPA16 and 11-2-2 are used
for NGL or light hydrocarbon mixes. API 2565 is used for propylene, and ethylene. In addition, NBS
1045 can be selected for ethylene calculations. ASTM 1550 can be used for butadiene.
Terms
Date: 8/1/2019
Page 46

Dynamic Fluid Measurement SFC3 Liquid Pulse Manual Data Entry 2-1
CHAPTER 2: Data Entry
and Configuration Menus
Introduction to the Smart Flow Computer Software
Introduction to the Flow Computer Software
Your SFC3 software is constructed around a menu-driven organization. Begin your software and, across
the top of your screen, you see a bar like this:
This is called the menu bar. It consists primarily of series of topics–Port, Diag, and so forth. When
you move the cursor to a topic you will see a list–we will call it a menu list– of topics related to the main
topic on the menu bar.
At the bottom of the screen is the prompt bar. It informs you of appropriate actions that you can perform
while your cursor is at its present location. In this example:
you are informed that your valid choices are the four arrow (, , , and )keys, the ENTER key,
and the key.
Another important area of the screen is the filename area. This is the rightmost section of the menu bar; it
informs you what configuration file you are presently viewing and editing. In the example above, you are
editing the file mainunits. When you first begin the SFC sotware, however, it will display
because no file has yet been chosen. Until you choose a file to edit or view, by opening either an existing
file or a new one, you will not be able to move from the File menu item.
The center portion of the screen is simply called the viewing area. Here you view either various menu lists
or the prompt window associated with an item in a menu list after it is selected (that is, after you press
ENTER). When you are in a prompt window the message appears in the filename area.
Under certain conditions you will have a screen where the viewing area takes up the whole screen and the
menu and/or prompt bars disappear. Examples of these are: the wiring diagrams, the calibration windows,
and the Diag windows.
ABOUT
Displays the version number of EPROM and PC configuration menu. Press <Esc> to Exit.
Date: 8/1/2019
Page 47

Dynamic Fluid Measurement SFC3 Liquid Pulse Manual Data Entry 2-2
FILE
Open a File
Use this function to open an existing configuration file. After a file is opened it becomes the currently
active file; its contents can be viewed and its parameters can be edited.
Open a New File
Create a new file to store all the programmed information for one Flow Computer. You are prompted for
the new file’s name of eight characters or less. If you enter the name of a pre-existing file, the software
informs you of this and prompts you for your file’s name again. After a file is opened it becomes the
currently active file; its contents can be viewed and its parameters can be edited.
Delete a File
Delete a file when that file is no longer needed.
When this function is chosen a list of existing configuration files is displayed. Use the arrow keys to move
the cursor to your selection, then press to delete the file.
Date: 8/1/2019
Page 48

Dynamic Fluid Measurement SFC3 Liquid Pulse Manual Data Entry 2-3
Load File
Use this function to exchange parameter values between the PC and the Flow Computer. After this action
is performed all parameter values in the Flow Computer and the currently active file in the PC are identical.
To read all current parameters from the Flow Computer to the currently active file in the PC, press the
function key; this is called “uploading”.
To write all current parameters from the currently active file in the PC to the Flow Computer press the
function key; this is called “downloading”.
View File
Unlike every other file function, View File does not act upon configuration files. Instead, View File allows
the user to view files that were previously captured in a report. For capturing data in a report, look for
these items under the Report menu header:
Prev. Hourly Data
Prev. Daily Data
Alarm Data
Audit Trail Report
TicKet Report
Auto Data Retrieval
Current Data
When viewing a file use PageUp and PageDown to browse through it.
Save As
Use Save As to save the parameters in the currently active file (that is, the parameter values currently being
edited) to a new file. You are prompted for the new file’s name of eight characters or less. If you enter the
name of a pre-existing file, the software informs you of this and prompts you for your file’s name again.
The original file will remain in memory.
Date: 8/1/2019
Page 49

Dynamic Fluid Measurement SFC3 Liquid Pulse Manual Data Entry 2-4
Save
When permanent modifications are performed on a file, user must save the new changes before exiting the
program, or proceeding to open a different file.
Save and Exit
Exit the program and save the parameters that were changed.
Exit
Exit without saving new modified parameters.
Date: 8/1/2019
Page 50

Dynamic Fluid Measurement SFC3 Liquid Pulse Manual Data Entry 2-5
PORT
PC Communication Set Up
Communication Port Number (1,2,3,4)
Enter the PC port used to communicate with the Flow Computer.
Flow Computer Port Number
There are two available ports in the Flow Computer. Port 1 is the RS-485 Modbus port. Port 2 is the RS232 Modbus port. The PC set up must match the Flow Computer port set up.
Unit ID Number
The Unit ID Number is used strictly for communication purposes; it can take any value from 1 to 247. Only
one master can exist in each loop.
Note: Do not duplicate the Unit ID number in a single communication loop!
This situation will lead to response collisions and inhibit communications
to units with duplicate ID numbers.
Modbus Type
Note: this parameter must be set the same for both the PC and the Flow
Computer for communication to occur.
The Modbus Communication Specification is either Binary RTU or ASCII.
Parity
Note: this parameter must be set the same for both the PC and the Flow
Computer for communication to occur.
RTU - NONE
ASCII - EVEN or ODD
Set the parity to match the Modbus Type.
Baud Rate
Note: this parameter must be set the same for both the PC and the
Flow Computer for communication to occur.
Date: 8/1/2019
Page 51

Dynamic Fluid Measurement SFC3 Liquid Pulse Manual Data Entry 2-6
Baud rate is defined as number of bits per second. The available selections are 1200, 2400, 4800, or 9600.
Transmit Delay
This Delay in milliseconds is used to allow hand shaking between the PC and the Flow Computer. The PC
will hold the RTS line high for the specified Transmit Delay time. After that time expires the data stream
will begin transmitting. Transmit Delay is applicable regardless of the type of communication with the
Flow Computer (RS-232 or RS-485).
This function can be very useful, especially when using a half-duplex RS-485 port; it allows the RS-485
port to turn off. A delay of 50 milliseconds is normally sufficient.
RTS can also be used as transmit line to printer. (RTS to Pin2, Common to Pin7)
Flow Computer Communication Set Up
Unit ID Number
The Unit ID Number is used strictly for communication purposes; it can take any value from 1 to 247.
Note: Do not duplicate the Unit ID number in a single communication
loop! This situation will lead to response collisions and inhibit
communications to units with duplicate ID numbers.
Only one master can exist in each loop.
Port #1 Modbus Type
Note: this parameter must be set the same for both the PC and the
Flow Computer for communication to occur.
The Modbus Communication Specification is either Binary RTU or ASCII.
Date: 8/1/2019
Page 52

Dynamic Fluid Measurement SFC3 Liquid Pulse Manual Data Entry 2-7
Port #1 Parity
Note: this parameter must be set the same for both the PC and the
Flow Computer for communication to occur.
RTU - NONE
ASCII - EVEN or ODD
Set the parity to match the Modbus Type.
Port #1 Baud Rate
Note: this parameter must be set the same for both the PC and the
Flow Computer for communication to occur.
Baudrate is defined as number of bits per second. The available selections are 1200, 2400, 4800, or 9600.
Port #1 RTS Delay
This function allows for a modem or radio delay time before transmission. The Flow Computer will turn
the RTS line high before transmission for the entered time delay period.
Port #2 Modbus Type
Note: This parameter must be set the same for both the PC and the
Flow Computer for communication to occur.
The Modbus Communication Specification is either Binary RTU or ASCII.
Port #2 Parity
RTU - NONE
ASCII - EVEN or ODD
Set the parity to match the Modbus Type.
Port #2 Baud Rate
Baud rate is defined as number of bits per second. The available selections are 1200, 2400, 4800, or 9600.
Select 0=RTS,1=Printer
RTS line has dual function selection; either RTS for driving request to send or transmit to serial printer.
To use serial printer interface for printing reports, ie.batch, daily, interval and proving. Connect the serial
printer pin2 to RTS and common return to pin7 and select 1 for printer.
Port #2 Number of Nulls
This function is used because no hand shaking with the printer is available and data can become garbled as
the printer’s buffer is filled. The Flow Computer will send nulls at the end of each line to allow time for
the carriage to return. Printers with large buffers do not require additional nulls. If data is still being
garbled, try reducing the baud rate to 1200.
Dial
Use the cursor arrow
keys to move the cursor to the desired phone number and press ENTER. Dial’s display indicates the
owner of each phone number according to the Phone Book.
Dial cannot add new phone numbers; it can only dial numbers that have previously been entered in the
Phone Book.
Example: T,9,1281-530-5539 instructs the dialer to use tone dialing, pause, dial 9 for an outside line,
pause, then dial the number. See Phone Book for more information.
Date: 8/1/2019
Page 53

Dynamic Fluid Measurement SFC3 Liquid Pulse Manual Data Entry 2-8
Phone Book
Phone Book lists all the phone numbers with the phone’s owner new numbers can be added to the list.
<Arrow Keys> Select Number to Modify or Delete.
Add new entry to phonebook.
+ Delete selected entry.
or ENTER Modify selected entry.
<Esc> Exit and save changes.
Phone Book Edit
Type name, press , and type phone number. Press ENTER to save, <Esc> to leave entry unchanged.
In the phone number the following codes may be used:
<0-9> Dial digit
<P> Change to pulse dialing
<T> Change to tone dialing
<Comma> Pause
Example: T,9,1281-530-5539 instructs the dialer to use tone dialing, pause, dial 9 for an outside line,
pause, then dial the number.
Modem Setup
<Modem Dial Prefix> Enter the string sent to the modem before the phone number.
Normally either "ATDT" (dial tone) or "ATDP" (dial pulse)
<Modem Dial Suffix> Enter the string sent to the modem after the phone number.
Normally just "^M" (CR)
<Modem Hangup String> Enter the string sent to the modem to hang-up the phone.
See your modem manual for other characters.
Hang-up Phone
Press ENTER to send the Modem Hang-up string (Defined in Modem Setup) to the modem.
Note : Hand shake and error checking should be turned off. Commands
to turn off the hand shake vary between modems. Check your
modem manual. Typical command - AT&K0, AT&Y0.
Date: 8/1/2019
Page 54

Dynamic Fluid Measurement SFC3 Liquid Pulse Manual Data Entry 2-9
DIAG
Read Single Flow Computer Communication Setup
Press and the configuration program will attempt to communicate with a single Flow Computer at
different baud rates and formats.
Failure to communicate can occur because of a communication wiring problem, wrong PC port selection,
communication parameter mismatch between PC and Flow Computer (Modbus type, parity, baud rate,
etc.) or lack of power to the Flow Computer. To use this feature, the user must insure that only one Flow
Computer is connected to the PC. More than one Flow Computer in the loop will cause data collisions and
unintelligible responses.
Diagnostic Data
Diagnostic Data shows real-time, live data. Use it to monitor switch outputs, status inputs, analog
inputs and outputs, analog frequency, failure codes and so forth. To control the switch outputs manually
use the F8 function key to freeze the screen, press the SPACE BAR to change activity, and use ENTER key
to move to next switch.
Date: 8/1/2019
Page 55

Dynamic Fluid Measurement SFC3 Liquid Pulse Manual Data Entry 2-10
PROVER
Prove Request
Enter the meter number to prove and then enter the prove sequence type. Single run sequence is one run
one way in uni-directional prover and round trip in bi-directional. Sequence will be a sequence of run to
achieve repeatability and meter factor.
Prover Temperature Override
When there is no live prover temperature connected to the flow computer, user can enter override value to
be used in the proving calculations, or use the meter temperature.
Prover Pressure Override
When there is no live prover pressure connected to the flow computer, user can enter override value to be
used in the proving calculations, or use the meter pressure.
Prover Gravity Override
Prover gravity override will be used for liquid corrections for both meter and prover. Gravity override is
not used for batch correction, but only in the proving calculations.
Prover Shaft Temperature Override
The shaft temperature override is used in piston type provers. The temperature for the shaft is normally the
ambient temperature.
CTL or CPL Override
Enter the override value, the proving meter temperature and pressure correction will default to the override
value. Zero in the data entry indicates use calculated value.
Prove Data
PROVER REPORT NUMBER
The number that will appear in the proving report.
Prover Serial Number
The serial number of the prover that will appear in the proving report.
PROVER MODEL
The prover model that will appear in the proving report.
Prover Size
The size of the prover in inches.
PROVER TYPE
0 = Ballistic type prover with piston action.
1 = Reduced type prover uni-directional with total pulse count less than 10,000.
2 = Reduced volume bi-directional with less than 10,000 pulses in each direction.
All the above will use the double chronometry method (pulse interpolation).
3 = Uni-directional big volume prover with pulse count over 10,000 counts
4 = Bi-directional large volume prover with pulse count in each direction exceeding 10,000 in
each direction
5 = Simth with piston action
Date: 8/1/2019
Page 56

Dynamic Fluid Measurement SFC3 Liquid Pulse Manual Data Entry 2-11
mild carbon
62.0 10-7/F
304 stainless
96.0 10-7/F
316 stainless
88.3 10-7/F
7–14 pH stainless
60.0 10-7/F
DET ECTOR SWITCH
Provers are always fitted with dual detector switches. Because of wiring considerations, many times both
detectors are paralleled together. Select single detector, when both detectors are paralleled together. Select
dual detector, when two isolated signals are used. . Prover operation will not with the wrong prover
controller chip.
333 chip is our most common prover controller chip. It uses a single detector switch. It is normal operation
is for Active Low switches commonly found in Piston SVPs like Calibron and Brooks. It also supports
Active High switches (sometimes called Reverse Polarity detector switch).
331 chip is generally used for Ball provers with dual detector switches like most traditional prover
controllers, one switch for start and one to stop. It also supports Active High single detector provers.
Single Detector Delay
When single detector is used. Hysteresis time is required to insure proper debounce time. 100 milliseconds
are sufficient in most cases.
DET ECTOR MOUNTING
When piston type prover is selected, the detector switches distance will change with temperature. For
ballistic provers, the user must select "on calibration section mounting". Pipe provers are normally "off
calibration section mounting".
Prove Seal
When prover seal signal is not available. The option for requiring prove ready signal is waived.
NUMBER OF PROVE RUN S TO AVE RAGE
Numbers 1-10 are for the consecutive runs to achieve good meter factor and pulse deviation within set
limit. After the number of prove runs to average is achieved within the pulse deviation limit, then the prove
runs will stop.
Number of Total Runs
Numbers 1-20 are the total number of allowable runs to achieve repeatability. The Flow Computer will
attempt to achieve consecutive runs within the repeatability limit.
UPS TREAM SIGNAL POL ARITY
The upstream signal polarity signals high or low is ready to launch signal. The logic polarity of the piston
upstream can be programmed as low or high to indicate ready to launch.
RUN OUTPUT SIGNAL POLARITY
When using ballistic provers, a signal is required to start prover, or bring the piston to launch position.
Coefficient of Expansion on Displacer Shaft E-7 (Piston Prover)
This is the coefficient of thermal expansion of the prover piston shaft
Date: 8/1/2019
Page 57

Dynamic Fluid Measurement SFC3 Liquid Pulse Manual Data Entry 2-12
mild carbon
62.0 10-7/F
304 stainless
96.0 10-7/F
316 stainless
88.3 10-7/F
7–14 pH stainless
60.0 10-7/F
mild carbon
62.0 10-7/F
304 stainless
96.0 10-7/F
316 stainless
88.3 10-7/F
7–14 pH stainless
60.0 10-7/F
Area Thermal Coefficient E-7 (Piston Prover)
This is the coefficient of expansion for prover wall
PROVER BASE TEMPERATURE
The temperature in which the prover volume was established. All steel correction factors will be based on
base temperature.
PROVER BASE PRESSURE
The prover pressure correction factors will be based on the reference calibration pressure. The modulus of
elasticity combined with the live pressure are used to calculate wall expansion due to pressure.
Pre-travel in Volume
After the second detector switch is tripped. The Flow Computer allows for certain delay period
proportional to time between prover run first and second detector switch. To allow for the prove ball to
stabilize, after the time expires, the launch sequence will be re-initiated.
Prove Abort Time Out in Seconds
If the prove run was not achieved in the set time, then the prove will be aborted. The reason for this
function is to accommodate the possibility the second detector switch was not triggered for one reason or
another, or the proving was launched from the wrong direction.
UPS TREAM/DOWNSTREAM PROVER VOLUME
The prover volume in barrels at reference conditions per water draw.
PROVER DIAMETER
The diameter of the prover in inches.
PROVER WALL THICKNESS
The thickness of prover wall in inches assuming single wall prover.
Modulus of Elasticity
The elasticity coefficient of prover wall material.
Coefficient of Cubical Expansion E-7
PROVER TEMPERATURE SAMPLE PERIOD
The prover temperature should be stable before proving. This would indicate that the prover and the fluid
through the prover have similar temperatures. The sample period configured is a command to the Flow
Computer to sample the prover temperature every so many minutes and compares the temperature to the
previous sample.
Date: 8/1/2019
Page 58

Dynamic Fluid Measurement SFC3 Liquid Pulse Manual Data Entry 2-13
Pulse Deviation %
Highest of Counts Lowest of Counts
Counts
Lowest of
100
Meter Factor Deviation %
Proved Meter Factor Previous Meter Factor
Previous Meter Factor
100
Prover Temperature Allowable Change in Deg.F
Each time the prover temperature is sampled and compared to the previous sample. The deviation should
not exceed the set limit. Once the prover temperature is stable the Flow Computer will give the command
to initiate a prove.
Prover and Meter Temperature Deviation
This will set the limit between the meter and prover temperature. If the difference between the meter and
prover temperature is above the set limit the prove will be aborted
Flowrate Change per Sample Period
The maximum flow rate fluctuation acceptable before initiating a prove. The temperature sample checking
period is also used.
PULSE DEVIATION
The pulse deviation limit is for setting the repeatability of runs. The Flow Computer will try to achieve
consecutive runs within the programmed limits.
METER FACTOR DEVIATION
To implement proved meter factor; the deviation must be within these limits.
IMPLEMENT METER FACTOR AUTOMATICALLY
Enter '1' to automatically implement the new meter factor. The new meter factor will apply to the current
batch and will be used for that product until next prove.
Prover Temperature Transducer 0=Single,1=Dual
Inlet or outlet temperature transmitters are accepted. Inlet is used in forward direction and outlet in the
reverse direction.
Date: 8/1/2019
Page 59

Dynamic Fluid Measurement SFC3 Liquid Pulse Manual Data Entry 2-14
Prover Diagram
Live run data flow diagram for the proving sequence, pulse counts valve sequencing, prover temperature
and prover pressure. meter temperature and pressure.
Previous Prove Report
Up to 16 previous proves can be stored and retrieve at any time. The prove reports are not associated with
certain product files but are in chronological order.
Single Prove Report
The previous single prove run report.
Prove Abort Report
The previous prove abort report.
Date: 8/1/2019
Page 60

Dynamic Fluid Measurement SFC3 Liquid Pulse Manual Data Entry 2-15
METER
Batch and Stream Data
STREAM ID
Up to 8 characters. This function will serve as Stream Tag.
STREAM LOCATION
Up to 20 characters. Stream location will appear in the reports.
BI-DIRE CTIONAL
This feature allows a status input or phase angle to give direction for meter.
BAT CH TYPE
If daily batch selected, the batch will end at the day start hour. On demand type will end the batch, when
the Flow Computer is requested to end the batch manually. Weekly based batch type will end batch at day
start hour at the end of the week.
BAT CH TYPE – WEEKLY
Weekly based batch type will end batch at day start hour at the end of the week. Enter the day of the week
to end batch. (0=Monday,1=Tuesday,2=Wednesday,3=Thursday,4=Friday,5=Staturday,6=Sunday)
BAT CH TYPE – TIME
Time based batch type will end batch at the day start hour of that day.
BAT CH NUMBER
This number will increment by one at the end of batch.
NEX T BATCH PRESET WARNI NG
Batch Preset warns the operator the batch has reached the preset warning limit. Enter data for the next
batch.
NEX T BATCH PRESET
Batch Preset warns the operator the batch has reached the preset limit. Enter data for the next batch. If
ending batch at preset is configured and the batch has reached the preset limit, the batch will be ended.
NEX T BATCH PRODUCT NUMBER
Enter the product number for the next batch.
NEX T BATCH ID
Enter the batch ID for the next batch.
NEX T BATCH SHIP ID
Enter the ship ID for the next batch.
NEX T BATCH RECEIEVE ID
Enter the receive ID for the next batch.
ENABLE BATCH PRESET
Enter ‘0’ to eliminate the warning and alarms associated with batch presets. Batch Preset does not end
batch; it will provide switch output and warning indications.
END BATCH AT PRESE T
Enter ‘1’ to end batch when the batch has reached the preset limit.
BAT CH PRESET BASE
Batch preset values can be gross or net barrels.
ENABLE BATCH SC HEDU LE
If batch schedule is enabled, the Flow Computer will use product schedule to determine which product to
be used in the next batch.
Date: 8/1/2019
Page 61

Dynamic Fluid Measurement SFC3 Liquid Pulse Manual Data Entry 2-16
BAT CH SCHEDULING
Up to ten different products can be scheduled in sequence. When the flow computer receive end batch
command, it will move the scheduled products one step up, and the product at the top of the schedule list
will be used for the batch. The batch schedule can be altered at any time.
METER DATA
METER ID
Up to 8 characters. This function will serve as Meter Tag.
BI-DIRE CTIONAL
This feature allows a status input to give direction or use of the flow computer phase angle feature. The
phase angle requires dual pickups The phase angle feature relies on high precision quadrature decoder that
gives quick and precise direction detection. Bi-directional totalizers will totalize accordingly.
STREAM NUMBER AND LINEAR FACTOR
Enter stream number that meter belongs to. Enter ‘0’ if that meter is not active.
LINEAR FACTOR
Enter the different correction factors for the meter at different flow rates. The flow computer will perform
linear interpolation. Notice that even though using this feature enhances the measurement accuracy,
performing audit trail on a linearized meter factor is very difficult.
PRODUCT METER FACTOR
Enter the meter factor for each product. This will be the default value used at the beginning of each new
batch. Changing the value during the batch will not affect the meter factor for the current batch. To
change current batch meter factor, use the "Meter Factor Override" entry. Changing the meter factor in the
product meter factor file only applies the next time this product is selected.
FLOW CUTOFF FREQUENCY
The Flow Computer will quit totalizing, when frequency is below the set limit. This feature is to reduce
noise effect when the meter is down for period of time. The totalizer will stop totalizing when the
frequency is below the cut off limit.
RET ROACTIVE METER FACTOR
If zero is selected, the meter factor will not apply to the entire batch. It will only apply from the time the
new meter factor is entered. Retroactive in the other hand will apply to the entire batch and the entire batch
is re-calculated, using the new meter factor.
FLOW POLARITY
Station total can add meters, or subtract one from the others.
K FACTOR
K Factor is the number of pulses per unit volume, i.e. 1000 pulses/barrel. The tag on the meter would
normally indicate the K Factor.
GROSS FLOWRATE LOW/HIGH LIMIT
The high/low flow rate alarm is activated, when gross flow rate exceeds or is below the set limit. The
alarm will be documented with time, date, and totalizer.
Date: 8/1/2019
Page 62

Dynamic Fluid Measurement SFC3 Liquid Pulse Manual Data Entry 2-17
ASSIGNMENT
DESCRIPTION
1
Analog Input#1
2
Analog Input#2
3
Analog Input#3
4
Analog Input#4
5
Analog Input#5
6
Analog Input#6
7
Analog Input#7
8
Analog Input#8
9
RTD Input#9
10
RTD Input#10
11
RTD Input#11
12
RTD Input#12
13
Use Override Value
20
Multi.Variable #1
21
Multi.Variable #2
Density
Type
Densitometer
Type 0
None
Type 1
4–20 mA
Density 4–20 mA Type (Gravity Unit)
Type 0
Specific Gravity 4-20mA
Type 1
API Gravity 4-20mA
Type 2
Density Signal 4-20mA in GM/CC
Type 2
Frequency
INPUT POSITION ASSIGNMENT
DENSITY TYPE
If live density is connected to the meter, user must enter the density type. Raw density frequency or a 420mA input can be selected. This density will be used to calculate mass flow and net flow.
DENSITY 4-20MA TYPE (GRAVITY UNIT)
Note that this type of input requires the user to choose a subtype, as indicated in the table above.
Date: 8/1/2019
Page 63

Dynamic Fluid Measurement SFC3 Liquid Pulse Manual Data Entry 2-18
ASSIGNMENT
DESCRIPTION
1
Analog Input#1
2
Analog Input#2
3
Analog Input#3
4
Analog Input#4
5
Analog Input#5
6
Analog Input#6
7
Analog Input#7
8
Analog Input#8
ASSIGNMENT
DESCRIPTION
1
First Set of Densitometer Data Entries
2
Second Set of Densitometer Data Entries
ASSIGNMENT
DESCRIPTION
0
Upstream
1
Downstream
DENSITY 4-20MA INPUT POSITION ASSIGNMENT
DENSITY FREQ INPUT POSITION ASSIGNMENT
PROVE VOLUME SELECTION
Date: 8/1/2019
Page 64

Dynamic Fluid Measurement SFC3 Liquid Pulse Manual Data Entry 2-19
0=
5A/6A 6=
23B/24B
12=
API2565-Propylene
1=
6A 7=
4B 13=
API2565-Ethylene
2=
5B/6B 8=
OLD23/24
14=
ASTM1550-Butadiene
3=
6B 9=
OLD24
15=
NEW23
4=
23A/24A
10=
24C 16=
NEW23/24
5=
24A 11=
6C 17=
Ethanol
PRODUCT DATA
PRODUCT NAME
Up to 16 characters.
TABLE SELECTION
Table A is for Crude, Table B is for refined products, Table C is for special products – i.e. toluene.
OLD/NEW Tables are used in for LPG and NGLs.
Crude oil, natural gasoline, drip gasoline JP4 use 6A,24A if density is known, and 5A/6A,23A/24A if live
densitometer is used. Gasoline, naphthalene, jet fuel, aviation fuel, kerosene, diesel, heating oil, furnace oil
use 5B/6B,23B/24B when live density is used. 6B,24B when no live density is used. Benzene, toluene,
styrene, ortho-xylene, and meta-xylene, acetone use 6C/24C. Enter slope and intercept if ethanol product is
selected.
GRAVITY/DENSITY @60
The gravity at 60 will be prompted only if the table selected, density at reference condition is known. (Even
table is selected). The gravity at 60 is used to calculate the volume correction factor.
ALP HA T E-6
The Alpha T will be prompted only if table 6C or 24C is selected. Enter Alpha T value, the number entered
will be divided by 10-6.
Example: Entered Value 335 (Actual value 0.000335)
COR ROSION INHIBITOR OR ANTISTATIC
The switch output will be activated if flow exceeds flow cut off limit. If flow falls below flow cut off, the
switch output will be de-activated after 30 seconds delay.
When corrosion inhibitor or antistatic is selected in the product file, and a switch output is assigned, the
switch will be turned on when that product is used. When the flow stops, 30 second delay timer of the
switch will be turned off.
Date: 8/1/2019
Page 65

Dynamic Fluid Measurement SFC3 Liquid Pulse Manual Data Entry 2-20
OTHER PARAMETERS
Day Start Hour (0-23)
Day start hour is used for batch operation. If daily batch is selected, the batch will end at day start hour, all
batch totalizers and flow weighted values are reset.
Company Name
Up to 20 characters. The company name appears in the reports.
Flow Rate Average Second
Flow rate averaged 1-10 is for fluctuating flow rate conditions. This number is used to perform averaging
on the current flow rate by adding it to the previous seconds flow rate, and then display an averaged
smoothed number. Only low resolution pulse meter requires this function.
Old Table Gravity Unit
If old table 23/24 is selected, and gravity units are required in API units
Disable Alarms
When the alarm function is disabled, alarms will not be logged. Alarms are also not logged if turbine
frequency is below cut of limit.
Print Intervals in Minutes
When the second port of Flow Computer is configured as printer port, then a snapshot report can be
printed at any minute combination. (i.e. every five minutes, every hour, or every ten hours).
GM/CC Conversion Factor
This factor is used to reference the density to density of water (i.e. .999012) to establish specific gravity.
Weight of H2O in Vac @60 Deg.F
The weight of one barrel of water under vacuum conditions. (i.e. 350.1616 Lb/barrel)
Atmospheric Pressure
Local pressure or contracted atmospheric pressure. (i.e. 14.73 psi)
Pulse Output Width
Pulse Output Width is the duration, in milliseconds, of one complete pulse cycle (where each cycle is the
pulse plus a wait period, in a 50/50 ratio). For example: if POW = 500 msec, the Flow Computer at most
can produce one pulse each second regardless of the pulse per unit volume selected (500 msec pulse + 500
msec wait). If POW = 10 msec the Flow Computer can produce up to 50 pulses per second.
The Flow Computer’s maximum pulse output is 125 pulses/sec. The Pulse Output in combination with the
Pulse Output Width should be set so that this number is not exceeded.
Date and Time
The PC software will show the current date and time from the PC. Press F3 to download that date and time
to the flow computer. Press F2 to upload the date and time from the flow computer.
End Batch
The batch will end if requested through this menu. The current batch totalizer and flow weighted data will
reset to zero. Non-resetable totalizers are not affected by the batch resetting.
Overrides:
CURRENT BATCH PRESE T
Enter the value to override the current batch preset or batch preset warning volume
Date: 8/1/2019
Page 66

Dynamic Fluid Measurement SFC3 Liquid Pulse Manual Data Entry 2-21
METER FACTOR OVERRIDE
Enter Meter Factor to override the current batch meter factor. This meter factor is used only for the current
batch. If permanent modifications to the meter factor are needed, change the meter factor in the meter
factor file.
GRAVITY OVE RRIDE
Enter Gravity Override to replace current gravity. The gravity override is a non-retroactive gravity and will
not override the product file gravity. It only applies to the current running batch.
BS&W OVERRIDE
Enter the BS&W override for the current batch (none retroactive).
ALP HA T E-6 OVERRIDE
Enter Alpha T Override to the batch. It will not effect the Alpha T value in the product file. Alpha T is the
thermal expansion coefficient for the selected product. The flow computer divides by 1000000.
Example: 0.000355 = 355 / 1000000
EQUILIBRIUM PRESSURE OV ERRIDE
Enter the equilibrium pressure override for the current batch.
METER TEMPERATURE OVERRIDE
This value is entered when no live temperature is available, or different value from live value should be
used.
METER PRESSURE OVERRIDE
Pressure override can be used when no live pressure transmitter is connected to the Flow Computer.
CTL SLOPE AND INTER CEPT
Slope and intercept are used if Ethanol product is configured.
Security Code
Several levels of security codes have been selected to fit different levels of responsibility. Up to six
alphanumeric codes can be used for each entry. If the security code is not used, then there will not be any
security code prompt in the menu.
Date: 8/1/2019
Page 67

Dynamic Fluid Measurement SFC3 Liquid Pulse Manual Data Entry 2-22
INPUT/OUTPUT
Transducer Input Assignment
TRA NSDUCER INPUT AS SIGNMENT
The Flow Computer provides 4 analog inputs, 4 status input, 5 switch outputs, one density frequency input
(or can be configured as turbine #3 frequency input), two turbine inputs, and two 4 wire RTD inputs. In
order for the Flow Computer to read the live input, the input must be properly assigned and properly wired.
TRA NSDUCER TAG ID
Up to 8 alphanumeric ID number. The transmitters are referred to according to the TAG ID. All alarms
are labeled according to TAG ID.
4MA
Enter the 4mA value for the transducer.
20MA
Enter the 20mA value for the transducer.
LO/H I LIMIT
Enter the low and high limits. When live value exceeds high limit or less than low limit, an alarm log will
be generated.
MAINTENANCE VALUE
The value to be used when the transmitter fails, or while calibrating. For calibration, set fail code to 1 while
calibrating.
FAIL CO DE
Fail Code 0: always use the live value even if the transmitter failed.
Fail Code 1: always use the maintenance value
Fail Code 2: use maintenance value if transmitter failed. i.e. 4-20mA is above 21.75 or below
3.25)
DENSITY PERIOD LOW/HIGH LIMITS
Density Period is the time period in micro-second. The densitometer fails if the density period exceeds the
density period low or high limits. If the densitometer fails and density fail code is set to 2, the maintenance
value will be used.
Transducer Override
Enter a value to override current transducer data. Enter ‘0’ to clear override status.
Calibration
See details in chapter 1.
Date: 8/1/2019
Page 68

Dynamic Fluid Measurement SFC3 Liquid Pulse Manual Data Entry 2-23
Assignment
Comments
1
End Stream#1 Batch
End the batch for Stream#1 and reset batch totalizer
2
End Stream#2 Batch
End the batch for Stream#2 and reset batch totalizer
3
End Stream#3 Batch
End the batch for Stream#3; reset batch totalizers
4
Alarm Acknowledge
Reset the previous occurred alarms output bit
5
Print Request
Step 1: set port 2 RTS type to 1 (printer type)
Step 2: When this status is activated, the Flow Computer will send
the "Request Report" to the printer via the serial port #2.
6
Request Prove Meter#1
7
Request Prove Meter#2
8
Request Prove Meter#3
9
Request Prove Meter#4
10
Request Prove Meter#5
11
N/A
12
Request Trial Prove Meter1
13
Request Trial Prove Meter2
14
Request Trial Prove Meter3
15
Request Trial Prove Meter4
16
Request Trial Prove Meter5
17
Request Trial Prove Meter6
18
Prover Ready (High) /
Upstream Polarity
19
Stream #1 Flow Direction
20
Stream#1 Product ID Bit 0
Stream#1 Product ID Bit 1
Stream#1Product ID Bit 2
Stream#1 Product ID Bit 3
Product ID Bits: Before ending batch, user can use status bits to
select next product. These bits are read immediately at batch end.
See the following table to specify a product.
21
22
23
Status Input Assignment
I/O | Status Input Assignment
User can select any one of status input and assign it to input point.
Date: 8/1/2019
Page 69

Dynamic Fluid Measurement SFC3 Liquid Pulse Manual Data Entry 2-24
Assignment
Comments
24
Stream#2 Flow Direction
25
Stream#2 Product ID Bit 0
Stream#2 Product ID Bit 1
Stream#2 Product ID Bit 2
Stream#2 Product ID Bit3
Product ID Bits: Before ending batch, user can use status
bits to select next product. These bits are read immediately
at batch end.
See the following table to specify a product.
26
27
28
29
Stream#3 Flow Direction
30
Stream#3 Product Bit 0
Stream#3 Product Bit 1
Stream#3 Product Bit 2
Stream#3 Product Bit 3
Product ID Bits: Before ending batch, user can use status
bits to select next product. These bits are read immediately
at batch end.
See the following table to specify a product.
31
32
33
34
Display Freeze
35
Display Toggle
36
Stream#1 Partial Batch End
37
Stream#2 Partial Batch End
38
Stream#3 Partial Batch End
39
End All Streams Batch
40
End All Streams Partial Batch
Date: 8/1/2019
Page 70

Dynamic Fluid Measurement SFC3 Liquid Pulse Manual Data Entry 2-25
Product
Bit 3
Product
Bit 2
Product
Bit 1
Product Bit
0r
Product
Number
0 0 0 0 = 1 0 0 0 1
= 2 0 0 1 0
= 3 0 0 1 1
= 4 0 1 0 0
= 5 0 1 0 1
= 6 0 1 1 0
= 7 0 1 1 1
= 8 1 0 0 0
= 9 1 0 0 1
= 10
1 0 1 0 = 11
1 0 1 1 = 12 1 1 0 0
= 13 1 1 0 1
= 14 1 1 1 0
= 15 1 1 1 1
= 16
*PRODUCT ID BITS
Examples:
Assign Status Input #1 19
Assign Status Input #2 20
Assign Status Input #3 21
Assign Status Input #4 22
User is using the four inputs to monitor the product ID.
Date: 8/1/2019
Page 71

Dynamic Fluid Measurement SFC3 Liquid Pulse Manual Data Entry 2-26
Meter 1
Meter 2
Meter 3
Str1
Str2
Str2
IV
101
201
301
701
801
901
ISV
102
202
302
702
802
902
GSV
103
203
303
703
803
903
NSV
104
204
304
704
804
904
Mass
105
205
305
705
805
905
Switch Output Assignment
I/O | Switch Output Assignment
The Flow Computer switch outputs are open collector type and require external D.C power. Assignment 15 are for pulse output. Assignment in the "Other Parameters" menu are ON/OFF type outputs. Switch 1-5
can be pulse or contact type output, switch 6-17 are only contact type outputs. Pulse output/unit value entry
is in other parameters assignment. PLC is required (GE 90-Micro) for switch 6-17.
ASS IGNMENTS - PULSE OUTPUTS
Pulse Output and Pulse Output Width
Pulse Output is used to activate a sampler or external totalizer. The number selected will be pulses per unit
volume or per unit mass. If 0.1 pulse is selected, the one pulse will be given every 10 unit volumes has
passed through the meter.
Pulse Output Width is the duration, in milliseconds, of one complete pulse cycle (where each cycle is the
pulse plus a wait period, in a 50/50 ratio). For example: if POW = 500 msec, the Smart Flow Computer at
most can produce one pulse each second regardless of the pulse per unit volume selected (500 msec pulse +
500 msec wait). If POW = 10 msec the Smart Flow Computer can produce up to 50 pulses per second.
The Flow Computer’s maximum pulse output is 125 pulses/sec. The Pulse Output in combination with the
Pulse Output Width should be set so that this number is not exceeded.
Date: 8/1/2019
Page 72

Dynamic Fluid Measurement SFC3 Liquid Pulse Manual Data Entry 2-27
Meter No:
1 2 3
IV Low
106
206
306
IV High
107
207
307
SG Out of Range
108
208
308
Temp.Out of Range
109
209
309
Alpha T Out Range
110
210
310
API Out of Range
111
211
311
Meter Down
112
212
312
Corr.Inhibitor
113
213
313
Antistatic
114
214
314
Stream No
1 2 3
Product Bit 0
720
820
920
Product Bit 1
721
821
921
Product Bit 2
722
822
922
Product Bit 3
723
823
923
Partial or Batch Ended(30 Sec)
724
824
924
Batch Warning
725
825
925
Batch Preset
726
826
926
Partial Batch Ended
727
827
927
Traditional Batch Ended
728
828
928
Flow Direction (1=Reverse)
729
829
929
ASS IGNMENTS - CONTACT TYPE OUTPUTS
Date: 8/1/2019
Page 73

Dynamic Fluid Measurement SFC3 Liquid Pulse Manual Data Entry 2-28
Meter-Independent Parameters
Analog Input #1 High
31 Prove Meter#1
81
Analog Input #2 High
32 Prove Meter#2
82
Analog Input #3 High
33 Prove Meter#3
83
Analog Input #4 High
34 Prove Meter#4
84
RTD#9 Input
39 Prove Meter#5
85
RTD#10 Input
40 Prove Meter#6
86
Analog Input #1 Low
43 Multi.Var.Pressure High
87
Analog Input #2 Low
44 Multi.Var.Pressure Low
88
Analog Input #3 Low
45 Multi.Var.Pressure Failed
89
Analog Input #4 Low
46 RTD Input #9 Low
51 Watchdog
90
RTD Input #10 Low
52 Day Ended (30 Seconds)
91
Analog Input #1 Failed
55 Month Ended (5 Seconds)
92
Analog Input #2 Failed
56 Active Alarms
93
Analog Input #3 Failed
57 Ocdurred Alarms
94
Analog Input #4 Failed
58 Remote Control
95
RTD Input #9 Failed
63 Multi.Var.Temperature High
96
RTD Input #10 Failed
64 Multi.Var.Temperature Low
97
Analog Output#1 Overrange
67 Multi.Var.Temp Failed
98
Analog Output#2 Overrange
68 Prove Run in Progress
71 Prove Launch Forword
72 Prove Launch Reverse
73 Prove Launch For/Rev
74 Compact/Smith Prove Run
75 Prove Completed
76 Prove Aborted
77 Prove Meter #1-#6
78
Date: 8/1/2019
Page 74

Dynamic Fluid Measurement SFC3 Liquid Pulse Manual Data Entry 2-29
Product
Bit 3
Product
Bit 2
Product
Bit 1
Product
Bit 0
Product
Number
0 0 0 0 = 1 0 0 0 1
= 2 0 0 1 0
= 3 0 0 1 1
= 4 0 1 0 0
= 5 0 1 0 1
= 6 0 1 1 0
= 7 0 1 1 1
= 8 1 0 0 0
= 9
1 0 0 1 = 10
1 0 1 0 = 11 1 0 1 1
= 12 1 1 0 0
= 13
1 1 0 1 = 14 1 1 1 0
= 15 1 1 1 1
= 16
*PRODUCT ID BITS
Date: 8/1/2019
Page 75

Dynamic Fluid Measurement SFC3 Liquid Pulse Manual Data Entry 2-30
Meter 1
Meter 2
Meter 3
IV
101
201
301
ISV
102
202
302
GSV
103
203
303
NSV
104
204
304
Mass
105
205
305
Density
106
206
306
SG
107
207
307
SG@60
108
208
308
API
109
209
309
API60
110
210
310
Temperature
111
211
311
Pressure
112
212
312
Stream 1
Stream 2
Stream 3
IV
701
801
901
ISV
702
802
902
GSV
703
803
903
NSV
704
804
904
Mass
705
805
905
Analog Output Assignment
4-20mA selection must be proportional and within the range of the selected parameter. The 4-20mA signal
is 12 bits.
ASS IGNMENTS:
Date: 8/1/2019
Page 76

Dynamic Fluid Measurement SFC3 Liquid Pulse Manual Data Entry 2-31
Meter-Independent Parameters
Analog Input #1
51
Analog Input #2
52
Analog Input #3
53
Analog Input #4
54
RTD Input #9
59
RTD Input #10
60
Remote Control*
63
*Note: Remote control output can be controlled through the modbus
communcation link.
Date: 8/1/2019
Page 77

Dynamic Fluid Measurement SFC3 Liquid Pulse Manual Data Entry 2-32
Flow
Rate
Batch Total
Cumulative
Total
Previous
Daily
Previous
Batch
IV
01
06
11
16
21
ISV
02
07
12
17
22
GSV
03
08
13
18
23
NSV
04
09
14
19
24
Mass
05
10
15
20
25
BS&W
46 Specific Gravity
52
Temperature
47 Specific Gravity @60°F
53
Pressure
48
API
54
Density
49
API @60°F
55
Density Temperature
50
Product
56
Density Pressure
51
Flow Computer Display Assignment
Display assignments select up to 17 assignments. The Flow Computer will scroll through them at the
assigned delay time. Active alarm will automatically prompt on the screen if alarm conditions exists. To
read active alarms, use the diagnostic screen.
Assignment
4 Digit Selection, where
1st Digit: 0: Forward 1: Reverse
2nd Digit: 1:Meter#1,2:Meter#2,3:Meter#3,
7:Stream#1,8:Stream#2,9=Stream#3
3rd and 4th Digit: Selection (see table below)
OTHER ASSIG NMENTS
3 Digit Selection, where
1st Digit: 1:Meter#1,2:Meter#2,3:Meter#3,
7:Stream#1,8:Stream#2,9=Stream#3
2nd and 3rd Digit: Selection (see table below)
Date: 8/1/2019
Page 78

Dynamic Fluid Measurement SFC3 Liquid Pulse Manual Data Entry 2-33
Dens.Frequency#1
60 Prove Mode
76
Dens.Period#1
61
Prove Temperature
77
Dens.Frequency#2
62
Prove Pressure
78
Dens.Period#2
63
Time / Date
73
Alarm
74
2 Digit Selection, where
1st and 2nd Digit: Selection (see table below)
Examples:
0116 Display Meter #1 Forward Previous Daily IV Total
0106 Display Meter #1 Forward Batch IV Total
1106 Display Meter #1 Reverse Batch IV Total
1210 Display Meter #2 Reverse Batch Mass Total
0147 Display Meter #1 Temperature
0248 Display Meter #2 Pressure
Date: 8/1/2019
Page 79

Dynamic Fluid Measurement SFC3 Liquid Pulse Manual Data Entry 2-34
Modbus Shift
Reassigns Modbus address registers on one Flow Computer to variables for easy polling and convenience.
Use Modbus Shift to collect values in scattered Modbus registers into a consecutive order. The Flow
Computer will repeat the assigned variables into the selected locations.
Note: some Modbus registers are 2 byte/16 bit, and some are 4 byte/32 bit. Register size incompatibility
could cause rejection to certain address assignments. Refer to the manual for more details and a listing of
the Modbus Address Table Registers.
Example: you want to read the current status of switches #1 and #2 (addresses 2617 and 2618) and the
Forward and Reverse Daily Gross Total for Meter #1 ( addresses 3173 and 3189). Make assignments such
as:
3082=31001
Date: 8/1/2019
Page 80

Dynamic Fluid Measurement SFC3 Liquid Pulse Manual Data Entry 2-35
REPORTS
Current Data - Snapshot Totalizer Updates
This report consists of two sections. The upper section is primarily the non-changing parameters, the
bottom section is the dynamic. Press any key to move from one section of the report to the other. Press
to pause, then press to print, or enter the file name and press to capture the snapshot data.
Previous Batch Data
Up to 12 previous batches are stored in the Flow Computer. Select number of previous batches to be
displayed, printed, or captured.
Previous Hourly Data
Up to 12 previous hourly data are stored in the Flow Computer. Enter starting hour and date, the Flow
Computer will go backward from that selected time and date. Current hour cannot be selected. Press F4 to
display, then press F5 to print, or enter the file name and press F6 to capture the Previous Hourly
Report.
Previous Daily Data
Enter start date, and the Flow Computer will move backward from the entered data and time. Up to 12
previous daily reports can be retrieved. Current day data cannot be retrieved. Press F4 to display, press F5
to print, or enter the file name and press F6 to capture the Previous Daily Report.
Previous Alarm Data
Up to 50 previous alarm data can be retrieved. Starting from the most recent alarm to the oldest alarm.
Press F4 to display, press F5 to print, or enter the file name and press F6 to capture the Previous
Alarm Report.
Date: 8/1/2019
Page 81

Dynamic Fluid Measurement SFC3 Liquid Pulse Manual Data Entry 2-36
Audit Trail Report
The audit trail report shows changed configuration parameters that could influence the calculated numbers.
The Flow Computer provides up to 100 event logs (50 pairs of new and old parameters; some zero
parameters cannot be logged). One purpose for audit trail is to backtrack calculation errors that result from
mistakes by the operator of the flow computer. Press F4 to display, press F5 to print, or enter the file name
and press F6 to capture the "Audit Trail Report".
Build User Report
One screen can be built or edited with this menu. Any text can be used. Modbus register must follow the
"^" sign in order for the program to retrieve the address location.
View User Report
To monitor the "build user report". user reports can be printed through the PC parallel port.
Formatted Ticket Report
The Flow Computer allows the user to make personal ticket report. This ticket report is just for display and
printing purposes. To make this report, user must use "Last Daily Data Area" in the Modbus registers
(3n761-3n931, 4m881-4m959, n=meter 1-6, m=stream1-3)
-3703).
Example:
DYNAMIC FLUID BATCH REPORT
METER 1 PRODUCT SELECTION ^31843
METER 1 MASS TOTAL ^31899
Results - The report will look as follows:
DYNAMIC FLUID BATCH REPORT
METER 1 PRODUCT SELECTION 3
METER 1 MASS TOTAL 34563. 2
Auto Data Retrieval
This function is made to replace printers and use a PC to poll the configured units on time basis (Hourly or
Daily). All parameters polled will be stored in the configured file name. Each unit ID will have an
individual file name. The PC or laptop must be on at the time it has to get the data, and the user must
activate that function by pressing and leaving the PC on. The data format can be either standard or user
defined format. This function is to eliminate the need for paper and make the process more
environmentally friendly. Echo to the local printer can be enabled where reports will be stored on hard
drive and printed to a parallel printer.
Date: 8/1/2019
Page 82

Dynamic Fluid Measurement SFC3 Liquid Pulse Manual Data Entry 2-37
WIRING
See the wiring diagrams in the Wiring section of Chapter 1, “Quick Start”.
To print wiring diagram, you have to run your Flow Computer software in Windows, then copy the entire
screen onto the Clipboard.
1. Type win and press ENTER (run window).
2. Point to MDOS Prompt and click.
3. Type "A:", and press ENTER.
4. Type "SFC332” and press ENTER.
5. Use arrow keys to move to Wiring and then to the desired diagram.
6. Press ALT+ENTER, then press ALT+SPACEBAR to open Control menu for the
application.
7. From the Control menu, choose Edit, and then choose Mark. A flashing rectangular
cursor appears at the upper left corner of the window.
8. Move the cursor to the first character you want to select.
9. Mark the information you want to copy, and press ENTER to transfer the selected
information onto the Clipboard.
10. Start an application (Microsoft Word), Place the insertion point at the place you want
the information from the Clipboard to appear. From the application's Edit menu,
choose Paste.
Date: 8/1/2019
Page 83

Dynamic Fluid Measurement SFC3 Liquid Pulse Manual Data Entry 2-38
PRINT
Print "Help" File
Turn on parallel printer, point the cursor to Help, press ENTER, and then press F5 to print Help file.
Print Modbus Registers
Turn on parallel printer, point the cursor to Modbus Reg, press ENTER, and then press F5 to print
Modbus registers.
Print Schematic
Turn on parallel printer, point the cursor to the Schematic, press ENTER, and then press F5 to print
schematic (Terminal Board Wiring only).
Print Calibration Data
Calibration data are programmed parameters in the data file. To print, turn on parallel printer, point the
cursor to the Calib.Data, press ENTER, and then press .
Print Files
The user can print the files that were captured. Turn on parallel printer, point the cursor to the desired file,
and then press <ENTER>.
Date: 8/1/2019
Page 84

Dynamic Fluid Measurement SFC3 Liquid Pulse Manual Flow Equations- 3-1
1000
1
10009990120
1
WaterWeight of
SG-BSW)%(LMFCPLCTL IV
WaterWeight of
.
Density
-BSW)%(LMF IV
MASS
:density live No
MASS
:applied is density live If
eraturerence tempty at refe API Graviwhere API
temp. reference atdensity Product
.API
f Water Density o .
temp. reference at expansion of Correction
K K
T - T
) (liquid on effect etemperaturfor Correction
FactorMeter Factor ionLinearizat MF LF
:Where
T
T
T
T
ReferenceActualT
TTTT
e
5131
5141
ASTM D1250
))8.0(1(-
2
10
CTL
LMF
)%1(
3600
BSWLMFCPLCTLIV
LMFCPLCTLIV
CPLCTLIV
L)(Pulses/BBFactor K Nominal
es/sec)Total(Puls
(BBL/Hr)NSV - VolumeStandard Net
(BBL/Hr)GSV - VolumeStandard Gross
(BBL/Hr)ISV - VolumeStandard Indicated
(BBL/Hr)IV - VolumeIndicated
CHAPTER 3: Flow Equations
FLOWRATES
Mass Flowrate (MASS)
Mass flow rate is calculated differently depending on whether live density data is or is not available. Both
equations give results in Lb/Hr.
Date: 8/1/2019
Page 85

Dynamic Fluid Measurement SFC3 Liquid Pulse Manual Flow Equations- 3-2
Table
Product
Type
API
Gravity
Relative
Density
K0
K1
6A,23A
Crude Oil
0-100
.6110 to 1.0760
341.0957
0.0
6B,23B
Fuel Oil
0-137
.5270 to 1.0760
103.8720
0.2701
6B,23B
Jet Group
37.1-47.9
.7890 to .8395
330.3010
0.0
6B,23B
Gasoline
52.1-85
.6535 to .7705
192.4571
0.2438
6B,23B
Between Jet
and Gasoline
48-52
.7710 to .7885
A = -0.001868
40
B =
1489.0670
factorility Compressib F
pressure mEquilibriu P
PSIG in pressure Flowing P
liquid onility compressibfor Correction
) -F(P-P
e
e
1
1
CPL
2
T
T
B
A
P
is calculated from the equations developed by Dr.R.W. Hankinson and published as
e
GPA Technical Publication No.15, unless the override value is being used.
Temperature Range: -50 F to 140 F.
Relative Density Range: 0.49 to 0.676
For F:
Use API Chapter 11.2.1 for liquids 0-90 API
Use API Chapter 11.2.2 for Hydrocarbons
Temperature Range: -50 F to 140 F
Relative Density: 0.350-0.637
K
and K1 in the above equations are physical constants from the API Manual and are given in the table
0
below for various product types. However, for products between the jet group and gasoline use constants A
and B in the following equation:
Date: 8/1/2019
Page 86

Dynamic Fluid Measurement SFC3 Liquid Pulse Manual Flow Equations- 3-3
Volume MeterCorrected
Volume Prover Corrected
CPLMCTLMVolume Meter
Factor K
Counts Total
CTLPCPLPCPSPCTSPBPV
TDVOL
BPV
BBLPulses
c)(Pulses/se Total
FactorMeter Prove
VolumeMeter Corrected
VolumeMeter
VolumeProver Corrected
3600
3600
/
:Flowrate IV Prove
:Prover Compact
:ProverPipe
provea duringprover at Pressure Avg. P whenCPL
PressureMeter of effect thefor CorrectionCPLM
provea duringmeter at Temp. Avg.T whenCTL
eTemperaturMeter ofFactor Correction VolumeCTLM
provea duringprover at Pressure Avg. P whenCPL
PressureProver of effect thefor CorrectionCPLP
provea duringprover at Temp. Avg.T whenCTL
eTemperaturProver of effect thefor CorrectionCTLP
PSIG 0 and F60 @ VolumeProver BaseBPV
Where
Actual
Actual
:
PROVE EQUATION
Note:
Additional Information refer to “API Chapter 4 and Chapter 12” that describe full terms and rules for meter
proving.
Date: 8/1/2019
Page 87

Dynamic Fluid Measurement SFC3 Liquid Pulse Manual Flow Equations- 3-4
shaft.displacer on expansion of tcoefficien thermalLinear G
chamber.prover for expansion of tcoefficien thermalArea G
etemperatur Base T
chamberprover of eTemperatur T
TTGCTSP
:Prover Pipe
)T(TG)T(TG CTSP
ON - SectionnCalibratio MountingDetector :Prover Compact
TTGCTSP
OFF - SectionnCalibratio MountingDetector :Prover Compact
etemperatur of effect thefor Correction
l
a
b
p
bpa
bplbpa
bpa
)(1
]1[]1[
)(1
CTSP
prover of thickness Wall WT
materialprover for elasticity of Modulus E
prover ofdiameter Internal ID
Pressure Base P
prover of pressure operating Internal P
WT E
P ID
CPSP :Prover Pipe
WT E
)P - (P ID
CPSP :Prover Compact
pressure of effect thefor Correction
b
b
1
1
CPSP
Date: 8/1/2019
Page 88

Dynamic Fluid Measurement SFC3 Liquid Pulse Manual Flow Equations- 3-5
Date: 8/1/2019
Page 89

Dynamic Fluid Measurement SFC3 Liquid Pulse Manual Flow Equations- 3-6
PSIG in pressure nCalibratio P
ds/PSIGmicrosecon in tcoefficien Pressure P
PSIG in pressure Flowing P
Fds/microsecon in tcoefficien eTemperatur T
dsmicrosecon in constant nCalibratio T
F e,temperatur Flowing T
ds.microsecon in period noscillatioer densitomet The t
(GM/CC) emass/volum constant, nCalibratio A D
Factor CorrectionDensity DCF
T )P - (P P )T - (T T T
:Where
T
) K(t-T
T
)(t-TD
DCF
cal
coef
coef
0
0
0calcoefcalcoef 0p
p
p
p
p
0
0
0
00
2
12
Density Corrected
DENSITY EQUATIONS
Sarasota Density GM/CC
Sarasota density is calculated using the frequency signal produced by a Sarasota densitometer, and applying
temperature and pressure corrections as shown below
Date: 8/1/2019
Page 90

Dynamic Fluid Measurement SFC3 Liquid Pulse Manual Flow Equations- 3-7
Fds/microsecon in tcoefficien eTemperatur T
F e,temperatur Flowing T
tCoefficien eTemperatur K
Offset Pressure P
Constant Pressure K
PSIG in pressure Flowing P
Factor CorrectionDensity DCF
ds.microsecon in period noscillatioer densitomet The t
Constants nCalibratio K ,K ,K
: Where
t Kt K Kd
d]) T-TK d) [K(P P DCF
cal
t
0
210
cal
(
t
-
2
210
6
0
10 Density Corrected
UGC Density GM/CC
UGC density is calculated using the frequency signal produced by a UGC densitometer, and applying
temperature and pressure corrections as shown below
Date: 8/1/2019
Page 91

Dynamic Fluid Measurement SFC3 Liquid Pulse Manual Flow Equations- 3-8
onby Solartr SuppliedConstants nCalibratio K,K,K
dsmicrosecon in Period nOscillatioer Densitomet t Where
t Kt KKD
210
2
210
Fre in TemperatuWhere T
)(T- K )(T-K DDT
68]681[
1918
nby Solarto SuppliedConstants nCalibratio , K K, KK
PKKK
PK KK
PSIG in Pressure P
:Where
P KP) K DL(DP
BABA
BA
BA
2121
,
2020
212121
202020
2120
1
range. this outside K Let
KDPKDPD
r
jrvos
0.0
)(
3
Solartron Density GM/CC
Solartron density is calculated using the frequency signal produced by a Solartron densitometer, and
applying temperature and pressure corrections as shown below.
Density at 68°F and 0 PSIG
Temperature Corrected Density
Temperature and Pressure Corrected Density
Additional Equation for Velocity of Sound Effects
The following equation can provide more accurate measurement for LPG products in the density range of
0.300 D 0.550 (D is in gm/cc).
Date: 8/1/2019
Page 92

Dynamic Fluid Measurement SFC3 Liquid Pulse Manual Modbus Data — 4-1
ASCII
RTU
DATA BITS
7
8
START BITS
1
1
PARITY
EVEN, ODD
NONE
STOP BITS
1
1
ERROR CHECKING
LRC
CRC
BAUD RATE
1200-9600
1200-9600
ADDRESS
FUNCTION
DATA
ERR\CHECK
:
2 CHAR
2 CHAR
Nx2 CHAR
2 CHAR
CR
LF
8 BITS
16 BITS
16 BITS
Nx16 BITS
16 BITS
8 BITS
8 BITS
ADDRESS
FUNCTION
DATA
CRC
8 BITS
8 BITS
Nx8 BITS
16 BITS
CHAPTER 4: MODBUS DATA
MODBUS PROTOCOL
TRANSMISSION MODE
ASCII FRAMING
Framing is accomplished by using colon (:) character indicating the beginning of frame and carriage (CR),
line feed (LF) for the end of frame
ASCII MESSAGE FORMAT
RTU FRAMING
Frame synchronization is done by time basis only. The Smart Flow Computer allows 3.5 characters time
without new characters coming in before proceeding to process the message and resetting the buffer.
RTU MESSAGE FORMAT
Date: 8/1/2019
Page 93

Dynamic Fluid Measurement SFC3 Liquid Pulse Manual Modbus Data — 4-2
FUNCTION
CODE
ACTION
01 03
Read Strings or Multiple 16 Bits
16
Write Strings or Multiple 16 Bits
EXCEPTION CODE
DESCRIPTION
01
Illegal Function
02
Illegal Data Address
03
Illegal Data Value
FUNCTION CODE
To inform the slave device of what function to perform
ERROR CHECK
LRC MODE
The LRC check is transmitted as two ASCII hexadecimal characters. First, the message has to be stripped
of the: LF, CR, and then converted the HEX ASCII to Binary. Add the Binary bits and then two's
complement the result.
CRC MODE
The entire message is considered in the CRC mode. Most significant bit is transmitted first. The message is
pre-multiplied by 16. The integer quotient digits are ignored and the 16-bit remainder is appended to the
message as the two CRC check bytes. The resulting message including the CRC, when divided by the
same polynomial (X16+X15+X2+1) at the receiver, which will give zero remainder if no error, has
occurred.
EXCEPTION RESPONSE
Exception response comes from the slave if it finds errors in communication. The slave responds to the
master echoing the slave address, function code (with high bit set), exception code and error check. To
indicate that the response is notification of an error, the high order bit of the function code is set to 1.
BROADCAST COMMAND
All units listen to Unit ID Zero, and no one will respond when the write function is broadcasted.
Date: 8/1/2019
Page 94

Dynamic Fluid Measurement SFC3 Liquid Pulse Manual Modbus Data — 4-3
ADDR
FUNC
CODE
STARTING POINT
# OF POINTS
CRC
CHECK
HI
LO
HI
LO
01
03
0C
04
00
01
C6
9B
ADDR
FUNC
CODE
BYTE
COUNTS
DATA
CRC
CHECK
HI
LO
01
03
02
00
01
79
84
ADDR
FUNC
CODE
START
POINT
# OF
POINTS
BYTE
COUNTS
DATA
CRC
CHECK
HI
LO
HI
LO
HI
LO
01
10
0C
04
00
01
02
00
01
AA
14
ADDR
FUNC
CODE
START
ADDR
# OF
POINTS
CRC
CHECK
C
10
0C
04
01
43
58
ADDR
FUNC
CODE
STARTING POINT
# OF POINTS
LRC
CHECK
HI
LO
HI
LO
:
30
31
30
33
30
43
30
43
30
30
30
31
45
42
CR
LF
ADDR
FUNC
CODE
BYTE
COUNT
DATA
LRC
CHECK
HI
LO
:
30
31
30
33
30
32
30
30
30
31
46
39
CR
LF
MODBUS EXAMPLES
FUNCTION CODE 03 (Read Single or Multiple Register Points)
RTU MODE - READ ADDRESS 3076
RES PONSE
Write Address 3076
Response
ASCII MODE - READ ADDRES S 3076
RES PONSE
Date: 8/1/2019
Page 95

Dynamic Fluid Measurement SFC3 Liquid Pulse Manual Modbus Data – 4-4
MODBUS ADDRESS TABLE – 16 BITS
ADDRESS DESCRIPTION DECIMAL READ/WRITE
3001 Unit ID 0 Inferred Read
3002 No of Stream 0 Inferred Read
3003 Gravity Unit 0 Inferred Read
3004 Meter #1 Stream Number 0 Inferred Read
3005 Meter #2 Stream Number 0 Inferred Read
3006 Meter #3 Stream Number 0 Inferred Read
3007 Meter #4 Stream Number 0 Inferred Read
3008 Meter #5 Stream Number 0 Inferred Read
3009 Meter #6 Stream Number 0 Inferred Read
3010-3012 Spare
3013 Meter #1 Polarity 0 Inferred Read
3014 Meter #2 Polarity 0 Inferred Read
3015 Meter #3 Polarity 0 Inferred Read
3016 Meter #4 Polarity 0 Inferred Read
3017 Meter #5 Polarity 0 Inferred Read
3018 Meter #6 Polarity 0 Inferred Read
3019 Spare
3020 Last Prove Report Request(1=Latest,16=Oldest)0 Inferred Read
3021-3024 Spare
3025 Reversed
3026 Meter #1 Frequency 0 Inferred Read
3027 Meter #2 Frequency 0 Inferred Read
3028 Meter #3 Frequency 0 Inferred Read
3029 Meter #4 Frequency 0 Inferred Read
3030-3034 Spare
3035 Status Input #1 Status(1=ON,0=OFF) 0 Inferred Read
3036 Status Input #2 Status(1=ON,0=OFF) 0 Inferred Read
3037 Status Input #3 Status(1=ON,0=OFF) 0 Inferred Read
3038 Status Input #4 Status(1=ON,0=OFF) 0 Inferred Read
3039 Status Input #5 Status(1=ON,0=OFF) 0 Inferred Read
3040 Status Input #6 Status(1=ON,0=OFF) 0 Inferred Read
3041 Status Input #7 Status(1=ON,0=OFF) 0 Inferred Read
3042 Status Input #8 Status(1=ON,0=OFF) 0 Inferred Read
3043 Status Input #9 Status(1=ON,0=OFF) 0 Inferred Read
3044 Status Input 10 Status(1=ON,0=OFF) 0 Inferred Read
3045 Switch output#1 Status(1=ON,0=OFF) 0 Inferred Read
3046 Switch output#2 Status(1=ON,0=OFF) 0 Inferred Read
3047 Switch output#3 Status(1=ON,0=OFF) 0 Inferred Read
3048 Switch output#4 Status(1=ON,0=OFF) 0 Inferred Read
3049 Switch output#5 Status(1=ON,0=OFF) 0 Inferred Read
3050 Switch output#6 Status(1=ON,0=OFF) 0 Inferred Read
3051 Switch output#7 Status(1=ON,0=OFF) 0 Inferred Read
3052 Switch output#8 Status(1=ON,0=OFF) 0 Inferred Read
3053 Switch output#9 Status(1=ON,0=OFF) 0 Inferred Read
3054 Switch output10 Status(1=ON,0=OFF) 0 Inferred Read
3055-3148 Spare
Date: 8/1/2019
Page 96

Dynamic Fluid Measurement SFC3 Liquid Pulse Manual Modbus Data – 4-5
MODBUS ADDRESS TABLE – 16 BITS
ADDRESS DESCRIPTION DECIMAL READ/WRITE
3149 Display Delay 0 Inferred Read
3150 Display Assignment #1 0 Inferred Read
3151 Display Assignment #2 0 Inferred Read
3152 Display Assignment #3 0 Inferred Read
3153 Display Assignment #4 0 Inferred Read
3154 Display Assignment #5 0 Inferred Read
3155 Display Assignment #6 0 Inferred Read
3156 Display Assignment #7 0 Inferred Read
3157 Display Assignment #8 0 Inferred Read
3158 Display Assignment #9 0 Inferred Read
3159 Display Assignment 10 0 Inferred Read
3160 Display Assignment 11 0 Inferred Read
3161 Display Assignment 12 0 Inferred Read
3162 Display Assignment 13 0 Inferred Read
3163 Display Assignment 14 0 Inferred Read
3164 Display Assignment 15 0 Inferred Read
3165 Display Assignment 16 0 Inferred Read
3166 Status Input 11 Status(1=ON,0=OFF) 0 Inferred Read
3167 Status Input 12 Status(1=ON,0=OFF) 0 Inferred Read
3168 Status Input 13 Status(1=ON,0=OFF) 0 Inferred Read
3169 Status Input 14 Status(1=ON,0=OFF) 0 Inferred Read
3170 Status Input 15 Status(1=ON,0=OFF) 0 Inferred Read
3171 Status Input 16 Status(1=ON,0=OFF) 0 Inferred Read
3172 Status Input 17 Status(1=ON,0=OFF) 0 Inferred Read
3173 Status Input 18 Status(1=ON,0=OFF) 0 Inferred Read
3174 Status Input 19 Status(1=ON,0=OFF) 0 Inferred Read
3175 Status Input 20 Status(1=ON,0=OFF) 0 Inferred Read
3176 Switch output11 Status(1=ON,0=OFF) 0 Inferred Read
3177 Switch output12 Status(1=ON,0=OFF) 0 Inferred Read
3178 Switch output13 Status(1=ON,0=OFF) 0 Inferred Read
3179 Switch output14 Status(1=ON,0=OFF) 0 Inferred Read
3180 Switch output15 Status(1=ON,0=OFF) 0 Inferred Read
3181 Switch output16 Status(1=ON,0=OFF) 0 Inferred Read
3182 Switch output17 Status(1=ON,0=OFF) 0 Inferred Read
3183 Switch output18 Status(1=ON,0=OFF) 0 Inferred Read
3184 Switch output19 Status(1=ON,0=OFF) 0 Inferred Read
3185 Switch output20 Status(1=ON,0=OFF) 0 Inferred Read
3186-3197 Reserved
When the event occurs, the counter will be incremented by one. (roll over at:37677)
3198 Audit Index Counter 0 Inferred Read
3199 Alarm Index Counter 0 Inferred Read
3200 Stream #1 Batch Index Counter 0 Inferred Read
3201 Stream #2 Batch Index Counter 0 Inferred Read
3202 Stream #3 Batch Index Counter 0 Inferred Read
3203 Prove Index Counter 0 Inferred Read
3204 Daily Index Counter 0 Inferred Read
3205 Hourly Index Counter 0 Inferred Read
3206 Prove Abort Index Counter 0 Inferred Read
3207 Abort Prove Command (set to 1) 0 Inferred Read
Date: 8/1/2019
Page 97

Dynamic Fluid Measurement SFC3 Liquid Pulse Manual Modbus Data – 4-6
Bit position
Status
0
Meter #1 prove run in progress
1
Meter #1 temperature out of range
2
Stream #1 batch ended flag
3
Meter #2 prove run in progress
4
Meter #2 temperature out of range
5
Stream #2 batch ended flag
6
Meter #3 prove run in progress
7
Meter #3 temperaure out of range
8
Stream #3 batch ended flag
9
10
Meter#4 temperature out of range
11
12
13
Meter#5 temperature out of range
14
15
Meter #6 temperature out of range
Meter
#1
#2
#3
#4
Aborted
Bit-0 on
Bit 2 on
Bit 4 on
Bit 6 on
Completed
Bit 1 on
Bit 3 on
Bit 5 on
Bit 7 on
Meter
#5
#6
Aborted
Bit-0 on
Bit 2 on
Completed
Bit 1 on
Bit 3 on
MODBUS ADDRESS TABLE – 16 BITS
ADDRESS DESCRIPTION DECIMAL READ/WRITE
30001 Version Number 0 inferred Read
30002 Application Tag 0 inferred Read
30003 Reserved
30004 Meter /Stream Status
30005 Prove Meter 1-4 Status
30006 Prove Meter 5,6 Status
*note:
Abort bit does not include meter factor from a completed prove was not implemented.
Date: 8/1/2019
Page 98

Dynamic Fluid Measurement SFC3 Liquid Pulse Manual Modbus Data – 4-7
Bit position
Status
0
1
Meter #1 Related Fault
2
3
4
Meter #2 Related Fault
5 6
7
Meter #3 Related Fault
8
9
10
Meter #4 Related Fault
11
12 13
Meter #5 Related Fault
14
15
Meter #6 Related Fault
Bit position
Status
0
1
2
Stream#1 Batch End Acknowledgement
3 4
5
Stream#2 Batch End Acknowledgement
6
7
8
Stream#3 Batch End Acknowledgement
9
MODBUS ADDRESS TABLE – 16 BITS
ADDRESS DESCRIPTION DECIMAL READ/WRITE
30007 Meter Related Fault
30008 Traditional Batch End Acknowledgement
Date: 8/1/2019
Page 99

Dynamic Fluid Measurement SFC3 Liquid Pulse Manual Modbus Data – 4-8
Bit position
Status
0
1
Proving Meter #1 in Progress
2
3
4
Proving Meter #2 in Progress
5 6
7
Proving Meter #3 in Progress
8
9
10
Proving Meter #4 in Progress
11
12 13
Proving Meter #5 in Progress
14
15
Proving Meter #6 in Progress
Meter
#1
#2
#3
#4
Aborted
Bit-0 on
Bit 2 on
Bit 4 on
Bit 6 on
Meter
#5
#6
Aborted
Bit-0 on
Bit 2 on
MODBUS ADDRESS TABLE – 16 BITS
ADDRESS DESCRIPTION DECIMAL READ/WRITE
30009 Proving Meter in Progress (stays ON during the entire proving)
30010 Prove Meter 1-6 Status
30011 Prove Meter 5,6 Status
*Note:
A proving process has aborted or a proving process has completed but the resulting
Meter Factor was not implemented.
Date: 8/1/2019
Page 100

Dynamic Fluid Measurement SFC3 Liquid Pulse Manual Modbus Data – 4-9
MODBUS ADDRESS TABLE – 16 BITS
ADDRESS DESCRIPTION DECIMAL READ/WRITE
30020 Flow Computer ID 0 Inferred Read/Write
30021 reserved
30022 Port 1 Modbus Type (0=RTU,1=ASCII) 0 Inferred Read/Write
30023 Port 1 Parity(0=None,1=Odd,2=Even) 0 Inferred Read/Write
30024 Port 1 Baud Rate(0=1200,1=2400,3=4800,4=9600)
30025 reserved
30026 Port 1 RTS Delay in Milliseconds 0 Inferred Read/Write
30027-30030 reserved
30031 Port 2 Select 0=RTS,1=Printer 0 Inferred Read/Write
30032 Port 2 Modbus Type (0=RTU,1=ASCII) 0 Inferred Read/Write
30033 Port 2 Parity(0=None,1=Odd,2=Even) 0 Inferred Read/Write
30034 Port 2 Baud Rate(0=1200,1=2250,3=4800,4=9600)
30035 Printer Baudrate(0=1200,1=2400,3=4800..) 0 Inferred Read/Write
30036 Port 2 RTS Delay in Milliseconds 0 Inferred Read/Write
30037 Printer Number of Nulls 0 Inferred Read/Write
30038-30085 Spare
30086 Analog #1 Input Scale Data 0 Inferred Read
30087 Analog #2 Input Scale Data 0 Inferred Read
30088 Analog #3 Input Scale Data 0 Inferred Read
30089 Analog #4 Input Scale Data 0 Inferred Read
30090 Analog #5 Input Scale Data 0 Inferred Read
30091 Analog #6 Input Scale Data 0 Inferred Read
30092 Analog #7 Input Scale Data 0 Inferred Read
30093 Analog #8 Input Scale Data 0 Inferred Read
30094 RTD #9 Input Scale Data 0 Inferred Read
30095 RTD #10 Input Scale Data 0 Inferred Read
30096 RTD #11 Input Scale Data 0 Inferred Read
30097 RTD #12 Input Scale Data 0 Inferred Read
30098 Density Input #1 Scale Data 0 Inferred Read
30099 Density Input #2 Scale Data 0 Inferred Read
30100 Spare
30101 Switch Output #1 Assign 0 Inferred Read/Write
30102 Switch Output #2 Assign 0 Inferred Read/Write
30103 Switch Output #3 Assign 0 Inferred Read/Write
30104 Switch Output #4 Assign 0 Inferred Read/Write
30105 Switch Output #5 Assign 0 Inferred Read/Write
30106 Switch Output #6 Assign 0 Inferred Read/Write
30107 Switch Output #7 Assign 0 Inferred Read/Write
30108 Switch Output #8 Assign 0 Inferred Read/Write
30109 Switch Output #9 Assign 0 Inferred Read/Write
30110 Switch Output #10 Assign 0 Inferred Read/Write
30111 Switch Output #11 Assign 0 Inferred Read/Write
30112 Switch Output #12 Assign 0 Inferred Read/Write
30113 Switch Output #13 Assign 0 Inferred Read/Write
30114 Switch Output #14 Assign 0 Inferred Read/Write
30115 Switch Output #15 Assign 0 Inferred Read/Write
30116 Switch Output #16 Assign 0 Inferred Read/Write
30117 Switch Output #17 Assign 0 Inferred Read/Write
Date: 8/1/2019
 Loading...