

Page 1

DYNAMET 5
Weather Station
User Manual v. 1.1
Page 2

Dynamet 5
1
Copyright 2016 Dynamax Inc
All Rights Reserved
Version 1.1
This manual refers to Lascano-Van Bavel ETP computation algorithm, implementation of the algorithm in
Dynamet 5 weather station, including PC400 data logger support software for Dynamet 5 Weather
station.
Specifications are subject to change. Dynagage is a new product for experimental purposes under
development. DYNAMAX Inc assumes no liability for customer assistance, infringements of patents or
copyrights arising from the use of this product. US Patents covering the construction of various stem flow
gauges are No 5,337,604 and 5,269,183. DYNAMAX does not warrant or represent that any license,
either express or implied, is granted under any patent right, copyright, or other intellectual property right
of DYNAMAX relating to this product, or process. There are no implied warranties of merchantability or of
fitness for a particular purpose given with the sale of any goods. DYNAMAX Inc shall not be liable for
consequential, incidental or special charges.
Dynagage, Dynamet, Flow32, Flow32W and Dynamax are trademarks of Dynamax Inc
Lascano-Van Bavel ET algorithm and CR200/CR1000 (Dynamet) program for the same are copyrights of
Dynamax Inc.
IBM is a registered trademark of International Business Machines
PC208W PC400 and LoggerNet are trademarks of Campbell Scientific Inc
Windows, Windows 95, Window 98, Windows NT, Windows2000, Windows Millennium, Microsoft Office,
Microsoft Excel are trademarks of Microsoft Corporation.
Updated: 5/12/2017
Page 3

Dynamax Inc
2
Page 4

Dynamet 5
3
Wind direction
sensor
SC32B
Voltage
Regulator for
Solar panel
Internal
battery
12V, 5 AHr
Includes documentation for Lascano-van Bavel RCM ET computation algorithm. Programs
written and algorithms verified by
Dr. Robert J. Lascano
Dr. Cornelius van Bavel,
Michael van Bavel, BSEE
Sai P. Gonuguntla, MSEE
Program and algorithms, Copyright, Dynamax, Inc., 2006
Portions of the manual are courtesy of Campbell Scientific, Inc and are subject to Copyright ©
2016, Campbell Scientific, Inc.
Trademarks used are property of their respective owners.
Page 5

Dynamax Inc
4
Page 6

Dynamet 5
5
TABLE OF CONTENTS
1.0 INTRODUCTION TO DYNAMET 5 ............................................................................................... 7
1.1 Unpacking, Bill of materials ........................................................................................................ 8
1.1.1 Bill of materials ...................................................................................................................... 9
1.2 Communication Options ............................................................................................................ 10
2.0 SOFTWARE INSTALLATION ...................................................................................................... 11
2.1 PC400 Installation ...................................................................................................................... 12
2.1.1 Working Directory Location ................................................................................................ 13
2.2 Lascano-VanBavel ET program for Dynamet 5 ..................................................................... 14
3.0 DYNAMET 5 AND SENSOR INSTALLATION ........................................................................... 15
3.1 List of Tools required ................................................................................................................ 16
3.2 Dynamet 5 and Tripod Installation .......................................................................................... 19
3.2.1 Tripod Installation: ............................................................................................................... 20
3.2.2 Solar Panel Installation ........................................................................................................ 22
3.2.3 Install Dynamet 5 Enclosure ................................................................................................ 23
3.3 Sensor Installation ...................................................................................................................... 24
3.3.1 MaxiMet (GMX500) ............................................................................................................ 24
3.3.2 Solar Radiation (LI200S) ..................................................................................................... 28
3.3.3 Rain Gauge (TE525) ............................................................................................................ 30
3.3.4 Soil Temperature Sensor (TM-10) ....................................................................................... 31
3.3.5 Soil Moisture Sensor (ML3 – Theta Probe) ......................................................................... 31
4.0 Lascano-VanBavel ETP Program .................................................................................................. 32
4.1 Application of ETP Information ............................................................................................... 32
4.2 ET Program Basics .................................................................................................................... 34
4.2.1 Elevation and Average Barometric Pressure Calculation .................................................... 34
4.3 ET Variables and complete algorithm ..................................................................................... 35
4.4 CR1000 Program for Dynamet 5 and ET computation .......................................................... 37
4.5 Customizing the Program.......................................................................................................... 39
5.0 USING PC400 ................................................................................................................................. 42
5.1 Setup, Program Logger And Communications ....................................................................... 42
5.2 Connect To Logger ..................................................................................................................... 45
Page 7

Dynamax Inc
6
5.3 Monitor Data In Real Time ....................................................................................................... 46
5.4 Data Collection ........................................................................................................................... 47
5.5 Advanced PC400 Features ........................................................................................................ 49
5.5.1 View data and Graphics ....................................................................................................... 49
5.5.2 SHORT CUT/ SCWIN ......................................................................................................... 49
5.5.3 CRBasic – Program Editor ................................................................................................... 49
6.0 DATA FORMAT, VIEW AND GRAPHS ...................................................................................... 50
6.1 File Format ................................................................................................................................. 50
6.2 Dynamet 5 Data Format ............................................................................................................ 51
6.3 Open Data – Using “View” ........................................................................................................ 53
6.4 Open Data – Using EXCEL ....................................................................................................... 55
7.0 COMMUNICATIONS .................................................................................................................... 57
7.1 RF Modem (RFMX) ................................................................................................................... 59
7.1.1 Specifications ....................................................................................................................... 60
7.1.2 List of Hardware .................................................................................................................. 60
7.1.3 Programming ........................................................................................................................ 61
7.1.4 Antenna/ Tower .................................................................................................................... 61
7.1.5 Host Modem Installation ...................................................................................................... 62
7.1.6 Remote Station Installation .................................................................................................. 62
7.1.7 Use of Repeater .................................................................................................................... 63
7.2 Dual band cellular wireless Modem (GSM)............................................................................. 64
7.3 Short-haul Modem (SHM) ........................................................................................................ 67
7.3.1 Specifications ....................................................................................................................... 67
7.3.2 Hardware Configuration....................................................................................................... 68
7.3.3 Troubleshooting ................................................................................................................... 68
7.4 Modes of Communication ......................................................................................................... 69
7.4.1 Modes of Configuration ....................................................................................................... 69
7.4.2 A sample large scale setup ....................................................................................................... 72
Appendix A: LASCANO-VAN BAVEL ITERATIVE ET ALGORITHM ................................................ 75
Appendix B: REFERENCES ..................................................................................................................... 77
Appendix C: SENSOR SPECIFICATIONS .............................................................................................. 78
Page 8
Dynamet 5
7
1.0 INTRODUCTION TO DYNAMET 5
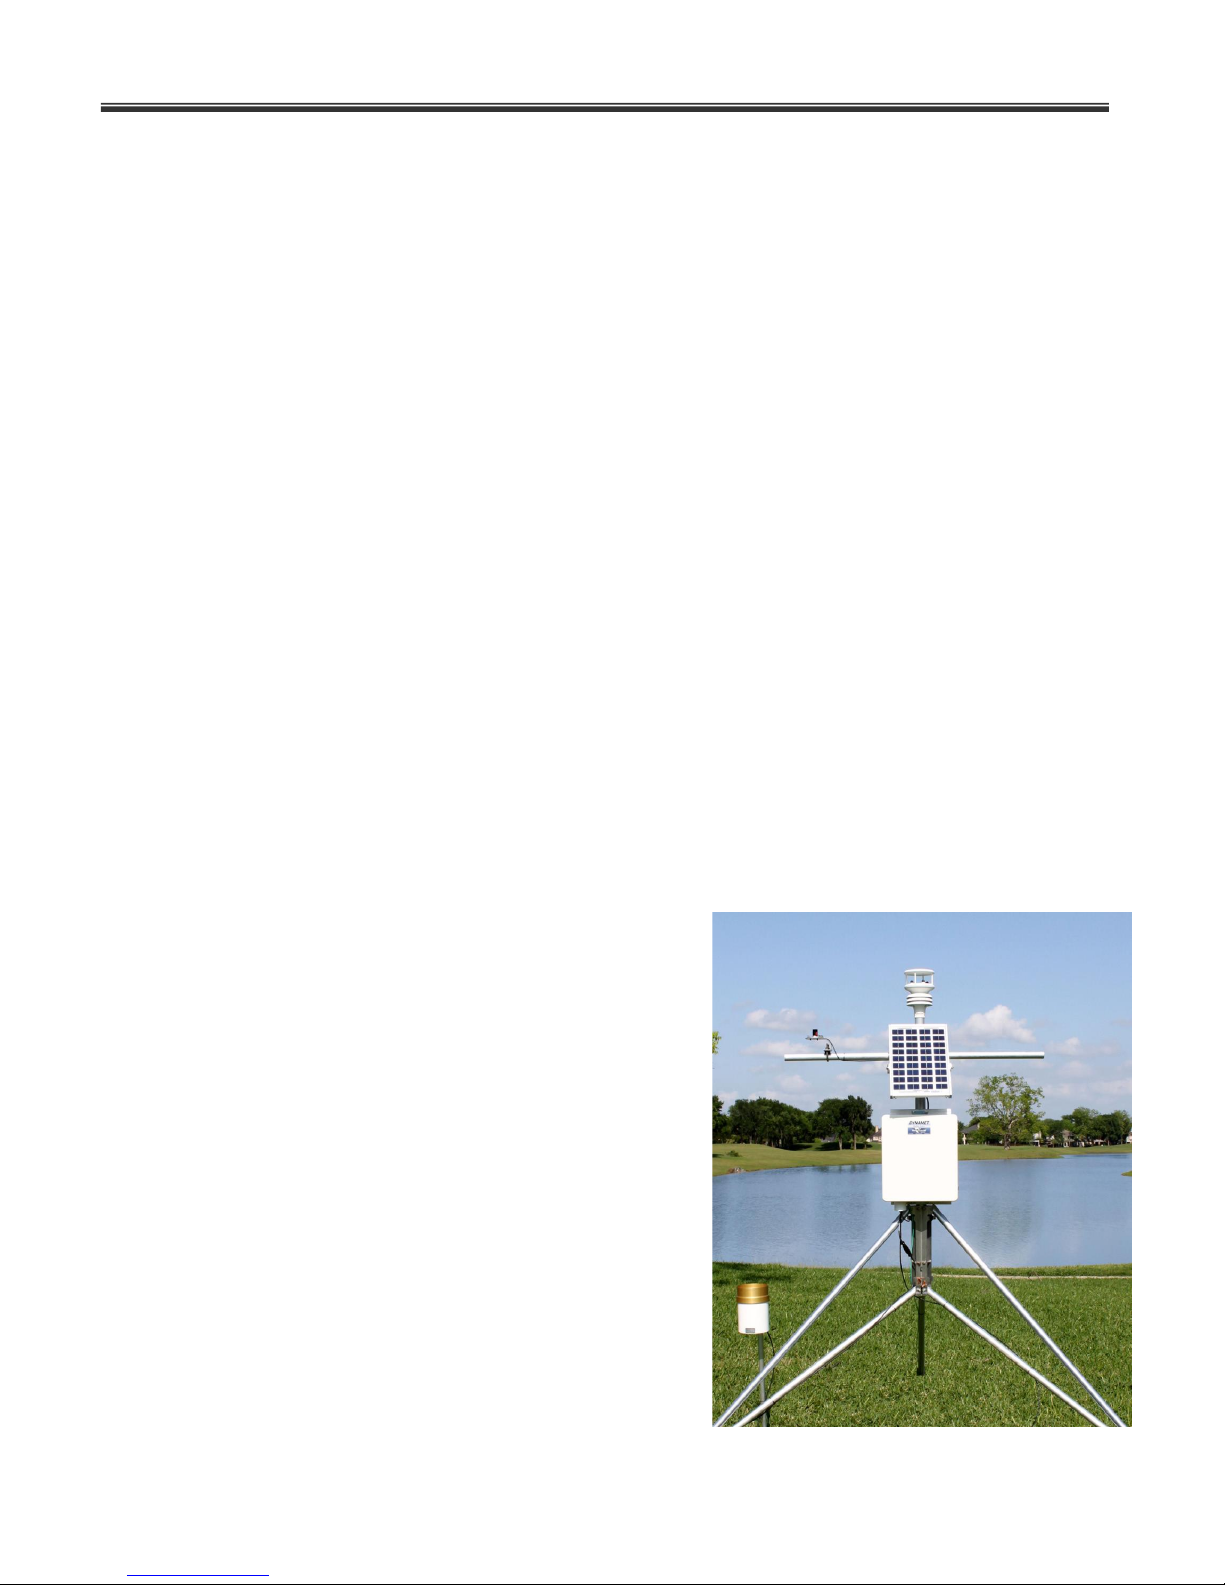
The Dynamet 5 weather station is completely pre-wired, and assembled in a weatherproof
enclosure, including software to read data from weather sensors. Data is collected and stored in
the data logger non-volatile memory. Up to 500,000 records (180 days) can be stored in the
data logger. A block diagram of Dynamet 5 weather station logger is shown on the following
page. Data logger and weather sensors are installed on a 6ft. (2 m) tripod with collapsible legs,
ground stakes, and slide collars for leveling. A crossbar is used for mounting the wind set,
pyranometer and leveling stand, and a 12-plate radiation shield for RH/temperature probe are
installed as shown in the figure below. Grounding rod, Lightening arrestor, and ground rod
cables are required to protect system from lightening surges. The Dynamet 5 weather station is
a specially designed automated system to record the critical weather parameters affecting the
growth and harvest yield of crops.
Each station includes software for weather data retrieval, and RCM ETP algorithm, LascanoVan Bavel Evapotranspiration (ETP), for computing ETP in mm/hr, with daily water use. Crop
growth models and Crop Water Index are developed with this information for grower
applications of irrigation, pest control, and performing the optimum harvest. Many other crop
manager decisions can benefit from the hourly weather records, and current information.
Standard evapotranspiration modeling software is packaged with the Dynamet 5 weather
station. The purpose is to compute the potential evapotranspiration from short grass (ETP) in
mm per hour on an hourly basis. A daily total in mm is also computed. The algorithms are based
on the method originally proposed by Penman, but with several modifications by Dr. C.H.M. Van
Bavel and Dr. Robert J. Lascano, that updated the procedure.
Dynamet 5 system Features
Portable 2 meter (6 ft) tripod,
o 3 meter (10 ft) optional
Sealed enclosure
MaxiMet GMX500 Weather Station
Ultrasonic wind speed & direction
Built in ETo iterative RCM calculation
CR1000 data logger
10 Watt solar panel, mast mounted
Battery and charger circuit
Scientific grade weather sensors
500,000 data values in recorded data memory
2MB Total program and storage memory
RS-232 Interface, USB and PC 9-pin cable (3m)
Power Up Program Start
PC400 support software
Mast - Enclosure specifications
Page 9
Dynamax Inc
8
1.1 Unpacking, Bill of materials
Using the following bill of materials, open the cartons and check off the items to see that all
material was received in good condition. Notify Dynamax no later than 10 days after receipt if
there are any discrepancies. Notify the shipper and Dynamax immediately if goods are
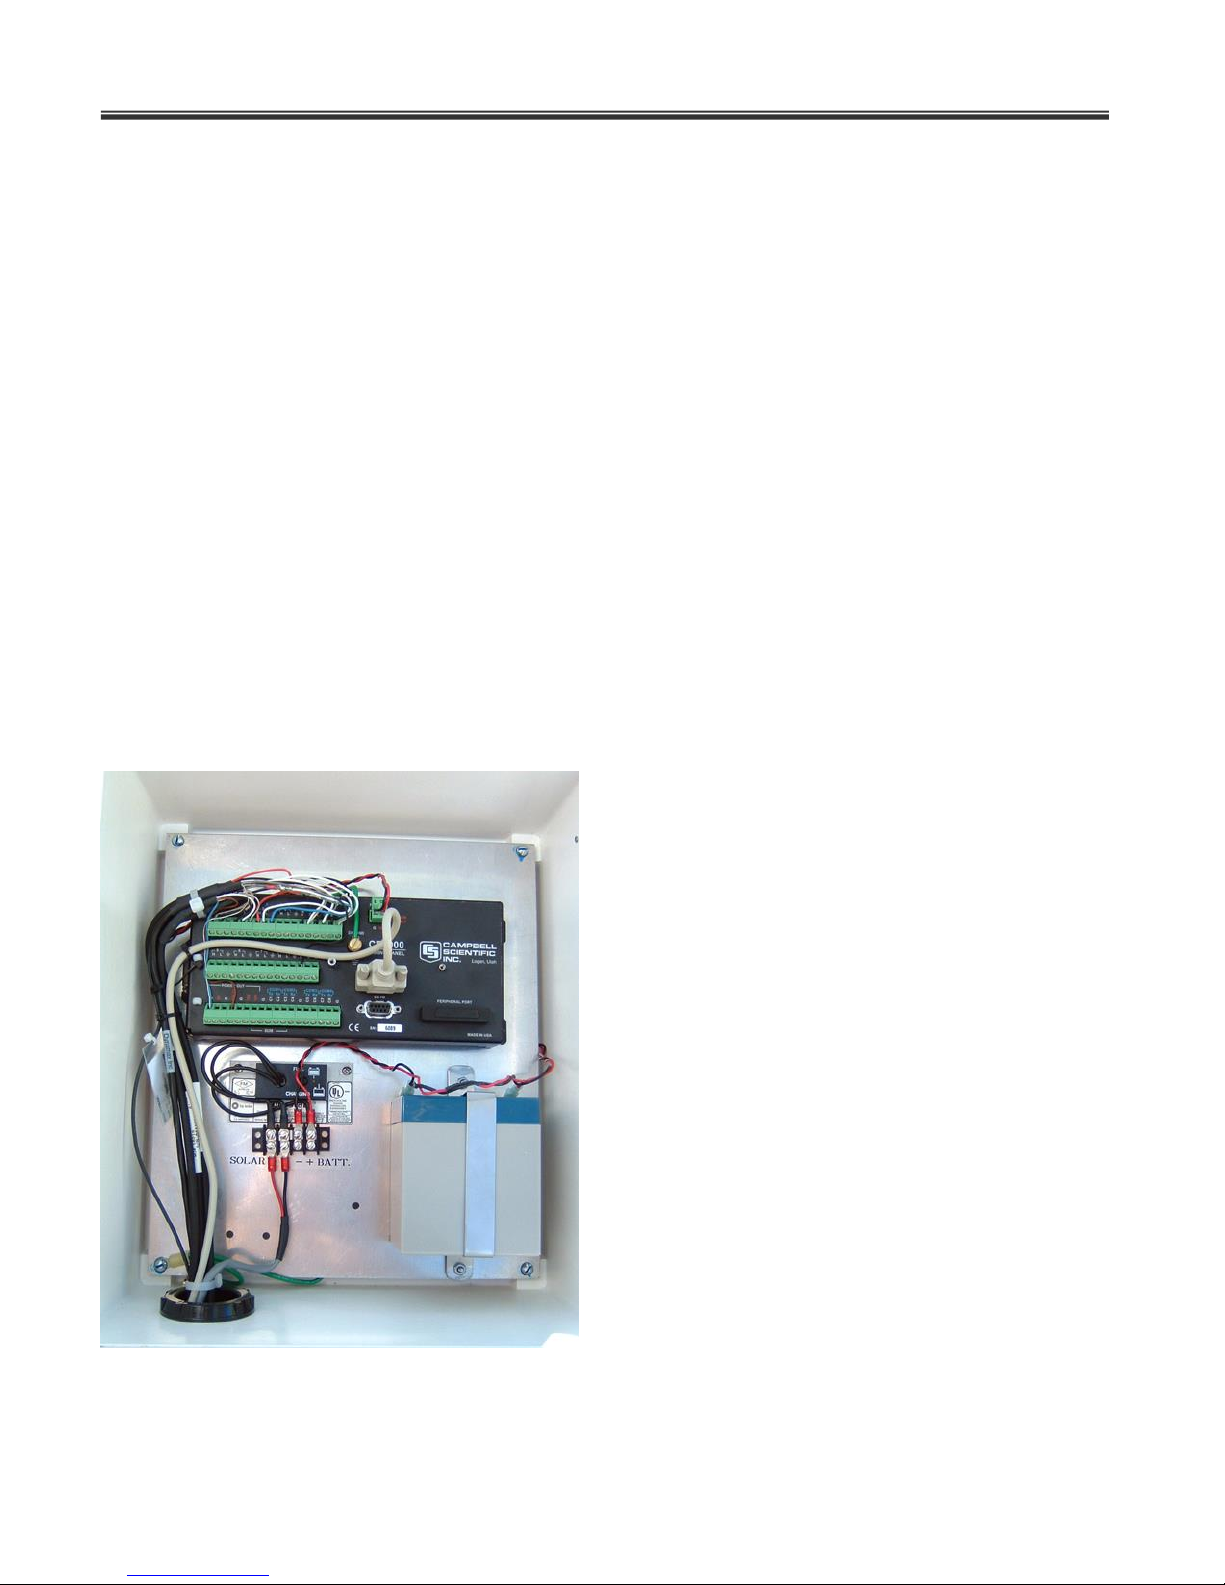
damaged in transit by mishandling. The white Dynamet 5 enclosure contains the CR10000
logger, voltage regulator for solar panel (some times voltage regulator may be installed at the
back of the solar panel). Sensor cables with sensors installed on the end, and 5' RS232
interface cable, exit from the bottom of the system enclosure. Each sensor lead is labeled with a
sequence number.
Be careful at all times not to step on or otherwise bend the gage connector leads.
A CD Rom Containing your programs includes:
PC400 software supplied with Dynamet 5 systems. A PC400 manual is included in a pdf form.
Dynamet 5 data logger programs directory with the standard program, and a test program.
A directory with your custom program tuned for your weather application, to run the logger with
additional sensors, and a specific solar sensor supplied for your weather station.
Page 10

9
1.1.1 Bill of materials
1. CM106 – 10ft Tripod with Grounding Kit
2. Mounting arm – Cross Mount
3. LI200S Pyranometer Sensor
4. LI2003s Pyranometer Leveling Base
5. Pyranometer Mounting Stand
6. CR1000 Data Logger
7. GM500 MaxiMet – Ultrasonic Wind Speed, Wind Direction, Relative Humidity,
Temperature, Barometric Pressure, Dew Point
8. 6ft SDI-12 Cable
9. TE525 Tipping Bucket Rain Gage with 25ft lead
10. TM10 Soil Temperature Probe
11. 10W Solar Panel & Mounts
12. 5Ahr, 12V Battery
13. Enclosure 10 x 8 Mounting Brackets & Hardware
14. Serial (RS232) to USB Adapter
15. 1” SCH40 Aluminum Pipe x 48”
Dynamet 5
Page 11

Dynamax Inc
10
1.2 Communication Options
Dynamet 5 weather station based on CR1000 logger offers a variety of communication choices
of user to connect between logger and PC using PC400 or LoggerNet for advanced network
applications. Optional RS232, 150 to 250 ft RS232 extension cables can be added for direct
communication at 1200 baud. In addition, Dynamet 5 supports remote communication options
given below with easy to use software features.
(Model DNX9600) Landline Modem for remote field retrieval and control:
Customer provides telephone connections and PC MODEM (Hayes compatible) at computer
location. Many models are supported by the telecommunication software package included in
PC400 or LoggerNet.
(Model: SHM) Short haul modem for communication using 4-wire cable:
For cable communication of up to 4Miles not possible using 9-wire serial cable. DIP switch
selectable. Easy to install and establish communication. Short-haul modems are line-powered,
i.e. powered from communicating device PC or Data Logger. Refer to sections 8.2 for a detailed
discussion on Modem setup and hardware required.
(Model: RFMX) Radio Modem 900 MHz/ 2.4GHz:
Stand-alone radio modems provide efficient and low-cost serial communication to remote
installations for long distances of up to 40 Miles @ 9600 baud rate. RFMX modems allow pointto-point and point-to-multi-point configurations between central PC and multiple data loggers
connected to it. RFMX modems can be setup using PC400 or LoggerNet software. RFMX is
also offered in a modem kit (Model: RFMXMK) with surge protector, high-gain antenna,
connectors assembled in a weatherproof enclosure, and optional solar panels for continuous
powering the modem. Refer to sections 8.1 and 8.3 for a detailed discussion on Modem setup
and hardware required. For frequency (product) selection suitable to your project contact a
Dynamax representative.
(Model: GSM) Dual-band GSM Cellular modem (900/1800, 850/1900):
GSM cellular modem for serial data rates of up to 115,200 bps, using a cellular network where
available. GSM modem is very low power modem with 5 Ahr battery capacity of 33Hours of
communication and 20Days on idle. GSM modem installed in remote site can be connected to
PC using a 56K landline modem (Model: DNX9600) and telephone network. GSM-CMK is a
cellular modem kit that includes modem, surge protector, antenna and 15' long antenna cable
assembled in a weatherproof enclosure, optional solar panels for continuous powering the
modem. Software setup for GSM modem is same as that of Data Modem. For frequency
(product) selection suitable to your project contact a Dynamax representative.
Page 12

Dynamet 5
11
2.0 SOFTWARE INSTALLATION
Dynamet 5 is a completely integrated weather station capable of reading a variety of scientific
grade weather sensors. Sensor readings are then stored in data loggers memory of 1MB
memory. In addition removable storage modules are available for expanding the available data
memory. Data from the logger is available for down load using data logger support software.
Down loaded data from the logger contains measurements from individual sensors at the
interval defined in the program and calculated ETP in mm/hour using Lascano-Van Bavel
Evapotranspiration (ETP) algorithm on an hourly basis and accumulated daily ETP mm/day.
Dynamet 5 weather station is based on CR1000 data logger. Hence can be operated using any
of the following data logger support software,
PC400
LoggerNet
For Procedure to connect, program download data refer to chapter 5. In this manual we
describe working with Dynamet 5 weather station using PC400. As described above full
capabilities of Dynamet 5 weather station is obtained by using two sets of software programs,
1. Data logger support software - PC400 (Logger Net software for advanced
applications
2. Data logger program Dynamet 5.cr1 to load in to CR1000 data logger for reading
variety of weather sensors, compute weather data from electrical measurements
and store to logger memory.
3. In addition custom weather station configurations may require a modified version
of Dynamet 5.cr1 program.
Page 13
Dynamax Inc
12
2.1 PC400 Installation
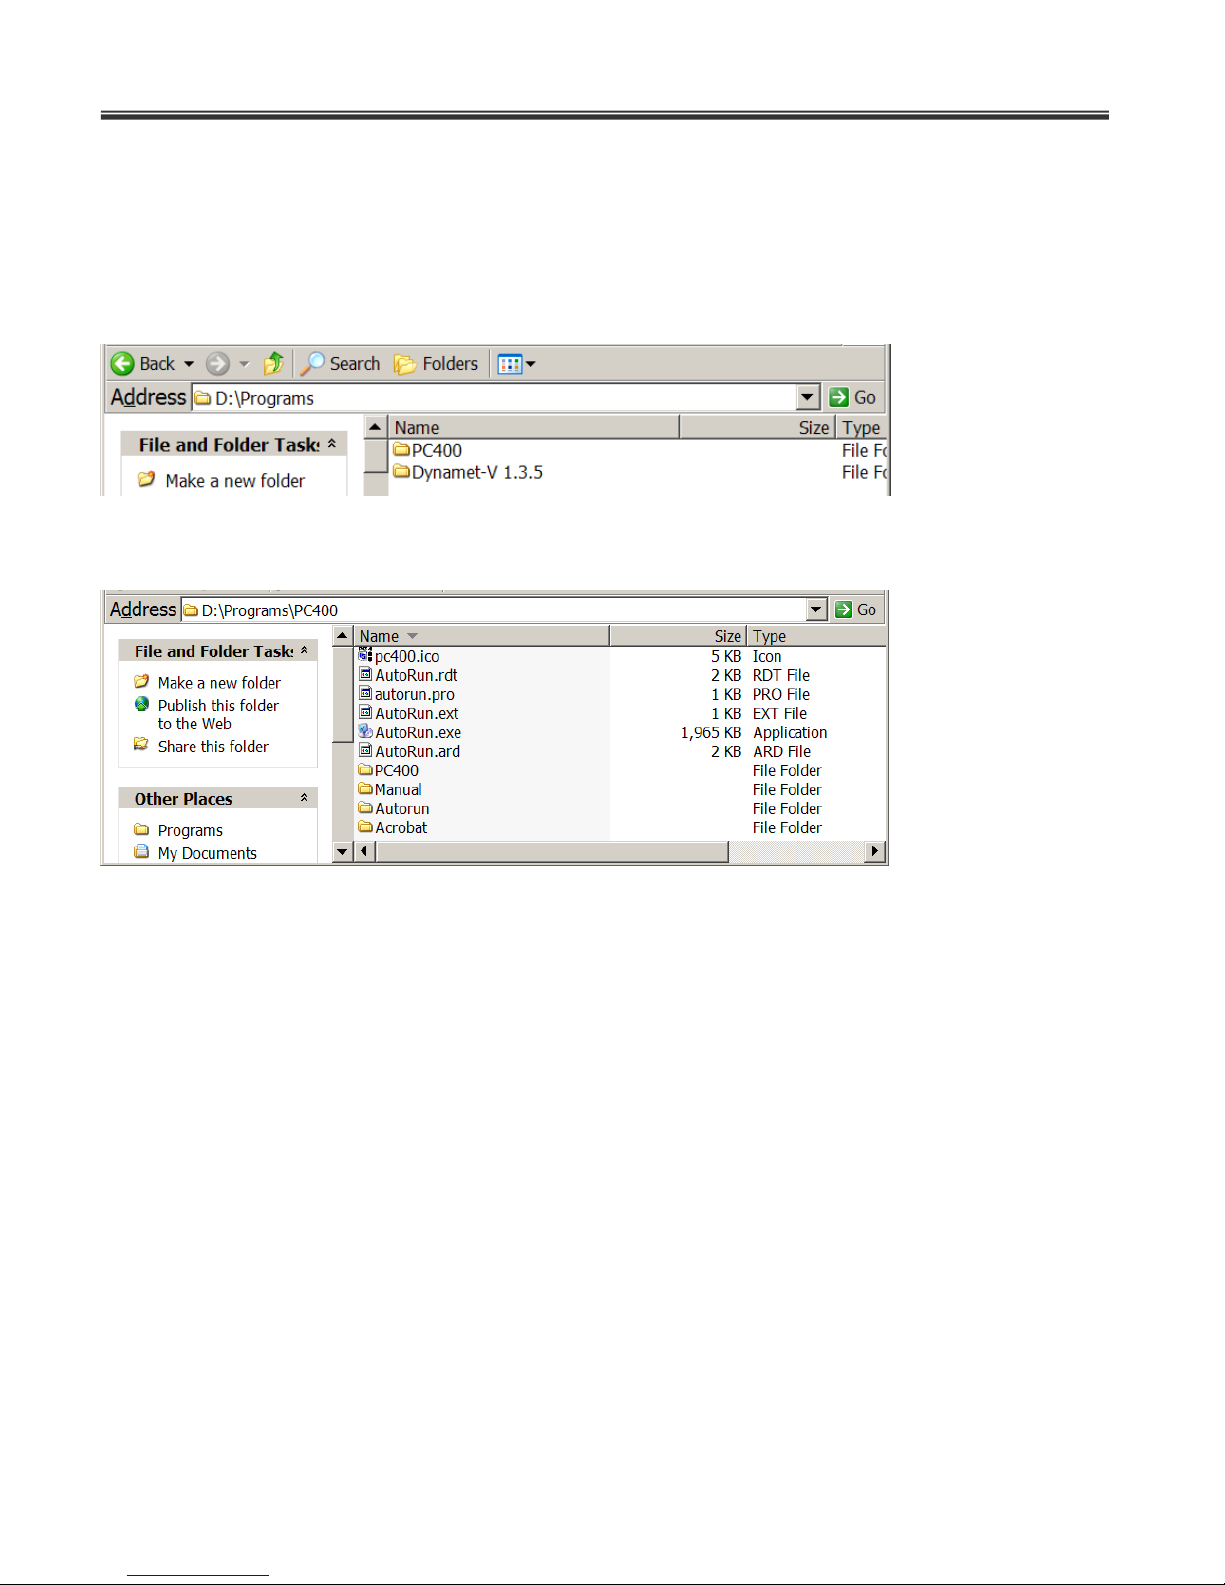
PC400 Logger utilities software is provided in a CD-ROM. Insert the CD into the CD-ROM. It
should automatically present the installation panels. If it does not then open windows explorer
(My Computer) to view the following list of files on the install CD.
Enter the PC400 Directory, click on it.
Then find the installation autorun icon.
Double click on autorun.exe to launch the installation. The installation wizard will guide you
through the process. Any of these directories can be used for installation.
C:\CampbellSci\Program Files\PC400 (Default install directory) or
D:\CampbellSci\Program Files\ PC400 or
E:\CampbellSci\Program Files\ PC400 or
C:\CampbellSci\ PC400 or
D:\CampbellSci\ PC400 or
E:\CampbellSci\ PC400
Refer to next page for working directory installation.
Page 14
Dynamet 5
13
2.1.1 Working Directory Location
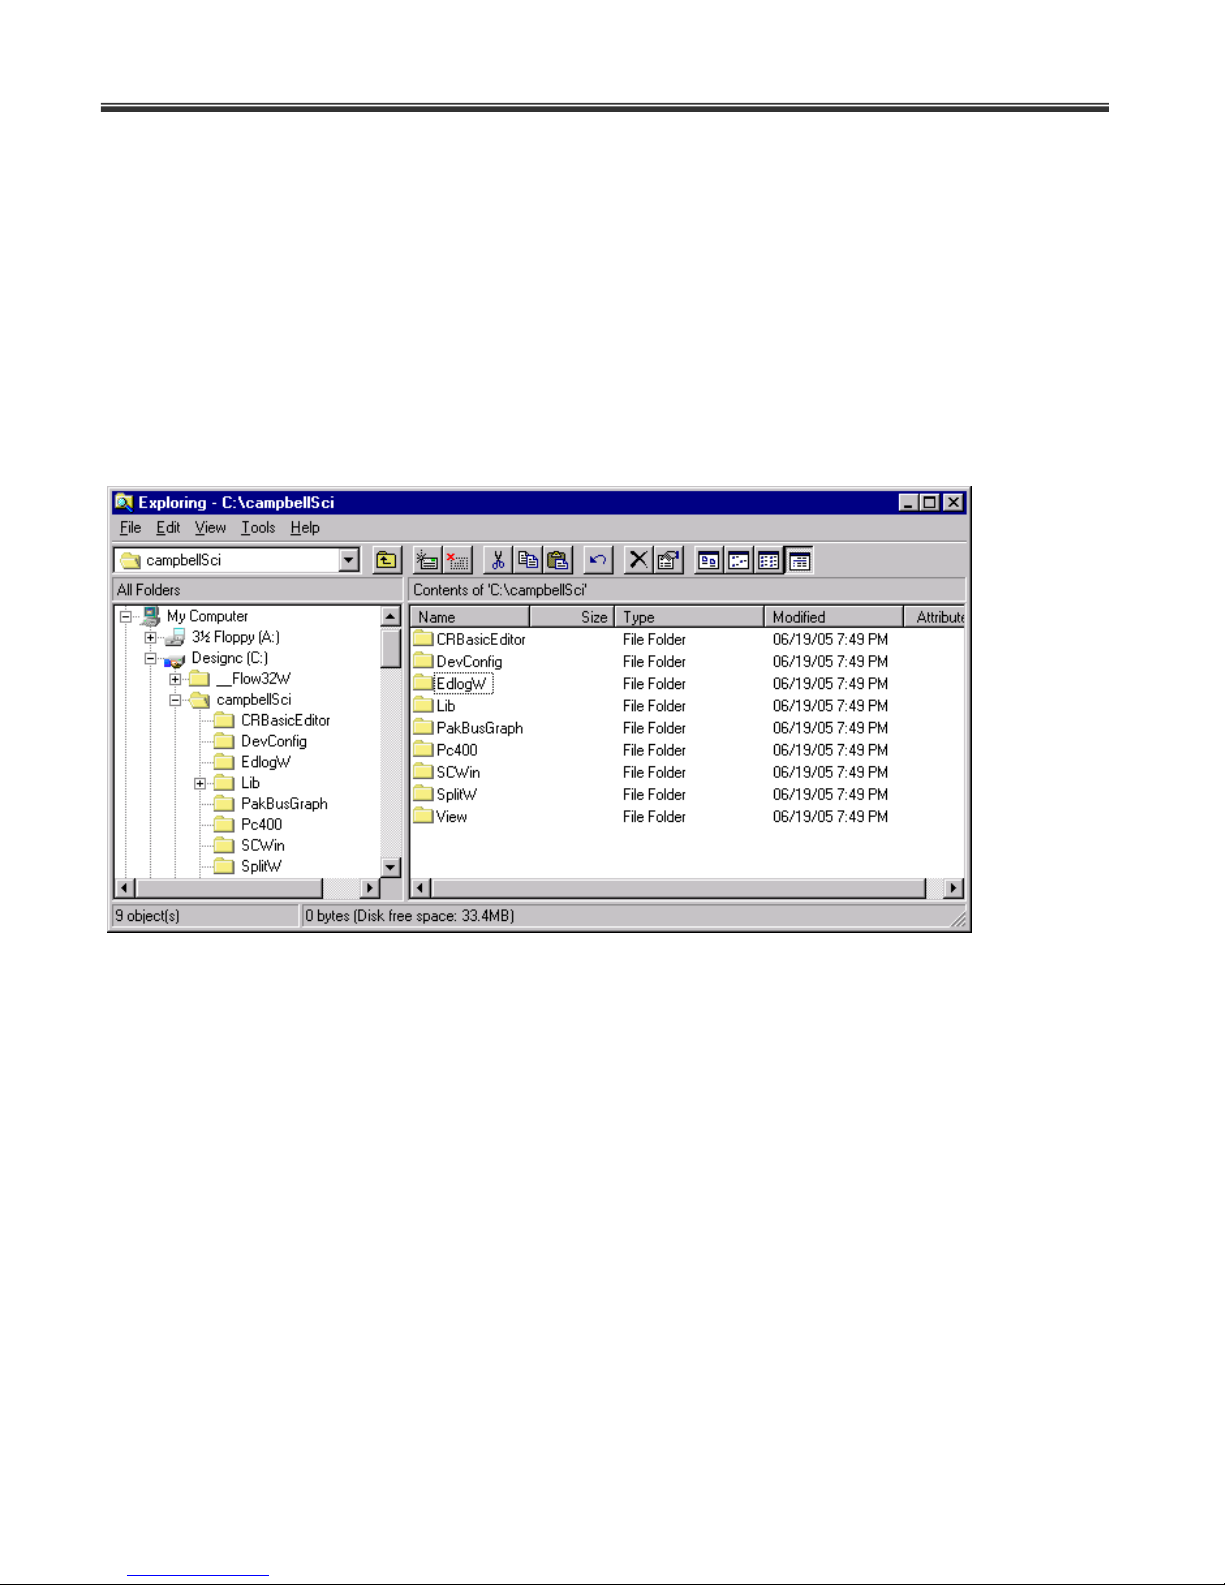
PC400 install wizard prompts for working directory location. By default working directory is
C:\CampbellSci\PC400\
This can be changed by specifying a different path location on the hard-drive. Location of
working directory will not affect the operation of PC400 or Flow32w software. This directory
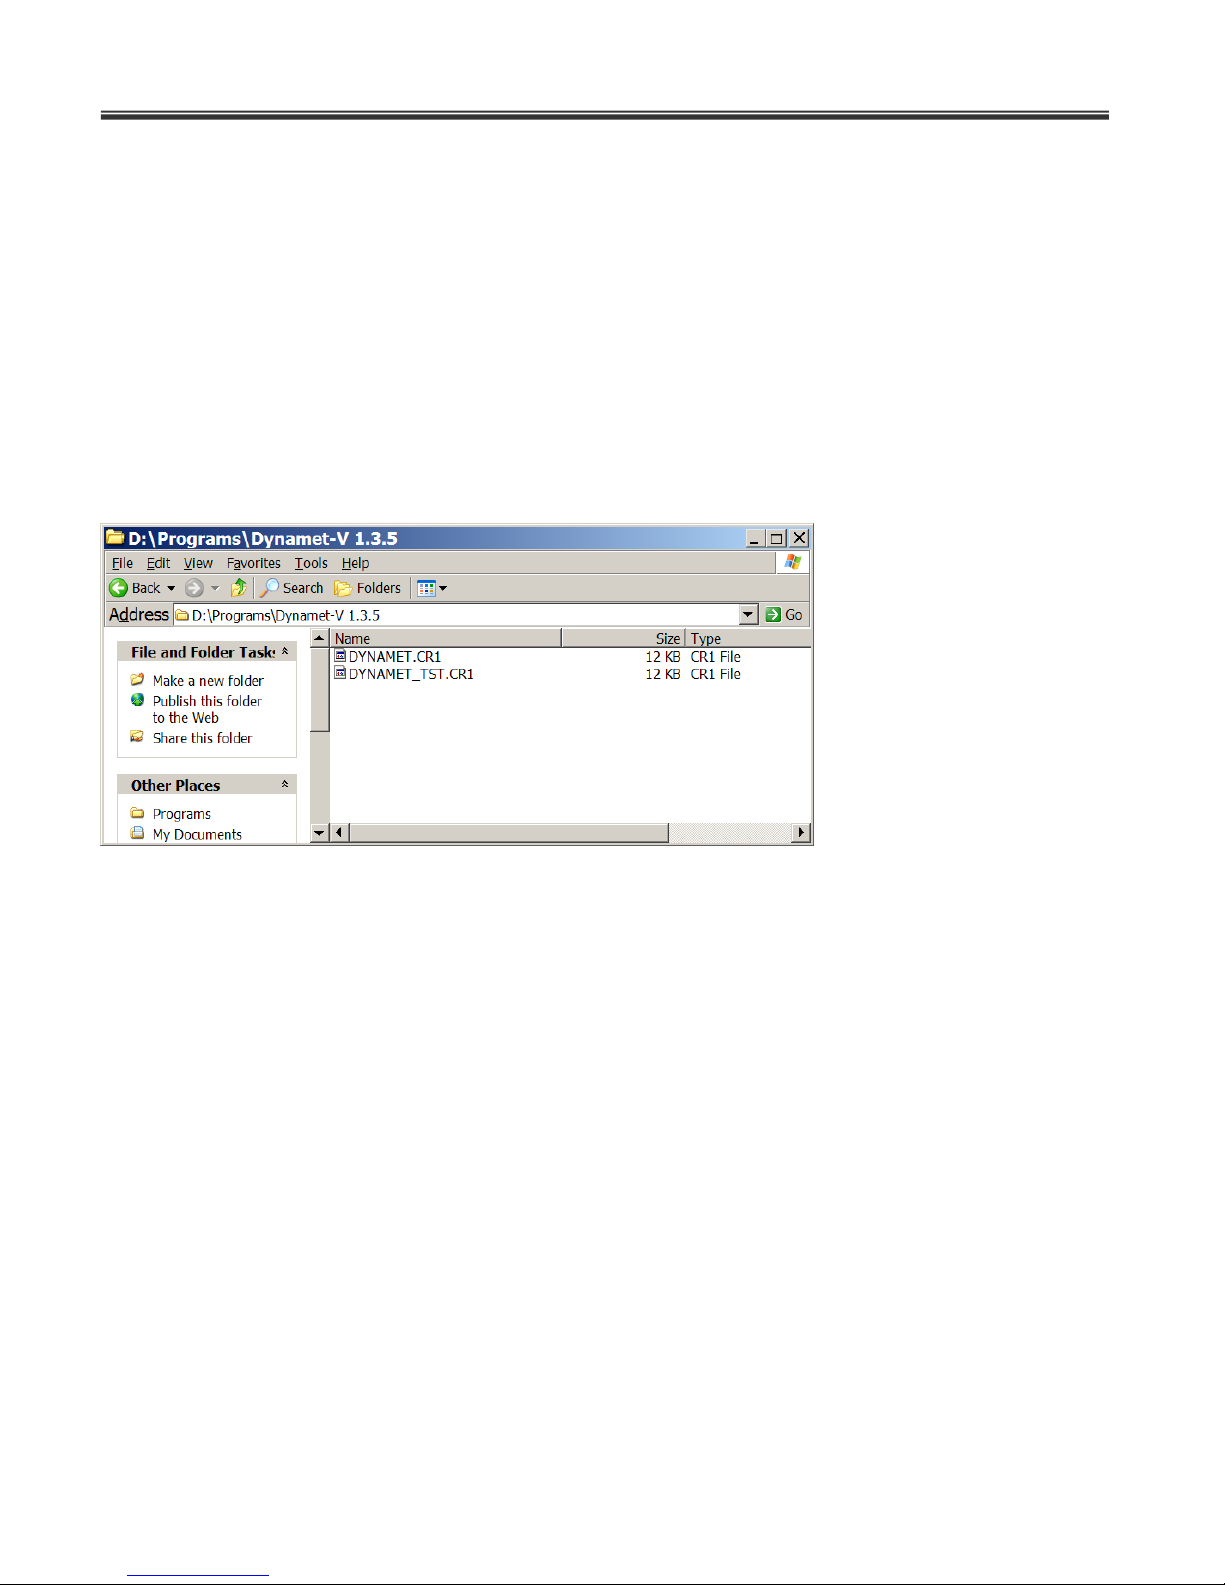
stores temporary files. Following is a typical list of working directory when working directory and
PC400 executables are stored in different locations.
Page 15
Dynamax Inc
14
2.2 Lascano-VanBavel ET program for Dynamet 5
Each Dynamet 5 station is supplied with a standard Dynamet 5 program Dynamet 5.cr1 and a
test program Dynamet 5Tst.cr1. These programs are supplied in a CD along with the system.
Dynamet 5.cr1 program is loaded into the logger before it is shipped out. Copy Dynamet 5.Cr1
and Dynamet 5Tst.Cr1 programs to the PC and save them to a preferred location on the PC.
These are READ ONLY files. Any changes to these files are not allowed; you can make
changes in the CRBasic editor and save the modified program with a new file name.
In addition if the Dynamet 5 system shipped is a custom one, with additional soil moisture
sensors etc., these are shipped with custom programs Dynamet 5Cust1.Cr1 and Dynamet
5Cust1Tst.Cr1 or similar names in a CD disk.
Create a directory for your weather station control program, and data retrieval location called:
C:\\Dynamax\Dynamet 5\
Copy the contents of CD ROM Dynamet 5-V 1.X.X shown above to:
C:\\Dynamax\Dynamet 5\
If you wish to have an on-line manual, copy the .pdf file in the CD root directory to your directory
above as well.
Page 16

Dynamet 5
15
3.0 DYNAMET 5 AND SENSOR INSTALLATION
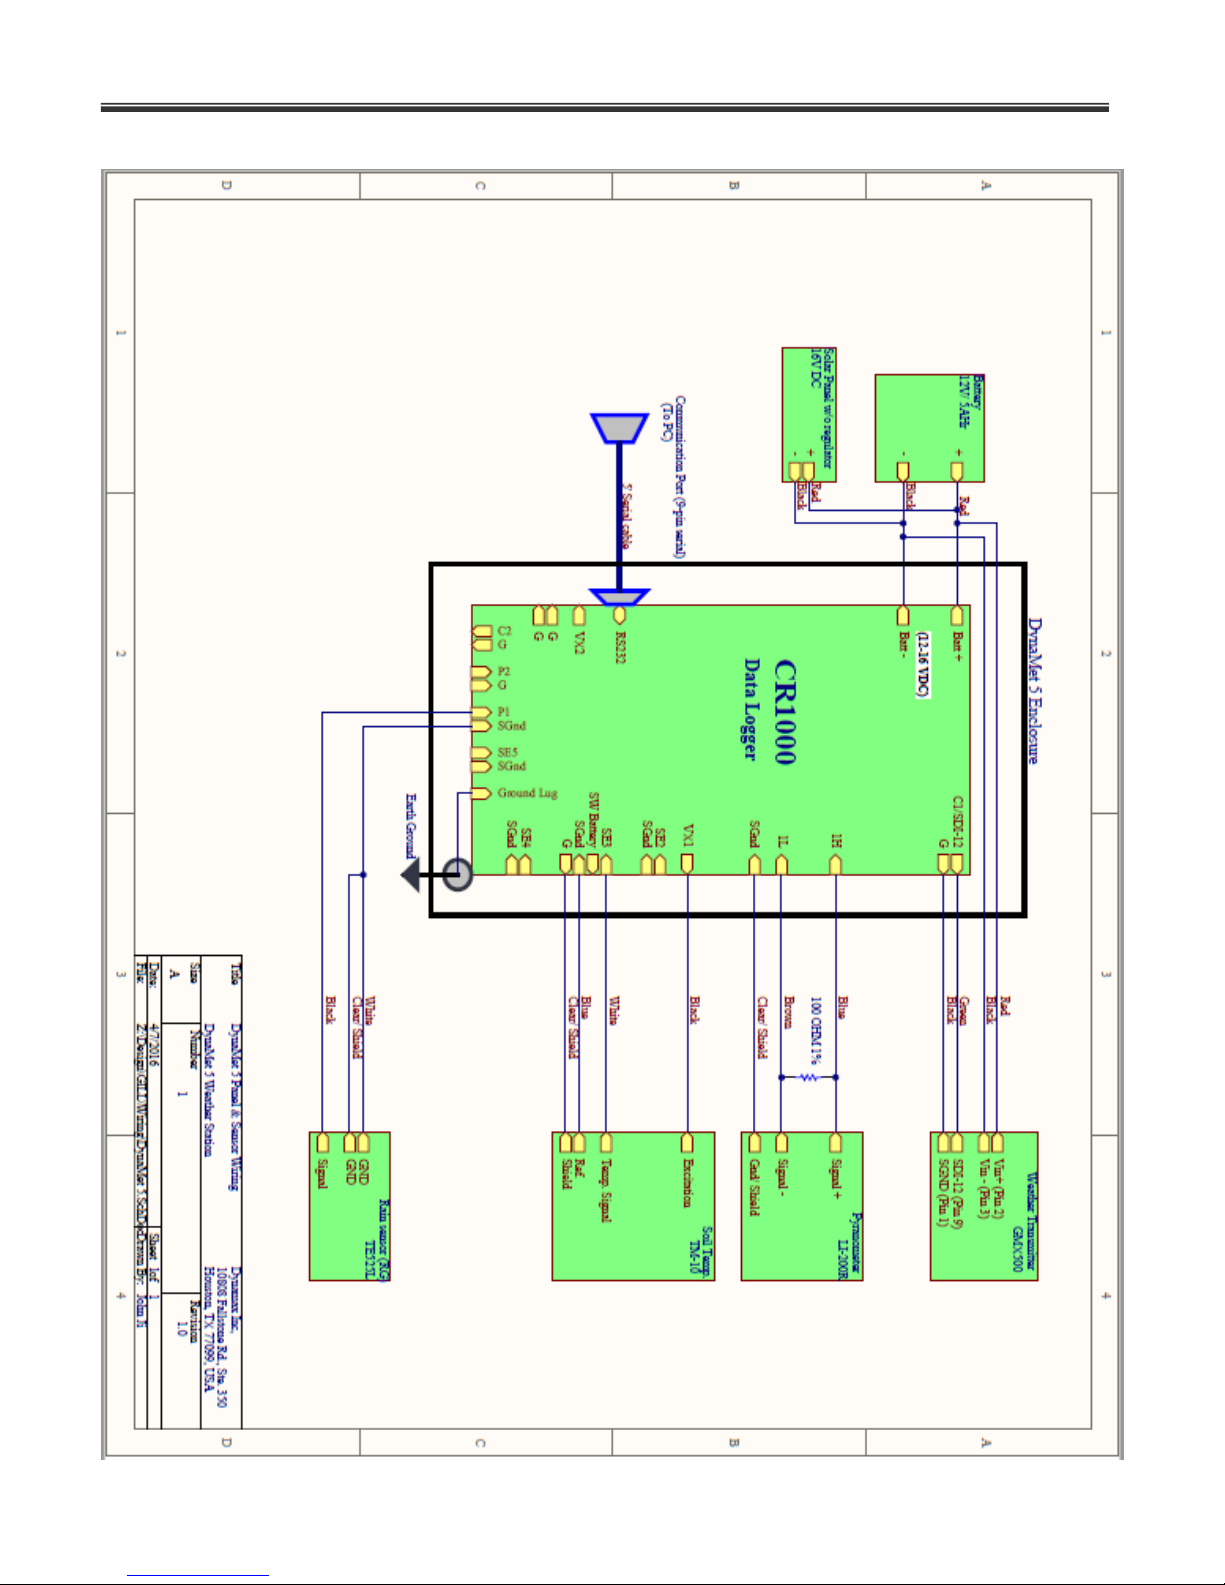
Dynamet 5 weather station is completely integrated system with data collection/ processing and
storage unit along with basic meteorological sensors. Dynamet 5.cr1 program supplied with the
system can read all the basic weather sensors (solar radiation, air temp., RH, Wind speed, wind
direction, rain gauge, soil temp., soil moisture), process data according to the applied algorithms
and constants, compute ETP and store in data loggers memory for retrieval at a later time. At
the time of order can be added to the Dynamet 5 weather station and these custom stations will
be assembled and programmed with a custom program before the units are shipped from our
factory. So, all the assembly and programming of the weather station is performed at our
factory. This leaves end-user with only installation of the weather station at the required site.
Dynamet 5 weather station installation on Tripod (Model#: CM6 or CM10) is explained in detail
in “Tripod Weather station Installation manual” supplied with Dynamet 5. This chapter
discusses basics of tripod installation, system mounting and sensor wiring and solar panel
installation. Selecting an appropriate site for installation of weather station is critical to obtain
accurate meteorological data. The site should be away from urban and natural obstructions
such as buildings and trees, sprinkler irrigation. This chapter explains steps involved in:
Tripod/ tower installation
Dynamet 5 weather station installation
Solar panel installation
Sensor installation on the tripod
Page 17

Dynamax Inc
16
3.1 List of Tools required
Shovel
Rake
12” pipe wrench
Teflon tape or pipe dope
Small sledge hammer
12’ tape measure
Felt-tipped marking pen
Open-end wrenches: 3/8”, 7/16”, ½”, 9/16”
Socket wrench and 7/16” deep well socket
Level (12” – 24”)
5/64” Allen wrench
Straight-bit screwdrivers (small, medium, and large)
Magnetic compass
Calculator
Volt/ Ohm meter
Wire ties and tabs
Conduit and associated tools as required
6’ ladder
Data logger prompt sheet / manuals
Station log/ pen
Lock and key for enclosure
Page 18
Dynamet 5
17
Page 19
Dynamax Inc
18
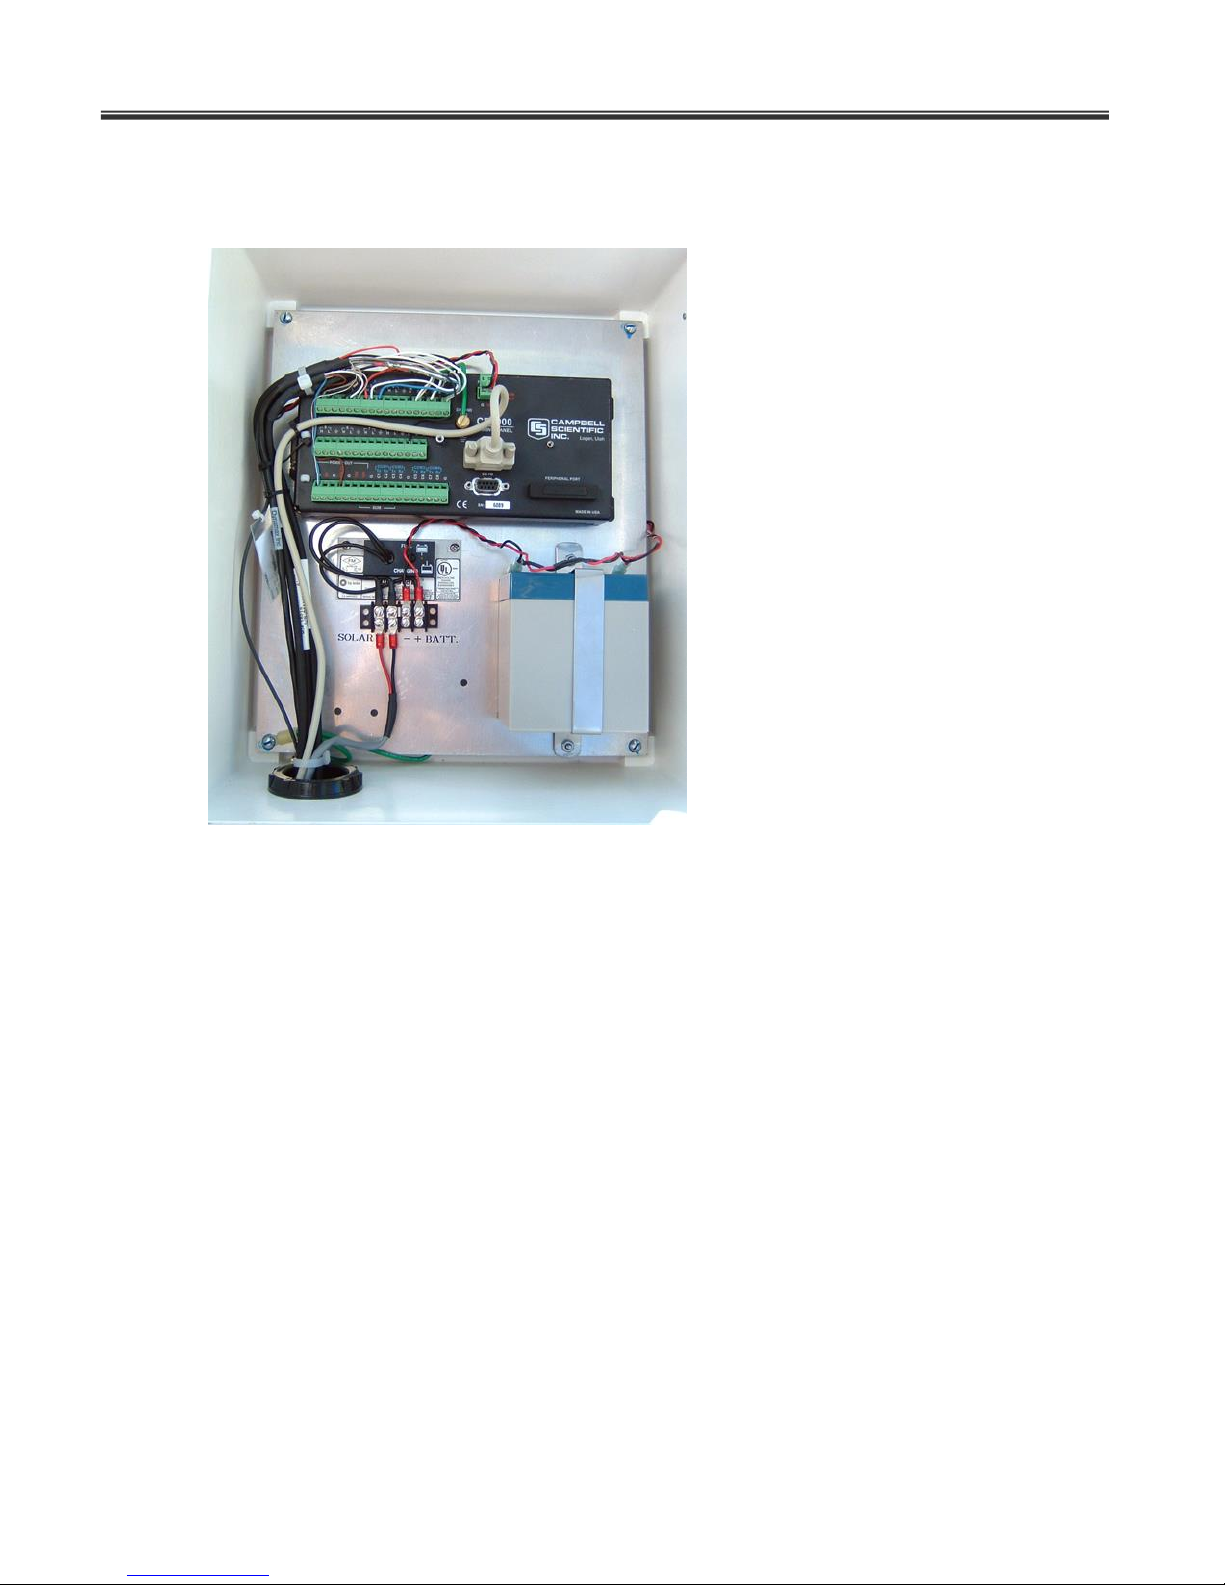
Dynamet 5 Logger Assembly – wiring, internal battery, and solar charge
regulator.
Page 20

Dynamet 5
19
3.2 Dynamet 5 and Tripod Installation
Operation, Overview and Quick start guide
1. Site selection and preparation.
2. Unpacking system
3. Mounting Tripod CM6 or CM 10 explained in Tripod manual.
4. Mount Dynamet 5 enclosure, connect sensor cables, connect Power, and
Connect Grounding.
5. Install sensors on the tripod
6. Connect personal computer
7. Install data logger support software (PC400) (optional provided in CD) on PC
8. Copy Dynamet 5 program files (supplied in a CD) to PC
9. Using data logger support software connect to the Dynamet 5 weather station.
Set the logger internal clock with the PC time/date Click on the Set Datalogger Clk
10. Download Dynamet 5Tst.cr1 to logger Dynamet 5 weather station starts working and
collect data at the specified intervals. Monitor, sensor output and calculated ET data.
11. If the sensors data and ETP output are with in the acceptable ranges, means that the
sensors and system are installed properly.
12. Now modify the Dynamet 5.cr1 program, for site-specific parameters, save with a
different name. Compile the new program and send to logger. Now the data logger
collects sensor data every minute, compute ET every hour and store hourly and daily
data to the logger.
13. After few days down load data stored in the logger memory.
PC400 -> Connect -> Collect all button
Retrieve data, then its saved data into *.DAT files on disk directory.
14. The retrieved data contains two different files. One containing hourly output of sensor
data and computed ETP. The second file containing daily output of accumulated ET,
average/ maximum/ minimum values of the sensor output.
Page 21

Dynamax Inc
20
3.2.1 Tripod Installation:
The following parts are supplied with Tripod kit.
Tripod base Assembly
Mast Assembly
Cross Arm Mount (Short pipe)
Lightning Rod with Clamp
Grounding Rod with Clamp
5’, 4AWG wire
4’, 12AWG wire
Hold down stakes
Cable ties
Select site for installing tripod and weather station. The site should be away from
obstructions and sprinklers. A flat ground is recommended for installation, even though
the tripod can be installed in many different terrains with some professional help.
Prepare an area of 10’ diameter for installing tripod with little disturbance to the ground
surface or vegetation. Apply pipe dope and Teflon tape to threads on the cross arm
mount and 1 1/4 “ end of the mast. To prevent cross threading, hand thread the cross
arm mount in to the mast’s bell reducer and then tighten with a pipe wrench. Hand thread
the mast into the threaded coupling on the tripod center bracket and then tighten with a
pipe wrench.
Mark the tripod legs to indicate how far they should extend. Each leg has a slide collar
with a single bold for loosening or tightening the collar. Loosen the bolt on each collar
with ½” wrench.
Stand the tripod upright and orient it so on leg points south. Extend the leg until the top of
the slide collar is even with the marks made before and tighten the bolt. Extend all the
other legs in the same manner.
Page 22
Dynamet 5
21
Lightning
rod
Plumb the mast by adjusting the south and northeast facing legs. Loosen the slide collar
bolt on the south facing leg. With the level on the south side of the mast, adjust the leg so
the level reads plumb, and then tighten the bolt. Repeat the same procedure for the
northeast facing leg with the level on the east side of the mast.
Drive the rebar stakes through the holes in the feet in to the ground surface to secure
tripod.
Loosen the sent screws in the two-brass ground lugs attached to the center bracket of
the tripod. Strip 1” of insulation from the other end of the 4AWG wire and inset it into the
lower ground lug. Strip 1” of insulation from one end of the 12AWG wire and insert it into
the upper ground lug. Tighten the setscrews. Attach the other end of the 12AWG wire to
the ground lug of the enclosure.
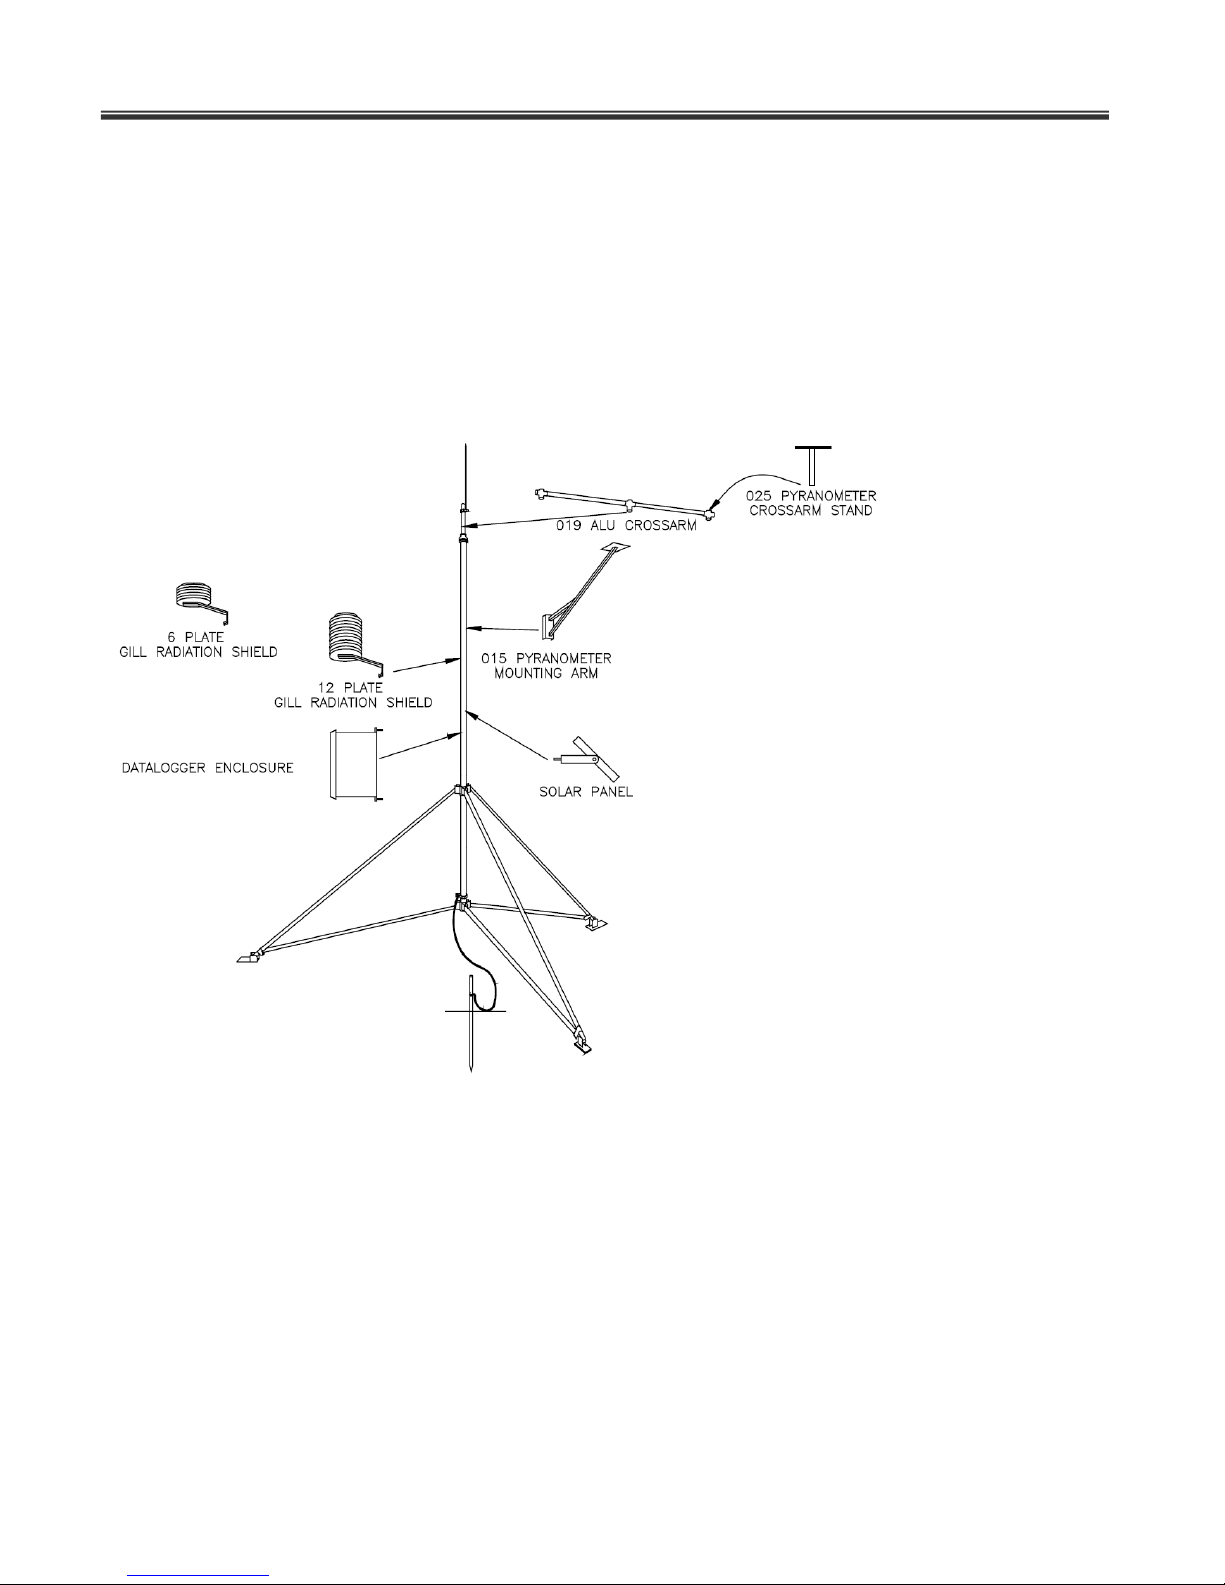
Attach 019ALU cross-arm to the mast. Slide the center NU-RAIL connector of the cross
arm down the cross arm mount until it rests on top of the bell reducer. Maintain the center
of the NU-RAIL connector about 113” above the ground surface. Orient cross arm mount
Page 23
Dynamax Inc
22
(019ALU) in east/west direction with the ¾” NU-RAIL facing East (northern hemisphere)
and tighten the setscrews. In a 025 cross arm stand orient the 019ALU north south with
¾” NU-RAIL facing south.
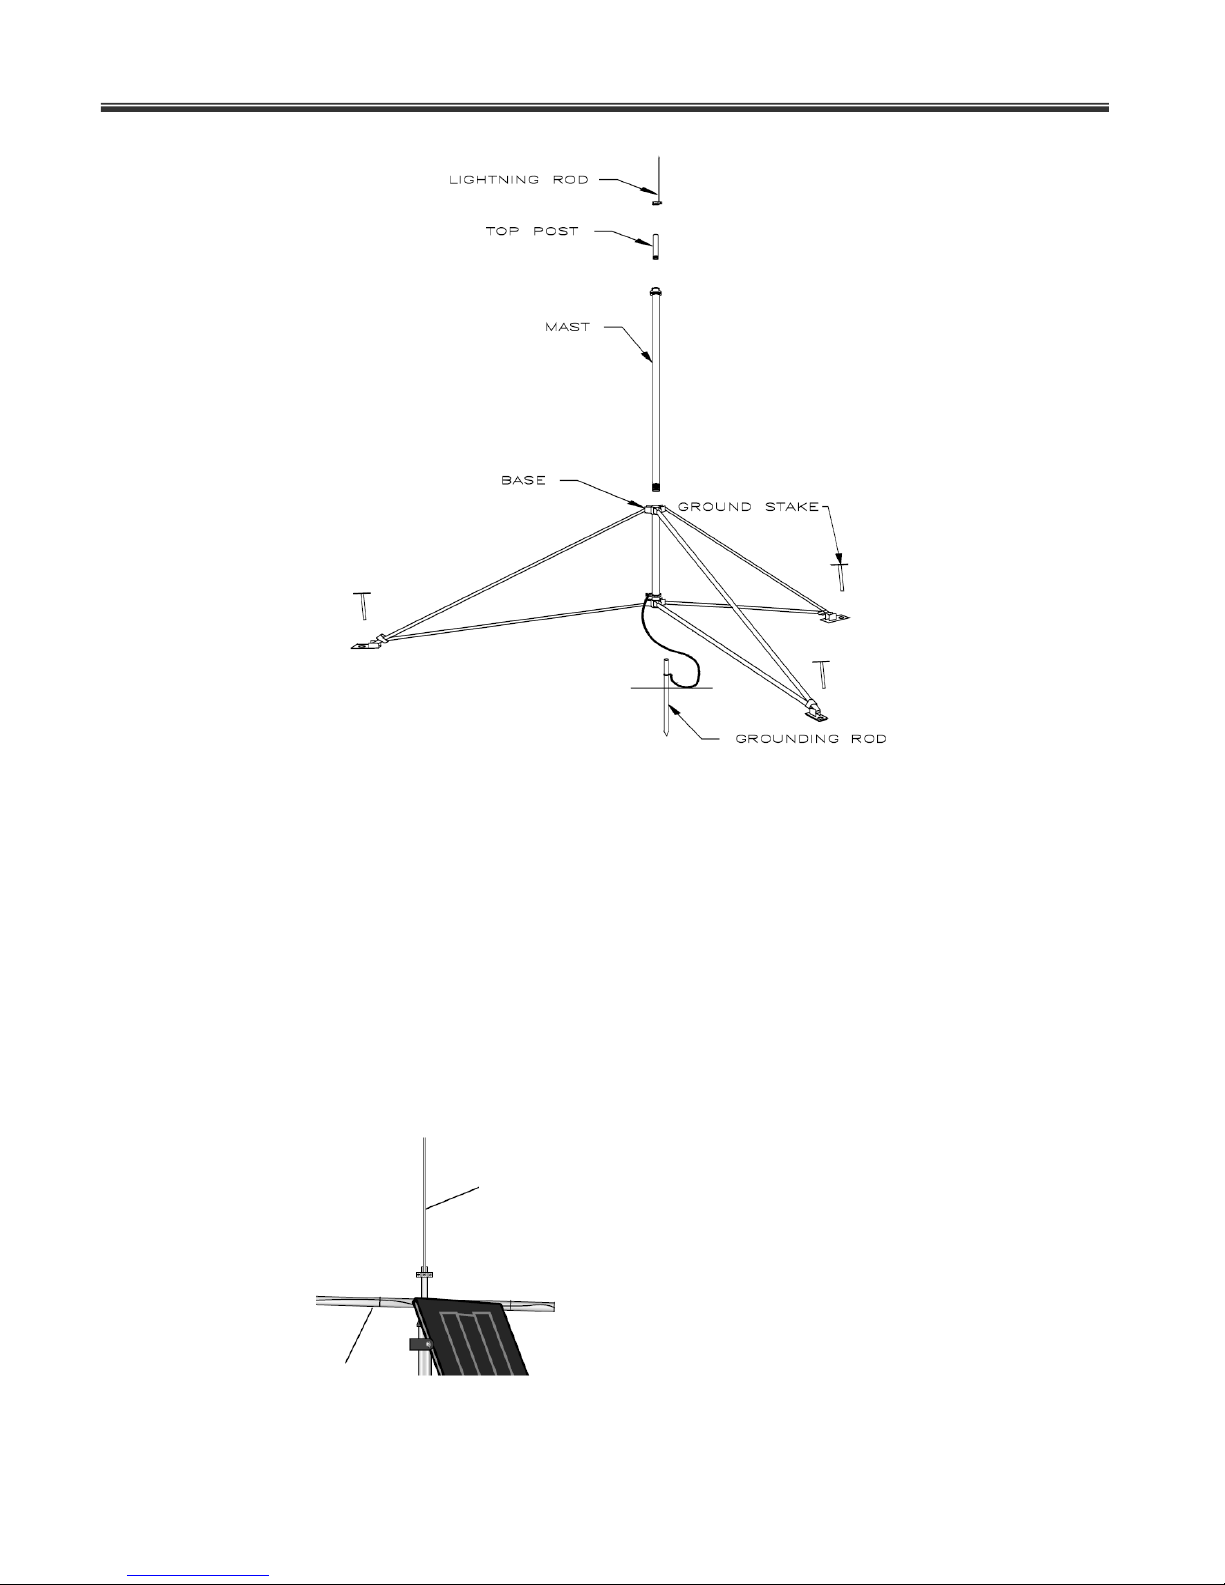
Lightning Rod: Position the lightning rod 4” down from the top of the mast, attach
lightning rod to the mast and make sure the lightning rod set screw is tight.
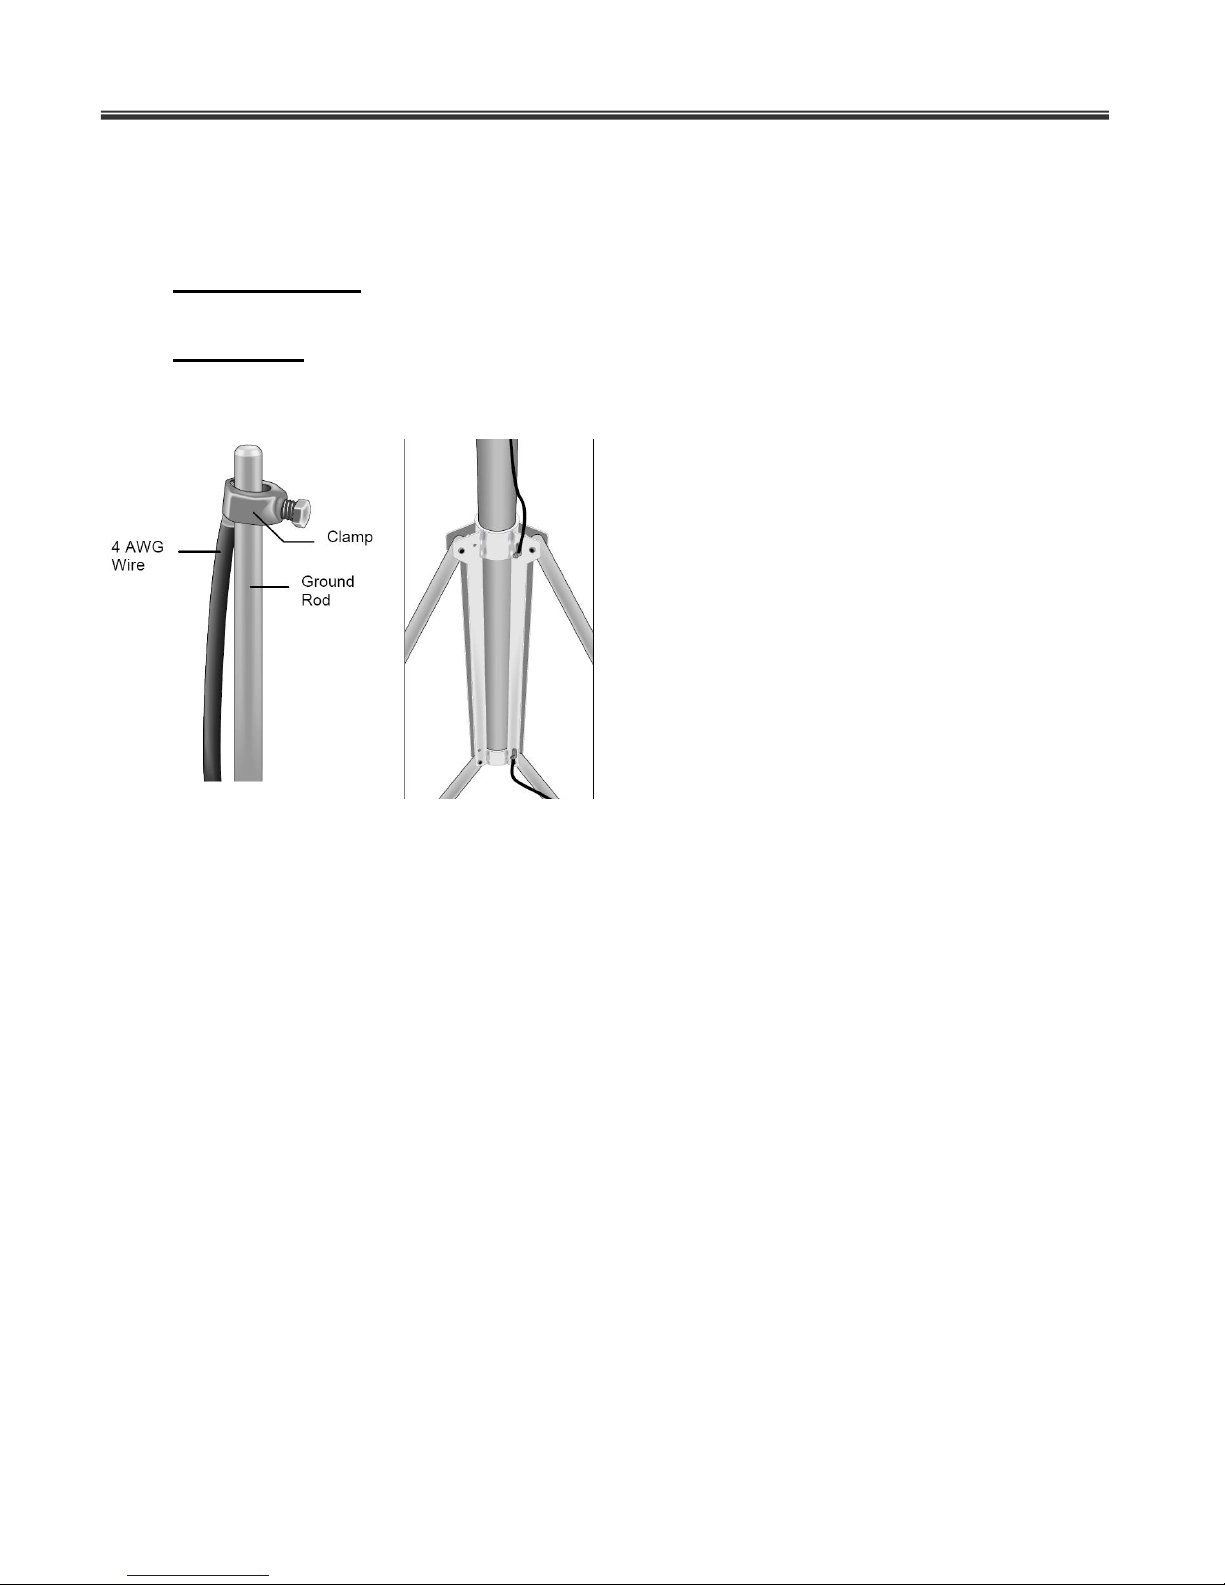
Grounding: Slide the clamp down the ground rod before driving it in the ground. Drive
Ground rod close to the center of the tripod using a fence post driver of sledgehammer.
In hard soils use water to prime the soil and hole to make driving the rod easier.
Loosen bolt that attached clamp to the ground rod. Strip 1” insulation from one end
of the 4AWG wire and insert it between the rod and the clamp. Tighten the clamp
bolt.
3.2.2 Solar Panel Installation
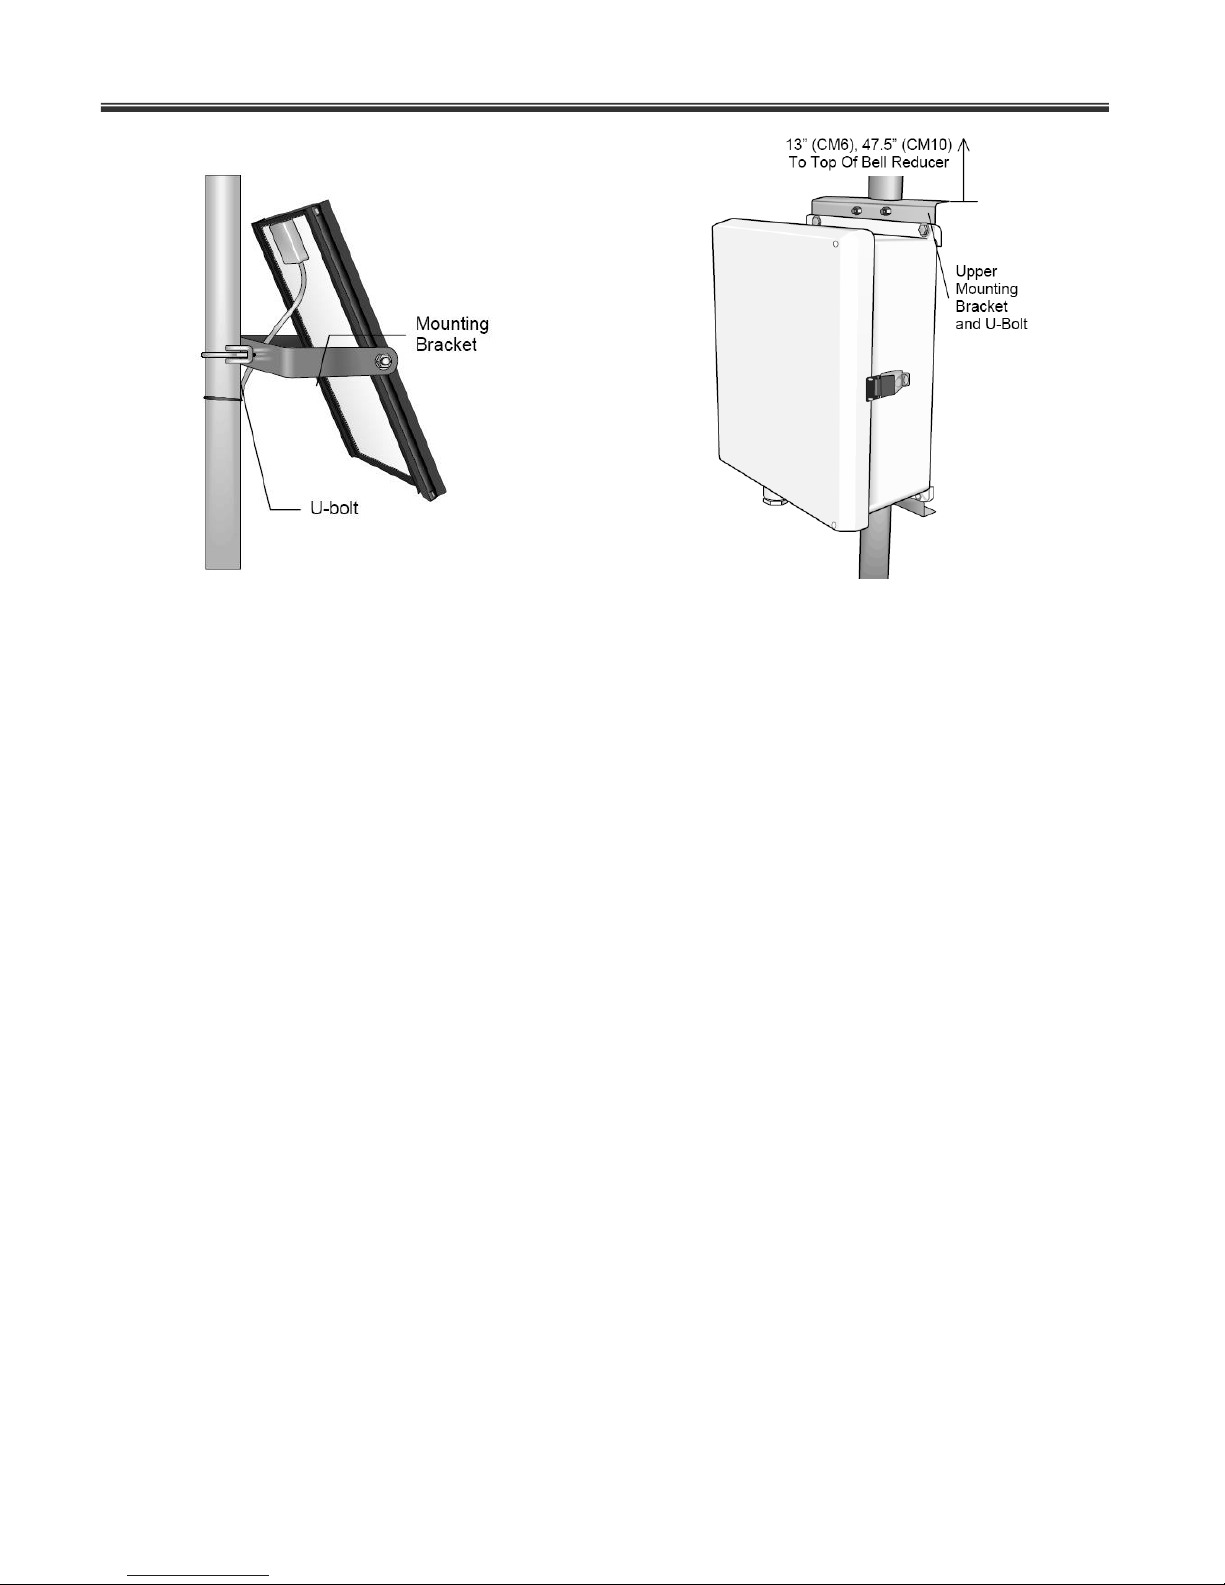
Solar panel with regulator models are shipped with a 12V regulator attached at the back of the
panel. A 15’ cable is attached to the regulator and the other end of the cable must be connected
to the pigtail hanging from the Dynamet 5 conduit labeled “Solar Panel”. Mount solar panel to
the mast, facing south (in northern hemisphere) Position solar panel mounting at the top of the 1
¼” diameter section of the mast. Install U-bolt muffler clamp and nuts. The solar panel should be
oriented to receive maximum insulation over the course of the year. Below table lists tilt angles
at various latitudes. Once the tilt angle is determined, loosed two bolts that attach mounting
bracket to the panel. Adjust the angle, and then tighten the bolts as shown below.
Page 24
Dynamet 5
23
3.2.3 Install Dynamet 5 Enclosure
Dynamet 5 weather station enclosure contains CR1000 data logger, and other storage of
communication peripherals if any. Sensor cables, Power cables, Communication cables
connected to the data logger or any peripherals routed out of the enclosure through a PVC
conduit. So it is not necessary of an end-user to make any wiring inside the enclosure. All
the connectors are accessible out of the box. Position the enclosure on the north side of the
mast or tower (northern hemisphere). Secure enclosure as shown in the figure using U-bolts
and mounting brackets. Route the 12AWG wire from the Ground Lug on the enclosure to the
tripod-grounding clamp. Tighten the screws. Grounding is critical not only for the accuracy of
data/ reduce signal noise but also to protect equipment from any lightening surges.
Page 25
Dynamax Inc
24
3.3 Sensor Installation
Dynamet 5 weather station sensors basic or additional are supplied with sensors or connected
to the data logger in the Dynamet 5 enclosure. In this section we discuss the procedure to install
the sensors on tripod along with Dynamet 5 enclosure, cable routing, setting up/ orientation of
the sensors and Entering parameters in the Dynamet 5 program.
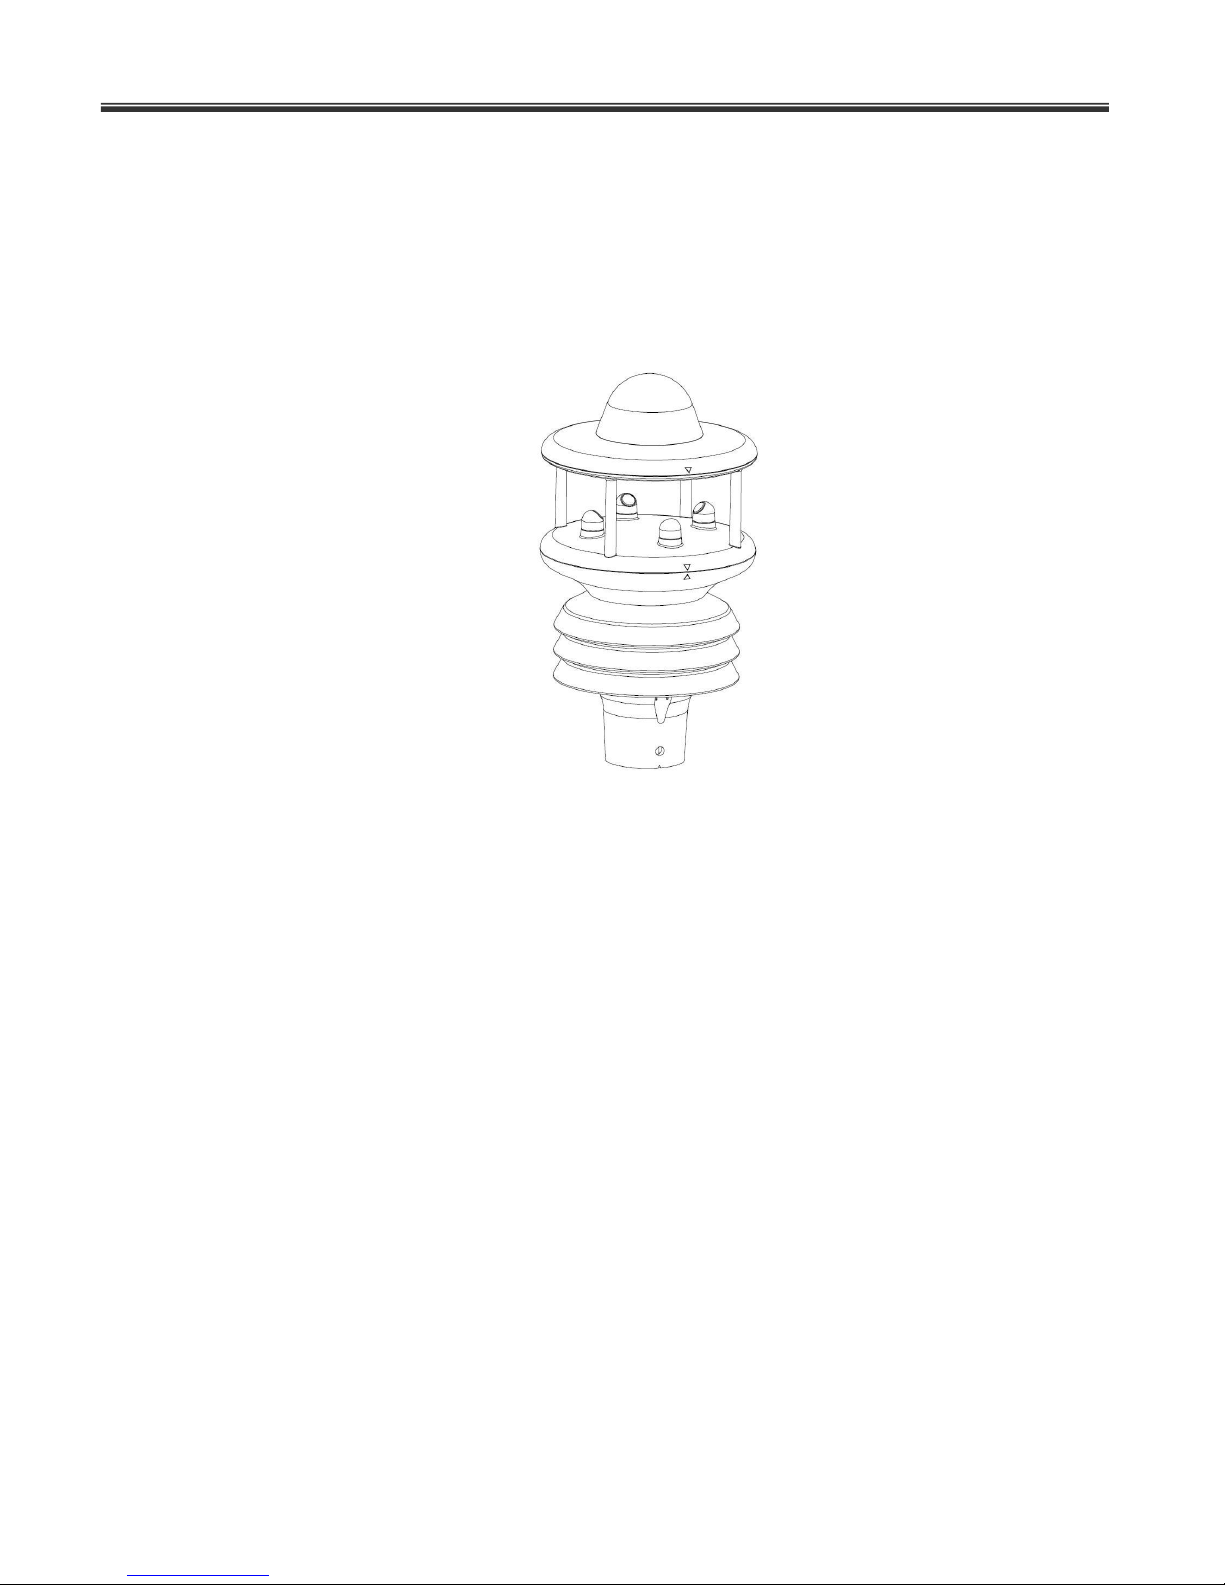
3.3.1 MaxiMet GMX500
MaxiMet GMX500 is an advanced compact weather station designed and manufactured by Gill
instruments using proven technology to measure meteorological and environmental parameters
to international standards.
The MaxiMet uses the Gill WindSonic wind speed and direction sensor. The WindSonic
measures the times taken for an ultrasonic pulse of sound to travel from the North (N)
transducer to the South (S) transducer, and compares it with the time for a pulse to travel
from S to N transducer. Likewise times are compared between West (W) and East (E),
and E and W transducer.
Page 26
Dynamet 5
25
If, for example, a North wind is blowing, then the time taken for the pulse to travel from N
to S will be faster than from S to N, whereas the W to E, and E to W times will be the
same. The wind speed and direction can then be calculated from the differences in the
times of flight on each axis. This calculation is independent of factors such as
temperature.
The compass point and polarity of U and V if the wind components along the U and V
axis are blowing in the direction of the respective arrows.
MaxiMet can output the following wind readings depending on use of a Compass or GPS.
o Relative wind – wind speed and/or direction, uncorrected, but relative to the north
marker, which may not be facing North.
o Corrected wind – with the aid of the Compass Magnetic North corrected wind
direction can be output.
o True wind – wind speed and/or direction information corrected by GPS for any
direction misalignment of the north marker and/or for any motion of the station.
(E.g. vehicle or vessel).
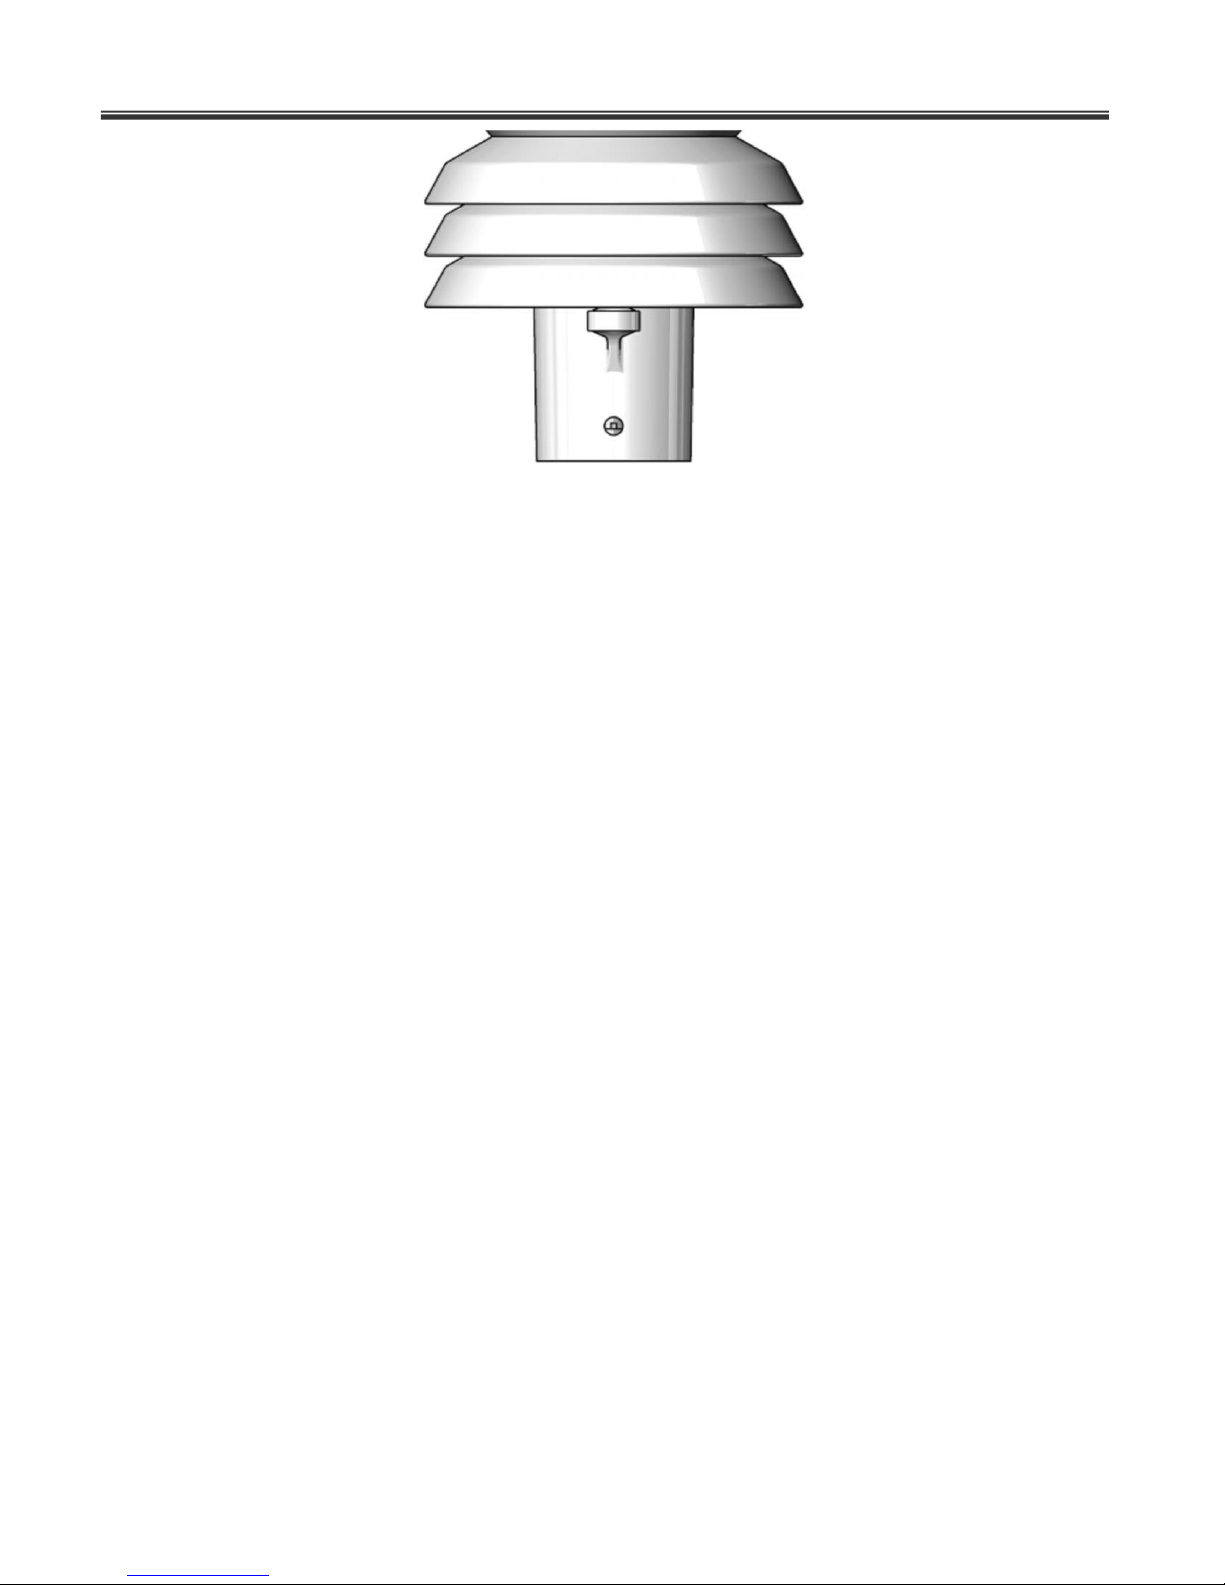
A Met Spec Multi-Plate Radiation Shield is used. The special shield plate geometry, with
its double louvre design, provides excellent response time performance of quick ambient
temperature changes while still working effectively as a baffle to stop larger contaminants
such as salt or dirt from reaching the temperature and humidity sensor. The shield
benefits from very robust material choice and extremely high UV protection requiring no
maintenance.
Page 27
Dynamax Inc
26
There is an internal solid state instrument contained within the Radiation shield that
provides digital output signals for Relative Humidity, Temperature and calculated Dew
point.
Barometric pressure output is provided by a solid-state device fitted on to a circuit board
inside a MaxiMet molding.
MaxiMet contains a 2-axis compass and magnetic field sensing module using Magneto-
Inductive (MI) sensors. The sensor changes inductance by 100% over its field
measurement range. It incorporates a temperature and noise stabilized oscillator/counter
circuit. The compass has a high degree of azimuth accuracy. MaxiMet uses the internal
compass to electronically sense the difference in the earth's field from the system's
magnetic field, then an on-board microprocessor electronically subtracts out the system's
magnetic fields, reporting highly accurate compass readings. Wind direction data is
corrected for the orientation of the sensor. The output of the wind direction is relative to
magnetic North. The MaxiMet compass is calibrated at Gill Instruments before the unit is
delivered. Prior to installing MaxiMet it is suggested that for best accuracy a declination
figure should be entered. Use of the Compass Corrected Wind direction readings allows
the unit be installed such that accurate positioning of the MaxiMet North Marker is not
required.
Declination is the magnetic declination (the angle between Magnetic North and True
North) in degrees. This is a correction factor that is added to the magnetic north heading
from the compass. Map and declination figures in decimal figures can be obtained from
http://www.ngdc.noaa.gov/geomag/declination.shtml
MaxiMet uses a highly accurate GPS (Optional) antenna receiver module including a
ceramic GPS patch antenna. The module is capable of receiving signals from up to 48
GPS satellites and transferring them into position and timing information that can be read
over a serial port. Small size and high-end GPS functionality are combined with low
power consumption.
Page 28
Dynamet 5
27
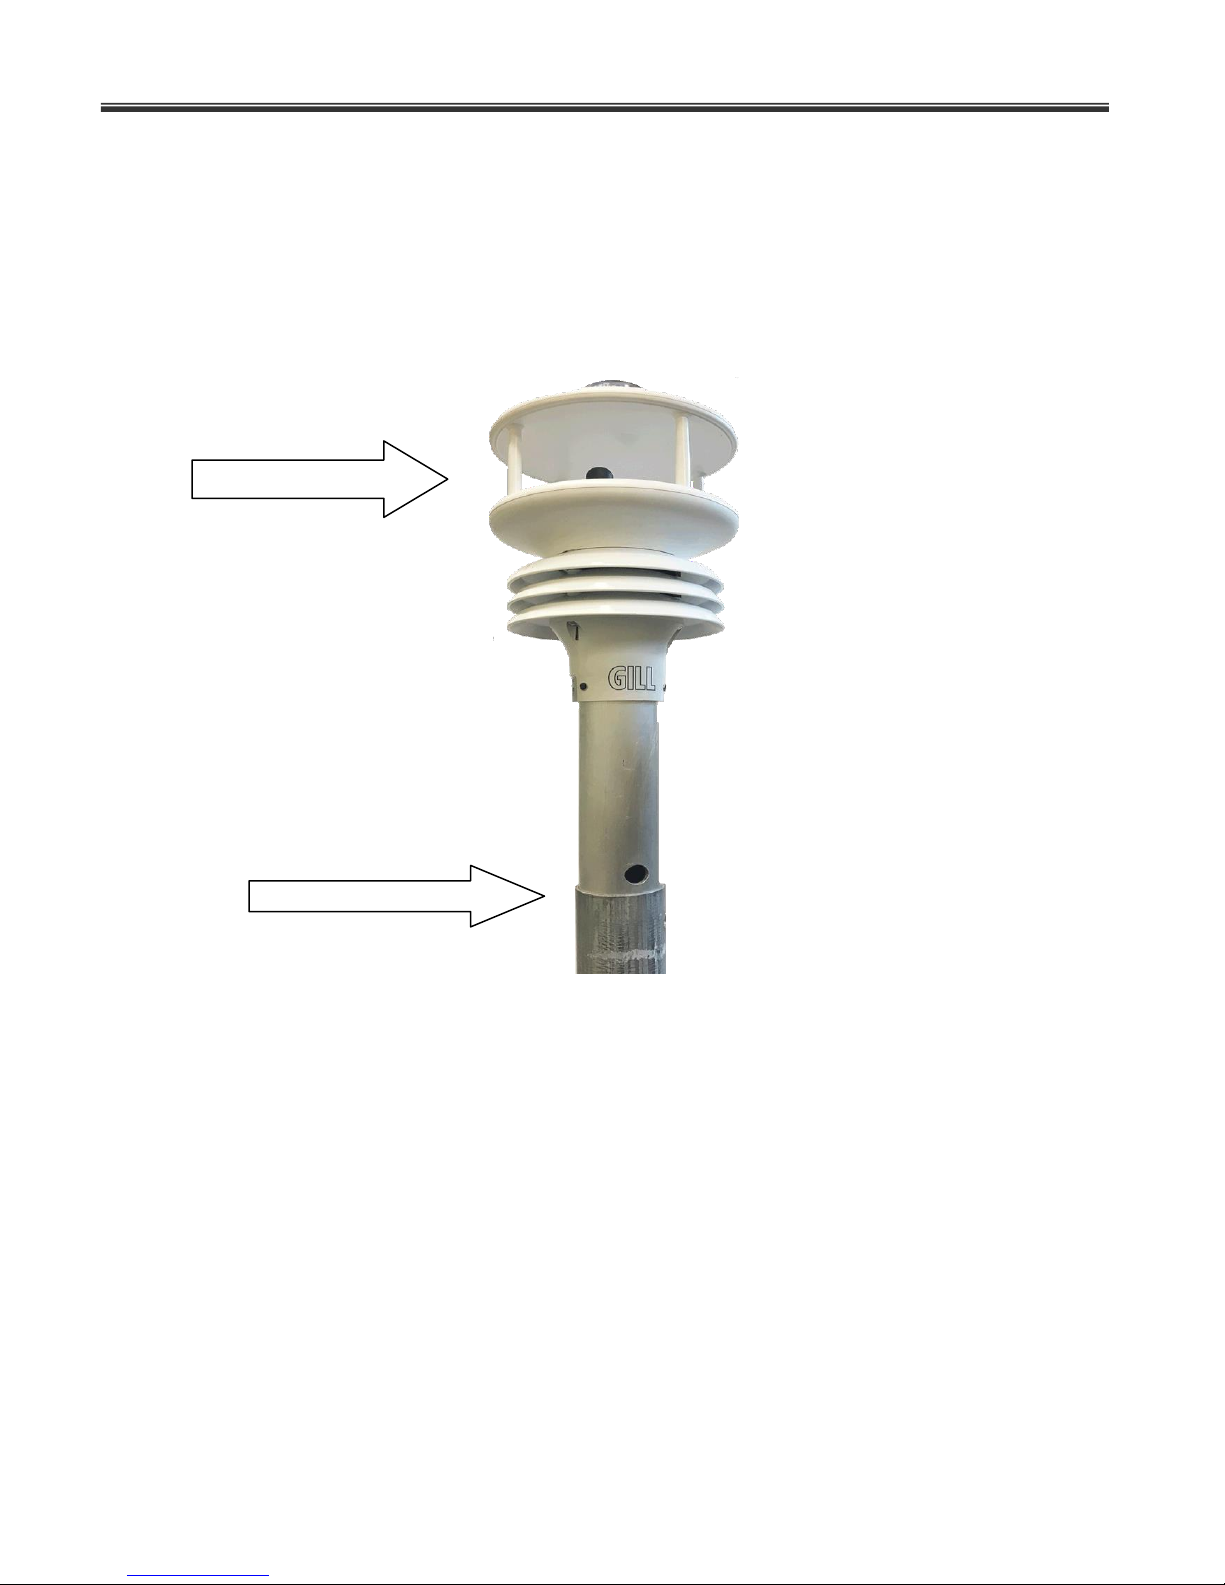
Support tube into mast
2m from the ground
When GPS Speed and GPS heading are available and GPS Speed transitions are above
5m/s, Corrected Wind Speed shall be computed as the True Wind speed using GPS
speed and GPS heading.
When GPS Speed is available and GPS Speed transitions are below 4m/s, Corrected
Wind Speed shall be computed as the True Wind Direction using GPS speed and
Compass heading.
Insert the MaxiMet Support Tube inside the mast and secure with bolt. The support tube
will fit snug inside the mast for added stabilization as shown above.
To reach a designed height of 2m, the distance between the ground to the top of the
stand should be 40”. On the legs of the tripod, the distance from the bolt to the end of the
bracket should be 18”
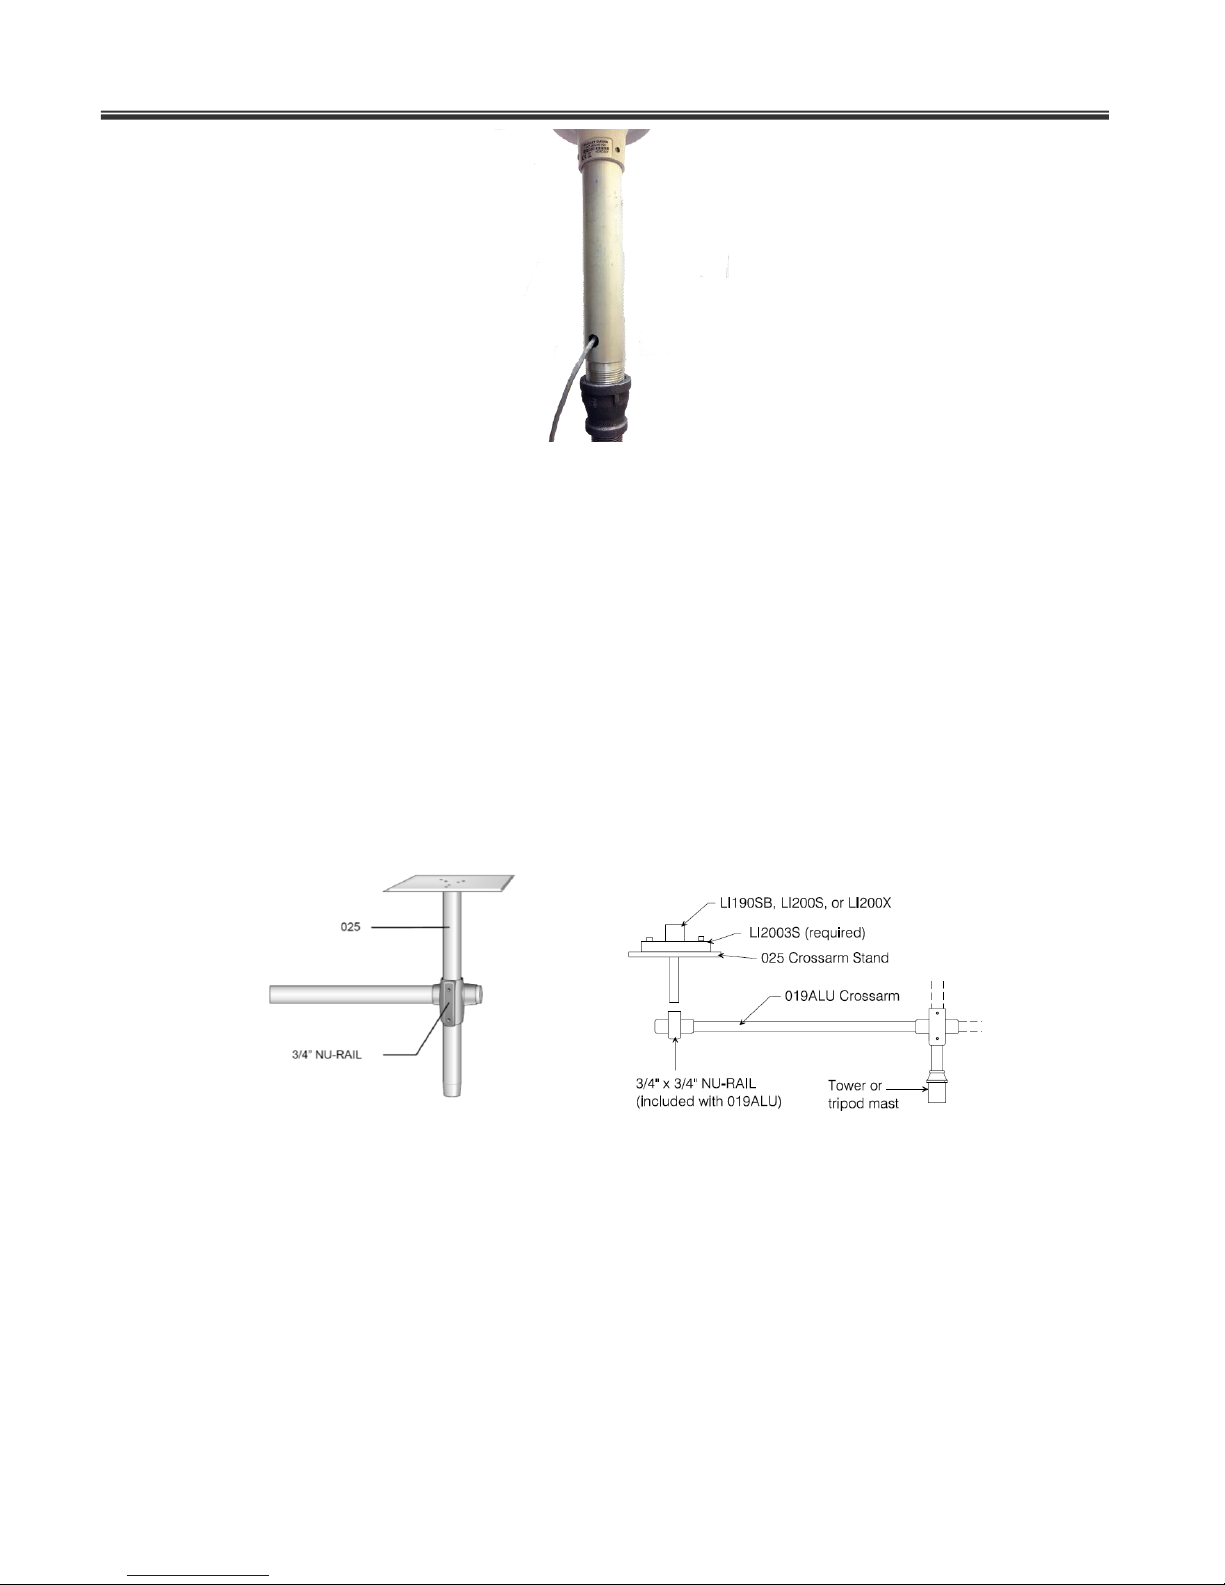
Install the MaxiMet GMX500 on top of the support tube using the supplied 3 x M5 screws.
Before wiring the GMX500 into the data logger, run the cable through the designated hole
in the support tube as shown below.
Page 29
Dynamax Inc
28
3.3.2 Solar Radiation (LI200S)
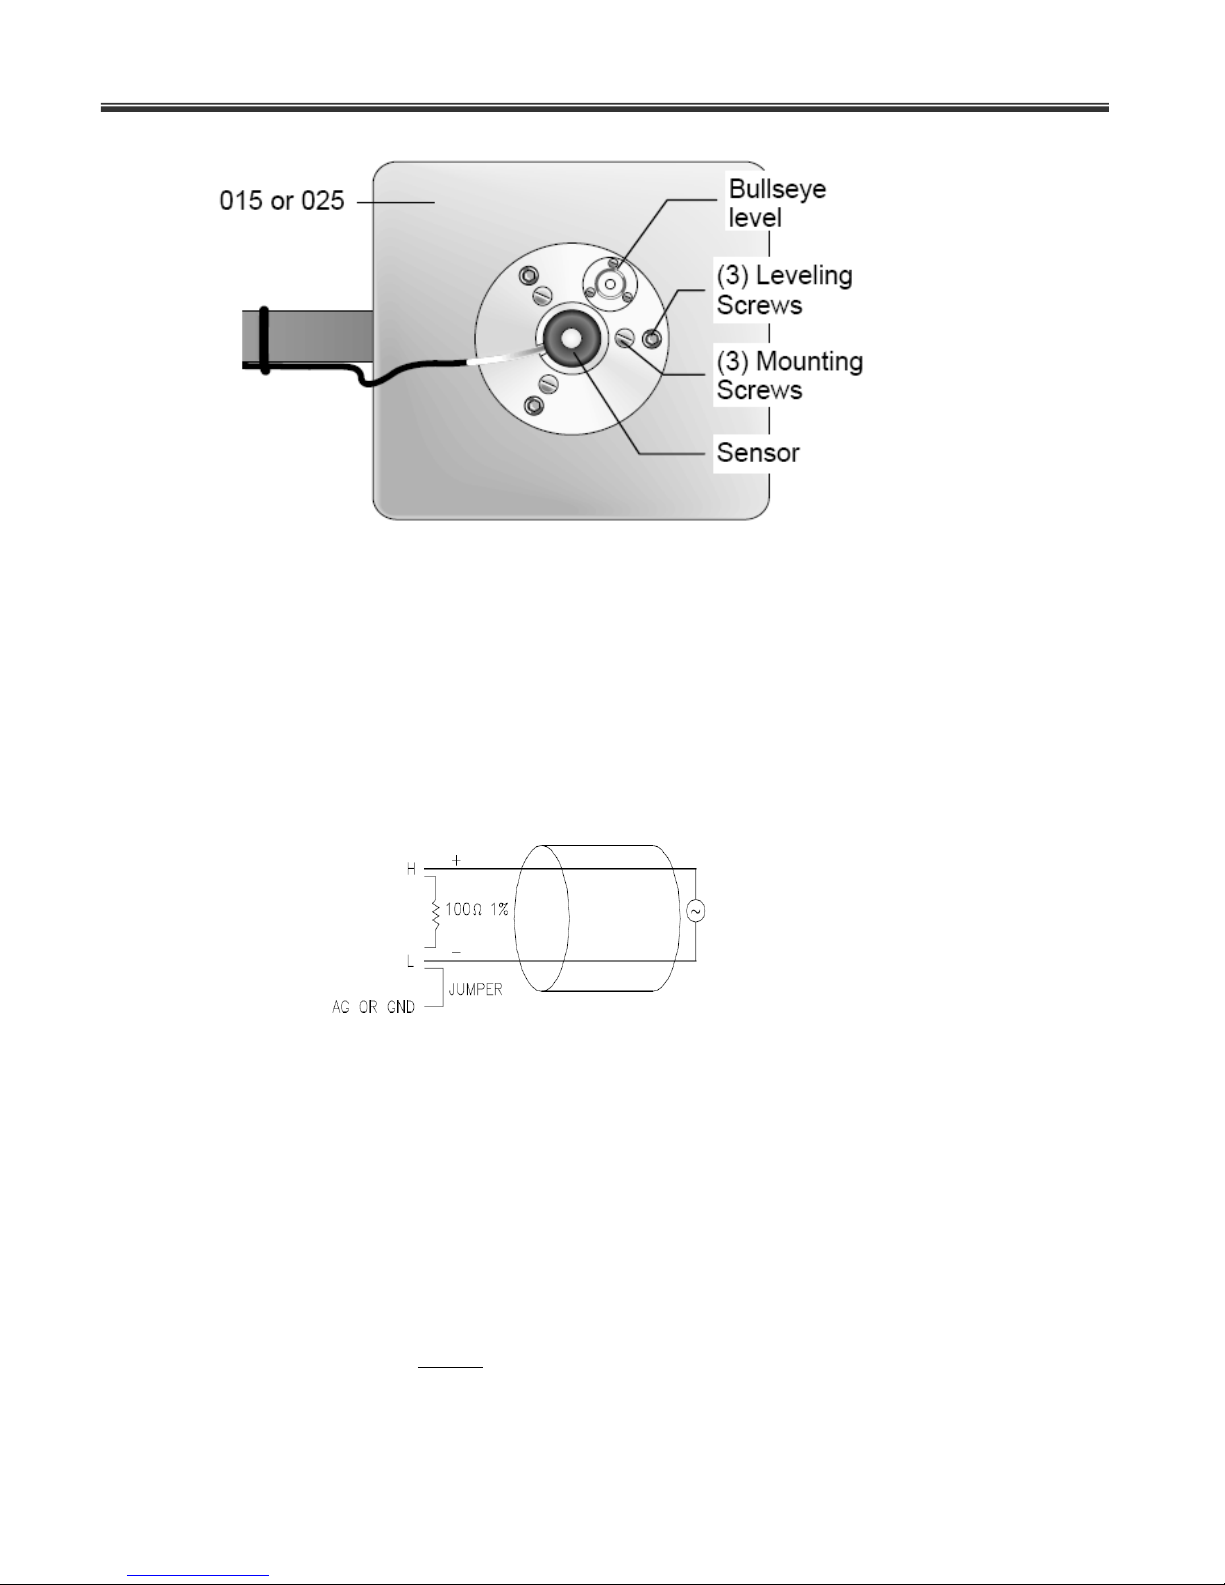
LI200SZ solar radiation sensor is supplied with LI2003S mounting base/leveling fixture. The
base includes a bubble lever, sensor holder and three adjustment screws for level setting. The
LI2003S base/ leveling fixture is attached to a tripod using a pyranometer mounting arm
(angled) or a cross arm stand and mounted on to one end of the cross arm (019ALU).
Pyranometer Cross stand: When using cross stand instead of the mounting arm,
Position the mounting plate 5” above the ¾” NU-RAIL and tighten the setscrews.
Position the base of the sensor in the mounting flange on the LI2003S and tighten
the setscrews with allen wrench provided. Adjust the three leveling screws flush
with the bottom of the LI2003S.
Mount LI2003S to the tripod mast using angle fixture (015) or to one end of the
cross (019ALU) using a cross arm stand (025).
Page 30
Dynamet 5
29
1000*
1.0*
1
C
Multiplier
Level LI2003S using the bubble level and leveling screws and tighten the
mounting screws. Remove the red protective cap prior to use.
As shown in the figure below, signal positive of the pyranometer is connected to
the High end (H) of the differential input channel and signal negative to the
corresponding low side (L) A jumper of the differential channel. A jumper wire is
installed between analog ground and Low side(L) of the differential channel. A 100
Ohm 1% precision resistor is installed between the High (H) and Low (L) of the
differential channel.
A multiplier must be entered in the CR1000 Dynamet 5 program (Dynamet 5.cr1)
before any valid data can be obtained from the sensor. Each LI200S sensor is
calibrated at the factory and shipped with date of calibration constant and LICOR
calibration constant (labeled as multiplier on the sensor tag). Identify the Licor
calibration constant ( C) from the sensor tag, apply this value in the formula below
to calculate Multiplier for the Dynamet 5 program. Resultant solar radiation data
from the data LI200S/logger is in W/m2.
Page 31
Dynamax Inc
30
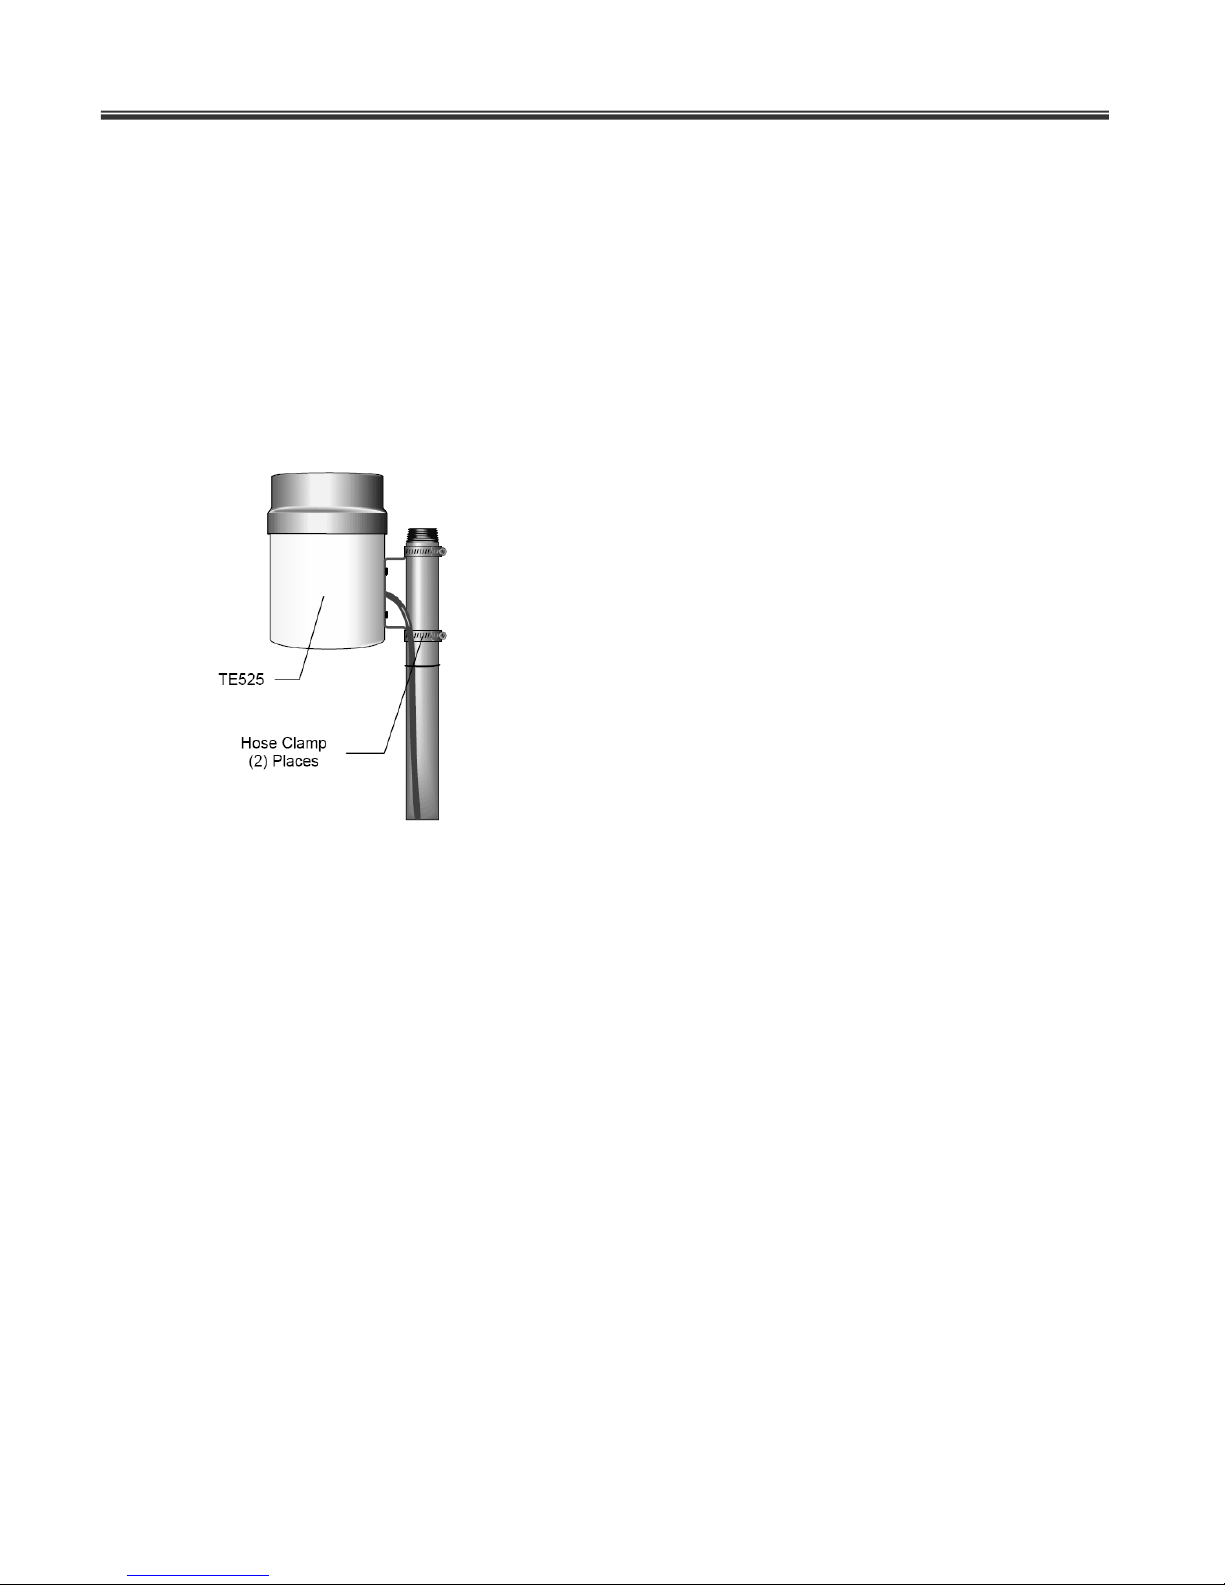
3.3.3 Rain Gauge (TE525)
Select a location about 10’ from the tripod installation, Install a vertical pole.
Mount the rain gauge to the vertical pipe.
Route the sensor lead to the Dynamet 5 enclosure/ Tripod in plastic or metal
conduit.
Alternatively the rain bucket can be set on a level ground away from the tripod.
Page 32
Dynamet 5
31
Polynomial Equation
A0
A1
Mineral Soil
1.6
8.4
Organic Soil
1.3
1.7
Color
Function
CR200 channel wiring
Black
Excitation
Switched Excitation
White
Signal
Single-ended channel
Blue
Signal Ground
SGnd
Clear/ Shield
Shield
SGnd
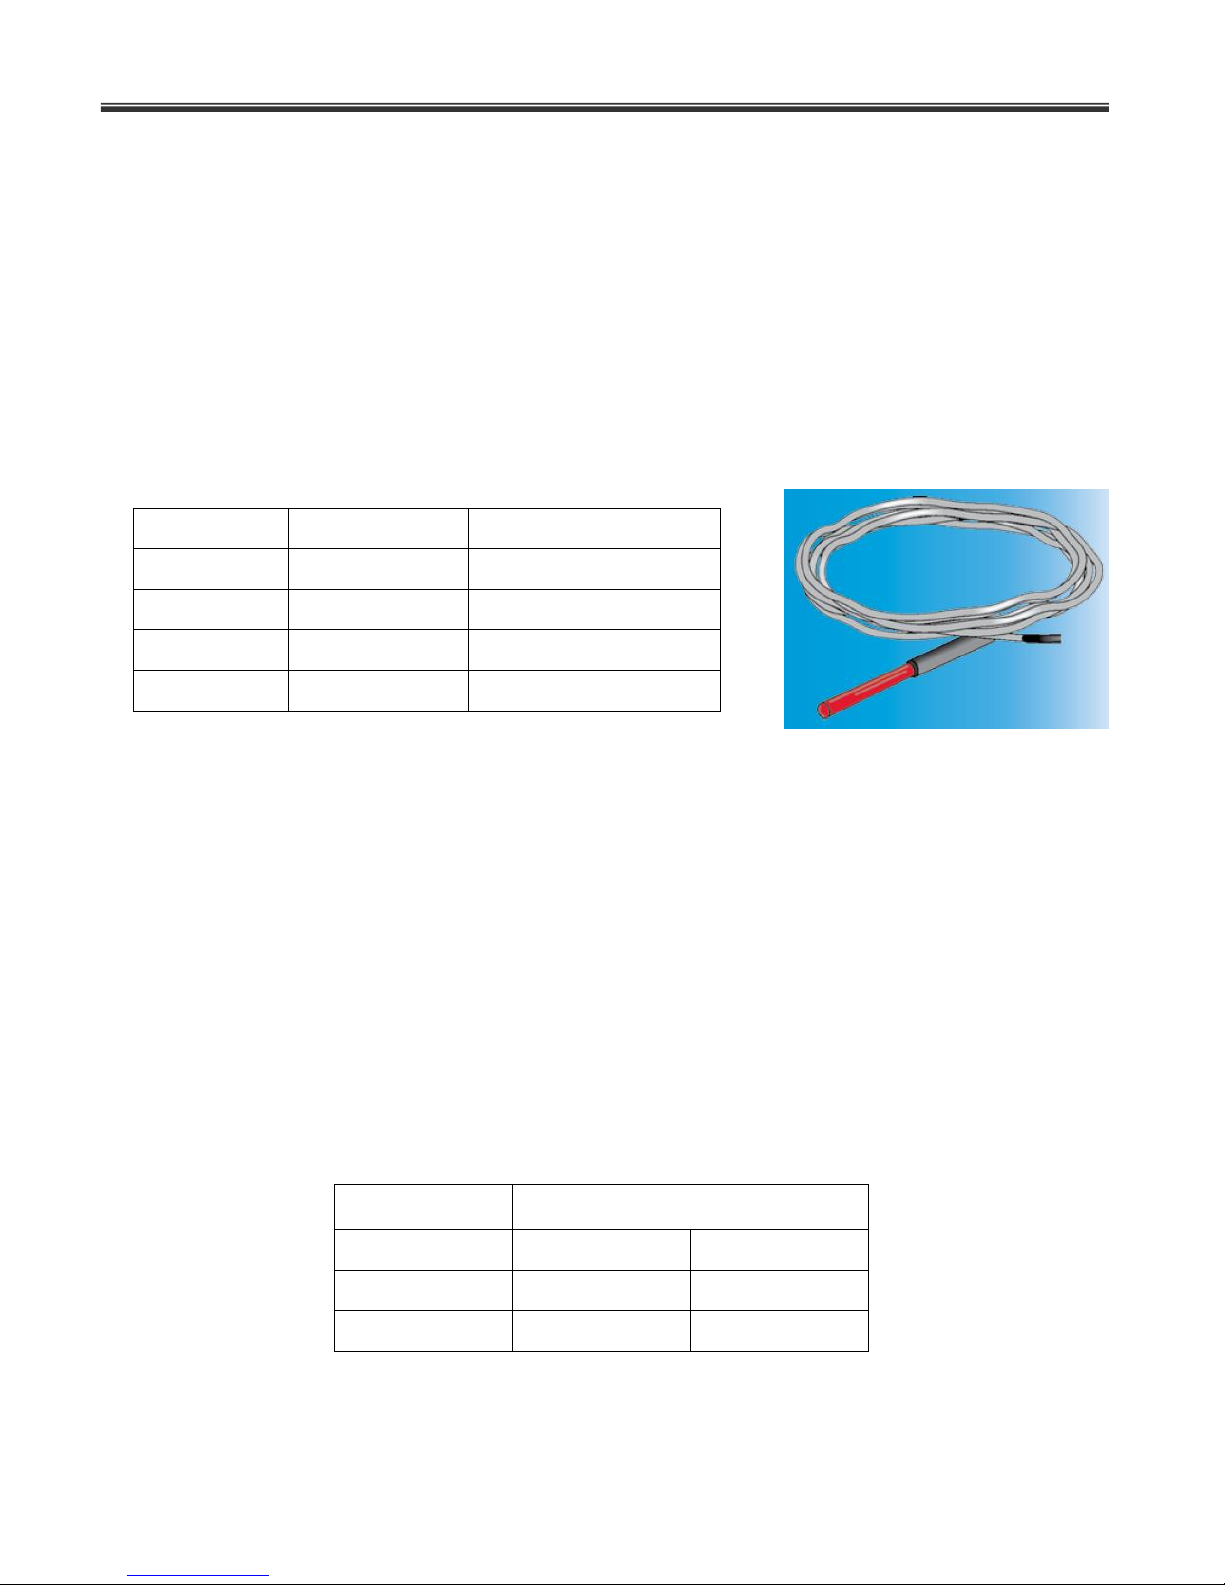
3.3.4 Soil Temperature Sensor
The TM10 is designed to measure the temperature of air, water, or soil. For air temperature
measurements, a solar radiation shield (41301) is typically used to house the probe, while limiting
solar loading on the sensor. The temperature probe can also be buried or submerged to 50 feet.
The probe is not weighted for submergence (ie, it will float), so the installer should plan to add a
weighting system or secure the probe to a fixed, submerged object, such as a piling. The TM10
has a measurement temperature range of -35° to +50°C and outputs a full scale range of 0 to 2.2
Volts. TM10 comes with a standard lead length of 10’, and offered lead lengths are 25, 50, 75, and
100 feet, although the sensor may be ordered with lead lengths up to 1000 ft. Temperature
measurement is made in degrees C.
3.3.5 ML3 Soil Moisture Sensor (Optional)
ML3 soil moisture sensor measures volumetric soil moisture content by the principle of dielectric
constant of the medium changes with water content. The changes in dielectric constant is
measured in mV DC voltage. Dynamet 5 weather station reads the DC voltage and converts to
volumetric soil content in %. Soil moisture sensor ML3 is wired to the Dynamet 5 weather
station. Select the location for installing the ML3 sensor, usually close to the sprinkler fall area or
under the drip nozzle. Push the sensor in to the soil until the rods are fully covered. Route the
wire to Dynamet 5 station and secure it from any damage. Based on the type of soil in which
measurements are made, identify the constants A0 and A1. enter these values in CR1000
program to calculate soil moisture for either organic or mineral soil using polynomial equation.
Page 33

Dynamax Inc
32
4.0 Lascano-VanBavel ETP Program
The value of ETP (Potential Evapotranspiration) is a reference measure of the evaporative
demand, as determined by weather conditions. Using Lascano-VanBavel ET algorithm we
calculate ETP estimation from a well-watered short grass. ETP is normally expressed in mm/hr
or inch/hr and daily-accumulated values are expressed in mm/day or inches/day. It can be
related to hourly or daily data for the sap flow rate, and used to normalize such data against
day-to-day variations in the weather, or to identify deviations in the sap flow rate from normal
patterns. ETP is also used to create and index reference to schedule irrigation and to calculate
crop coefficients. Lascano-VanBavel ET algorithm is embedded in Dynamet 5.CR1 and
Dynamet 5Tst.CR1 programs supplied with Dynamet 5 weather station. In addition custom
Dynamet 5 weather station programs can also be supplied with embedded ET calculations. The
new Lascano-VanBavel RCM algorithm for ETP does not assume a value for temperature and
saturation humidity at the evaporation surface, but rather derives both from closing the energy
balance.
Using Dynamet 5.Cr1 or any of the variation of these programs and a Dynamet 5 weather
station user can collect sensor data as well as the computed ET data (both hourly and daily)
from the station. Hence, there is not further processing of the collected data. Output of the data
logger already contains raw sensors data, computed ET data as well as daily-accumulated data.
4.1 Application of ETP Information
In the interpretation of data on the sap flow rates in crops and trees it is essential to compare
their hourly pattern within that of the concurrent evaporation demand. A general comparison
can also be made of daily totals, as an indication of water stress, or other influences that cause
the plant to use less water than expected.
For example, the weather data may give a value of 10.3 mm/day for ETP and, from stem flow
gauges, the total water used by a tree on 10 m2 of land is found as 94 kg/day (converts to 9.4
mm/day). On the next day, if the value for ETP is 10.6 mm/day, but the water use measured as
46 kg/day (4.6 mm), stomatal closure and reduced transpiration has occurred. The reduced
transpiration can be a result of reduced soil water availability, but possibly a result of other
factors such as low root zone temperature, vascular disease, or others.
In the case of irrigation management, a comparison of the ETP rates with the stem flow data
serves the dual purpose of diagnosing the need for supplying water and the basis for calculating
how much water should be applied. For example, if a four-day sequence of water use a
transpiration showed, respectively, 94 kg/day, 96 kg/day, 50 kg/day, and 28 kg/day, while the
ETP was essentially constant, we would know that irrigation is needed and overdue, on the 5th
day. By adding up the sap flow, we also know that the total amount that has to be replaced
equals 266 kg.
Page 34

Dynamet 5
33
To this amount we must add the losses by soil evaporation, which must be estimated from
previous data, if available. Assuming one tree occupies a 10 m2 area, and if the transpiration is
80% of ETP, then the suggested irrigation is 333 kg or 86 gallons (per 10 m2), i.e. 266 kg / 80
%. That would translate to an irrigation of 33.3 mm to replenish the water used over four days.
Many variations on this theme can be formulated for a specific application.
One caution should be stated. The ETP estimate is only a quantitative measure of the
evaporative demand, and is not intended to be an estimate of the actual water use by the crop
or the trees, even if they are well watered. Therefore, the two variables, ETP and stem or trunk
flow rate, are expressed as mm per hour and kg/plant/hour, respectively, even though the water
use by vegetation is often also expressed as mm per hour or per day. The relation between
daily ETP and daily stem or trunk flow rate is not even necessarily linear, that is, the quotient
(stem or trunk flow rate). ETP may not be constant over the entire range of weather conditions
or the development period of a crop.
Page 35

Dynamax Inc
34
5.0817.3
2.1013
Eelf
eabp
4.2 ET Program Basics
This section covers the basics of Evapotranspiration algorithms and the ET algorithm
implemented in Dynamet 5.Cr1.
The ET program contains two constants that are always set for the customers site, and two
constants that could be modified for various situations. Parameters lev and zot should be
modified only by persons thoroughly familiar with ETP modeling. Normally, the last two
constants are altered to account for the barometric pressure and the height of the wind
measurement. The present form of the program is adapted to metric units. Each user needs to
know the height of the weather station above ground level, and the altitude above sea level in
feet.
zot = 0.0005 surface roughness parameter in m, for ¾ in. high turf grass
zom = 2.0 wind speed height of measurement in meters, 2 m typical.
elf = 100 elevation of station in feet , 100 ft being only an example
has = 1004.0 Specific air heat capacity in J/KgC
In this section we discuss definition of these parameters and their units followed by procedure to
modify these parameters in Dynamet 5 program to meet the geography of the location of
weather station.
4.2.1 Elevation and Average Barometric Pressure Calculation
The user should calculate the Average Barometric Pressure as indicated in the following formula
and substitute the calculated average barometric pressure (abp) figure for line two of the select
elements. The Average Barometric Pressure is computed as follows:
Average barometric pressure in mb,
As a simple example, at sea level, elf is zero, so the ABP is 1013 Mb.
If the altitude is 100 ft (elf=100), enter abp=1009 in line two of the select elements
calculation.
Page 36
Dynamet 5
35
Notation
Description
Units
zom
Height of measurement
M
zot
Roughness parameter for heat and vapor profile
M
abp
Average barometric pressure
Mb
lev
Heat of vaporization
J/Kg
has
Specific heat air capacity
J/Kg.degC at 30C
Notation
Description
Units
hgr
Hourly average solar radiation
W/m2
hta
Hourly average of air temperature
degC
hrh
Hourly average or relative humidity
%
hws
Hourly average of wind speed
M/s
hts
Hourly average of s temperature
DegC
Notation
Description
Units
had
Air Density
Kg/m3
hum
Ambient Humidity
Kg/m3
ras
Aerodynamic resistance
S/m
skl
Sky long-wave radiation
W/m2
htc
Surface temperature
DegC
rnt
Net radiation balance
W/m2
sht
Sensible heat flux
W/m2
hums
Humidity at the surface
Kg/m3
evt
Evapotranspiration
Kg/m2.s
EVT
Evapotranspiration in standard units
mm/hour
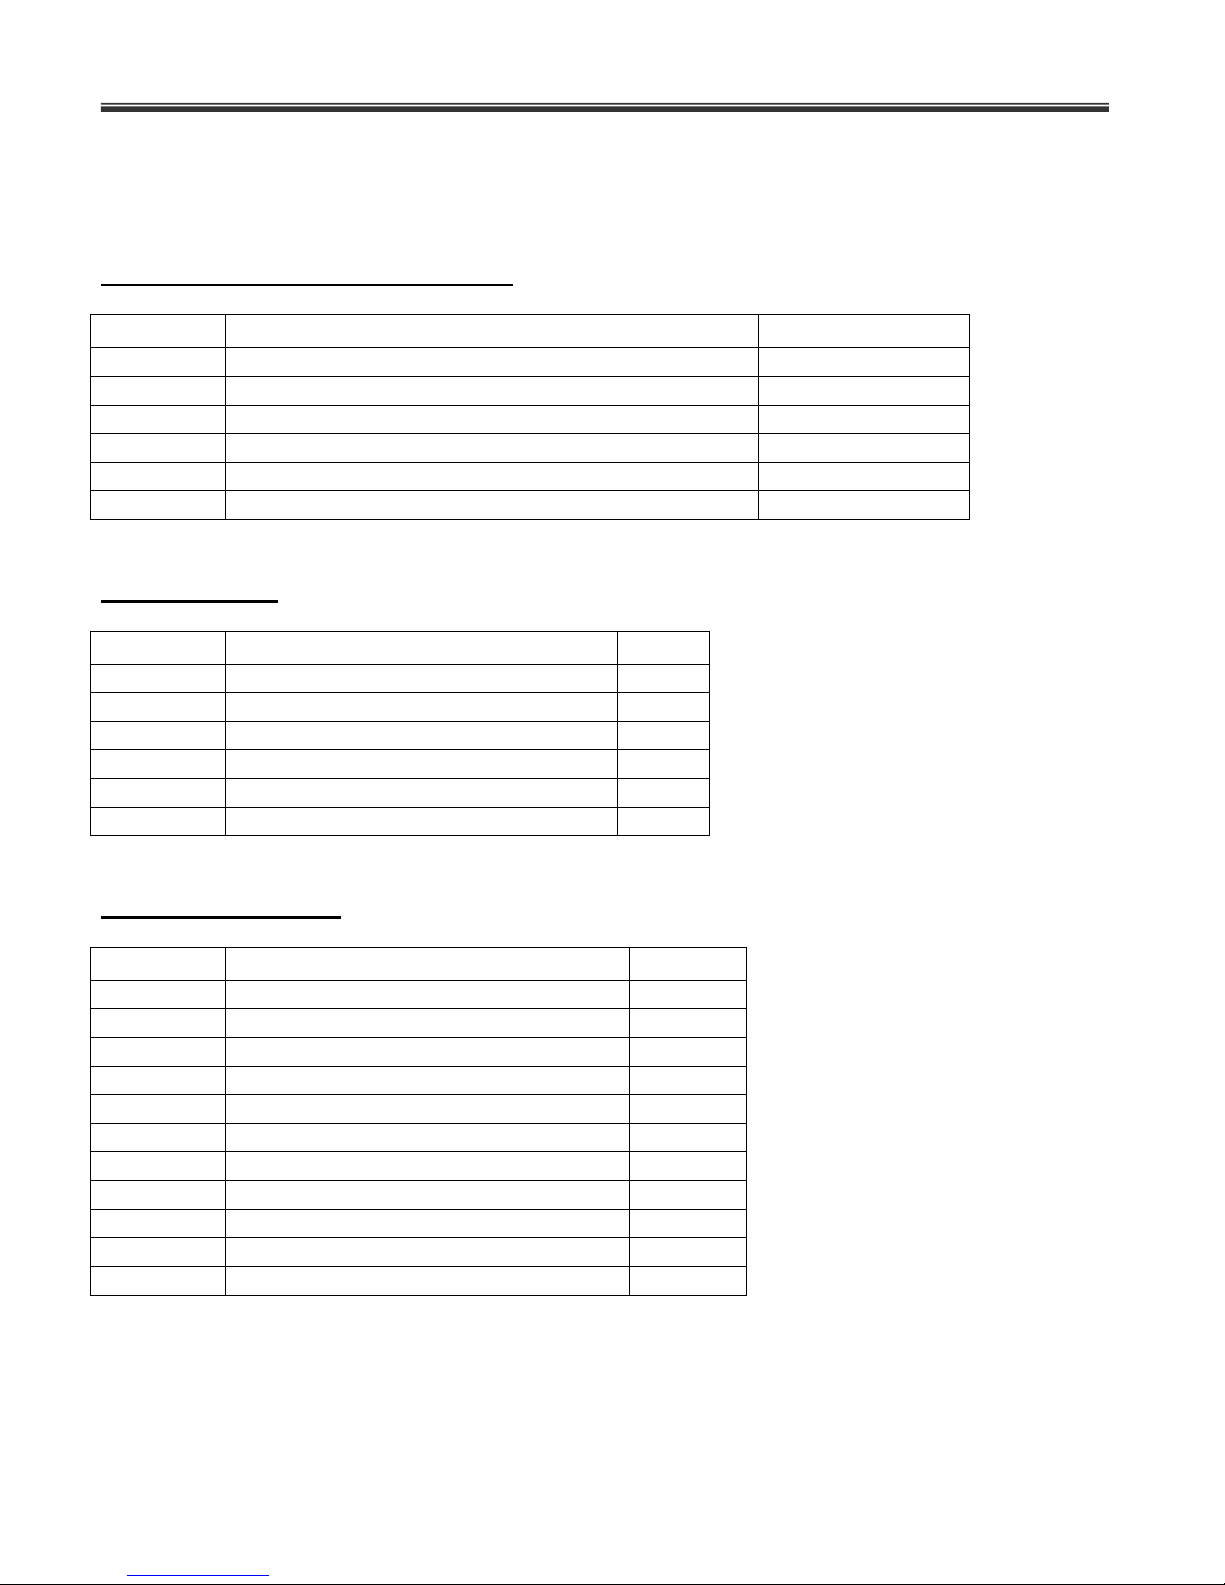
4.3 ET Variables and complete algorithm
Constants or site-specific variables:
Input variables:
Calculated variables:
Page 37

Dynamax Inc
36
5.0817.3
6
2.1013
10002361.0501.2
:
Eelf
eabp
htalev
VariablesSpecificSite
1078.6
ln2693882.17
1078.6
ln3.237
1078.6
:int
3.237
2693882.17
a
a
asa
T
T
as
e
e
hdp
hrhTee
eTe
nCalculatioPoDew
a
a
2.273
1500
4
22
237
269.17
08241.070.0()2.273(867.5
1.0
1.016.0
ln
16.0
ln
2.273
323.1
2.1013
1548.1
:lg
hta
hdp
hdp
ehumhtaEskl
hwswhen
hws
zot
zom
rasor
hws
zot
zom
ras
hdp
e
hum
abp
had
ncalculatioETfororithmaRCM
htc
hta
hashad
ras
lev
ras
hum
htc
e
rashta
hashadhtchta
sklhtcEhgrroothtc
htc
htc
htc
,
2.273
16.303
2.273
323.1
2.273
16.303
)2.273(867.580.0
237
269.17
4
10
3600
2.273
16.303
2.273867.580.0
4
evtEVT
lev
shtrnt
evt
rashta
htchtahashad
sht
sklhtcEhgrrnt
RCM ET Algorithm:
Page 38

Dynamet 5
37
Parameter
Constant
notation in
program
Description
Units
Default
Values
zom
C_ZOM
Height of measurement
M
2.0
zot
C_ZOT
Roughness parameter for heat and
vapor profile
M
0.003
elf
C_ELF
Altitude above sea level
ft.
100
has
C_HAS
Specific Air Heat capacity
J/Kg.degC
at 30C
1004.0
Notation
Description
Units
Default
Values
INT-SCAN
Time interval in seconds between successive reading of
the data from meteorological sensors
sec
60
INT_STORE
Time interval in minutes at which to calculate average of
the raw weather variables, calculate ETP and store to
logger memory
min
60
4.4 CR1000 Program for Dynamet 5 and ET computation
Every standard and custom Dynamet 5 system is supplied tested and supplied with a program
to read sensors every minute and calculate average, ET and store to logger every hour, as well
as store daily-accumulated variables at mid night. This enables the user to simply power up the
Dynamet 5 system and the unit starts collecting data as long as all the sensors are connected
and operating properly. In addition to this each system is supplied with a 3.5” floppy disk or a
CD containing the same program currently stored in the logger and a test program with a
smaller scan and store intervals. For example read sensors every 5 seconds and calculate and
store to logger memory every minute. This test program is helpful as a learning tool for a new
user as well as for testing the installation for any problems and an invaluable tool in trouble
shooting the weather station, sensors, cabling or installation.
Even though Dynamet 5 weather station is shipped ready to flip the switch and operate, we
recommend the user to modify the site specific constants/ variables to meet the geography of
the location where the station is setup, compile the program and send the new program to
logger. These site specific variables are,
In addition an advanced user familiar with CRBasic programming can experiment with timing
loops in the program such as scan interval and log interval.
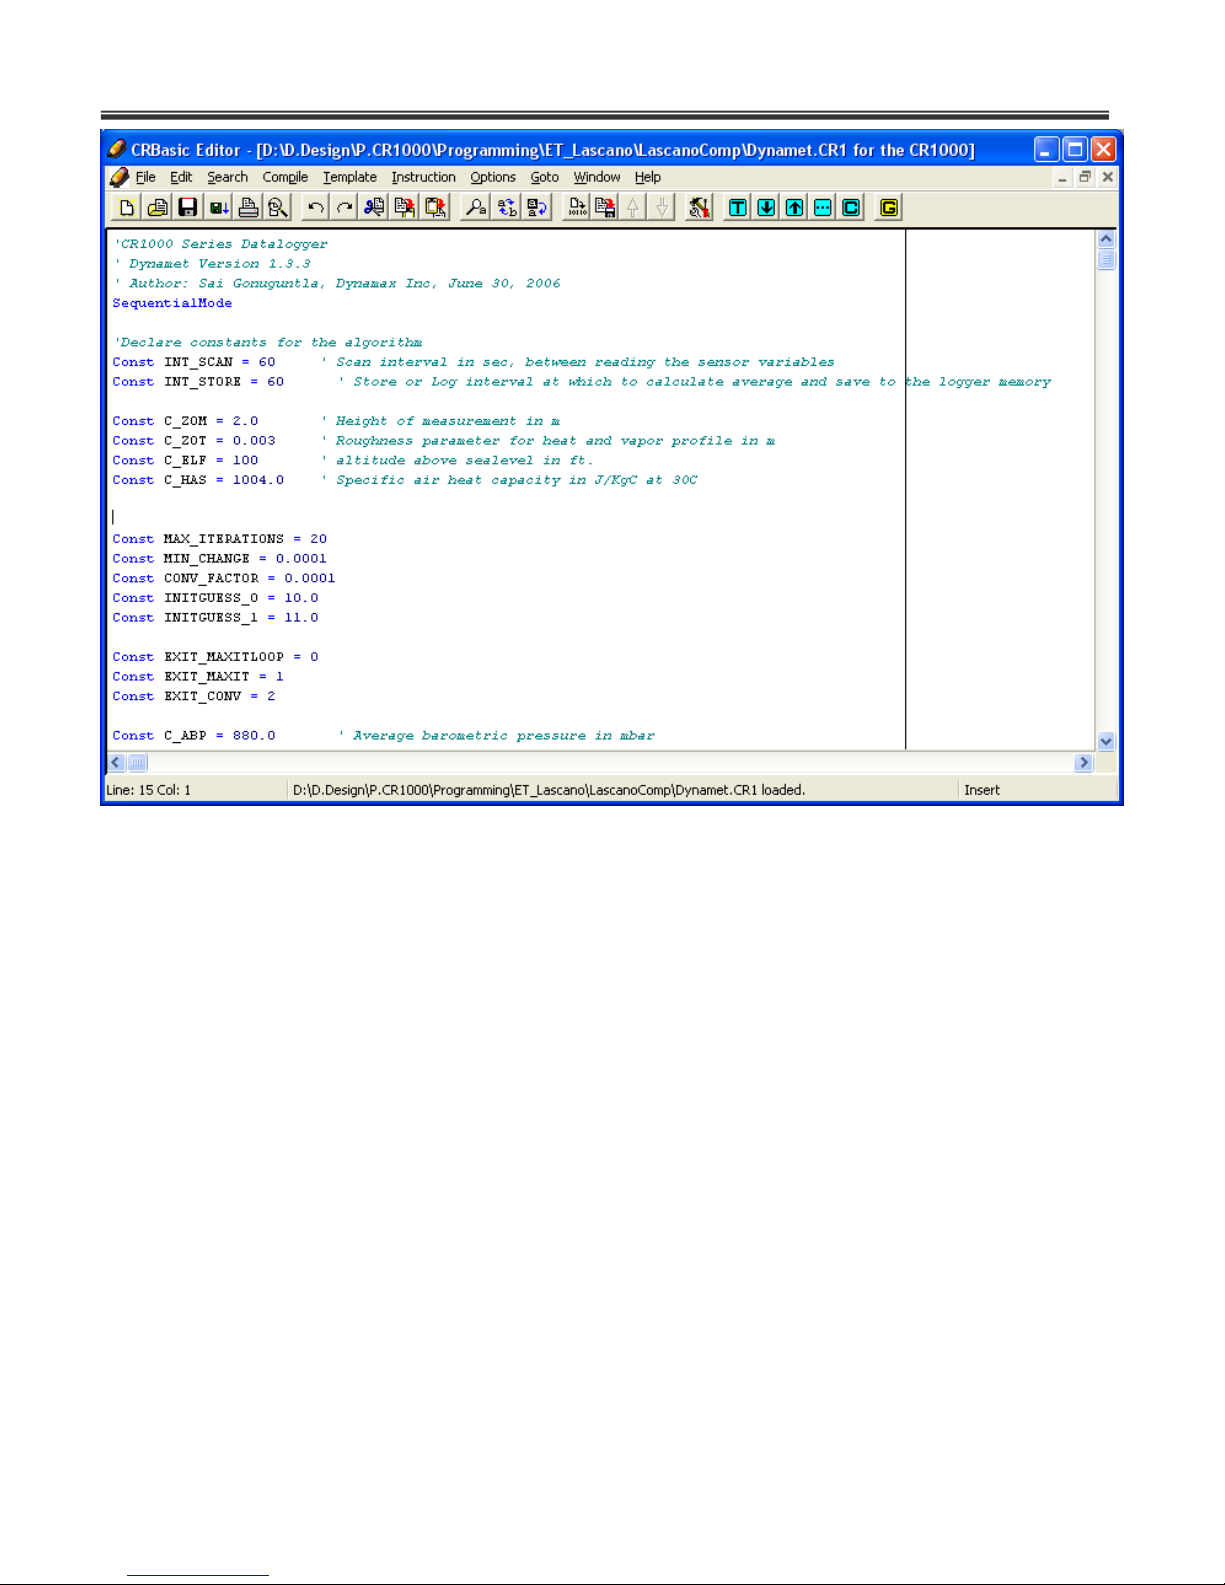
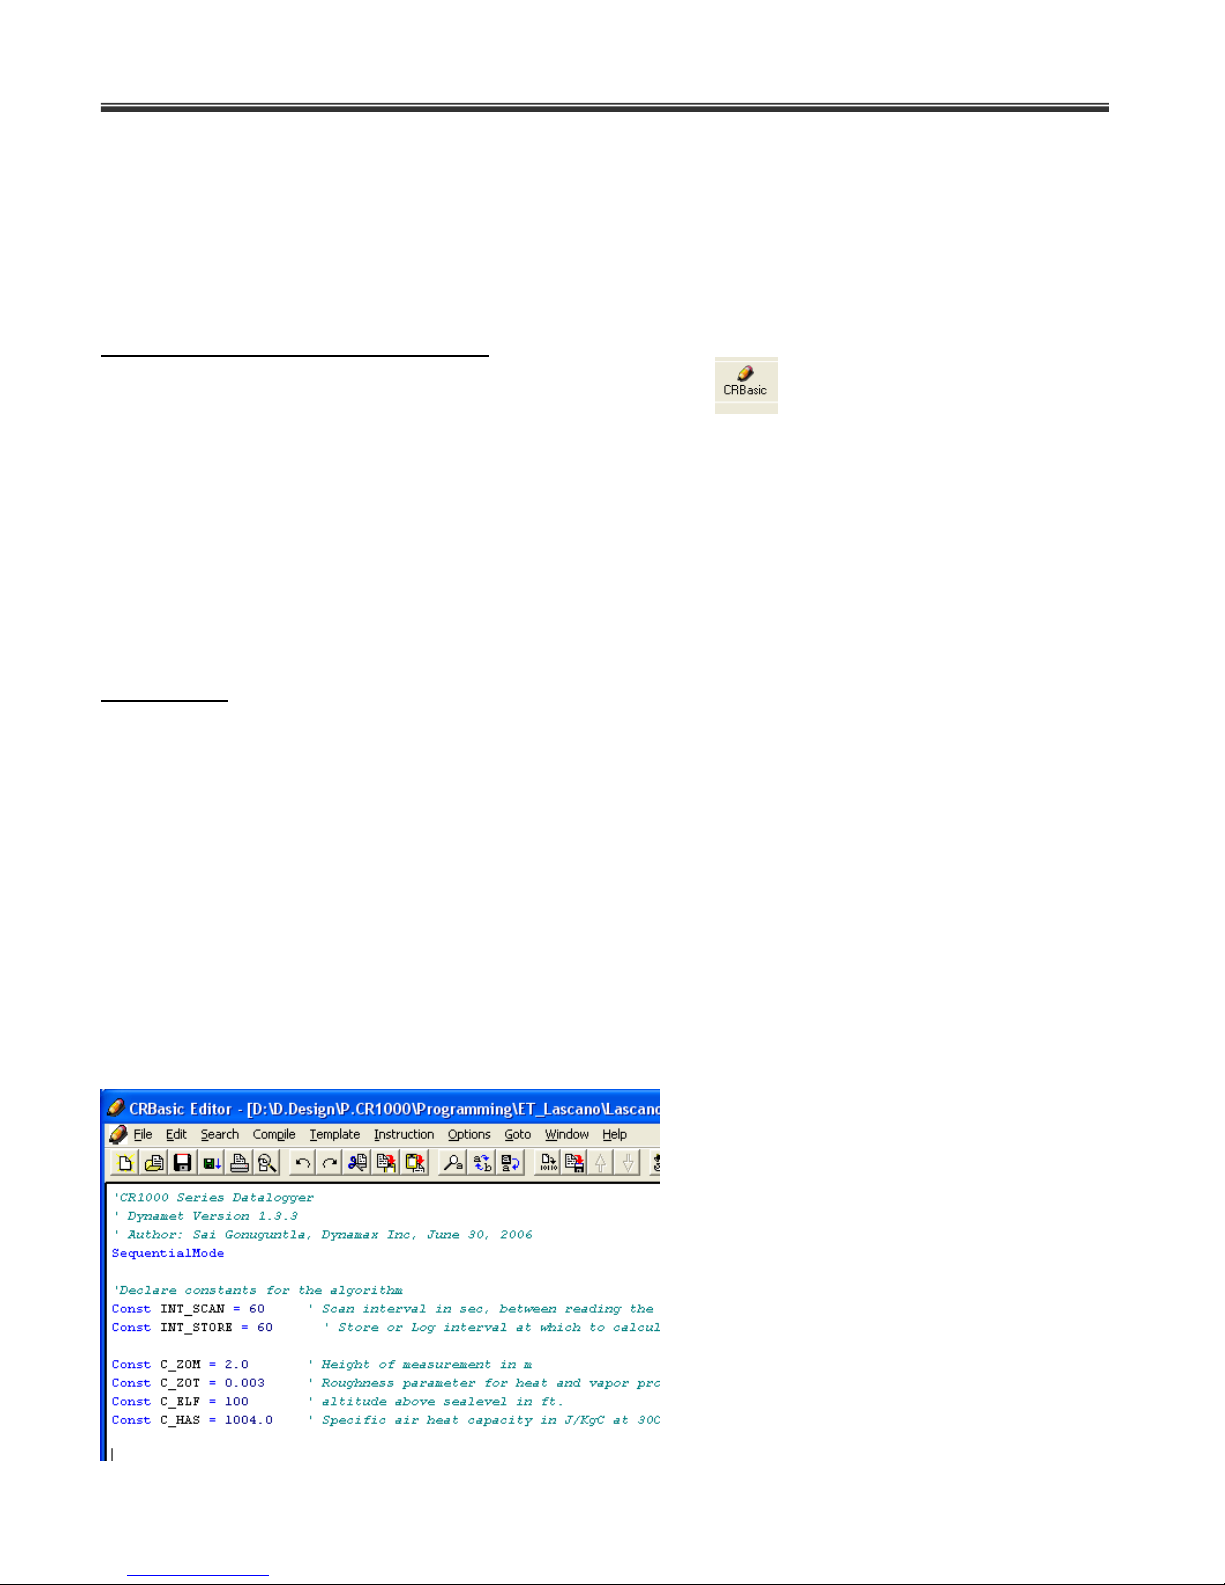
Program supplied with Dynamet 5 system has the above list of variables present at the top of
the program. Following is screen capture of the program Dynamet 5.CR1 as viewed in CR Basic
editor. As shown in the picture above list of variables appear in the following order at the top of
the program.
Page 39
Dynamax Inc
38
Notice in the figure timing loop parameters and site-specific parameters appear at the top of the
program to enable any users identify these variables and make changes if necessary.
Const INT_SCAN
Const INT_STORE
Const C_ZOM
Const C_ZOT
Const C_ELF
Const C_HAS
The following site-specific parameters must be modified to meet the geographical location at
which the station is setup to collect data. Timing loop parameters are options as the industry
standard is to collect data every hour.
Const C_ZOM
Const C_ZOT
Const C_ELF
Const C_HAS
Page 40
Dynamet 5
39
4.5 Customizing the Program
Following examples show how to modify the parameters, save and compile the program before
making it ready to send to the logger.
Procedure to Modify the Program:
Open CR Basic Editor by clicking on CRBasic icon .
Open the file Dynamet 5.CR1 in the editor.
Now identify the site-specific or timing loop variables at the top of the program as shown
in the previous above.
Modify values assigned to the constants as required.
Save the program under a different file name (Dynamet 5SiteA.cr1) so that the original
program is not modified. Save the program and compile.
Now the new program Dynamet 5SiteA.cr1 is ready to send to logger.
Example 1:
Dynamet 5 weather station is setup at a site that is only 50ft. above the sea level. The system is
installed on top of a tower whose height is 20m. Roughness parameter of the location of the
installation is found to be 0.001m and the specific air heat capacity is 1002.0 J/KgC. Modify the
program Dynamet 5.cr1 and send to logger so that the Dynamet 5 station can calculate ET
using the Lascano-VanBavel RCM algorithm.
From the program it is clear that the required station parameters are,
zom = 20 m
zot = 0.001 m
elf = 50 ft.
has = 1002.0 J/KgC
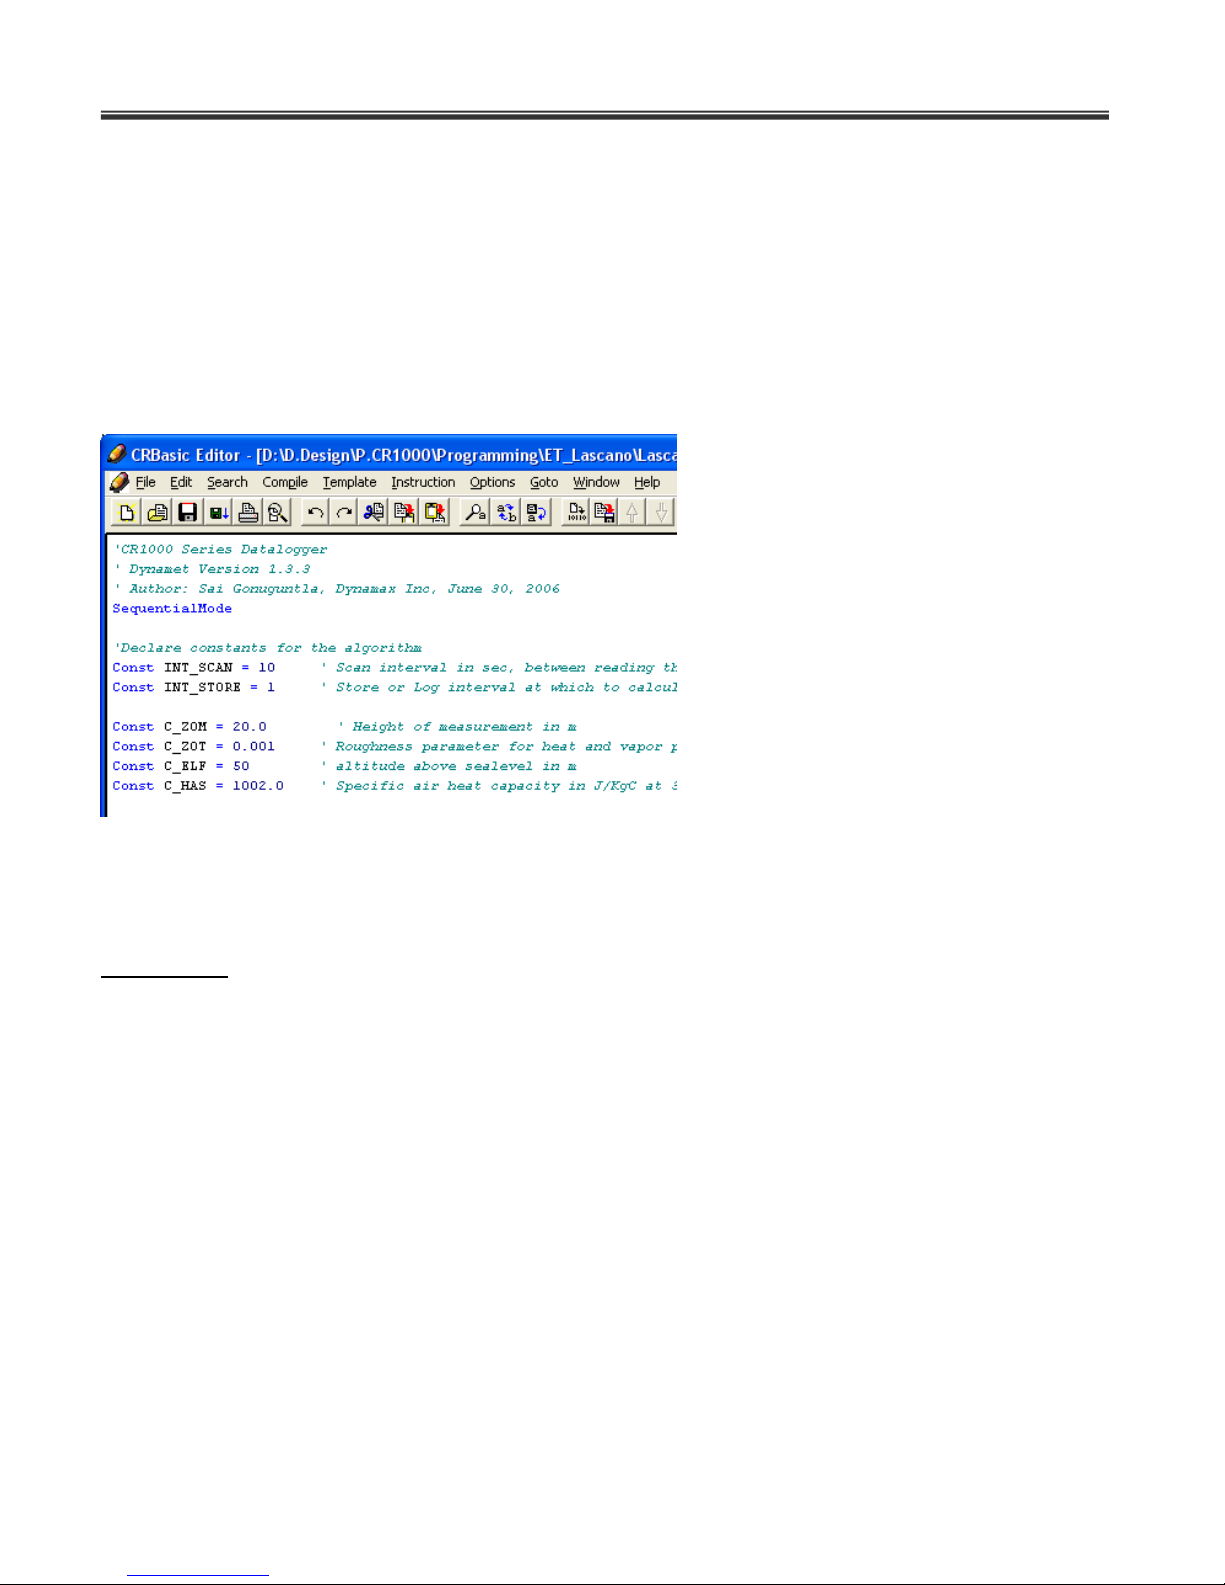
Open the program in Dynamet 5.CR1 in CRBasic. As shown below are the default parameters.
Page 41
Dynamax Inc
40
Now modify the station parameters/ constants in the program to reflect the new settings.
C_ZOM = 20
C_ZOT = 0.001
C_ELF = 50
C_HAS = 1002.0
Enter these values in program as shown below.
Save the program as a different name Dynamet 5Ex1.Cr1. Compile the program. In CRBasic
editor and the program is ready for sending to logger for data collection and ET computation
with the revised parameters.
Example 2:
Dynamet 5 weather station is setup at a site that is only 200ft. above the sea level. The system
is installed on top of a tower whose height is 5m. Roughness parameter of the location of the
installation is found to be 0.004m and the specific air heat capacity is 1002.0 J/KgC. The station
is located in a research site and the project requires sensor data to be read every 5 seconds
and store to logger every one minute. Modify the program Dynamet 5.cr1 and send to logger so
that the Dynamet 5 station can calculate ET using the Lascano-VanBavel RCM algorithm.
From the program it is clear that the required station parameters are,
zom = 5 m
zot = 0.004 m
elf = 200 ft.
has = 1002.0 J/KgC
Scan interval = 5 sec
Store interval = 1 min
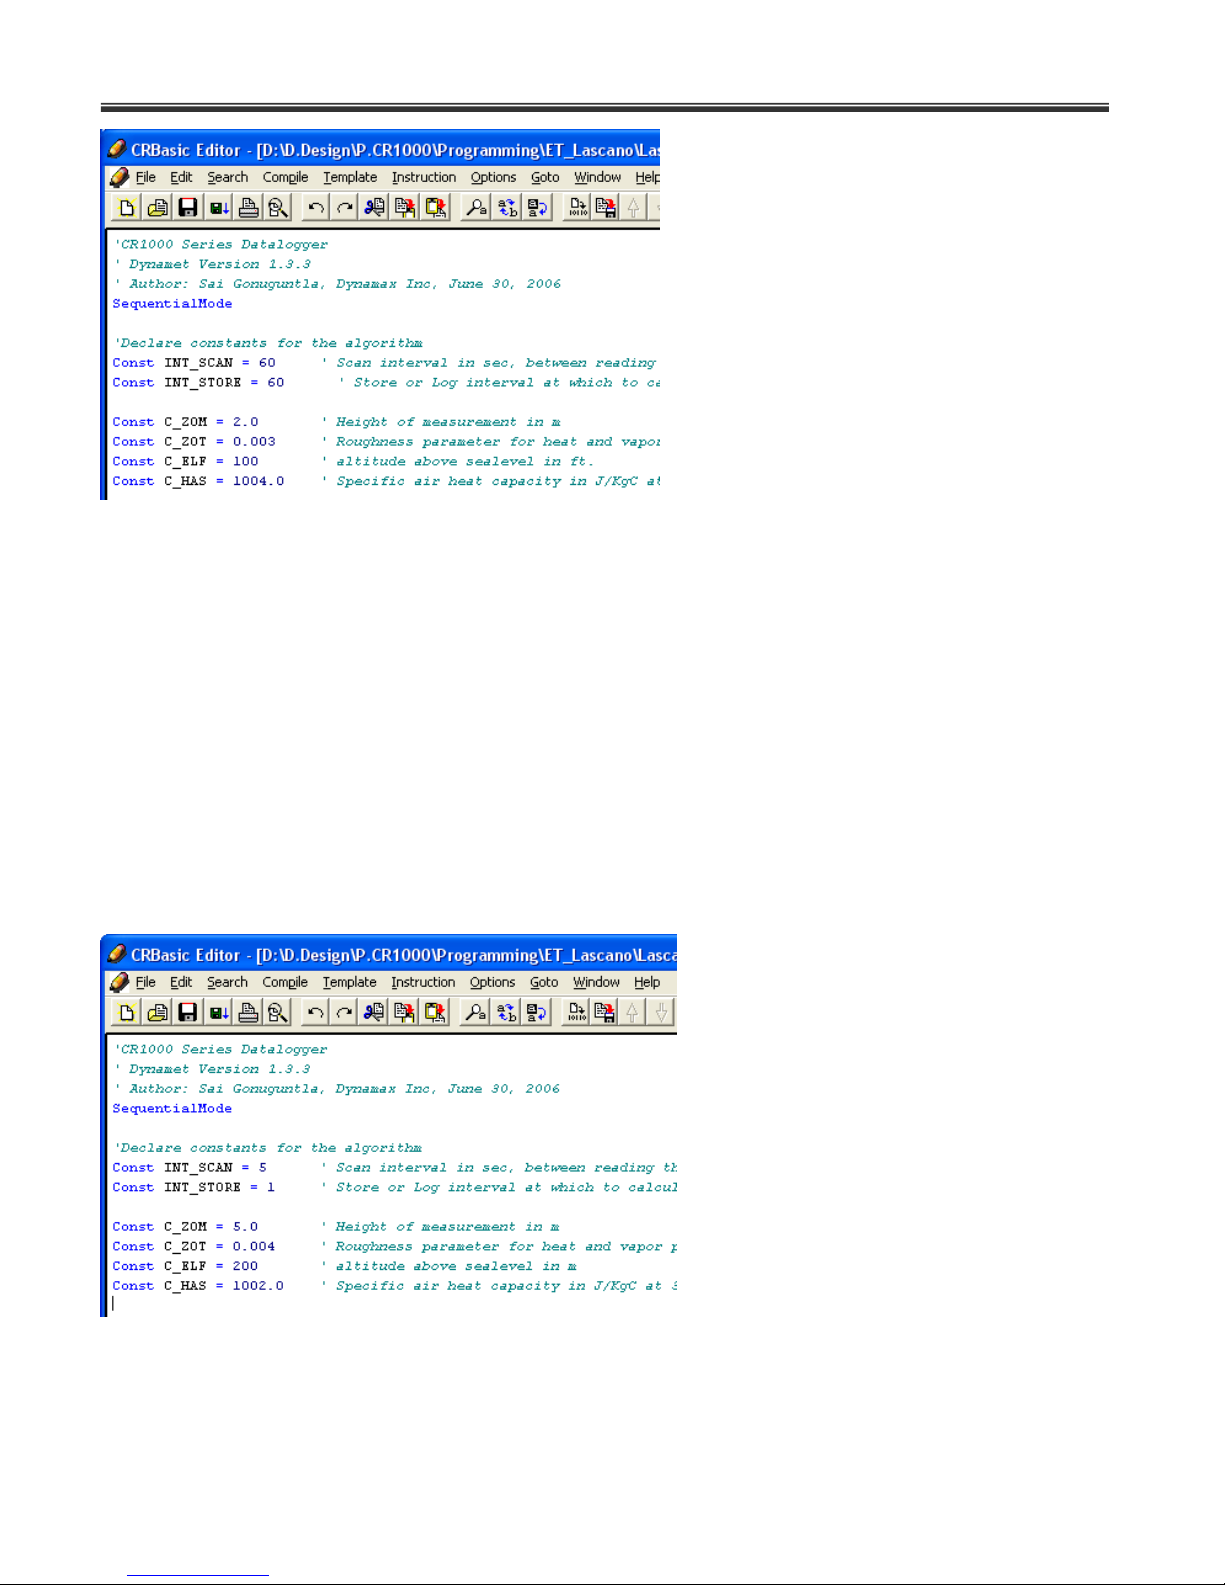
Open the program in Dynamet 5.CR1 in CRBasic. As shown below are the default parameters.
Page 42
Dynamet 5
41
Now modify the station parameters/ constants in the program to reflect the new settings.
INT_SCAN = 5
INT_STORE = 1
C_ZOM = 5
C_ZOT = 0.004
C_ELF = 200
C_HAS = 1002.0
Enter these values in program as shown below.
Save the program as a different name Dynamet 5Ex2.Cr1. Compile the program. In CRBasic
editor and the program is ready for sending to logger for data collection and ET computation
with the revised parameters.
Page 43
Dynamax Inc
42
5.0 USING PC400
5.1 Setup, Program Logger And Communications
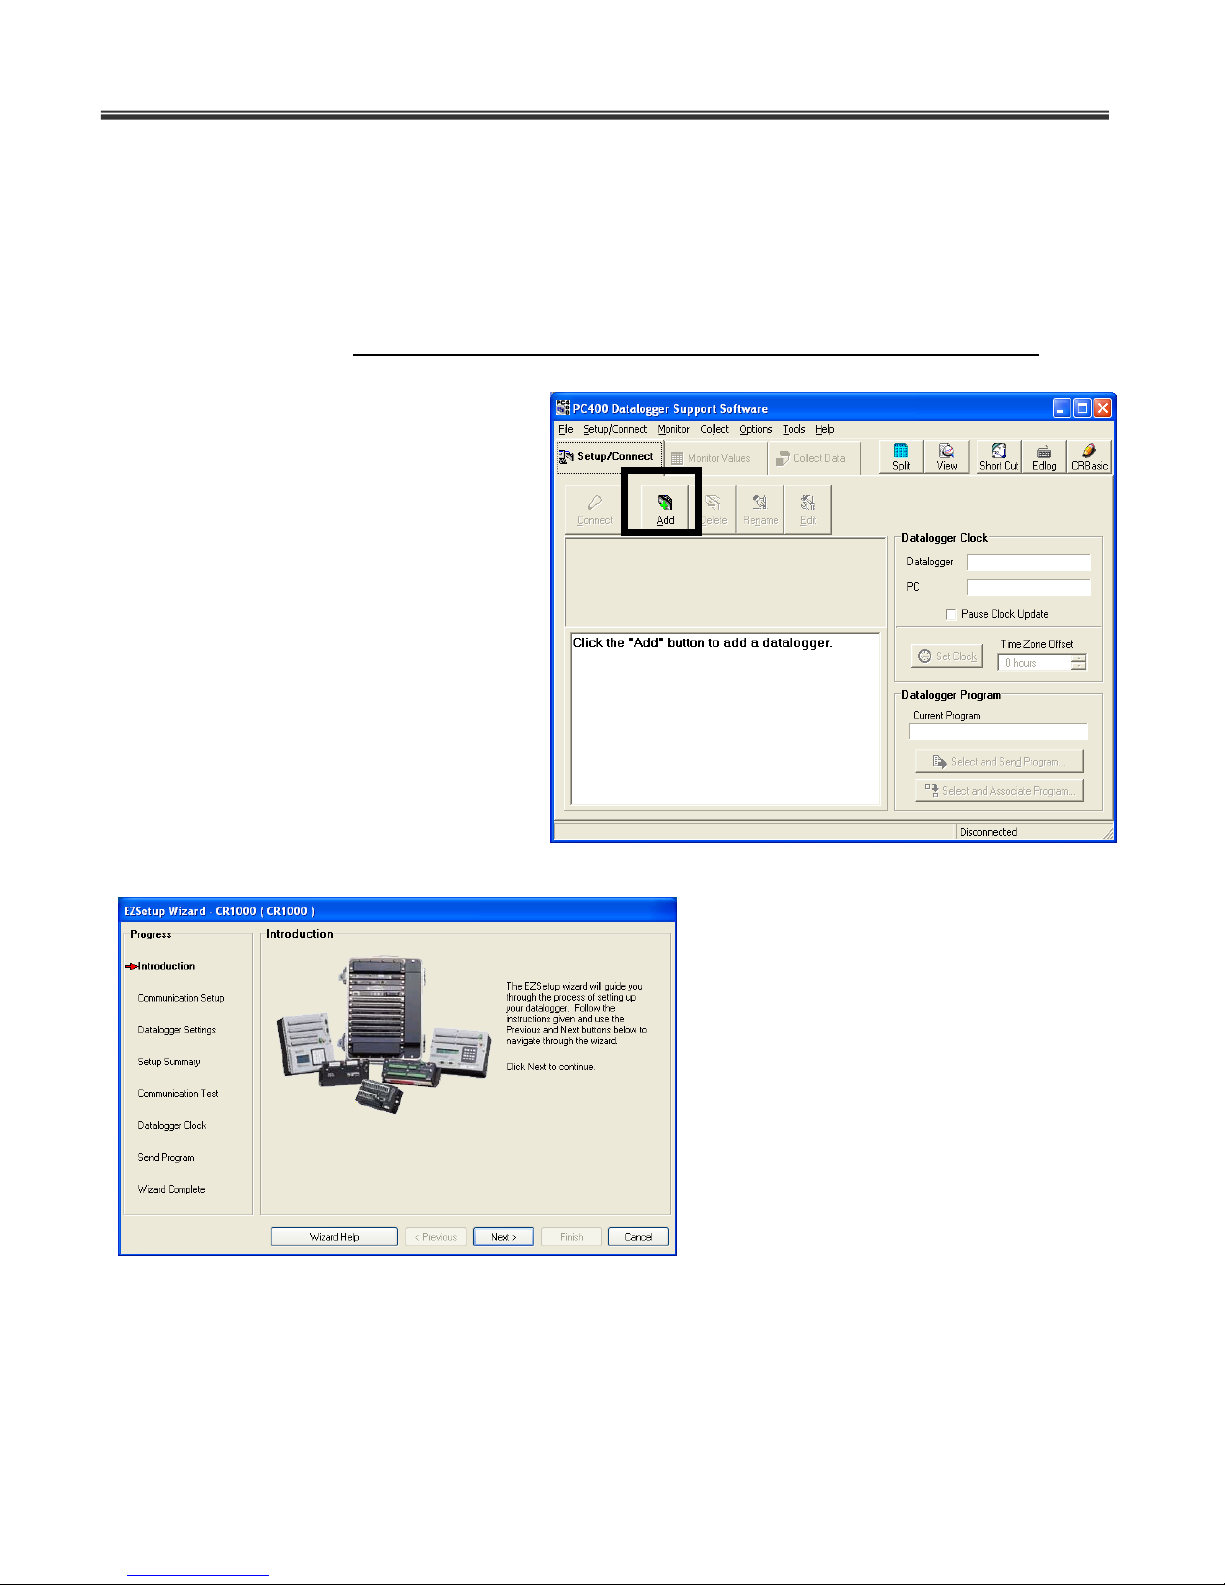
1. If this first time using software or to add a new logger station to the software setup click
on Add button. PC400 offers a easy to use step-by-step EZSetup wizard that will
guide through adding stations and connecting to logger. If the station is already added in
the list, proceed with connect to
logger in section 5.2.
2. EzSetup wizard is shown in the
screen to the left. Click Next to
start the wizard and complete
setup process. Select the data
logger as CR1000, assign
Dynamet 5 as the Name of the
data logger and enter the
following settings in the setup
wizard.
Page 44
Dynamet 5
43
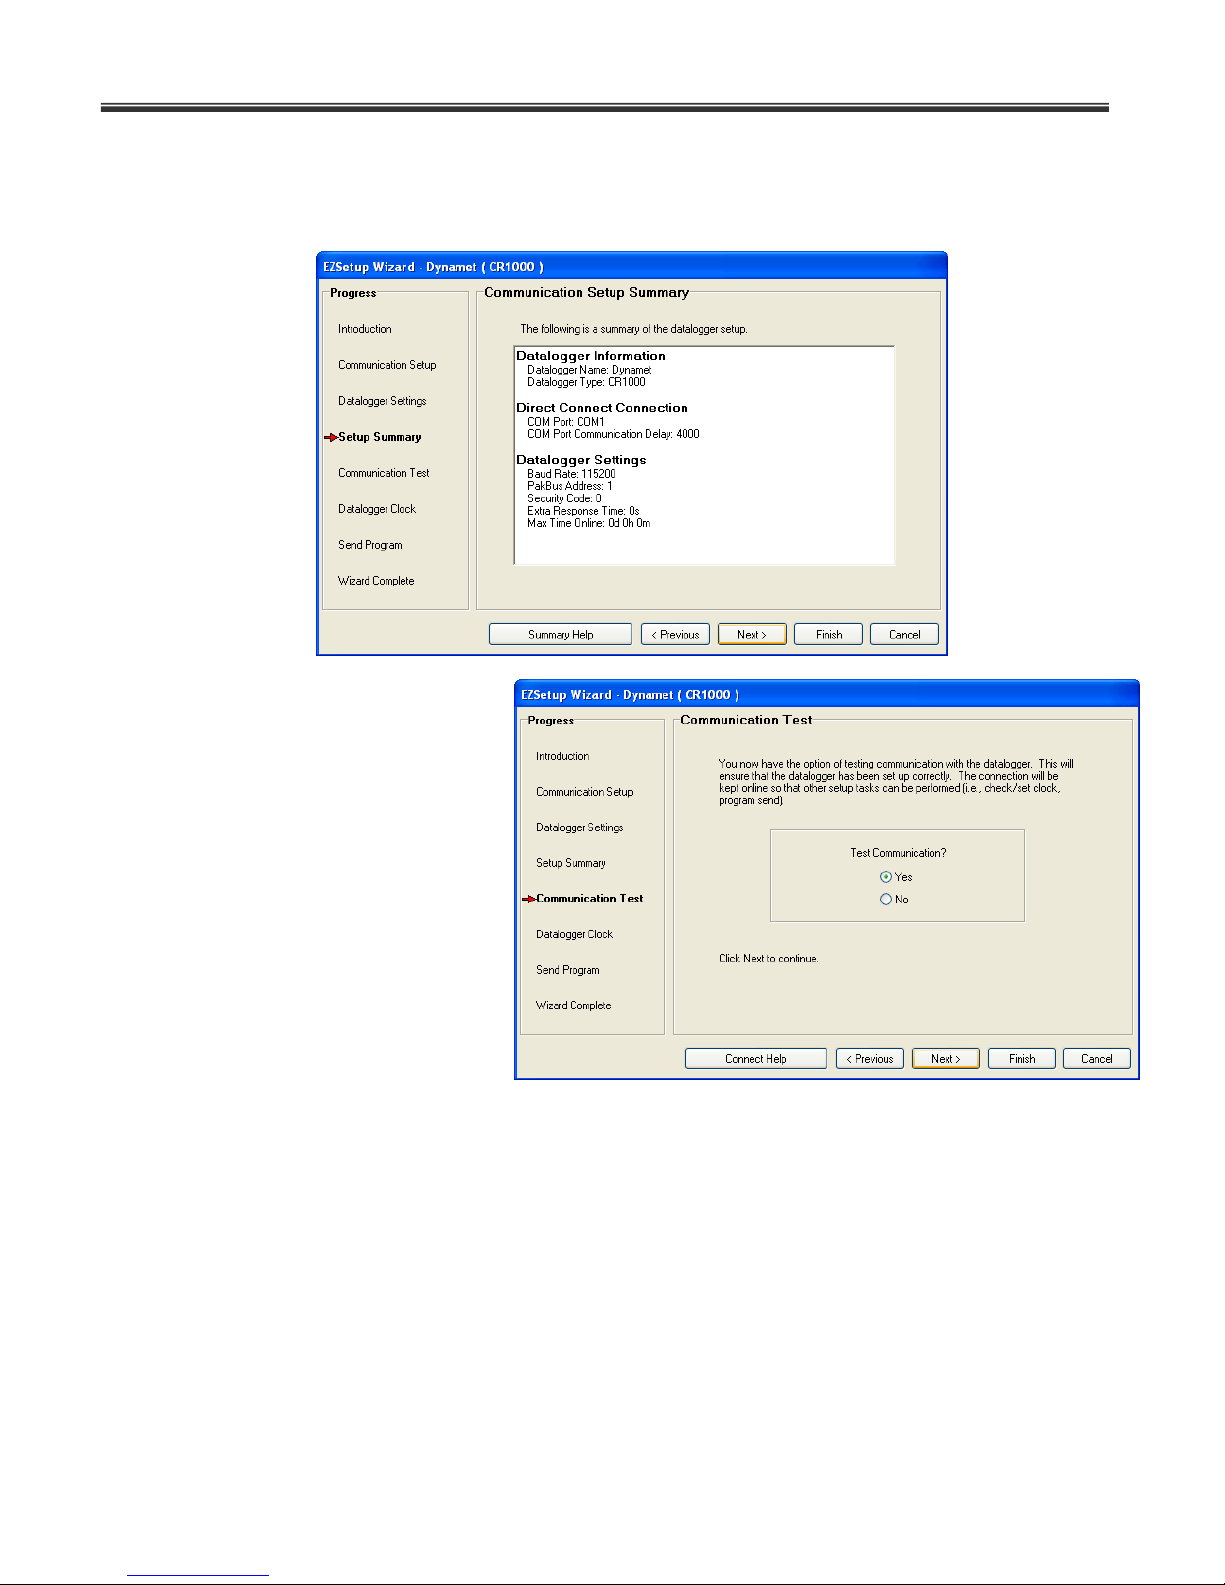
3. Setup wizard displays a summary of the settings as follows in the setup summary
window. For any changes such as COM port, baud rate click Previous button to change
the settings. When all the parameters are entered as required click next to proceed with
setup wizard.
4. At this point if data logger is
connected to PC COM port
using 5’ RS232
communication cable, you
may proceed with
communication test by
selecting Yes for the radio
button clicking Next. Or click
Finish to close setup wizard,
add this station (Dynamet 5-
1) to the station list for
connection and data retrieval
in future.
5. If Test Communication is selected in the previous window, PC400 software tries to
connect to the specified logger on the COM port assigned in the setup wizard. If the
Communication test is unsuccessful software responds with Communication test Failed
message and reverts back to the communication test window. At this point make sure
communication cable is connected to PC and logger is powered and retry the
communication test. Click Finish to skip communication test and connect at a later time.
6. If the communication test is successful Communication test successful window will be
displayed. Click Next to continue with setup wizard.
Page 45
Dynamax Inc
44
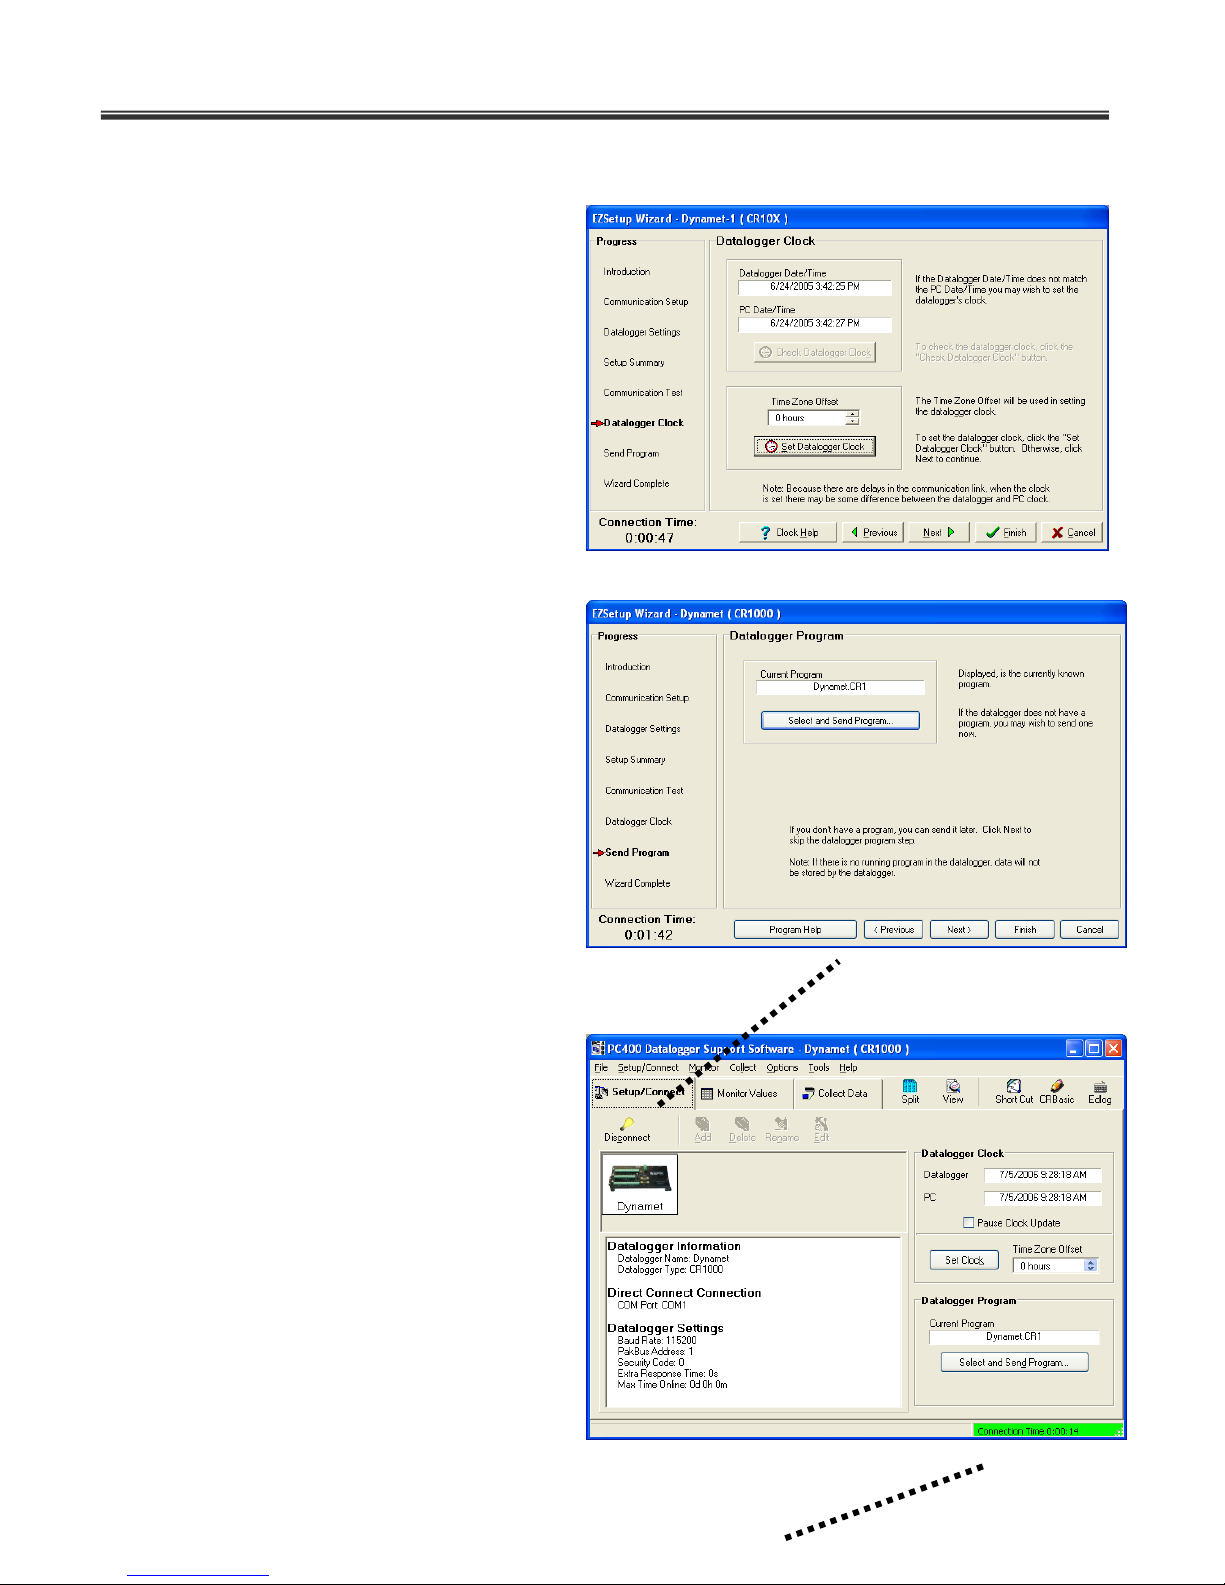
7. In the Datalogger clock window is
displayed as shown in the figure. If
Datalogger Date/Time is different
from the PC Date/Time, select time
zone offset between data logger and
PC and click Set Datalogger Clock
command button. Click Next to
continue.
8. In the Send Program window click
command button Select and Send
Program to select *.cr1 program
(Dynamet 5.cr1) using windows file selector and send to the data logger. Alternatively,
you many click on command button
Select and associate program for
sending to data logger at a later
time.
9. Click Next to complete the wizard
and then Finish to close the Ezsetup
wizard and revert back to PC400
main window as shown below.
Choose stay connected to keep the
communication and close the
Ezsetup wizard. Notice that a new
station “Dynamet 5” is added in the station list, along with the station parameters entered
while in the setup wizard.
10. In the PC400 Setup/Connect Tab
notice “Disconnect button is
displayed” as shown in the figure
below and on the bottom right corner
displays Connection time, implying
software is currently connected to
the data logger. Also data logger
clock and data logger program can
be set from this window.
11. Connecting to a data logger already
setup in the software is described in
the next section.
Page 46
Dynamet 5
45
5.2 Connect To Logger
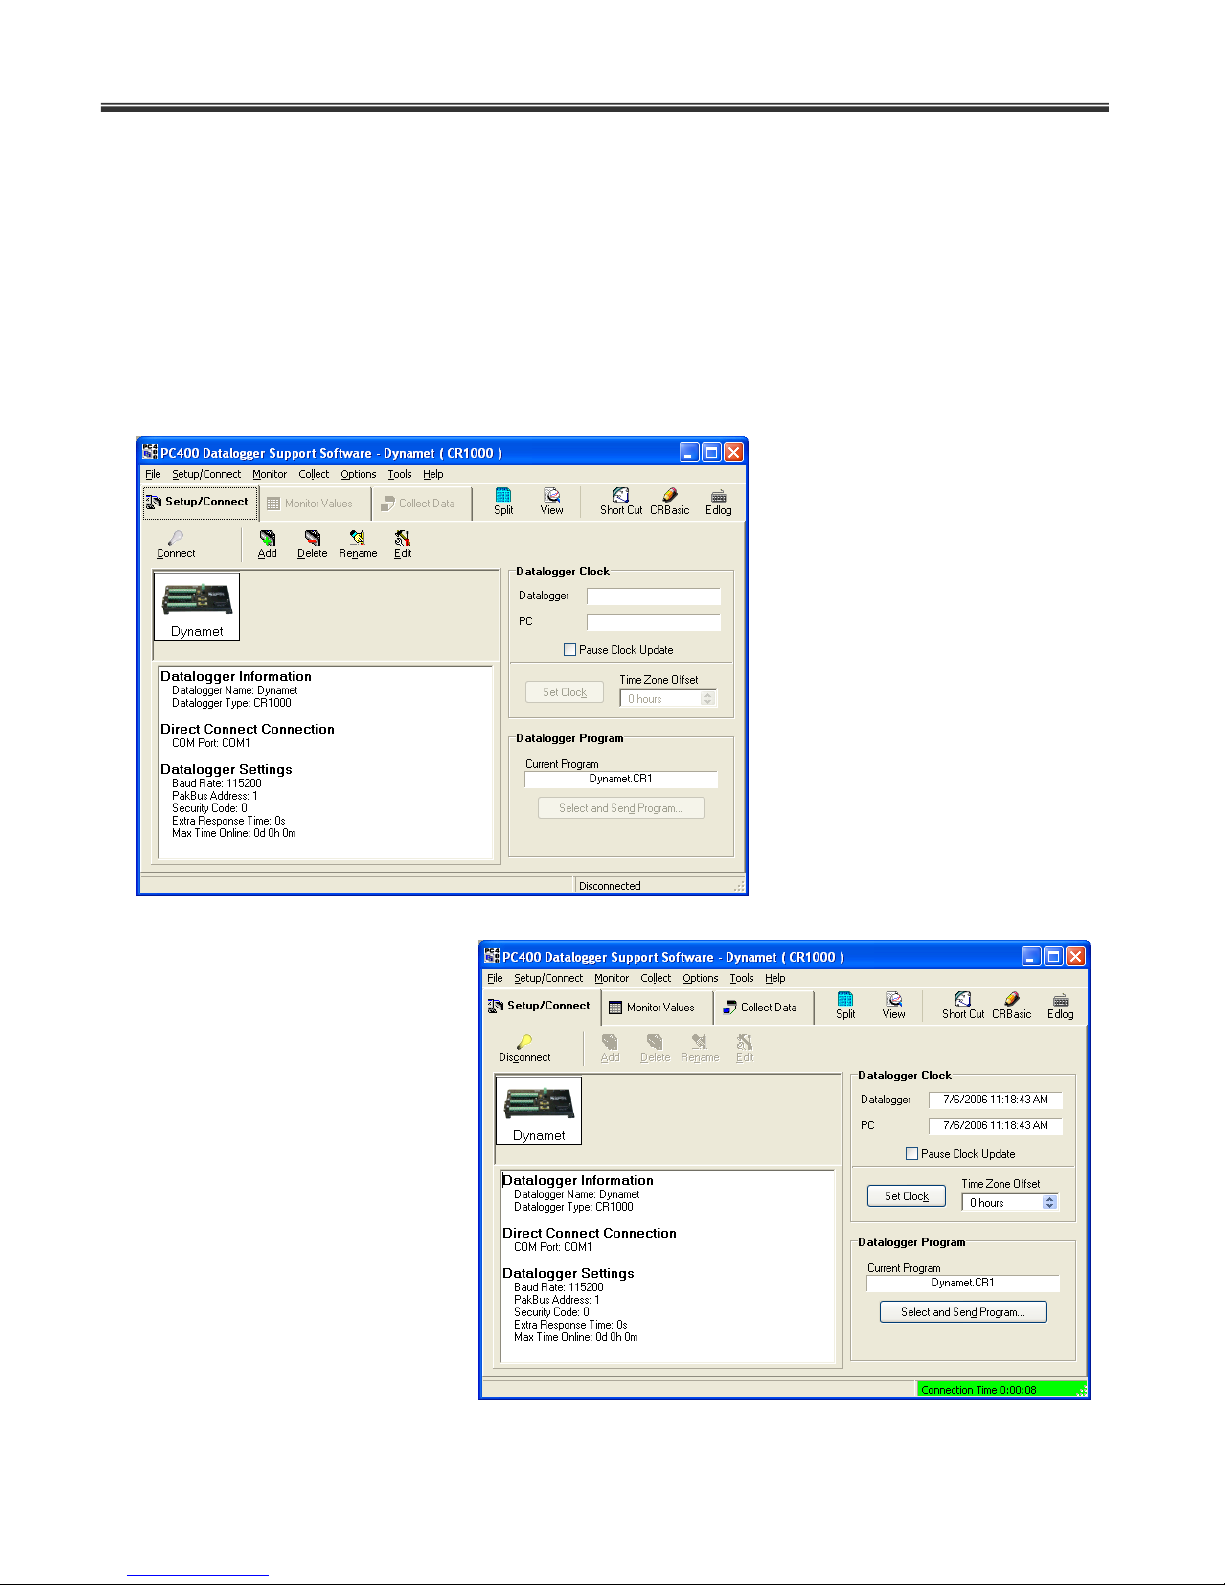
PC400 saves data logger setting once added in the software for future connections. A list of
stations with name assigned is displayed in the Setup/ Connect tab of PC400 software as
shown in the figure. A summary of the previously assigned settings in the software is displayed
on in this window as shown below. Click on a station to view the settings previously entered to
that particular station. To change or edit a station’s settings simply click Edit button while the
station is selected.
To connect to a logger for setting
up program or data retrieval,
simply select the station name
and click on Connect button.
If the connection is successful
Connect button changes to
“Disconnect” and Connection
time is displayed at the bottom
right corner indicating software is
currently connected to the data
logger.
Click command button Select
and Send Program to send a
new program to the logger.
If data logger clock and PC clock
are different select Offset and
click Set Clock to update data
logger clock.
Page 47
Dynamax Inc
46
5.3 Monitor Data In Real Time
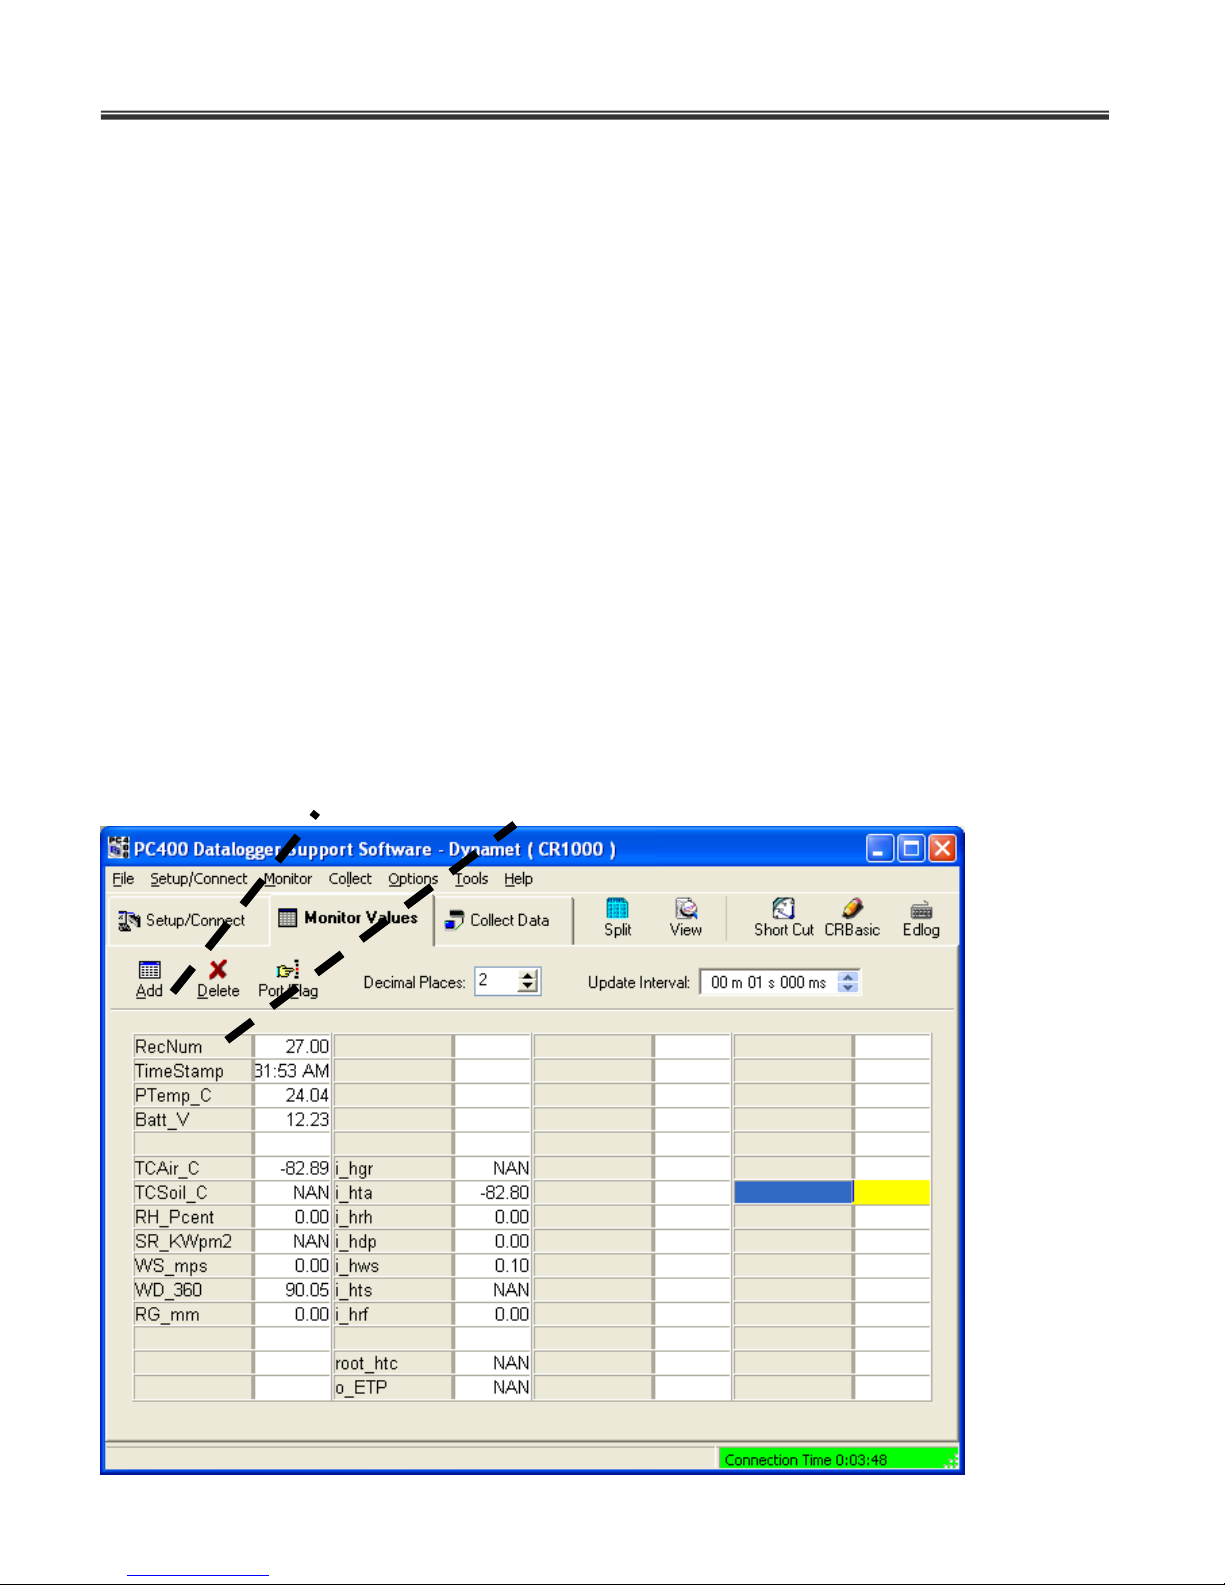
With communication established between software and the data logger, select Monitor Values
tab in PC400 window. This is similar to Numeric panel in PC208 and LoggerNet.
1. Click on Add button to open the signal list. Select Public from the left column to display public
variables available in the right column. Select desired signals from the right column. Click on a
cell in the Monitor values window, Click Paste button. All the selected signals will be displayed in
the Monitor values window. Note that if you have a long averaging interval, it will take that amount
of time to see a new reading. You may want to temporarily select a smaller interval or use
maintenance program to test the operation. And then download the program with required long
term averaging interval later. Any unwanted signals in Monitor window can be removed simply by
selecting the cell and click Delete button.
2. Once in the Add menu, to select a range of values select the starting label, click on the beginning
(for example TCAir_C) and then a SHIFT-Click on the ending of the range (for example RG_mm)
and then click the Paste button.
3. Note any variables displaying a “-NAN” are a out of range, or in the case of a sensor input
location, it is a open circuit wire.
4. In the figure below all Dynamet 5 sensor variables are displayed in the monitor mode.
Page 48
Dynamet 5
47
5.4 Data Collection
An active communication to the data logger is required to connection between software and
weather station and for collecting data. In labs, nearby field tests or environmental chambers,
the logger can be within RS232 cable connection range (100 ft), or within the range of a
broadband radio link up to 40 miles (using Dynamax's RFMX modem) or cellular wireless
connection (using Dyanamax’s GSM modem). In addition to data collection real-time monitoring
of data can be performed from a remote station explained in the previous sections. Following
steps explain data retrieval manually at will.
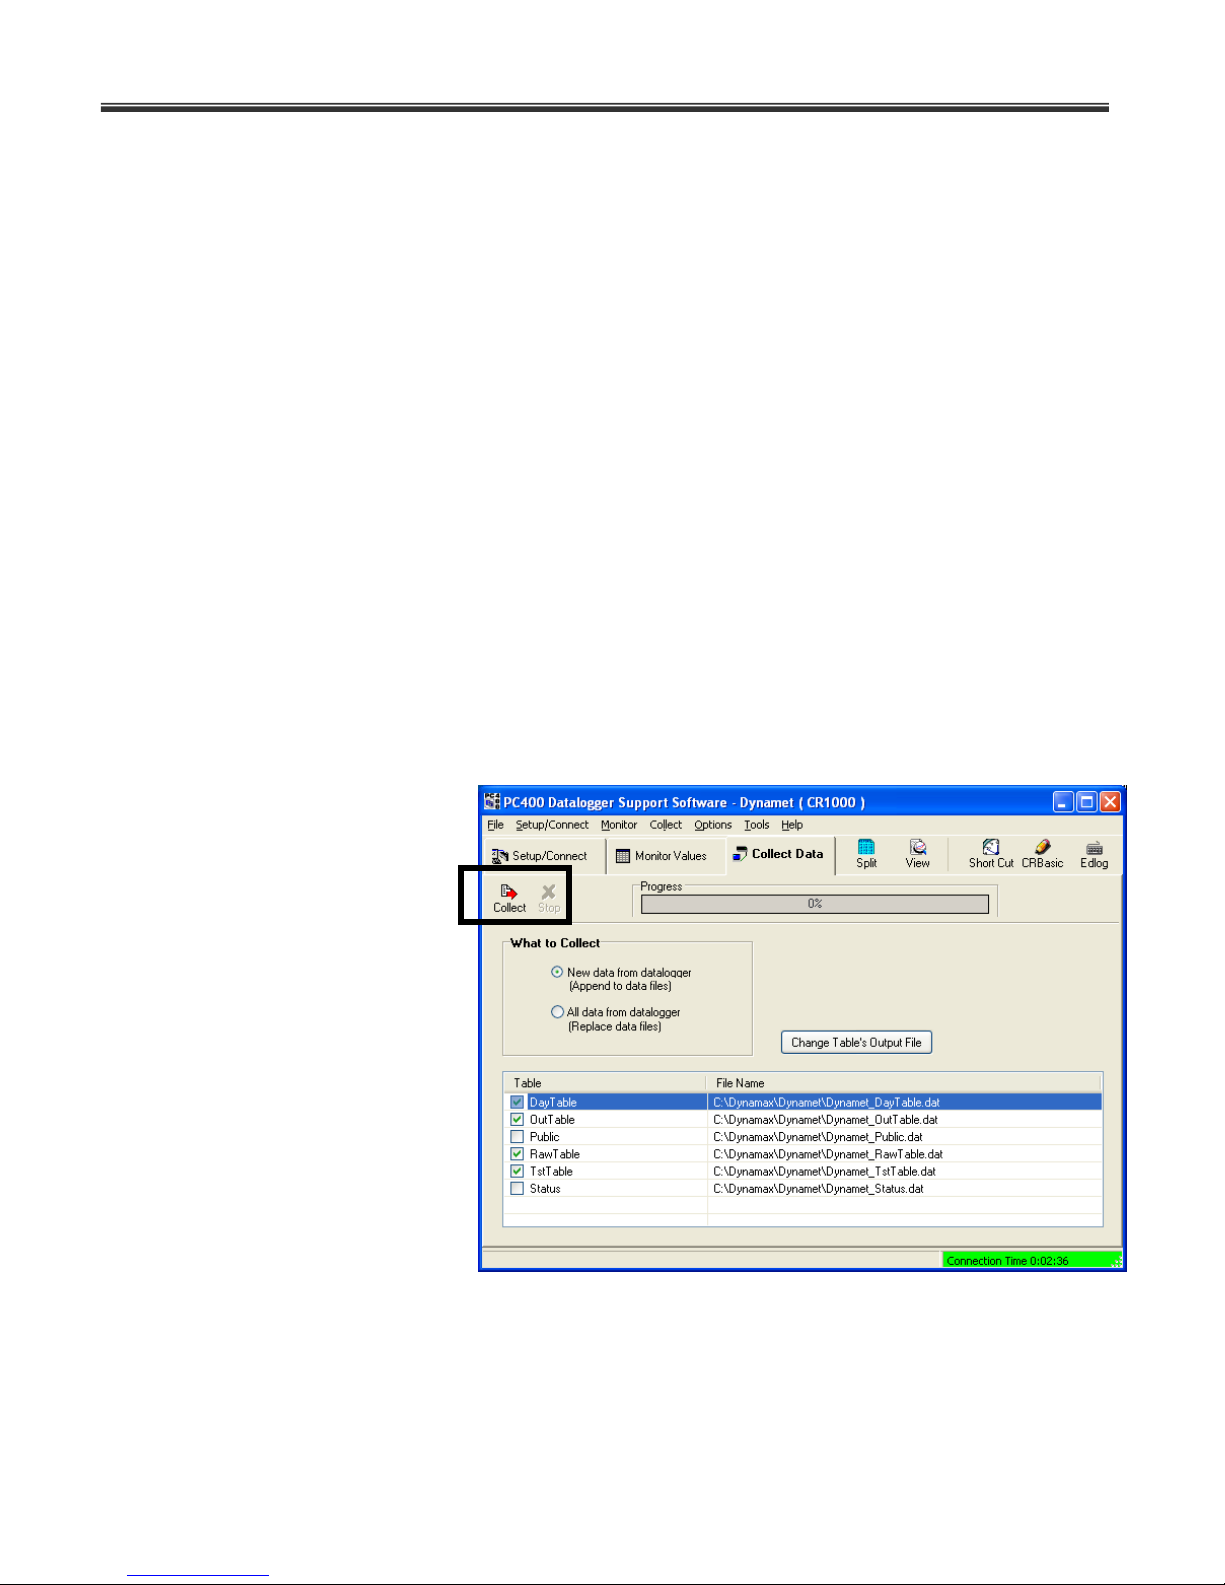
1. With software connected to the data logger select Collect Data tab in PC400 software to
display data retrieval options and controls.
2. Select the required tables to collect by simply enabling the check box to the left of the
table name. If desired change the file name or path by double clicking on the table name
or by clicking on Change the Table’s output file command button while the required
table is selected. Notice that the output files can be assigned .csv, .dat, .prn etc and
corresponding file formats. We recommend using a .csv format such that the downloaded
data files can be viewed easily using any spreadsheet application such as Excel.
3. Select what to collect options, choose New data from logger option to collect only new
data since the last retrieval
and appends to specified
file name. Choose All
data from logger collect
and dump all the data
present in the logger and
overwrite the specified file
name. Note: All data
from logger option overwrites any existing data
in the file.
4. Before proceeding make
sure desired file name and
properties are displayed in
Collect tab.
5. Click Collect button to
start data collection and
save to file. Wait for software to complete retrieval and respond with “Collection
Complete” message. Click on stop command button to stop data collection at any time.
6. Now the data is collected and saved to data file for further processing and analysis.
Page 49

Dynamax Inc
48
PC400 supports only manual data collection. For applications using network
communication options, automatic data retrieval and schedule choose advanced data
logger support software such as LoggerNet.
Page 50

Dynamet 5
49
5.5 Advanced PC400 Features
In addition to basic options explained above for Flow32 operations an advanced user can
explore a myriad of other features offered by PC400 data logger support software’s explained
else where in the manual or in different booklet.
5.5.1 View data and Graphics
View is a program that can be used to open data files (*.DAT, *.PRN, *.CSV), or other CSI file
types (*.DLD, *.CSI, *.PTI, *.FSL, *.LOG, *.CR5, *.CR9). Data files can be viewed numerically,
or up to two traces can be plotted on a graph. Both numeric data and graphs can be sent to a
printer. Graphs can be saved to disk in BMP, WMF, or EMF format.
View data feature is explained in chapter 6 and PC400 manual.
5.5.2 SHORT CUT/ SCWIN
Short Cut for Windows (SCWIN) is an application for generating programs for Campbell
Scientifics' data loggers and pre-configured weather stations. SCWIN guides you through four
steps to program a data logger to measure your sensors and select the data to be stored in the
data logger's final storage. Once a program is completed, SCWIN generates a wiring diagram
for connecting your sensors to the data logger. SCWIN software feature is not applicable to
Flow32 but an advanced user may choose to use SCWIN for advanced programming.
5.5.3 CRBasic – Program Editor
CRBasic is programming editor and compiler for table-based data loggers such as CR1000 etc.
This feature is not applicable to current version of Flow32 data logger.
Page 51

Dynamax Inc
50
6.0 DATA FORMAT, VIEW AND GRAPHS
Connecting to Dynamet 5 weather station using PC400 software and collecting data is
described in the previous chapter. This discusses in detail
o File formats
o Data formats
o Open data file using VIEW, Plot signals
o Open data file using Excel, Plot signals
As explained in the previous chapter section, “Collect data for offline processing”, the tables
(files) of interest to the end-user are,
Raw Table………… saved in………… Dynamet 5_RawTable.csv
Out Table………… saved in………… Dynamet 5_OutTable.csv
Day Table………… saved in………… Dynamet 5_DayTable.csv
In this section we discuss in detail contents of these data tables (files), format of data presented
in these files, units, how to view and chart data and further analysis if any.
6.1 File Format
As explained in the previous chapter, section “Data Collection”, the Dynamet 5 data files can be
saved with the .csv, .dat, .txt, .prn extensions. Comma separated file format is the
recommended file format as it allows the files to be viewed using any of the spreadsheet
applications such as Excel. Following table shows some of the key differences among the file
formats.
.csv Data points with in a line are delimited by a comma. Simply open the file in Excel
to view the data in a more readable format in rows and columns.
.dat Same as .csv but saved with extension .dat, to readily view the files in text editors
as well as Campbell scientific’s VIEW application
.txt Same as .csv but saved with .txt extension.
.prn Data saved with TAB delimitor. This enables to view easily in a row and column
format in a text editor or to print easily in the row and column format from a text
editor.
Page 52

Dynamet 5
51
6.2 Dynamet 5 Data Format
Data collected from Dynamet 5 is in three different files as shown below. All these files are
saved with a header showing the logger type, column header/ variable name.
Raw Table………… saved in………… Dynamet 5_RawTable.csv
Out Table………… saved in………… Dynamet 5_OutTable.csv
Day Table………… saved in………… Dynamet 5_DayTable.csv
Raw Table file containing raw data form the meteorological sensors Air Temperature, Soil
Temperature (if available), Solar radiation (Global) sensor, Wind speed, Wind direction and Rain
gauge.
Raw data Table format:
Time Stamp
Record#
Jday
HHMM
TCAir_C
RH_Pcent
SR_KWpm2
WS_mps
Wdir_Deg
WS_mps_WVc(1)
WS_mps_WVc(2)
WS_mps_WVc(3)
RG_mm
TCSoil_C
Batt_V
Ptemp_C of CR1000 logger
Out Table file contains raw sensors values averaged over the storage interval and calculated
Dew Point in degC, calculated Surface temperature in degC using iterative RCM algorithm,
calculated ETP using Lascano-VanBavel recursive algorithm.
Output Table Format:
Time Stamp
Record#
Jday
HHMM
SR_KWpm2
TCAir_C
RH_Pcent
Page 53

Dynamax Inc
52
DewPoint_C
WS_mps
TCSoil_C
RG_mm
SurfaceTemp_C
ETP
Day Table file contains Daily accumulated ET, maximum/minimum/average/total (wherever
applicable) values for the entire day of the meteorological sensors.
Daily Table Format:
Time Stamp
Record#
Jday
ETP_Total
Surface Temperature Average
Surface Temperature Maximum
Sufrace Temperature Minumum
DewPoint_C Average
DewPoint_C Maximum
DewPoint_C Minimum
TCAir_C Average
TCAir_C Maximum
TCAir_C Minimum
RH_Pcent Maximum
RH_Pcent Minimum
SR_KWpm2 total
WS_mps Maximum
WS_mps Minimum
RG_mm Total
DewPoint_C
TCSoil_C Average
TCSoil _C Maximum
TCSoil _C Minimum
BattV Minimum
Ptemp_C Maximum
Ptemp_C Minimum
Page 54
Dynamet 5
53
6.3 Open Data – Using “View”
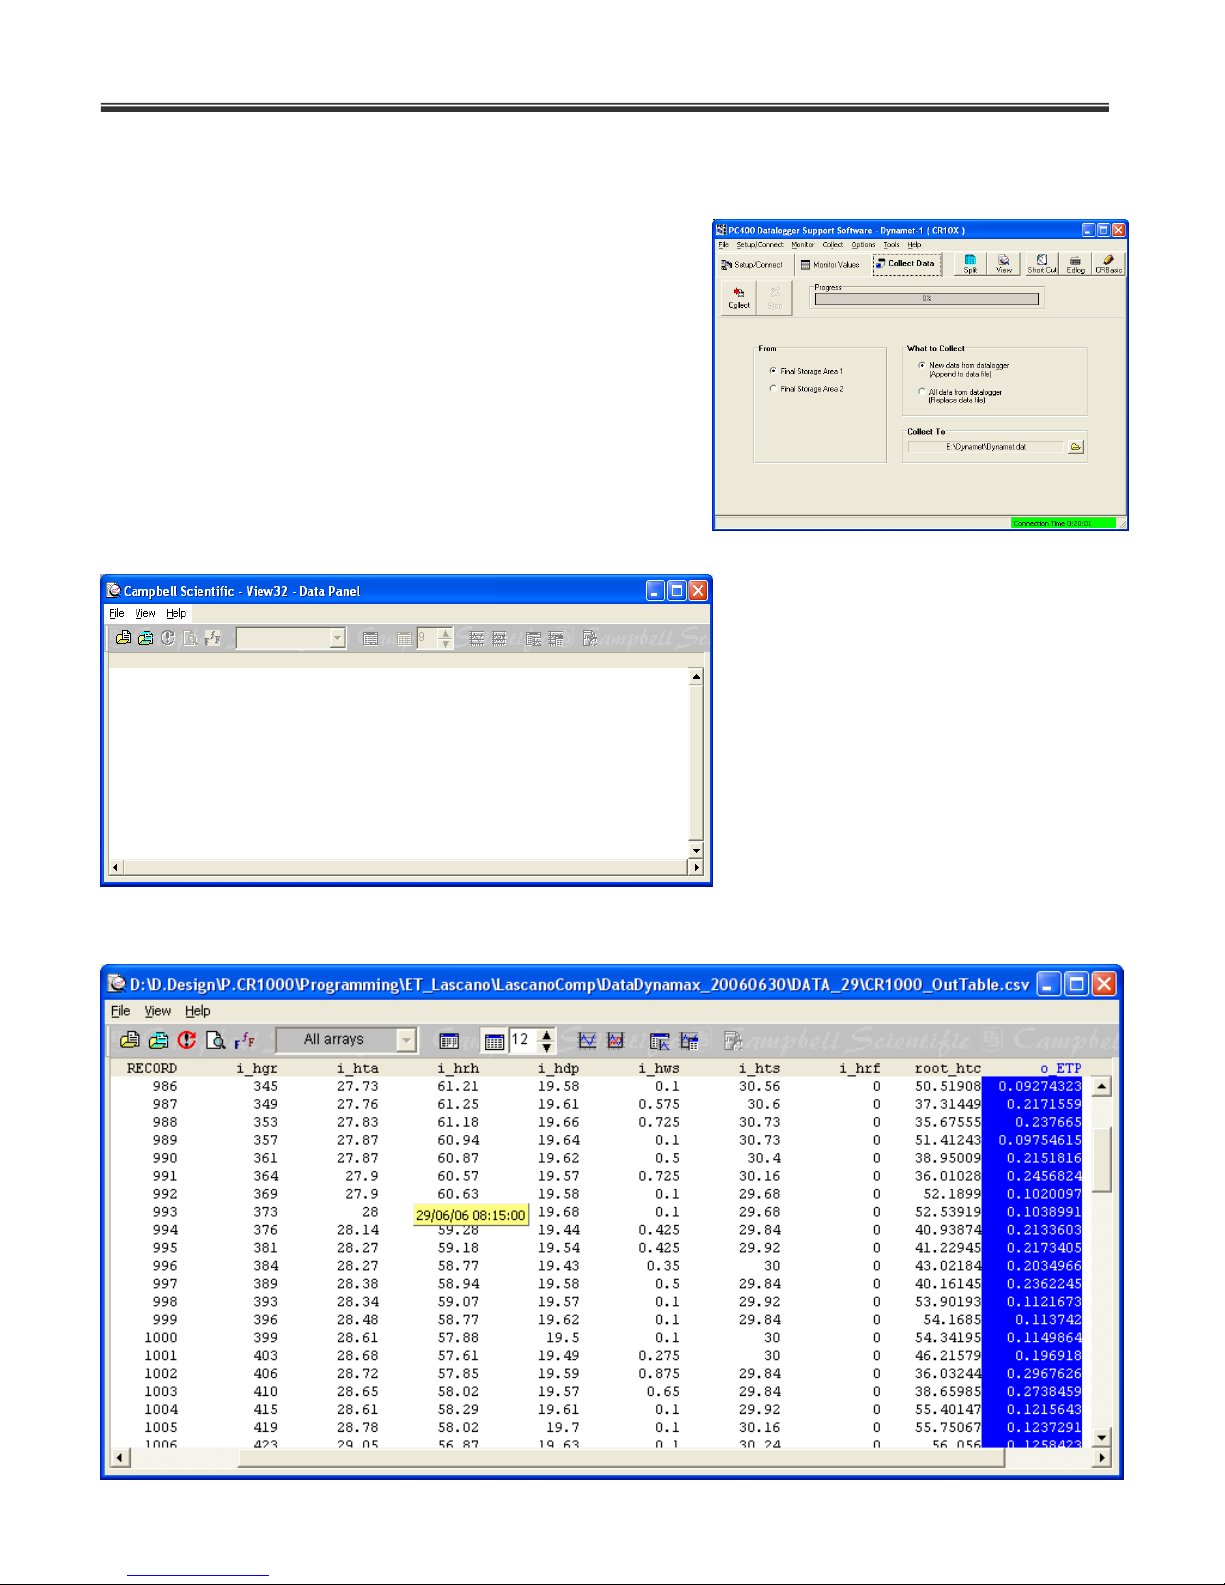
1. Now that the data is retrieved form the CR1000
logger, PC400 VIEW utility is a great tool for a quick
look at the data. VIEW also allows plotting two columns
at a time for observation and save to bitmap file. Click
on the VIEW button on the PC400 main toolbar to
launch VIEW utility.
1. Click on File Menu
and browse down to
5_OutTable.csv
2. Now the output table is
displayed in the VIEW window
in csv format. Click on View
Menu and then Expand tabs to
see the data in the column
format, shown below. Format of
the data was discussed earlier.
Column header shows the variable name associated with the values displayed in the
column along with the units.
Dynamet
Page 55
Dynamax Inc
54
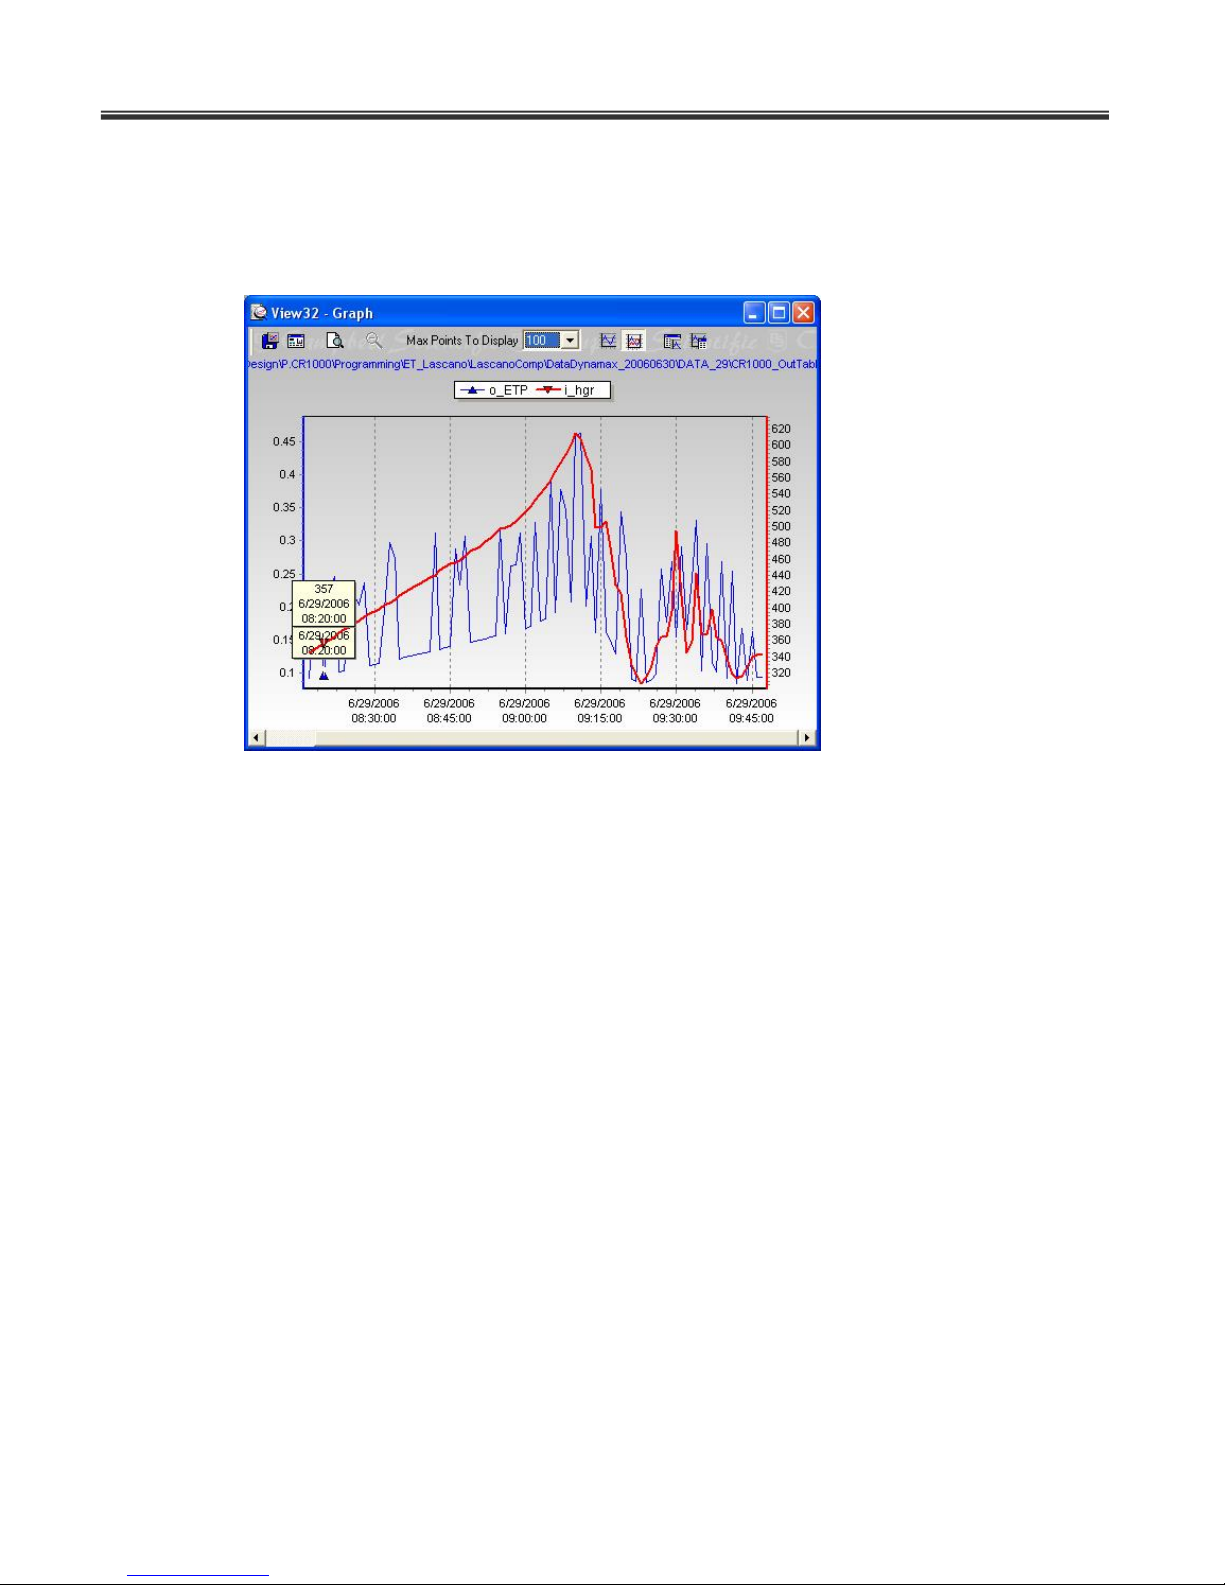
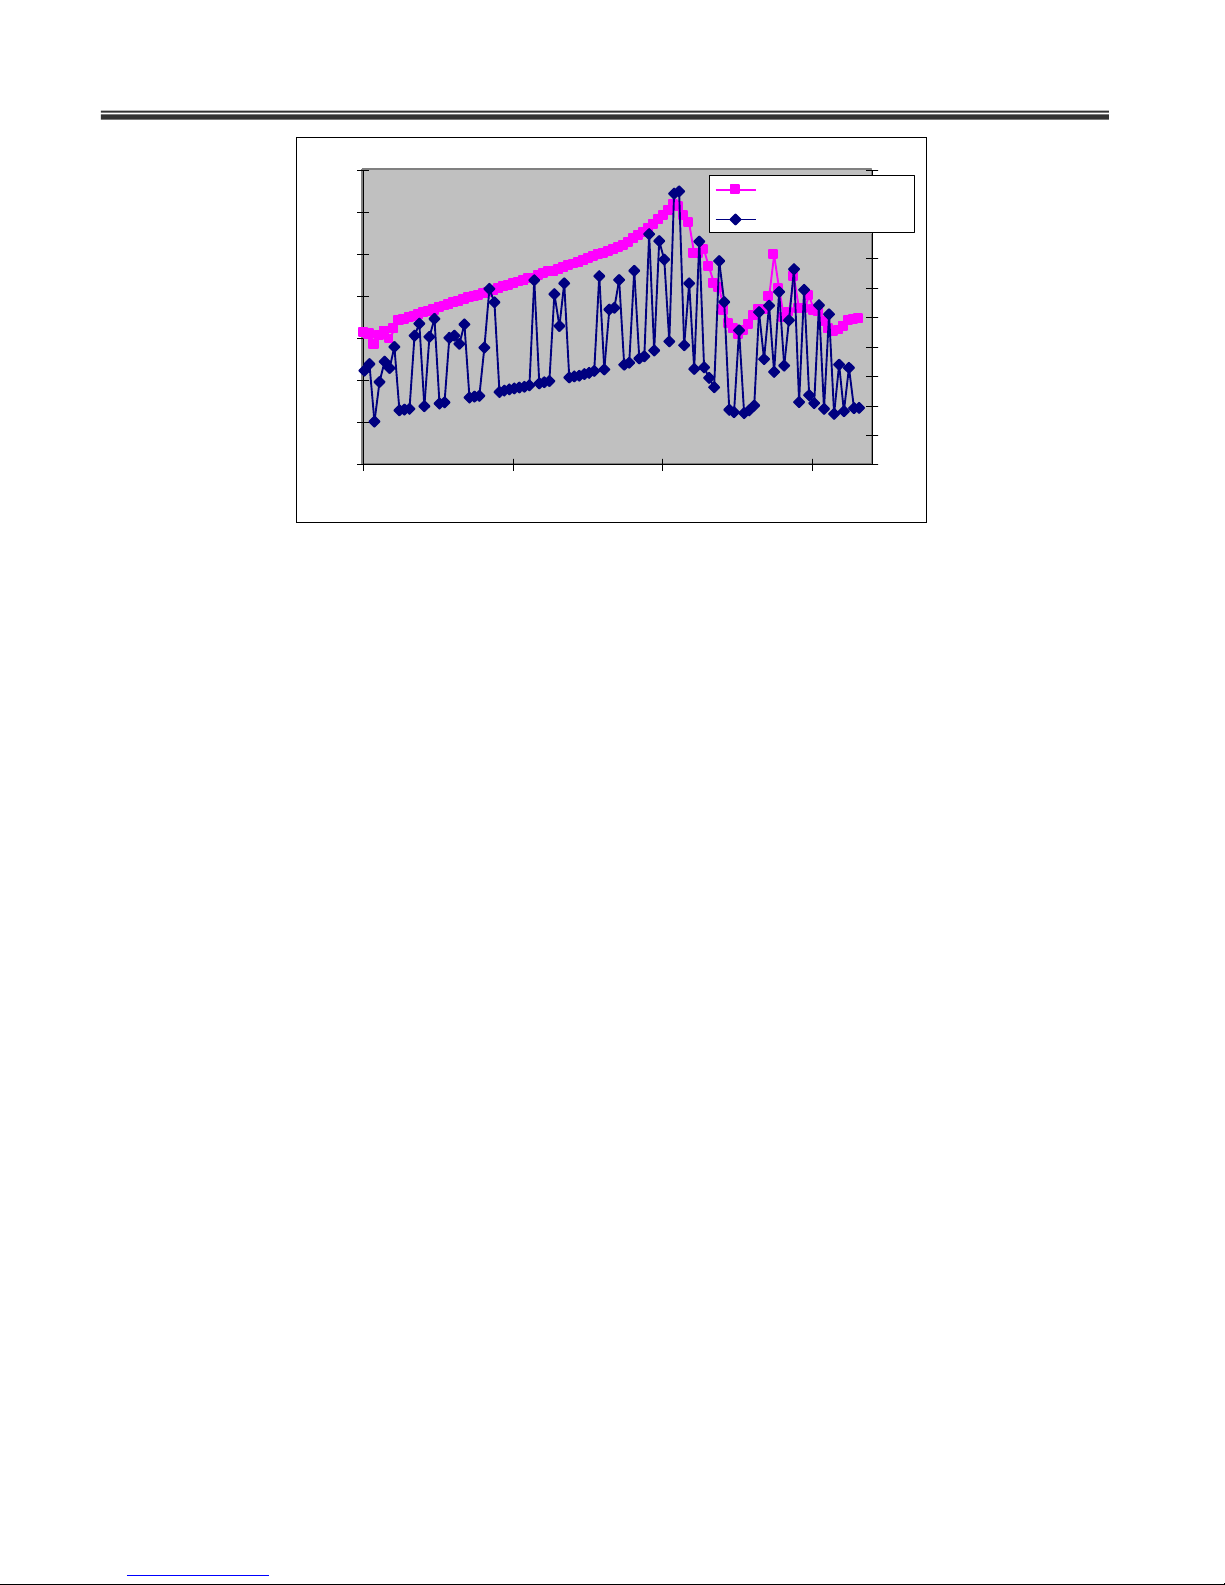
3. Now select one or more of the required columns to view in a chart format.
Example shown here is for ETP (in Blue) and Global radiation (in Red). To select
multiple columns click on the second column with mouse while holding down the
shift key. Once the required columns are selected, click on the tool bar button,
show graph (2Y axes) to display the chart of the selected data.
4. Similarly VIEW tool can be used to view data from other data files raw and daily
average tables.
Page 56
Dynamet 5
55
6.4 Open Data – Using EXCEL
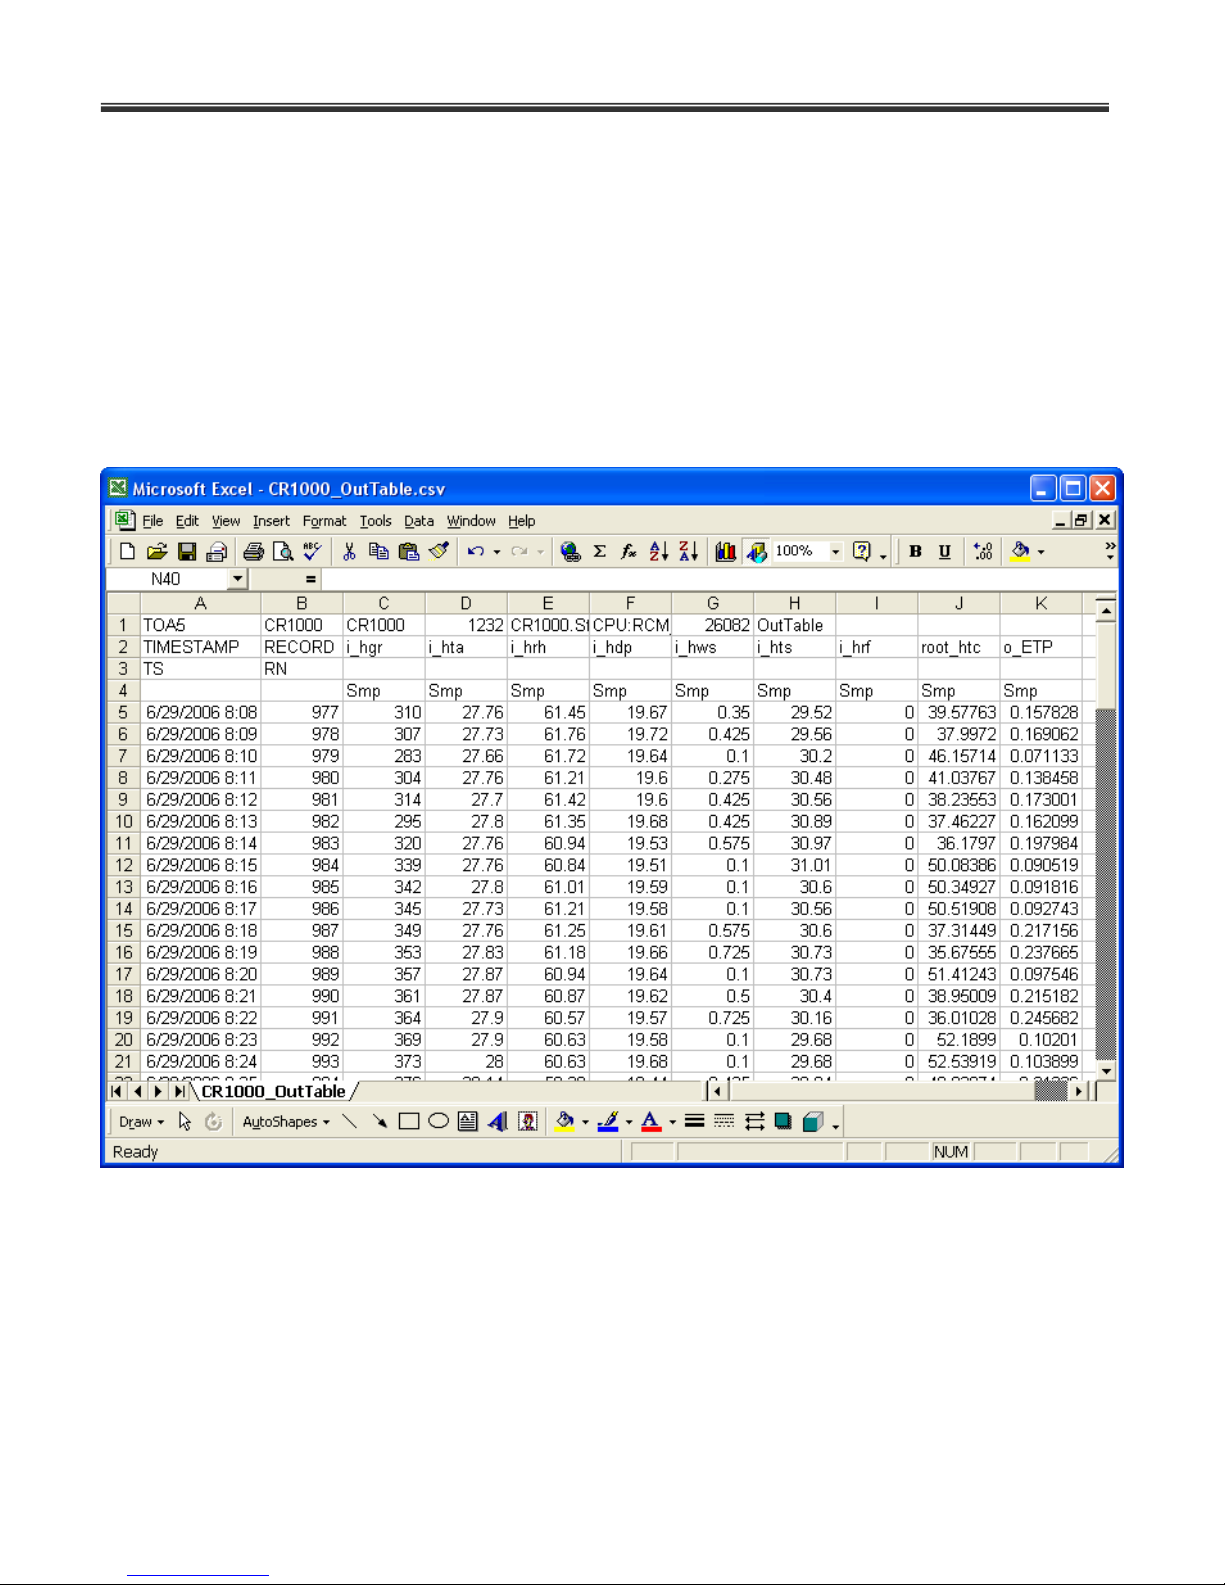
1. In the earlier sections it was recommended to save collected data in .csv format such that
the collected data can be readily opened in Excel or any preferred spreadsheet
application. In the windows explorer navigate to the location where data files are saved.
Select the required file (saved in .csv) format and double click to open this Excel.
Alternatively, Launch Excel application, and open the file using open wizard and csv
format. Figure below shows the Output table file Dynamet 5_OutTable.csv as displayed
in excel window.
2. In excel it is much simpler to plot required columns and there is no limitation on the
number of columns that can be displayed in a chart. Ideally all the variables saved in the
OutTable can be displayed in the same chart using multiple axes option. Select column/
columns for charting along with the Time stamp or Jday and HHMM for X-axis. Click on
chart wizard button, follow steps in the wizard to complete the wizard and display chart as
shown below for ETP, Global radiation.
Page 57
Dynamax Inc
56
0
100
200
300
400
500
600
700
6/29/2006 8:08 6/29/2006 8:38 6/29/2006 9:08 6/29/2006 9:38
0
0.05
0.1
0.15
0.2
0.25
0.3
0.35
0.4
0.45
0.5
CR1000 i_hgr
OutTable o_ETP
3. Plots for other variables can be plotted in the same manner.
Page 58
Dynamet 5
57
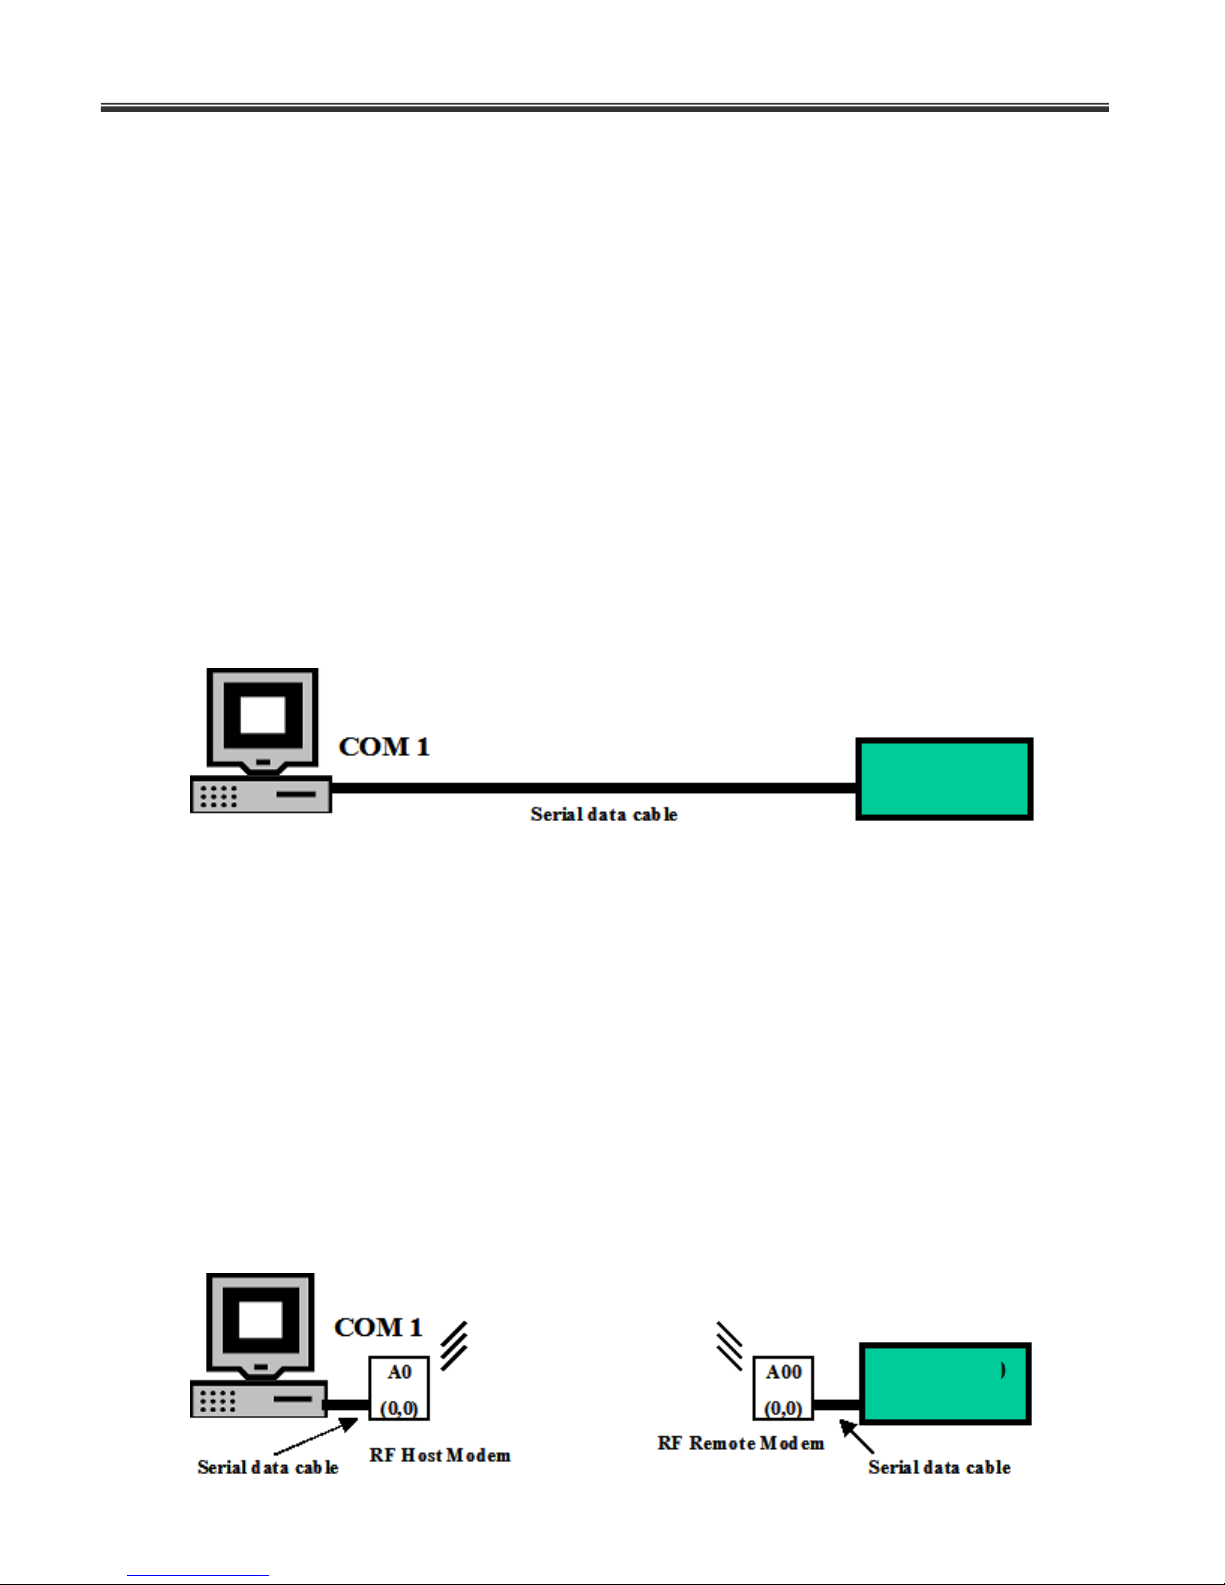
Serial data cable:
RF Radio Modem (RFMX):
Logger
Logger
7.0 COMMUNICATIONS
Dynamet 5 weather station and PC400 has added communications and networking features for
remote long distance and cable communications and scheduling. Below is a list of
communication devices offered by Dynamax and are tested on Dynamet 5 for signal strength
and transmission range. For advanced remote network communications choose LoggerNet
software.
This is a basic serial communication interface using 9 conductor serial cable, is shown in the
figure below. 6’ serial cable is supplied with Flow32 and can be extended up to 200’ without
loosing any signal. If a longer cable is required contact Dynamax. For distances longer than 200’
it is recommended to use either a short-haul modem or RF interface.
Radio modem for wireless communications up to 40Miles (64KM) at baud rate 9600bps. Baud
speed is programmable. LoggerNet software is equipped with capability to program, and
configure RFMX modems in point-to-point and point-to-multi-point modes. Refer to RFMX
modem manual for setup and programming details. A simple communication setup between
Dynamet 5 weather station and PC using RF modems is shown below along with modem
addresses.
Page 59
Dynamax Inc
58
Logger
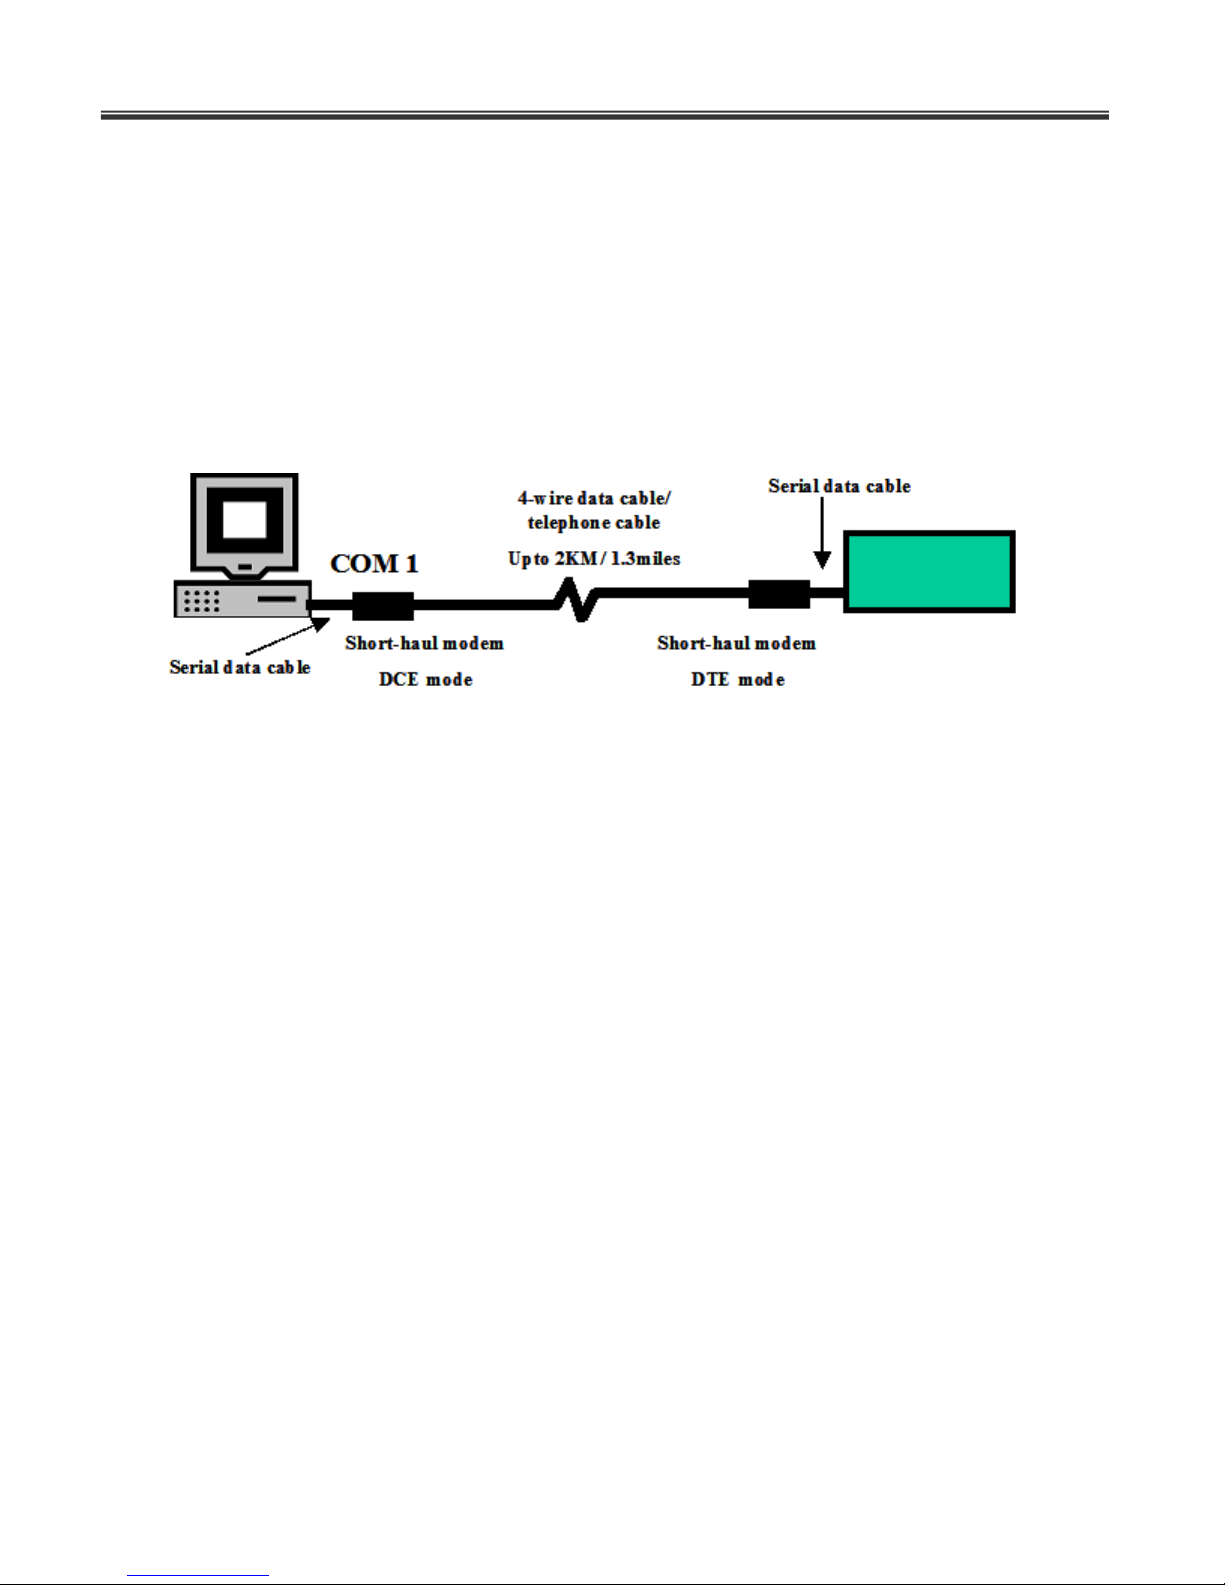
Short-haul Modem (SHM):
Short haul modem is a bi-directional serial interface converter for RS232 and RS485. This
communication setup facilitates Point-Point, bi-directional communication up to 1.3 mile/ 2Km/
6660ft. at a data transfer rate of 9600bps. This model makes use of Dynamax’s SHM short-haul
modem, 4-wire 24-gauge cable or standard telephone cable. Short-haul modems are configured
using DIP switch in different modes. For details on short-haul modem refer to SHM manual.
Landline Phone modem (DNX9600):
Data modem/ Land-line dialup modem. Where telephone service is available. DNX9600 is
factory set to 9600 bps but can be changed using DIP switch settings or programming software.
Cellular Modem (GSM):
GSM is a Dual-band cellular modem for serial communications using GSM mode. As GSM is
widely acceptable and providers available in most countries. Cellular modem is offered in all the
4 available GSM frequencies making it possible to use in any country. Devices with serial data
rates up to 15200bps can be connected using GSM modem.
Page 60
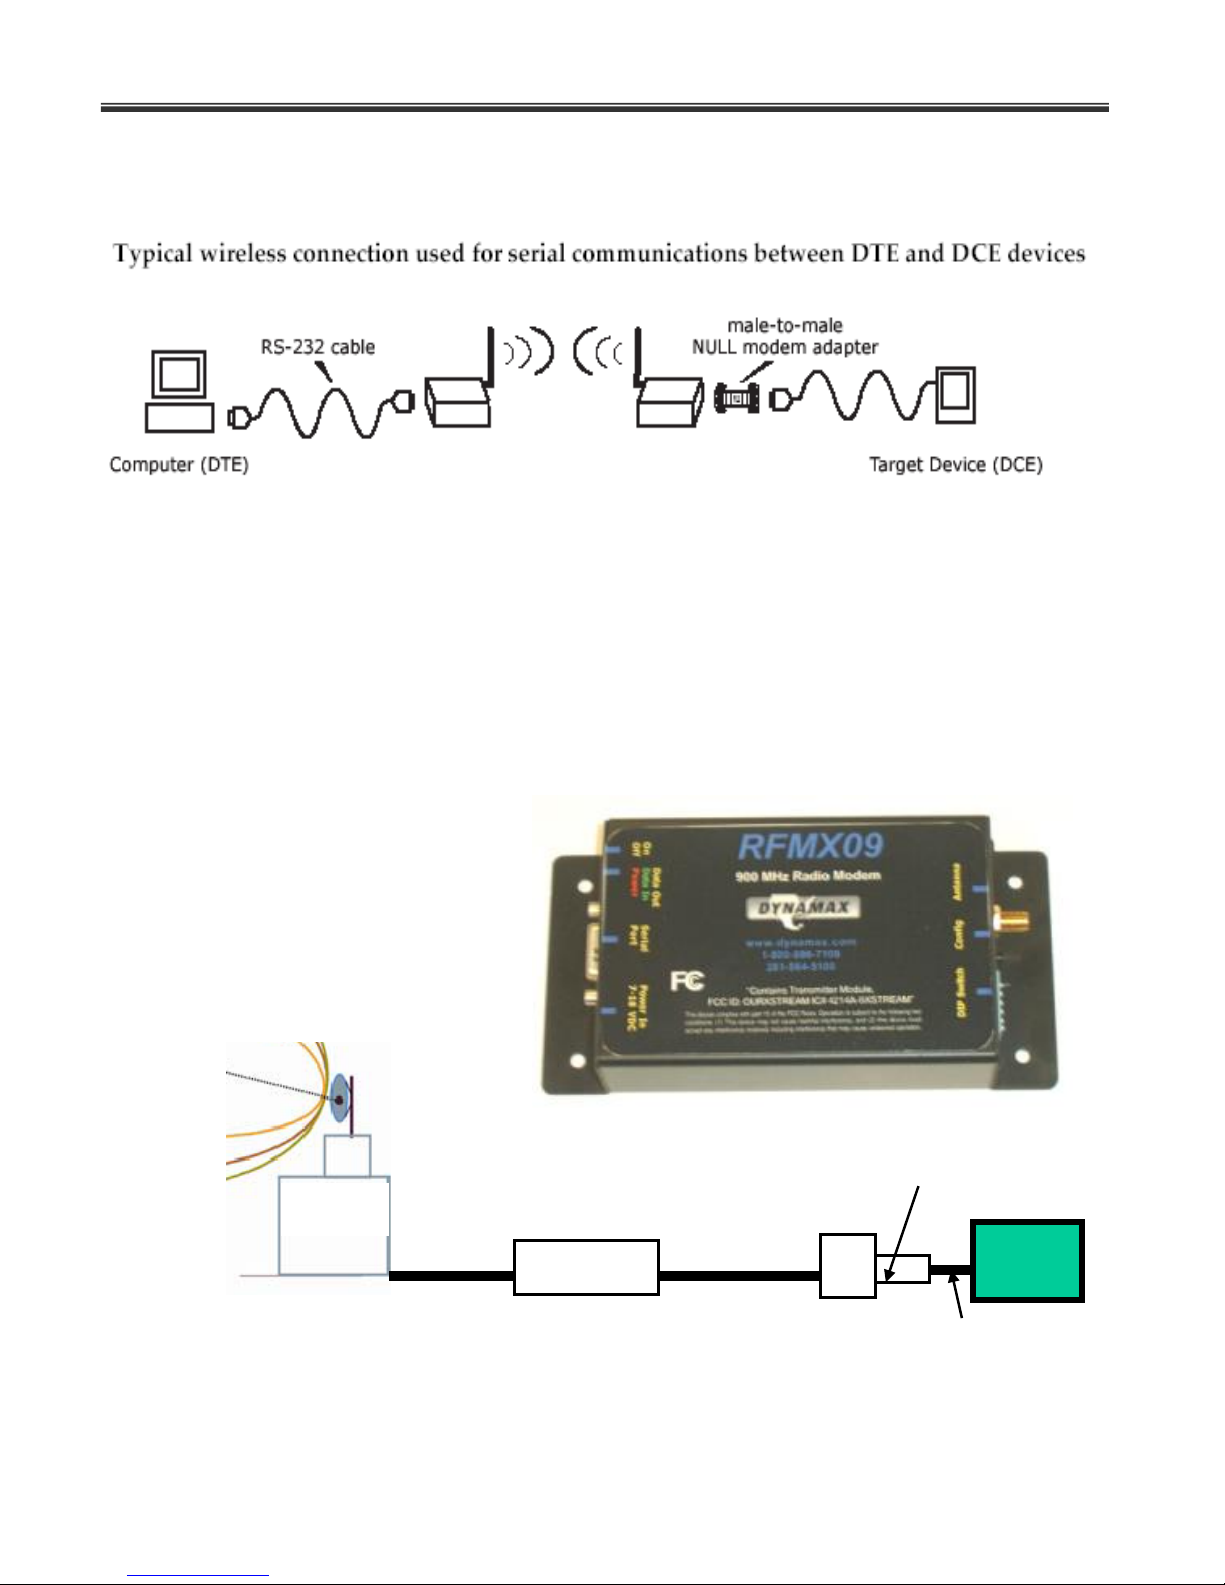
Dynamet 5
59
2 RFMX Modems
Antenna
A0
(0,0)
Serial data
RFMX
Surge Protector
DSX
RPSMA-N
N-N coaxial
Logger
Null Modem
7.1 RF Modem (RFMX)
RFMX 900 MHz RF modem with transmission range of up to 40 miles LOS using a directional
antenna is shown in figure below. Basic hardware setup using half-wave dipole antenna is
shown above. RFMX modems with dipole antenna has a transmission range of up to 7 miles
LOS. This chapter describes installation of RFMX modems along with hardware, required
power, supplies, network topologies, etc. Also is included a list of compatible hardware for use
with RF modems such as Surge protectors, high-gain Antennas, omni-directional antennas,
coaxial cables and connectors, adapters etc. Refer to the list of hardware required for entire list.
Page 61
Dynamax Inc
60
Communication
Frequency
902 –928 MHz
Channel capacity
7 hopping sequences sharing 25 frequencies
RF baud rate
10,000 bps
Network Topology
Point-to-point, Point-to-multi-point
Multi-drop
Serial Interface
RS-232
Serial Baud Rate
1200 – 115200 (programmable)
Performance
Indoor
Up to 1500’ (457m)
Outdoor
7miles/ 11Km LOS (dipole)
40 miles/ 64Km LOS (Yagi/ High-gain antenna)
Transmit power output
140mW (21.5dBm)
Receiver sensitivity
-110dBm
Power
Supply voltage
7 – 18 VDC
Transmit current
200mA
Receive current
7mA
Power down current
<1mA
Physical properties
Enclosure size
2.75” x 5.50” x 1.124”
Weight
7.1 oz (200g)
Operating temperature
-40o to +85o C
Certifications
FCC Part 15.247
Industry Canada
Radio-Surge Protector cables
Length
LMR400 N(M)-RPSMA(M) coax
3'
RPSMA(M) - RPSMA(F)
3'
RPSMA(M) - RPSMA(F)
10'
RPSMA(M) - RPSMA(F)
20'
Surge Protector
DSX-POL N(F)
Antenna cables (Coaxial)
Length
LMR400 N(M)-N(M)
10'
LMR400 N(M)-N(M)
20'
LMR400 N(M)-N(M)
30'
Antenna
dB gain
Dipole/Half-wave comes with radio 2.1dB
2.1
High directional Yagi antenna
6, 9, 11
Omni directional antenna
3, 5, 7
7.1.1 Specifications
7.1.2 List of Hardware
Page 62
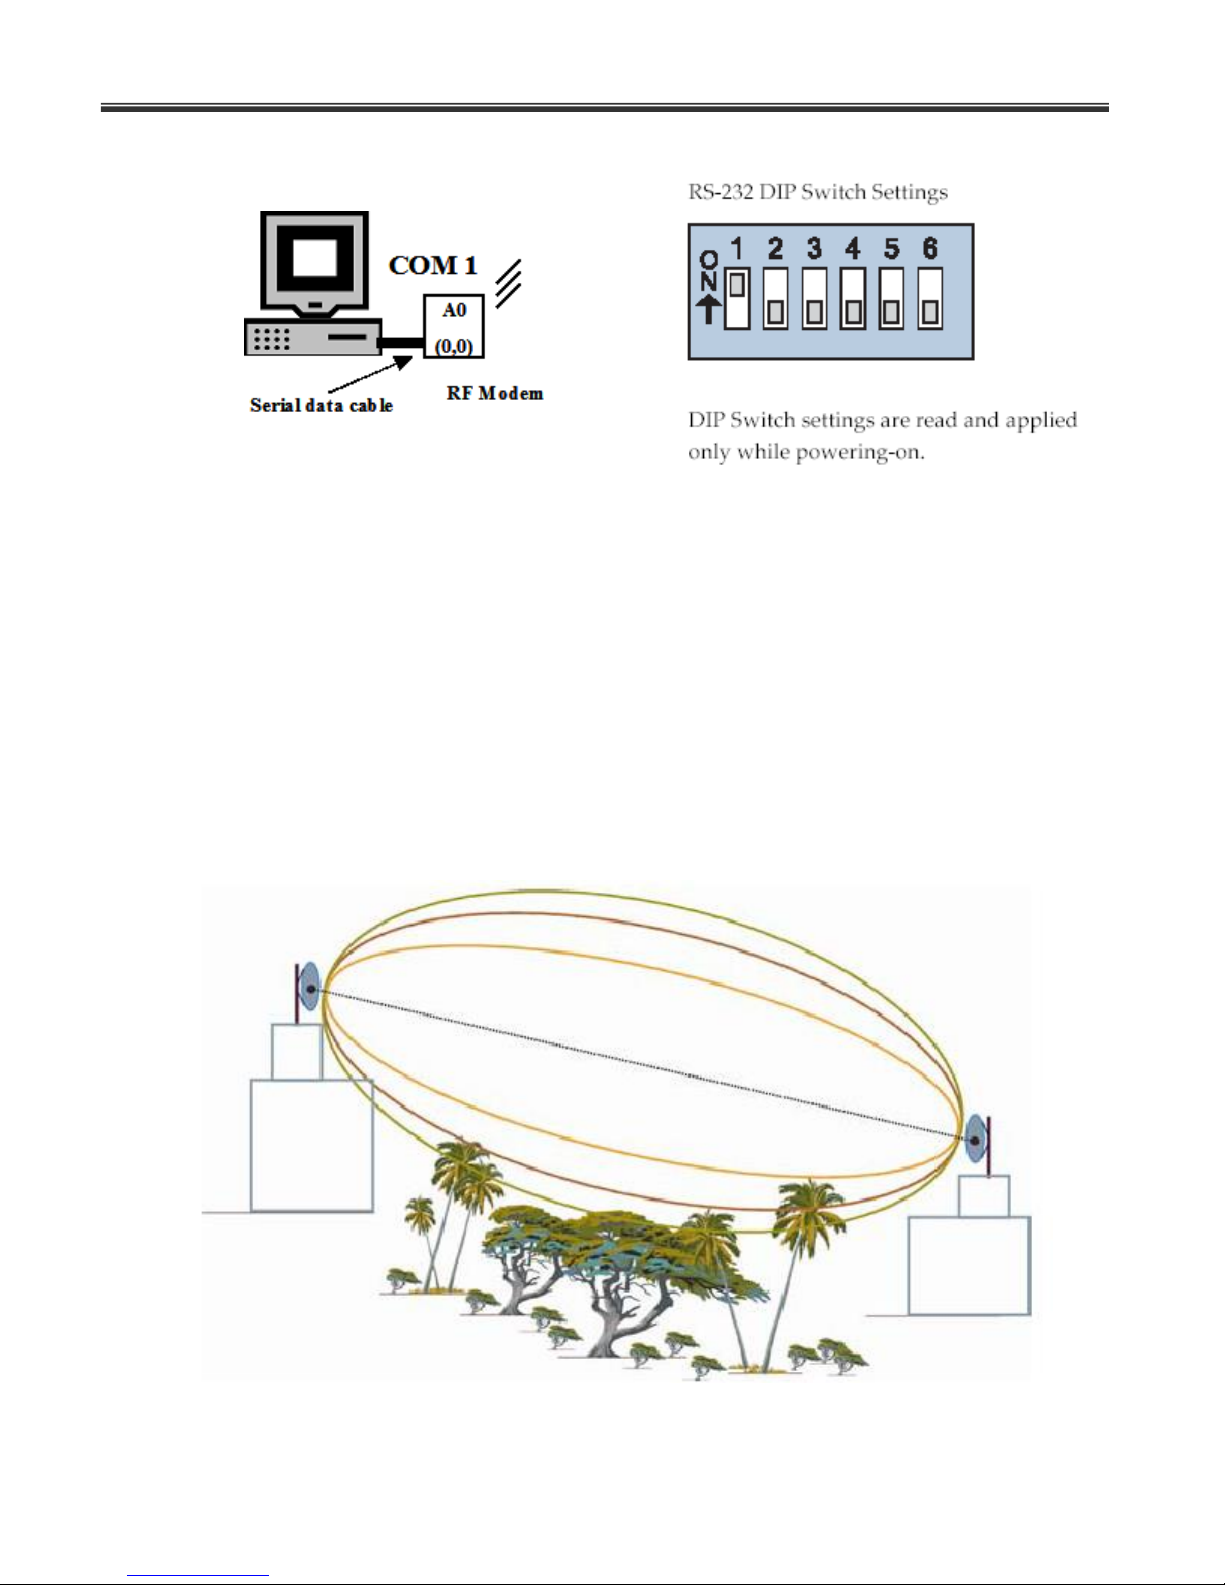
Dynamet 5
61
7.1.3 Programming
RFMX modems are programmable using PC400 or LoggerNet software. Set DIP switches as
sown in the figure above for RS232 mode. Connect RF modem directly to the PC using serial
cable as shown above. Refer to RFMX manual for detailed programming and communication
protocol.
7.1.4 Antenna/ Tower
Line of sight between host and remote modem is essential to get maximum signal strength and
maximum transmission range. This distance can be improved by using mounting antenna on a
high tower such that common obstructions like trees, buildings are not causing an obstruction in
to interface between the two points. An example of this is shown in the figure below.
Page 63
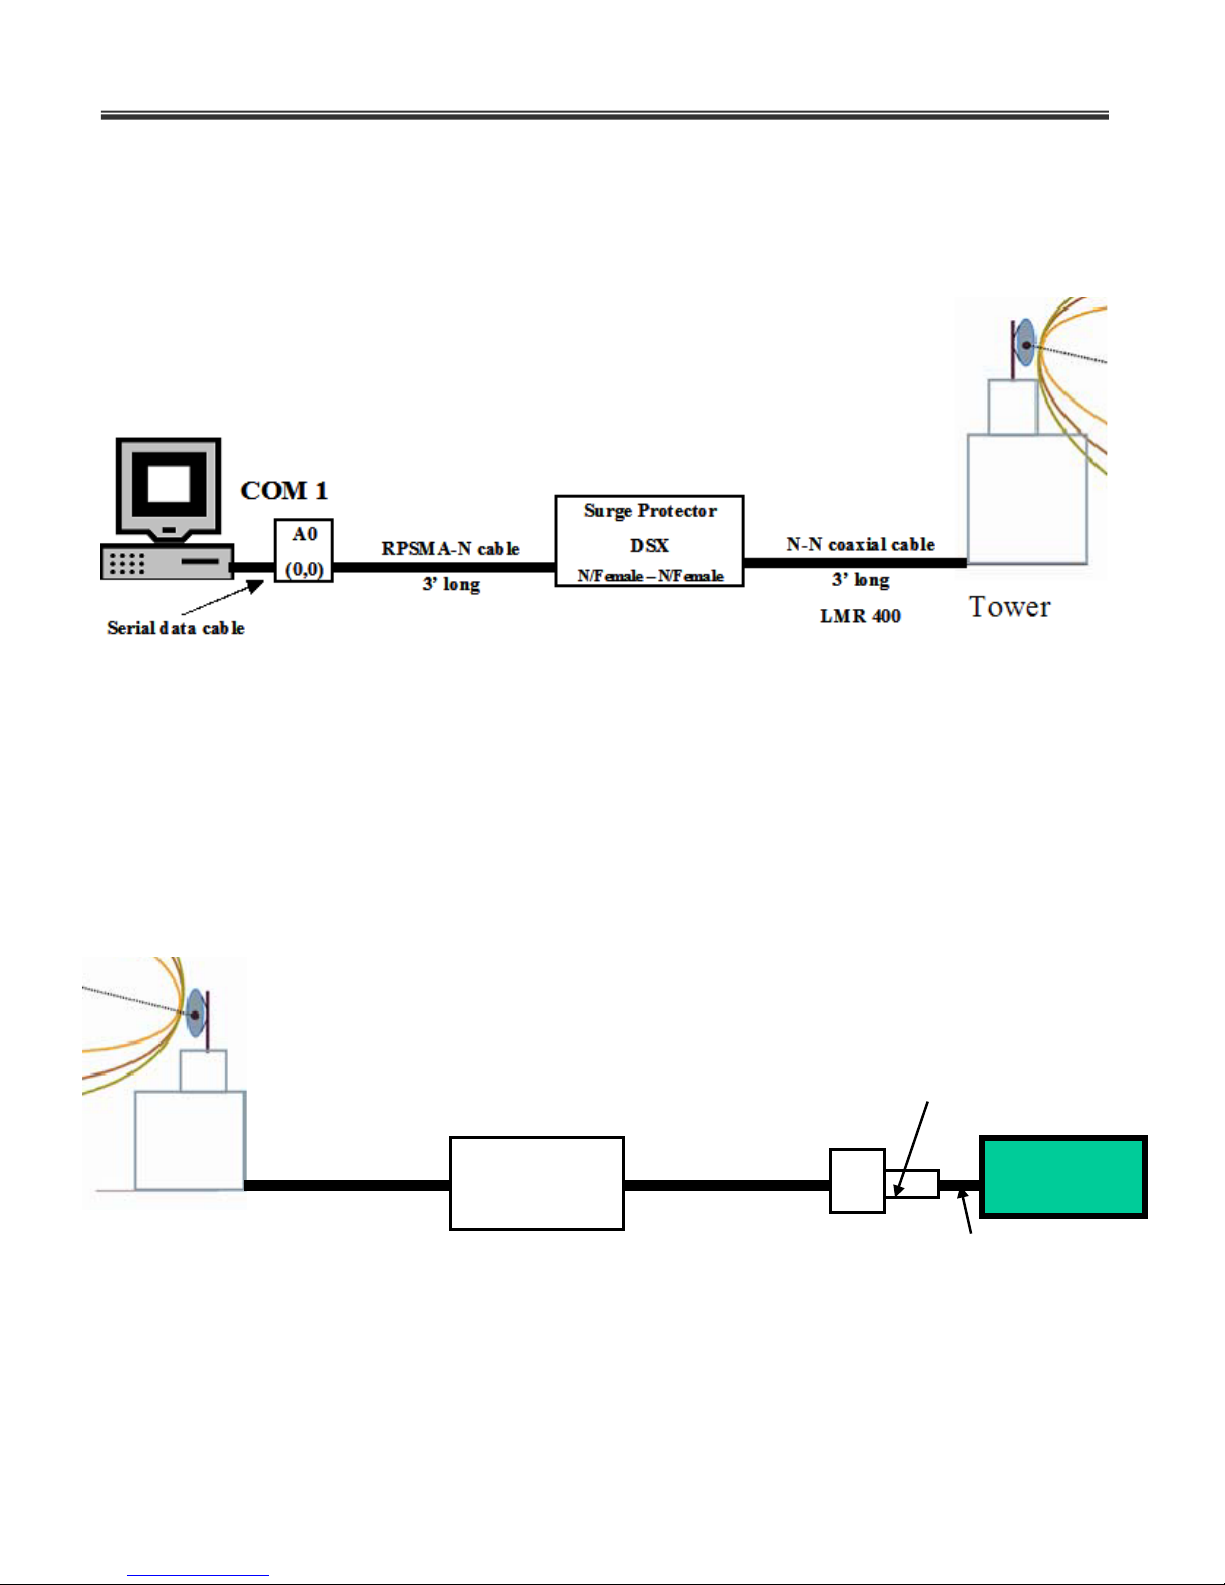
Dynamax Inc
62
Tower
A0
(0,0)
Serial data
RFMX
Surge Protector
DSX
N/Female –
N/Female
RPSMA-N cable
3’ long
N-N coaxial
cable
3’ long
LMR 400
Logger
Null Modem
RFMX
Host Modem
7.1.5 Host Modem Installation
Configuration for Host station is shown in figure below. RF modem is connected to PC using
serial cable and to transmitting antenna via surge protector to shield equipment from lightning
surges. Make sure to earth ground the surge protector.
7.1.6 Remote Station Installation
Hardware setup for remote Dynamet 5 weather station (Logger) is shown in figure below.
Program RF modem from LoggerNet / PC208w software before connecting to remote station.
Page 64
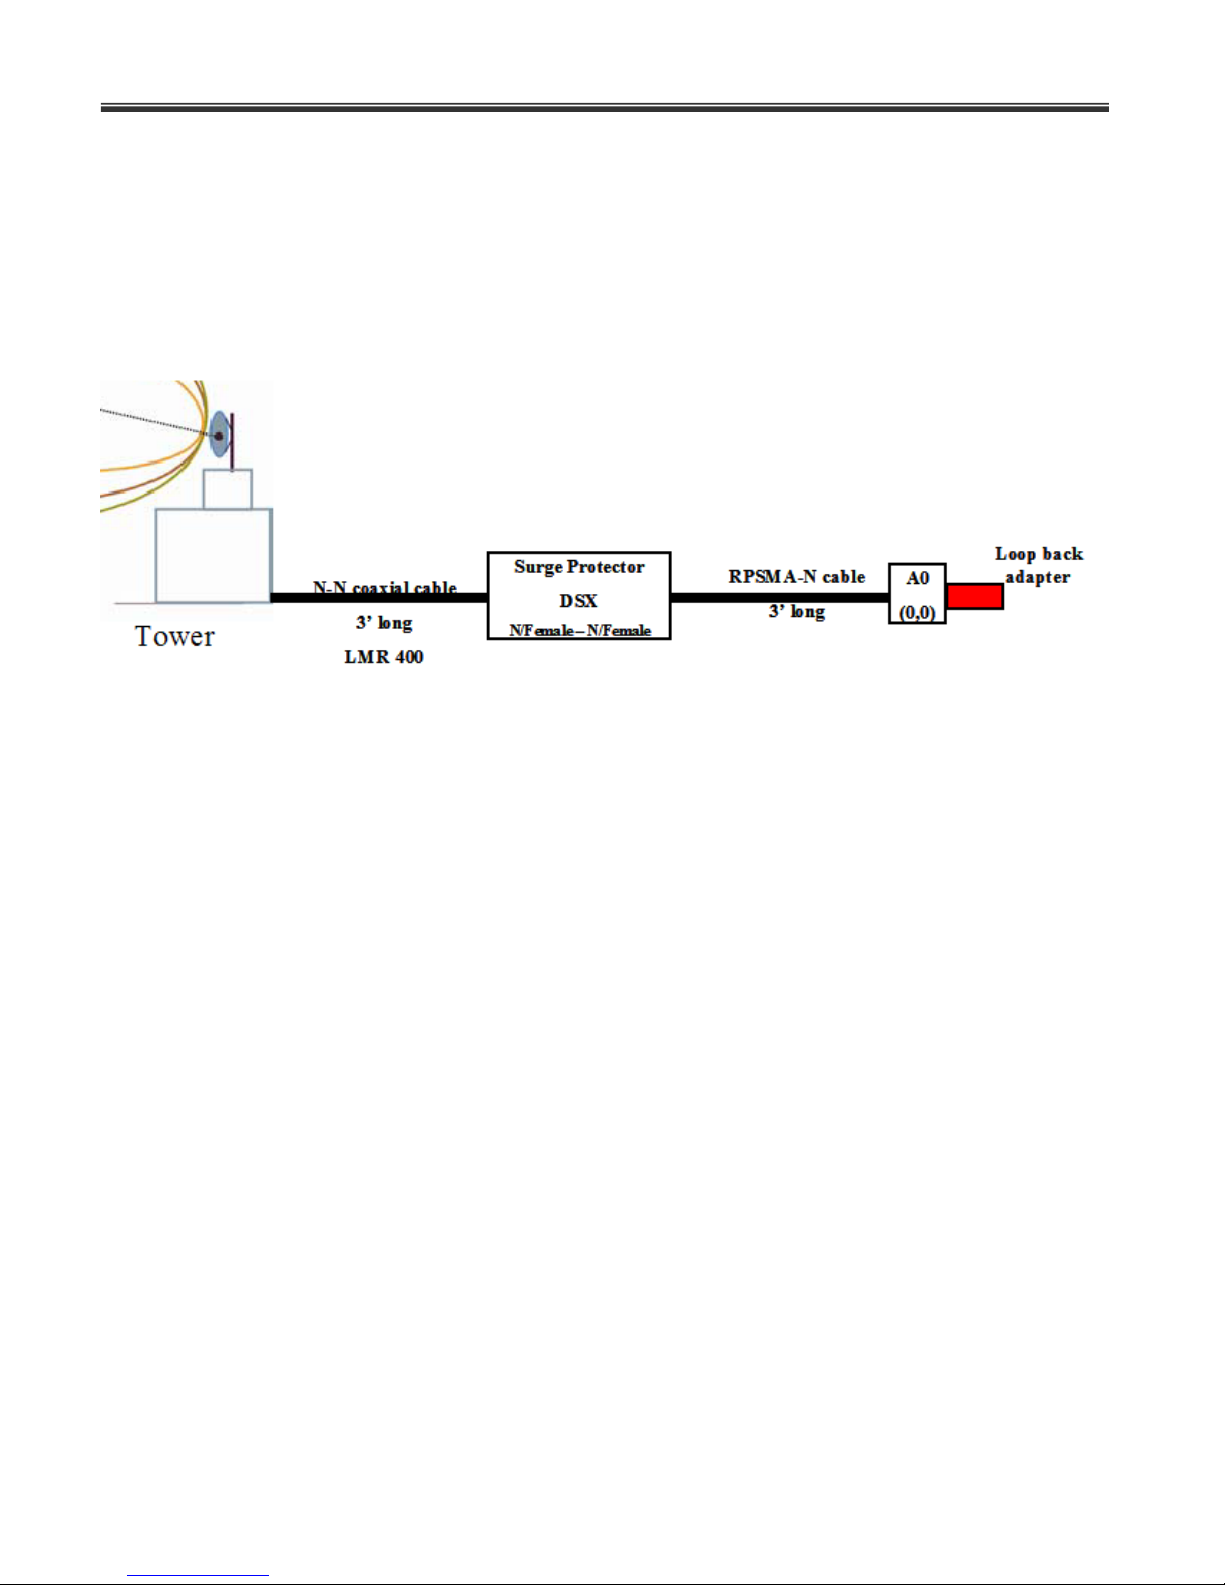
Dynamet 5
63
RFMX
Repeater Modem
7.1.7 Use of Repeater
For extreme terrain conditions, and transmission over long distances achievable using host and
remote antennas it is possible to use a repeater tower along with a omni-directional antenna as
shown in the figure below. This is simple store and forward method of repeater
configuration. This configuration uses a loop back adapter supplied with RF modem. The
repeater will buffer incoming data and retransmit it when there is a break in data reception.
Page 65
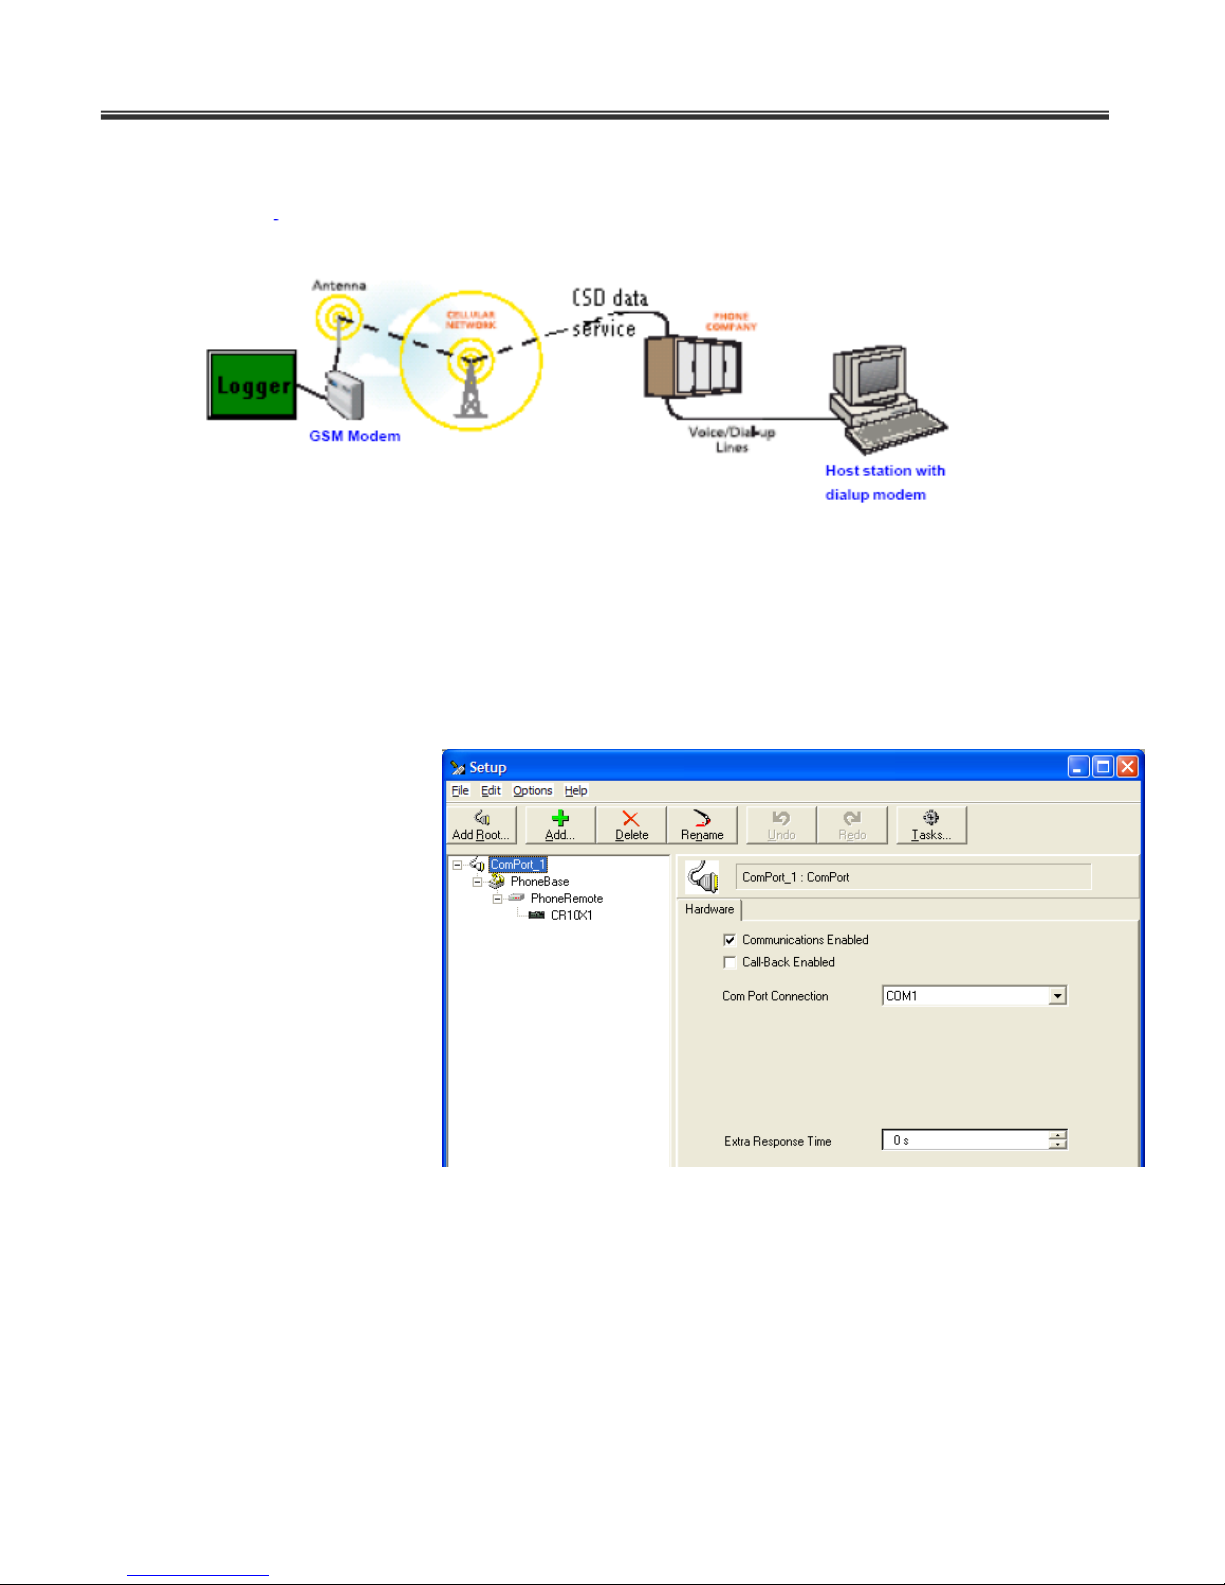
Dynamax Inc
64
7.2 Dual band cellular wireless Modem (GSM)
Dynamet 5 weather station is compatible with cellular modem (GSM-F1/2) for remote
communications using GSM wireless network. Communication can be established using PC400
or LoggerNet. In terms of functionality Loggernet is same as PC208w or PC400 but Logger net
has some advanced features. Follow the screen captures to setup GSM modem communication
to Dynamet 5 - CR10x logger.
** base modem / modem
connected to the PC-software
Conexant HCF 56K modem is
not in the modem pick list
Select “Rockwell HCF 56K
modem” instead
Page 66
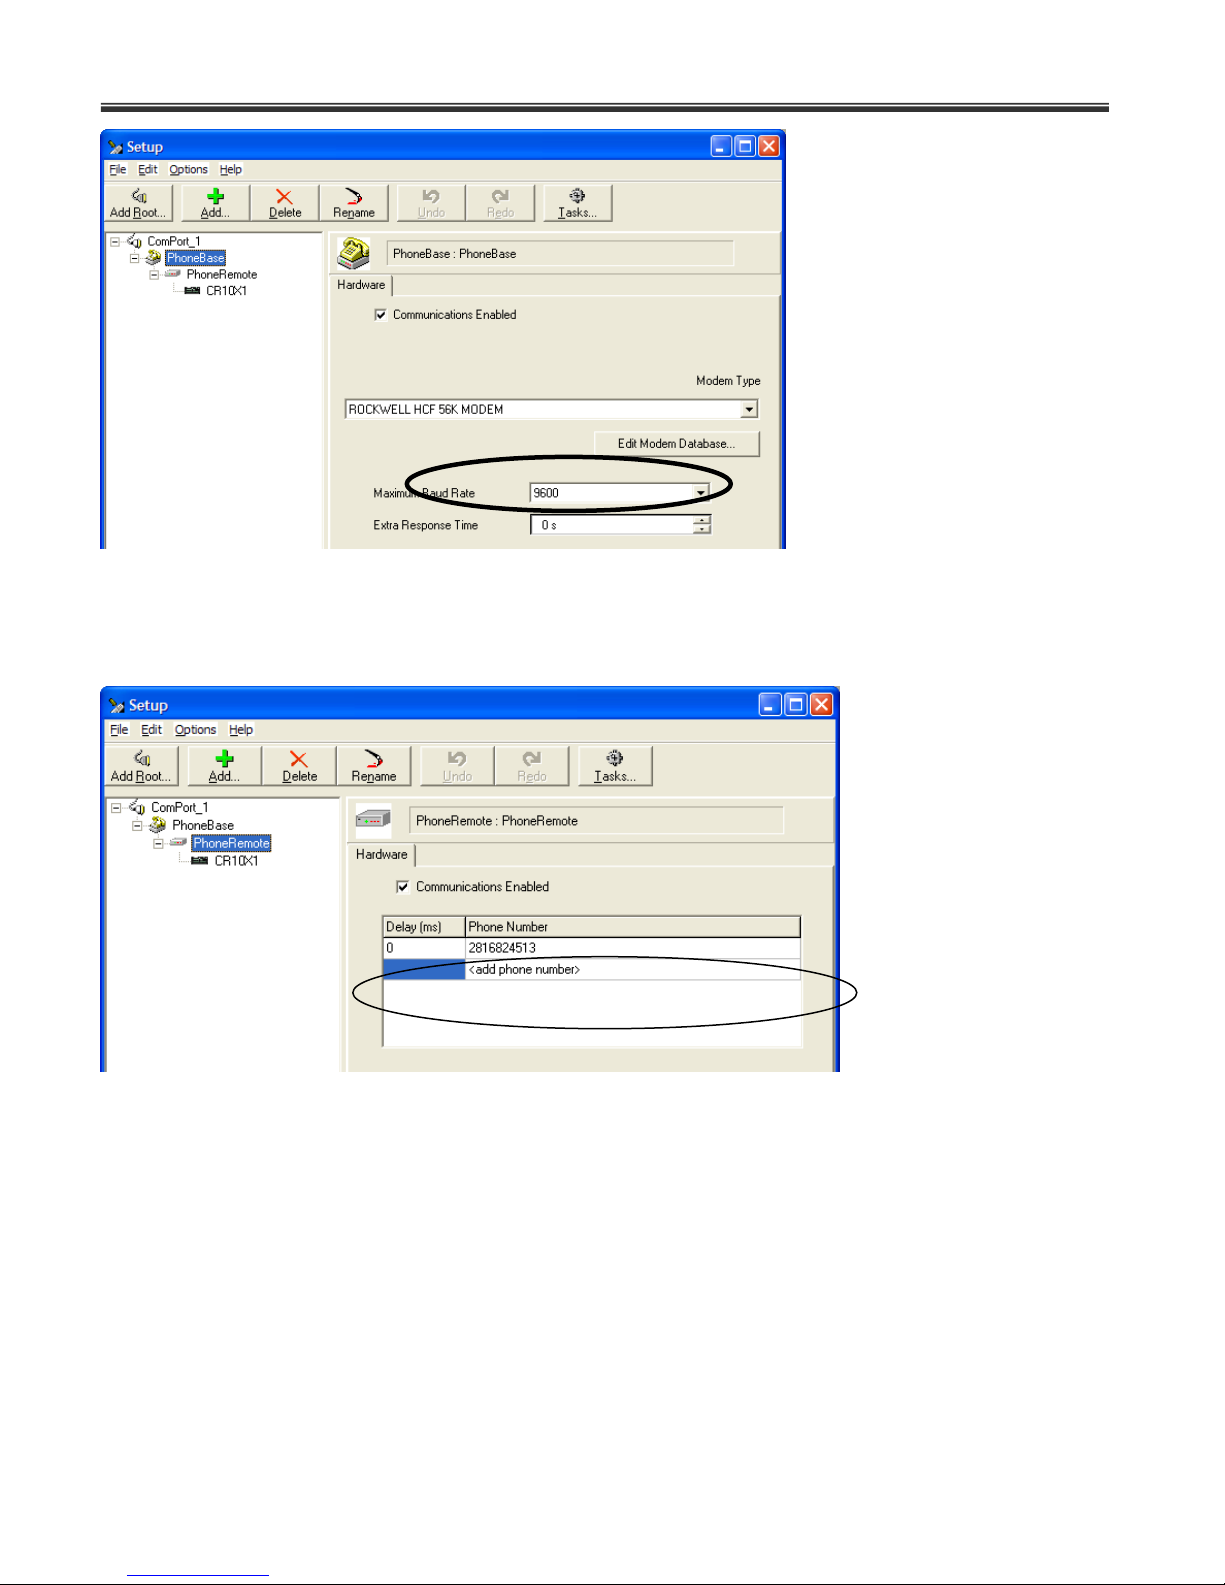
Dynamet 5
65
Enter data number corresponding to the remote modem – Phone modem/ GSM cellular modem
Page 67
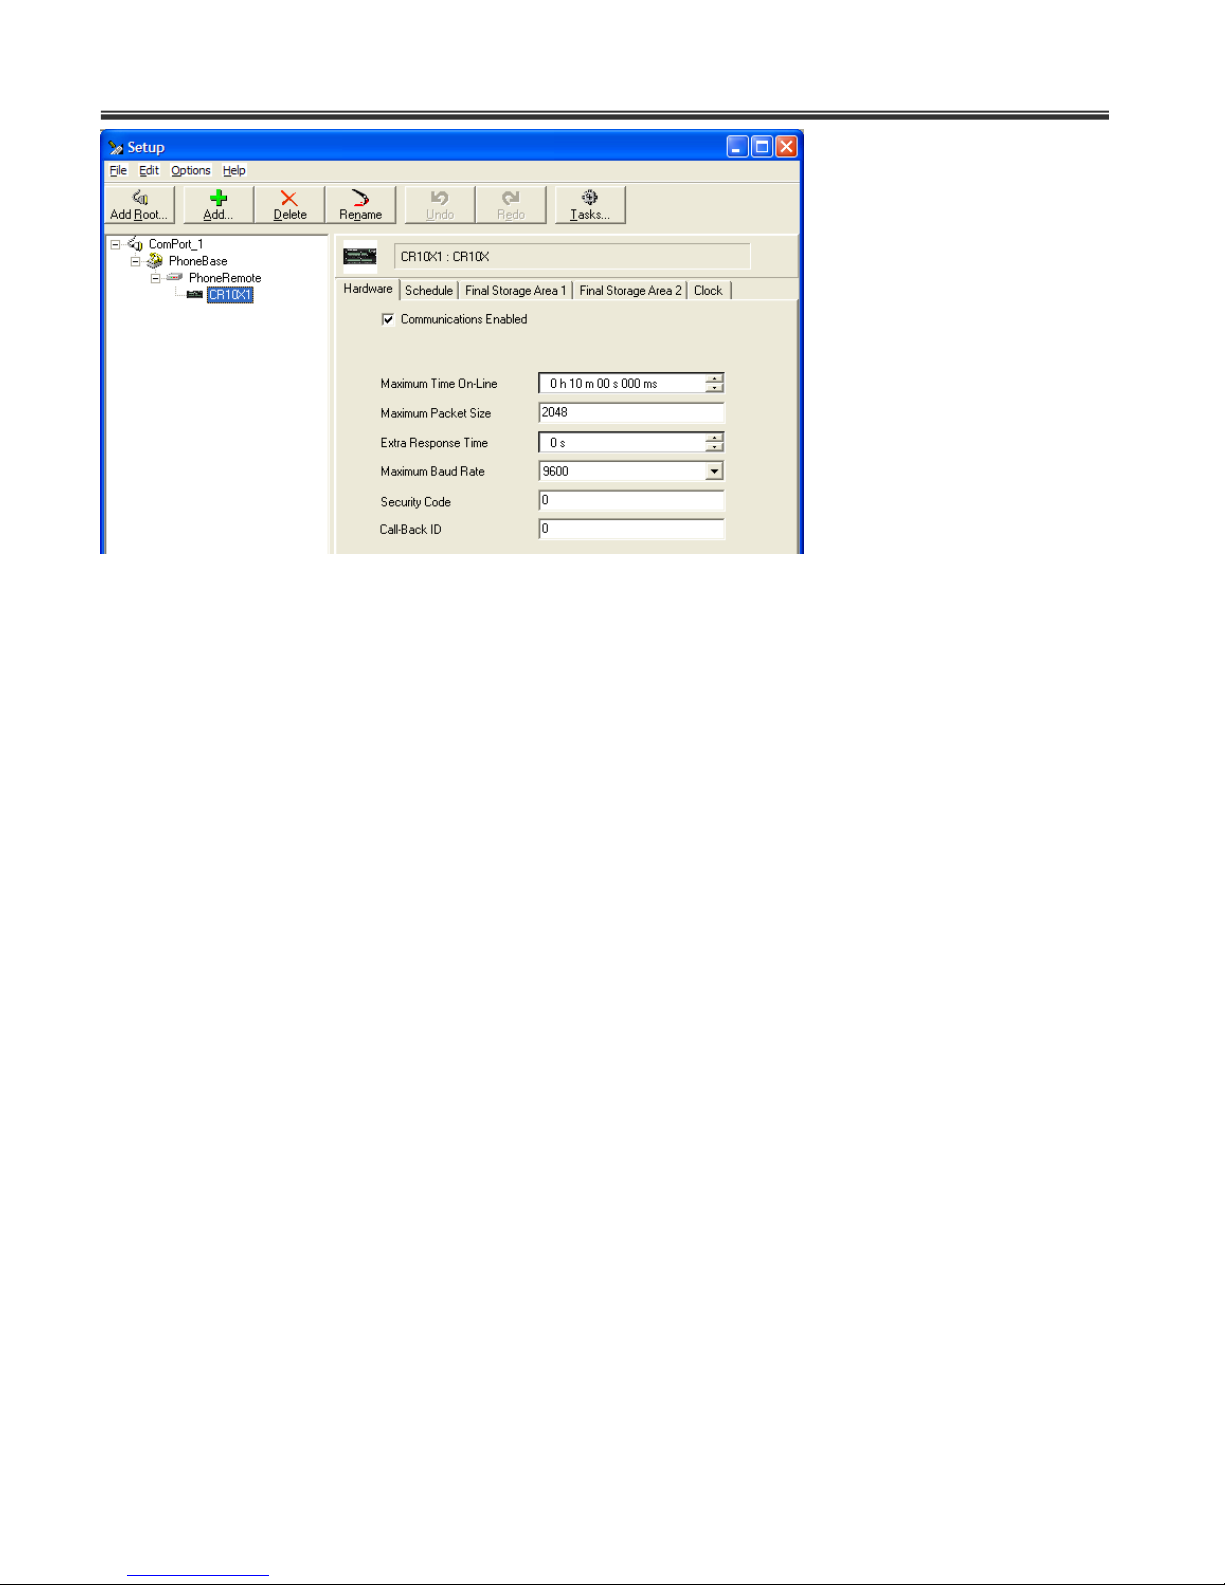
Dynamax Inc
66
Connecting to the Logger:
1. Click on Connect tool bar to open Connect to datalogger window.
2. Select CR10x station with GSM modem.
3. Click on connect button to start dialing out to GSM modem and datalogger network.
Page 68
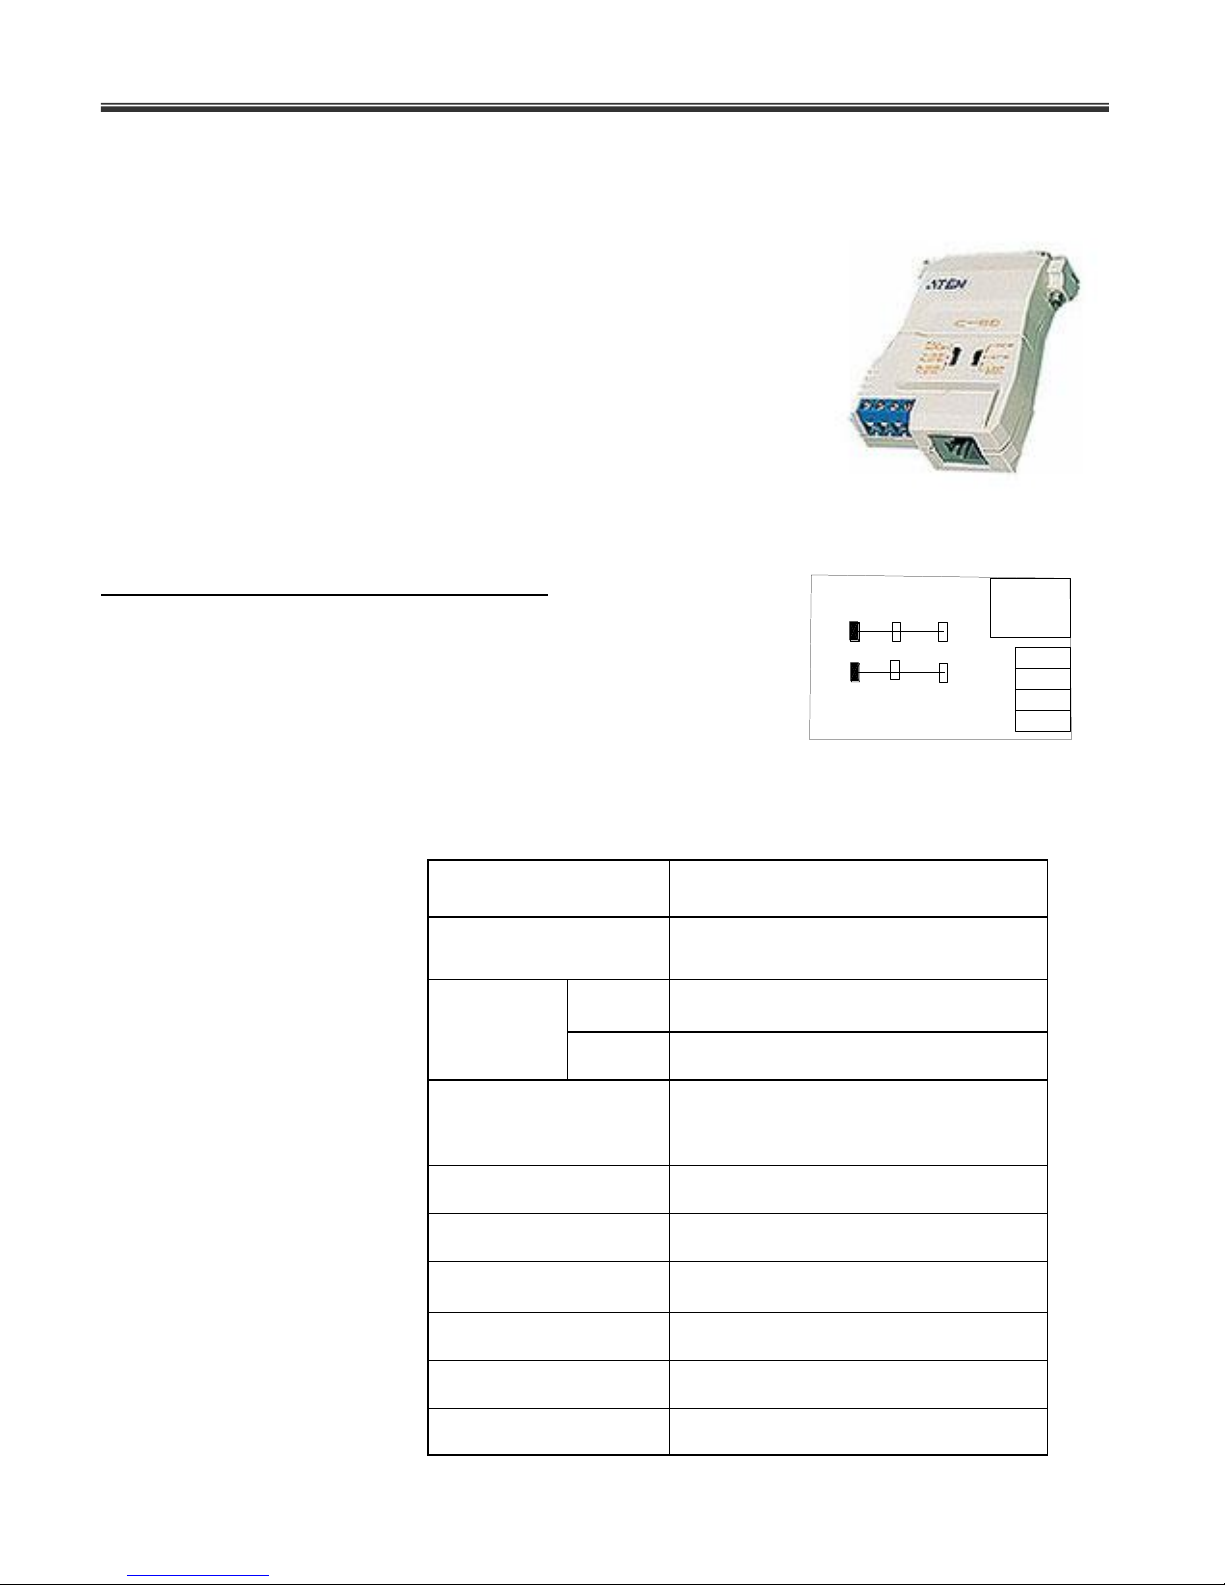
Dynamet 5
67
Function
Specification
Connectors
RS-232 DB-25 Female, RJ-11 Jack
4 Screw Terminal
Switches
SW1
DCE, DTE, Loop Back Select
SW2
Full Duplex, Simples Select
Cable Length
3.5 Km (Max.) @ 4800 bps
2 Km (Max.) @ 9600 bps
800 m (Max.) @ 19200 bps
Interface
RS-232
Data Transfer Speed
110 ~ 38400 bps
Power Consumption
No external Power source Required
Housing
Plastic
Weight
60 g
Dimensions (L x W x H)
54 x 74.5 x 18.5 mm
1
2
3
4
25 pin serial
connector
RX (DCE)
TX (DTE)
Full
Duplex
TX (DCE)
RX (DTE)
Loop
Back
DTE
DCE
RJ-11
IC 150
7.3 Short-haul Modem (SHM)
The Short-haul modem is a compact interface device that can be
used to transmit and receive serial data over relatively long
distances that are not achievable using RS232 interface. The
modem unit plugs directly in to the COM port on an asynchronous
device.
SHM is a non-powered line driver with a 1500VAC lightning surge
protection and noise rejection. The unit shown in the figure is
switch selectable and operates using 4 wires on screw terminals
or RJ11 connector. For using with Dynamet 5 modem is
connected in point-point 4-wire Full-duplex mode where only software handshake is applicable.
SHM Non-Powered RS-232 Line Driver
Communication modes
Full duplex/simplex switch selectable
Loop back
Features
No External Power Required
DCE/DTE Switch Selectable
Long Distance Transfer Via Economical TP Cable
Compact Size
7.3.1 Specifications
Page 69
Dynamax Inc
68
Comm. Device
Device type
Sw1
Sw2
PC (Host)
DTE
Full-Duplex
DCE
Flow32-Logger (Remote)
DCE
Full-Duplex
DTE
7.3.2 Hardware Configuration
Installing a serial interface using SHM, short-haul modem uses a 4-wire cable. A 4-wire cable
with RJ-11 connectors on either end reduces the installation time.
Connect the transmission cable as show in the figure using screw terminals or directly to RJ-11
sockets.
Configure the selection switches SW1 and SW2 on host modem connected to PC and the
remote modem connected to Flow32-Logger as shown in the table below.
Connect 25-9 pin serial adapter to the serial port connector on each modem.
Connect host modem to COM port on PC and remote modem to Communication cable on
Flow32-Logger. No power connections are required.
Turn power ON to Flow32-Logger and Launch Flow32-Logger software on PC.
Refer to Section 9.1 an 9.2 for software setup using LoggerNet (PC208W).
7.3.3 Troubleshooting
If experiencing difficulty getting communication using serial interface,
Check whether the COM port to each modem is connected, and COM port assigned in the
Flow32-Logger software’s station setup are the same.
Verify the switch selections on host and remote modem.
Check continuity on the cable/wires.
Page 70
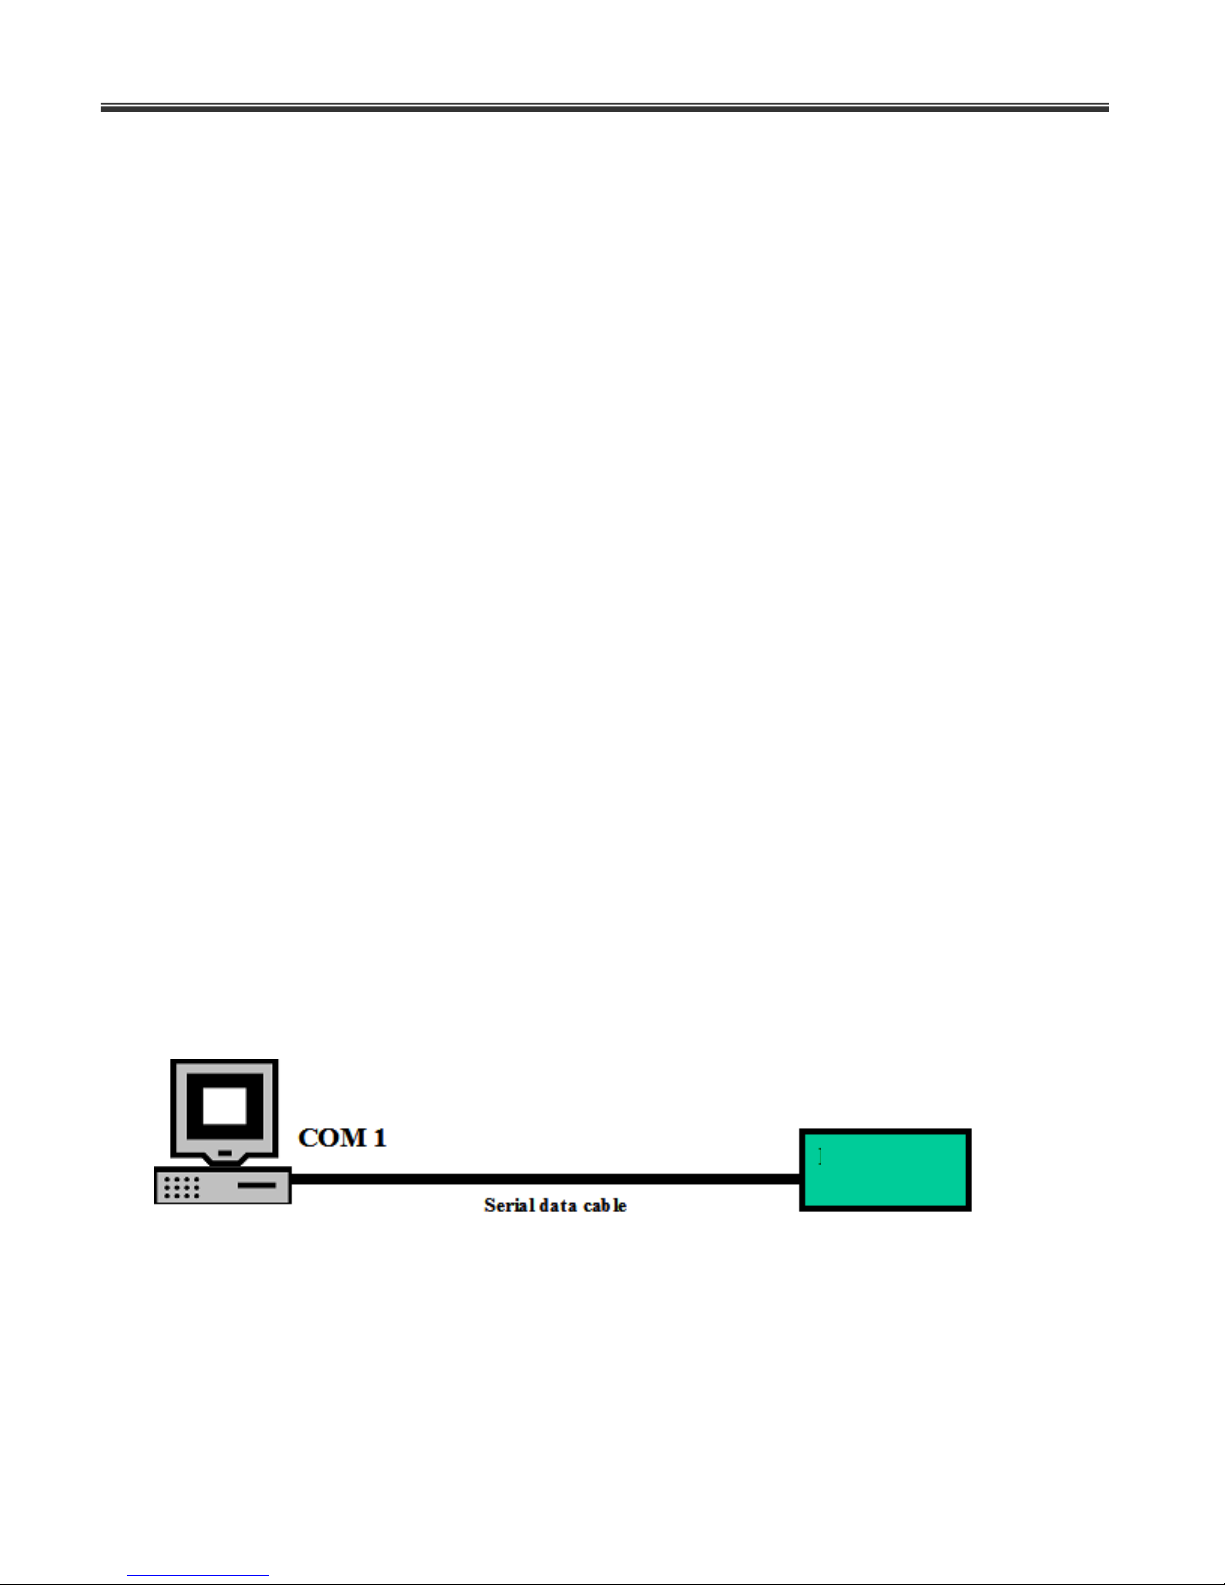
Dynamet 5
69
Point-to-point
Point-to-multi-point
Logger
7.4 Modes of Communication
PC400 or LoggerNet software support various remote communication devices. Following
communication modes are possible using Flow32 logger,
Point-to-point configuration of multiple Dynamet 5 weather stations
Point-to-multi-point configuration of multiple weather stations (LOGGERNET
Only)
Communication scheduling and automatic data collection (LOGGERNET
Only)
PC400 along with LoggerNet supports the following communication interfaces,
Standard serial communication using Serial data cable
RF communication using Dynamax’s RFMX modems
Short-haul modem communication using Dynamax’s SHM.
GSM cellular communication modem
For additional modes of communication not mentioned above may be used with Dynamet 5 to
communicate with Logger but would require manual configuration specific to the communication
device.
7.4.1 Modes of Configuration
Point-to-point is a simple configuration in which two devices located at two different places are
interfaces to communicate with each other by using cable, modem etc. Simple point-to-point
configuration between Dynamet 5 and COM1 on PC is shown in figure below. Cable interface in
this figure can be replaced with RF or serial interface converter.
Point-to-multi-point configuration is one in which two or more devices located at different places
are interfaced to communicate with single control station or PC. An example of point-to-multipoint configuration is shown in figure below. Data loggers Logger 0, Logger 1 and Logger 2 are
setup to communicate with PC on COM1. Logger Net can program host modem to communicate
with only one of the remote stations at any given time.
Page 71
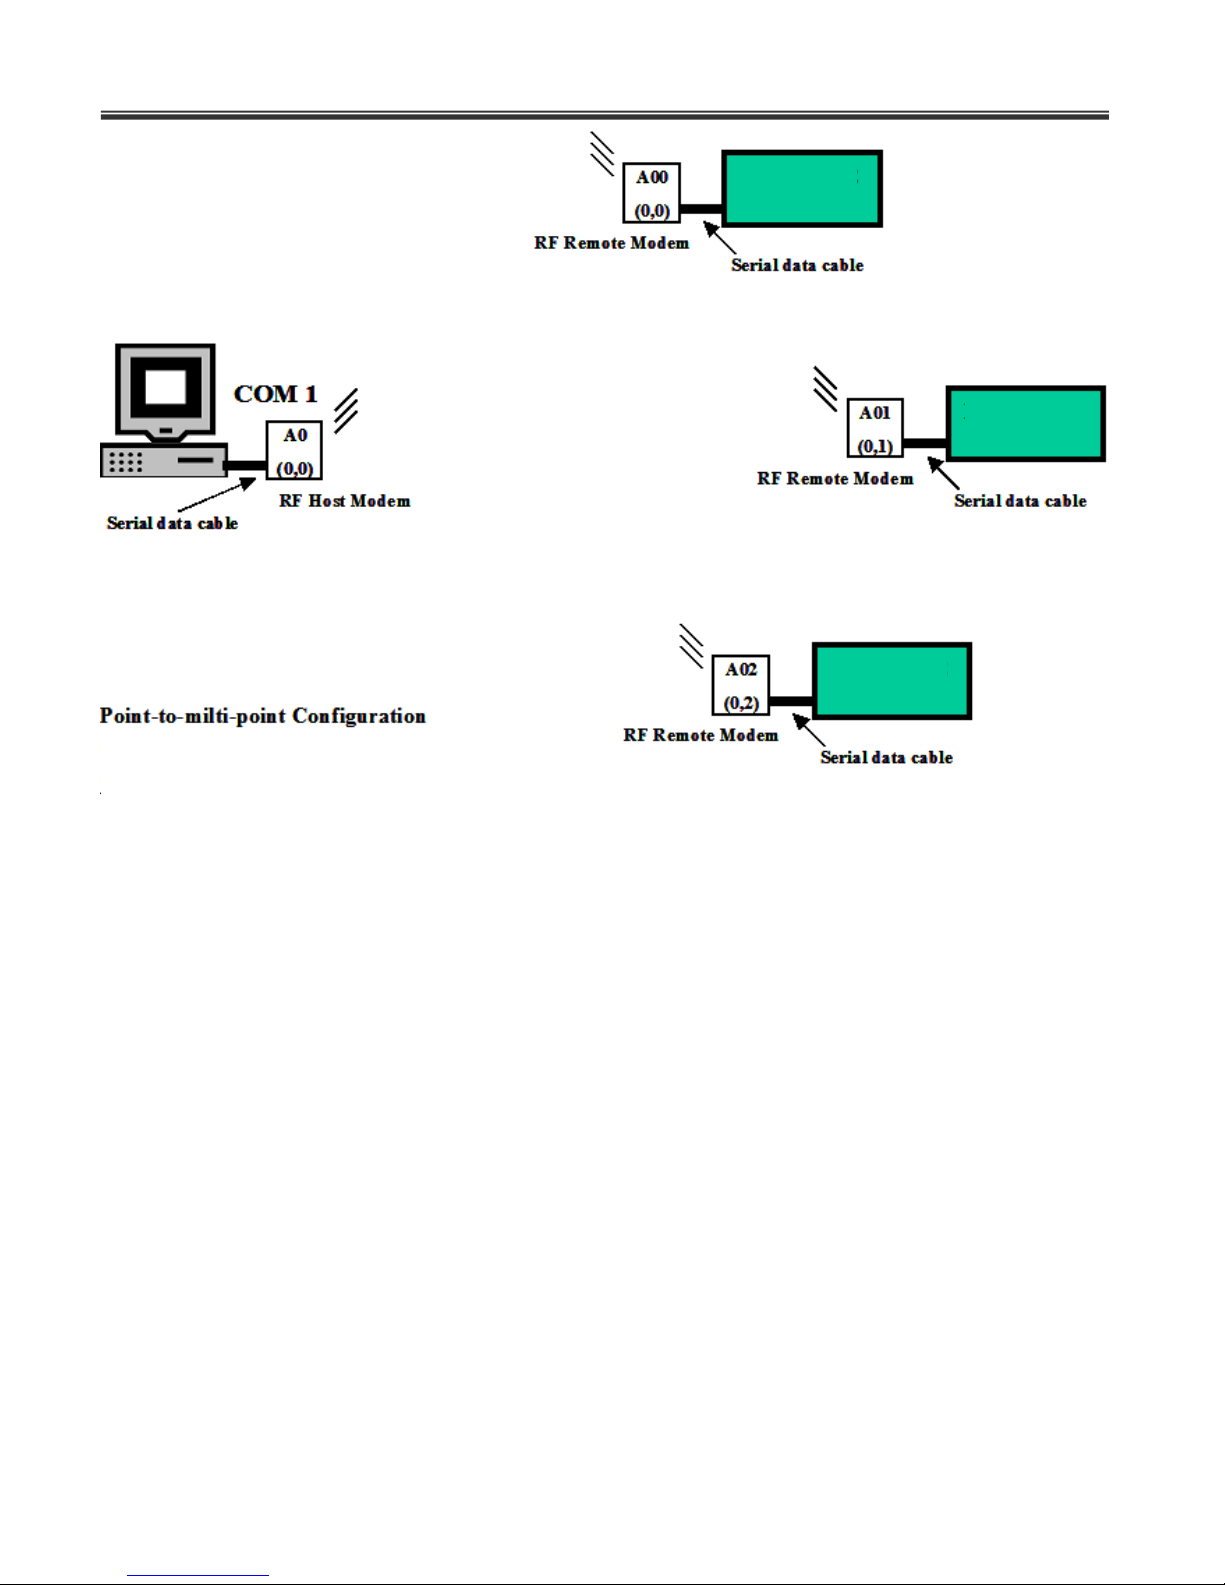
Dynamax Inc
70
Multi-station Scheduling
Logger 0
Logger 1
Logger 2
A multi-station setup as shown in figure below is a configuration of more than one station connected to a
single PC but each station connected on a different COM port. Once hardware (cabling and connections)
are setup the setup is ready to monitor anytime. Communication interface in this network can be
substituted with any of the available types as long as there is only one Logger station setup on each
COM port. Only one station may be connected at any give time.
Page 72
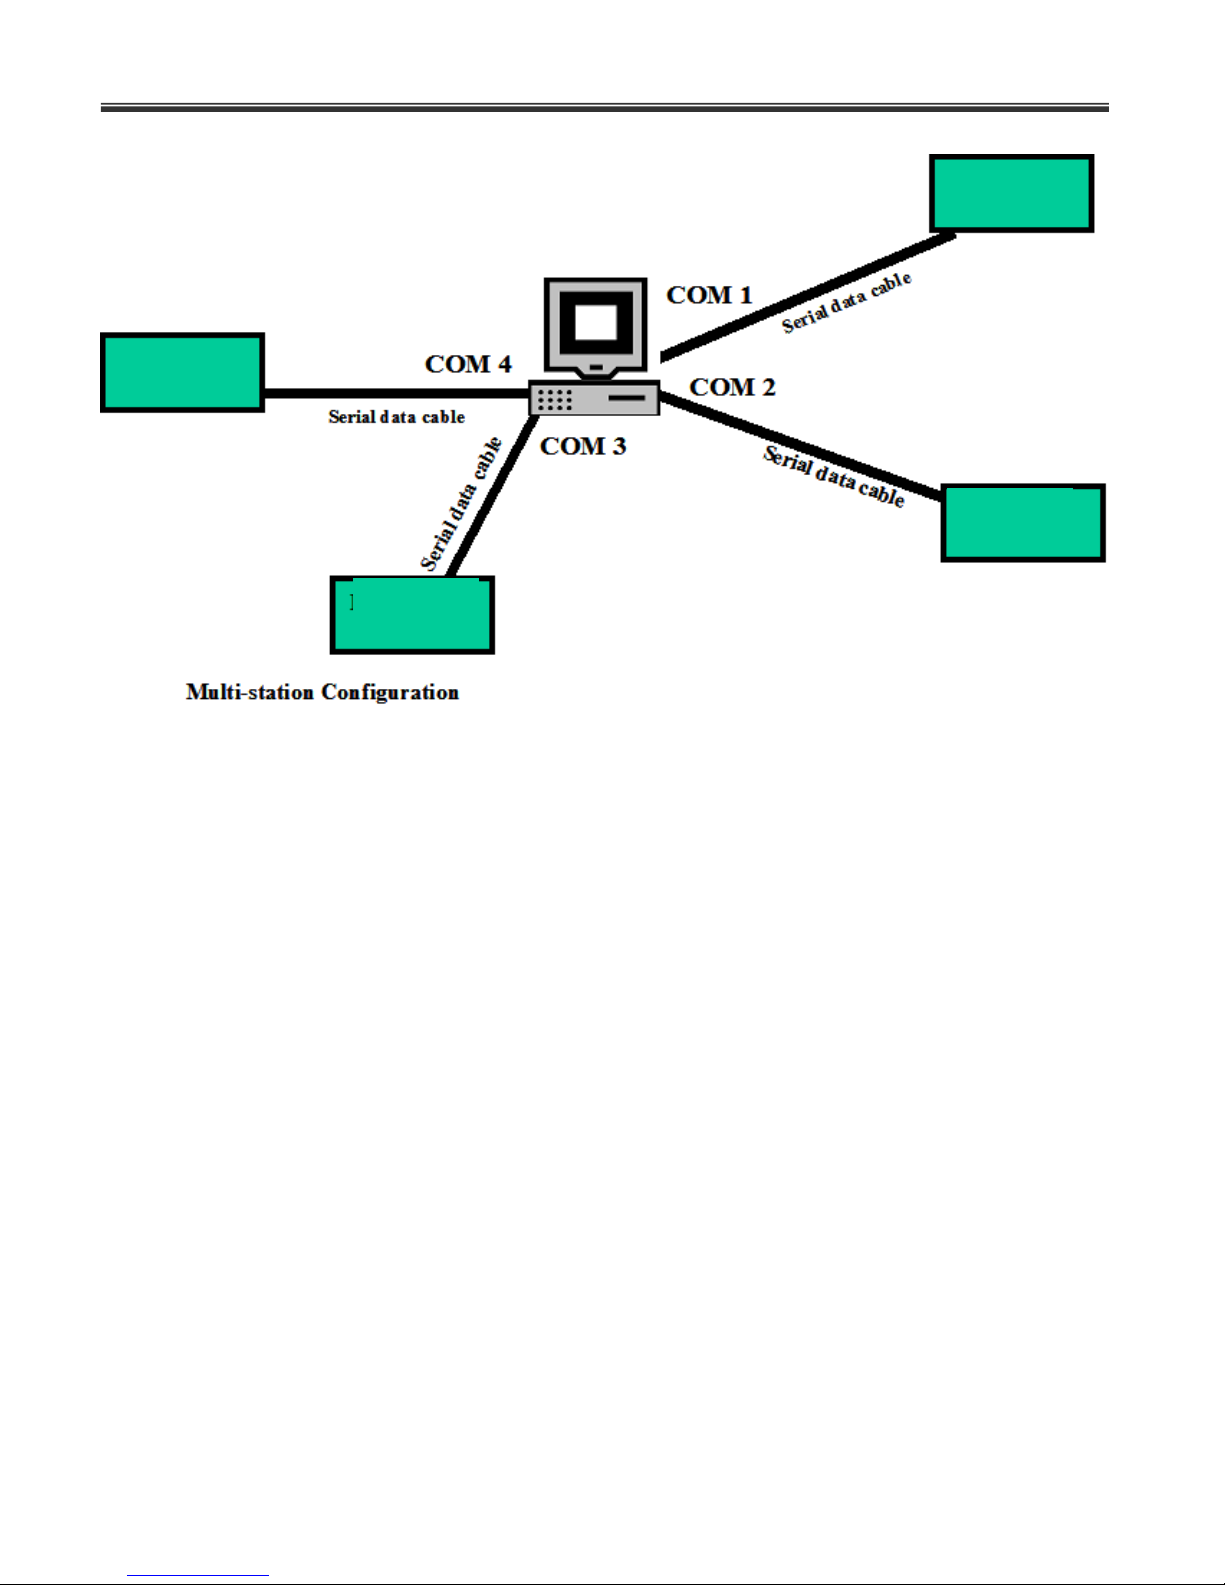
Dynamet 5
71
Logger 4
Logger 3
Logger 2
Logger 1
Page 73
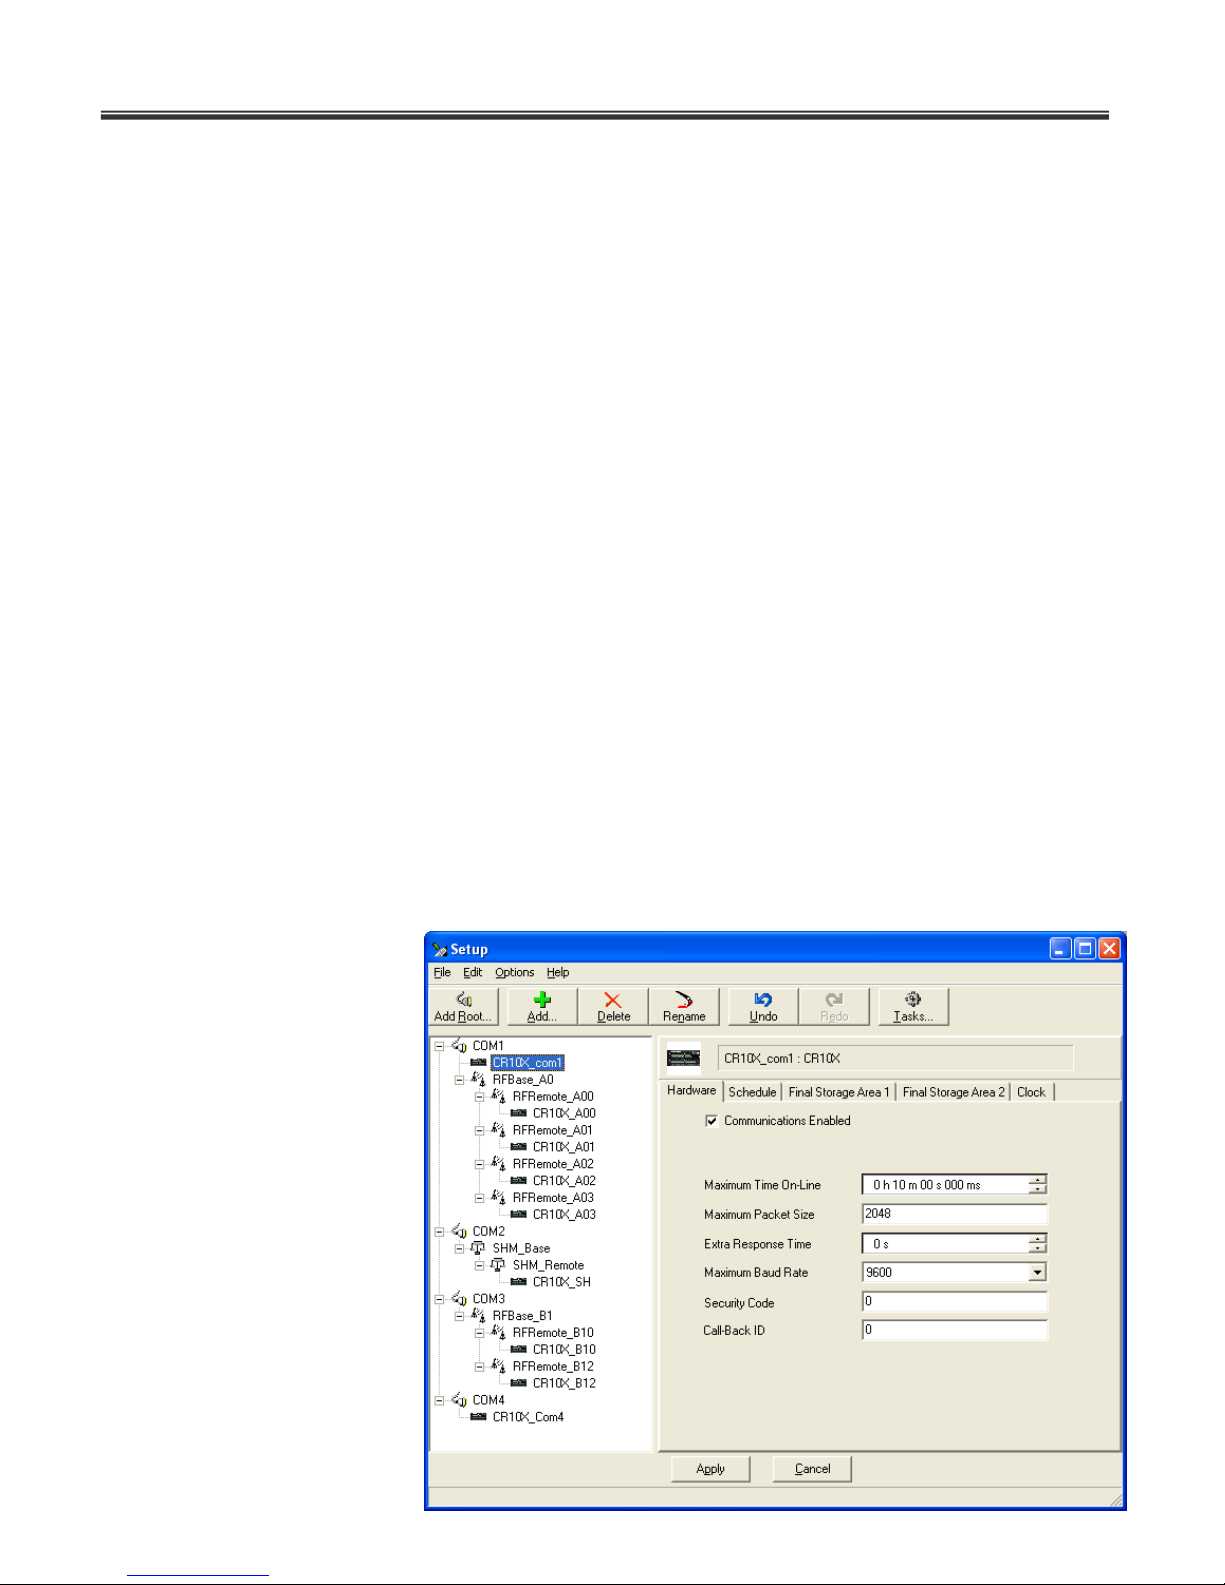
Dynamax Inc
72
7.4.2 A sample large scale setup
A large-scale/ hybrid network of CR10x based Dynamet 5 weather stations can be characterized
as a group of stations connected to more than one COM port on PC and using more than one
type of communication interface. A sample large-scale setup is shown on the previous page.
This setup has 9 Dynamet 5 Logger stations connected to 4 COM ports on a central
workstation.
CR10X_com4 is connected to Com4 respectively using standard serial (RS232) data cable.
Distance in this case is limited to 200’.
CR10X_SH is connected to Com2 using serial interface modem (short-haul modem). When
using SHM modem, transmission distance (between PC and Dynamet 5 stations) is limited
to 1.34miles(2KM).
CR10X_B11 and CR10X_B12 are connected to RF Host modem B1 on COM3 via RF
communication interface, using modems on each remote station. RF host modem B1 on
Com3 can be programmed using Logger Net to connect with either CR10X_B11 or
CR10X_B12 at any given time.
CR10X_com1 are connected to COM1 respectively using standard serial (RS232) data
cable. Distance in this case is limited to 200’.
CR10X_A00, CR10X_A01, CR10X_A02 and CR10X_A03 are connected to RF Host modem
A0 on COM1 via RF communication interface, using modems on each remote station.
Since we have more than one interface on COM1 (RF and serial cable), user has to
manually connect the appropriate cable either serial cable on CR10x_com1 or serial cable to
RF host modem. When serial cable from CR10x_com1 is connected to COM1 CR10x_com1
can be accessed from software In order to connect with one of the stations is network#0, RF
host modem A0 should be manually connected to COM1 and programmed net# and
module# same as respective remote RF modem.
Configuration and setup of
these stations in Logger Net
is shown in figure below.
Automatic scheduling and
data collection can be
achieved by activating
schedule tab for each
CR10x station.
Page 74
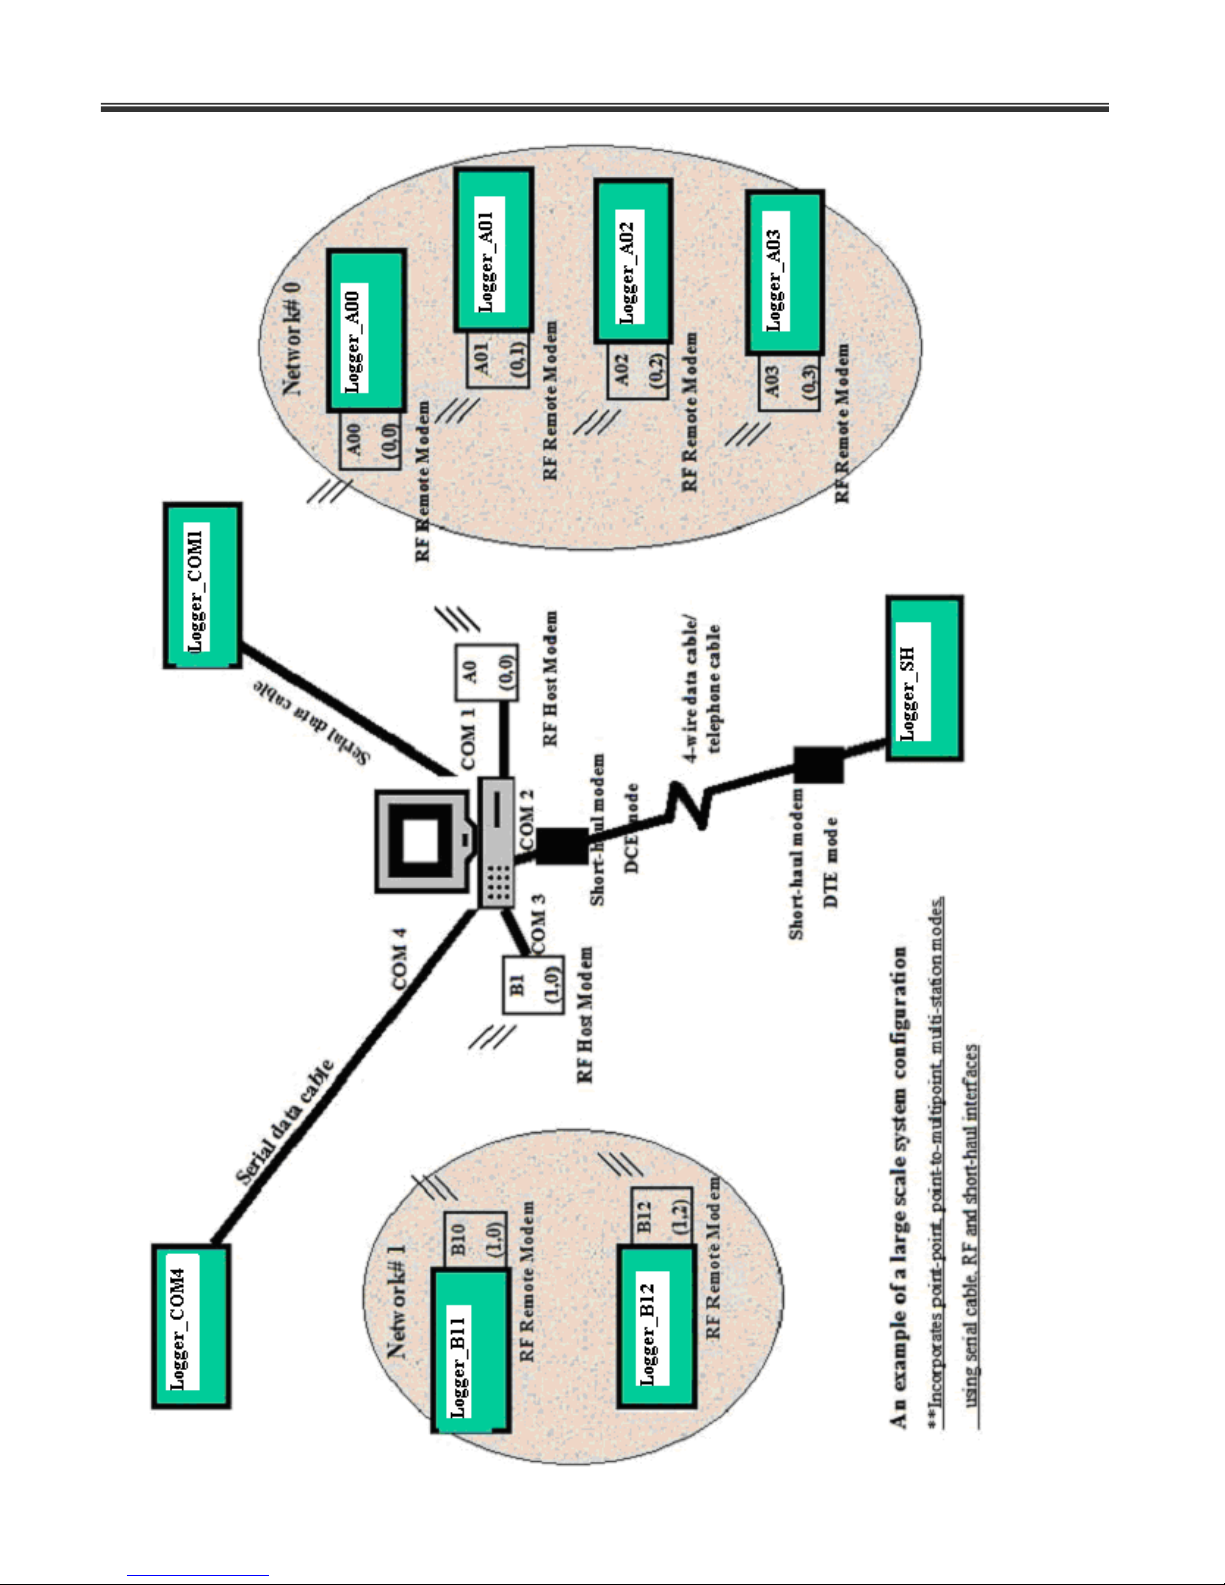
Dynamet 5
73
Page 75

Dynamax Inc
74
Page 76
Dynamet 5
75
Notation
Description
Units
zom
Height of measurement
M
zot
Roughness parameter for heat and vapor profile
M
abp
Average barometric pressure
Mb
lev
Heat of vaporization
J/Kg
has
Specific heat air capacity
J/Kg.degC at 30C
Notation
Description
Units
hgr
Hourly average solar radiation
W/m2
hta
Hourly average of air temperature
degC
hrh
Hourly average or relative humidity
%
hws
Hourly average of wind speed
M/s
hts
Hourly average of soil temperature
DegC
Notation
Description
Units
had
Air Density
Kg/m3
hum
Ambient Humidity
Kg/m3
ras
Aerodynamic resistance
S/m
skl
Sky long-wave radiation
W/m2
htc
Surface temperature
DegC
rnt
Net radiation balance
W/m2
sht
Sensible heat flux
W/m2
hums
Humidity at the surface
Kg/m3
evt
Evapotranspiration
Kg/m2.s
EVT
Evapotranspiration in standard units
mm/hour
Appendix A: LASCANO-VAN BAVEL ITERATIVE ET ALGORITHM
Constants or site-specific variables:
Input variables:
Calculated variables:
Page 77

Dynamax Inc
76
5.0817.3
6
2.1013
10002361.0501.2
:
Eelf
eabp
htalev
VariablesSpecificSite
1078.6
ln2693882.17
1078.6
ln3.237
1078.6
:int
3.237
2693882.17
a
a
asa
T
T
as
e
e
hdp
hrhTee
eTe
nCalculatioPoDew
a
a
2.273
1500
4
22
237
269.17
08241.070.0()2.273(867.5
1.0
1.016.0
ln
16.0
ln
2.273
323.1
2.1013
1548.1
:lg
hta
hdp
hdp
ehumhtaEskl
hwswhen
hws
zot
zom
rasor
hws
zot
zom
ras
hdp
e
hum
abp
had
ncalculatioETfororithmaRCM
htc
hta
hashad
ras
lev
ras
hum
htc
e
rashta
hashadhtchta
sklhtcEhgrroothtc
htc
htc
htc
,
2.273
16.303
2.273
323.1
2.273
16.303
)2.273(867.580.0
237
269.17
4
10
3600
2.273
16.303
2.273867.580.0
4
evtEVT
lev
shtrnt
evt
rashta
htchtahashad
sht
sklhtcEhgrrnt
RCM ET Algorithm:
Page 78

Dynamet 5
77
Appendix B: REFERENCES
o Van Bavel, C.H.M and Lascano R.J. Calculation of Potential and of Reference
Evapotranspiration poster
o Van Bavel, C.H.M and Lascano R.J. Calculation of Potential and of Actual
Evapotranspiration Agronomy journal, Feb 2006 pending publication.
o ASCE, 2005. The ASCE standardized Reference Evapotranspiration Equation. Prepared
by Task committee on standardization of Reference Evapotranspiration of the
Environmental and Water Resources Institute, January, 2005. Environmental and Water
Resources Institute of the ASCE
o Budyko, M.I. 1956. The heat balance of the Earth’s surface. (English translation, N.A.
Stepanova, Office of Technical Services, PB 131692, US. Department of commerce,
Washington, D.C.1958), 259 pp.
o Murray, F.W., On the Computation of Saturation Vapor Pressure, Journal of Applied
Meteorology, February 1967, volume 6.
o Lascano, R.J. 2000. A general system used to measure and calculate daily crop water
use. Agronomy Journal, 1992, 821-832.
o Penman, H.L. Natural evaporation from open water, bare soil and grass. Proc. Roy.
Soc. (London). A193: 120-145. 1948
o Van Bavel, C.H.M. Potential evaporation: The combination concept and its experimental
verification. Water Resources Research. 2: 445-467. 1966.
o Kimball, B.A., S.B. Idso, and J.K. Aase. A model of thermal radiation from partly cloudy
overcast skies. Water Resources Research. 18: 931-936. 1982.\
Page 79

Dynamax Inc
78
Appendix C: SENSOR SPECIFICATIONS
Page 80
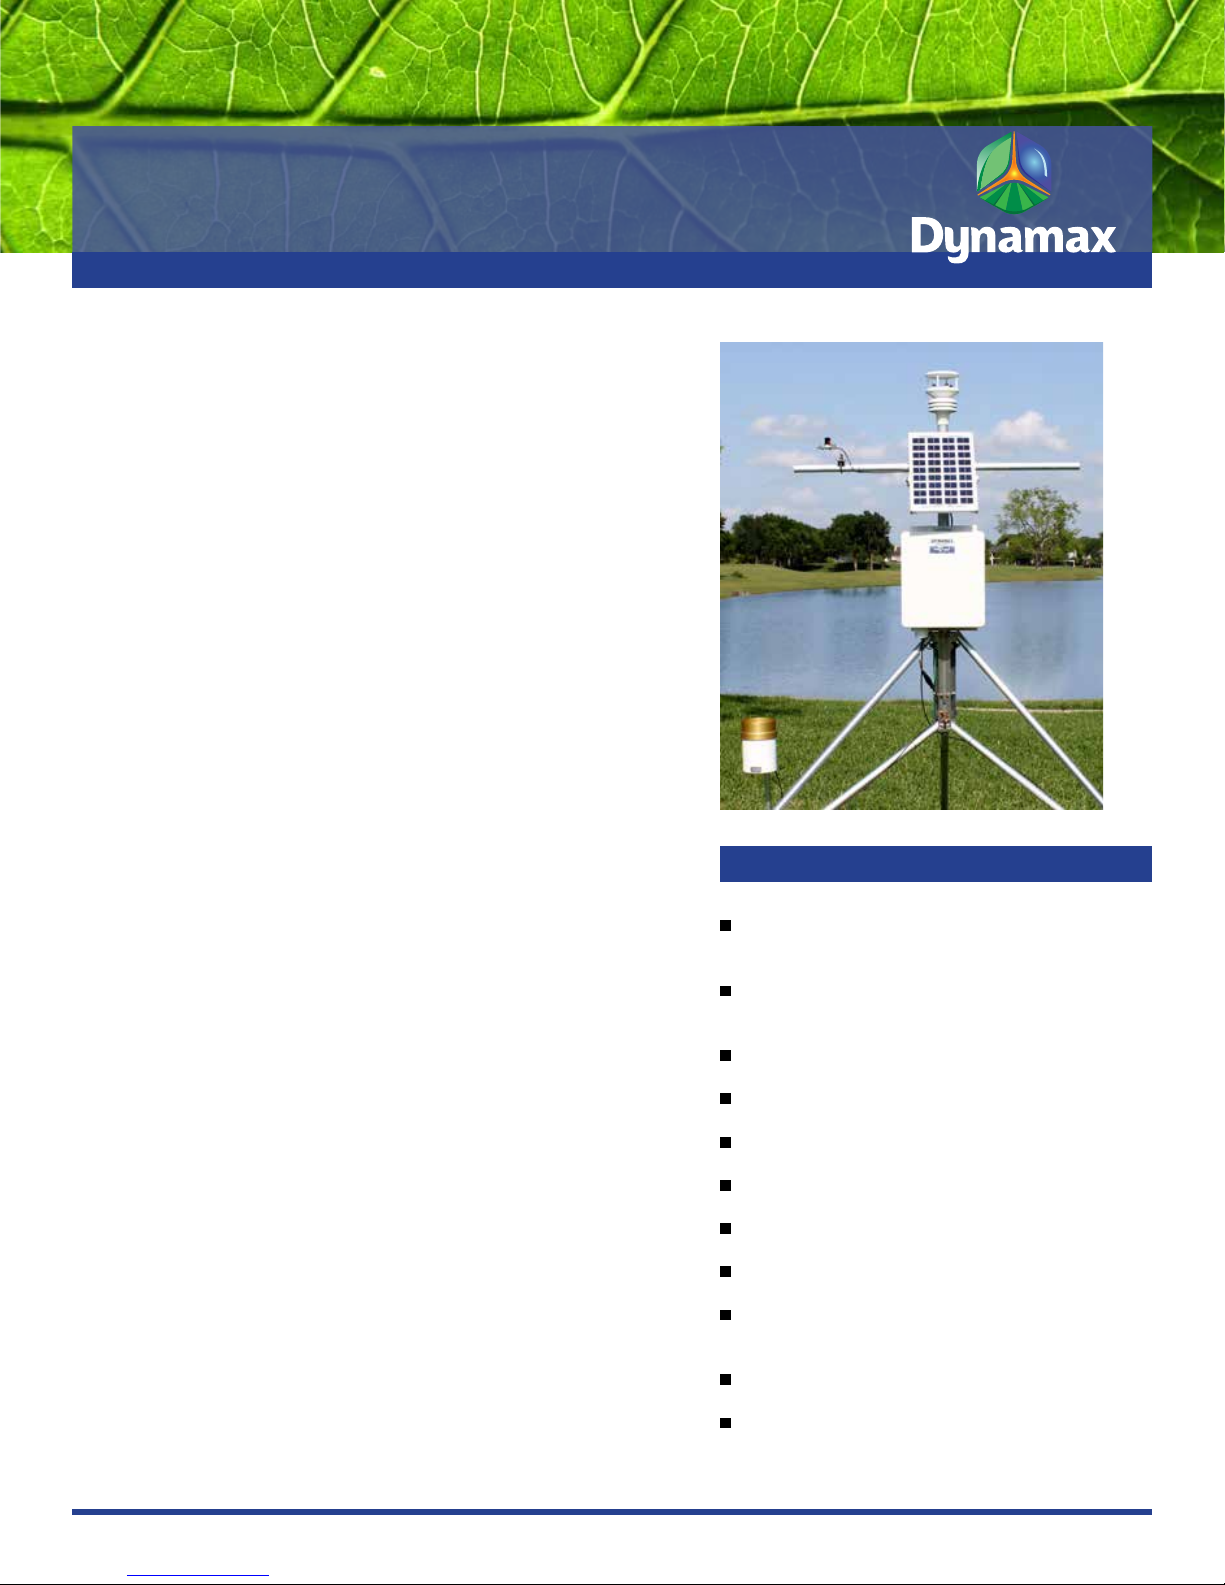
Dynamet 5
Weather Station
The DynaMet-5 is a complete ETp (Evapotranspiration)
weather station which includes the DynaLog1000 data
logger and the MaxiMet 500 compact weather station kit.
The rainfall sensor included is the TE525, which is a very
rugged and accurate rainfall sensor. A soil temperature
probe is also included. The system comes with all software
for programming, data collection, and calculation of ETp.
The DynaMet-5 is a research grade, weather station ideal
for research, commercial, or agricultural applications.
Comes complete with a 6 ft Tripod, cross-arm, grounding
kit, rechargeable battery and 10 Watt solar panel.
Evapotranspiration Software
Standard evapotranspiration modeling software is
packaged with the Dynamet weather station. The purpose
is to compute the potential evapotranspiration from short
grass (ETP) in mm per hour on an hourly basis. A daily
total in mm is also computed. The algorithms are based
on the method originally proposed by Penman, but with
several modications by Dr. C.H.M. Van Bavel that updated
the procedure. Whereas the original method was designed
to give only daily totals from average daily weather data,
the present method uses hourly input data and provides
a more realistic picture of the evaporative demand. PENV
software facilitates a variety of research and commercial
weather tracking projects.
Features
MaxiMet 500 Compact weather
station
MaxiMet™
MaxiMet is an advanced compact weather station designed
and manufactured by Gill Instruments using proven
technology to measure meteorological and environmental
parameters to international standards. MaxiMet
incorporates all the measurement parameters that meet
the requirements of users in demanding applications where
cost, quality and performance are essential.
Mast - Enclosure Specications
6 ft. (2 m) tripod with collapsible legs, ground stakes,
and slide collars for levelling. Crossbar mount for wind
set, pyranometer mounting, levelling stand, and 12 plate
radiation shield for RH /temperature probe are included.
Grounding rod, lightening arrestor, and ground rod cables
are included. Logger is mounted in a sealed and lockable
NEMA 4 white berglass enclosure 12” x 14”.
Dynamax, Inc | 10808 Fallstone Rd #350 | Houston TX 77099 | USA | [email protected] | www.dynamax.com | 800-896-7108
Portable 2 meter (6 ft.) tripod, 3
meter (10 ft.) optional
Sealed enclosure
CR1000 data logger
10 Watt solar panel, mast mounted
Battery and charger circuit
Scientic grade weather sensors
4 MB of storage
RS-232 Interface & PC9-pin cable
(3 m)
Power Up Program Start
PENV - Penman-Van Bavel ETP
Page 81
Specications
Wind Speed
Range 0.1 m/s to 60 m/s
Accuracy ± 3% to 40 m/s, ± 5% to 60 m/s
Resolution 0.01 m/s
Wind Direction
Range 0 to 359°
Accuracy ± 3° to 40 m/s, ± 5° to 60 m/s
Resolution 1°
Barometric Pressure
Range 300 to 1100
Accuracy ± 0.5 hPa @ 25°C
Resolution 0.1 hPa
Units of measure hPa, bar, mmHg, inHg
Air Temperature
Range -40°C to +70°C
Accuracy ± 0.3°C @ 20°C
Resolution 0.1
Units of measure °C, °F, °K
Relative Humidity
Range 0-100%
Accuracy ± 2% @ 20°C (10%-90% RH)
Resolution 1%
Units of measure % Rh, g/m3, g/Kg
Dew Point
Range -40°C to +70°C
Resolution 0.1 °C
Units of measure °C, °F, °K
Accuracy ± 0.3°C @ 20°C
Rain Gage
Sensor Type Tipping bucket with magnetic reed switch
Housing Material Anodized aluminum
Resolution 1 tip
Volume per Tip 4.73 ml/tip (0.16 . oz/tip)
Rainfall per Tip 0.254 mm (0.01 in.)
Accuracy ±1% (up to 1 in./h)
Solar Radiation
Accuracy Absolute error in natural daylight is ±5% maximum (±3% typical)
Sensitivity 0.2 kW m
Light Spectrum Waveband 400 to 1100 nm
+0, -3% (1 to 2 in./h)
+0, -5% (2 to 3 in./h)
-2
-1
mV
Dynamax, Inc | 10808 Fallstone Rd #350 | Houston TX 77099 | USA | [email protected] | www.dynamax.com | 800-896-7108
Page 82
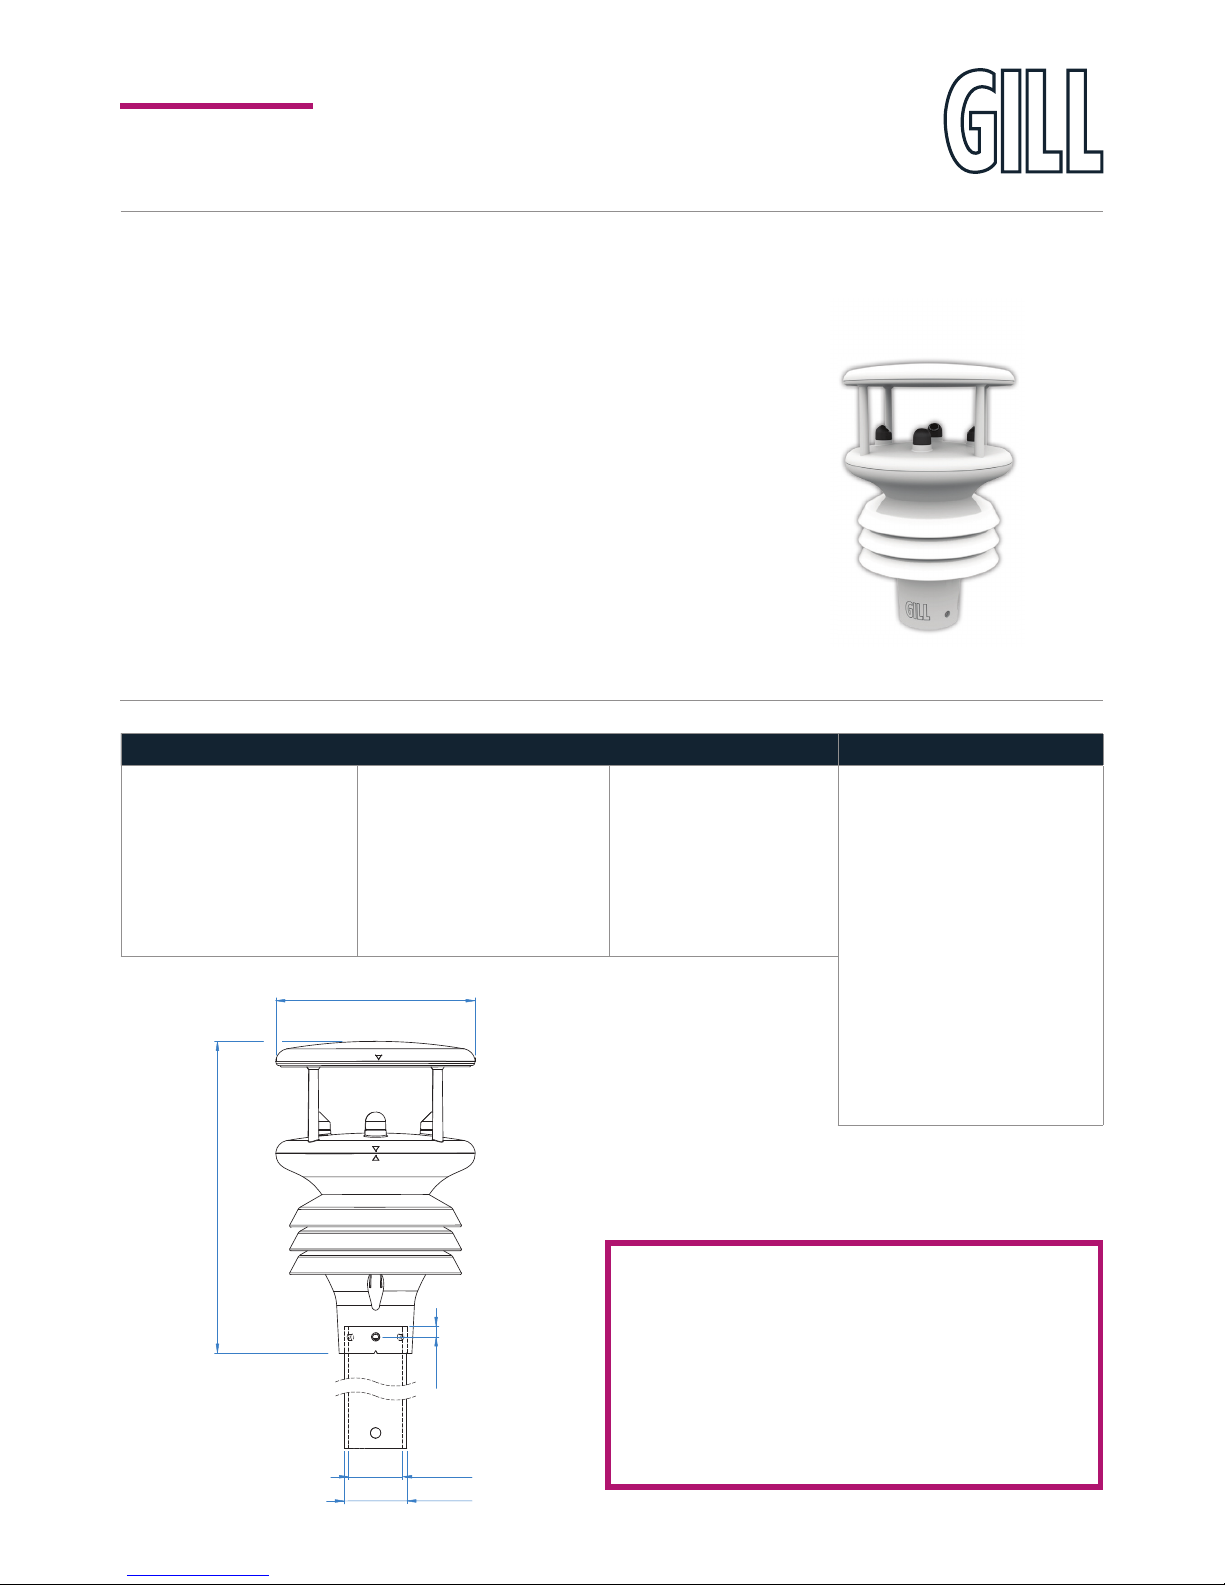
(.9$PNQBDU8FBUIFS4UBUJPO
The MaxiMet range of compact weather stations is designed and manufactured by Gill Instruments. MaxiMet products use
reliable, high quality instruments to provide accurate meteorological information in a wide variety of applications.
TEMP, HUMIDITY & PRESSURE WIND GPS (OPTION) PARAMETERS
Air Pressure / Temperature
Relative / Absolute humidity
Naturally aspirated UV stable
radiation shield
Protection against wind-blown
precipitation/dust
Wind speed & direction
Apparent and true wind (with GPS)
WMO wind averages and gust
Compass
GPS (optional) gives height above
sea level, latitude and longitude
Height above sea level m
Sunrise/sunset
Position of the sun
4PMBS/PPO
Twilight
MSL pressure
"OHMFPG5JMU
Temperature °C / °F / °K
Relative humidity % Rh, g/mHLH
Barometric pressure hPa, bar, mm Hg
Wet bulb temperature °C / °F / °K
Absolute humidity g/m
Air density kg/m
Wind speed
m/s, km/hr, mph, kts, ft/min
Wind direction °
Wind chill °C / °F / °K
True/apparent wind
Outputs
RS232, 422, 485 (ASCII), SDI-12, NMEA,
MODBUS, Analogue (option)
Temperature, humidity, pressure."DPNCJOFEJOTUSVNFOUNPVOUFEJOTJEFUISFF
EPVCMFMPVWFSFEOBUVSBMMZBTQJSBUFESBEJBUJPOTIJFMETXJUIOPNPWJOHQBSUT5IFSFTVMUT
BSFIJHIQFSGPSNBODFBDSPTTFBDINFBTVSFNFOUPWFSMPOHQFSJPETPGUJNF
Wind. 8JOETQFFEBOEEJSFDUJPONFBTVSFNFOUTBSFQSPWJEFEWJBBOVMUSBTPOJDTFOTPS
BOEUIFBEEJUJPOPGBOFMFDUSPOJDDPNQBTTQSPWJEFTBQQBSFOUXJOENFBTVSFNFOUT
"WFSBHFTQFFEBOEEJSFDUJPOUPHFUIFSXJUI8.0BWFSBHFTBOEHVTUEBUBJTBMTP
QSPWJEFE"EE(14PQUJPOBMUPQSPWJEFUSVFXJOEBOEPUIFSGFBUVSFT
GMX500 Features
MaxiMet
222mm
38.5mm
44.5mm
7.5mm
142mm
All MaxiMet Models Feature
2VBMJUZ.FBTVSFNFOUT
-JHIUXFJHIUBOE3PCVTU
-PX1PXFS.PEF
'SFFPG$IBSHF4PGUXBSF
(JMM1SPWFO3FMJBCJMJUZ
$PNQBDU*OUFHSBUFE%FTJHO
3FBM5JNF0VUQVU
&BTZ*OTUBMMBUJPO
(JMM$VTUPNFS4VQQPSU
:FBS
8BSSBOUZ
1MFBTFTFFUIFNBOVBMGPSBGVMMMJTUPGEFSJWFEQBSBNFUFST
Page 83
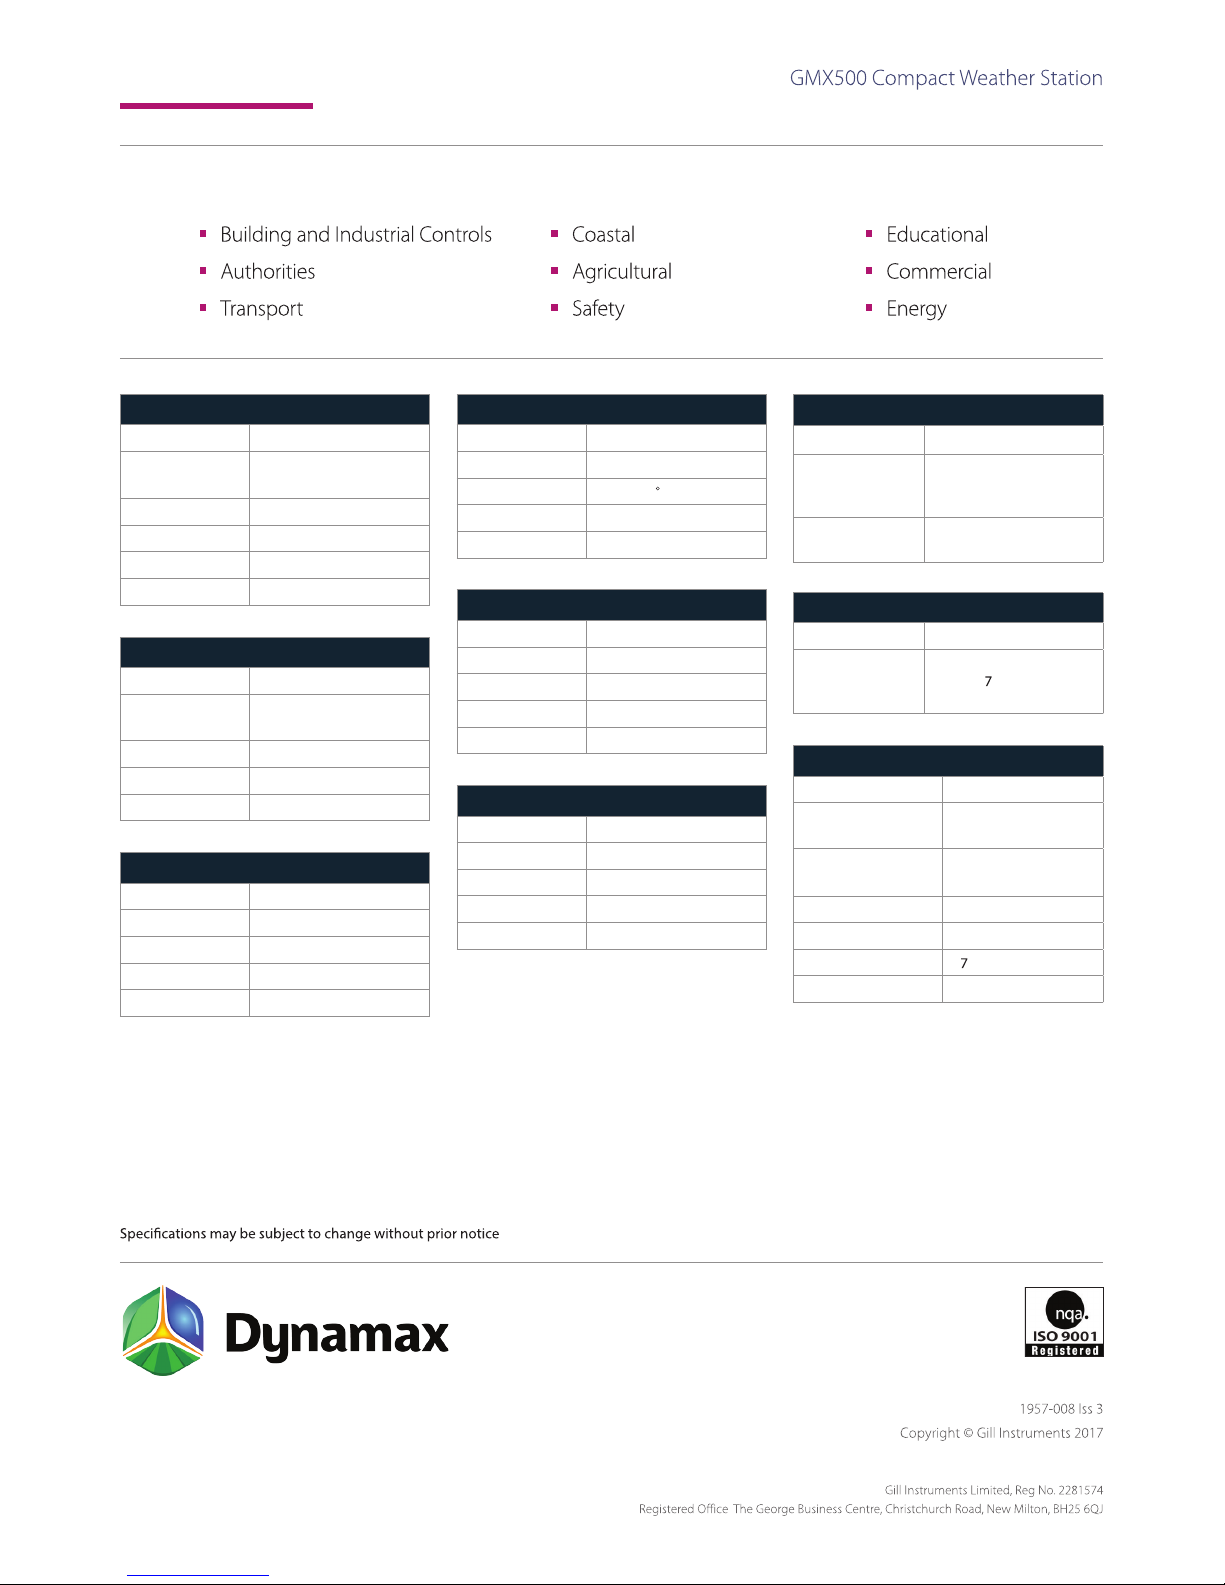
MaxiMet
Applications
WIND SPEED
Range 0.1 m/s to 60 m/s
Accuracy ± 3% to 40 m/s,
± 5% to 60 m/s
Resolution m/s 0.01
Starting Speed 0.1 m/s
Sampling Rate 1 Hz
Units m/s, km/hr, mph, kts, ft/min
WIND DIRECTION
Range 0-359°
Accuracy ± 3° to 40 m/s
± 5° to 60 m/s
Resolution 1°
Sampling Rate 1 Hz
Units Degrees
TEMPERATURE
Range -40°C to +70°C
Resolution 0.1
Accuracy ± 0.3°C @ 20°C
Sampling Rate 1 Hz
Units °C, °F, °K
HUMIDITY
Range 0-100%
Resolution 1%
Accuracy ± 2% @ 20
C (10%-90% RH)
Sampling Rate 1 Hz
Units % Rh, g/m3, g/Kg
DEW POINT
Range -40°C to +70°C
Resolution 0.1
Accuracy ± 0.3°C @ 20°C
Units °C, °F, °K
Sampling Rate 1 Hz
ENVIRONMENTAL CONDITIONS
IP Rating 66
Operational
Temperature Range:
-40°C to +70°C
EMC Standard: BS EN 61326 : 2013
FCC CFR47 parts 15.109
CE Marking YES
RoHS compliant YES
Weight
0. Kg
Origin UK
PRESSURE
Range 300 to 1100
Resolution 0.1 hPa
Accuracy ± 0.5 hPa @ 25°C
Sampling Rate 1 Hz
Units hPa, bar, mmHg, inHg
POWER
Power Supply 5 to 30 Vdc
Power (Nominal)
12 Vdc
25 mA continuous high
mode. 0.
mA eco-power
mode (1 hour polled)
OUTPUTS
Output rate 1/s, 1/min, 1/hr
Digital Comms
Modes
Serial RS232, RS422,
RS485, SDI-12, NMEA,
MODBUS, ASCII
Analogue Outputs Available via separate
optional device
10808 Fallstone Road
Suite 350
Houston, TX 77099
Tel: (281) 564-5100
www.dynamax.com
[email protected]
 Loading...