

Page 1

DwyerLog Logger Interface
Software
USER’S GUIDE
Version 1.4x
March 21, 2013
Dwyer Instruments, Inc
102 Indiana Hwy 212
Michigan City, IN 46360
Phone: (219) 879-8868 Fax: (219) 872-9057
http://www.dwyer-inst.com
Page 2

Quick Start ................................................................................................................... 4
Overview ...................................................................................................................... 4
Connecting the Logger to Your PC .............................................................................. 4
Setting Up the Logger To Record Data ........................................................................ 5
Custom Interval Setup ................................................................................................. 6
Alarm Setup ................................................................................................................. 6
Using the Software to Check Logger Status ................................................................. 7
General Logger Status and Data In Memory Pane .................................................................. 7
Alarm Status Pane .................................................................................................................... 8
Last Sample Pane ..................................................................................................................... 9
Ending the Logging Session ........................................................................................ 9
Powering Down the Logger .......................................................................................... 9
Loading Logger Data ................................................................................................... 9
Automatic Data Retrieval ........................................................................................... 10
Working With the Data Graph .................................................................................... 11
Using the Zoom Feature ............................................................................................ 12
Data Listing Window .................................................................................................. 13
Data Summary and Statistics ..................................................................................... 13
Using the Data Filter .................................................................................................. 14
Hiding or Viewing Channels ....................................................................................... 15
Exporting Logger Data ............................................................................................... 15
Printing the Logger Data ............................................................................................ 16
Calibrating the Logger ................................................................................................ 16
Setting the Calibration Password ............................................................................... 17
Setting the Logger Real Time Clock ........................................................................... 18
Data Security ............................................................................................................. 18
Specifications ............................................................................................................ 19
MTL-30 Temperature Humidity Logger ......................................................................
19
MTL-30 Logger Status LED ....................................................................................... 19
Replacing the MTL-30 Battery ................................................................................... 20
MTL-30 Specifications ............................................................................................... 21
MTL-20 Temperature Logger ..................................................................................... 21
MTL-20 Logger Status LED ....................................................................................... 21
Replacing the MTL-20 Battery ................................................................................... 21
MTL-20 Specifications ............................................................................................... 22
Page 3

GDL Temperature Humidity Logger with Display ....................................................... 22
Turning the GDL On and Off ...................................................................................... 23
GDL Sample Screen .................................................................................................. 23
The GDL Summary Screen ........................................................................................ 24
GDL Graph Screen .................................................................................................... 25
GDL Buttons .............................................................................................................. 25
Replacing the GDL Battery ........................................................................................ 26
GDL Specifications .................................................................................................... 27
GDL-T Four Temperature Logger with Display ........................................................... 27
Turning the GDL-T On and Of f ................................................................................... 27
GDL-T Sample Screen ............................................................................................... 28
GDL-T Difference Screen .......................................................................................... 29
GDL-T Summary Screen ........................................................................................... 29
GDL-T Graph Screen ................................................................................................. 30
GDL-T Buttons ........................................................................................................... 30
Replacing the GDL-T Battery ..................................................................................... 31
GDL-T Specifications ................................................................................................. 31
MTL-LCD Loggers with Display ................................................................................. 31
MTL-LCD Display and Butt on .................................................................................... 32
Replacing the MTL-LCD Battery ................................................................................ 32
MTL-20-LCD Specifications ....................................................................................... 33
MTL-30-LCD Specifications ....................................................................................... 33
Page 4
DwyerLog User’s Guide Version 1.4x 4/33
Quick Start
Follow the procedure below to start using your data logger:
1. Connect the data logger to a free USB port on your computer.
2. Start the DwyerLog Interface Program.
3. From the Logger menu, select Setup.
4. Select the "Logging starts immediately when setup is complete" option.
5. Click Continue to start logging.
The logger i s now logging data. Yo u can click on t he
has been lo gged.
icon on the toolbar to download and view the data that
Overview
The Dwyer USB data loggers are versatile devices that can be used for a wide range of logging applications. Ea c h
logger is capable of sampling data as fast as once per second or as slow as once every 18 hours. Each logger can
stop recording when memory becomes full, or rollover for continuous recording. The start of recording is software
selectable to be immediate, delayed, or initiated when the Start button is press.
The loggers can also be used to monitor high and low alarm events, that indicate if the recorded data passed above
and/or below the user selected threshold. The loggers have a visual indication of an alarm condition.
Each USB logger has an internal real time clock/calendar. This real time clock is used to record the time stamps for
data samples. This real time clock is independent of your computer clock, and can be set separately, or set to match
your computer clock.
The USB loggers are extremely low power. Under normal operating conditions, the battery will last several years.
Connecting the Logger to Yo ur P C
Your logger comes complete with the software and the USB interface cable. To connect the logger to your
computer, follow these steps:
1. Connect the USB cable to the logger and to a free USB port on your computer.
2. If you are connecting the logger to the PC for the first time, the logger will automatically be recognized and
installed on your computer.
3. Start the DwyerLog program and click on the
The logger status screen should now be displayed.
Note: The Windows operating system can not handle USB devices being unplugged and replugged too fast. When
unplugging the logger, wait for about 5 seconds before plugging it (or any other USB device) in again. If you
unplug and replug a device too quickly, the computer may stop recognizing any USB devices on that port. If this
happens, the only solution is to restart the computer. This is a Windows USB problem and is not related to the
DwyerLog soft ware.
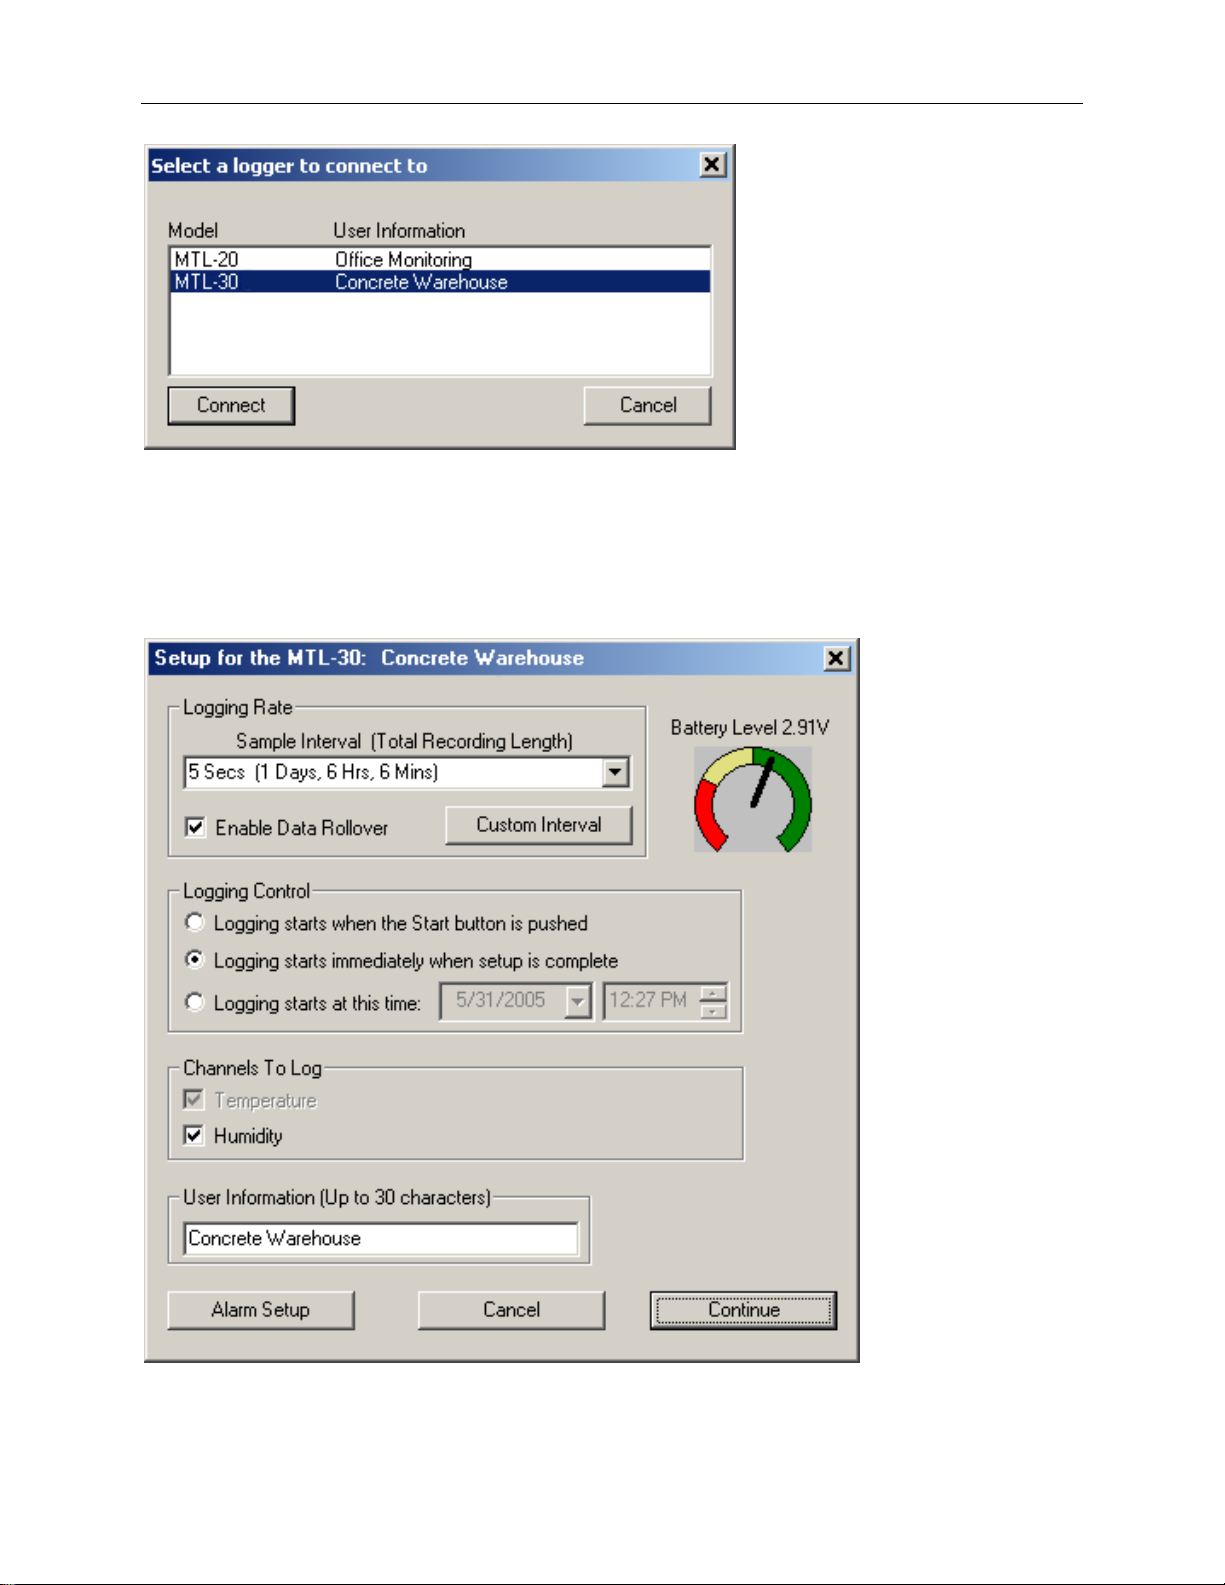
If more then one logger is connected to your computer at the same time, the program will ask you to select one of
the loggers:
icon on the toolbar.
Page 5
DwyerLog User’s Guide Version 1.4x 5/33
To select a logger click on one of the l oggers on t he list, and click the Connect button.
Setting Up the Logger To Record Data
To set your logger to start recording data, select Setup from the Logger menu. The setup options window is shown
below.
• Sample Interval (Total Recording Length): Select the sample interval from a predefined list of intervals.
• Custom Interval: Add your own interval to the sample interval list.
Page 6
DwyerLog User’s Guide Version 1.4x 6/33
• Enable Data Rollover: Check this box to have the lo gger contin uously record the data, overwriti ng earliest
recorded data. When this box is not checked, logging is stopped when the logger memory becomes full.
• Logging Control: Logging can star t in three ways depending on the selection you make:
• Logging st arts when the Start button is pushed: Logging will start when t he Start button is pushed for about 3
seconds.
• Logging st arts immediately when se tup is complete: Logging will star t immediately once the Continue button
is clicked.
• Logging starts at this time: Logging will start at the user spe c ified time. There is no limit how far in the future
you can set the logging to start.
• Channels to Log: You can elect to disable unused logger channels. When a channel is disabled, its memory is
allocated to the other channels, increasing the total logging time. The total logging time will be reflected in the
Sample Interval window. Depending on the logger, some channels are required and cannot be disabled. Channels
that can not be disabled are grayed out and can not be unchecked. For instance, in the picture above, the
Temperature channel is required to record Realative Humidity, so the Temperature channel cannot be disabled. At
least one channel must be enabled for logging.
• User Information: Enter any text you like in this box. This field is used to identify the logger t o the user. Y ou
can enter descriptive location, serial number, etc.
• Alarm Setup: Click t his button to open the Alarm Setup Wind ow.
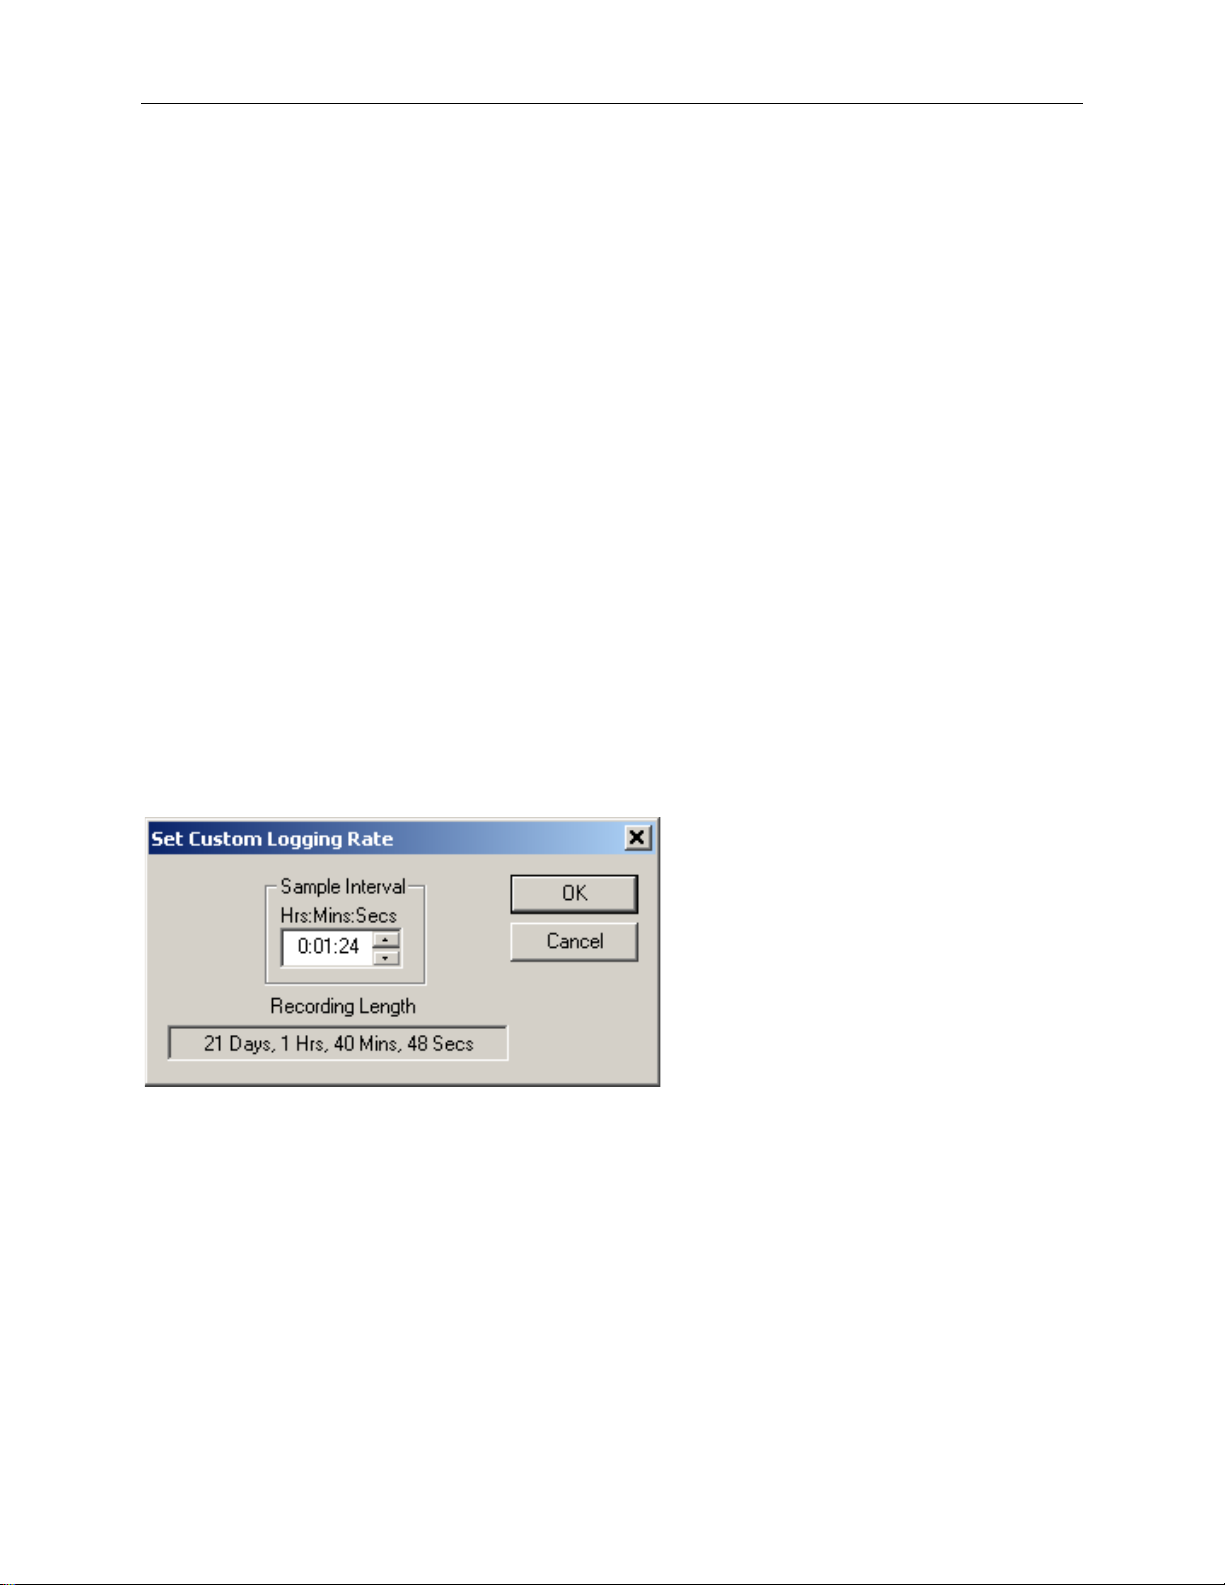
Custom Interval Setup
Commonly used intervals are predefined in the Sample Interval box in the Logger Setup screen. I f needed, a
custom interval can be defined by the user. This is done by clicking on the Custom Interv al button in t he Logger
Setup screen. The custom interval window will popup, as shown bel ow. You can se lect a custom logging interval
using this window.
In the window above, the sampling interval was set to 1 minute, 24 seconds, to allow a 3 week recording.
Alarm Setup
Alarms are used to indicate whether or not the data inside the logger exceeded a user specified threshold. This can
be an indication that an important event has o ccurred and the data i s worth downl oading and looking at. The alar m
status is indicated visually by pr e ssing the Check button and watching the LED light. The LED will flash green
when no alarms occurred. The LED will flash red when an alarm has occurred and is stored in logger memory.
To get to the Alarm Setup window, click the Alarm Set up button in the Lo gger Setup screen. The Alarm Setup
windows allows you to se t high and/ or low alarm thresholds for each l ogger cha nnel, or d isable these alarms.
Alarms are se t by entering the thresholds as shown in the window below.
Page 7
DwyerLog User’s Guide Version 1.4x 7/33
The checkbox to the left of the low/high alarms enables the alarm when checked, and disables the alarm when clear.
Using the Software to Check Logger Status
Selecting Status from the Logger menu brings up t he Logger Status window. You can al so bring up t he status
window by p ressing the
button on the toolbar. The logger status screen is separated into three panes:
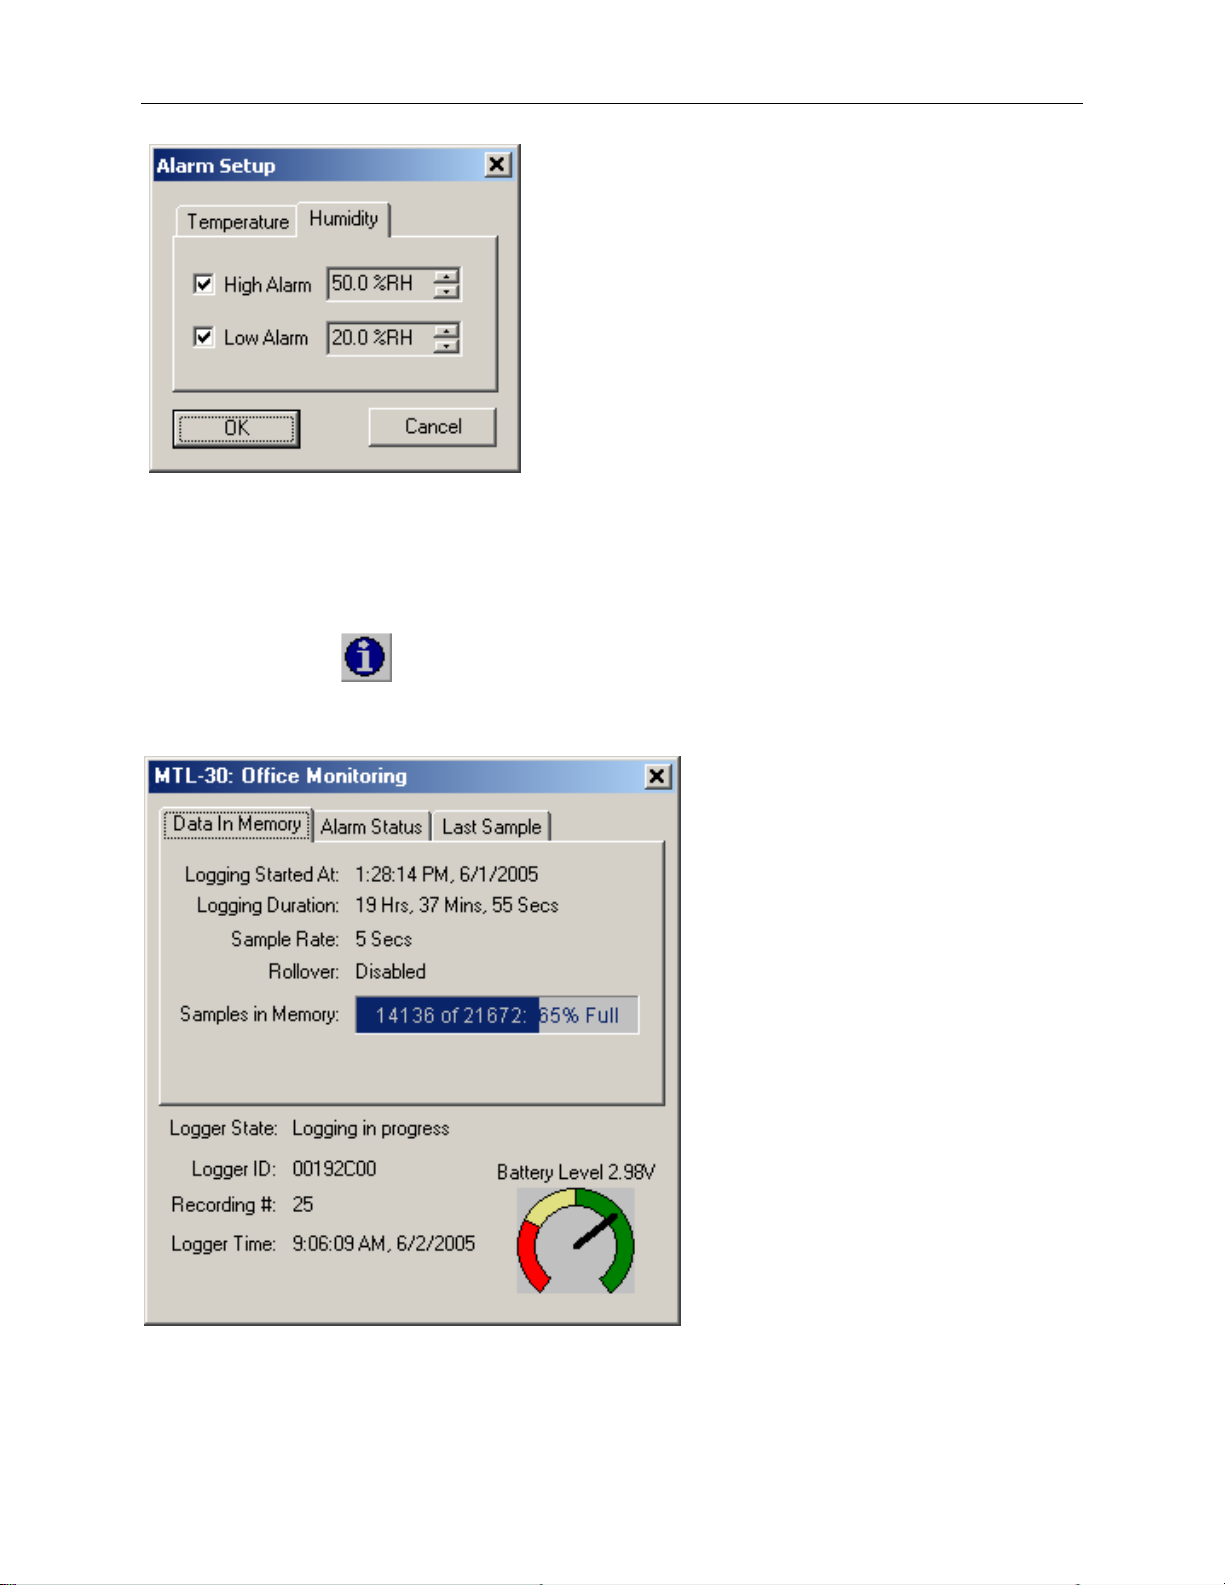
General Logger Status and Data In Memory Pane
Logger State shows the internal st ate of the logger:
o Power Save Mode: This mode is entered when the battery is replaced, or the user powered down the
logger. The logger battery is not used in this mode and can last for up to 10 years. The logger's real time
clock is not running in this mode.
Page 8
DwyerLog User’s Guide Version 1.4x 8/33
o Idle, waiting for se tup: The logger is not logging. It is waiting for a setup from the user. The l ogger's
real time clock is active in this mode.
o Logging will start on button press: Logging has been setup to start when the logger's Start button is
pressed.
o Logging will start at xxxx: Delayed logging. Logging has been selected to start at a future time. The
logger is waiting for this time to arrive to start logging.
o Logging in Progress: The logger is currently logging data.
o Logger ID: An ID that is unique for each logger. This ID can be used to ensure that the logged data has
not been tampered with. See the Data Security section for more details.
o Recording #: Indicates the number of times the logger has been setup to log. This counter can be used to
ensure that the logged data has not been tampered with. See the Data Security section for more details.
o Logger Time: Shows the date and time of the logger's real time clock.
o Battery Level: Shows the current level of the logger's battery. It is recommended that the battery is
replaced when this indicator reaches yellow. When this indicator reaches red, it is imperative that the
battery is replaced before logging becomes unpredictable.
• Logging Started At: Shows at what time the logging has started.
• Logging Duration: Shows how long the logging session ha s been active.
• Sample Rate shows how often the logger is recording the data.
• Data Rollover shows how many times the sample memory wrapped around after becoming full.
• Samples in Memory: Shows informatio n on how many samples are currently stored in the logger memory, and
how much space remains free. Note that if rollover occurs, this value will always be 100%.
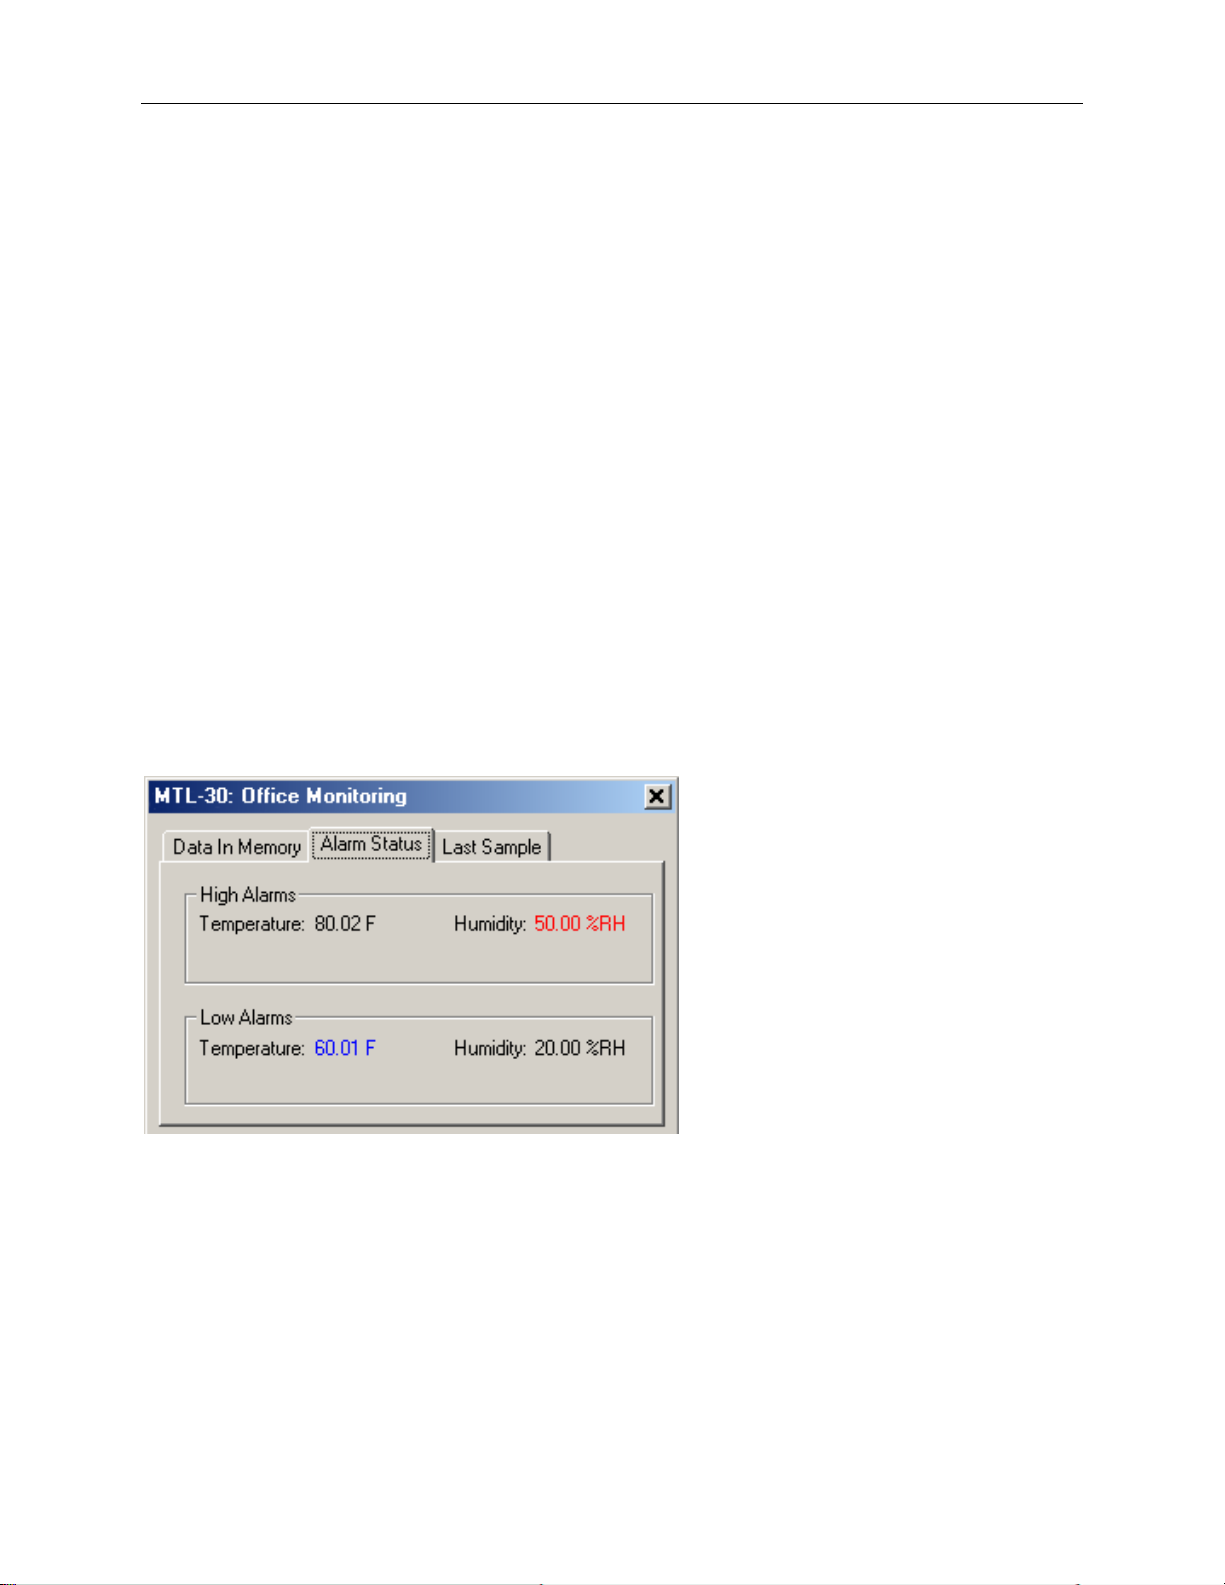
Alarm Status Pane
The Alarm Status pane displays the alarm thresholds for the active channels. If a high alarm occurred the threshold
is displayed in red. If a low alarm occurre d, the threshold is displayed in blue.
Page 9
DwyerLog User’s Guide Version 1.4x 9/33
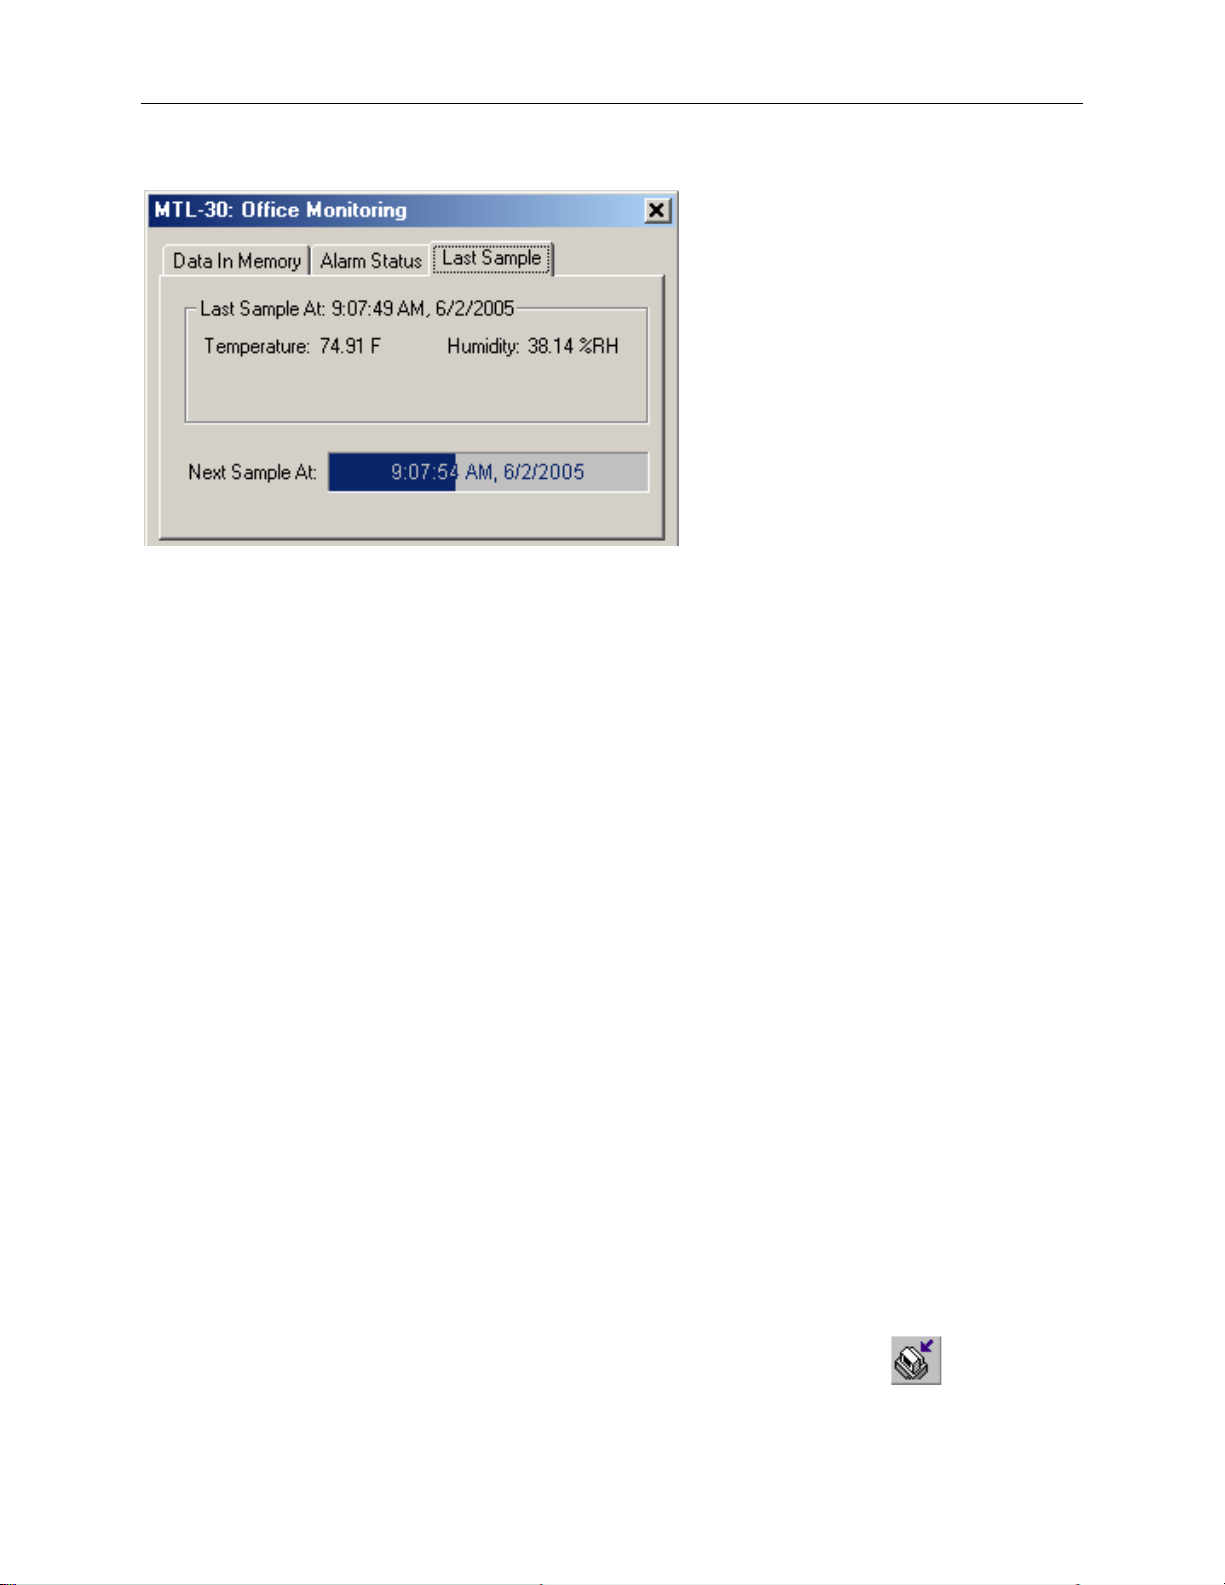
Last Sample Pane
The Last Sample pane shows the value of the last sample taken, for all the active channels. It also shows when the
next sample will be taken.
Ending the Logging Session
There are a number of ways that the logging session can end:
1. When the logger memory becomes full, and data rollover was not selected during logger setup, the logger
will automatically stop loggin g and e nter the idle state.
2. Selecting End Logging f rom the Logger menu.
3. Logging will stop automatically if the logger detects a low battery condition.
4. If the battery is removed from the logger, logging will stop. No data will be lost.
Once loggi ng has ended, it cannot b e resumed without erasing the logged samples stored in the l ogger memory.
Powering Down the Logger
Your logger uses very little power and has a long battery life. If you want to e xtend the battery life farther, you can
power down the logger when it is not logging. In the power down mode the logger uses practically no power, and
can be stored without loosing battery power, as long as the battery shelf life allows (10 years for Lithium batteries, 6
years for Alkaline). This state is us eful if the logger is go ing to be s t ored without being used for an extended perio d
of time.
• To put the logger into the power down mode, select Power Down from the Logger menu.
• To check if the logger is in power down mode, check the logger st atus usin g t he PC. Logger State will be indicated
as Power Save Mode.
• The logger automatically exits power save mode when it is set up to log, or when the logger's real time clock is set.
Note: The power down mode can only be entered when the logger is idle (not logging). In the power down mode
the logger's real time clock is not running.
Loading Logger Data
To get the sampled data from your logger, connect the logger to your computer and click the button on the
toolbar, or select Get Data from the Logger menu. Once the data is transferred from the logger to your PC, the data
graph and data listing windo ws will be displayed.
Page 10
DwyerLog User’s Guide Version 1.4x 10/33
Logged data can be retrieved from the logger at any time. You do not have to stop the logging session to retrieve
the data.
The graph display will be blank if there a r e le ss than two data points logged. The listing window will be blank if
there are no data points logged (as can happen during delayed logging, or when logging is set to start on button
press).
Automatic Data Retrieval
The DwyerLog Interface Software can be setup to automatically load the data from the logger into the computer as
samples become available. In this mode the graph and the listing windows are updated automatically with the new
data.
To enable this feature follow these steps:
• Make sure that your logger is connected to your computer.
• Make sure that the logger is logging dat a. Automati c retrieval is not available when the logger is not loggi ng.
• Manually download the data for the first time by clicking the
the Logger menu.
• From the Logger menu select Auto Update.
The computer will download data as often as the sampling interval you s etup. For instance, if you set your logger to
collect data once every minute, the software will perform a download once a minute. Of course the logger has to be
connected to your computer while the Auto Update mode is active.
When the Auto Update mode is active, the software does not change the zoom level of your graph. Instead it scrolls
the graph as new data becomes available.
button on the toolbar, or select Get Data from
Page 11

DwyerLog User’s Guide Version 1.4x 11/33
Working With the Data Graph
Clicking a nywhere within the graph windo w act ivates the graph toolbar butto ns and the graph window features.
• The graph plots each data channel using a different color and dot style. A small rectangular legend shows the color
and the dot style of each channel. This legend c an be moved by clicking t he left mouse button whi le inside t he
legend and dragging the legend to where you want it to be. The legend can be turned ON and OFF by pressing the
button on the toolbar.
• There is an addi t ional legend above eac h of the Y axis. This legend is the channel name drawn in the same color as
the channel line on the graph. T his legend helps identify which channel belongs to which a xi s . For instance, in the
graph above, the Temperature in red and Dew Point in green correspond to the left Y axis, the Relative Humidity in
blue corresponds to the right Y axis.
Page 12

DwyerLog User’s Guide Version 1.4x 12/33
• The Cursor Location Markers show the cursor position on the graph. The position is shown on ea ch of the axis in a
slightly larger, bold text. The position indicators can be turned ON and OFF by pressing the
toolbar
• Clic king the
the graph, marks this point, and shows the point values for all channels, at the specified time. An example of
sample markers is shown above.
• During zoom mode, you can use the vertical and horizontal scroll bars to move the graph a round.
• Clic king the
and drag the mouse, while holding down the button, to the opposite corner. Releasing the button will activate the
zoom. Clicking the right mouse b utton unzooms the graph one level. When the graph is zoomed, you can us e the
vertical and horizontal scroll bars to move the graph around. See Using the Zoom Feature section for more details.
• The
• The button connects the sample p oints with a line.
• The
• The
the minimum and maximum scale will be about equivalent to the minimum and the maximum of the data.
button turns ON and OFF the marks at the data points.
button turns the grid l i nes ON and OFF.
button on the toolbar causes the graph to unzoom to the full scale of the recorded data. This means that
button activates the sample marker function. When this function is active, cl i cking a point on
button activates the zoom mode. To zoom to an area, click the left mouse button at one corner
button on the
Using the Zoom Feature
There are a number of ways to zoom to the data you would like to see on the screen.
• Graphic Zoom: You can graphically zoom on the portion of the data that is displayed on the screen by pressing
the left mous e button and dragging the box around the part of the graph you would like to zoom to . You can repeat
this until t he graph is zoomed to just a few points . Pressing the right mouse button reverses the graphic zoom
(causes unzoom).
• Unzoom: Pressing the left mouse button, then releasing it witho ut dragging the mouse c auses the graph to unzoom
(zoom out). Once again pressing the right mouse button reverses this zoom.
• The
minimum and maximum scale will be about equivalent to the minimum and the maximum of the data.
• Autoscaling a specific axis: You can also autoscale the time or one of the data axes only, without affecting the
other axes. To autoscale the time axis only, choose Time -> Auto Sca le from the Zoom menu. To autoscale one
of the data axis only, choose Auto Scale for the appropriate channel from the Zoom menu.
• Numerical Zoom: Another way to specify the zoom is to enter the mi nimum and maximum limi ts of the graph
numerically. You can do this individually for the time axis and for each of the data axis. To do this, select Custom
for the appropriate axis from the Zoom menu, and enter the minimum and maximum limi ts for the axis.
button on the toolbar causes the graph to unzoom to the full scale of the data. This means that the
Page 13

DwyerLog User’s Guide Version 1.4x 13/33
Data Listing Window
The data listing window is shown be low.
The Data pane lists the data samples collected by the logger. If the data rollover check box in the setup window was
cleared, the earliest data samples are listed. If the data rollover check box was checked, the latest data samples are
listed.
The column width of each column is adjustable by using the left mouse button and dragging the column to the
desired width.
icon next to a data sample indicates an alarm condition. That is, one or more of the data channels are outside
The
the minimu m or maximum (alarm low and alar m hi gh) thres holds.
Data Summary and Statistics
The Data Summary pane displays the summary and statistics for the currently loaded dataset. The statistics
Page 14

DwyerLog User’s Guide Version 1.4x 14/33
displayed are: Minimum value, maximum value, average value (mean) and standard deviation.
For temperature channels Mean Kinetic Temperature (MKT) is displayed as well. MKT is used in pharmaceutical
and food industries as a simplified way of expressing the overall effects of temperature fluctuation during storage
and transit of perishable goods. The software uses the activation energy value H = 83.144 KJ/mol for MKT
calculation.
The data statistics are also included when data is exported to a text or Excel file.
A typical Data Summary window is shown below.
Using the Data Filter
The data filter helps to display only relevant information in the data listi ng window. It can also decrease the number
of printed pages when the data listing is printed. The data filter allows you to:
• Hide sample points when the data did not change sufficiently.
• Show only data points that were sampled in a specified time period.
Page 15

DwyerLog User’s Guide Version 1.4x 15/33
To apply the data filter, select the Data Filter… option from the View menu. The filter selection dialog box is
shown below.
• The filter can be disabled by checking the “No Data Filter” box.
• Sample range filtering can be disabled by checking the “Don’t limit using xxx x” box for all the channels or for
specific channels. Channels are selected by clicking on the channel pane.
• Date range filtering can be disabled by checking the “Don’t Limit By Date” box.
• The filter settings apply consecutively. It is therefore very easy to find settings that will display no samples at all.
The DwyerLog program will give you a warning if you selected a filter that results in no samples being displayed.
Hiding or Viewing Channels
The DwyerLog software has the ability to hide channels you do not wish to view. This feature is accessed by
selecting Channels > from the View menu, and then deselecting or selecting the specific channels you wish to hide
or view. The hidden channels do not a ppear in either the plot or the data listing. They also are not exported through
the export to text a nd export to Excel features.
Exporting Logger Data
The DwyerLog software allows exporting sample data and data statistics to a text file or to a Microsoft Excel file.
• To export sample data to a text file, select Export -> Text F ile fro m the File menu.
• To export sample data to a Microsoft Excel file, select Export -> Excel File from the File menu.
Page 16

DwyerLog User’s Guide Version 1.4x 16/33
The file exported to Microso ft Excel is an Excel .csv file. The easiest wa y to op e n th is file in Excel is to just double
click on the created file. The file can also be opened from within Microsoft Excel:
1. From the Microsoft Excel application choose Open… from the File menu.
2. In the Open window, under Files of type:, select Text Files (*.prn, *.txt, *.csv).
3. Navigate to the directory where you saved the exported file. The file name should be listed in the window.
4. Select the file and click Open.
When you first open the .csv file in Excel, the Da te Time column will be in a strange format. To convert to a normal
time and date format follow these steps:
1. Select the entire Date Time column by clicking on the column header (E).
2. While the cursor is in the column, click the right mouse button and select Format Cells.
3. Under Category: select Date or Time, then choose the format that suits you in the Type: column.
4. Click OK when done.
Printing the Logger Data
The DwyerLog software can print the data graph and data samples list. To print these, select Print fr om the File
menu. You can also view how your data will be printed using the Print Preview option from the File menu.
Graphs and data samples are printed as they appear on the screen. For graphs, this includes the current zoom detail,
marking of sample points, etc (see Working with the Data Graph for more detail).
For sample listing printout, any da ta filters applied to the data will be app lie d to the printed output as well. Data
filters are especially useful for reducing the amount of pages that the data sample printout generates.
Calibrating the Logge r
Your logger is factory calibrated to an accuracy given in the logger specifications. However, there may be times
when you wish to adjust the calib ration of your logger. NIST tr a c e able c a libration certificate is available at the
factory for an additional cost.
The DwyerLog software also provides you with the ability to perform a single point offset calibration. This
calibration can be used to increase the accuracy of your logger for a restricted data range. For instance, if your
application calls for logging temperature between 20°F and 32°F, you may want to calibrate your logger at 26°F.
Warning: Calibrating the logger erases the data that is stored in logger memory.
Calibration only can be performed when the logger is idle (not logging). To calibrate your logger, select
Calibrate… from the Logger menu. For extra security, calibration is password protected. You must enter the
correct password in the Calibration Password window before you’re allowed to calibrate the unit. The Password
Calibration window also allows you to change the password.
Once the password is entered correctly, a window asking you to select the channel to calibrate pops up. Select the
channel you would like to calibrate and click OK. Each channel must be calibrated separately.
The User Calib ration window for the channel you selected will appear:
Page 17

DwyerLog User’s Guide Version 1.4x 17/33
To perform the calibr a tion:
1. Select a stable and accurate reference instrument. It is best to use a reference instrument that has at least 2
to 4 times the accuracy of the logger you are calibrating. For instance, if the accuracy of the logger
temperature channel is given as +/-1ºF, the accuracy of your reference instrument should be at least +/-
0.5ºF to +/-0.25ºF.
2. Make sure that both the logger and your reference instrument are reading the same stable source. For
temperature and humidity, it is be st to place the logger and the reference sensor in a stable chamber.
3. Adjust your s ource to t he value at which you would like to perform the calibration.
4. Wait for your reference instrument and the reading in the “Logger Reading” box to stabilize.
5. Enter the reading from your reference instrument in the “Reference Instrument” box, and hit the Calibrate!
button.
Setting the Calibration Password
To change the calibration password select Calibrate… from the Logger menu. When the Calibration Password
window is displayed, follow these steps:
• Enter the current calibration password in the “Ent er Calibrat i on Password” box. If you are setting the password
for the first time, do not enter anything in this box, since the logger is factory configured not to have a password as
a default.
• Enter the new password in the “New Password” box.
Page 18

DwyerLog User’s Guide Version 1.4x 18/33
• Enter the new password agai n in the “Repeat New Passwo rd” box.
• Click OK.
You can also remove password protection (restore factory default empty password) by checking “Remove
Password”.
If you forgot the calibration password and need to reset it, click the Forgot Password button. This will reset the
logger password to factory default (empty password). Resetting the password in this way will erase the data stored
in the logger and reset t he recording counter to 0.
Setting the Logger Real Time Clock
Each logger has an internal Real Time Clock. This clock is updated every second. During logging, the time stamps
of the data samples are set by the Real Time Clock.
When you first connect a new battery to the logger, or when the logger is in power down state, the real time clock is
not runnin g. When the real time clock is stopped, and you setup your logger to log, the DwyerLog softwa re
automatically matches the logger clock to your computer’s clock. You can also manually set the logger’s real time
clock, using the DwyerLog software
To set the logger’s Real Time Clock, select Set Clo ck… from the Logger menu . Make sure that “Use Windows
Clock” is unchecked, then enter the current date and time in the appropriate fields. If the “Use Windows Clock” is
checked, the logger's real time clock will be matched to your Windows clock.
Note: You cannot set the Real Time Clock while logging is in progress.
Data Security
The Dwyer loggers and t he DwyerLog software have a number of features to prevent tampering with, or falsifying
the logged data. The security features are as follows:
• Each logger comes with a factory set unique logger ID. The logger ID is always displayed in the Logger Status
window and t he Data Summary window. The logger ID cannot be changed by the user. The logger ID prevents
somebody from switching loggers once the data is collected.
• Once logging has started, parameters such as sample rate, logging start time, logging sample counter, etc. cannot be
changed without first clearing the recorded data. This prevents gathering many data samples at a fast sample rate
and then lowering the sample rate to give the appearance that the data was recorded over a longer period of time.
• Each logger has an internal recording session counter. This counter counts how many times the l ogger was setup to
record data. This counter cannot be reset. This counter can be used to guarantee that the logger data has not been
cleared during a given period of time. To do this, make a note of the recording counter after you setup the logger to
log. This counter should now remain the same. If at a later time, the recording counter has increased, you know
that somebody stopped the recording, and initiated a new logging session.
• The logger's internal real time clock cannot be changed during the logging session.
• The calibr a tion data is password protected. T his pr e vents a third party from recalibrating the u nit to yield a false
data.
• Calibrating the logger erases the logged data from the logger memory. This prevents som ebody from ad justing t he
logged data after a recording was made.
Page 19

DwyerLog User’s Guide Version 1.4x 19/33
PC Interface
USB port. USB cable is included
Sampling Interval
User selectable from 1 second to 18 hours, in 1 second increments.
Data Security
Unique factory set logger ID. Recording session counter. Password protected calibration.
Operating System
Compatibility
Windows XP, Windows Vista and Windows 7. Compatible with both 32 bit and 64 bit
systems.
Mi n imum Sy s tem
Requirements
5MB of free disk space, 800 x 600 screen resolution, 1 free USB port.
Recording Start
On button press, immediate after setup, or at a user specified date and time.
Recording Mode
Stop on memory full, or continuous recording with memory rollover
Real Time Status
Visual indication through the status LED. Software real time status.
User Calibration
Password protected calibration for each channel.
User Information
Up to 30 characters
Logger Channels
User selectable. Disabling channels increases the storage capacity of the other channels.
Units
US and Metric
Data Format
Exportable to text or Excel files.
Status Light
Logger State
Flashed Green one time
Logging is no t in progress. Data in memory did not exceed the alarm
thresholds.
Flashed Red one time
Logging is not in progress. Data in memory exceeded one of the alarm
thresholds.
Flashed Green four times
Logging is in progress. Data in me mory did not exceed the alarm thresholds
Flashed Red four times
Logging is in progress. Data in memory exceeded one of the alarm thresholds
Flashed Green-Red three times
Delayed logging. Logging will start at the user specified time.
Specifications
Common logger specifications are shown below. For specific logger specification, see the logger documentation.
MTL-30 Temperature Humidity Logger
The MTL-30 i s a self-contained, precision instrument for record ing the te mpe rature and relative humidity of t he
surrounding environment. The MTL-30 can store up to 43,344 temperature samples, or up to 21,672 of both
temperature and relative humidity samples. In addition to Temperature and Humidity, the DwyerLog software
computes and displays the Dew Point Temperature.
The MTL-30 logger temperature and relative humidity sensors are open to the air. It is therefore important to ensure
that water does not get into the unit. This is especially important in high humidity situations (90% RH and above)
where water may condense inside the logger, causing damage to the internal electronics.
Warning: Care must be taken to ensure that the logger is not operating under condensing conditions. This
means that the dew point temperature must be below the ambient temperature. Condensation will damage the
humidity sensor and the logger ele c tronics.
MTL-30 Logger Status LED
Pressing the Start/Che ck button makes the LED flash a series of flashes to indicate the logger status. The table
below shows the different logger sta te s that the status light can sho w.
Page 20

DwyerLog User’s Guide Version 1.4x 20/33
Logging Interval
Battery Life
1 Second
4 Months
5 Seconds
17 Months
10 Seconds
2.5 Years
30 Seconds
4.5 Years
1 Minute
6 Years
2 Minutes
7 Years
Replacing the MTL-30 Battery
The battery level of the MTL-30 can be checked using the DwyerLog software, by opening the Logger Status
window. It is suggested that the battery is replaced when the battery level reaches yellow. When the battery level
reaches red, it is imperative that the battery is replaced as soon as possible. When the battery level is too lo w, the
logger will s top logging automatically, resulting in data not being recorded. The Dwyer Log software will give you a
warning if you try to start a logging session while the battery is low.
To replace the battery follow these steps:
1. Disconnect the logger from the USB cable. Do not replace the battery while the USB cable is connected!
2. Using a screwdriver, remove the screw in the back of the logger.
3. Remove the logger from the case.
4. Using a pen or a pencil, push the battery out of the casing, then use your fingers to slide the battery out
Avoid using pliers as they will short the battery.
5. Press and hold the logger button for about 2 seconds. This step removes any extraneous charge from the
logger system. T his step is very important. The logger may not operate correctly if this step is not
performed.
6. Slide the new CR2032 battery into the battery case. Make sure that the + indicator on the battery matches
the + indicator on the battery case.
7. When the battery is replaced correctly, the LED will flash a single green flash for about 1 second.
8. Place the logger back in the case and replace the screw.
General guidelines as to how long a battery will last is shown in the table below. It is assumed that the logger uses a
fresh CR2032 battery, and is setup for continuous logging with rollover enabled.
Page 21

DwyerLog User’s Guide Version 1.4x 21/33
Sample Point Capacity
43,344 points for temperature only. 21,672 points for temperature, humidity
and dew point.
Alarms
Visual over and under alarm indicator for temperature and humidity. Dew
point alarms are not available
Calibration
User single point offset calibr ation is available through software for both
temperature and humidity. Calibration is password protected.
Operating Temperature
-35°F to 160°F (-31°C to 70°C)*
Storage Temperature
-40°F to 170°F (-40°C to 77°C)
Time Accuracy
+/-100ppm @75°F
Relative Humidity Range
0% to 99%RH, non condensing.
Relative Humidity Accuracy
+/- 2%RH, from 10% to 90% RH
Relative Humidity Resolution
0.01%RH
Temperature Accuracy
+/-1°F (0.5°C)
Temperature Resolution
0.01°F or 0.01°C
Dimensions
3’’ x 1.6" x 0.6’’ (7.6cm x 4.0cm x 1.5cm)
Weight
1.0 oz (23g)
Power Source
3V CR2032 Lithium coin cell battery (Included)
Battery Life (average use)
6 Years
Status Light
Logger State
Flashed Green one time
Logging is no t in progress. Data in memory did not exceed the alarm
thresholds.
Flashed Red one time
Logging is not in progress. Data in memory exceeded one of the alarm
thresholds.
Flashed Green four times
Logging is in progress. Data i n memory did not exceed the alar m thr esholds
Flashed Red four times
Logging is in progress. Data in memory exceeded one of the alarm
thresholds
Flashed Green-Red three times
Delayed logging. Logging will start at the user specified time.
MTL-30 Specifications
* Lithium batteries do not perfo rm well in very low temperatures. If the log ger is going to be used in temperatures
below 32°F (0°C), make sure to start with a fresh battery, and check the battery level often.
MTL-20 Temperature Logger
The MTL-20 i s a self-contained, precision instrument for recording the temperature of the surrounding environment.
The MTL-20 can store up to 43,344 temperature samples.
MTL-20 Logger Status LED
Pressing the Start/Check button makes the LED flash a series of flashes to indicate the logger status. The table
below shows the different logger sta te s that the status light can sho w.
Replacing the MTL-20 Battery
The battery level of the MTL-20 can be checked using the DwyerLog software, by opening the Logger Status
window. It is suggested that the battery is replaced when the battery level reaches yellow. When the battery level
reaches red, it is imperative that the battery is replaced as soon as possible. When the battery level is too low, the
logger will s top logging automatically, resulting in data not being recorded. The Dwyer Log software will give you a
Page 22

DwyerLog User’s Guide Version 1.4x 22/33
Logging Interval
Battery Life
1 Second
4 Months
5 Seconds
17 Months
10 Seconds
2.5 Years
30 Seconds
4.5 Years
1 Minute
6 Years
2 Minutes
7 Years
Sample Point Capacity
43,344 temperature points.
Alarms
Visual over and under alarm indicator for temperature.
Calibration
User single point offset calibra tion is available through software. Calibration is
password protected.
Operating Temperature
-40°F to 185°F (-40°C to 85°C)*
Storage Temperature
-40°F to 185°F (-40°C to 85°C)
Time Accuracy
+/-100ppm @75°F
Temperature Accuracy
+/-0.9°F (0.5°C) for the range of 0°F to 120°F (-17°C to 50°C)
Temperature Resolution
0.01°F or 0.01°C
Dimensions
3’’ x 1.6" x 0.6’’ (7.6cm x 4.0cm x 1.5cm)
Weight
1.0 oz (23g)
Power Source
3V CR2032 Lithium coin cell battery (Included)
Battery Life (average use)
6 Years
warning if you try to start a logging session while the battery is low.
To replace the battery follow these steps:
1. Disconnect the logger from the USB cable. Do not replace the battery while the USB cable is connected!
2. Using a screwdriver, remove the screw in the back of the logger.
3. Remove the logger from the case.
4. Using a pen or a pencil, push the battery out of the casing, then use your fingers to slide the battery out
Avoid using pliers as they will short the battery.
5. Press and hold the logger button for about 2 seconds. This step removes any extraneous charge from the
logger system. This step is very important. The logger may not operate correctly if this step is not
performed.
6. Slide the new CR2032 battery into the battery case. Make sure that the + indicator on the battery matches
the + indicator on the battery case.
7. When the battery is replaced correctly, the LED will flash a single green flash for about 1 second.
8. Place the logger back in the case and replace the screw.
General guidelines as to how long a battery will last is shown in the table below. It is assumed that the logger uses a
fresh CR2032 battery, and is setup for continuous logging with rollover enabled.
MTL-20 Specifications
* Lithium batteries do not perform well in very low temperatures. If the logger is going to be used in temperatures
below 32°F (0°C), make sure to start with a fresh battery, and check the battery level often.
GDL Temperature Humidity Logger with Display
The GDL is a self-contained, precision instrument for recording the temperature and relative humidity of the
Page 23

DwyerLog User’s Guide Version 1.4x 23/33
surrounding environment. The GDL can store up to 43,344 temperature samples, or up to 21,672 of both
temperature and relative humidity samples. In addition to Temperature a nd Humidity, the unit computes and
displays the Dew Point Tempera ture .
The GDL features a display that allows the user to see the current temperature, humidity and dew point
simultaneo usly. In ad dition the unit shows, gr aphically, the temper ature and relative humidity data that has been
logged during the current logging session. A summary screen shows informati on about the current logging session,
such as the logging rate, the number of samples recorded, the length of the current recording and the amount of time
left for recording.
The GDL temperature and relative humidity sensors are open to the air. It is therefore important to ensure that water
does not get into the unit. This is especially important in high humidity situations (90% RH and above) where water
may condense inside the logger, causing damage to the internal electronics.
Warning: Care must be taken to ensure that the logger is not operating under condensing conditions. This
means that the dew point temperature must be below the ambient temperature. Condensation will damage the
humidity sensor and the logger ele c tronics.
Turning the GDL On and Off
To conserve battery life, the GDL will turn itself Off after about 1hour of operation, if the unit is not logging and no
buttons are pushed. The display will go blank and the unit will enter a Power Save mode. In this mode the logger
uses practically no power, and the battery will last as long as its shelf life (typically 6 years for an alkaline battery).
In the Power Save mode you can still use all the features of the DwyerLog software to communicate with the logger,
even set the logger for a new logging session. The logger will automatically exit the Power Down mode when it is
set to log.
Another wa y to turn the logger Off is to power down the logger using the DwyerLog software.
To turn the logger On at a ny time, just press any of the logger's buttons. The displ ay will come back on and the
logger will operate normally
GDL Sample Screen
There are three different screens that the user can switch between, using the View button. The Sample and
Summary screen show the current status of the logger. The Graph screen shows a record of the logged temperature
and humidity samples in memory.
The Sample screen is shown below.
This screen shown the current Relative Humidity, Temperature and Dew Point measurements. The measurements
are updated every two seconds, independent of the device sample rate.
Note: If the user selects only the temperature channel to be logged, the logger will display only the temperature
during logging. Relative Humidity and Dew point will not be displayed. When logging is finished (either the
memory becomes full, or on user command), the logger will once again display all three measurements
Page 24

DwyerLog User’s Guide Version 1.4x 24/33
(temperature, humidity and dew point).
The icons provide a summary of the current state of the logger.
• MEM: The Memory bar gra ph shows the amount of memory used and left in the logger. When logging
starts, the bar graph is empty. It fills up as samples are stored into memory. The percentage display shows
how much me mory is used, as well.
• Rollover Enabled Icon: This icon shows that rollover has been enab led and tha t once the memory
becomes full, the logger will overwrite the oldest data stored in memor y. Note that this icon shown that
rollover has been enabled. It does not indicate if rollover has occurred.
• Logger State Icon: This icon sho ws the current state of the logger:
• IDLE: T he logger is not logging. The sample display is still being updated, but no d a ta is sto red in
logger memor y.
• LOGGING: The logger is recording data at a user specified logging rate.
• PRESS STA RT TO LOG: The logger i s not recording data, but has been s etup to start logging when
the Start button is pressed. Press and hold the Start button for about 3 seconds to start logging.
• DELAYED LOGGING: The logger is not recording data, but has been setup to start logging at a
specific date and time. To see when logg ing will start, press the View button twice to bring up the
countdown to the start of logging.
• Battery Level Icon: This icon shows the state of the logger batteries. When this icon is down to one bar,
the logger battery should be replaced.
• Alarm Indicator: This icon shows that a channel has entered an alarm state during logging. This is a
"sticky" indicator since once the channel entered an alarm condit ion, the icon turns On, and stays On even
if the alarm condition goes away. See the Alarm Setup section in the Software User's Guide for more
information on setting and using al arms.
The GDL Summary Screen
The Summary screen is shown below.
The icons in the summary screen are identical to the icons in the Sample screen. The Summary screen shows:
• The User Information: This 30 character text field is entered through the DwyerLog setup software, and
can be any text that describes the logger
• Logging Rate: Is the rate at which the data in memory was logged at.
• Samples: Shows the number of samples stored in memory. If a rollover has occurred this number will
show the maximum number of samples that can be stored in the logger, and will not change, even though
the logger may be logging.
• Mem Used: Shows the lengt h (in days, hours, minutes or seconds) of data currently st ored in memory. If a
rollover has occurred, this number wi ll show the maximum length of data that can be stored in memory, for
a given sample rate. If a rollover has occurred, this number will not change even though the logger may be
Page 25

DwyerLog User’s Guide Version 1.4x 25/33
logging.
• Mem Left: Sho ws the length (in days, hours, minutes or seconds) of data the logger can record without
overwriting currently recorded data (record without a rollover). If a rollover has occurred, this number will
show 0 Sec, even though the logger may still be logging.
GDL Graph Screen
The GDL is capable of displaying the logged data graphically to show temperature and relative hu midity trends.
The GDL Graph screen is shown below.
This screen shows the gr aph of the samples stored in logge r memory. The tempera t ure graph is shown with a s olid
line. The temperature axis is on the left . The humidi ty graph is shown with a dotted line. The humi dity axis is on
the right. The graph ti me stamps are shown on the left and on the right, above the a xis.
For instance, in the graph above, data collected between August 1st, 2006, 1:45 PM and August 2nd, 11:30 AM is
shown. The graph temperature range is between 75°F and 83°F. The relative humidity range is between 30%RH
and 54%RH.
When in the graph screen, you can use the Display - and Display + b uttons to shift the graph left and ri ght,
respectively. Pressing and holdi ng the Start but t on, while in the graph screen, returns the graph view to the last
sample take n.
When the logger is logging, the gr aph display is automatically upda ted as new samples are logged.
GDL Buttons
The GDL has five buttons as shown below.
• Units: Use this button to change the displayed units between °F and °C.
• View: Use this button to change the displayed screen.
• Start: If the logger has been setup to start on button press, press and hold the Start button to begin
logging. In the Graph sc reen, pr essing and holding this button returns the vie w to the last s ample logged.
• Display +: Use this button to increase the screen contrast when in Sample and Summary screens. When in
the Graph screen this button shifts the graph to the right.
• Display -: Use this button to decrease the screen contrast when in Sample and Summary screens. When in
the Graph screen this button shifts the graph to the left.
Page 26

DwyerLog User’s Guide Version 1.4x 26/33
Replacing the GDL Battery
The GDL uses three AA type alkaline or lithium batteries. Using rechargeable Ni-MH batteries is not
recommended. The battery level of the GDL is shown on the screen, or can be checked using the DwyerLog
software, by opening t he Logger Status window. It is suggested that the battery is replaced when the battery level
reaches 1 bar on the display, or in the yellow zone in the DwyerLog software. When the battery indicator is empty,
or reaches red in the DwyerLog software, it is imperative that the battery is replaced as soon as possible. When the
battery level is too low, the logger wil l sto p logging automatically, resulting in data not being recorded . The
DwyerLog software will give you a warning if you try to start a logging s ession wh ile the battery is low.
To conserve battery power, the GDL will shutdown automa tically, when not log ging, after about one hour of
operation. To turn the l ogger back On, just pre s s any button. The logger can run while logging continuously for one
year on a single set of three AA alkaline batteries.
To replace the batteries follow these steps:
1. Disconnect the logger from the USB cable. Do not replace the battery while the USB cable is connected!
2. Using a screwdriver, remove the 4 screws in the back of the logger.
3. Carefully remove the back case. Be very careful not to pull on the battery wires.
4. Remove the three used AA batteries.
5. Press and hold any logger button for about 2 seconds. This step removes any extraneous charge from the
logger system. This step is very important. The logger may not operate correctly if this step is not
performed.
6. Insert three new AA batteries into the battery holder. Make sure that the + indicator on the battery matches
the + indicator on the battery case.
7. When the batteries is replaced correctly, the logger should start up automatically and show the Sample
screen.
8. Replace the GDL back cover and replace the 4 screws.
Page 27

DwyerLog User’s Guide Version 1.4x 27/33
Text Display
Displays real time temperature, hu midity and dew point. Displays logging
summary, sample rate, memory used and memory left.
Graph Display
Shows measure ment trends graphically. Graph can be scrolled through the entire
logged data.
Sample Point Capacity
43,344 points for temperature only. 21,672 points for temperature, humidity and
dew point.
Alarms
Visual over and under alarm indicator for temperature and humidity. Dew point
alarms are not available
Calibration
User single point offset calibra tion is available through software for both
temperature and humidity. Calibration is password protected.
Operating Temperature
15°F to 150°F (-10°C to 65°C)
Storage Temperature
-5°F to 160°F (-20°C to 70°C)
Time Accuracy
+/-100ppm @75°F
Relative Humidity Range
0% to 99%RH, non condensing.
Relative Humidity
Accuracy
+/- 2%RH, from 10% to 90% RH
Relative Humidity
Resolution
0.01%RH
Temperature Accuracy
+/-1°F (0.5°C)
Temperature Resolution
0.01°F or 0.01°C
Dimensions
4’’ x 3.05" x 1.5’’ (10.2cm x 7.7cm x 3.8cm)
Weight
7.0 oz (200g)
Power Source
Three AA batteries (Included)
Battery Life
1 year continuous use, 2 years average use. The logger automatically turns itself
Off after 1 hour, when not logging. Turn On by pressing any button.
GDL Specifications
GDL-T Four Temperature Logger with Display
The DataView GDL-T is a self-contained, precision instrument for recording up to four temperatures. The GDL-T
has one internal temperature sensor and 3 external sensors. The external sensors are temperature rated between 40°F to 160°F (-40°C to 70°C). The internal sensor can operate from 15°F to 150°F (-10°C to 65°C). The GDL-T
can store up to 21,760 points when 4 channels are logging, 29,010 points when 3 channels are logging, 4 3,520
points when 2 channels are loggin g and 87,040 points whe n a single channel is logging.
The GDL-T features a display that allows the user to see the current temperature for all channels simultaneously, as
well as the temperature difference between channels. In addition the unit graphs two of the channels that have been
logged during the current logging session. The two channels shown on the graph are user selectable. A summary
screen shows information about t he current logging session, suc h as the logging rate, the number of samples
recorded , the length of the current recording and the amount of time left for recording.
Turning the GDL-T On and Off
To conserve battery life, the GDL-T will turn itself Off after about 1hour of ope r a tion, if the unit is not logging and
no buttons are pushed. The display will go blank and the unit will enter a Power Save mode. In this mode the
logger uses practically no power, and the battery will last as long as its shelf life (typically 6 years for an alkaline
battery).
In the Power Save mode you can still use all the features of the DwyerLog software to communicate with the logger,
even set the logger for a new logging session. The logger will automatically exit the Power Save mode when it is set
to log.
Another wa y to turn the logger Off is to power down the logger using the DwyerLog software.
Page 28

DwyerLog User’s Guide Version 1.4x 28/33
To turn the logger On at a ny time, just press any of the loggers' buttons. The display will come back on and the
logger will operate normally
GDL-T Sample Screen
There are a number of different screens that the user can switch bet we en, using the View button. The Sample and
Summary screens show the current status of the logger. The Graph screen shows a record of the logged temperature
samples in memory.
A typical four channel s ample scre en is shown below.
This screen shown the current temperature measureme nts. These measurements are updated every two seconds,
independent of the device sample rate.
Note: During logging only the channels that are selected to log will be displayed. For instance, if the user selected
Internal Temperature and Temp 3 for logging, using the logger setup screen, only Temp Int and Temp 3 will be
display during logging. Once logging has finished, all four channels will be displayed again.
The icons provide a summary of the current state of the logger .
• MEM: The Memory bar gra ph shows the amount of memory use d and left in the logger. When logging
starts, the bar graph is empty. It fills up as sa mp le s ar e stored in memory. The percentage display shows
how much me mory is used, as well.
• Rollover Enabled Icon: This icon shows that rollover has been enabled and that once the memory
becomes full, the logger will overwrite the oldest data stored in memor y. Note that this icon sho wn that
rollover has been enabled. It does not indicate if rollover has occurred.
• Logger State Icon: This icon sho ws the current state of the logger:
• IDLE: The logger is not loggi ng. The sample displa y is stil l being updated, but no data is stored
in logger memory.
• LOGGING: The lo gger is recording data at a user specified logging rate.
• PRESS STA RT TO LOG: The logger i s not recording data, but has been setup to start logging
when the Start button is pressed. Press and hold the Start button for about 3 seconds to start
logging.
• DELAYED LOGGING: The logger is not recording data , but has been setup to start logging at a
specific date and time. To see when logging will start, press the View button until the logging
countdown is displayed on the screen..
• Battery Level Icon: This icon shows the state of t he logger b attery. When this icon is down to one bar,
the logger battery should be replaced.
• Alarm Indicator: This icon shows that a channel has entered an alarm state during logging. This is a
"sticky" indicator since once the channel entered an alarm condition, the ic on turns O n, and stays On even
Page 29

DwyerLog User’s Guide Version 1.4x 29/33
if the alarm condition goes awa y. See the Alarm Setup section in the Software User's Guide for more
information on setting and using al arms.
GDL-T Difference Screen
When four channels are s elected t o log, or when the GDL-T is idle, the unit will display an additional temperature
difference screen. The temperature difference is always displayed between the Internal Channel (Temp Int) and
Channel 1 (Temp 1), and between Channel 2 (Temp 2) and Channel 3 (Temp 3).
When less than four channels are selected to log, the temperature difference will be displayed on the sample screen.
GDL-T Summary Screen
The Summary screen is shown below.
The icons in the summary screen are identical to the icons in the Sample screen. The Summary screen shows:
• The User Information: This 30 character text field is entered through the DwyerLog setup software, and
can be any text that describes the logger
• Logging Rate: Is the rate at which the data in memory was logged at.
• Samples: Shows the number of samples stored in memory. If a rollover has occurred this number will
show the maximum number of samples that can b e stored in the logger, a nd will not c hange, even though
the logger may be logging.
• Mem Used: Shows the lengt h (in days, hours, minutes or seconds) of data currently stored in me mory. If a
rollover has occurred, this number will sho w the maximum length of data that can be stored in memory, for
a given sample rate. If a rollover has occurred, this number will not change even though the logger ma y be
logging.
• Mem Left: Shows the length (in days, hours, minutes or seconds) of data the logger can record without
overwriting currently recorded data (record without a rollover). If a rollover has occurred, this number will
show 0 Sec, even though the logger may still be logging.
Page 30

DwyerLog User’s Guide Version 1.4x 30/33
GDL-T Graph Screen
The GDL-T is capable of displaying the logged data graphically to show temperature trends. Two channels can be
displayed at one time. The user can select the graphed channels in the Select Graph Channels screen:
Use the Display + button to select the channels to graph.
Note that only the logged channels (channels recorded in logger memory) can be graphed.
The GDL-T Graph screen is shown below.
This screen shows the gr aph of the s amples stored in logger memory. The solid line corresponds to the left axis.
The dotted line corresponds to the r igh t a xis. The grap h time stamps are shown on the left and on the right, above
the axis.
For instance, in the graph above, data collected between August 1st, 2009, 1:45 PM and August 2nd, 11:30 AM is
shown. The graph Internal Temperature T0 range is between 75° F and 83° F. The T1 range is between 30° F and
54° F.
When in the graph screen, you can use the Display - and Display + b uttons to shift the graph left and ri ght,
respectively. Pressing and holding the Start butto n, while in the graph screen, retur ns the graph view to the last
sample take n.
When the logger is logging, the gr aph display is automatically upda ted as new samples are logged.
GDL-T Buttons
The GDL-T has five buttons as shown below.
• Units: Use this button to change the displayed units between ° F and ° C.
• View: Use this bu tton to change the displayed scree n.
• Start: If the logger has been setup to start on button press, press and hold the Start button t o begin
logging. In the Graph s creen, pressing and holding this button ret urns the view to the last sample log ged.
Page 31

DwyerLog User’s Guide Version 1.4x 31/33
used and memory left.
logged data. 2 Channels at a time can be graphed (user selectable).
Capacity
for 2 temperatures, 87,040 points for single temperature.
Alarms
Visual over and under alarm indicator for all 4 channels.
temperature channels. Calibration is password protected.
Operating Temperature
15°F to 150°F (-10°C to 65°C)
Storage Temperature
-5°F to 160°F (-20°C to 70°C)
Time Accuracy
+/-100ppm @75°F
Temperature Range
Temperature Accuracy
+/-1°F (0.5°C)
Temperature Resolution
0.1°F or 0.1°C
Dimensions
4’’ x 3.05" x 1.5’’ (10.2cm x 7.7cm x 3.8cm)
Weight
7.0 oz (200g)
Power Source
Three AA batteries (Included)
Off after 1 hour, when not logging. Turn On by pressing any button.
• Display +: Use this button to increase the screen contrast when in Sample and Summary screens. When in
the Graph screen this button shifts the graph to the right. When in Graph Select screen, this button selects
the channels to graph.
• Display -: Use this button to decrease the screen contrast when in Sample and Summary screens. When in
the Graph screen this button shifts the graph to the left.
Replacing the GDL-T Battery
For instructions on how to replace the GDL-T battery, please see the section Replacing the GDL Battery.
GDL-T Specifications
Text Display
Graph Display
Sample Storage
Calibration
External Probe
Displays real time temperature for all 4 channels. Displays temperature
difference between channels. Displays logging summa ry, sample rate, memory
Shows meas urement trends graphically. Graph can be scrolled through the entire
21,760 points for 4 temperatures, 29,013 points for 3 temperatures, 43,520 points
User single point offset calibration is available through software for all
-40°F to 160°F (-40°C to 70°C)
Battery Life
1 year continuous use, 2 years average use. The logger automatically turns itself
MTL-LCD Loggers with Display
The MTL-LCD T emperature and Temperature/Humidity loggers are self-contained, precision instruments for
recording the temperature and r elative humidity of the surrounding environment. The M TL-20-LCD records
temperature only and can store up to 43,344 temperature samples. The MTL-30-LCD records both temperature and
humidity and can store up to 43,344 temperature samples, or up to 21,672 of both temperature and relative humidity
samples. In addition to Temperature and Humidity, the D wyerLog software computes and displays the Dew Point
Temperature for the MTL-30-LCD.
MTL-20-LCD and MTL-30-LCD loggers have a digita l display that shows the current temperature and humidit y
(for MTL-30-LCD) reading, current recording state and the alarm condition.
The MTL-30-LCD logger temperature and relative humidity sensors are open to the air. It is therefore i mporta nt to
Page 32

DwyerLog User’s Guide Version 1.4x 32/33
ensure that water does not get into the unit. This is especially important in high humidity situations (90% RH a nd
above) where water may condense inside the logger, causing damage to the internal electronics.
Warning: Care must be taken to ensure that the logger is not operating under condensing conditions. This
means that the dew point temperature must be below the ambient temperature. Condensation will damage the
humidity sensor and the logger ele c tronics.
MTL-LCD Display and Button
The MTL-LCD displa y s hows the current reading. MTL-20-LCD shows the temperature. MTL-30-LCD display
alternates between temperature and humidity. The display is updated every 2 seconds.
In addition to the current samp le the display shows a solid REC icon when logging is in progress. The REC icon
flashes when the logger is waiting to log either by a button press or delayed logging. The ALARM icon is
displayed when the recorded data in logger memory exceeded one of the alarm thresholds set by the user during
logger setup.
The Start/Units button is used to:
• Start recording by holding down the button, when the logger was setup to start logging on button press.
• Change the displayed temperature units (°F or °C) .
Replacing the MTL-LCD Battery
The battery level of the MTL-LCD loggers can be checked using the DwyerLog software, by opening the Logger
Status window. It is suggested that the battery is replaced when the battery level reaches yellow. When the battery
level reaches red, it is imperative that the battery is replaced as soon as possible. When the battery level is too low,
the logger will stop logging automatically, resulting in data not being recorded. The DwyerLog software will give
you a warning if you try to start a logging session while the b a tte r y is low.
To replace the battery follow these steps:
1. Disconnect the logger from the USB cable. Do not replace the battery while the USB cable is connected!
2. Using a screwdriver, remove the screw in the back of the logger.
3. Remove the logger from the case.
4. Using a pen or a pencil, push the battery out of the casing, then use your fingers to slide the battery out
Avoid using pliers as they will short the battery.
5. Press and hold the logger button for about 2 seconds. This step removes any extraneous charge from the
logger system. This step is very important. The logger may not operate correctly if this step is not
performed.
6. Slide the new CR2032 battery into the battery holder. Make sure that the + indicator on the battery
matches the + indicator on the battery holder.
7. When the battery is replaced correctly, you should see the sensor reading on the display.
8. Place the logger back in the case and replace the screw.
Page 33

DwyerLog User’s Guide Version 1.4x 33/33
Display
Displays real time temperature. D isplays logging status and alarm status.
Sample Point Capacity
43,344 Temperature samples..
Sample Rate
1 second to 18 hours.
Alarms
Visual over and under temperature alarm indicator.
Operating Temperature
-4°F to 140°F (-20°C to 60°C)
Storage Temperature
-4°F to 160°F (-20°C to 70°C)
Temperature Accuracy
+/-1°F (0.5°C)
Temperature Resolution
0.1°F or 0.1°C
Calibration
Password protected single point offset calibration is available through software.
Time Accuracy
+/-100ppm @75°F
Dimensions
3’’ x 1.6" x 0.6’’ (7.6cm x 4.0cm x 1.5cm)
Weight
1.0 oz (28g)
Power Source
3V CR2032 Lithium coin cell battery (Included)
Battery Life
3 Years. The logger automatically turns itself OFF after 1 hour, when not logging.
Turn On by pressing the button.
Display
Displays real time temperature a nd r e la tive humidity. Displays logging status and
alarm status.
Sample Point Capacity
43,344 points for temperature only. 21,672 points for temperature, humidity and
dew point.
Alarms
Visual over and under alarm indicator for temperature and humidity
Sample Rate
1 second to 18 hours.
Operating Temperature
-4°F to 140°F (-20°C to 60°C)
Storage Temperature
-4°F to 160°F (-20°C to 70°C)
Temperature Accuracy
+/-1°F (0.5°C)
Temperature Resolution
0.1°F or 0.1°C
Relative Humidity Range
0% to 99%RH, non condensing.
Relative Humidity
Accuracy
+/- 2%RH, from 10% to 90% RH
Relative Humidity
Resolution
0.1 %RH
Calibration
Password protected single point offset calibration is available through software for
temperature and relative humidity.
Time Accuracy
+/-100ppm @ 75°F
Dimensions
3’’ x 1.6" x 0.6’’ (7.6cm x 4.0cm x 1.5cm)
Weight
1.0 oz (28g)
Power Source
3V CR2032 Lithium coin cell battery (Included)
Battery Life
3 Years. The logger automatically turns itself OFF after 1 hour, whe n not logging.
Turn On by pressing the button.
MTL-20-LCD Specifications
MTL-30-LCD Specifications
 Loading...