

Page 1

Keypad (Fig.1)
3
56
4
21
A
A
B
B
C
C
B
C
Vent Check Pro (CO + CO2)
Operation
Press button 1 to turn the meter
on and off.
After a 30 second warm-up the
meter is ready to use and will
display the normal operating
screen (Fig. 2). To sk ip the warm
up, press and hold button 6 for 2
seconds. It is advisable, however,
to allow the unit to perform its full
setup.
During operation the display will
automatically cycle through the
current level of CO
2
and CO. Press
button 5 to see the current air
temperature.
Pressing button 6 will cycle
through minimum, maximum,
average and current readings. In
this mode the time at the bottom
will change to show you how long
youhavebeeninthismode.
Pressing any button will turn the backlight on for 10
seconds.
The unit will turn off automatically after 20 minutes of
inactivity.To override this function, turn the unit off then
restart it by holding down button 2 then turning it on
with button 1.
The meter will take a new reading every second. When
the operating conditions change, the unit will respond
in 30 seconds for CO
2
.
When battery supply is low, 'Lob' will be displayed.
Change the batteries or connect the DC adaptor.
NOTE: Do not hold the meter close to the face as
exhalation can affect CO
2
readings.
Normal Operation
(Fig.2)
A =Current
measurement
type (CO
2
,CO
or TA)
B = Current level
C = Current date /
time
Triple reading and display of CO2, CO and
temperature
NDIR sensor for CO
2
detection
Datalogging capability (downloadable via USB)
Statistics of weighted averages
BS8494 compliant (from 10 - 60 ºC)
Backlight for working in dark areas
Programmable and audible warning alarms
Easy manual fresh air correction on CO
2
PC connection via USB interface
With hard case and power adaptor
Can be used with rechargeable batteries
w: www.duomo.co.uk - e: [email protected] - t: 01905 797989 - f: 01905 774296 | © Duomo (UK) Ltd. 2007
A
cycle through the minimum, maximum and average
readings of each parameter automatically. To return to
normal mode,press button 3.
Pressing button 2 will hold all current readings and HOLD
flashes in the top left of the screen. Press again to exit hold
mode.
Recording (Manual)
The Vent Check Pro can manually record up to 99 points
of data.
In normal mode, press button 4 to record a data point.
The REC icon flashes on screen for about 3 seconds and
the screen displays the data point number (1 - 99). Each
point recorded contains information on the current CO
2
,
CO and air temperature.
You can view all manually recorded data points at any
time by using button 5. Press and hold it for 2 seconds
V
e
nt
Che
c
kPro
Page 2

or more until 'Recall' appears on screen.
Press buttons 2 and 4 to cycle up and down through all
recorded data points stored on the unit. The data point
number will appear on screen first, followed by the stored
reading. Pressing button 5 will then cycle through each
parameter. The time at which the data was recorded will
also appear at the bottom of the screen.
To exit the recall mode, press button 3.
Recording (Automatic)
As well as recording data manually,the Vent Check Pro also
allows you to datalog automatically.The unit can store up
to 30,000 data points (10,000 data points each for CO
2
,CO
and temperature). The sampling rate can be altered in the
advanced setup menu and can be set from 1 second to 4
hours, 59 minutes and 59 seconds.
To begin datalogging press button 3 for 2 seconds. The
REC icon will flash at the bottom of the screen. Pressing
button 3 again for 2 seconds will stop the datalogger.
NOTE: Each time you star t the datalogger you will
overwrite the previously recorded data.
During datalogging you can still cycle through all three
parameters.
Setup
To enter setup, make sure the unit is turned off then press
and hold button 1 for more than a second. To exit this at
any time,simply press button 3.
There are six setup options within this menu;
Use buttons 2 and 4 to cycle through each of the six
options and their parameters and then button 6 to
confirm a selection.
CLr
To delete all manually stored data points scroll to 'yes' and
confirm your selection. Press button 3 at any time to
escape back to the top menu.
ALAr
To set the audible alarm threshold for CO & CO
2
detection,
scroll through to the level required and confirm your
selection. Available levels range from 15 to 200ppm in
5ppm increments for CO and 400 to 2000ppm in 50ppm
increments for CO
2
.
unit
Select whether to display the temperature on screen
using degrees centigrade or fahrenheit.
rATE
Press button 6 to start setting the sampling rate. The
hours will flash first, use buttons 2 and 4 to set. Pressing
button 6 to move on to the minutes and repeat with the
seconds. The final push of button 6 will confirm your
selection and return to the main menu. The range is from
1 second to 4 hours,59 minutes and 59 seconds.
PrES
If operating at high altitudes the barometric pressure
value of this unit may need adjusting from the standard
of 1013hPa.(Range is 700 - 1990hPa).
rtC
The first option that appears is whether to use the 24
hour clock or not. Select 24 or 12, confirm your selection
then set the date (day, month, year) using buttons 2 and
4, followed by 6 to set it. The time can then be set (hours,
minutes,seconds) by the same method.
Fresh Air Correction & Calibration
CO2Fresh Air Correction
It is strongly suggested that the unit be corrected in a
sunny, outdoor environment that is well ventilated. Do
not correct the unit in places crowded with people or
close to areas with high CO
2
concentration such as
ventilating outlets or fireplaces.
To correct the unit for CO
2
make sure that it is turned off
and place it in the calibration site. Turn it on by pressing
and holding buttons 1, 3 and 4 for 3 seconds.The unit will
enter calibration mode. There are three different
calibration options available to perform. Select the CO
2
option and pres button 6 to start calibrating. After about
5 minutes the unit will stop flashing and calibration will
be completed.
To abort correction at any time,simply turn the meter off.
CAUTION: The meter is corrected at ambient air of
around 400ppm. Do not correct the meter in an
environment with an unknown CO
2
concentration. Doing
this could lead to inaccurate measurements.
CLr - Clears all manually stored data points
ALAr - Determines the CO & CO
2
alarm threshold
unit - Changes the display between
o
C andoF
rATE - Sets the sampling rate for the datalogger
PrES - Pressure compensation for CO
2
measurement
rtC - Sets the date and time for the unit
w: www.duomo.co.uk - e: [email protected] - t: 01905 797989 - f: 01905 774296 | © Duomo (UK) Ltd. 2007
CO2Levels & Guidelines
ASHRAE Standard 62-1989: 1000ppm
CO
2
concentration in occupied building should not
exceed 1000ppm.
Building Bulletin 101 (BB101): 1500ppm
UK standards for schools say that CO
2
averaged over the
whole day (i.e. 09:00 - 15:30) should not exceed
1500ppm.
Page 3

Troubleshooting
Specification
Can't power on
Press button 1 for more than 0.3 seconds and try
again. Check whether batteries are in good contact
and correct polarity is observed.
Fixed readings
Check whether data hold function was activated.
Slow response
Check whether the air flow channels on the rear are
blocked.
Error messages
E01: CO
2
sensor damaged
E02:The value is under range
E03:The value is over range
E04:The original data error results in this error
E07: Voltage to measure CO
2
. Replace batteries or
use an adaptor
E17: Retry CO
2
calibration
E31:Temperature sensor damaged
CO
2
Range of 0 - 9999ppm
Accuracy ± 30ppm ±5% of reading
Response time <30 seconds
CO
Range of 0 - 1000ppm
Accuracy: ± 10ppm at <100ppm
± 10% of reading for 101 - 500ppm
± 20% of reading for 501ppm and above
Response time <60 seconds
Temperature
Range of -20 - 60 ºC (-5 - 140 ºF)
Accuracy ± 0.6ºC (0.9 ºF)
Response time <2 minutes
Warm Up
30 seconds
Operating Ranges
From0~50ºC , 0 ~ 95% RH (avoid condensation)
Storage
From -20 ~ 60 ºC ,0 ~ 99% RH (avoid condensation)
Power
4 pcs AA batteries (rechargeable option),DC Adaptor
Battery Life
> 10 hours (Alkaline)
w: www.duomo.co.uk - e: [email protected] - t: 01905 797989 - f: 01905 774296 | © Duomo (UK) Ltd. 2007
OSHA: 5000ppm
Time weighted average over five 8-hour work days
should not exceed 5000ppm.
NIOSH recommendations:
250 - 350ppm
Normal outdoor ambient concentrations.
600ppm
Minimal air quality complaints.
1000ppm
Indicates adequate ventilation; complaints such as
headaches, fatigue and eye/throat irritation will be more
widespread. 1000ppm should be used as an upper limit
for indoor levels.
CO Levels & Guidelines
ppm Symptoms and applicable standard
0 - 1 Normal background levels
1600 Nausea within 20 min., death within2-3hrs
9
Maximum indoor air quality level:
Maximum allowable concentraion per
ASHRAE Residential standards 62-1989 for
living area
25
Maximum limit 8 hrs of continuous
exposure per California OSHA workplace
standards
35
Maximum 8 hrs average exposure level per
US OSHA workplace standards
50
Maximum concentration for continuous
exposure in any 8 hrs average level per
OSHA standards
100
Remove employees from enclosed space if
the CO concentration exceeds 100ppm per
OSHA exposure limit
200
Mild headache, fatigue, nausea and
dizziness within2-3hrs
800
Dizziness, nausea, convulsions, death within
2-3hrs
400
Frontal headache,life threatening after 3
hrs. Maximum concentration in flue gas per
the US EPA and AGA standards
Page 4
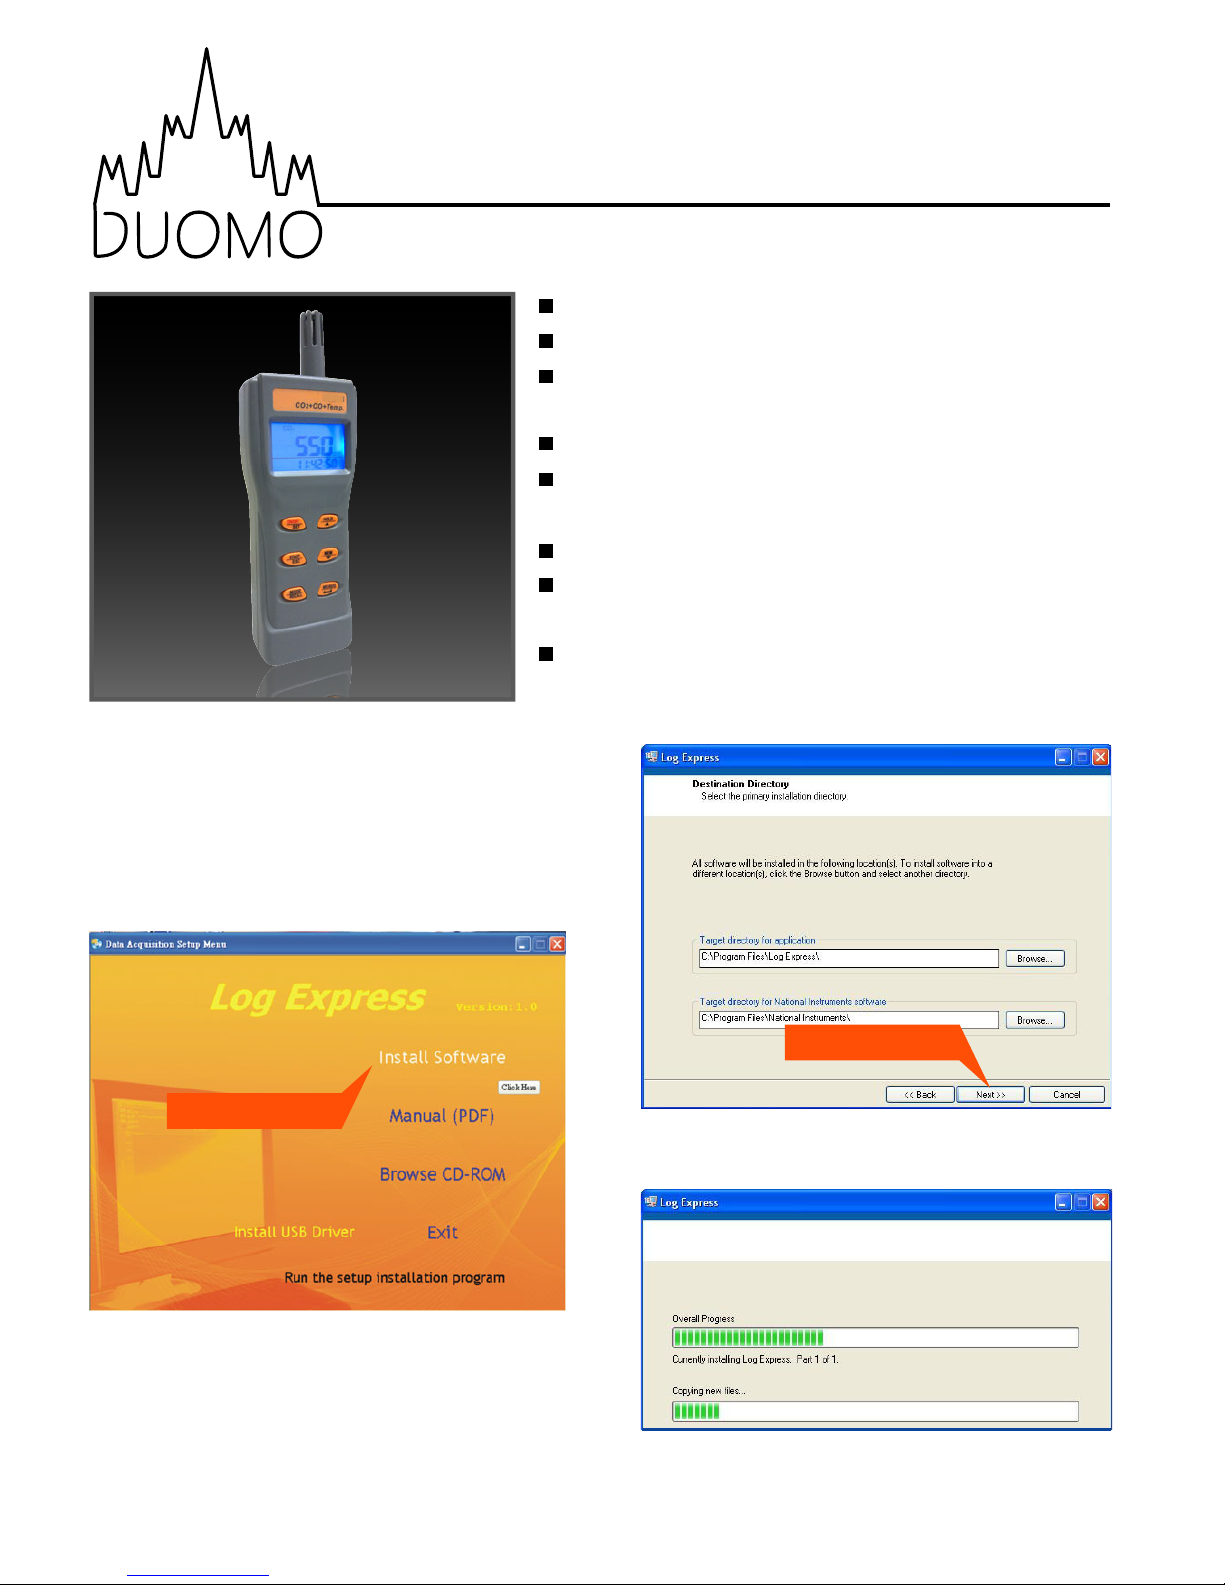
Installation Guide for Log Express
Installation
1. Insert the CD into your computer and wait for the
Log Express installation program to start. The
following screen will be displayed. Select the first
option 'Install Software' and follow the installation
instructions.
2. Check the default installation directories as
shown in the next image on the right hand side. If
you are happy with these, click 'Next'. If you wish to
change them, use 'Browse' to select an alternative.
3. Click 'Next' again on the next dialog box and the
installation will then begin (see below).
Datalogging software
RS232 to USB cable
Realtime graph display of CO
2
and
temperature
Printable statistics
Data can be saved to text file for further
analysis
Upto 30,000 sample readings
Programmable sample interval from 1
second to 5 hours
Quickly view the data at a certain date and
time with interactive graph
w: www.duomo.co.uk - e: [email protected] - t: 01905 797989 - f: 01905 774296 | © Duomo (UK) Ltd. 2007
2 & 3. NEXT
V
ent
Ch
e
c
k
P
ro
1. CLICK
Page 5
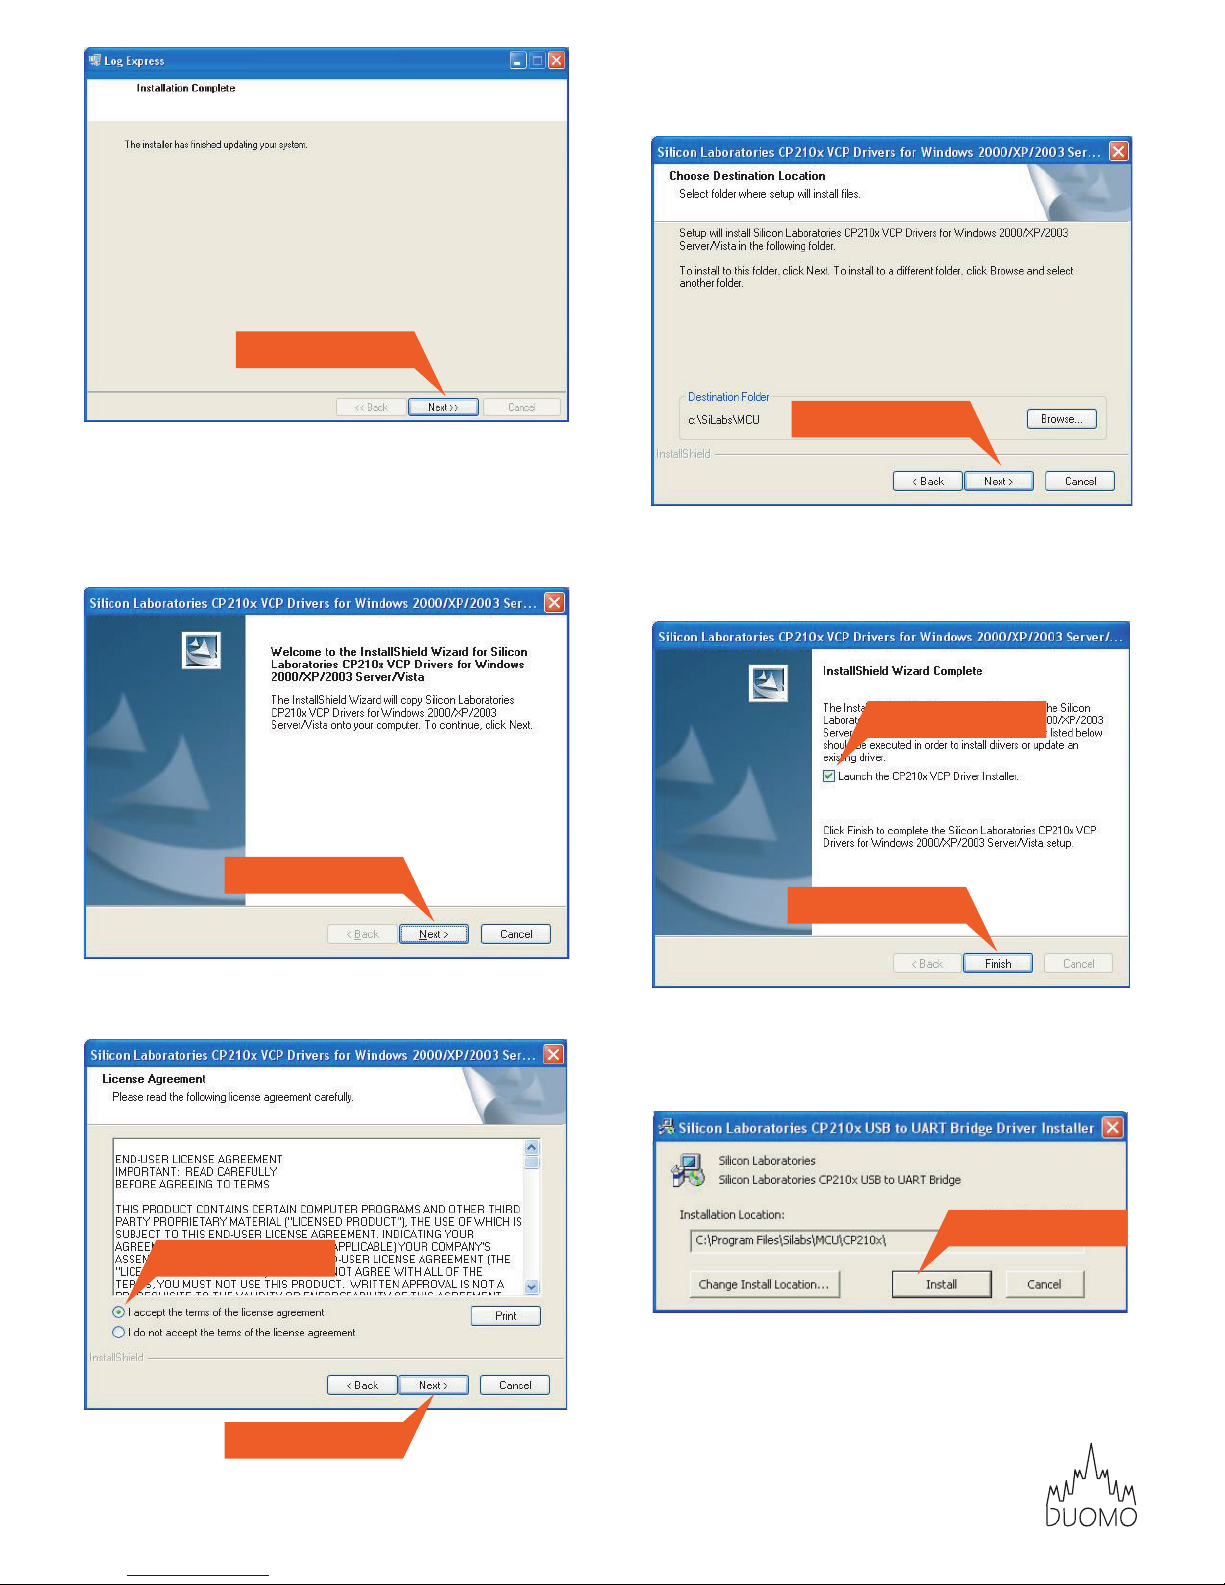
4. When it has finished, the above screen will be
displayed.Click 'Next' to continue.
5. The driver for the Vent Check Pro will now be
installed,click 'Next' to continue.
6. Select the terms of the licence agreement and
click 'Next'.
4. NEXT
5. NEXT
6a. NEXT
6. ACCEPT
7. Check the default installation directory. If you are
happy with this, click 'Next' on this and the next
dialog box.
8. Once installation is complete, the following
screen will appear. It is important to click the
checkbox before clicking 'Finish'.
9. Select 'Install' on the pop up screen and then
restart the computer when prompted to complete
the installation.
If you have any questions regarding the installation
process, or about Log Express and the Vent Check
Pro,please feel free to contact Duomo (UK) Ltd.
7. NEXT
8a. FINISH
8. SELECT
w: www.duomo.co.uk - e: [email protected] - t: 01905 797989 - f: 01905 774296 | © Duomo (UK) Ltd.2007
9. INSTALL
Page 6
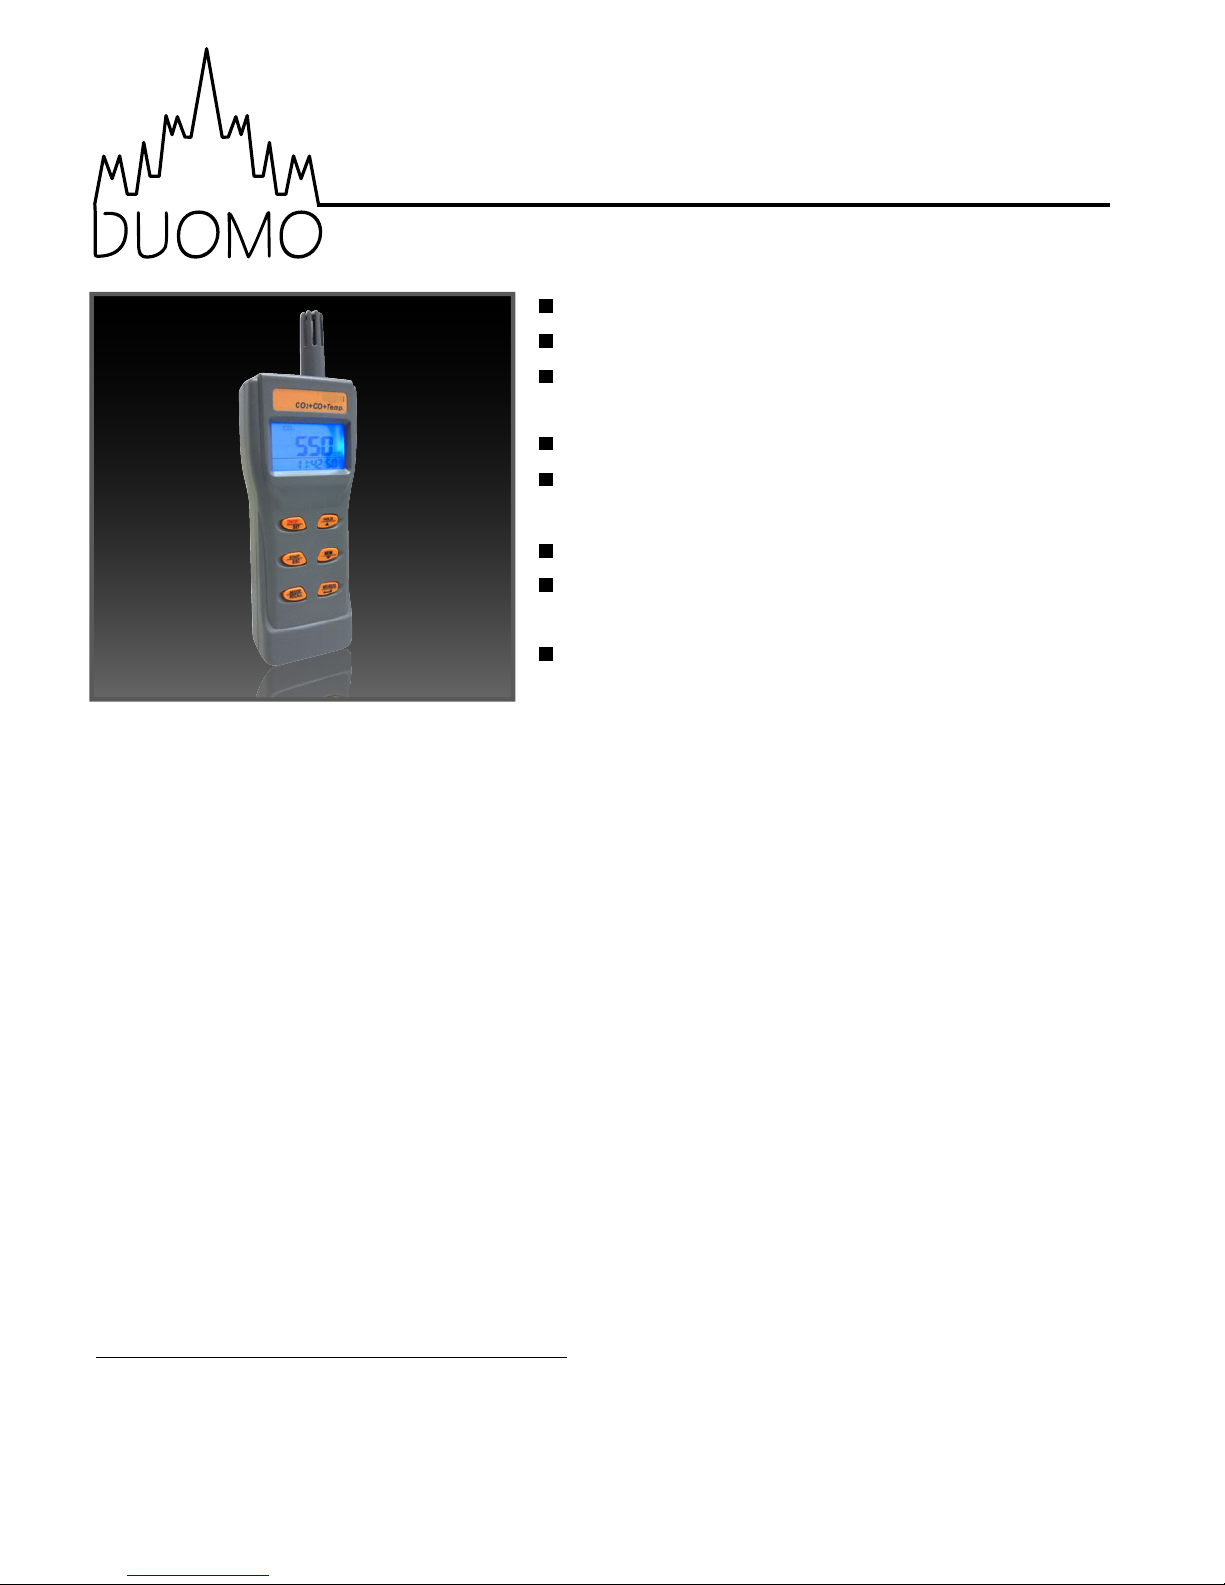
Log Express
Connecting
Homescreen
In order to download the data from the Vent Check
Pro or use it as a real time datalogger you must first
have fully installed Log Express and the associated
drivers from the installation CD.
Use the 'Log Express Installation' datasheet if you
need instructions on how to do this.
NOTE: Make sure that you have the Vent Check Pro
connected to the computer via the USB cable
before launching the program.
Upon launching the program, Log Express will
automatically connect to the Vent Check Pro. If you
do not have it already connected you will see an
error message. If this happens, connect the device
with the USB cable and select 'AutoConnect' from
the 'Communication' menu or the 'LogInfo' button.
Once you have established a connection you can
then choose to download existing data or begin
datalogging.
Datalogging software
RS232 to USB cable
Realtime graph display of CO
2
and
temperature
Printable statistics
Data can be saved to text file for further
analysis
Upto 30,000 sample readings
Programmable sample interval from 1
second to 5 hours
Quickly view the data at a certain date and
time with interactive graph
w: www.duomo.co.uk - e: [email protected] - t: 01905 797989 - f: 01905 774296 | © Duomo (UK) Ltd. 2007
File
From this menu you can load a previously saved set of
results, save a set of results, print the current view and
exit the program.
Setting
The setting menu gives access to the 'Logger'. Here it is
possible to synchronise the time between the Vent
Check Pro and the computer and also give the Vent
Check Pro a unique identifier.This is particularly useful if
you have several devices and want to keep track of
each one and the records it takes.
Communication
To connect to the Vent Check Pro if it has not already
done so automatically, select the 'AutoConnect' option
at the top of this menu. If you are experiencing any
difficulties with connections, you can select an
alternative COM port from the 'COMPort' sub menu.
View
The view menu allows you to zoom in on a particular
point of the graph. With the 'Zoom in' tool selected,
press and hold down the CTRL key and left click to
zoom in on the graph. Doing the same with the right
mouse button will zoom out.
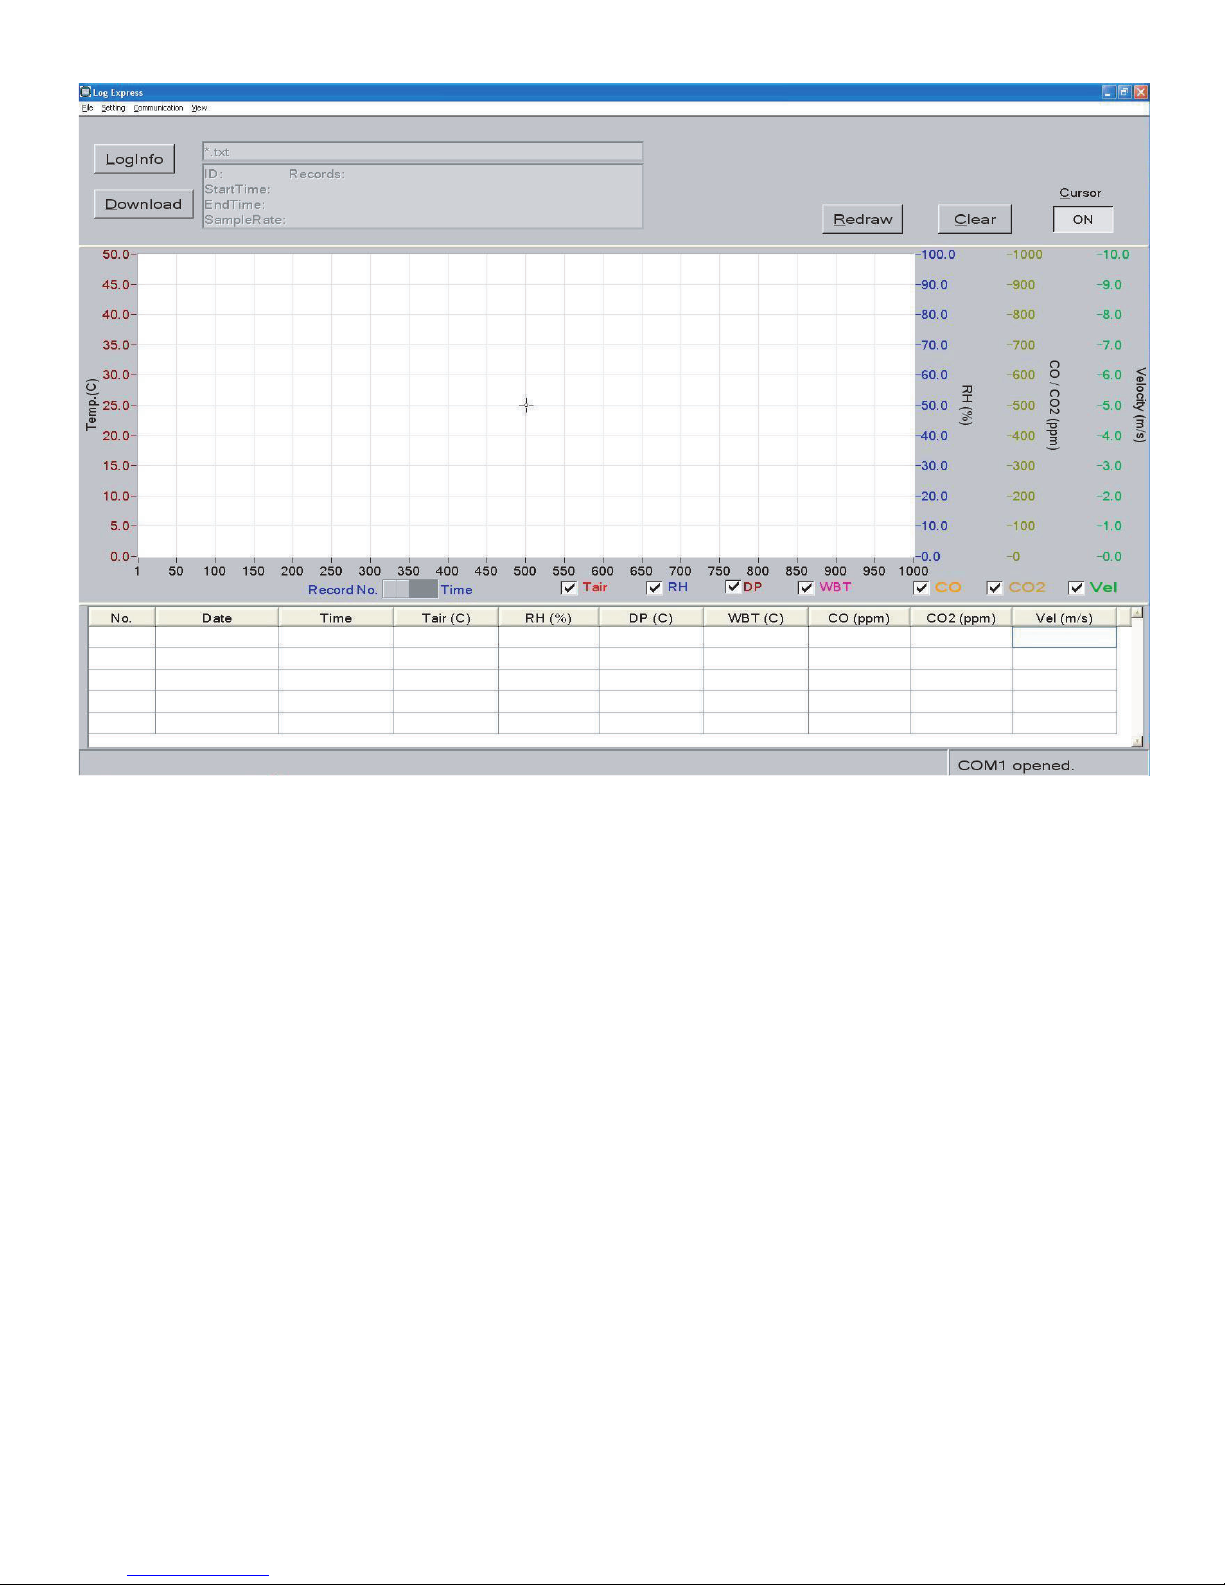
The image on the next page shows the layout of
Log Express. The menu bar at the top contains the
following options;
V
ent
Ch
e
c
k
P
ro
Page 7
w: www.duomo.co.uk - e: [email protected] - t: 01905 797989 - f: 01905 774296 | © Duomo (UK) Ltd.2007
Layout
'Zoom window' lets you zoom out of the current view
using the CTRL k ey and the right mouse button.
The 'Zoom Xaxis' and 'Zoom Yaxis' functions allow you
to rescale either access by the same method.
LogInfo
The 'LogInfo' button establishes a connection between
the device and the computer, similar to selecting
'AutoConnect'.
Download
Press the download button to transfer all data from the
Vent Check Pro to Log Express.
Redraw
Clears the current view of the graph and resets it.
Clear
The 'Clear' button resets Log Express and clears out any
currently stored data.
Cursor
Turning the cursor on allows you to interrogate any
data point on the graph by clicking it. Doing so will
display the data point number, data value, d ate and
time for that particular parameter. See image on the
next page.
Record No./ Time Bar
Switching between Record No. and Time displays alters
the X-axis of the graph as shown on the next page.
Display Selectors
Toggle the temperature, CO
2
and CO readings on and
off. on the graph. Clicking each checkbox will alter the
display on the graph by showing or hiding the relevant
readings.
Data Points
The table at the bottom of the screen displays each
individual data point taken in chronological order. The
date and time are shown, along with the readings for
the air temperature, carbon monoxide and carbon
dioxide.
Page 8
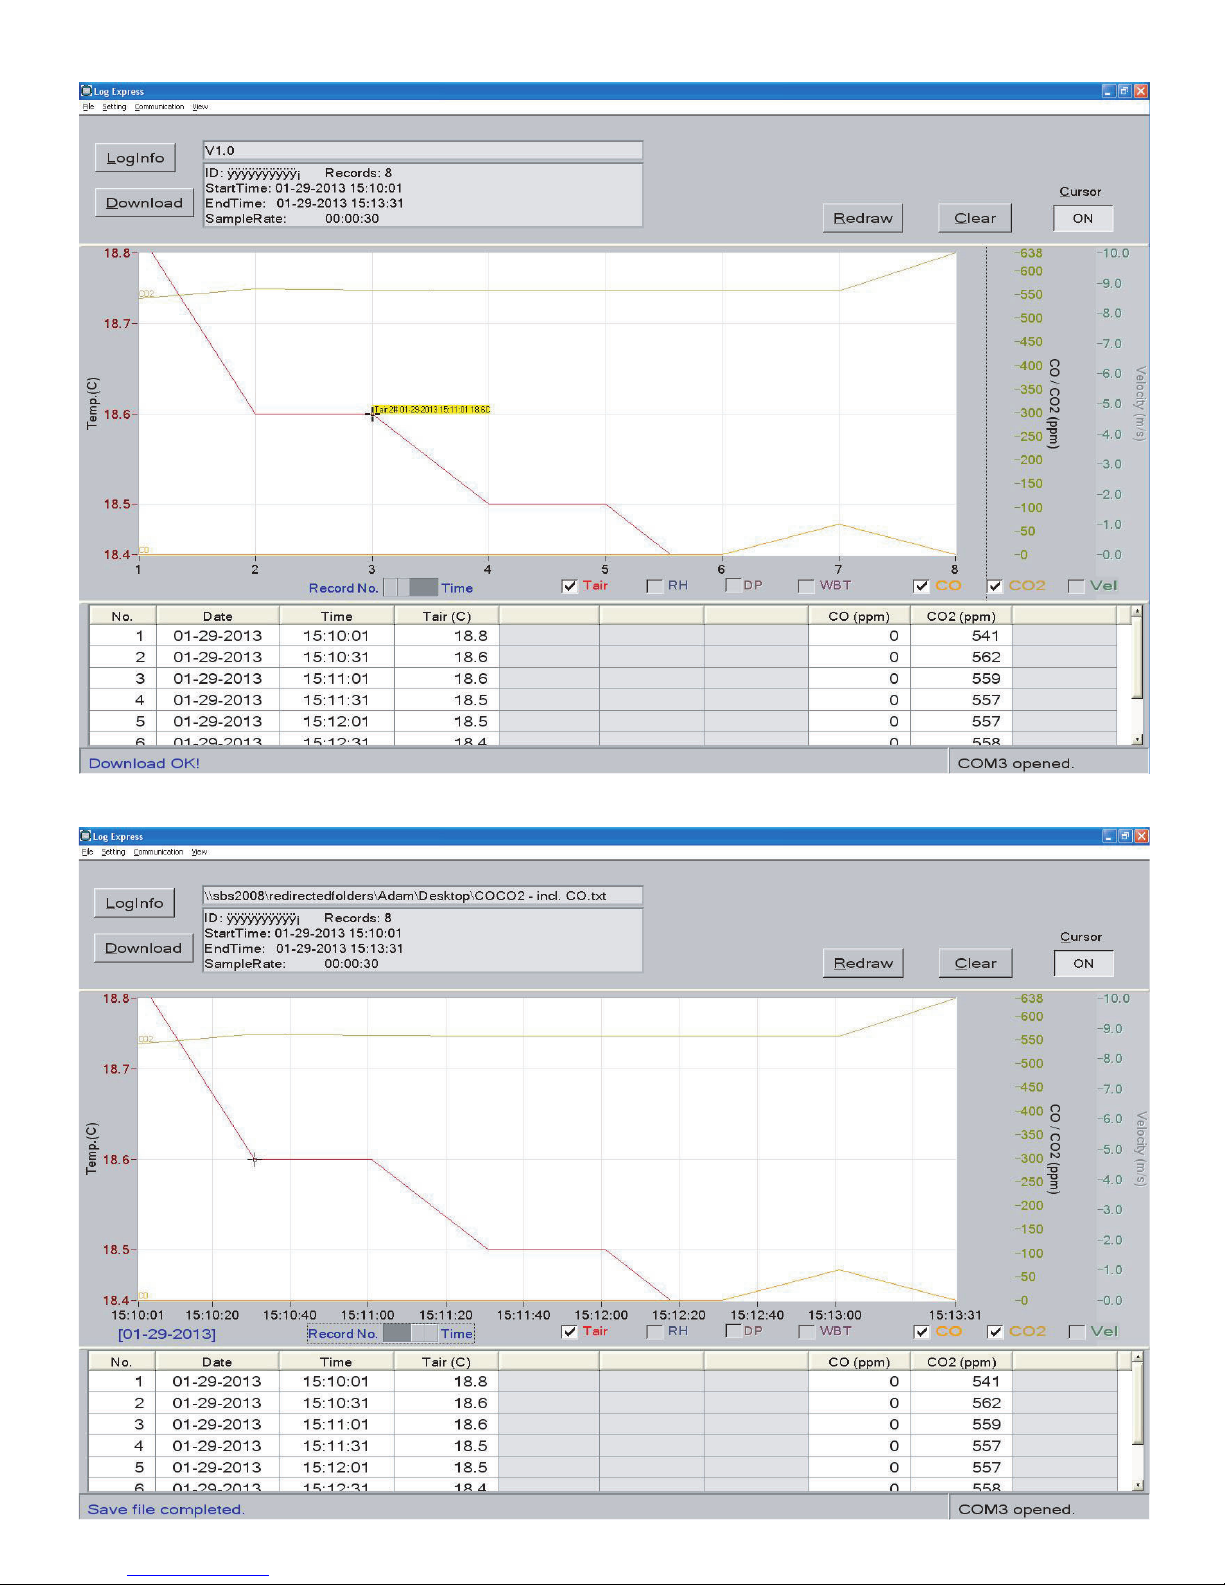
The image below shows the use of the 'Cursor' function. The highlighted yellow data point shows the value of air
temperature at that particular date and time.
This image shows the x axis represented in time rather than data points.
w: www.duomo.co.uk - e: [email protected] - t: 01905 797989 - f: 01905 774296 | © Duomo (UK) Ltd.2007
 Loading...