

Dranetz Technologies DBEP550-4, DBEP500-4, DBEP10-4, DBEPFLEX3K-4, DBEPFLEX6K-4 User manual
...Page 1

Energy PlatformTM
USER GUIDE
DRANETZ
1000 New Durham Road
Edison, New Jersey 08818-4019
Find Quality Products Online at: sales@GlobalTestSupply.com
www.GlobalTestSupply.com
Page 2

WARNING
Death, serious injury, or fire hazard could result from improper connection of this instrument. Read and
understand this manual before connecting this instrument. Follow all installation and operating
instructions while using this instrument.
Connection of this instrument must be performed in compliance with the National Electrical Code (ANSI/
NFPA 70-2008) of USA and any additional safety requirements applicable to your installation.
Installation, operation, and maintenance of this instrument must be performed by qualified personnel
only. The National Electrical Code defines a qualified person as “one who has the skills and knowledge
related to the construction and operation of the electrical equipment and installations, and who has
received safety training on the hazards involved.”
Qualified personnel who work on or near exposed energized electrical conductors must follow applicable
safety related work practices and procedures including appropriate personal protective equipment in
compliance with the Standard for Electrical Safety Requirements for Empl oyee Workplaces (ANSI/NFPA
70E-2009) of USA and any additional workplace safety requirements applicable to your installation.
Published by Dranetz
1000 New Durham Road
Edison, NJ 08818-4019 USA
Telephone: 1-800-372-6832 or 732-287-3680
Fax: 732-248-1834
Web site: www.drane
Copyright © 2009 Dranetz
All rights reserved.
No part of this book may be reproduced, stored in a
retrieval system, or transcribed in any form or by any
means—electronic, mechanical, photocopying, recording,
or otherwise—without prior written permission from the
publisher, Dranetz
Printed in the United States of America.
P/N UG-EP1 Rev.
ii
tz.com
, Edison, NJ 08818-4019.
B
Find Quality Products Online at: sales@GlobalTestSupply.com
www.GlobalTestSupply.com
Page 3

ADVERTENCIA
U
na conexión incorrecta de este instrumento puede producir la muerte, lesiones graves y riesgo de incendio. Lea y
entienda este manual antes de conectar. Observe todas las instrucciones de instalación y operación durante el uso de
este instrumento.
La conexión de este instrumento a un sistema eléctrico se debe realizar en conformidad con el Código Eléctrico
Nacional (ANSI/NFPA 70-2008) de los E.E.U.U., además de cualquier otra norma de seguridad correspondiente a
su establecimiento.
La instalación, operación y mantenimiento de este instrumento debe ser realizada por personal calificado solamente.
El Código Eléctrico Nacional define a una persona calificada como "una que esté familiarizada con la construcción y
operación del equipo y con los riesgos involucrados."
El personal cualificado que trabaja encendido o acerca a los conductore s eléctricos energizad os expuestos debe seg uir
prácticas y procedimientos relacionados seguridad aplicable del trabajo incluyendo el equipo protector personal
apropiado en conformidad con el estándar para los requisitos de seguridad eléctricos para los lugares de trabajo del
empleado (ANS I/NFPA 70E-2009) de los E.E.U.U. y cualquier requisito de seguridad adicional del lugar de trabajo
aplicable a su instalación.
AVERTISSEMENT
Si l'instrument est mal connecté, la mort, des b lessures graves, ou un danger d'incendie peuvent s'en suivre. Lisez
attentivement ce manuel avant de connecter l'instrument. Lorsque vous utilisez l'instrument, suivez toutes les
instructions d'installation et d e service.
Cet instrument doit être connecté conformément au National Electrical Code (ANSI/NFPA 70-2008) des Etats-Unis
et à toutes les exigences de sécurité applicables à votre installation.
Cet instrument doit être installé, utilisé et entretenu uniquement par un personnel qualifié. Selon le National
Electrical Code, une personne est qualifiée si "elle connaît bien la constructi on et l'utilisation de l'équipement, ainsi
que les dangers que cela implique."
Le personnel qualifié qui travaillent dessus ou s'approchent des conducteurs électriques activés exposés doit suivre
des pratiques en matière et des procédures reliées par s ûreté applicable de travail comprenant le maté riel de protection
personnel approprié conformé men t à la norme pour des conditions de sûreté électriques pour les lieux de travail des
employés (ANSI/NFPA 70E-2009) des Etats-Unis et toutes les conditions de sûreté additionnelles de lieu de travail
applicables à votre installation.
WARNUNG
Der falsche Anschluß dieses Gerätes kann Tod, schwere Verletzungen oder Feuer verursachen. Bevor Sie dieses
Instrument anschließen, müssen Sie die Anleitung lesen und verstanden haben. Bei der Verwendung dieses
Instruments müssen alle Installation- und Betriebsanweisungen beachtet werden.
Der Anschluß dieses Instruments muß in Übereinstimmung mit den nationalen Bestimmungen für Elektrizität
(ANSI/NFPA 70-2008) der Vereinigten Staaten, sowie allen weiteren, in Ihrem Fall anwendbaren
Sicherheitsbestimmungen, vorgenommen werden.
Installation, B etrieb und Wartung dieses Instruments dürfen n ur von Fachpersonal durchgeführt werden. In dem
nationalen Bestimmungen für Elektrizität wird ein Fachmann als eine Person bezeichnet, welche "mit der Bauweise
und dem Betrieb des Gerätes sowie den dazugehörigen Gefahren vertraut ist."
Qualifiziertes Personal, das an bearbeiten oder her a usgestellte angezogene elektrische Leiter sich nähern, muß
anwendbare Sicherheit bezogener Arbeit Praxis und Verfahren einschließlich passende persönliche schützende
Ausrüstung ge mäß dem Standard für elektrische Sicherheitsauflagen für Angestellt-Arbeitsplätze (ANSI/NFPA 70E-
2009) der Vereinigten Staaten und alle zusätzlichen Arbeitsplatzsicherheitsauflagen folgen, die auf Ihre Installation
anwendbar sind.
iii
Find Quality Products Online at: sales@GlobalTestSupply.com
www.GlobalTestSupply.com
Page 4

Safety Summary
Definitions
Symbols
Definiciones
WARNING statements inform the user that certain conditions or practices could result
in loss of life or physical harm.
CAUTION statements identify conditions or practices that could harm the Energy
Platform, its data, other equipment, or property.
NOTE statements call attention to specific information.
The following International Electrotechnical Commission (IEC) symbols are marked
on the top and rear pa nel in the immediate vicinit y of the referenced terminal or d evice:
!
Las ADVERTENCIAS informan al usuario de ciertas condiciones o prácticas que
podrían producir lesiones mortales o daño físico.
Las PRECAUCIONES identifican condiciones o práctica s que podrían da ñar la Ener gy
Platform, sus datos, otros equipos o propiedad.
Caution, refer to accompanying documents (this manual).
Direct current (DC) operation of the terminal or device.
Power Switch
Símbolos
Las NOTAS llaman la atención hacia la informaci ón espec íf ic a.
Los siguientes símbolos de la Comisión Internacional Electrotécnica (IEC) aparecen
marcados en el panel superior y el posterior inmediatos al terminal o dispositivo en
referencia:
!
Precaución, consulte los documentos adjuntos (este manual).
Operación de corriente continua (CC) del terminal o dispositivo.
Interruptor de encendido
Continued on next page
iv
Find Quality Products Online at: sales@GlobalTestSupply.com
www.GlobalTestSupply.com
Page 5

Safety Summary,
Continued
Définitions
Symboles
Definitionen
Les messages d’AVERTISSEMENT préviennent l’utilisateur que certaines conditions
ou pratiques pourraient entraîner la mort ou des lésions corporelles.
Les messages de MISE EN GARDE signalent des condi ti ons ou pratiques susceptibles
d’endommager “Energy Platform”, ses données, d’autres équipements ou biens
matériels.
Les messages NOTA attirent l’attention sur certains renseignements spécifiques.
Les symboles suivants de la Commission é lectrotech nique intern ationale (CEI) figuren t
sur le panneau arrière supérieur situé à proximité du terminal ou de l’unité cité:
!
WARNUNGEN informieren den Benutzer darüber, daß bestimmte Bedingungen oder
Vorgehensweisen körperliche oder tödliche Verletzungen zur Folge haben können.
Mise en garde, consultez les documents d’accompagnement (ce manual).
Fonctionnement du terminal ou de l’unité en courant continu (CC).
Interrupteur de tension
Symbole
VORSICHTSHINWEISE kennzeichnen Bedingungen oder Vorgehensweisen, die zu
einer Beschädigung von Energy Platform, seiner Daten oder anderer Geräte bzw. von
Eigentum führen können.
HINWEISE machen auf bestimmte Informationen aufmerksam.
Die folgenden Symbole der Internationalen Elektrotechnischen Kommission
(International Electrotechnical Commission; IEC) befinden sich auf der Abdeck- und
Seitenplatte unmittelbar am betreffenden Terminal oder Gerät.
!
Vorsichtshinweis, siehe Begleitdokumente (dieses Handbuch).
Gleichstrombetrieb im Terminal oder Gerät.
Netzschalter
Continued on next page
v
Find Quality Products Online at: sales@GlobalTestSupply.com
www.GlobalTestSupply.com
Page 6

Safety Summary,
Continued
Safety
precautions
The following safety precautions must be followed whenever any type of voltage or
current connection is being made to the Energy Platform.
• Wear proper Personal Protective Equipment, including safety glasses and insulated
gloves when making connections to power circuits.
• Hands, shoes and floor must be dry when making any connection to a power line.
• Before each use, inspect all cables for breaks or cracks in the insulation. Replace
immediately if defective.
• Set the Energy Platform power switch to Off.
• Before connecting to electric circuits to be monitored, open their related circuit
breakers or disconnects. DO NOT install any connection of the Energy Platform to
live power lines.
• Connections must be made to the Ener g y Plat form fi rst, th en con nect to the ci rcuit to
be monitored.
• If the equipment is used in a manner not specified in this use r’s guide, the protecti on
provided by the equipment may be impaired. These safety precautions are repeated
where appropriate throughout this manual.
These safety precautions are repeated where appropriate throughout this manual.
vi
Find Quality Products Online at: sales@GlobalTestSupply.com
www.GlobalTestSupply.com
Page 7

Statements and Notices
Statement of
warranty
Statement of
reliability
Notice regarding
FCC compliance
All products of Dranetz
material and workmanship for a period of one year from the date of delivery. Dranetz
will repair or repl ace, at its opt ion, all def ectiv e equipment t hat is retur ned, fr eight
prepaid, during th e warrant y period. There will be n o char ge f or repai r provid ed the re is
no evidence that the equipment has b een mishand led or abuse d. This warrant y shal l not
apply to any defects resulting from improper or inadequate maintenance, buyersupplied hardware/software interfacing, unauthorized modification or misuse of the
equipment, operation outside of environmental specifications, or improper site
preparation or maintenance.
The information in this ma nual has been reviewed and is believed to be e ntirely
reliable, however, no responsibility is assumed for any inaccuracies. All material is for
informational purposes only and is subject to change without prior notice.
This device has been tested and found to comply with the limits for a Class A digital
device, pursuant to Part 15 of the FCC Rules. These limits are designed to provide
reasonable prote cti on against harmful in terference when the eq uipment is operated in a
commercial environment. This equipment generates, uses, and can radiate radio
frequency energy and, if not installed and used in accordance with the instruction
manual, may cause harmful interference to radio communications. Operation of this
equipment in a residential are a is likel y to ca use harmfu l inter feren ce in which case the
user will be required to correct the interference at his/her own expense.
are warran ted to the original purchaser against defective
Notice regarding
proprietary
rights
This publication contains information proprietary to Dranetz
using this manual, you agree that the information contained herein will be used solely
for the purpose of operating equipment of Dranetz
.
. By accepting and
Continued on next page
vii
Find Quality Products Online at: sales@GlobalTestSupply.com
www.GlobalTestSupply.com
Page 8

Statements and Notices,
Continued
Copyright
Trademarks
This publication is protected under the Copyright laws of the United States, Title 17 et
seq. No part of this p ublica tion may be rep roduced , tr ansmit ted, t ranscr ib ed, sto red in a
retrieval system, or translated into a ny la nguage or computer language, in any form, by
any means, electronic, mechanical, magnetic, optical, chemical, manual, or otherwise,
without the prior written consent of Dranetz
New Jersey 08818.
Copyright © 2009 Dranetz
All Rights Reserved. Printed in the United States of America.
Energy Platform, Scope Mode and DranView are registered trademarks of Dranetz
, 1000 New Durham Road, Edison,
.
viii
Find Quality Products Online at: sales@GlobalTestSupply.com
www.GlobalTestSupply.com
Page 9

Table of Contents
Safety Summary .................................................................................................................... iv
Statements and Notices.......................................................................................................... vii
CHAPTER 1 - Getting Started
Overview ............................................................................................................................... 1-1
Unpacking the Energy Platform ............................................................................................ 1-3
Standard Accessories............................................................................................................. 1-4
Energy Platform Controls, Indicators, and Connectors......................................................... 1-5
Top and Side Views........................................................................................................ 1-6
Front View ...................................................................................................................... 1-7
Bottom View........................................................................................ ........................... 1-8
Rear View ....................................................................................................................... 1-9
Upgrading Firmware from a Data Card................................................................................. 1-10
Energy Platform Features................................................ ...................................................... 1-12
Basic Operation ..................................................................................................................... 1-14
Power-on Sequence......................................................................................................... 1-15
Home Screen Icons ................................................................................................ ......... 1-16
CHAPTER 2 - Voltage Measurement Cable and Current Probe Connections
Overview ............................................................................................................................... 2-1
Connecting Voltage Measurement Cables ............................................................................ 2-4
Connecting Current Probes.................................................................................................... 2-9
CHAPTER 3 - View Real Time Data
Overview ............................................................................................................................... 3-1
Section A -Scope Mode ............................................................................................................... 3-2
Overview ............................................................................................................................... 3-2
Turning Channels On/Off...................................................................................................... 3-3
Checking Input Range........................................................................................................... 3-4
Section B -Meter Mode................................................................................................................ 3-5
Overview ............................................................................................................................... 3-5
Standard Meter Tab............................................................................................................... 3-6
Distortion Meter Tab............................................................................................................. 3-8
Advanced Meter Tab............................................................................................................. 3-10
Section C -Harmonics.................................................................................................................. 3-12
Overview ............................................................................................................................... 3-12
Harmonic Graph.................................................................................................................... 3-13
Harmonic Detail .................................................................................................................... 3-14
Harmonic Options.................................................................................................................. 3-15
Harmonic List........................................................................................................................ 3-17
Section D -Voltage and Current Phasor ....................................................................................... 3-18
Overview ............................................................................................................................... 3-18
Phasor Screen ........................................................................................................................ 3-19
Phasor Rotation...................................................................................................................... 3-20
Phasor Parameter/Channel Selection..................................................................................... 3-22
ix
Find Quality Products Online at: sales@GlobalTestSupply.com
www.GlobalTestSupply.com
Page 10

Table of Contents,
CHAPTER 4 - Instrument Settings
Overview ............................................................................................................................... 4-1
Access Instrument Settings Menu......................................................................................... 4-2
Time and Date Settings..........................................................................................................4-3
Select Language........................................................................ ......... .................................... 4-5
Set Display Preferences......................................................................................................... 4-6
Touch Screen Calibration...................................................................................................... 4-7
Turn Threshold Beeper On/Off............................................................................................. 4-9
Communications.................................................................................................................... 4-10
Data Card............................................................................................................................... 4-12
Reset to Factory Configuration.............................................................................................. 4-15
CHAPTER 5 - Start Menu
Overview ............................................................................................................................... 5-1
Section A -Automatic Setup......................................................................................................... 5-3
Section B -Wizard Setup.............................................................................................................. 5-6
Overview ............................................................................................................................... 5-6
Current Probe Selection.........................................................................................................5-8
Scale Factor Setup................................................................................................................. 5-10
Circuit Type Selection........................................................................................................... 5-12
Nominal Values..................................................................................................................... 5-14
Mode of Operation................................................................................................................. 5-17
Monitoring Mode................................................................................................................... 5-18
Advanced Options ................................................................................................................. 5-19
Site Name/Memory Card....................................................................................................... 5-20
Section C -Monitor Same Circuit.................................................................................................5-24
Overview ............................................................................................................................... 5-24
Turning Monitoring On/Off................................................................................................... 5-25
Monitoring at a Specified Time and Date............................................................................. 5-28
Modify Trigger Parameters and Intervals.............................................................................. 5-33
Section D -Load Setup Template from Card................................................................................ 5-34
Section E -Load Data from Card..................................................................................................5-35
Overview ............................................................................................................................... 5-35
Loading Data from Card........................................................................................................ 5-35
Card Error Messages ............................................................................................................. 5-36
Continued
CHAPTER 6 - Advanced Setup Options
Overview ............................................................................................................................... 6-1
Advanced Options Menu....................................................................................................... 6-2
RMS Variation Limit.............................................................................................................6-3
x
Find Quality Products Online at: sales@GlobalTestSupply.com
www.GlobalTestSupply.com
Page 11

Table of Contents,
Demand Parameters............................................................................................................... 6-5
Journal Limit.......................................................................................................................... 6-8
Journal Interval for Timed Readings ..................................................................................... 6-12
CHAPTER 7 - View Event Data
Overview ............................................................................................................................... 7-1
Section A -Event List................................................................................................................... 7-4
Overview ............................................................................................................................... 7-4
Section B -Trend.......................................................................................................................... 7-5
Overview ............................................................................................................................... 7-5
Trend Display........................................................................................................................ 7-6
Trend Setup............................................................................................................................ 7-7
CHAPTER 8 - Reports
Overview ............................................................................................................................... 8-1
Demand and Energy Report .................................................................................................. 8-2
CHAPTER 9 - Downloading Events
Continued
Overview ............................................................................................................................... 9-1
Viewing Events via EPRW.................................................................................................... 9-2
Viewing Events via DranView.............................................................................................. 9-3
DranView with HASP........................................................................................................... 9-4
APPENDIX A - Optional Accessories
Overview ............................................................................................................................... A-1
Hardware Accessories List & Descriptions........................................................................... A-2
Software Accessories List ..................................................................................................... A-7
APPENDIX B - Technical Specifications
Overview ............................................................................................................................... B-1
General................................................................................................................................... B-2
Interfaces ............................................................................................................................... B-3
Measured Parameters............................................................................................................. B-4
Computed Parameters............................................................................................................ B-5
Parameter Settings in Each Monitoring Mode ...................................................................... B-9
TR2500 Current Probe........................................................................................................... B-10
TR2510 Current Probe........................................................................................................... B-11
DRANFLEX 3000XL/6000XL Current Probes.................................................................... B-12
DRANFLEX 3003XL/6003XL Current Probes.................................................................... B-13
xi
Find Quality Products Online at: sales@GlobalTestSupply.com
www.GlobalTestSupply.com
Page 12

Table of Contents,
APPENDIX C - Battery Specifications and Replacement Procedure
Overview ............................................................................................................................... C-1
Battery Specifications............................................................................................................ C-2
Battery Pack Safety Precautions............................................................................................ C-3
Battery Pack Replacement..................................................................................................... C-4
APPENDIX D - User Replaceable Parts List
APPENDIX E - Common Circuit Connections
Overview ............................................................................................................................... E-1
Verifying Voltage and Current Connections......................................................................... E-5
Single Phase........................................................................................................................... E-7
Split Phase............................................................................................................................. E-8
3 Phase, Four Wire Wye........................................................................................................ E-9
3 Phase 2-Watt Delta............................................................................................................. E-10
2 1/2 Element Without Voltage Channel B........................................................................... E-11
2 1/2 Element Without Voltage Channel C........................................................................... E-12
Connecting to a Potential Transformer (PT) ......................................................................... E-13
Connecting to a Current Transformer (CT)........................................................................... E-15
Connecting to an Isolated Current Transformer (ISO).......................................................... E-16
Continued
APPENDIX F - Event Classification
APPENDIX G - Energy Platform Menu Structure
xii
Find Quality Products Online at: sales@GlobalTestSupply.com
www.GlobalTestSupply.com
Page 13
Dranetz Energy Platform
TM
xiii
Find Quality Products Online at: sales@GlobalTestSupply.com
www.GlobalTestSupply.com
Page 14

xiv
Find Quality Products Online at: sales@GlobalTestSupply.com
www.GlobalTestSupply.com
Page 15

Overview
CHAPTER 1
Getting Started
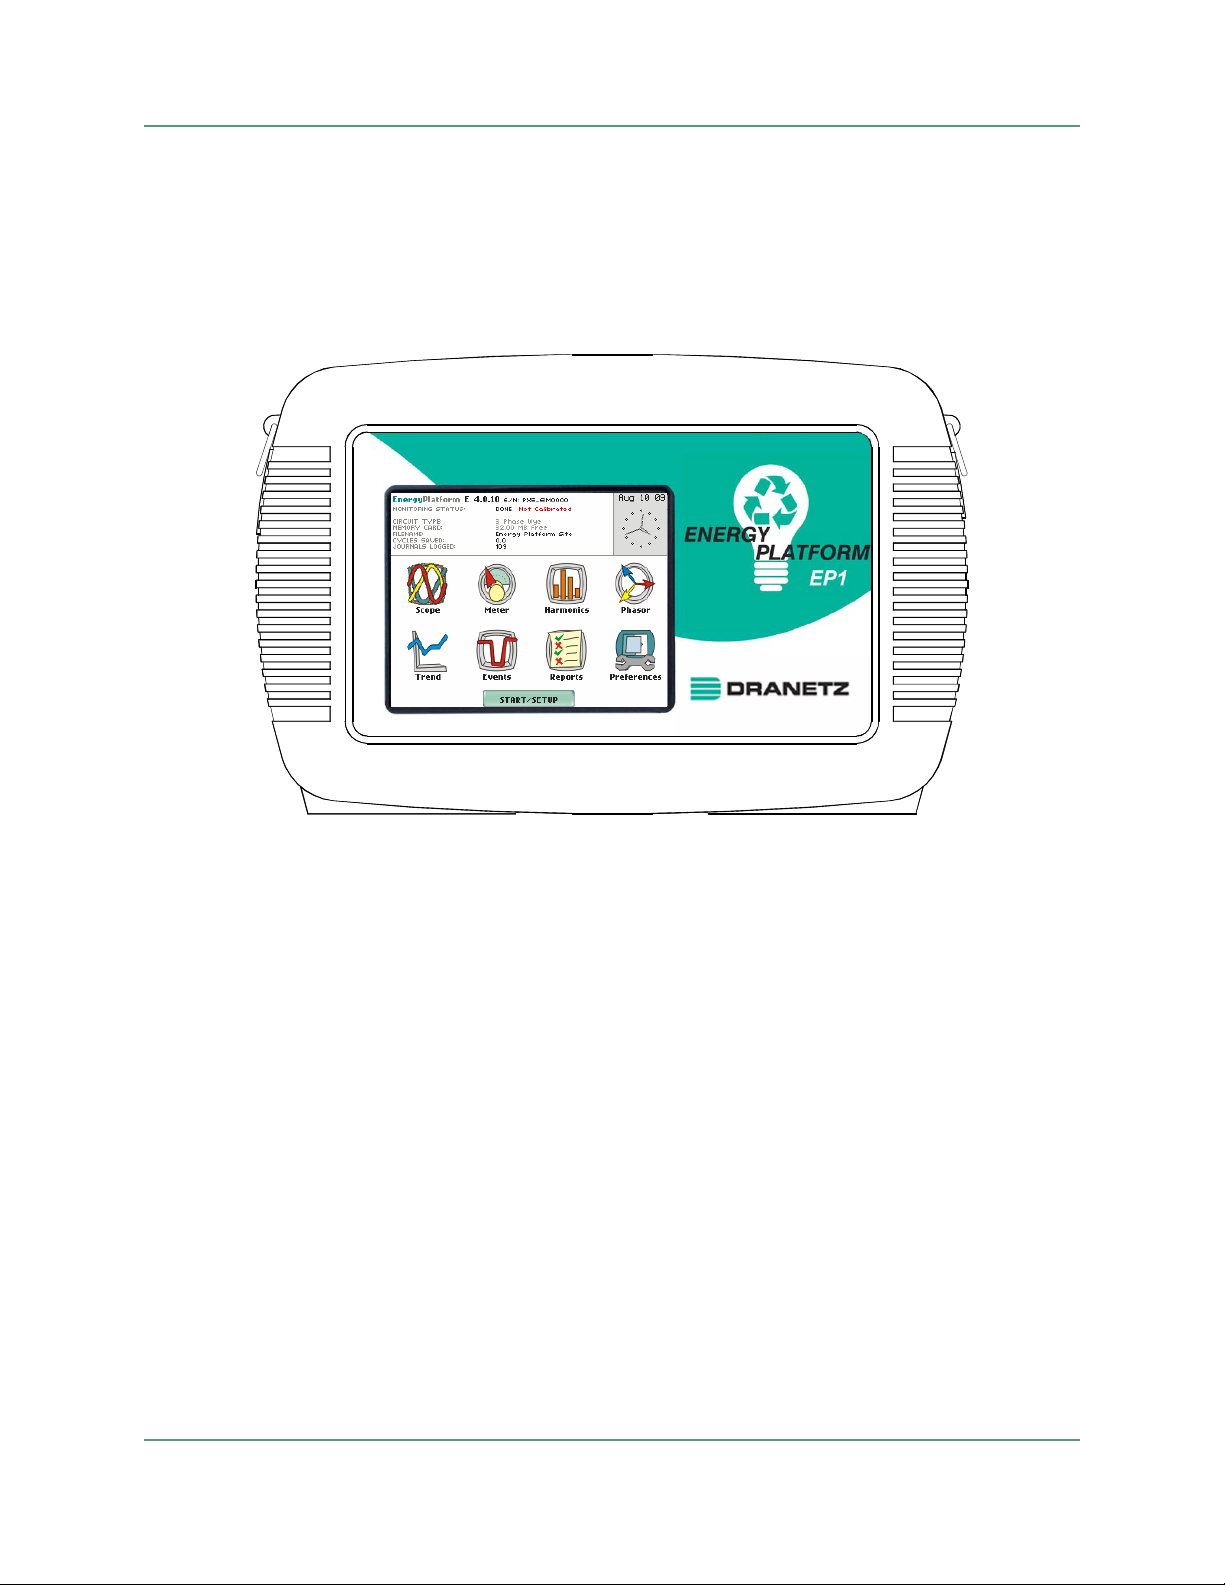
Energy Platform
description
Energy Platform
firmware
The Dranetz
Energy Platform
TM
is a portable, hand-held, eight-channel demand
and energy meter/monitor. This advanced power instrument is designed with a color
liquid crystal display (LCD) 1/4 VGA, using touch screen technology. It can monitor,
record and display data on four voltage channels and four current channels
simultaneously.
The Energy Pla tform is de signed to a llow the user to easil y conduct a complete dema nd
and energy audit of a facili ty, a distributi on circui t, or an indi vidual pie ce of equipmen t.
In addition, it simultaneously provides basic power quality (PQ) information about the
system being monitored.
The firmware for the Energy Platform is contained on internal FLASH memory. It has
an operating system capable of performing multiple applications. When an updated
version of the firmware is released, the user can upgrade the internal program by
putting the latest Energy Platform firmware program card in the appropriate slot of the
mainframe. See page 1-10 for instructions on how to upgrade the Energy Platform
firmware from a data card.
The Energy Platform firmware can monitor demand and energy parameters for energy
audits, efficiency studies and cost reduction programs. It can carry out long-term
statistical studies to establish performance baselines, and perform field-based
equipment testing and evaluation for commissioning and maintenance. The firmware
integrates an intuitive instrument setup procedure to ensure the capture of all relevant
data for additional post process analysis, report writing, and data archiving using other
compatible Dranetz
and DranView®.
Writer
software applications such as the Energy Platform
TM
Report
This manual
This manual contains instructions for operating the Dranetz
Energy Platform.
1-1
Find Quality Products Online at: sales@GlobalTestSupply.com
www.GlobalTestSupply.com
Page 16

Overview, continued
In this chap ter
The following topics are covered in this chapter.
Topic See Page
Unpacking the Energy Platform 1-3
Standard Accessories 1-4
Energy Platform Controls, Indicators and Connectors 1-5
Upgrading Firmware from a Data Card 1-10
Energy Platform Features 1-12
Basic Operation 1-14
1-2
Find Quality Products Online at: sales@GlobalTestSupply.com
www.GlobalTestSupply.com
Page 17

Unpacking the Energy Platform
CH 1/ Getting Started
Introduction
Unpacking
Shipping
damage
inspection
For maximum protection against possible shipping damage, the Energy Platform has
been sealed in a two-p iece, p las tic s uspens ion pack , enc losed wit hin a dur able s hippi ng
carton. After openin g the ca rt on, ins pect t he cont ent s for p ossibl e sh ippin g dama ge and
check the carton inventory.
Unpack the Energy Platform from the carton as follows:
Step Action
1 Remove any remaining literature inside the top of the carton.
2 Carefully remove the Energy Platform from its shipping carton.
3 Remove all accessories inside the carton. Check that all of the standard
accessories (see page 1-4) are included.
Visually inspect the Energy Platform for possible shipping damage. If any damage
exists, first notify and file an insurance claim with your carrier or underwriter or both.
Then notify Dranetz
the unit. DO NOT return the Energy Platform without prior instructions from Dranetz
Customer Service Department. Dranetz Customer Service Department can
be reached at (732) 287-3680 or 1-800-372-6832.
Customer Service Department of your intentions to return
Repacking for
return shi pmen t
Return notice
If the unit must be return ed to Dranetz
in heavy packaging materia l and place in a well padded box or crate to p revent damag e.
Do not return the Energy Platform in an unpacked box. Dranetz
responsible for damage incurred during transit due to inadequate packing on your part.
Notify Dranetz
return the unit without prior instructions from Dra netz
Service Department can be reached at (732) 287-3680 or 1-800-372-6832.
Customer Service of your intention of returning the unit. Do not
for service or repai r , wrap the unit sec urely
will not be
. Dranetz Customer
1-3
Find Quality Products Online at: sales@GlobalTestSupply.com
www.GlobalTestSupply.com
Page 18

St andard Accesso ries
Standard Accessories
Standard
accessories
Optional
accessories
The following table lists the Energy Platform's standard accessories.
Description Part Number
Standard Software Accessories
TM
Energy Platform
Report Writer (EPRW) 118070-G1
Standard Hardware Accessories
Cable Set 116042-G6
Easel 116038-G1
AC Adapter 117029-G1
*US Power Cord USSTDCORD (900744)
*European Power Cord EUROSTDCORD (115369-G2)
*United Kingdom Power Cord UKSTDCORD (115368-G2)
*Australian Power Cord AUSTDCORD (901347)
Notice: Charge Battery 899156
Energy Platform User Guide (CD) UG-EP1
Energy Platform Quick Refe rence Guide QR-EP1
*User specified, one standard only.
Refer to Appendix A for the list of hardware and software optional accessories
available for use with Energy Platform.
Batteries
Replaceable
parts
Calibration
Refer to Appendix C for the description and replacement of the batteries contained in
Energy Platform.
Refer to Appendix D for the user replaceable parts.
The recommended calibration interval for this unit is once every 12 months.
We recommend that you return the unit to the factory for calibration. If you decide to
do so, first contact the Dranetz
Customer Service Department to obtain an
Authoriz ation Number.
Telephone: (732) 287-3680 or 1-800-372-6832
FAX: (732) 248-9240
Fill out the Repair /Servi ce Ord er for m enc losed i n the shippi ng car ton and shi p it a long
with the unit to the Dranetz
Dranetz
Customer Service Department for a replacement.)
Repair Department. (If this form is missing, ask the
1-4
Find Quality Products Online at: sales@GlobalTestSupply.com
www.GlobalTestSupply.com
Page 19

Energy Platform Controls, Indicators, and Connectors
CH 1/ Getting Started
Dimensions
Energy Platform is a self-contained, portable instrument weighing less than 4 pounds
and measuring 8" (20.3 cm) deep by 12" (30.5 cm) wide by 2.5" (6.4 cm) high. This
section identifies and describes the co ntr ols, indicators, and connectors on all panels of
the Energy Platform shown with rubber boot installed.
PROBE
Top View
Front View
VOLTAGE
INPUTS
600V RMS MAX
INPUTS
CONNE CT ON LY
DRANE TZ
ACCESSORIES
Va Ia Vb Ib Vc Ic Vd (+) IdVd (-)NEUTRAL
Rear View
Bottom View
1-5
Find Quality Products Online at: sales@GlobalTestSupply.com
www.GlobalTestSupply.com
Page 20

Energy Platform Controls, Indicators, and Connectors, continued
Top and Side
views
The top (circuit connection) view features the input voltage and current connectors.
The left side contains the optical interface port. The right side contains the AC adapter
input connector. Both sides have rings for attaching the supplied carrying strap. See
below for descriptions of the top and side connectors.
1 2 3 5
PROBE
VOLTAGE
INPUTS
600V RMS MAX
Va Ia Vb Ib Vc Ic Vd ( +) IdVd (-)NEUTRAL
INPUTS
CONNECT ONLY
DRANETZ
ACCESSORIES
11 12
6 7 8 9
104
Parts table
1-6
Part Function
1 CH A, Voltage Input Connector; color red.
2 CH A, PROBE, Current Input Connector.
3 CH B, Voltage Input Connector; color yellow.
4 CH B, PROBE, Current Input Connector.
5 CH C, Voltage Input Connector; color blue.
6 Neutral, Voltage Input Connector; color white.
7 CH C, PROBE, Current Input Connector.
8 CH D, + Differential Voltage Input Connector; color grey.
9 CH D, - Differential Voltage Input Connector; color white.
10 CH D, PROBE, Current Input Connector.
11 Optical Serial Data Port
12 AC Adapter/Battery Charger Input Connector.
Find Quality Products Online at: sales@GlobalTestSupply.com
www.GlobalTestSupply.com
Page 21

CH 1/ Getting Started
Front view
The front view primari ly shows t he color touch sc reen LCD. See below for desc riptions
of the Energy Platform front panel.
21
Parts table
Part Function
1 Mainframe Protective Rubber Boot Enclosure
2 Liquid Crystal Display (LCD). Provides 3.75 x 4.75 inches display
consisting of 1/4 VGA size screen of text and graphic information. The
color LCD is equipped with touch screen technology, operable using the
finger and/or PDA stylus. Touch screen display permits menu selection,
alphanumeric data entry, and has a compact fluorescent (CCFL)
backlighting that is always on for low light level viewing.
The following are some basic care instructions for the LCD monitor
• Use and store the unit within the specified temperature and humidity
range. The LCD screen may be adversely affected by exposure to high
temperature or humidity. Condensation or moisture produced by
sudden temperature changes may also damage the LCD screen. Clean
any moisture from surface immediately.
• Be careful when cleaning or removing stains on the LCD surface.
Gently wipe the surface with a soft cloth or cotton pad. Isopropyl
alcohol may be used, but make su re that all solvent res idu e i s r emoved.
• Do not apply excessive force to the LCD surface. The LCD screen
contains sensitive electronic components that may be damaged due to
strong impact.
:
1-7
Find Quality Products Online at: sales@GlobalTestSupply.com
www.GlobalTestSupply.com
Page 22

Energy Platform Controls, Indicators, and Connectors, continued
Bottom view
Parts table
The bottom view features a slot to hold the data card.
The bottom also features LED indicators and the On/Off power button. See below for
descriptions of the data card slot, indicators, and power button.
1 2 4 53
Part Function
1 Data Card Slot. Holds and connects data card to internal circuitry. Eject data
card by pushing data card release.
2 Battery Ch arge Indicator. LED will ligh t steadily while battery is fast
charging and blink when fully charged.
3 Status Indicato r. LED will light steadily when abnormal condit ion is detected.
The unit is operating normally when light is off.
4 Power Indicator. LED will blink in a heartbeat fashio n (once pe r second) when
the unit is operating normally.
5 On/Off Power Button. Push for on, push for off.
1-8
Find Quality Products Online at: sales@GlobalTestSupply.com
www.GlobalTestSupply.com
Page 23

CH 1/ Getting Started
Rear view
The rear view shows the battery compartment and the easel studs to mount the unit to
desired angular position for use on a flat surface or to hang from a panel.
1-9
Find Quality Products Online at: sales@GlobalTestSupply.com
www.GlobalTestSupply.com
Page 24

Upgrading Firmware from a Data Card
Upgrading Firmware from a Data Card
Energy Platform
firmware web
upgrade
Copy firmware
program in data
card
Users can upgrade the Energy Platform internal program by downloading the latest
firmware update release from the web and installing it into the Energy Platform internal
memory. Refer to the instructions below on how to upgrade the Energy Platform
firmware.
Firmware upgrades for the Energy Platform can be downloaded from the
Dranetz
information on Energy Platform firmware update releases.
The procedure below specifies how to download the latest Energy Platform firmware
from the web and copy it into a data card.
website. Log on to www.dranetz.com for the lat est
Step Action
1 Locate the latest version of the firmware upgrade (in data file format
“hostcode.bin”) from the Dranetz
Dranetz
regarding Energy Platform firmware upgrade releases.
2 Format the Compact Flash data card using the Memory Card options in
Energy Platform. The card must be formatted before it can be written to.
Refer to Chapter 5 Start Menu - Site Name/Memory Card for instructions
on how to format data card.
regularly posts the latest information and instructions
website www.dranetz.com.
NOTE: All data and setups stored in card will be lost when you format
the data card. Copy any files that you want to save to a computer first
before formatting card.
3 Insert the Compact Flash data card into the appropriate slot in the
computer. If the computer does not accommodate a Compact Flash card
in its native format, use a compatible PC card adapter to be able to read/
write data into the card.
4 Download and copy the latest version of the Energy Platform firmware
upgrade program (data file “hostcode.bin”) from the Dranetz
website to the data card.
Refer to page 1-11 for instructions on how to install the data card
containing the latest firmware upgrade to the Energy Platform.
1-10
Find Quality Products Online at: sales@GlobalTestSupply.com
www.GlobalTestSupply.com
Page 25

CH 1/ Getting Started
Install data card
to Energy
Platform
The proce dure below sp ecifies how to install the data card contain ing the latest
firmware upgrade to the Energy Platform.
Step Action
1 Make sure that the unit is off. If not, press the Energy Platform On/Off
power button to turn unit off.
2 Remove the data card from its protective holder and check that the plug
end of card is clean and free of any obstruction.
NOTE: If plug end of card is dirty, clean with static-free, dry , low pr essure
air to remove any foreign material causing obstruction of the plug holes.
3 At the bottom of the unit, position the data card with the label facing up
and the plug end facing the Data Card Slot.
4 Insert the card fully into the data card slot until resistance is felt, then
press firmly until card engagement is felt.
NOTE: Do not force the card further into the slot if no card engage ment is
felt. Remove card and che ck if ther e is fore ign object on or in the plug end
of the card. Remove any obstruction. Reinsert program card and repeat
card engagement. If card cannot be engaged, STOP all further action and
call Dranetz
Technical Support at 1-800-372-6832 for assistance.
5 Turn the unit on by pushing the on/off button. The loader should display
“Booting from program card ”. If not, call Dranet z
for assistance.
6 The instrument will prompt the user to verify whether or not to upgrade
the firmware. Press Yes and the upgrade procedure will commence. Do
not turn the power of f nor remove the data card whil e firmware upg rade is
in progress.
7 If no errors were detected, a window displaying “Installation Complete”
will pop up. Remove the data card from the unit.
T echnical Suppo rt
1-11
Find Quality Products Online at: sales@GlobalTestSupply.com
www.GlobalTestSupply.com
Page 26

Energy Platform Features
Energy Platform Features
Touch screen
function
Scope mode
Meter mode
Harmonics
All Energy Platform functions described below are operable using a color LCD touch
screen technology. Users may use a finger and/or a PDA stylus to app ly p res sur e t o t he
LCD screen to result in touch screen recognition. The touch screen display is also
workable with line man gl ove s on. T ouc h screen buttons will appear in reverse-video to
show visual feedback of contact along with audi ble fe edback. In order to reduce power
consumption, the backlight of the LCD screen times-out after a specified
programmable time of no user activity. The backlight reactivates by touching any part
of the screen.
Scope mode functions as an oscilloscope, displaying real-time waveforms of voltage
and current for up to eight channels simultaneously, with one second update rate. The
colors of waveform dis play are user pr ogrammable. Scope mode al so provi des a te xtual
display of rms values, division for axis values, and frequency.
Meter mode functions as a true rms voltmeter and a true rms clamp-on ammeter.
Voltage and current measurements, along with other calculated parameters, are
displayed on the Meter mode screens in both textual and graphical format.
Harmonics display the amplitude and phase of each harmonic to the 63rd harmonic in
both graphical and textual format.
Phasor diagram
Event
The phasor screen displays a graph that indicates phase relations between voltage and
current based upon the angles at the fundamental frequency, as determined by Fourier
analysis. Phasor diagram displays voltage and current phasors for all channels.
Functioning as a phase angle meter, the unit can display system imbalance conditions
and provides such information in textual form also. The phase angle display can also
verify if monitoring connections have been made correctly. Animated phasor demo
rotations demonstrating resistive, inductive and capacitive loads can be displayed.
Energy Platform features an Event List screen which shows a summary of all captured
events in the order that they occurred. An event occurs when a programmed threshold
limit is crossed. Energy Plat form is able to record three typ es of events namely sag,
swell or aggregate snapshot.
Continued on next page
1-12
Find Quality Products Online at: sales@GlobalTestSupply.com
www.GlobalTestSupply.com
Page 27

CH 1/ Getting Started
Monitoring
capacity
Automatic
setup, Wizard
setup, or
Advanced setup
Trend
The Energy Platform can monitor the following power configurations:
• Single Phase • 3 Phase 2-Watt Meter Delta
• Split Phase • 2 1/2 Element without V
• 3 Phase Wye • 2 1/2 Element without V
B
C
While monitoring any of the above configurations, the Energy Platform can also be
connected to monitor neutral to ground voltage and neutral or ground current, where
applicable.
Setup is a configuration of parameter thresholds that control the data recorded by the
Energy Plat form. Users ma y perform instrument setup in three ways: v ia Automatic
Setup which utilizes au to- configured settings and all ows us er s to proceed directly with
data monitoring; via Wizard Setup which follows a step-by-step sequence where users
go through a series of circuit setup screens; or via Advanced setup which allows users
to modify trigger parameters and intervals or tweak threshold settings under the
Advanced Options.
Users can generate plots for all journalled data combined with min/max recordings of
that parameter. Most journal parameters have multiple channels to plot.
Reports
Data Card
Energy Platfor m featu re s a summar y repor t for Demand and Energy parameters in easy
to read format. The data is displayed via the report panels. The panel is color coded
such that green indicates the parameter is within limits, yellow means parameter is
moderately out of limits, while red means parameter severely exceeds the monitoring
limits.
Energy Platform supports the use of Compact Flash data card with part number
CFDATA-DB. The user replaceable data card is used as primary storage for data. Data
monitoring CANNOT proceed without the data card. The Energy Platform is designed
to accommodate the Compact Flash card in its native format, and does not require the
use of a PC card adapter. However, a PC card adapter can be used to read the da ta into a
laptop or other computer with a PC card slot.
1-13
Find Quality Products Online at: sales@GlobalTestSupply.com
www.GlobalTestSupply.com
Page 28

Basic Operation
Basic Operation
Introduction
Battery pack
The normal power source for the Energy Platform is its internal battery pack. The AC
Adapter/Battery Charger is used to charge the battery. Always charge the battery fully
before use. The Energy Platform will always operate on the charger and is designed to
do so, regardless of the state of charge of the battery.
Type:
Sealed, rechargeable NiMH (Nickel Metal Hydride) cells.
Length of operation
for more than two (2) h ours wi th t he bac klight on. Whe n the ba cklig ht is tur ned off, the
unit can operate f or more t han three (3) h ours. For i nformati on on ho w to turn backli ght
on or off, see Chapter 4 Instrument Settings - Set Display Preferences.
Charging
Charger to the Energy Platform. A screen warning will appear during operation when
battery charg e is low. A depleted battery pack can be rec har ged in six ( 6) hours whet her
the unit is on or off. The Battery Charge Indicator glows steadily while charging, and
flashes when fully charged.
NOTE: The Battery Charge Indicator functions whenever the AC Adapter/Battery
Charger is properly connected.
: The battery pack can be charged by connecting the AC Adapter/Battery
: The Energy Platform can operate on a fully charged battery pack
AC power
source
The Energy Platform can be operated from a 50/60 Hz 120/230V AC power source
with or without the battery pack installed.
Connect the AC Adapter output cable to the Input Connector on the right side of the
Energy Platform. Connect the AC Adapter power cord to an appropriate outlet.
Refer to Appendix C for the specifications and replacement of the batteries contained
in Energy Pl atform.
1-14
Find Quality Products Online at: sales@GlobalTestSupply.com
www.GlobalTestSupply.com
Page 29

CH 1/ Getting Started
Power on
sequence
Follow these steps to turn on the Energy Platform and display the Home screen.
Step Action
1 Connect ac adapter/battery charger plug into the right side of Energy Platform.
2 Plug the ac adapter into an ac power source.
3 Press the Energy Platform On/Off power button to turn the unit on.
Result
: The Home screen will be displayed.
EP001
Home screen
features
Home screen is frequently referenced as the starting point for all major functionalities
of the Energy Platform.
The date and time appear on the top right corner of the Home screen. Both can be
configured to appear i n a dif fe rent format . See pag e 4- 3 for the pr ocedur e on how to set
and reformat time and date.
The unit name and model, Ener gy Platform program revision l evel, and stat us messages
appear in the upper portio n of the Ho me screen. Pertinent informat ion that appear in the
status message area are the monitoring status, circuit configuration, percentage of data
card used while monitoring, site/file name, number of event cycles saved, and number
of timed intervals saved.
MONITORING STATUS: OFF i ndicates that the instrument is not actively
monitoring data. The monitoring status message will change to ON, DONE or
ARMED, depending upon the state of data monitoring. See page 5-25 for the
procedure on how to turn monitoring on/off.
Home screen contains the icons used to access the various Energy Platform functions.
See page 1-16 for the description of each icon found in Home screen.
1-15
Find Quality Products Online at: sales@GlobalTestSupply.com
www.GlobalTestSupply.com
Page 30

Basic Operation, continued
Home screen
icons
Home screen contains the following icons used to access various Energy Platform
functions:
- Scope mode shows real-time voltage and current waveforms of the signals on
Scope
the measuring inputs. See Chapter 3 View Real Time Data - Section A Scope Mode.
- Meter mode displays voltage and current measurements, along with other
Meter
calculated parameters. See Chapter 3 View Real Time Data - Section B Meter Mode.
Harmonics
amplitude and phase of each voltage and current harmonic to the 63rd harmonic. See
Chapter 3 View Real Time Data - Section C Harmonics.
Phasor
upon the angles of the fundamental. See Chapter 3 View Real Time Data - Section D
Voltage and Current Phasor.
Preferences
feedback, language selection, communications, LCD display, and data card operation.
See Chapter 4 Instrument Settings.
Events
a stored file from the data card. See Chapter 7 View Event Data - Section A Event List.
- Harmonic screen displ ays a spec tral gra ph and textua l matrix fe aturing t he
- Phasor diagrams indicate phase relations between voltage and current based
- Users can set instrument preferences like time and date, threshold alarm
- Events are displayed only af ter monitor ing has bee n turned on or upon read ing
- Trend allows users to view plots of journalled data along with min/max
Trend
measurements over the interval. See Chapter 7 View Event Data - Section B Trend.
Reports
report panels. The color coded panel indicates whether or not a parameter is within
limits. See Chapter 8 Reports.
Start/Setup
data monitoring or they can configure the instrument step-by-step using the Wizard
Setup. Users can also do a dva nced setups to modify trigger parameters and interval s or
tweak threshold settings under the Advanced Setup Opt ion s. Se e Chapter 5 Start Menu
and Chapter 6 Advanced Setup Options.
- The Energy Platform allows users to view Demand or Energy status via the
- Users have the option to use Automatic Setup and proceed directly with
1-16
Find Quality Products Online at: sales@GlobalTestSupply.com
www.GlobalTestSupply.com
Page 31

CHAPTER 2
Voltage Measurement Cable and Current Probe Connections
Overview
Introduction
In this chap ter
WARNING Death, serious injury, or fire haza rd could r esult fr om impr oper connect ion of this
This section describes how to connect the Energy Platform to make basic single phase
voltage measurements. For multi-phase connection diagrams, refer to Appendix E.
The following topics are covered in this c
Topic See Page
Connecting Voltage Measurement Cables 2-4
Connecting Current Probes 2-9
instrument. Read and understand this manual before connecting this instrument.
Follow all installation and operating instructions while using this instrument.
Connection of this instrument must be performed i n compliance wi th the National
Electrical Code (ANSI/NFPA 70-2008) and any additional safety requirements
applicable to your installation.
Installation, operation, and maint enance of this ins trument must be perfor med by
qualified personnel only. The National Electrical Code defines a qualified person
as “one who has the skills and knowledge related to the construction and
operation of the electrical equipment and installations, and who has received
safety training on the hazards involved.”
hapter.
Qualified personnel who work on or near exposed energized electric al c onductors
must follow applicable safety related work practices and procedures including
appropriate personal protective equipment in compliance with the Standard for
Electrical Safety Requ ireme nts for Employe e W orkplac es (ANSI/NFPA 70E-2009)
of USA and any additional workplace safety requirements applicable to your
installation.
Continued on next page
2-1
Find Quality Products Online at: sales@GlobalTestSupply.com
www.GlobalTestSupply.com
Page 32

Overview, continued
ADVERTENCIA
Una conexión incorrecta de este instrumento puede producir la muerte, lesiones
graves y riesgo de incendio. Lea y enti enda este manual antes de conectar. Observe
todas las instrucciones de instalación y operación durante el uso de este
instrumento.
La conexión de este instrumento debe ser hecha de acuerdo con las normas del
Código Eléctrico Nacional (ANSI/NFPA 70-2008) de EE. UU., además de
cualquier otra norma de seguridad correspondiente a su establecimiento.
La instalación, operación y mantenimiento de este instrument o de be s er realizada
por personal calificado solamente. El Código Eléctrico Nacional define a una
persona calificada como “una que esté familiarizada con la construcción y
operación del equipo y con los riesgos involucrados.”
El personal cualificado que trabaja encendido o acerca a los conductores
eléctricos energizados expuestos debe seguir prácticas y procedimientos
relacionados seguridad aplicable del trabajo incluyendo el equipo protector
personal apropiado en conformidad con el estándar para los requisitos de
seguridad eléctricos para los lugares de trabajo del empleado (ANSI/NFPA 70E-
2009) de los E.E.U.U. y cualquier requisito de seguridad adicional del lugar de
trabajo aplicable a su instalación.
AVERTISSEMENT
Si l'instrument est mal connecté, la mort, des blessures graves, ou un danger
d'incendie peuvent s'en suivre. Lisez attentivement ce manuel avant de connecter
l'instrument. Lorsque vous utilisez l'instrument, suivez toutes les instructions
d'installation et de service.
Cet instrument doit être connecté conformément au National Electrical Code
(ANSI/NFPA 70-2008) des Etats-Unis et à toutes les exigences de sécurité
applicables à votre installation.
Cet instrument doit être inst allé, util isé et entre tenu uniquement par un perso nnel
qualifié. Selon le National Electrical Code, une personne est qualifiée si “elle
connaît bien la construction et l'utilisation de l'équipement, ainsi que les dangers
que cela implique.”
Le personnel qualifié qui travaillent dessus ou s'approchent des conducteurs
électriques activés exposés doit suivre des pratiques en matière et des procédures
reliées par sûreté applicable de travail comprenant le matériel de protection
personnel approprié conformément à la norme pour des conditions de sûreté
électriques pour les lieux de travail des employés (ANSI/NFPA 70E-2009) des
Etats-Unis et toutes les conditions de sûreté additionnelles de lieu de travail
applicables à votre installation.
2-2
Find Quality Products Online at: sales@GlobalTestSupply.com
www.GlobalTestSupply.com
Page 33

CH 2/ Voltage Measurement Cables and Current Probe Connections
WARNUNG Der falsche Anschluß dieses Gerätes kann Tod, schwere Verletzungen oder Feuer
verursachen. Bevor Sie dieses Instrument anschließen, müssen Sie die Anleitung
lesen und verstanden haben . Bei der Verwendung dieses Instrument s müss en al le
Installation- und Betriebsanweisungen beachtet werden.
Der Anschluß dieses Instruments muß in Übereinstimmung mit den nationalen
Bestimmungen für Elektrizität (ANSI/NFPA 70-2008) der Vereinigten Staaten,
sowie allen weiteren, in Ihrem Fall anwendbaren Sicherheitsbestimmungen,
vorgenommen werden.
Installation, Betrieb und Wartung dieses Instruments dürfen nur von
Fachpersonal durchgeführt werden. In dem nationalen Bestimmungen für
Elektrizität wird ein Fachmann als eine Person bezeichnet, welche “mit der
Bauweise und dem Betrieb des Gerätes sowie den dazugehörigen Gefahren
vertraut ist.”
Qualifiziertes Personal, das an bearbeiten oder herausgestellte angezogene
elektrische Leiter sich nähern, muß anwendbare Sicherheit bezogener Arbeit
Praxis und Verfahren einschließlich passende p ers önl iche schützende Ausrüstung
gemäß dem Standard für elektrische Sicherheitsauflagen für AngestelltArbeitsplätze (ANSI/NFPA 70E-2009) der Vereinigten Staaten und alle
zusätzlichen Arbeitsplatzsicherheitsauflagen folgen, die auf Ihre Installation
anwendbar sind.
Safety
precautions
The following safety precautions must be followed whenever any type of voltage or
current connection is being made to the Energy Platform.
• Wear proper Personal Protective Equipment, including safety glasses and insulated
gloves when making connections to power circuits.
• Hands, shoes and floor must be dry when making any connection to a power line.
• Before each use, inspect all cables for breaks or cracks in the insulation. Replace
immediately if defective.
• Set the Energy Platform On/Off power button to Off.
• Before connecting to electric circuits to be monitored, open their related circuit
breakers or disconnects. DO NOT install any connection of the Energy Platform to
live power lines.
• Connections must be made to the Ener g y Plat form fi rst, th en con nect to the ci rcuit to
be monitored.
• If the equipment is used in a manner not specified in this use r’s guide, the protecti on
provided by the equipment may be impaired. These safety precautions are repeated
where appropriate throughout this manual.
Continued on next page
2-3
Find Quality Products Online at: sales@GlobalTestSupply.com
www.GlobalTestSupply.com
Page 34

Connecting Voltage Measurement Cables
Connecting Voltage Measurement Cables
Measurement
cable set
Optional fused
voltage adapter
Description
stored in a cable pouch as part of the measurement cable set, P/N 116042-G6. Each
cable set c onsists of a cable and alligat or clip.
Voltage Rating
Vrms max. For measur ing vol tages gr eate r than 600 Vrms, potential transformers (PT s)
must be used.
Contents
to their actual use). A cable set consists of six, 6-foot channel measurement cable
assemblies (probes), each with a detachable, alligator jaw, safety clip assembly
(maximum jaw opening, 3/4 in (20 mm)). The safety clip assemblies are red (+) and
black (-) for each of the four channels. One cable each of red (channel A), yellow
(channel B), blue (channel C), and grey (channel D), and two each of white are
provided.
A pouch for storage of the cables and the AC ada pter/battery charge r is incl uded in the
contents of the measurement cable set, but is not shown in the figure.
There are two optional fuse accessory kits available for use with the measurement
cables. One kit (P/N FVA-1) contains one fused voltage adapter and one measurement
connecting Red cable 50 cm i n lengt h. The othe r kit ( P/N FVA-4) contains four volta ge
adapters and four measurement connecting cables 50 cm in length (one Red, one
Yellow, one Blue, and one Grey).
: Voltage measurement cables are provided as standard accessories and are
: Direct connection of all voltage measurement cables are rated at 600
: The voltage measurement cables are shown on page 2-5 (positioned relative
2-4
The single fuse voltage adapter kit is used for one single voltage measurement input.
While the four fuse voltage adapter kit is used for a three phase and neutral voltage
measurement inputs.
Continued on next page
Find Quality Products Online at: sales@GlobalTestSupply.com
www.GlobalTestSupply.com
Page 35

Measurement
cable set w ith
optional fuse
diagram
CH 2/ Voltage Measurement Cables and Current Probe Connections
WARNING
WARNING
WARNING
WARNING
EP-11.vsd
To avoid the risk of electric shock or burns, always connect the safety (or earth)
ground before making any other connections.
To reduce the risk of fire, electrical shock, or physical injury it is strongly
recommended to fuse the voltage measurement inputs.
Fuses must be located as close to the load as possible to maximize protection.
For continued protection against risk of fire or shock hazard replace only with
same type and rating of recommended fuse.
Use only fast blow type fuse which is rated 600V. Recommended fuse type is
Littelfuse, part number KLKD0.30 rated 600V AC/DC, 0.3A fast blow.
Do not replace fuse again if failure is repeated. Repeated failure indicates a
defective condition that will not clear with replacement of the fuse. Refer
condition to a qualified technician.
Contact Dranetz Customer Service for more information on the fused voltage
adapter. Refer to Dranetz
Information Sheet titled Model FVA - Fuse Voltage
Adapter, P/N 899107 .
2-5
Find Quality Products Online at: sales@GlobalTestSupply.com
www.GlobalTestSupply.com
Page 36

Connecting Voltage Measurement Cables, continued
Connection
guidelines
Example: Single
phase
connection
Follow these guidelines when making voltage connections.
• Refer to the measurement cable set figure for color coding of probes that connect to
input channel connectors A, B, C, and D.
• Channel D input has plus (+) and minus (-) differential inputs. All voltage inputs
have a range of 1 to 600 Vrms max.
The following figure shows a voltage connection to a single phase circuit for channel
A.
EP-12.vsd
Continued on next page
2-6
Find Quality Products Online at: sales@GlobalTestSupply.com
www.GlobalTestSupply.com
Page 37

CH 2/ Voltage Measurement Cables and Current Probe Connections
Example:
Neutral to
ground
connection
The following figure shows a vo ltage connecti on using channel D as a dif ferenti al input
for measuring neutral to ground voltage. Connections are identical for split phase and
wye configurations. One probe connects the source neutral line to the D+ input.
Another probe connects the ground to the D- input.
EP-13.vsd
2-7
Find Quality Products Online at: sales@GlobalTestSupply.com
www.GlobalTestSupply.com
Page 38

Connecting Voltage Measurement Cables, continued
Safety
precautions
WARNING
ADVERTENCIA
AVERTISSEMENT
The following safety precautions apply to current probe connections in addition to
those safety precautions stated on page 2-3.
• DO NOT attempt to measure current in any circuit in which the circuit to ground
voltage exceeds the insulation rating of the current probe (600 Vrms max).
• Make sure the jaws of the current probe are tightly closed. Keep mating surfaces
clean and free from foreign matter.
DO NOT USE non-insulated current probe cores around a non-insulated wire.
Probes of this type are designed for use around insulated wires only. Use only
completely insulated probe cores with no exposed conductive areas of the core
around non-insulated wires.
NO UTILIZAR transformadores de corriente sin material aislante al rededor de
conductores sin material aislante. Los Transformadores de corriente de este tipo
están diseñados para ser utilizados solamente con conductores con aislamiento
eléctrico. Utilizar transformadores de corriente completamente aislados
alrededor de conductores sin aislamiento.
N'EMPLOYEZ PAS les noyaux courants non-isolés de sonde autour d'un fil nonisolé. Des sondes de ce type sont concues pour l'usage autour des fils isolés
seulement. L'utilisatio n seul ement a compl ét ement iso lé des noyaux de sonde sans
des secteurs conducteurs exposés du noyau autour des fils non-isolés.
WARNU NG
VERWENDEN Sie keine Stromzangen mit nicht isolierten Ferritkernen bei
Messungen an nicht isolierten Leitungen. Stromzangen dieses Typs sind nur für
Messungen an isolierten Leitern geeignet. Bitte verwenden Sie zur Messung an
nicht isolierten Leitungen Stromzangen mit vollständig isoliertem Kernmaterial.
Continued on next page
2-8
Find Quality Products Online at: sales@GlobalTestSupply.com
www.GlobalTestSupply.com
Page 39

Connecting Current Probes
CH 2/ Voltage Measurement Cables and Current Probe Connections
Current probes
Several Dranetz
current probes are illustrated on page 2-10. Refer to Appendix A for descriptions and
part numbers of probes and adapter cables. Refer to Appendix B for specifications of
current probe models TR2500, TR2510, DRANFLEX 3000XL/6000XL, and
DRANFLEX 3003XL/6003XL.
Probe positioning
position the probe with the arrow pointing towards the load when monitoring the line
conductor. Correct position of the probe is necessary for correct power measurements,
where in-phase voltage and current measurements are necessary. A positive watts
reading indicates that the probe is pointed towards the load, and a negative reading
indicates that the probe is pointed towards the source.
current probes can be used with the Energy Platform. Typical
: An arrow marking on the handle is a guide to ensure that you
Continued on next page
2-9
Find Quality Products Online at: sales@GlobalTestSupply.com
www.GlobalTestSupply.com
Page 40

Connecting Current Probes, continued
Typical current
probes
EP-14.vsd
NOTE: Current probes TR2500 can be used interchangeably with TR2500A, TR2510
with TR2510A, and TR2520 with TR2520A.
Continued on next page
2-10
Find Quality Products Online at: sales@GlobalTestSupply.com
www.GlobalTestSupply.com
Page 41

CH 2/ Voltage Measurement Cables and Current Probe Connections
Typical current
probes
(continued)
Actual photos of TR series probes and part numbers are shown below to aid users in
probe identification. Contact Dranetz
Customer Service Department for more
information on current probes, pricing and availability.
P/N TR-2500
P/N TR-2510 P/N TR-2520
P/N TR-2500A P/N TR-2510A P/N TR-2520A
Continued on next page
2-11
Find Quality Products Online at: sales@GlobalTestSupply.com
www.GlobalTestSupply.com
Page 42

Connecting Current Probes, continued
Typical current
probes
(continued)
Photos of DRANFLEX probes are also shown below. These types of probes are
available in lengths of 24, 36 and 48 inches and in two maximum ranges of 3000A
RMS and 6000A RMS. Contact Dranetz
information on current probes, pricing and availability.
DRANFLEX Current Probes
DRANFLEX 3000XL/6000XL current probes al low current meas urements in the range
of 0.5 to 3000 A full scale, or 0.5 to 6000 A full scale. Available in three sizes: 24”
probe length - c onductor( s) up to 8” diameter; 36” probe le ngth - c onducto r(s) up to 11”
diameter; 48” probe length - conductor(s) up to 17” diameter.
Customer Service Department for more
P/N 3000XL/24 (24” probe length)
DRANFLEX 3-Phase Cu rrent Probes
DRANFLEX 3003XL/6003XL are 3-Phase current probes that allow current
measurements in 3 Pha se ci rcuit s in the range of 0 .5 t o 3000 A full scal e, or 0.5 to 6000
A full scale. Available in three size s: 24 ” p robe length - conduc tor( s) up t o 8” d iame ter;
36” probe length - conductor(s) up to 11” diameter; 48” probe length - conductor(s) up
to 17” diameter.
P/N 3003XL/24 (24” probe length)
2-12
Find Quality Products Online at: sales@GlobalTestSupply.com
www.GlobalTestSupply.com
Page 43

CH 2/ Voltage Measurement Cables and Current Probe Connections
Single phase
current probe
connection
example
The following figure shows how to connect a current probe to channel A for current
monitoring of a single phase line.
The current probe may be connected to the return line if desired to measure the return
current when checking for load current leakage, loop current relationships, etc. If
measuring power, position the probe with the arrow pointing towards the load.
EP-15.vsd
NOTE: The connection shown above is not recommended withou t a voltage connec tion
to ensure frequency synchronization. If this configuration is used, then an internal
frequency reference must be entered. Refer to pages 5-14 to 5-16.
2-13
Find Quality Products Online at: sales@GlobalTestSupply.com
www.GlobalTestSupply.com
Page 44

This page intentionally left blank.
2-14
Find Quality Products Online at: sales@GlobalTestSupply.com
www.GlobalTestSupply.com
Page 45

Overview
CHAPTER 3
View Real Time Data
Introduction
Access to real
time data
The Energy Platform allows users to view demand/energy quality phenomena as it
happens, when it happens. The instrument is able to capture and process data in real
time, and allows users to view it in Scope mode, Meter mode, Harmonics, and Phasor
display.
Icons for Scope mode, Meter mode, Harmonics and Phasor displ ay are avail abl e in the
Home screen. Follow these steps to display the Home screen.
Action... Result...
STEP 1: Press the Energy
Platform On/Off power button
to turn the unit on. The Home
screen will be displayed.
EP001
In this chap ter
Find Quality Products Online at: sales@GlobalTestSupply.com
This chapter is divided into four sections.
Section Title See Page
A Scope Mode 3-2
B Meter Mode 3-5
C Harmonics 3-12
D Voltage and Current Phasor 3-18
3-1
www.GlobalTestSupply.com
Page 46

Overview
Overview
Section A
Scope Mode
Introduction
Scope mode
screen
Scope mode allows you to view real-time voltage and current waveforms for up to
eight channels simultaneously.
The Scope mode screen can be displayed by pressing the Scope key on the Home
screen.
Volts/Amps
channel labels
and RMS values
for displayed
waveforms
Frequency
Voltage scale Current scale
MARK201
Turn channels on/off
(p. 3-3)
Show channels input
range (p. 3-4)
Return to Home screen
Display one cycle
of selected
waveforms which
are scaled relative
to the largest peak
value. V & I are
scaled separately.
In this section
The following topics are covered in this section.
Topic See Page
Turning Channels On/Off 3-3
Checking Input Range 3-4
3-2
Find Quality Products Online at: sales@GlobalTestSupply.com
www.GlobalTestSupply.com
Page 47

Turning Channels On/Off
CH 3/ View Real Time Dat a
Select channels
to display
From the Scope mode screen, press Chan to turn Volts/Amps channel selection on/off.
MARK202
Any of the following will turn channels on/off:
• Press the desired Volts/Amps channel to turn it on/off.
• Press Volts or Amps button to turn on/off all channels of that parameter.
• Press A, B, C, D to turn on/off both the Volts and Amps for that channel.
Press OK to accept channel selection.
3-3
Find Quality Products Online at: sales@GlobalTestSupply.com
www.GlobalTestSupply.com
Page 48

Checking Input Range
Checking Input Range
Input range
Input range
description
The Input Range screen is displayed by pressing the CkRng key on the Scope mode
screen. Input Range shows the detected range for all channels. The number after the
status shows the percentage of the input of the instrument’s full range.
MARK205
The input range can only be viewed, not changed. Press OK when done viewing the
input range.
The following table describes the messages that may register on the Input Range
screen. The instrument is able to det ect the inpu t range for vol tage and cur rent cha nnels
A, B, C, and D.
3-4
Input Range Description
OK Within Range
OVER Over Range
UNDER Under Range
N/A Channel Disabled
CLIP Clipping
If input range is OVER, UNDER, or CLIP, then the rms readings will not be accurate.
Using CTs below 10% of Full Scale may also cause inaccuracies in amplitude, phase
and harmonic distortion readings.
Find Quality Products Online at: sales@GlobalTestSupply.com
www.GlobalTestSupply.com
Page 49

Overview
Section B
Meter Mode
CH 3/ View Real Time Dat a
Introduction
Metered
parameters
display
In this section
Meter mode allows you to vi ew real-t ime meter da ta. The met ered parame ters ava ilable
are logically separated into Standard, Distortion and Advanced tabs. Meter screens are
displayed in tabular form.
NOTE: Meter mode operation does not interfere with any of Energy Platform’s other
monitoring or recording functions. The individual voltage and current channel meter
readings are not affected by the monitoring setup. Turning monitoring of individual
channels off does not affect meter readings. Meter and Scope data is NOT available if
you are viewing a stored file from the data card.
The Energy Platform is designed to provide setup as well as data display. Metered
parameters are available for display regardle ss i f t h ey are being journalled under Setup
New Circuit > Advanced Options > Jo urnal Limit Set up. Users can tre nd journal entr ies
by limits (Very High, High, Low, Very Low) or by time (users can set the time interval
of how often rms and wave for m sn apshots will be recorded ev en when no disturbances
occur). For the procedur e on how to set entri es under jo urnal pa ramete rs , go to Chapte r
6 Advanced Setup Options - Journal Limit.
The following topics are covered in this section.
Topic See Page
Standard Meter Tab 3-6
Distortion Meter Tab 3-8
Advanced Meter Tab 3-10
3-5
Find Quality Products Online at: sales@GlobalTestSupply.com
www.GlobalTestSupply.com
Page 50

Standard Me ter Tab
St andard Meter Tab
Standard meter
list
Meter mode can be displayed by pressing the Meter icon on the Home screen. At startup, meter mode defaults in the Standard tab featuring the basic power quality
parameters available . The stand ard met ering proper ti es in clude Basi c Voltage & Amps,
Computed Basic, Power , Demand, Ener gy, Harmonics, and Advanced Ener gy as shown
below.
EP301
Standard Tab Parameter Name Label
Basic
(for A, B, C, D)
Vol ts
NOTE: Som e voltage channel meter
Vol ts
values are derived based on the
circuit type selection. The values
will change depending on the wiring
configuration setup.
Ampere Amps
Computed
Basic
Vector Displacement Power Factor Vector Displacement PF
Arithmetic Displaceme nt Power
Factor
Arithmetic Displacement
PF
Residual Current Residual Current
Net Current Net Current
Power
(for A, B, C, D,
Watts W
Vol ts Amp ere VA
Total)
Volts Ampere Reactive VAR
True Power Factor TPF
Displacement Power Factor DPF
NOTE: See Appendix B Technic al Specifi cations - Compu ted Parameters f or definit ion
of parameters.
Continued on next page
3-6
Find Quality Products Online at: sales@GlobalTestSupply.com
www.GlobalTestSupply.com
Page 51

Standard meter
list (continued)
CH 3/ View Real Time Dat a
Standard Tab Parameter Name Label
Demand Active Power Demand Active Power Demand
Apparent Power Demand Apparent Power Demand
Reactive Power Demand Reactive Power Demand
RMS Current Demand Phase A RMS Current Demand Ph A
RMS Current Demand Phase B RMS Current Demand Ph B
RMS Current Demand Phase C RMS Current Demand Ph C
RMS Current Demand Average RMS Current Demand Avg
Energy
(for A, B, C, D,
Total)
Harmonics
(for A, B, C, D)
Advanced
Energy (for A,
B, C, D, Total)
Watt Hours Watt Hrs
Volts Amper e Hours VA Hrs
Volts Ampere Reactive Hours VAR Hrs
Voltage Total Harmonic Distortion V THD
Current Total Harmonic Distortion I THD
Harmonic Power Unsigned Harm Pwr Unsigned
Forward Fundamental Frequency
Watt Hours
Forward Fundamental Frequency
Volts Ampere Reactive Hours
Reverse Fundamental Frequency
Watt Hours
Reverse Fundamental Frequency
Volts Ampere Reactive Hours
Fwd Whr
Fwd VAR Hr
Rev Whr
Rev VAR Hr
3-7
Find Quality Products Online at: sales@GlobalTestSupply.com
www.GlobalTestSupply.com
Page 52

Distortion Meter Tab
Distortion Meter Tab
Distortion meter
list
The Energy Platform is able to meter distortions or uncharacteristic changes in the
waveform of original sign als. Distor tion calc ulations measure the devi atio n of complex
waveshapes from pure sine waves. Harmonics are measured in accordance with IEC
61000-4-7 Class I.
EP311
Distortion Tab Parameter Name Label
THD
(for A, B, C, D)
Voltage Total Harmonic Distortion
Fundamental
V THD fund
TID
(for A, B, C, D)
Current Total Harmonic Distortion
Fundamental
Voltage Total Harmonic Distortion Root
Sum of Square
Current Total Harmonic Distortion Root
Sum of Square
Voltage Total Interharmonic Distortion
Fundamental
Current Total Interharmonic Distortion
Fundamental
Voltage Total Interharmonic Distortion
Root Sum of Square
Current Total Interharmonic Distortion
Root Sum of Square
I THD fund
V THD RSS
I THD RSS
V TID fund
I TID fund
V TID RSS
I TID RSS
Continued on next page
3-8
Find Quality Products Online at: sales@GlobalTestSupply.com
www.GlobalTestSupply.com
Page 53

Distortion meter
list (continued)
CH 3/ View Real Time Dat a
Distortion Tab Parameter Name Label
TIF
(for A, B, C, D)
Crest Factor
(for A, B, C, D)
Power
(for A, B, C, D)
Transformer
(for A, B, C, D)
Voltage Telephone Influence Factor
Fundamental
Current Telephone Influence Factor
Fundamental
Voltage Telephone Influence Factor
RMS
Current Telephone Influence Factor
RMS
Telephone Influence Factor Product TIF Prod
Vol t age Crest Factor Vol t s Crest Factor
Current Crest Factor Amps Crest Factor
Signed Phase Harmonic Power Signed
Unsigned Phase Harmonic Power Unsigned
Transfor mer Dera ting Factor Derating Factor
K Factor K Factor
V TIF fund
I TIF fund
V TIF RMS
I TIF RMS
3-9
Find Quality Products Online at: sales@GlobalTestSupply.com
www.GlobalTestSupply.com
Page 54

Advanced Meter Tab
Advanced Meter Tab
Advanced meter
list
Advanced Energy/Demand include various energy parameters on per phase and total
basis as well as in forward and reverse mode.
EP341
Advanced Tab Parameter Name Label
Peak Power Peak Watt Demand Peak Watt Demand
Peak Volts Ampere Demand Peak VA Demand
Peak Volts Ampere Reactive
Peak VAR Demand
Demand
Peak Current Demand Phase A Peak Current Dmd Ph A
Peak Current Demand Phase B Peak Current Dmd Ph B
Peak Current Demand Phase C Peak Current Dmd Ph C
Peak Current Demand Average Peak Current Demand Avg
Predicted Power Predicted Watt Demand Predicted W Demand
Predicted Volts Ampere
Predicted VA Demand
Demand
Predicted Volts Ampere
Predicted VAR Demand
Reactive Demand
Continued on next page
3-10
Find Quality Products Online at: sales@GlobalTestSupply.com
www.GlobalTestSupply.com
Page 55

Advanced
meter list
(continued)
CH 3/ View Real Time Dat a
Advanced Tab Parameter Name Label
Advanced Energy
(for A, B, C, D,
Total)
Forward Fundamental
Frequency Watt Hours
Forward Fundamental
Frequency Volts Ampere
Reactive Hours
Fwd Whr
Fwd VAR Hr
Reverse Fundamental Frequenc y
Watt Hours
Reverse Fundamental Frequenc y
Volts Ampere Reactive Hours
Rev Whr
Rev VAR Hr
3-11
Find Quality Products Online at: sales@GlobalTestSupply.com
www.GlobalTestSupply.com
Page 56

Overview
Overview
Section C
Harmonics
Harmonics
display
The Energy Platform allows users to view voltage and current harmonics/
interharmonics in graphical or in list form. Harmonics are waveform distortion, a
steady-state deviation from an ideal power frequency sinusoid and is characterized by
the spectral content of the waveform. Interharmonics are frequency components
between the harmonic frequen cies. The IEC 61000-4 -7 Sta ndard dicta tes that harmon ic
analysis is done using a synchronous window of 10 cycles for 50 Hz, or 12 cycles for
60 Hz. This results in b ins whi ch are nominal ly 5 Hz wide. The actua l widt h of t he bins
is equal to the actual freque ncy divided by 10 if the nominal frequency is 50 Hz, and 12
if 60 Hz. For example, if actually operating at 49.9 Hz, the bin is 4.99 Hz, but is
labelled “5 Hz” as specified by the standard.
Use the respective touch screen but tons to dis play the next Channe l (Channe ls A, B, C,
D) and the next Parameter (V, I, W) of harmonic data. The number of harmonics/
interharmonics displayed is up to the 60th. Summary values of odd, even and total
distortion are displayed. A summary of harmonic distortion as well as interharmonic
distortion values per phase/parameter are also available on display.
Users can determine the numbe r or ran ge of harmonic frequencies to trend and vi ew in
detail. There is also the option to select how to plot harmonic/interharmonic data and
specify the units of measure by which harmonic data is calculated.
Harmon i c Graph
Users can choose the unit of measure by which harmonic data is calculated and
graphed, based on a Per centage of the fundamental va lue or in Engineering units (volts
and amps). Frequency co mponen ts of harmonic graph s can b e disp lay ed either in Her tz
or in Harmonic Number. The graphs can be zoomed and rescaled.
: Harmonics are measured in ac cor dance with IEC 61000-4-7 Class 1.
Harmon i c L i st
measured values: f requency a nd harmonic number; magn itude in Engineeri ng units and
percent of fundamental ; ph ase in degrees (for harmonics o nly). This list is displ ayed in
order of ascending frequency, and can also be sorted in order of descending magnitude.
In this section
3-12
The following topics are covered in this section.
Harmonic Graph 3-13
Harmonic Detail 3-14
Harmonic Options 3-15
Harmonic List 3-17
Find Quality Products Online at: sales@GlobalTestSupply.com
: The list gives a textual display of the following for each of the
Topic See Page
www.GlobalTestSupply.com
Page 57

Harmonic Graph
CH 3/ View Real Time Dat a
Harmonic graph
display
Total harmonic distortion
(THD) on Odd contribution
and Even contribution
based on 127 harmonics*
The harmonic graph can be displayed by pressing Harmoni cs on the Home screen. The
screen defaults to a graphical spectrum display, although users have the option to
choose between the graph and li st form. The scree n will show a spectra l graph featuri ng
the amplitude of the harmonics relative to the fundamental frequency.
Use the properties under the Options button to select the vertical and horizontal
measurement scale. The percent magnitude of the first 60 harmonics are graphed
relative to the fundamental.
Display is
updated
approximately
once per
second
MARK221
Switch channel
display
Switch to
V, I, or W
Magnify harmonic
graph (p. 3-14)
Set harmonic options
(p. 3-15)
Show harmonics
text (p. 3-17)
*The odd contribution is the square root of the sum of the squares of the relative
amplitudes of harmonics 3, 5, and 7 through N-1, where N is a function of sampling
frequency. The even contribution is similar for harmonics 2, 4, and 6 through N. Total
value is the square root of the sum of the squares of the odd and even distortions.
3-13
Find Quality Products Online at: sales@GlobalTestSupply.com
www.GlobalTestSupply.com
Page 58

Harmonic Detail
Harmonic Detail
Harmonic detail
display
Fundamental exceeds
square so bar extends
past top
The Energy Platform allows users to determine the numbers or the range of harmonic
frequencies to trend. A blue box showing the default zoomed area appears once the
Detail button is pressed. Touch any side of the zoom box to activate the drag function.
T ouch and dr ag the si des of the zoom box to expand or nar row in on a sel ect numbe r of
harmonic/interharmonic graphs. The zoom box moves horizontally only. The vertical
scale will autoscale wh en zoomed.
NOTE: To select whether the vertical is scaled to the fundamental or the greatest
harmonic, use the Options key (see page 3-15).
touch and drag zoom box to
desired magnification scope
MARK235
MARK235b
harmonic data plot
(shown in channel color)
interharmonic data plot
(shown in gray)
MARK235c
The magnify buttons serve as zoom function keys, each of which feature a plus sign or
a minus si gn within. Press Zoom+ to display the zoomed area and view harmonic
graphs in greater detail. Users may repeatedly zoom in on a plot for up to seven (7)
levels. Press Zoom-(n) to unzoom graph display on e increment at a ti me, where n is the
counter of how many times the harmonic graphs have been magnified.
3-14
Find Quality Products Online at: sales@GlobalTestSupply.com
www.GlobalTestSupply.com
Page 59

Harmonic Options
CH 3/ View Real Time Dat a
Harmonic/
Interharmonic
data plots
The voltage and current harmonics and/or interharmonics for each phase channel can
be trended using the Options but to n. The properties specified under Harmoni c Op ti ons
apply when harmonic/interharmonic data is viewed in either graph or list form.
Properties under Show Harmonics... pertain to both the graph and the list, and
determine how the harmonics and interharmonics are used.
If Show Harmonics... only is enabled, then only the actual harmonics are shown.
If Show Harmonics... and Interharmonics is enabled, the spectrum will include all
the (nominal) 5 Hz bins, which includes the actual interharmonics as well. On the
graph, the harmonics are shown in the channel color, while interharmonics are shown
in gray color. On the text, the harmonics are shown in boldface.
If Show Harmonics... calculated including adjacent interharmonics is enabled, the
interharmonics are not explicitly shown but the harmonic values include the adjacent
interharmonic values in their calculation, as specified by IEC 61000-4-7.
The IEC 61000-4-7 Standard specifies that the interharmonic bins adjacent to the
harmonic be included in the computation of that harmonic. For example, if there was a
3rd harmonic (150 Hz) of 10%, and the value of the 145 Hz bin was 1%, and the value
of the 155 Hz bin was 2%, then the value reported in the bin labelled “150 Hz” would
also include contributions from the 145 Hz and 155 Hz bins. This would give
222
=
2110 ++
10.2%, not 10%.
The following graphs illustrate harmonic computation as per IEC 61000-4-7 Standard.
Harmonic Computation for 50 Hz
3.0%
2.5%
2.0%
1.5%
1.0%
0.5%
0.0%
… 130 135 140 145 150 155 160 165 170 175 180 185 190 195 200 205 210 215 220 …
3rd harmonic
+
2 adjacent
interharmonics
4th harmonic
+
2 adjacent
interharmonics
Continued on next page
3-15
Find Quality Products Online at: sales@GlobalTestSupply.com
www.GlobalTestSupply.com
Page 60

Harmonic Options, continued
Harmonic/
Interharmonic
data plots
(continued)
Harmonic Computation for 60 Hz
The 5 Hz bins adjacent to the harmonic bin are grouped together for the harmonic
magnitude. For example, at 60 Hz, 175+180+185 bins form the 3rd harmonic. All of
the rest of the 5 Hz bins in between such are used to compute the interharmonic
magnitude.
3.0%
2.5%
2.0%
1.5%
1.0%
0.5%
0.0%
… 160 165 170 175 180 185 190 195 200 205 210 215 220 225 230 235 240 245 250 …
3rd harmonic
+
2 adjacent
interharmonics
4th harmonic
+
2 adjacent
interharmonics
Properties under Graph Uni ts pertain to the wa y the graph (not the li st) is labelle d. The
vertical scale can be in Percent or Engineering units, and Scale to Fund (full scale)
can be chosen to be the fundamental at 100% or the largest component. The
engineering unit f or vol tage is volts and for cur re n t is amperes. The horizontal ax is can
be in Hz or Harmonic Number.
3-16
harmonic data display
measurem ent scale for
frequency (x axis) and
amplitude (y axis) of
harmonics
full scale graph relative to
fundamental frequency
MARK236
Find Quality Products Online at: sales@GlobalTestSupply.com
www.GlobalTestSupply.com
Page 61

Harmonic List
CH 3/ View Real Time Dat a
Harmonic text
display
To view the harmonics magnitude text display, press List from the Harmonic graph
screen on page 3-1 4. The harmon ic paramet ers dis played on list i nclude: (from le ftmost
column) the harmonic/interharmonic frequency in Hz, frequency in number, voltage
rms or maximum load o f c ur rent (depending on paramet er se lected), percent amplitude
of harmonics, and harmonic phase angle value.
By default, harmonic and interharmonic frequency values are arranged per increment
of 5Hz. Use the Sort button to organize harmonic text display according to percent
magnitude of the first 63 harmonics relative to the fundamental, followed by the
interharmonic values.
Harmonic phase degre e values from 1 to 63 a re displ ayed for voltage and cu rrent; while
phase degree values from 1 to 50 are displayed for harmonic watts. Harmonic phase
angle values can be normalized to the phase of the fundamental of the displayed
channel. Use the Norm button to show the normalized phase angle values.
Display is
updated
approximately
once per
second
MARK237
Toggle between Normal and
UnNormal phase values
MARK237b
3-17
Find Quality Products Online at: sales@GlobalTestSupply.com
www.GlobalTestSupply.com
Page 62

Overview
Overview
Section D
Voltage and Current Phasor
Phasor display
In this section
The phasor screen displays a graph that indicates the phase relations between the
voltage and current based upon the angles of the fundamentals, as determined by
Fourier analysis.
Phasor screen shows eight phasors autoscaled with zero degrees to the right (normally
channel A voltage) for clockwise rotation and with synchronized channels. Users are
allowed to display up to four channels at any one time for either volts or amps, or a
single channel for both volts and amps, depending on the phases being monitored.
A touch screen Demo button presents an animated phasor demo rotation for resistive,
capacitive and inductive loads.
The following topics are covered in this section.
Topic See Page
Phasor Screen 3-19
Phasor Rotation 3-20
Phasor Parameter/Channel Selection 3-22
3-18
Find Quality Products Online at: sales@GlobalTestSupply.com
www.GlobalTestSupply.com
Page 63

Phasor Screen
CH 3/ View Real Time Dat a
Phasor screen
display
If a channel is less than
20% of the maximum
voltage (or current), the
phasor is not displayed
The Phasor screen is displayed by pressing Phasor on the Home screen.
The Phasor screen shows eight phasors autoscaled with zero degree to the right for
clockwise rotation and with synchronized channels. The left sidebar shows rms values
for Volts/Amps for channels A, B, C and D; zero, positive and negative values for
Volts/Amps; zero, positive and negative sequence component values for Volts/Amps.
Depending on the p hases being mon itore d, u p to f our ch anne ls may be dis played at any
one time for either Volts or Amps, or a single channel for both Volts and Amps. An
arrow head and channel label are displayed on the vector.
Correct rotation is clockwise from 0
º
Sync channel is
displayed at 0
normally channel
A voltage
º -
MARK241
Show animated phasor demo rotation for Resistive,
Inductive and Capacitive loads (p. 3-20)
3-19
Find Quality Products Online at: sales@GlobalTestSupply.com
www.GlobalTestSupply.com
Page 64

Phasor Rotation
Phasor Rot a tion
Animated
phasor rotation
Sample 3-Phase,
three wire wye
rotation
Graphic illustration in the form of rotating phasors relative to the sine wave graph of a
four wire wye circuit is available by pressing the Demo button on the Phasor screen
(see page 3-19). The Demo button will be replaced by Start/Stop once phasor rotation
has been viewed. Press Start to replay animated phasor rotation. Users can choose to
Stop the phasor demo rotation at any time.
Phasor vectors are displayed using a clockwise rotation from the zero degrees
reference. Animated phasor demo for Resistive, Inductive and Capacitive loads is
available for viewing.
The following diagrams describe the positive phase rotation of voltage and current
phasors (for Resistive, Inductive and Capacitive loads) for a three phase, three wire
wye connection. An ar row he ad on th e line in dicat es dir ectio n point ing towa rd t he loa d.
Three phase vectors are
displayed as three lines, 120
degrees apart in a Resistive load
3-20
Display parameter/channel
selection (p. 3-22)
Start/Stop demo plot
waveforms as rotate
phasors; press any time
Switch phasor demo rotation between
Resistive, Inductive and Capacitive load
effects; press any time (p. 3-21)
MARK242
Return to
Phasor screen
Continued on next page
Find Quality Products Online at: sales@GlobalTestSupply.com
www.GlobalTestSupply.com
Page 65

CH 3/ View Real Time Dat a
Sample 3-Phase,
three wire wye
rotation
(continued)
The following diagrams describe the positive phase rotation of voltage and current
phasors (for Resistive, Inductive and Capacitive loads) for a three phase, three wire
wye connection. An ar row he ad on th e line in dicat es dir ectio n point ing towa rd t he loa d.
Three phase vectors are
displayed as three lines, 120
degrees apart in an Inductive
load
MARK243
Three phase vectors are
displayed as three lines, 120
degrees apart in a Capacitive
load
MARK244
Phasor
diagrams
Refer to Appendix E for the diagrams that describe the voltage and current phasors for
the standard type of power connections.
3-21
Find Quality Products Online at: sales@GlobalTestSupply.com
www.GlobalTestSupply.com
Page 66

Phasor Parameter/Channel Selection
Phasor Parameter/Channel Selection
Parameter/
Channel display
The Parameter/Channel selection screen is displayed by pressing Chan on the phasor
Demo screen. Depending on the phases being monitored, up to four channels may be
displayed at any one time for either Volts or Amps, or a single channel for both Volts
and Amps.
MARK245
Press to enable/disable t he parameter/ channel for display in the animated phasor
rotation. Any of the following will turn channels on / off:
• Press the desired Volts/Amps channel to turn it on/off.
• Press Volts or Amps button to turn on/off all channels of that parameter.
• Press A, B, C, D to turn on/off both the Volts and Amps for that channel.
Press OK to accept channel selection. The phasor Demo rotations will display the
parameters/channels enabled.
3-22
Find Quality Products Online at: sales@GlobalTestSupply.com
www.GlobalTestSupply.com
Page 67

Overview
CHAPTER 4
Instrument Settings
Introduction
In this chap ter
This chapter describes the miscellaneous tasks that users can perform to keep the
Energy Platform running efficiently. These are tasks that users might perform only
occasionally.
The following topics are covered in this chapter.
Topic See Page
Access Instrument Settings Menu 4-2
Time and Date Settings 4-3
Select Language 4-5
Set Display Preferences 4-6
Touch Screen Calibration 4-7
Turn Threshold Beeper On/Off 4-9
Communications 4-10
Data Card 4-12
Reset to Factory Configuration 4-15
4-1
Find Quality Products Online at: sales@GlobalTestSupply.com
www.GlobalTestSupply.com
Page 68

Access Instrument Settings Menu
Access Instrument Settings Menu
Preferences
menu screen
All functions in this chapter are found under the Instrument Settings menu. Follow
these steps to display the Instrument Settings menu screen.
Action... Result...
STEP 1: Press the Energy
Platform On/Off power button to
turn the unit on. The Home screen
will be displayed.
EP001
STEP 2: Press Preferences. The
Instrument Settings Setup Menu
will be displayed.
MARK151
4-2
Find Quality Products Online at: sales@GlobalTestSupply.com
www.GlobalTestSupply.com
Page 69

Time and Date Settings
CH 4/ Instrument Settings
Time and Date
display
Users have the option not only to set the exact time and date, but also to select the
format of how time and date will appear on screen.
Action... Result...
STEP 1: From the Instrument
Settings Setup Menu scr een, press
Time and D ate.
•Press Time if you want to
change the time settings.
Proceed to Step 2 on page 4-4.
•Press Date if you want to
change the date settings.
Proceed to Step 3 on page 4-4.
•Press Date Style to select the
format in which you want date
displayed on screen. View the
three different date format
selections each time you press
Date Style.
• mm/dd/yy format
• dd/mm/yy format
• yy/mm/dd format
EP152b
•Press Clock Style to select the
format in which you want time
displayed on screen. View the
three different time format
selections each time you press
Clock Style.
• analog
• digital using 1 to 12 hr
format (AM/PM)
• digital using 1 to 24 hr
format
•Press OK to accept new time/
date settings and return to
Instrument Settings menu.
•Press Cancel to discard
changes in time/date settings
and return to Instrument
Settings menu.
Continued on next page
4-3
Find Quality Products Online at: sales@GlobalTestSupply.com
www.GlobalTestSupply.com
Page 70

Time and Date Settings, continued
Time and Date
Display
(continued)
Action... Result...
STEP 2: Press the field
representing hours, minutes, and
seconds to change time settings.
Use the numeric keypad to enter
new time settings. T ime s hould be
entered in a 24-hour format
(example: 13:00:00 for 1:00 PM).
•Press OK to accept changes in
time settings.
•Press Cancel to discard
changes in time settings.
NOTE: Clock time and format
can be changed anytime
following this same procedure.
EP153
STEP 3: Press to select the month,
day, and year. Enter the year
using numbers from the keypad.
•Press OK to accept changes in
date settings.
•Press Cancel to discard
changes in date settings.
NOTE: Date settings and format
can be changed anytime
following this same procedure.
EP154
4-4
Find Quality Products Online at: sales@GlobalTestSupply.com
www.GlobalTestSupply.com
Page 71

Select Language
CH 4/ Instrument Settings
Select Language
The Energy Platform menu screens appear in the English language by default.
Action... Result...
STEP 1: From the Instrument
Settings Setup Menu scr een, press
Language.
• Check to select the desired
language in which you want
display screens to appear.
NOTE: Language options vary
depending on unit model.
US/Euro model: English,
Swedish, Spanish, German,
French, Italian, Finnish
Asian model: English, Chinese
(Simplified and Traditional),
Japanese, Korean, Thai
EP155
•Press OK to accept language
selection. The screen will
return to Instrument Settings
menu.
•Press Cancel to retain present
language.
EP155b
4-5
Find Quality Products Online at: sales@GlobalTestSupply.com
www.GlobalTestSupply.com
Page 72

Set Display Preferences
Set Display Preferences
LCD settings
User programmable settings for the LCD screen include the backlight timer, contrast,
password protect, parameter/channel colors, and touch screen calibration.
Action... Result...
STEP 1: From the Instrument
Settings Setup Menu screen, press
Display Preferences.
• Automatic backlight shutoff
timer is provided for the LCD
display. Press Backlight Timer
to automatically turn off
backlight after 1, 2, 5, 10 or 15
minutes of no user activity. Set
the Backlight Timer to Alw ay s
On if you do not want the
backlight to s hut off.
NOTE: The auto-shutoff feature
extends the life o f the batt ery and
should be duly considered.
• Press Contrast to brighten/dim
screen display to preferred
percentage.
• Press Password Protect to
enable/disable p assword log in
code to the
When password protect is
enabled and the user reactivates
the unit from auto -shutoff, the
keypad screen used to enter the
password will appear. The user
will have to enter the correct
password to continue using the
Energy Platfo rm
will appear when an incorrect
password is entered.
• Press Channel Colors to change
the color of the parameter
display. Select desired color
from a 28 color selection grid.
• Press Calibrate Touch Screen
to calibrate the u nit’s touch
screen functionalities. Proceed to
page 4-7.
• Press Exit to return to
Instrument Settings menu.
Energy Platform
. A message
.
MARK156
4-6
Find Quality Products Online at: sales@GlobalTestSupply.com
www.GlobalTestSupply.com
Page 73

Touch Screen Calibration
CH 4/ Instrument Settings
Calibration
procedure
The Energy Platf orm is able to perfor m calibr ation to ensure th e proper operati on of the
unit’s touch screen functionalities. The calibration procedure will correct the problem
of out of tolerance touch screen malfunction. Note that errors corrected by this
calibration procedure are specific only to touch screen operation.
Action... Result...
STEP 1: From the Display Setup
Menu (see page 4-6) scre en, press
Calibrate Touch Screen.Test if
touch screen recognition operates
properly by applying pressure on
the LCD screen.
•Press Clear to reset LCD
screen and delete display
markings.
•Press Calib to begin touch
screen calibration procedure.
Proceed to Step 2.
•Press Cancel to end calibrat ion
test and return to Display
Setup.
MARK164b
STEP 2: Follow the instruction
Tap Center of Target to begin
calibration. Target object X is
initially located in the lower
middle section of the screen.
• A series of screens will flash
showing movement of the
target object: from the lower
middle section to mid-right and
finally to upper left section of
the screen.
• To end touch screen
calibration, tap the center of the
target object X now located in
the upper left section of the
screen. Proceed to Step 3 on
page 4-8.
MARK164
MARK165
MARK166
Continued on next page
4-7
Find Quality Products Online at: sales@GlobalTestSupply.com
www.GlobalTestSupply.com
Page 74

Touch Screen Calibration, continued
Calibration
procedure
(continued)
Action... Result...
STEP 3: Once touch screen
calibration is done, a mess age will
appear to indicate Touch screen
was successfully calibrated.
•Press OK to continue on with
calibration test verification.
Proceed to Step 4.
STEP 4: Test if touch screen
recognition operates properly by
applying pressure on the LCD
screen.
MARK167
•Press Clear to reset LCD
screen and delete display
markings.
•Press Accept to complete the
touch screen calibration
procedure. Accepting will save
and store new touch screen
calibration data in memory.
Once the new data is stored, the
old touch screen calibrat i on
data is lost. The screen wi ll
return to the D isplay Setup
Menu.
•Press Cancel to discontinue the
touch screen calibration
procedure. Pressi ng Cancel will
retain the previous touch screen
calibration constants, no new
calibration data will be stored
in memory. The screen will
return to the D isplay Setup
menu.
MARK168
4-8
Find Quality Products Online at: sales@GlobalTestSupply.com
www.GlobalTestSupply.com
Page 75

Turn Threshold Beeper On/Off
CH 4/ Instrument Settings
Audible alarm
When set to ON, the unit will beep when threshold limits are crossed and other event
triggers occur. The beep that provides audible feedback to pressing touch screen key is
not affected by this setting.
Action... Result...
STEP 1: From the Instrument
Settings Setup Menu scr een, press
Turn Beeper On/Off.
• The unit can provide audible
alarm signals when triggered.
Press Threshold Beeper to
turn the alarm On or Off.
•Press Exit to return to
Instrument Settings menu.
MARK157
4-9
Find Quality Products Online at: sales@GlobalTestSupply.com
www.GlobalTestSupply.com
Page 76

Communications
Communications
Communication
interface setup
Communications Settings is where instrument-specific information is entered to allow
the Energy Platform to communicate to external devices using the optional Isolated
Communications
Features are not available at this time
Module assemblies or modem.
4-10
Find Quality Products Online at: sales@GlobalTestSupply.com
www.GlobalTestSupply.com
Page 77

Page intentionally left blank
CH 4/ Instrument Settings
4-11
Find Quality Products Online at: sales@GlobalTestSupply.com
www.GlobalTestSupply.com
Page 78

Data Card
Data Card
Format/View
data card
The Memory Card screen displays informatio n on the card inserted in the data card sl ot,
including the amount of total space, available space, and used space in card. This
screen also prompts u sers t o set fi lename a nd forma t card in p repar ation for monitor ing
and writing of data.
Action... Result...
STEP 1: From the Instrument
Settings Setup Menu scr een, press
Memory Card.
• Card Status indicates status
condition of the c ard inserted in
the data card slot. The
following messages may
appear under Card S ta tus (ref er
to pages 5-20 to 5-21 for a
detailed description of each
card status message):
•Not Inserted
• Contains File
•Empty
•Fragmented
•Unformatted
•Invalid Card
• Card size indicates the full
storage capacity of the data
card. The amount of remaining
space and used space in data
card are also displayed on
screen.
NOTE 1: The Energy Platform does not support
file fragmentation. When creating a file, it will
take the largest continuous block and use that
size block for data storage. Deleting files from
data card is not recommended. Whenever
possible, transfe r the f iles to a compute r a nd then
reformat the card using the Energy Platform
when there is no more space available to begin
new data storage.
EP160
•Press Format to format the
data card. Proceed to Step 2 on
page 4-13.
• Press View to display files stored
in data card. Proceed to S tep 3 on
page 4-13.
• Press Size to select the file size
increment by which you want
data saved in card. Proceed to
Step 4 on page 4-14.
• Press Exit to discard changes
and return to Instrument Settings
menu.
NOTE 2: Refer to Chapter 5 Start Menu - Site
Name/Memory Card for more information on
data card operation.
Continued on next page
4-12
Find Quality Products Online at: sales@GlobalTestSupply.com
www.GlobalTestSupply.com
Page 79
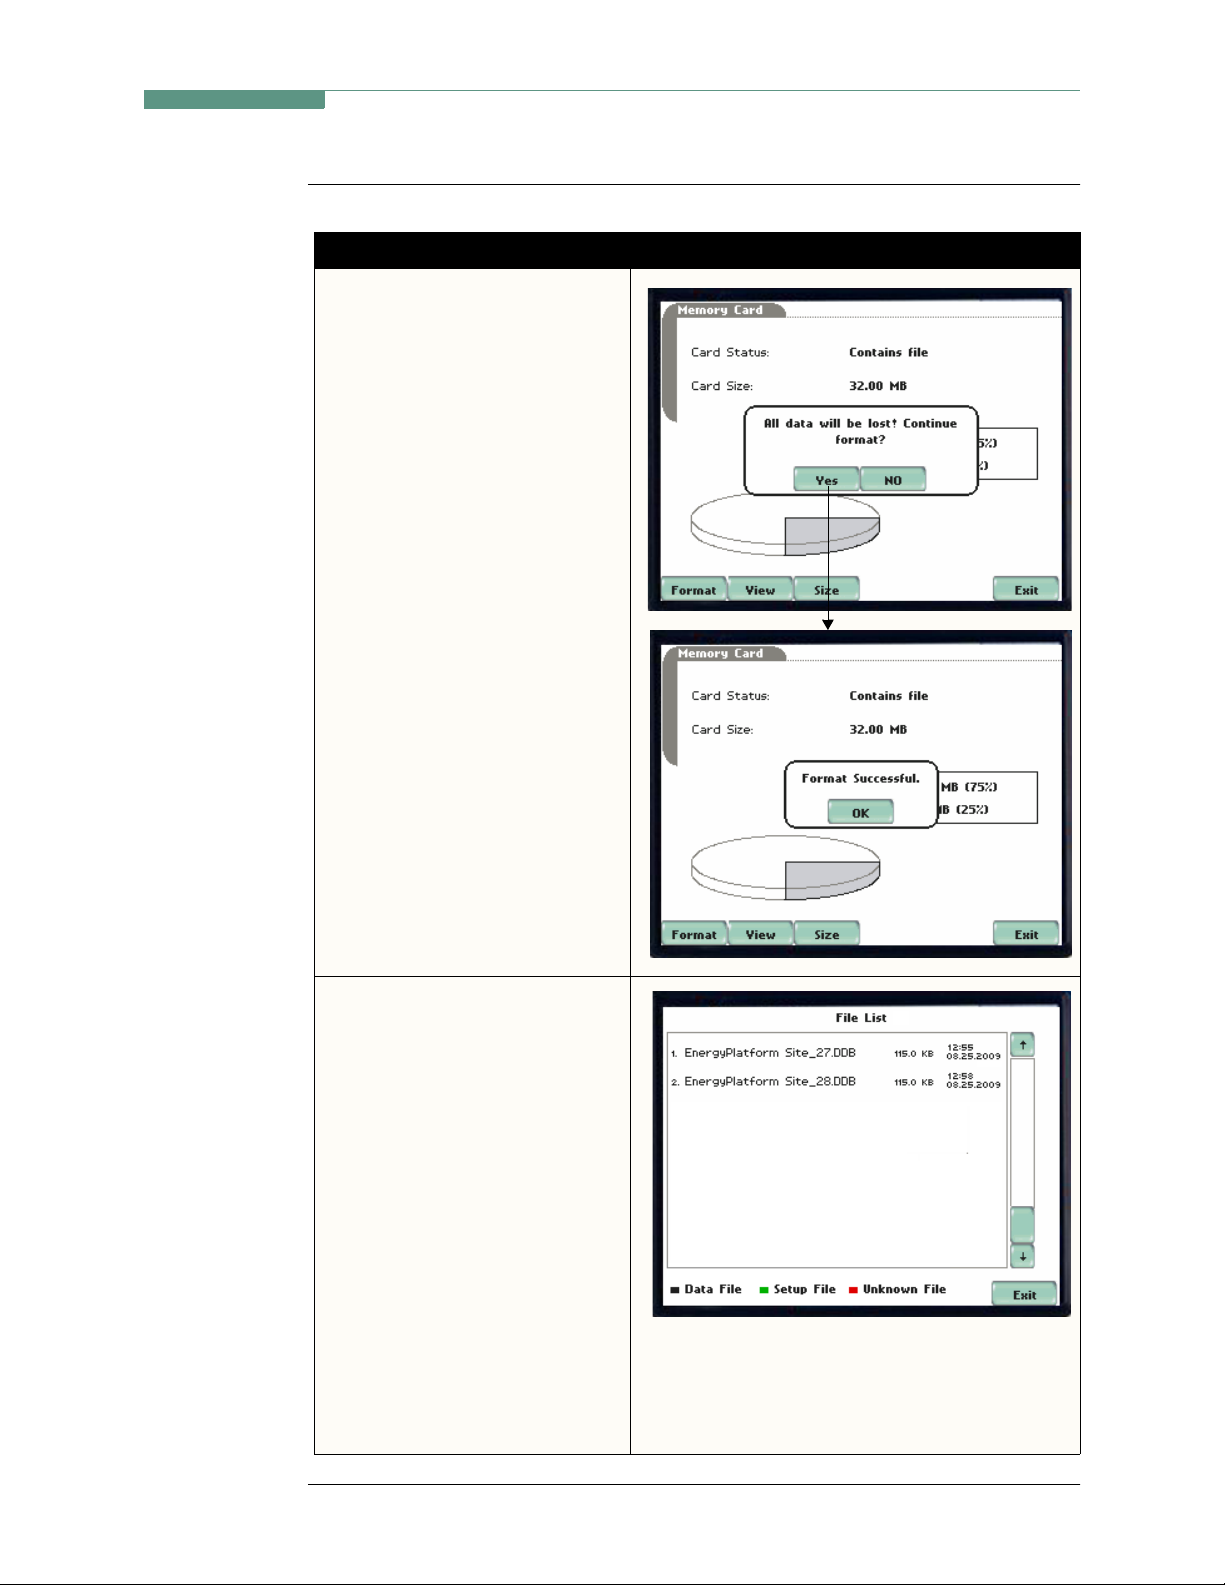
Format/View
data card
(continued)
CH 4/ Instrument Settings
Action... Result...
STEP 2: A ll data and setups
stored in data card will be lost
when you format the card.
• A confirmation message
verifies whether you want to
continue with data card format
or not.
Press Yes to continue data card
format. Press No to c ancel data
card format.
• The message Format
Successful! indicates that data
card format has been
completed. Press OK to exit
card format procedure and
return to the Memory Card
screen.
STEP 3: The Energy Platform
lists data file names stored in
card, along with file size, time
and date when data was recorded.
The text color indicates the type
of file: black is for data file
(.ddb), green is for setup file
(.set), and red is for an unknown
file.
EP161
EP162
•Press Up/Down arrow keys to
scroll the page up or down by
one line.
• Press and drag the scroll bar to
EP163
move the page up or down.
•Press Exit to quit and return to
Memory Car d screen.
4-13
Find Quality Products Online at: sales@GlobalTestSupply.com
www.GlobalTestSupply.com
Page 80

Date Card, continued
Format/View
data card
(continued)
Action... Result...
STEP 4: For better memory
management operation, Energy
Platform allows you to segment
data into maximum file size limits
of 32 MB, 64 MB, 128 MB or 256
MB. Select the file size inc rement
by which you want your data
stored in card.
•Press OK to accept changes in
file size limit settings.
•Press Cancel to discard
changes in file size settings.
EP164
4-14
Find Quality Products Online at: sales@GlobalTestSupply.com
www.GlobalTestSupply.com
Page 81

Reset to Factory Configuration
CH 4/ Instrument Settings
Definition
Procedure
Factory configurations are the default settings of all programmable features of the
Energy Platform as it left the factory.
Follow these steps to reset the Energy Platform to its factory configuration.
Action... Result...
STEP 1: From the Instrument
Settings Setup Menu scr een, press
Reset to Factory Defaults.
A confirmation message verifies
if you want to rese t the inst rument
to factory configuration and lose
all new data and settings.
•Press Yes to erase existing
settings an d reset the
instrument to factoryconfigured setups. The screen
will return to the Instrument
Settings menu.
MARK158
•Press No to cancel.
4-15
Find Quality Products Online at: sales@GlobalTestSupply.com
www.GlobalTestSupply.com
Page 82

Reset to Factory Configuration, continued
Factory default
settings
Dranetz
Platform.
Current Probes:
Scale Factors:
Circuit Type:
Mode of Operation:
Nominal Value:
Monitoring Mode:
Advanced Operations:
RMS Variation Limits:
current
Journal Limit:
Triggers:
Journal Interval
Site Name:
Size Increment by which Data is Saved in Card:
Clock Type:
Date:
Language:
Display
has set the default values for the various parameters of the Energy
TR2500/TR2500A for A, B, C; TR2510/TR2510A for D
1:1 for V and I, channels A, B, C, D
three phase wye
monitor
measured V, I, frequency
Long Term Timed Recording
individual limit setups
10% Very Low, 90% Low, 110% High for voltage; none for
journalling By Time for the various parameters
all V triggers off
Power Values:
Power Values Inte rval: 15 minutes
Waveform Snapshot: On
Demand and Energy:
Demand Sub-Interval: 5 minutes
Sub-Intervals per Interval: 3
Harmonics Journal Interva l:
Energy Platform Site
Analog
mm/dd/yy
varies depending on unit model
NOTE: Units shipped within North America are factory set using the English/
European language group version.
Backlight Timer: 1 minute
Contrast:
Password Protect:
70%
15 minutes
128 MB
OFF
4-16
Find Quality Products Online at: sales@GlobalTestSupply.com
www.GlobalTestSupply.com
Page 83

Overview
CHAPTER 5
Start Menu
Start menu
options
The Start Menu allows users to perform the following: set up the Energy Platform for
monitoring of an electrical system, load previously saved setups from card, and load
data from card.
There are three ways to set up the instrument for monitoring. The length of time to
monitor a circuit can vary from a few hours to a few weeks depending on the user
application.
•Automatic Setup
current channels, and parameter thresholds. The auto-configured setup enables users
to proceed directly with data monitoring.
•Wizard Setup
about the circuit t o be mo nit ored. The unit automaticall y tur ns on the correct voltage
and current channels when user selects a circuit type. Parameter thresholds are
automatically set based on the line voltage and current values that the user enters.
Threshold limits for capturing events are also set according to the monitoring mode
selected.
• Advanced setup options
and intervals that wer e prev iou sly se t up thr ough Aut omatic o r Wizard setups. Under
advanced setup, each channel must be turned on individually, but any combination
can be used. The user can turn on any available parameter. Users have wider control
over all setup functions when using advanced setup options.
automatically configures the instrument’s circuit type, voltage and
takes the user through a series of screens prompting for information
(see Chapter 6) allow the user to modify trigger parameters
Selection of setup method t ypically depen d on user applicat ion and extent of f amiliarity
with the operation of the intrument.
Monitor same circuit
setups has been previously saved to the card, you may load it using the menu below.
Load setup template from card
to load a previously saved data file from the card, use the menu below.
Load data from card
Platform.
Find Quality Products Online at: sales@GlobalTestSupply.com
www.GlobalTestSupply.com
makes use of the existing setup for monitoring. If a template of
enables you to use previously sav ed set ups. If you wish
allows you to transfer saved events from data card to the Energy
5-1
Page 84

Overview, continued
Displaying Start
Menu
Follow these steps to display the Start Menu.
Action... Result...
STEP 1: Press the Energy
Platform On/Off power button to
turn the unit on. The Home screen
will be displayed.
EP001
STEP 2: Press Start/Setup. The
Start Menu will be displayed.
EP100
In this chap ter
This chapter is divided into five sections:
Section Title See Page
A Automatic Setup 5-3
B Wizard Setup 5-6
C Monitor Same Circuit 5-24
D Load Setup Template from Card 5-34
E Load Data from Card 5-35
5-2
Find Quality Products Online at: sales@GlobalTestSupply.com
www.GlobalTestSupply.com
Page 85

Overview
CH 5/ Start Menu
Section A
Automatic Setup
Automatic Setup
procedure
Automatic Setup is a one-stop process using pre-defined settings to set the unit
automatically. Users have the option to view the list of parameter settings, change
probe types if current will be monitored, and/or proceed directly with data monitoring.
Follow the se steps to perform Automatic Setup.
Action... Result...
STEP 1: From the Start Menu,
press Automatic Setup. The autoconfigured circuit type, nominal
voltage, current and frequency
values appear on screen. Data
card status and available space in
card are also displayed.
• To continue Automatic Setup
and begin data monitoring,
press OK. Proceed to Step 2.
• To view the list of parame ter
settings for Automatic Setu p,
press Summary. Proceed to
Step 3 on page 5-4.
• To display/change probe types
for current monitoring, press
Probe. Proceed to Step 4 on
page 5-4.
EP101
•Press Cancel to quit and return
to Start Menu.
STEP 2: The Monitoring Menu
screen allows users to begin
monitori ng immediate l y or at a
specified time and date.
• T o star t monitoring, pr ess Start
Now!
Proceed to Section C Monitor
Same Circuit - Turning
Monitoring On/Off on page 5-24.
MARK123b
Continued on next page
5-3
Find Quality Products Online at: sales@GlobalTestSupply.com
www.GlobalTestSupply.com
Page 86

Overview, continued
Automatic Setup
procedure
(continued)
Action... Result...
STEP 3: Summary displays the
list of auto-configured parameter
settings for auto setup. The setup
summary is available for review
before, during and after
monitoring.
•Press Up/Down arrow keys to
scroll the page up or down by
one line.
• Press and drag the scroll bar to
move the page up or down.
• When done reviewing the
Setup Summary, press Exit.
The screen will return to AutoConfig.
STEP 4: Various probe types are
available for each channel for
current monitoring.
EP123c
•Press Change to display the
probe types available for each
channel. Proceed to Step 5 on
page 5-5.
• If using identic al probe type for
all Channels, press to ena ble
Set Identical. The display will
change to show only one probe
selection for al l channel s. Press
Change to display the probe
types available. Procee d to Step
5 on page 5-5.
•Press OK to accept probe
selection and return to Auto config screen.
•Press Cancel to disregard
probe selection and return to
Auto-config screen.
EP102
EP103
Continued on next page
5-4
Find Quality Products Online at: sales@GlobalTestSupply.com
www.GlobalTestSupply.com
Page 87

CH 5/ Start Menu
Automatic Setup
procedure
(continued)
Action... Result...
STEP 5: Select your desired
probe type.
NOTE: Use the same probes for
the following: TR2500 for
TR2500A, TR2510 for TR2510A,
TR2520 for TR2520A.
• If the curre nt probe that you are
using is not on the list, select
Other. Then press Scale to
define the CT scale factor on
the current probe. Proceed to
Step 6.
•Press OK to accept probe
selection and monitor current.
•Press Cancel to retain previous
probe settings and return to
previous screen.
STEP 6: You need to set the CT
scale factor when using a current
probe that is not on the list.
Pressing Scale will show the
numeric window to enter the CT
scale factor on the current probe.
Use the keypad to set the CT scale
factor. See sample scale factor
calculation on page 5-10.
EP104a
•Press OK to accept the CT
scale factor value. The Current
Probe Selection screen will be
displayed.
EP104d
•Press ... .... if you want to clear
and retype numeric values.
•Press x1000 to multiply the
value by 1000.
•Press Cancel to discard
changes and return to the
previous screen (screen shown
on Step 5).
5-5
Find Quality Products Online at: sales@GlobalTestSupply.com
www.GlobalTestSupply.com
Page 88

Overview
Overview
Section B
Wizard Setup
Introduction
Monitoring
modes
Wizard Setup guides the user through the circuit setup step-by-step, via a series of
screens prompting for information about the circuit to be monitored. The unit
automatically tur ns on the corr ect channels and sets t he parameter thresholds d epending
on the detected circuit type, nominal voltage and current values, and monitoring mode
specified by the user.
The Energy Platform allows users to monitor events in the following setup categories:
Long-term Timed Recording and Long-term Timed Recording with RMS Triggers
mode. Selecting any setup category automatically sets trigger and capture conditions.
Advanced users are free to mix and match settings (see Chapter 6 Advanced Setup
Options).
Long-term Timed Recording, Demand, Energy
quality energ y survey re quires the captu re of a set of basic da ta over an extende d period
of time. The Energy Platform is designed to facilitate long-term monitoring by
collecting min/max/avg data at each pre-determined interval in order to perform postprocess harmonic and other events analysis. It is also designed to be left unattended in
the field, recording statistically representative data for long-term analysis. Using the
Dranetz
energy studies can be carried out in harsh weather environments.
Long-term Timed Recording, Demand, Energy with RMS Triggers
same as above except that snapshots and rms event triggers are active.
lockable portable case option or other available enclosures, demand/
: Performing a statistically valid power
: This mode is the
5-6
Find Quality Products Online at: sales@GlobalTestSupply.com
www.GlobalTestSupply.com
Page 89

CH 5/ Start Menu
In this section
The following topics are covered in this section.
Topic See Page
Current Probe Selection 5-8
Scale Factor Setup 5-10
Circuit Type Selection 5-12
Nominal Values 5-14
Mode of Operation 5-17
Monitoring Mode 5-18
Advanced Options 5-19
Site Name/Memory Card 5-20
5-7
Find Quality Products Online at: sales@GlobalTestSupply.com
www.GlobalTestSupply.com
Page 90

Current Probe Selection
Current Probe Selection
Selecting
current probe
Follow these steps to monitor current and select probe type.
Action... Result...
STEP 1: From the Start Menu,
press Wizard Setup.
• If current will not be
monitored, press Next. Go to
page 5-10.
• If current will be monitored,
press Change to display the
probe types available for each
channel. Proceed to Step 2.
• If using identic al probe type for
all channels, pres s to enable Set
Identical. The display will
change to show only one probe
selection. Press Change to
display the probe types
available. Proceed to Step 2.
• If you want to enable/disable
current channels, press to
select/deselect Enable
Currents.
MARK101
5-8
•Press Cancel to quit and return
to Start menu.
STEP 2: Select your desired
probe type.
NOTE: Use the same probes for
the following: TR2500 for
TR2500A, TR2510 for TR2510A,
TR2520 for TR2520A.
• If the curre nt probe that you are
using is not on the list, select
Other. Then press Scale to
define the CT scale factor on
the current probe. Proceed to
Step 3 on page 5-9.
MARK103
EP104a
Continued on next page
Find Quality Products Online at: sales@GlobalTestSupply.com
www.GlobalTestSupply.com
Page 91

CH 5/ Start Menu
Selecting
current probe
(continued)
Action... Result...
STEP 2: (continued)
•Press OK to accept probe
selection and monitor current.
•Press Cancel to retain previous
probe settings and return to
previous screen.
STEP 3: You need to set the CT
scale factor when using a current
probe that is not on the list.
Pressing Scale will show the
numeric window to enter the CT
scale factor on the current probe.
Use the keypad to set the CT scale
factor. See sample scale factor
calculation on page 5-10.
•Press OK to accept the CT
scale factor value. The s creen
shown in Step 2 will be
displayed.
EP104d
Other relevant
information on
current probes
•Press ... .... if you want to clear
and retype numeric values.
•Press x1000 to multiply the
value by 1000.
•Press Cancel to discard
changes and return to the
previous screen (screen shown
on Step 2).
Refer to Chapter 2 Voltage Measurement Cable and Current Probe Connections for
illustrations of typical current probes and for guidelines on how to connect current
probes.
Refer to Appendix A for descriptions and part numbers of probes and adapter cables.
Refer to Appendix B for Dranetz
current probes technical specifications.
5-9
Find Quality Products Online at: sales@GlobalTestSupply.com
www.GlobalTestSupply.com
Page 92

Scale Factor Setup
Scale Factor Setup
What is a scale
factor?
When to use
Non-Dranetz
equipment
Sample
calculation
A scale factor is the ra tio of the i nput to outp ut for a pa rticula r current transfor mer (CT)
or potential transfor mer (PT). A scal e f act or is e ntered in the Energy Platfor m and then
multiplied automatically by the measured voltage or current so the unit displays the
correct values, as referenced to the primary side, rather than the secondary side of the
PT or CT.
NOTE: If voltage and current connections are made without using any of the above
named devices, the scale factor should be set to 1.
Scale factors must be entered for the following conditions:
• A Dranetz
• The current connections are made using a Dranetz
• The voltage connections are made using a PT.
Refer to the CT name pla te or to the manu facturer’s literature to deter mine the scale
factor.
The scale factor for a single CT or PT is calculated from its step-up or step-down ratio.
Example of step-down ratio
If a current transformer has a step-down ratio of 1000A:5A, therefore:
current probe is connected to a permanently installed CT.
ISO box.
Scale Factor = 1000/5 = 200
5-10
Example of step-up ratio
If a potential transformer has a step-up ratio of 1V:10V, therefore:
Scale Factor = 1/10 = 0.1
Find Quality Products Online at: sales@GlobalTestSupply.com
www.GlobalTestSupply.com
Page 93

CH 5/ Start Menu
Scale factor
setup screen
After setting up current probe configurations, the Scale Factor screen is displayed.
Action... Result...
STEP 1: From the Current Probe
Selection screen, press Next to
display the Scale Factor Setup.
• If voltage and current
connections are made without
using any current or potential
transformer devices, the scale
factor is set to th e defaul t value
of 1. Press Next and go to page
5-12.
• To enter new scale factors,
press the numeric field of the
Volts/Amps channel where you
want to enter new scale fa ctors.
Proceed to Step 2.
•Press Cancel to quit and return
to Start menu.
MARK105
STEP 2: Enter a new scale factor
value using the numeric keypad.
Press OK to accept the new scale
factor.
•Press .. . . . to clear and retype
numeric values.
•Press x1000 to multiply the
value by 1000.
•Press Cancel to discard
changes and retain previous
scale factor valu e, and retur n to
Scale Factor Setup screen.
MARK105b
5-11
Find Quality Products Online at: sales@GlobalTestSupply.com
www.GlobalTestSupply.com
Page 94

Circuit Type Selection
Circuit Type Selection
Circuit setup
The Energy Platform i s able to dis play wiring di agrams from whi ch users can sele ct the
circuit type appropriate to their application. The instrument will display the detected
circuit configuration and compare the detected voltages, currents, and phase sequence
(if applicable) to the selected circuit type. Refer to Appendix E for the descriptions of
common circuit connections.
Action... Result...
STEP 1: From the Scale Factor
Setup screen, press Next to
display Circuit Type Selection.
Read the Warning advisory, then
press Accept to display the men us
for circuit selection.
• To select a circuit
configuration, press the Ckt
arrow keys until the desired
configuration is displayed.
An auto circuit detection window
is displayed to show if selected
circuit type and the detected
voltages, currents, and phase
sequence match (text in green) or
do not match (text in red).
EP107
5-12
When done with Circuit setup,
press Next. Go to page 5-14.
• Real-time Scope and Phasor
screens are available. These
functions help verify if the
wiring configuration match es
the circuit being monitored.
Press Scope to check if the
waveforms look correct for the
specified wiring setup. Pr oceed
to Step 2 on page 5-13.
Press Phasor to view if phasor
display match those expected
from the specified wiring
diagram. Proceed to Step 3 on
page 5-13.
•Press Cancel to discard
changes and return to Start
menu.
EP108
Continued on next page
Find Quality Products Online at: sales@GlobalTestSupply.com
www.GlobalTestSupply.com
Page 95
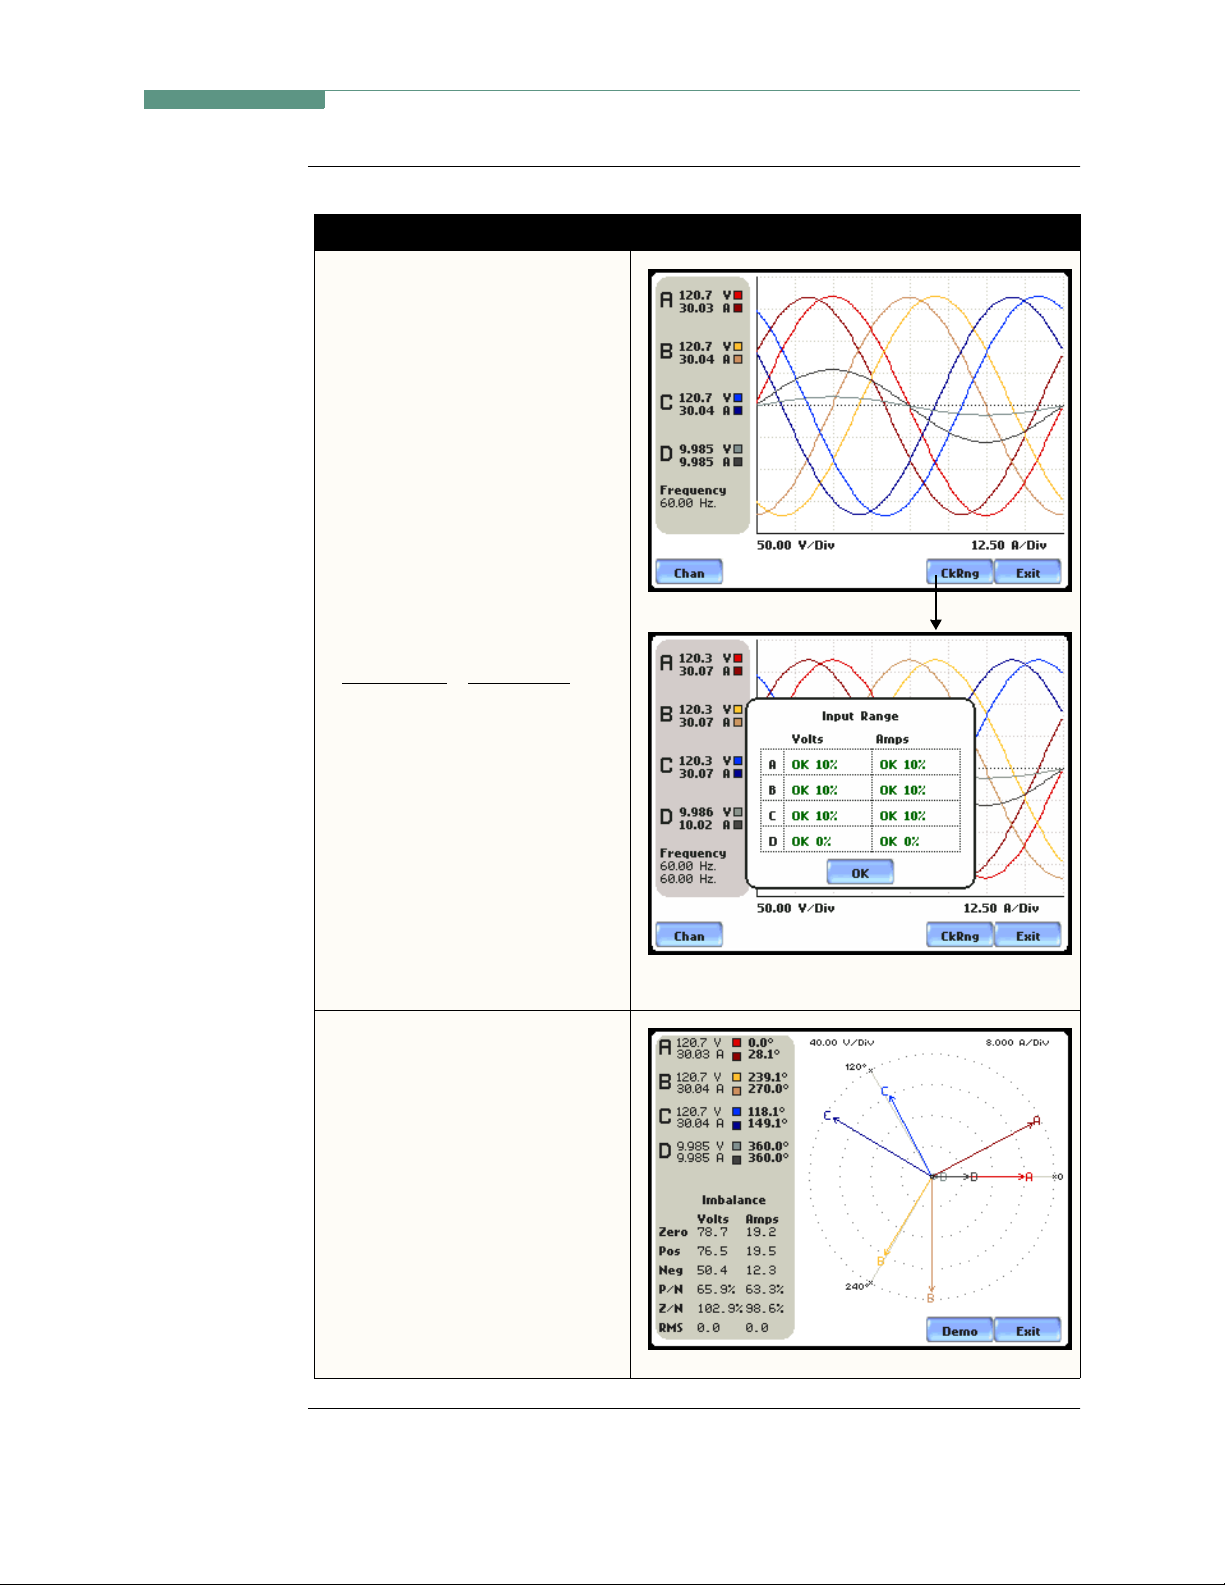
Circuit Setup
(continued)
Action... Result...
STEP 2: Scope mode allows users
to verify if waveforms look
correct for the specified wiring
setup.
• To check input range, press
CkRng. The Input Range
screen displays the detected
range for vo ltage and current
channels A, B, C, and D.
• The instrument registers a
message on the Input Range
screen that corresponds to the
detected input range for each
channel:
CH 5/ Start Menu
MARK201
Input Range
OK
OVER
UNDER
N/A
CLIP
Description
Within Range
Over Range
Under Range
Channel Disabled
Clipping
• When done checking the input
range, press OK to return to the
Scope mode screen. Once in
Scope mode screen, press Exit
to return to Ci rcuit Type
Selection screen.
STEP 3: Phasor display shows a
graph that indicates phase
relations between voltage and
current.
For more information on phasors,
refer to Chapter 3 View Real
Time Data - Section D Voltage
and Current Phasor.
MARK205
•Press Demo to show animated
phasor rotations.
•Press Exit to return to Circuit
Type Selection screen.
Find Quality Products Online at: sales@GlobalTestSupply.com
www.GlobalTestSupply.com
MARK241
5-13
Page 96

Nominal Values
Nominal Values
Frequency,
voltage and
current settings
The Nominal Values screen allows users to enter values for frequency nominal line
voltage and current, or use the computed nominal values displayed on screen.
Action... Result...
STEP 1: Nominal Values scre en
appears as users prepare the
instrument to record data. From
the Circuit T ype Selection screen,
press Next to display Nominal
Values.
• If the computed nomi nal values
are accepted without change,
press Next. Go to page 5-17.
• To enter a new nominal
Frequency, Voltage and/or
Current value, press the
corresponding button and
proceed to Step 2.
• To set the properties to track
frequency of a monitored
system, press Tracking.
Proceed to Step 3 on page 5-15.
NOTE: Make sure that the nominal values
computed by the Energy Platform are correct.
Nominal values are used as basis for setting
default thresholds and other parameters for
circuit monitoring.
MARK110
•Press Cancel to quit and return
to Start menu.
STEP 2: Enter a new nominal
Frequency/Voltage/Current value
using the numeric keypad. Press
OK to accept the new value.
•Press ... ... tto clear and retype
numeric values.
•Press x1000 to multiply the
value by 1000.
•Press Cancel to retain previous
nominal va lues and return to
Nominal Values screen.
MARK110b
Continued on next page
5-14
Find Quality Products Online at: sales@GlobalTestSupply.com
www.GlobalTestSupply.com
Page 97

Frequency,
voltage and
current settings
(continued)
Action... Result...
STEP 3: Tracking allows users to
set parameters to monit or changes
in frequency.
Frequency Class:
Check to select the power system
that define the freque ncy rang e of
distribution of the monitored
system.
• Standard frequency range is
16 Hz.
•
Fast
frequency range is 16-65 Hz.
• Internal uses the nominal
frequency when making
measurements where no
reference signal is available.
NOTE: Always enter a nominal
frequency that matches your
line frequency. This ensures
that if the Energy Platform
loses external sync, it will have
a corresponding internal sync.
CH 5/ Start Menu
MARK110c
Sync Channel:
Check to specify t he external sy nc
mode to show which channel the
signal is connected to. See page
5-16 for more details on
frequency synchronization.
• Ch A Volts: When set to Ch A,
the unit attempts to sync to an
incoming voltage signal.
• Ch D Volts: When set to Ch D,
the unit only attempts to sync
to voltage C h D.
Tracking Range:
The Min and Max refer to the
range of frequencies that the
phase locked loop will “hunt” if
sync is lost. See page 5-16 for
more details on frequency
tracking.
•Press OK to accept new
frequency tracking setti ngs .
•Press Cancel to quit and return
to Nominal Values screen.
5-15
Find Quality Products Online at: sales@GlobalTestSupply.com
www.GlobalTestSupply.com
Page 98

Nominal V a lues, continued
Frequency
synchronization
Frequency
tracking
Normal frequency synchronization (sync) of the Energy Platform analog signal
processing circuits is controlled by analyzing the external AC voltage signal input on
channel A. If sync is lost, then internal sync is automatically selected. The frequency
used for internal is entered und er Fr equency on the Nominal Values screen (see page 5-
14).
Typically, external sync on Ch D is specified if it is known that signal on A is
inappropriate for use as a sync source (i.e. the frequency is unstable or DC). A low
distortion 50, 60 or 400 Hz signal can be input to Ch D and used as a sync signal.
NOTE: Failure to connect an external sync or to select an internal sync during current
monitoring will result in erroneous data being collected and displayed.
Tracking determines how the phase locked loop circuitry responds to sudden changes
in frequency.
Standard mode
: On a normal power quality application [Standard], the system is
designed to “ride thr ough” volta ge change s to keep tra cking the f undamental f requen cy
even in the absence of voltage.
Fast mode
: When operating on a l ocal genera to r [Fa st], th e fr equency will v ary mor e as
loading changes occur. The Fast mode allows the instrument to follow these changes
more closely.
Internal mode
: In cases where no r eference si gnal is ava ilable ( such as DC monit oring),
the Internal setting is used to set the sample rate.
5-16
Find Quality Products Online at: sales@GlobalTestSupply.com
www.GlobalTestSupply.com
Page 99

Mode of Operation
CH 5/ Start Menu
Basic meter
setup
After entering the correct nominal values for circuit monitoring, users have the option
to set the instrument to record data or use th e instrument as a meter.
Action... Result...
STEP 1: F r om the Freq uency
Tracking screen, press Next to
display the Mode of Operation.
• To set up the instrument to
record data , press to enab le
Continue and set limits to
record events and statistical
data. Press Next and go to
page 5-18.
• To use the instrument as a
meter, press to enable Use as a
meter. Proceed to Step 2.
•Press Cancel to discard
changes and return to Start
menu.
MARK109
STEP 2: The instrument is now
configured for your specified
wiring setup and is rea dy to use as
a meter.
•Press Finish to begin using
instrument as a meter and
return to Home screen.
•Press Cancel to discard meter
mode operation and return to
Start menu.
MARK109b
5-17
Find Quality Products Online at: sales@GlobalTestSupply.com
www.GlobalTestSupply.com
Page 100

Monitoring Mode
Monitoring Mode
Choose a
monitoring
mode
Monitoring
mode
descriptions
The Energy Platform provides two monitoring modes of operation from which to
monitor and capture data relevant to user application.
Action... Result...
STEP 1: From the Basic Meter
screen, press Next to display the
different Monitoring Mode
setups.
• Check to select your desired
monitoring mode setup. Press
Next and go to page 5-19.
•Press Cancel to quit and return
to Start menu.
EP111
Long-term Timed Recording, Demand, Energy sets the instrument to use periodic
measurements only. This setting is used for long-term statistical studies and
benchmarking field-ba sed e quipment tes ting and e valuat ion. No t rigge rs a re se t so only
trended values are available.
NOTE
5-18
Long-term Timed Recording, Demand, Energy with RMS Triggers is the same as
above except that snapshots and rms event triggers are active.
Users can override the default settings to customize the instrument to their application.
For the default settings of parameters in each monitoring mode, see Appendix B
Technical Specifications - Parameter Settings in Each Monitoring Mode.
Find Quality Products Online at: sales@GlobalTestSupply.com
www.GlobalTestSupply.com
 Loading...