

Page 1

USER GUIDE
Shop for Power Metering products online at:
www.PowerMet erStore.com
1.877.766.5412
Page 2

WARNING
Death, serious injury, or fire hazard could result from improper connection of this instrument. Read and
understand this manual before connecting this instrument. Follow all installation and operating
instructions while using this instrument.
Connection of this instrument must be performed in compliance with the National Electrical Code (ANSI/
NFPA 70-2014) of USA and any additional safety requirements applicable to your installation.
Installation, operation, and maintenance of this instrument must be performed by qualified personnel
only. The National Electrical Code defines a qualified person as “one who has the skills and knowledge
related to the construction and operation of the electrical equipment and installations, and who has
received safety training on the hazards involved.”
Qualified personnel who work on or near exposed energized electrical conductors must follow applicable
safety related work practices and procedures including appropriate personal protective equipment in
compliance with the Standard for Electrical Safety Requirements for Employee Workplaces (ANSI/NFPA
70E-2012) of USA and any additional workplace safety requirements applicable to your installation.
Copyright© 2014 Dranetz
All rights reserved.
No part of this book may be reproduced, stored in a
retrieval system, or transcribed in any form or by any
means—electronic, mechanical, photocopying, recording,
or otherwise—without prior written permission from the
publisher, Dranetz, Edison, NJ 08818-4019.
Printed in the United States of America.
P/N UG-HDPQ Rev. B
ii
Shop for Power Metering products online at:
www.PowerMet erStore.com
1.877.766.5412
Page 3

ADVERTENCIA
Una conexión incorrecta de este instrumento puede producir la muerte, lesiones graves y riesgo de incendio. Lea y
entienda este manual antes de conectar. Observe todas las instrucciones de instalación y operación durante el uso de
este instrumento.
La conexión de este instrumento a un sistema eléctrico se debe realizar en conformidad con el Código Eléctrico
Nacional (ANSI/NFPA 70-2014) de los E.E.U.U., además de cualquier otra norma de seguridad correspondiente a su
establecimiento.
La instalación, operación y mantenimiento de este instrumento debe ser realizada por personal calificado solamente.
El Código Eléctrico Nacional define a una persona calificada como "una que esté familiarizada con la construcción y
operación del equipo y con los riesgos involucrados."
El personal cualificado que trabaja encendido o acerca a los conductores eléctricos energizados expuestos debe seguir
prácticas y procedimientos relacionados seguridad aplicable del trabajo incluyendo el equipo protector personal
apropiado en conformidad con el estándar para los requisitos de seguridad eléctricos para los lugares de trabajo del
empleado (ANSI/NFPA 70E-2012) de los E.E.U.U. y cualquier requisito de seguridad adicional del lugar de trabajo
aplicable a su instalación.
AVERTISSEMENT
Si l'instrument est mal connecté, la mort, des blessures graves, ou un danger d'incendie peuvent s'en suivre. Lisez
attentivement ce manuel avant de connecter l'instrument. Lorsque vous utilisez l'instrument, suivez toutes les
instructions d'installation et de service.
Cet instrument doit être connecté conformément au National Electrical Code (ANSI/NFPA 70-2014) des Etats-Unis
et à toutes les exigences de sécurité applicables à votre installation.
Cet instrument doit être installé, utilisé et entretenu uniquement par un personnel qualifié. Selon le National
Electrical Code, une personne est qualifiée si "elle connaît bien la construction et l'utilisation de l'équipement, ainsi
que les dangers que cela implique".
Le personnel qualifié qui travaillent dessus ou s'approchent des conducteurs électriques activés exposés doit suivre
des pratiques en matière et des procédures reliées par sûreté applicable de travail comprenant le matériel de protection
personnel approprié conformément à la norme pour des conditions de sûreté électriques pour les lieux de travail des
employés (ANSI/NFPA 70E-2012) des Etats-Unis et toutes les conditions de sûreté additionnelles de lieu de travail
applicables à votre installation.
WARNUNG
Der falsche Anschluß dieses Gerätes kann Tod, schwere Verletzungen oder Feuer verursachen. Bevor Sie dieses
Instrument anschließen, müssen Sie die Anleitung lesen und verstanden haben. Bei der Verwendung dieses
Instruments müssen alle Installation- und Betriebsanweisungen beachtet werden.
Der Anschluß dieses Instruments muß in Übereinstimmung mit den nationalen Bestimmungen für Elektrizität
(ANSI/NFPA 70-2014) der Vereinigten Staaten, sowie allen weiteren, in Ihrem Fall anwendbaren
Sicherheitsbestimmungen, vorgenommen werden.
Installation, Betrieb und Wartung dieses Instruments dürfen nur von Fachpersonal durchgeführt werden. In dem
nationalen Bestimmungen für Elektrizität wird ein Fachmann als eine Person bezeichnet, welche "mit der Bauweise
und dem Betrieb des Gerätes sowie den dazugehörigen Gefahren vertraut ist."
Qualifiziertes Personal, das an bearbeiten oder herausgestellte angezogene elektrische Leiter sich nähern, muß
anwendbare Sicherheit bezogener Arbeit Praxis und Verfahren einschließlich passende persönliche schützende
Ausrüstung gemäß dem Standard für elektrische Sicherheitsauflagen für Angestellt-Arbeitsplätze (ANSI/NFPA 70E-
2012) der Vereinigten Staaten und alle zusätzlichen Arbeitsplatzsicherheitsauflagen folgen, die auf Ihre Installation
anwendbar sind.
Shop for Power Metering products online at:
www.PowerMet erStore.com
iii
1.877.766.5412
Page 4
Safety Summary
Continued on next page
!
!
Definitions
Symbols
Definiciones
WARNING statements inform the user that certain conditions or practices could result
in loss of life or physical harm.
CAUTION statements identify conditions or practices that could harm the HDPQ
Xplorer, its data, other equipment, or property.
NOTE statements call attention to specific information.
The following International Electrotechnical Commission (IEC) symbols are marked
on the top and rear panel in the immediate vicinity of the referenced terminal or device:
Caution, refer to accompanying documents (this manual).
Direct current (DC) operation of the terminal or device.
Power Switch
Las ADVERTENCIAS informan al usuario de ciertas condiciones o prácticas que
podrían producir lesiones mortales o daño físico.
Las PRECAUCIONES identifican condiciones o prácticas que podrían dañar la HDPQ
Xplorer, sus datos, otros equipos o propiedad.
Símbolos
Las NOTAS llaman la atención hacia la información específica.
Los siguientes símbolos de la Comisión Internacional Electrotécnica (IEC) aparecen
marcados en el panel superior y el posterior inmediatos al terminal o dispositivo en
referencia:
Precaución, consulte los documentos adjuntos (este manual).
Operación de corriente continua (CC) del terminal o dispositivo.
Interruptor de encendido
iv
Shop for Power Metering products online at:
www.PowerMet erStore.com
1.877.766.5412
Page 5
Safety Summary, Continued
Continued on next page
!
!
Définitions
Symboles
Definitionen
Les messages d’AVERTISSEMENT préviennent l’utilisateur que certaines conditions
ou pratiques pourraient entraîner la mort ou des lésions corporelles.
Les messages de MISE EN GARDE signalent des conditions ou pratiques susceptibles
d’endommager “HDPQ Xplorer”, ses données, d’autres équipements ou biens
matériels.
Les messages NOTA attirent l’attention sur certains renseignements spécifiques.
Les symboles suivants de la Commission électrotechnique internationale (CEI) figurent
sur le panneau arrière supérieur situé à proximité du terminal ou de l’unité cité:
Mise en garde, consultez les documents d’accompagnement (ce manual).
Fonctionnement du terminal ou de l’unité en courant continu (CC).
Interrupteur de tension
WARNUNGEN informieren den Benutzer darüber, daß bestimmte Bedingungen oder
Vorgehensweisen körperliche oder tödliche Verletzungen zur Folge haben können.
Symbole
VORSICHTSHINWEISE kennzeichnen Bedingungen oder Vorgehensweisen, die zu
einer Beschädigung von HDPQ Xplorer, seiner Daten oder anderer Geräte bzw. von
Eigentum führen können.
HINWEISE machen auf bestimmte Informationen aufmerksam.
Die folgenden Symbole der Internationalen Elektrotechnischen Kommission
(International Electrotechnical Commission; IEC) befinden sich auf der Abdeck- und
Seitenplatte unmittelbar am betreffenden Terminal oder Gerät.
Vorsichtshinweis, siehe Begleitdokumente (dieses Handbuch).
Gleichstrombetrieb im Terminal oder Gerät.
Netzschalter
Shop for Power Metering products online at:
www.PowerMet erStore.com
v
1.877.766.5412
Page 6

Safety Summary, Continued
Safety
precautions
The following safety precautions must be followed whenever any type of voltage or
current connection is being made to the HDPQ Xplorer.
• Review NFPA70-E Standard for Electrical Safety Requirements for Employee
Workplaces for applicable safety requirements for potential electrical hazards that
may be encountered.
• Wear proper Personal Protective Equipment, including safety glasses and insulated
gloves when making connections to power circuits.
• Hands, shoes and floor must be dry when making any connection to a power line.
• Before each use, inspect all cables for breaks or cracks in the insulation. Replace
immediately if defective.
• Press the HDPQ Xplorer On/Off power switch to Off.
• Before connecting to electric circuits to be monitored, open their related circuit
breakers or disconnects. DO NOT install any connection of the HDPQ Xplorer to
live power lines.
• Connections must be made to the HDPQ Xplorer first, then connect to the circuit to
be monitored.
• If the equipment is used in a manner not specified in this User Guide, the protection
provided by the equipment may be impaired.
These safety precautions are repeated where appropriate throughout this manual.
vi
Shop for Power Metering products online at:
www.PowerMet erStore.com
1.877.766.5412
Page 7

Statements and Notices
Continued on next page
Statement of
warranty
Statement of
reliability
Notice regarding
FCC compliance
All Dranetz manufactured portable instruments and accessories are warranted to the
original purchaser against defective material and workmanship for a period of three
years from the date of invoice. User replaceable instrument batteries are warranted for a
period of one year from the date of invoice. Certain Dranetz branded accessories, such
as current transformers and other accessories not manufactured by Dranetz, are
warranted to the original purchaser against defective material and workmanship for a
period of one year from the date of invoice. Warranties for products and accessories
sold by, but not branded as Dranetz, are covered by their respective manufacturer's
warranties and are not warranted by Dranetz. Dranetz will repair or replace, at its
option, all defective equipment that is returned, freight prepaid, during the warranty
period. There will be no charge for repair, provided there is no evidence that the
equipment has been mishandled or abused. This warranty shall not apply to any defects
resulting from improper or inadequate maintenance, buyer-supplied hardware/software
interfacing, unauthorized modification or misuse of the equipment, operation outside of
environmental specifications, or improper site preparation or maintenance.
The information in this manual has been reviewed and is believed to be entirely
reliable. However, no responsibility is assumed for any inaccuracies. All material is for
informational purposes only, and is subject to change without prior notice.
This device has been tested and found to comply with the limits for a Class A digital
device, pursuant to Part 15 of the FCC Rules. These limits are designed to provide
reasonable protection against harmful interference when the equipment is operated in a
commercial environment. This equipment generates, uses, and can radiate radio
frequency energy and, if not installed and used in accordance with the instruction
manual, may cause harmful interference to radio communications. Operation of this
equipment in a residential area is likely to cause harmful interference in which case the
user will be required to correct the interference at his/her own expense.
Notice regarding
proprietary
rights
Shop for Power Metering products online at:
This publication contains information proprietary to Dranetz. By accepting and using
this manual, you agree that the information contained herein will be used solely for the
purpose of operating equipment of Dranetz.
www.PowerMet erStore.com
vii
1.877.766.5412
Page 8

Statements and Notices, Continued
Copyright
Trademarks
This publication is protected under the Copyright laws of the United States, Title 17 et
seq. No part of this publication may be reproduced, transmitted, transcribed, stored in a
retrieval system, or translated into any language or computer language, in any form, by
any means, electronic, mechanical, magnetic, optical, chemical, manual, or otherwise,
without the prior written consent of Dranetz, 1000 New Durham Road, Edison, New
Jersey 08818.
Copyright © 2014 Dranetz
All Rights Reserved. Printed in the United States of America.
Dranetz HDPQ
Other trademarks and trade names are those of their respective owners.
®
, Scope Mode® and Dran-View® are registered trademarks of Dranetz.
viii
Shop for Power Metering products online at:
www.PowerMet erStore.com
1.877.766.5412
Page 9

Table of Contents
Safety Summary .................................................................................................................... iv
Statements and Notices.......................................................................................................... vii
CHAPTER 1 - Getting Started
Overview ............................................................................................................................... 1-1
Unpacking the HDPQ Xplorer .............................................................................................. 1-3
Standard Accessories............................................................................................................. 1-4
HDPQ Xplorer Controls, Indicators, and Connectors........................................................... 1-5
Top View......................................................................................................................... 1-6
Left Side View ................................................................................................................ 1-7
Right Side View.............................................................................................................. 1-8
Front View ...................................................................................................................... 1-9
Rear View ....................................................................................................................... 1-10
Keyhole Mounting Procedure................................................................................................ 1-11
Upgrading Firmware.............................................................................................................. 1-12
HDPQ Xplorer UI Touchscreen Features.............................................................................. 1-14
Touchscreen Functions ................................................................................................... 1-14
Taskbar Icons .................................................................................................................. 1-15
Instrument Control Functions ......................................................................................... 1-15
Monitoring Status Functions........................................................................................... 1-18
Housekeeping Functions................................................................................................. 1-19
General Navigation Functions ........................................................................................ 1-21
HDPQ Xplorer Touch Icon Buttons ...................................................................................... 1-22
Basic Operation ..................................................................................................................... 1-23
Power-on Sequence......................................................................................................... 1-24
Home Start-up Page ........................................................................................................ 1-25
Home Monitoring Page................................................................................................... 1-25
CHAPTER 2 - Voltage Measurement Cable and Current Probe Connections
Overview ............................................................................................................................... 2-1
Connecting Voltage Measurement Cables ............................................................................ 2-4
Connecting Current Probes.................................................................................................... 2-10
CHAPTER 3 - Real Time Data
Overview ............................................................................................................................... 3-1
Section A -Dial Meters................................................................................................................. 3-3
Overview ............................................................................................................................... 3-3
Section B -Text Display Meters................................................................................................... 3-5
Overview ............................................................................................................................... 3-5
Standard Meter Tab ............................................................................................................... 3-6
Distortion Meter Tab ............................................................................................................. 3-8
Unbalance Meter Tab ............................................................................................................ 3-9
Shop for Power Metering products online at:
www.PowerMet erStore.com
ix
1.877.766.5412
Page 10

Table of Contents, Continued
Advanced Meter Tab ............................................................................................................. 3-10
Advanced Demand & Energy Meter Tab.............................................................................. 3-11
Advanced Flicker Meter Tab................................................................................................. 3-14
Section C -Scope Mode................................................................................................................ 3-15
Overview ............................................................................................................................... 3-15
Turning Channels On/Off...................................................................................................... 3-16
Viewing Plots - Stacked/Overlay .......................................................................................... 3-17
Checking Input Range ........................................................................................................... 3-18
Section D -Dashboard .................................................................................................................. 3-19
Overview ............................................................................................................................... 3-19
Parameter Details in Dashboard Display............................................................................... 3-22
Section E -Voltage and Current Phasor ....................................................................................... 3-24
Overview ............................................................................................................................... 3-24
Phasor Screen ........................................................................................................................ 3-25
Phasor Rotation...................................................................................................................... 3-26
Phasor Channel/Parameter Selection..................................................................................... 3-28
Section F -Harmonics................................................................................................................... 3-29
Overview ............................................................................................................................... 3-29
Harmonic Channel/Parameter Selection................................................................................ 3-31
Harmonic Graph/Table.......................................................................................................... 3-32
Harmonic Detail .................................................................................................................... 3-34
Harmonic Options.................................................................................................................. 3-35
Section G -Strip Chart Recorder .................................................................................................. 3-37
Overview ............................................................................................................................... 3-37
CHAPTER 4 - Setup Monitoring
Overview ............................................................................................................................... 4-1
Section A -Automatic Setup for Power Quality........................................................................... 4-4
Overview ............................................................................................................................... 4-4
Section B -Automatic Setup for Energy/Demand ...................................................................... 4-7
Overview ............................................................................................................................... 4-7
Section C -Wizard Setup.............................................................................................................. 4-10
Overview ............................................................................................................................... 4-10
Current Probes - Turns Ratios Setup ..................................................................................... 4-14
Circuit Type Selection........................................................................................................... 4-17
Nominal Values ..................................................................................................................... 4-18
Monitoring Mode................................................................................................................... 4-21
Trigger Limits Setup Options................................................................................................ 4-22
RMS Variation ................................................................................................................ 4-23
Transients........................................................................................................................ 4-27
Set Peak Transients......................................................................................................... 4-28
Set Waveshape Transients .............................................................................................. 4-30
x
Shop for Power Metering products online at:
www.PowerMet erStore.com
1.877.766.5412
Page 11

Table of Contents, Continued
Set RMS Distortion ............................................................................................................... 4-31
Set High Frequency Transients.............................................................................................. 4-32
Waveform Capture ................................................................................................................4-33
Timed Intervals...................................................................................................................... 4-35
Journal Limits........................................................................................................................ 4-38
Voltage Compliance EN50160 (for strict EN50160 Monitoring)......................................... 4-44
Finalize Monitoring ............................................................................................................... 4-46
Exit Setup .............................................................................................................................. 4-48
Section D -Monitor Same Circuit ................................................................................................ 4-49
Overview ............................................................................................................................... 4-49
Turn Monitoring On/Off........................................................................................................ 4-50
View/Save Setup Configuration ............................................................................................ 4-54
Section E -Load Setup Template..................................................................................................4-55
Section F -Load Data File from Memory..................................................................................... 4-56
Section G -Change Instrument Configuration.............................................................................. 4-58
Section H -View/Save Monitoring Setup..................................................................................... 4-59
CHAPTER 5 - Instrument Settings
Overview ............................................................................................................................... 5-1
Time and Date Settings..........................................................................................................5-3
Select Language..................................................................................................................... 5-6
Communications Options ...................................................................................................... 5-7
Set Up the HDPQ Xplorer for Wireless (WiFi) Connectivity............................................... 5-15
Set Up the HDPQ Xplorer for Bluetooth Connectivity......................................................... 5-19
Download Data Remotely via Network, WiFi & Bluetooth PAN ........................................ 5-21
Download Data via USB Connection.................................................................................... 5-22
Manage Memory.................................................................................................................... 5-23
Update Firmware ................................................................................................................... 5-25
Setup Sound........................................................................................................................... 5-28
Setup Display......................................................................................................................... 5-29
Reset to Factory Defaults ...................................................................................................... 5-30
CHAPTER 6 - View Event Data & Reports
Overview ............................................................................................................................... 6-1
Section A -Trend.......................................................................................................................... 6-6
Overview ............................................................................................................................... 6-6
Trend Plot .............................................................................................................................. 6-7
Trend Plot with Event Markers ............................................................................................. 6-15
Section B -Events......................................................................................................................... 6-17
Overview ............................................................................................................................... 6-17
Event List............................................................................................................................... 6-18
Shop for Power Metering products online at:
www.PowerMet erStore.com
xi
1.877.766.5412
Page 12

Table of Contents, Continued
Event Plot - RMS................................................................................................................... 6-22
Event Waveform.................................................................................................................... 6-28
Section C -Reports ....................................................................................................................... 6-34
Overview ............................................................................................................................... 6-34
Voltage Compliance Report .................................................................................................. 6-35
Compliance History............................................................................................................... 6-37
Compliance Summary ........................................................................................................... 6-39
EN50160 Compliance Limits (Default) ................................................................................ 6-43
Event Satistics........................................................................................................................ 6-46
Min/Max Table for Power Frequency and RMS Voltage ..................................................... 6-48
Energy & Demand Report ..................................................................................................... 6-49
Harmonics Statistics Report .................................................................................................. 6-51
Mini-Report Viewer .............................................................................................................. 6-53
APPENDIX A - Optional Accessories
Overview ............................................................................................................................... A-1
Hardware Accessories List & Descriptions........................................................................... A-2
Software Accessories List & Descriptions ............................................................................ A-8
APPENDIX B - Technical Specifications
Overview ............................................................................................................................... B-1
General................................................................................................................................... B-2
Interfaces ............................................................................................................................... B-3
Measured Parameters............................................................................................................. B-4
Computed Parameters............................................................................................................ B-6
Parameter Settings in Each Monitoring Mode ...................................................................... B-10
Current Probe Specifications................................................................................................. B-12
TR Series Probes............................................................................................................. B-12
PR Series Probes ............................................................................................................. B-12
DRANFLEX300MHB Series Probes.............................................................................. B-13
DRANFLEX3000XLB/6000XLB Series Probes............................................................ B-13
APPENDIX C - Battery Specifications and Replacement Procedure
Overview ............................................................................................................................... C-1
Battery Specifications............................................................................................................ C-2
Battery Safety Precautions..................................................................................................... C-3
Battery Pack Replacement..................................................................................................... C-4
APPENDIX D - User Replaceable Parts List
Overview ............................................................................................................................... D-1
xii
Shop for Power Metering products online at:
www.PowerMet erStore.com
1.877.766.5412
Page 13

Table of Contents, Continued
APPENDIX E - Common Circuit Connections
Overview ............................................................................................................................... E-1
Verifying Voltage and Current Connections......................................................................... E-5
Interconnect Jumpers............................................................................................................. E-7
Single Phase........................................................................................................................... E-8
Split Phase ............................................................................................................................. E-9
3 Phase, Four Wire Wye........................................................................................................ E-10
3 Phase (Floating or Grounded) Delta................................................................................... E-11
3 Phase 2-Watt Delta ............................................................................................................. E-12
Generic Circuit ...................................................................................................................... E-13
2 1/2 Element Without Voltage Channel B........................................................................... E-14
2 1/2 Element Without Voltage Channel C........................................................................... E-15
Connecting to a Potential Transformer (PT) ......................................................................... E-16
Connecting to a Current Transformer (CT)........................................................................... E-18
APPENDIX
Calculations ........................................................................................................................... F-1
F - PQ Parameter Calculations
Shop for Power Metering products online at:
www.PowerMet erStore.com
xiii
1.877.766.5412
Page 14
Dranetz HDPQ® Xplorer
xiv
Shop for Power Metering products online at:
www.PowerMet erStore.com
1.877.766.5412
Page 15

Overview
Continued on next page
HDPQ
description
CHAPTER 1
Getting Started
®
HDPQ
monitoring, recording and display of data on four voltage channels and four current
channels simultaneously. The HDPQ instrument builds upon the popular Dranetz PX5/
4400 family products, with more user-centric power quality management
functionalities and versatile communication options.
There are four Dranetz models of the handheld/portable HDPQ platform from which
you can choose from, depending on your application, that impacts what data and
information is displayed:
is Dranetz' new, advanced power quality instrument designed to facilitate
HDPQ® Xplorer
®
HDPQ
HDPQ
HDPQ
Xplorer-400
®
Guide
®
Visa
HDPQ Xplorer
user interface
The trademark shown is hereinafter referred to as HDPQ throughout this User Guide.
The Xplorer, Xplorer-400, Guide and Visa are portable, hand-held, eight-channel
power quality meter/monitors which are very similar in operation, although the Xplorer
also has a high speed sampling board for capturing the details of very fast transients.
NOTE: This User Guide provides information on the features and functionalities for
Dranetz model HDPQ Xplorer. Functionalities of other product models are each
specified in its own user guide. For inquiries contact the Dranetz Customer Service
Department at (732) 287-3680 or 1-800-372-6832.
The HDPQ Xplorer portable, hand-held, eight-channel power quality and energy meter/
monitor is capable for use on three user interface (UI):
• Local/LCD Touchscreen UI - with a WVGA wide screen liquid crystal display
(LCD), using touch screen technology.
NOTE: This User Guide provides information on this local user interface, which
includes the touch screen, LCD, and three touch buttons below the screen. The other
interfaces below may differ due to size and device capabilities, and are to be specified
in a separate document.
Shop for Power Metering products online at:
www.PowerMet erStore.com
1-1
1.877.766.5412
Page 16

Overview, continued
HDPQ Xplorer
user interface
(continued)
HDPQ Xplorer
firmware
• Remote UI - uses the remote desktop communication and other “apps” on personal
computers/laptops/tablets. Remote navigation using a computing device with a full
size screen such as laptop computer, desktop computer or tablet computer, typically
7" or larger display. The remote UI allows for complete control of the instrument to
the full extent of the instrument capabilities, including on screen 'touch' controls and
the three touch buttons below the display. Major differences between local and
remote UI is in the navigation and controls that are different on the instrument’s
touch screen versus mouse clicks on personal computer or laptop. On tablets, some
of the controls used for screen navigation do not apply.
• Remote Mobile UI - uses personal communication devices such as mobile and smart
phones. Compatible with devices such as Smartphone or equivalent devices with
small, typically 3” to 4" display. The capabilities are based on various “apps” that the
user can download from the Dranetz web site, like viewing real time and stored data
in a format compatible with smaller display.
The firmware for HDPQ Xplorer is contained on internal FLASH memory. It has an
operating system capable of performing multiple applications. When an updated
version of the firmware is released, you can upgrade the internal program by
downloading the latest firmware version. See page 1-12 for instructions on how to
upgrade the HDPQ Xplorer firmware.
This manual
In this chapter
This manual contains instructions for operating HDPQ Xplorer with the local/LCD
touchscreen user interface.
The following topics are covered in this chapter.
Topic See Page
Unpacking the HDPQ Xplorer 1-3
Standard Accessories 1-4
HDPQ Xplorer Controls, Indicators, and Connectors 1-5
Keyhole Mounting Procedure 1-11
Upgrading Firmware 1-12
HDPQ Xplorer UI Touchscreen Features 1-14
HDPQ Xplorer Touch Icon Buttons 1-22
Basic Operation 1-23
1-2
Shop for Power Metering products online at:
www.PowerMet erStore.com
1.877.766.5412
Page 17

Unpacking the HDPQ Xplorer
CH 1/ Getting Started
Introduction
Unpacking
Shipping
damage
inspection
For maximum protection against possible shipping damage, HDPQ Xplorer has been
sealed in a two-piece, plastic suspension pack, enclosed within a durable shipping
carton. After opening the carton, inspect the contents for possible shipping damage and
check the carton inventory.
Unpack the HDPQ Xplorer from the carton as follows:
Step Action
1 Remove any remaining literature inside the top of the carton.
2 Carefully remove the HDPQ Xplorer from its shipping carton.
3 Remove all accessories inside the carton. Check that all of the standard
accessories (see page 1-4) are included.
Visually inspect the HDPQ Xplorer for possible shipping damage. If any damage
exists, first notify and file an insurance claim with your carrier or underwriter or both.
Then notify Dranetz Customer Service Department of your intentions to return the unit.
DO NOT return the HDPQ Xplorer without prior instructions from Dranetz Customer
Service Department. Dranetz Customer Service Department can be reached at (732)
287-3680 or 1-800-372-6832.
Repacking for
return shipment
Return notice
If the unit must be returned to Dranetz for service or repair, wrap the unit securely in
heavy packaging material and place in a well padded box or crate to prevent damage.
Do not return the HDPQ Xplorer in an unpacked box. Dranetz will not be responsible
for damage incurred during transit due to inadequate packing on your part.
Notify Dranetz Customer Service of your intention of returning the unit. Do not return
the unit without prior instructions from Dranetz. Dranetz Customer Service Department
can be reached at (732) 287-3680 or 1-800-372-6832.
Shop for Power Metering products online at:
www.PowerMet erStore.com
1-3
1.877.766.5412
Page 18

Standard Accessories
Standard Accessories
Standard
accessories
Optional
accessories
Batteries
The following table lists the HDPQ Xplorer's standard accessories.
Description Part Number
Voltage Cable Set VSC-HDPQ
AC Adapter with Universal Plugs PS-HDPQ
Keyhole Mounting Kit 118313-G1
USB Cable, Male A to Micro B, 6 FT USB-MCABLE
USB to Bluetooth 2.1 Adapter - Class 1* USB-BLUETOOTH
HDPQ Xplorer Quick Reference Guide QR-HDPQ
HDPQ Xplorer User Guide UG-HDPQ
* The Dranetz Bluetooth external adapter is packaged as a standard accessory for the
HDPQ Xplorer, Xplorer-400 and Guide. While it is available as an optional accessory
for the HDPQ Visa.
Refer to Appendix A for the list of hardware and software optional accessories
available for use with HDPQ Xplorer.
Refer to Appendix C for the description and replacement of the batteries contained in
HDPQ Xplorer.
Replaceable
parts
Calibration
Refer to Appendix D for the user replaceable parts.
The recommended calibration interval for this unit is once every 12 months.
We recommend that you return the unit to the factory for calibration. If you decide to
do so, first contact the Dranetz Customer Service Department to obtain an
Authorization Number.
Telephone: (732) 287-3680 or 1-800-372-6832
FAX: (732) 248-1834
Fill out the Repair/Service Order form enclosed in the shipping carton and ship it along
with the unit to the Dranetz Repair Department. (If this form is missing, ask the
Dranetz Customer Service Department for a replacement.)
1-4
Shop for Power Metering products online at:
www.PowerMet erStore.com
1.877.766.5412
Page 19
HDPQ Xplorer Controls, Indicators, and Connectors
CH 1/ Getting Started
Dimensions
HDPQ Xplorer is a self-contained, portable instrument weighing less than 5 pounds
with 7” (diagonal) WVGA wide screen display and measuring 2.75" (7.00 cm) deep by
10" (25.4 cm) wide by 8" (20.3 cm) high. This section identifies and describes the
controls, indicators, and connectors on all sides of the HDPQ Xplorer, shown with
rubber boot installed.
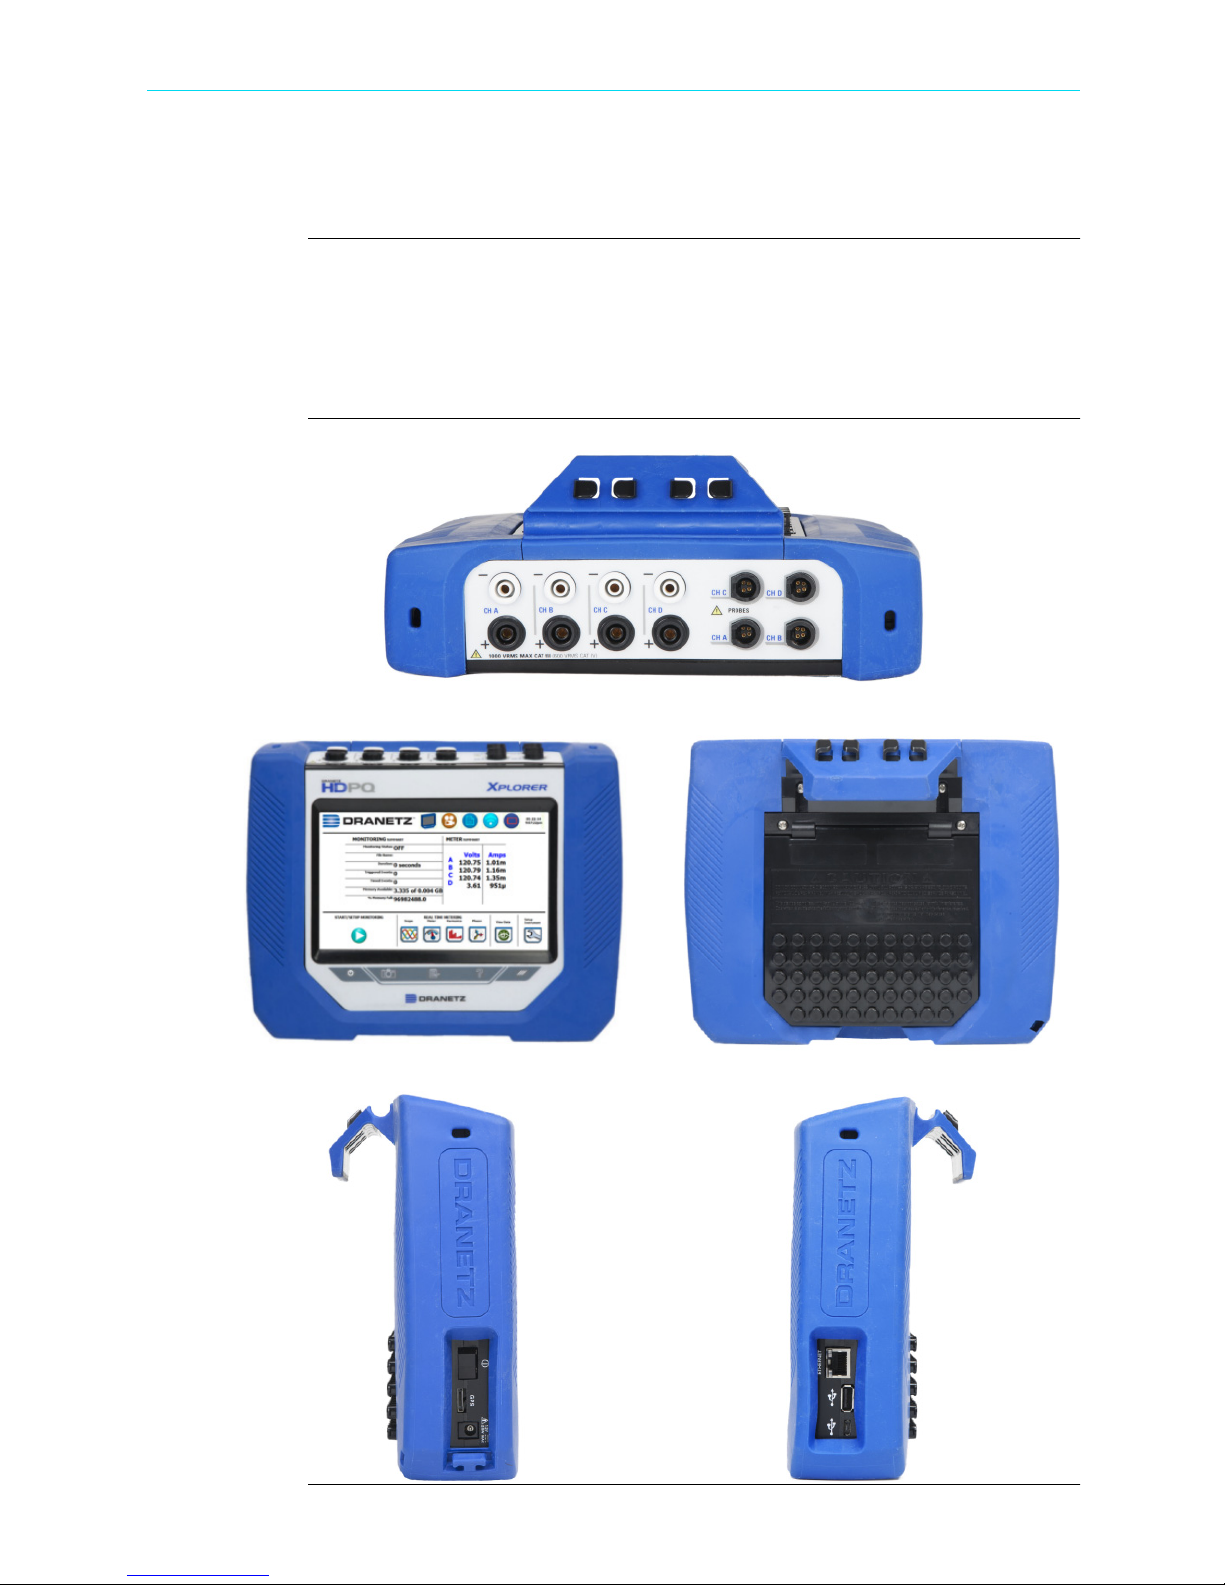
Top View
Front View
Rear View
Left Side View (with you facing front panel)
Shop for Power Metering products online at:
Right Side View (with you facing front panel)
www.PowerMet erStore.com
1-5
1.877.766.5412
Page 20
HDPQ Xplorer Controls, Indicators, and Connectors, continued
Top vi ew
Parts table
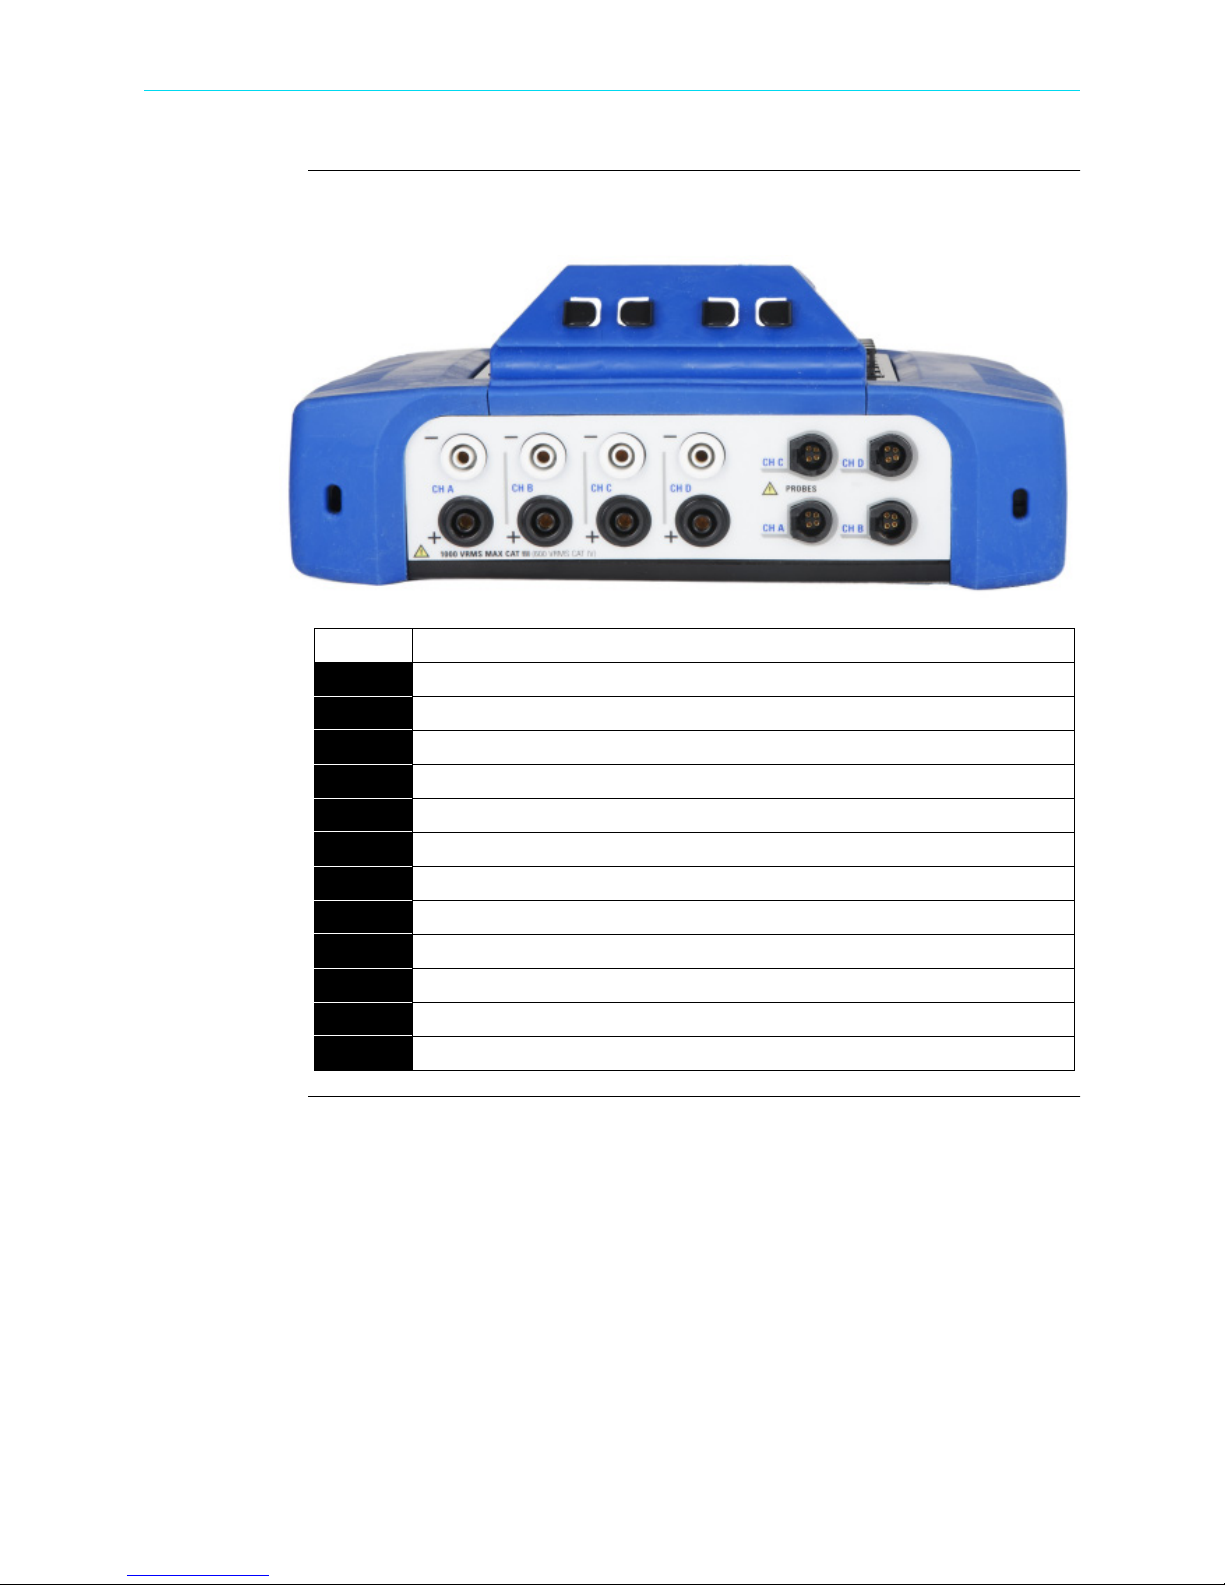
The top (circuit connection) view features the input voltage and current connectors. See
below for description of the top connectors.
Part Function
1 CH A, + Differential Voltage Input Connector; color black.
2 CH A, - Differential Voltage Input Connector; color white.
3 CH B, + Differential Voltage Input Connector; color black.
4 CH B, - Differential Voltage Input Connector; color white.
5 CH C, + Differential Voltage Input Connector; color black.
6 CH C, - Differential Voltage Input Connector; color white.
7 CH D, + Differential Voltage Input Connector; color black.
8 CH D, - Differential Voltage Input Connector; color white.
9 CH A, PROBE, Current Input Connector.
10 CH B, PROBE, Current Input Connector.
11 CH C, PROBE, Current Input Connector.
12 CH D, PROBE, Current Input Connector.
1-6
Shop for Power Metering products online at:
www.PowerMet erStore.com
1.877.766.5412
Page 21
CH 1/ Getting Started
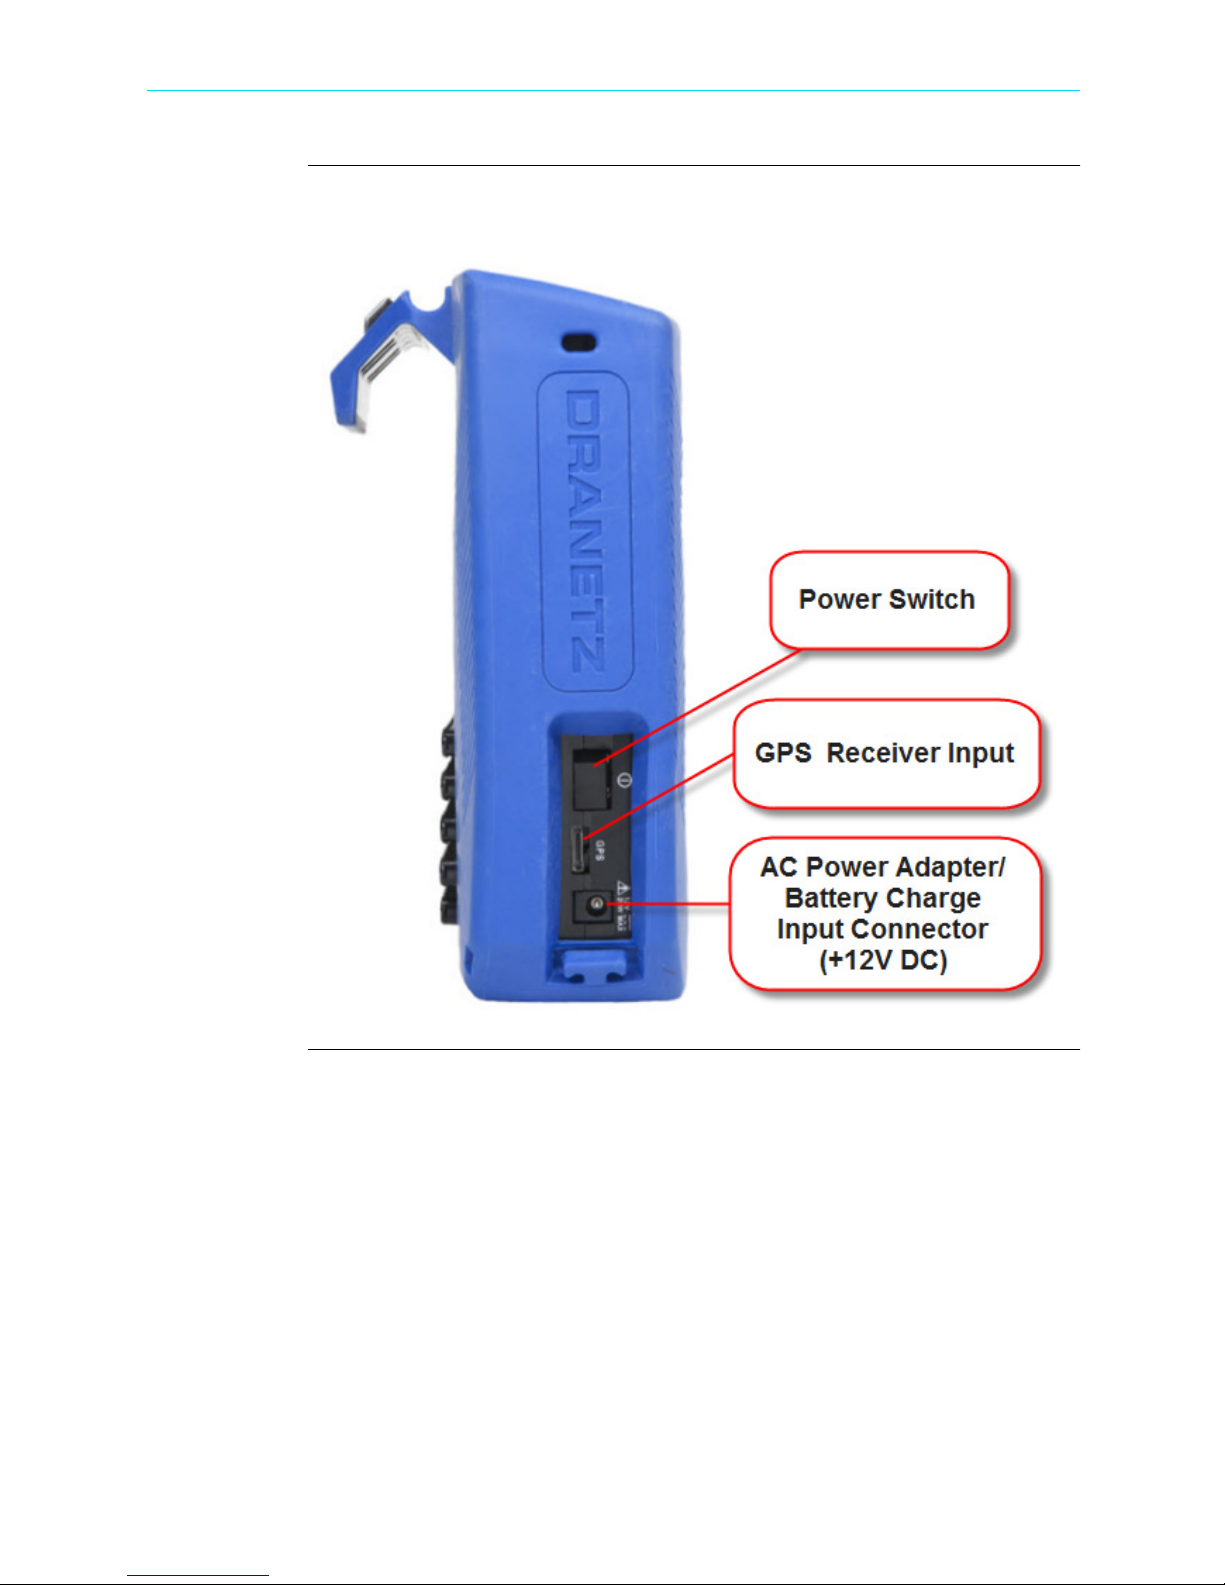
Left side view
The left side contains the power switch, GPS receiver port and AC adapter input
connector. See below for descriptions of the left side connectors.
Shop for Power Metering products online at:
www.PowerMet erStore.com
1-7
1.877.766.5412
Page 22
HDPQ Xplorer Controls, Indicators, and Connectors, continued
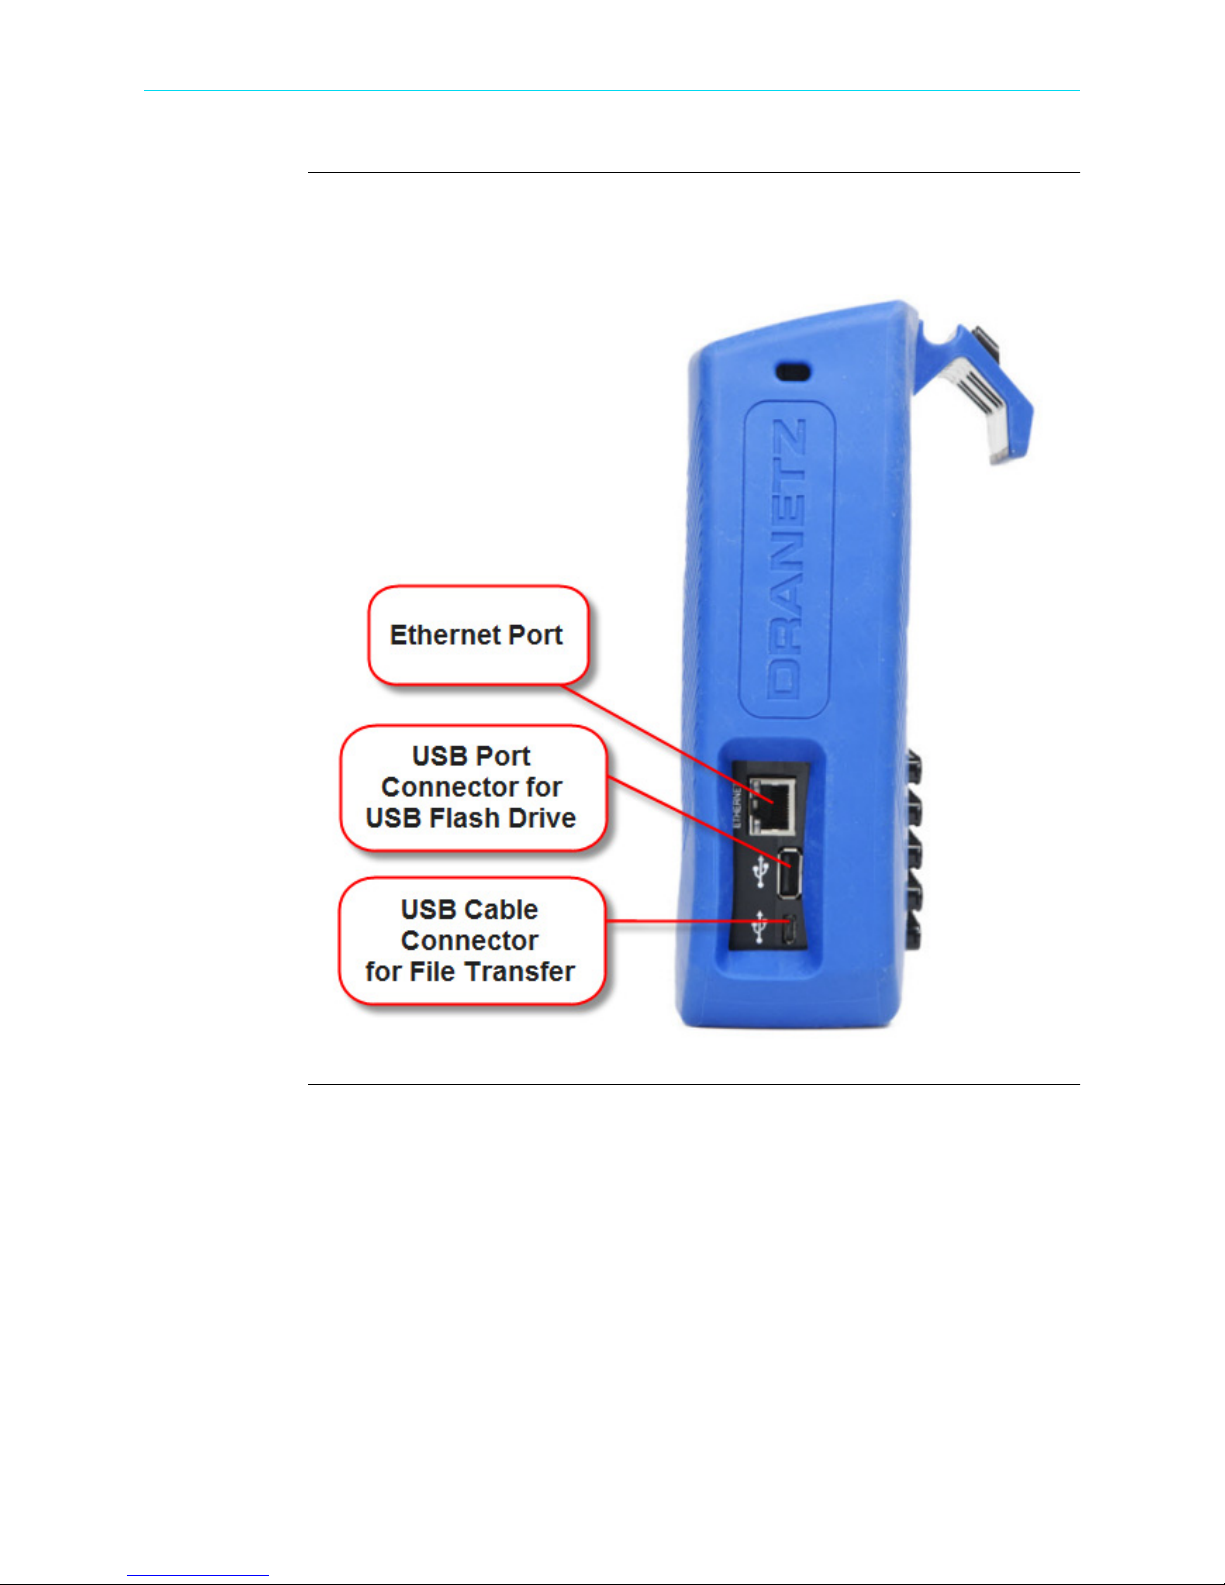
Right side view
The right side contains the ethernet port and the two USB port connectors for the USB
flash drive and the USB cable for plug & play file transfer directly to a computer. See
below for description of the right side connectors.
1-8
Shop for Power Metering products online at:
www.PowerMet erStore.com
1.877.766.5412
Page 23
CH 1/ Getting Started
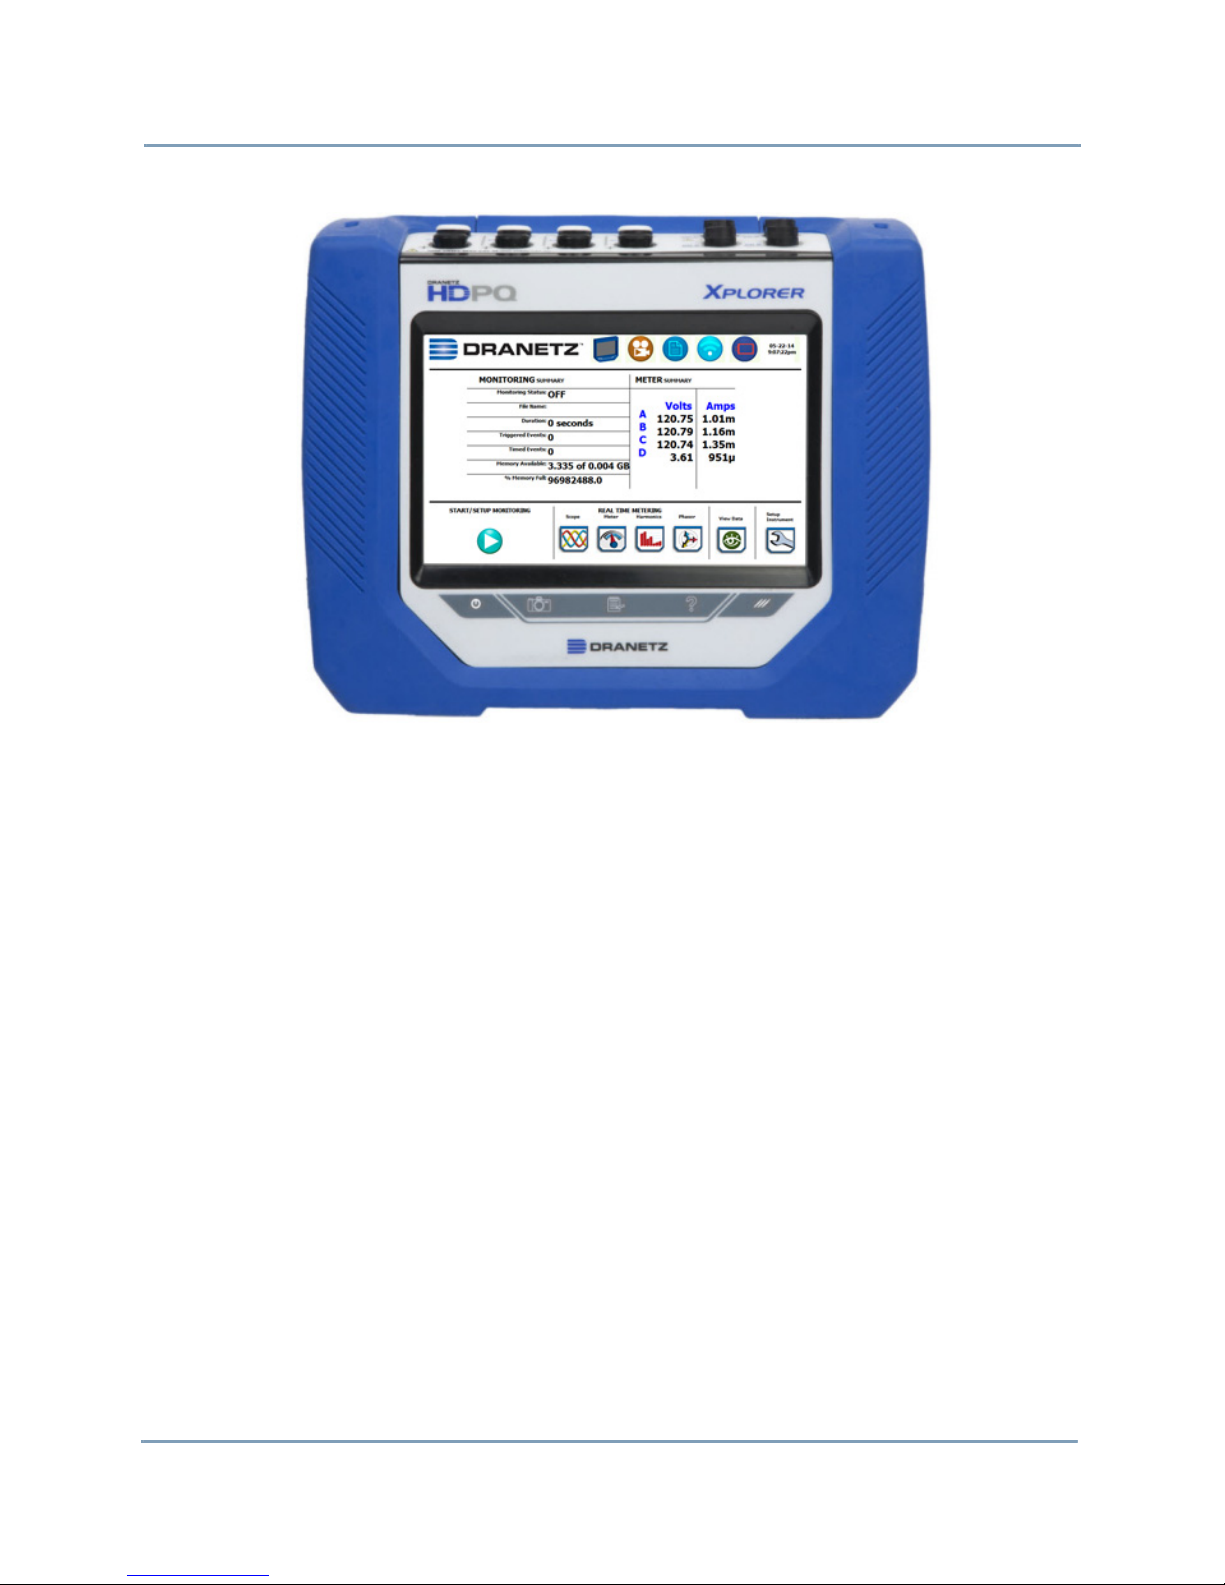
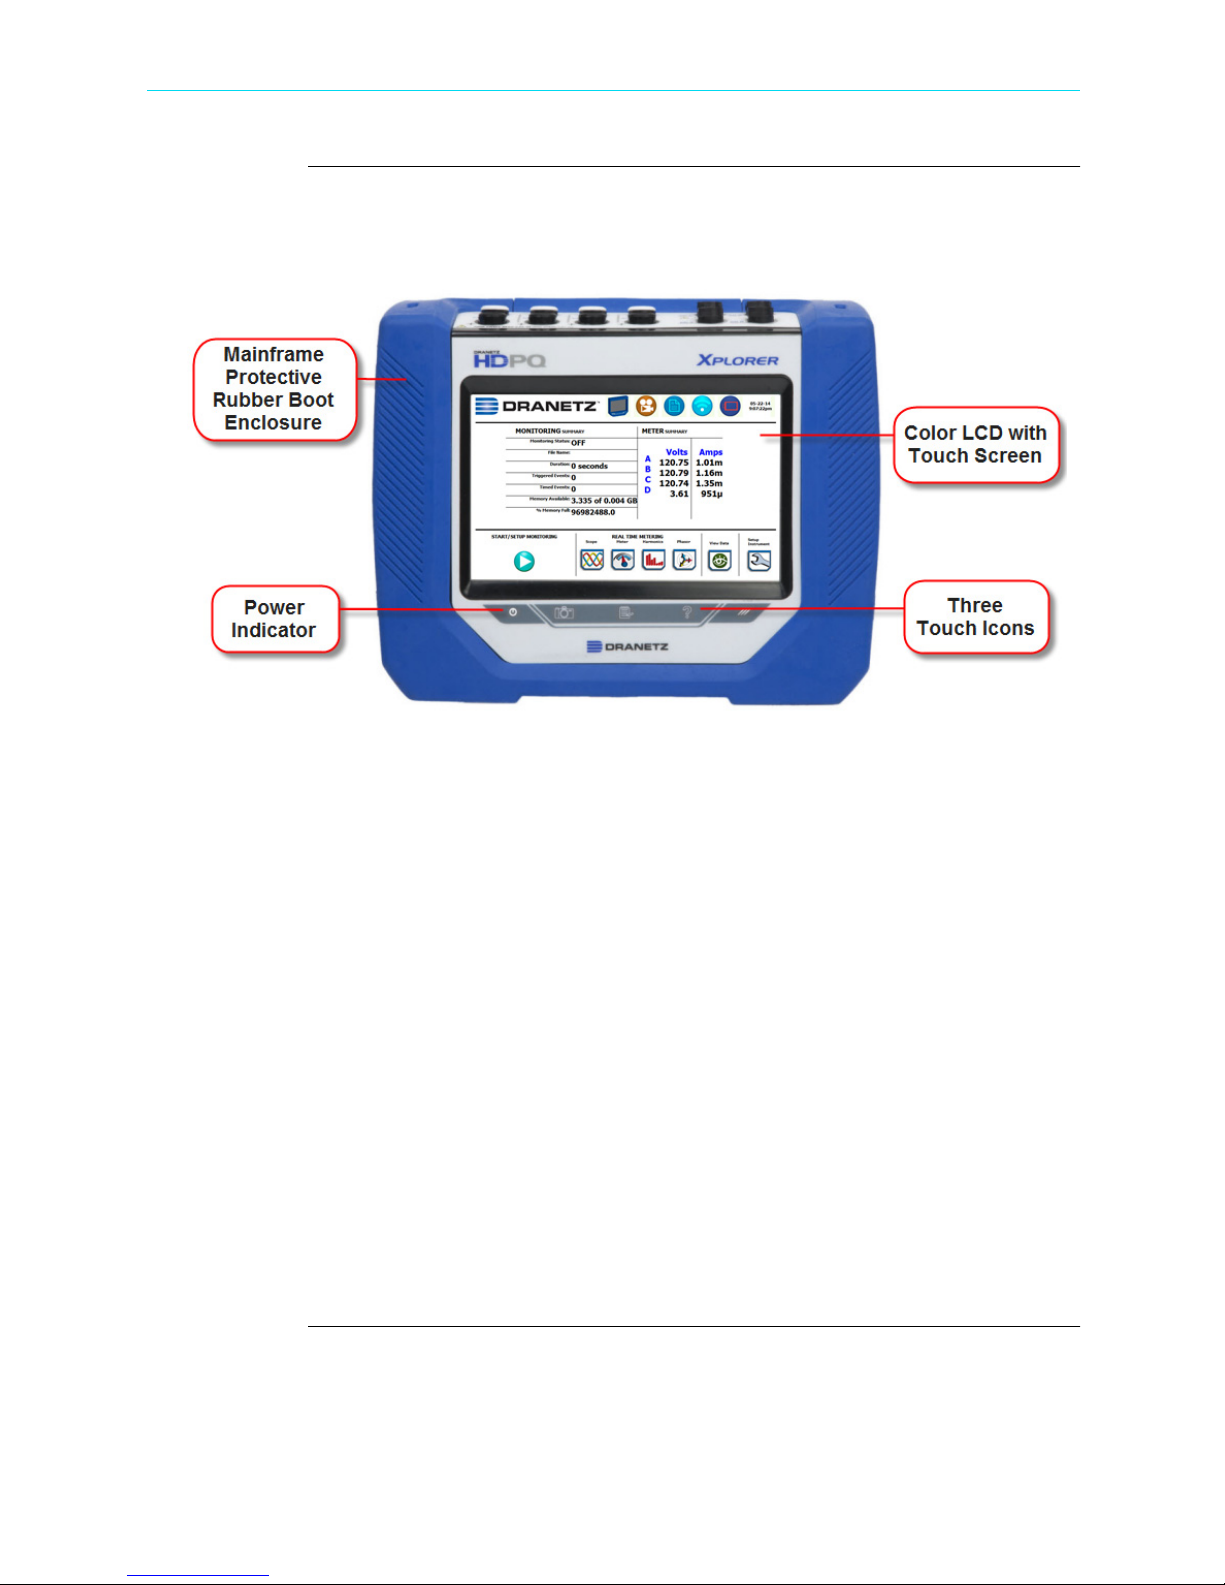
Front view
The front view shows the color touch screen LCD, the LED indicators, and touch icons
marked accordingly allowing you to perform functions specific to the screen display.
See below for description of the HDPQ Xplorer front display.
NOTE 1: Liquid Crystal Display (LCD). Provides 3.6 x 6.0 inches display consisting
of a WVGA touch screen of text and graphic information. The color LCD is equipped
with touch screen technology, operable using the finger and/or stylus. Touch screen
display permits menu selection and alphanumeric data entry.
Below are some basic care instructions for the LCD monitor:
• Use and store the unit within the specified temperature and humidity range. The LCD
screen may be adversely affected by exposure to high temperature or humidity.
Condensation or moisture produced by sudden temperature changes may also
damage the LCD screen. Clean any moisture from surface immediately.
• Be careful when cleaning or removing stains on the LCD surface. Gently wipe the
surface with a soft cloth or cotton pad. Isopropyl alcohol may be used, but make sure
that all solvent residue is removed.
• Do not apply excessive force to the LCD surface. The LCD screen contains sensitive
electronic components that may be damaged due to strong impact.
NOTE 2: Power Indicator. LED will light steadily when the unit is operating normally.
NOTE 3: Touch Icons. The three touch icons are used to perform various functions i.e.
take a Snapshot of the active screen, capture Mini-Reports and access Help screens.
See section HDPQ Xplorer Touch Icons for detailed desccriptions. These icons cannot
be activated with gloves on as they employ capacitive or touch technology.
Shop for Power Metering products online at:
www.PowerMet erStore.com
1-9
1.877.766.5412
Page 24
HDPQ Xplorer Controls, Indicators, and Connectors, continued
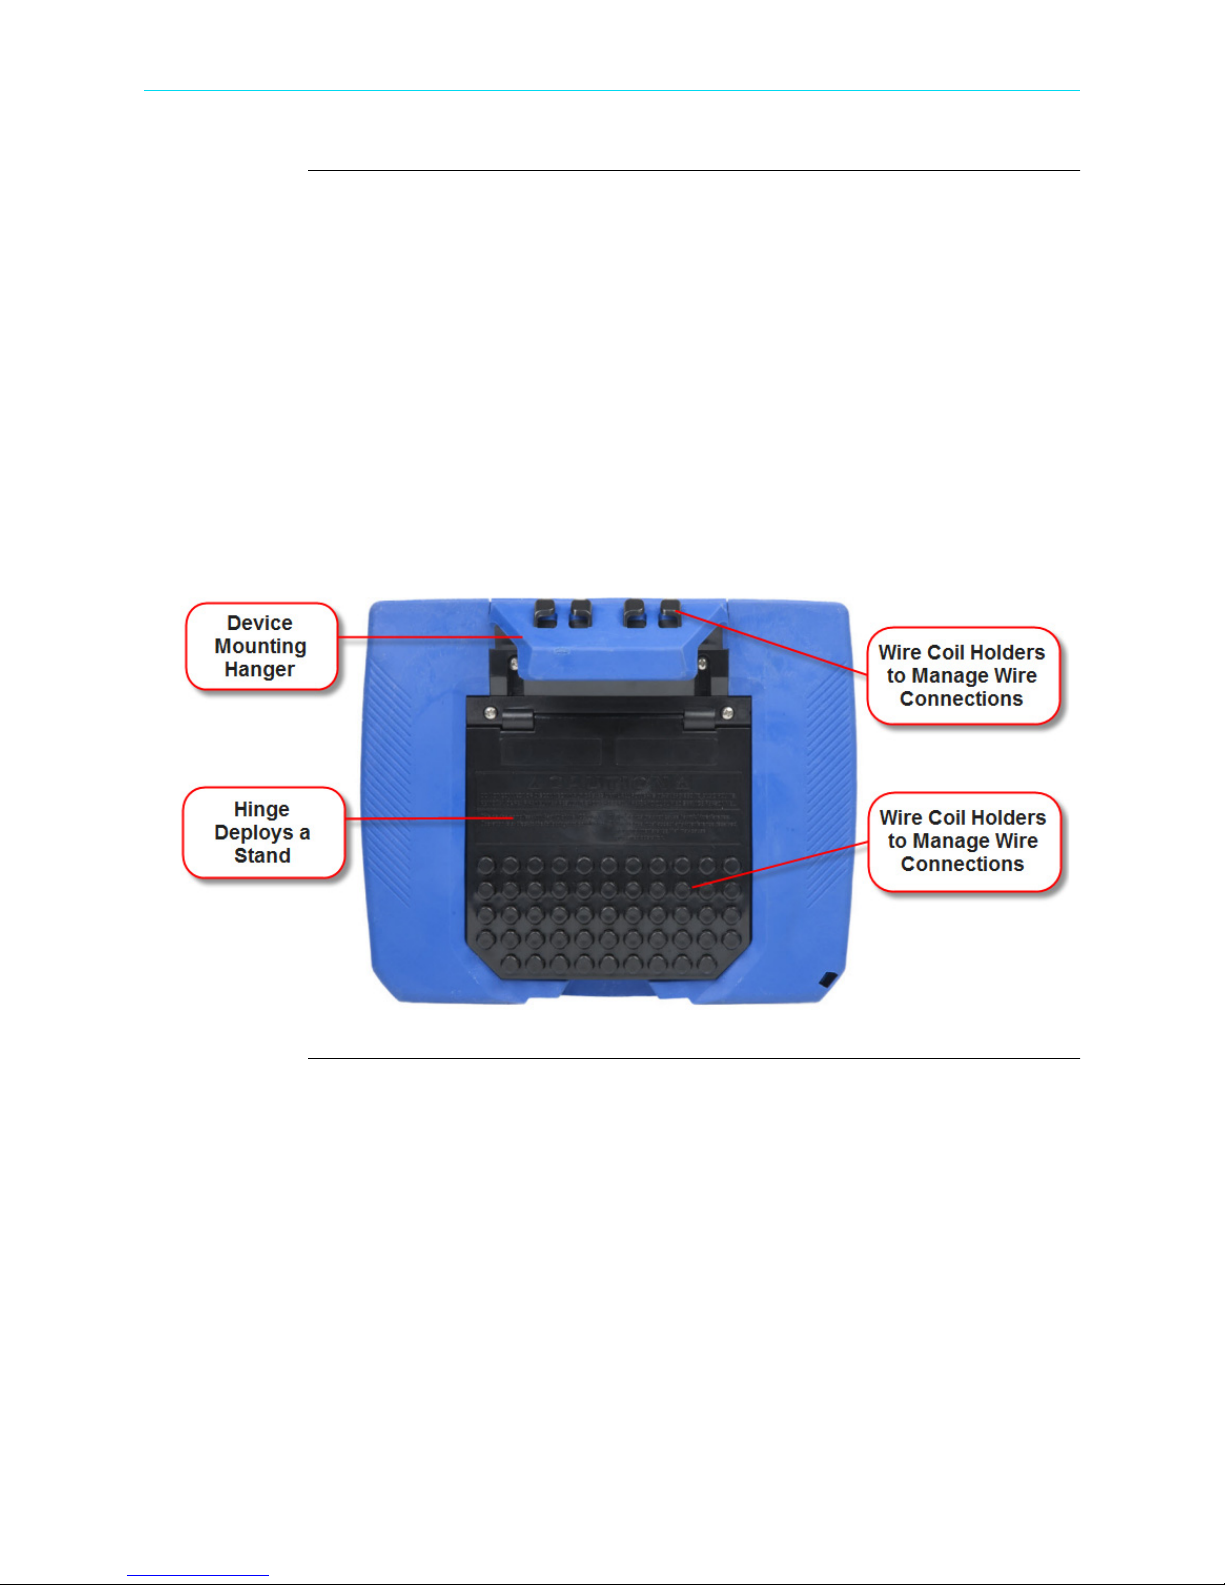
Rear view
The rear view shows the mounting hanger bracket on top if you want to hang the
instrument on a panel. This hanger bracket has built-in wire coil holders used to put
your measurement wirings in place. Note if you do not want to hang the instrument on
a panel, the hanger bracket is replaceable with the Dranetz-supplied accessory Keyhole
Mounting Kit (P/N 118313-G1). This kit allows you to mount the instrument on the
wall or install it in the optional weather resistance enclosure. See next section for
details.
The rear view also features a hinge which deploys a stand. The stand also has wire coil
holders to help manage your measurement wiring connections. The view below shows
the hinge closed.
NOTE: Battery compartment is located under the hinge (bottom area). See Appendix C
- Battery Specifications and Replacement Procedure.
1-10
Shop for Power Metering products online at:
www.PowerMet erStore.com
1.877.766.5412
Page 25
Keyhole Mounting Procedure
CH 1/ Getting Started
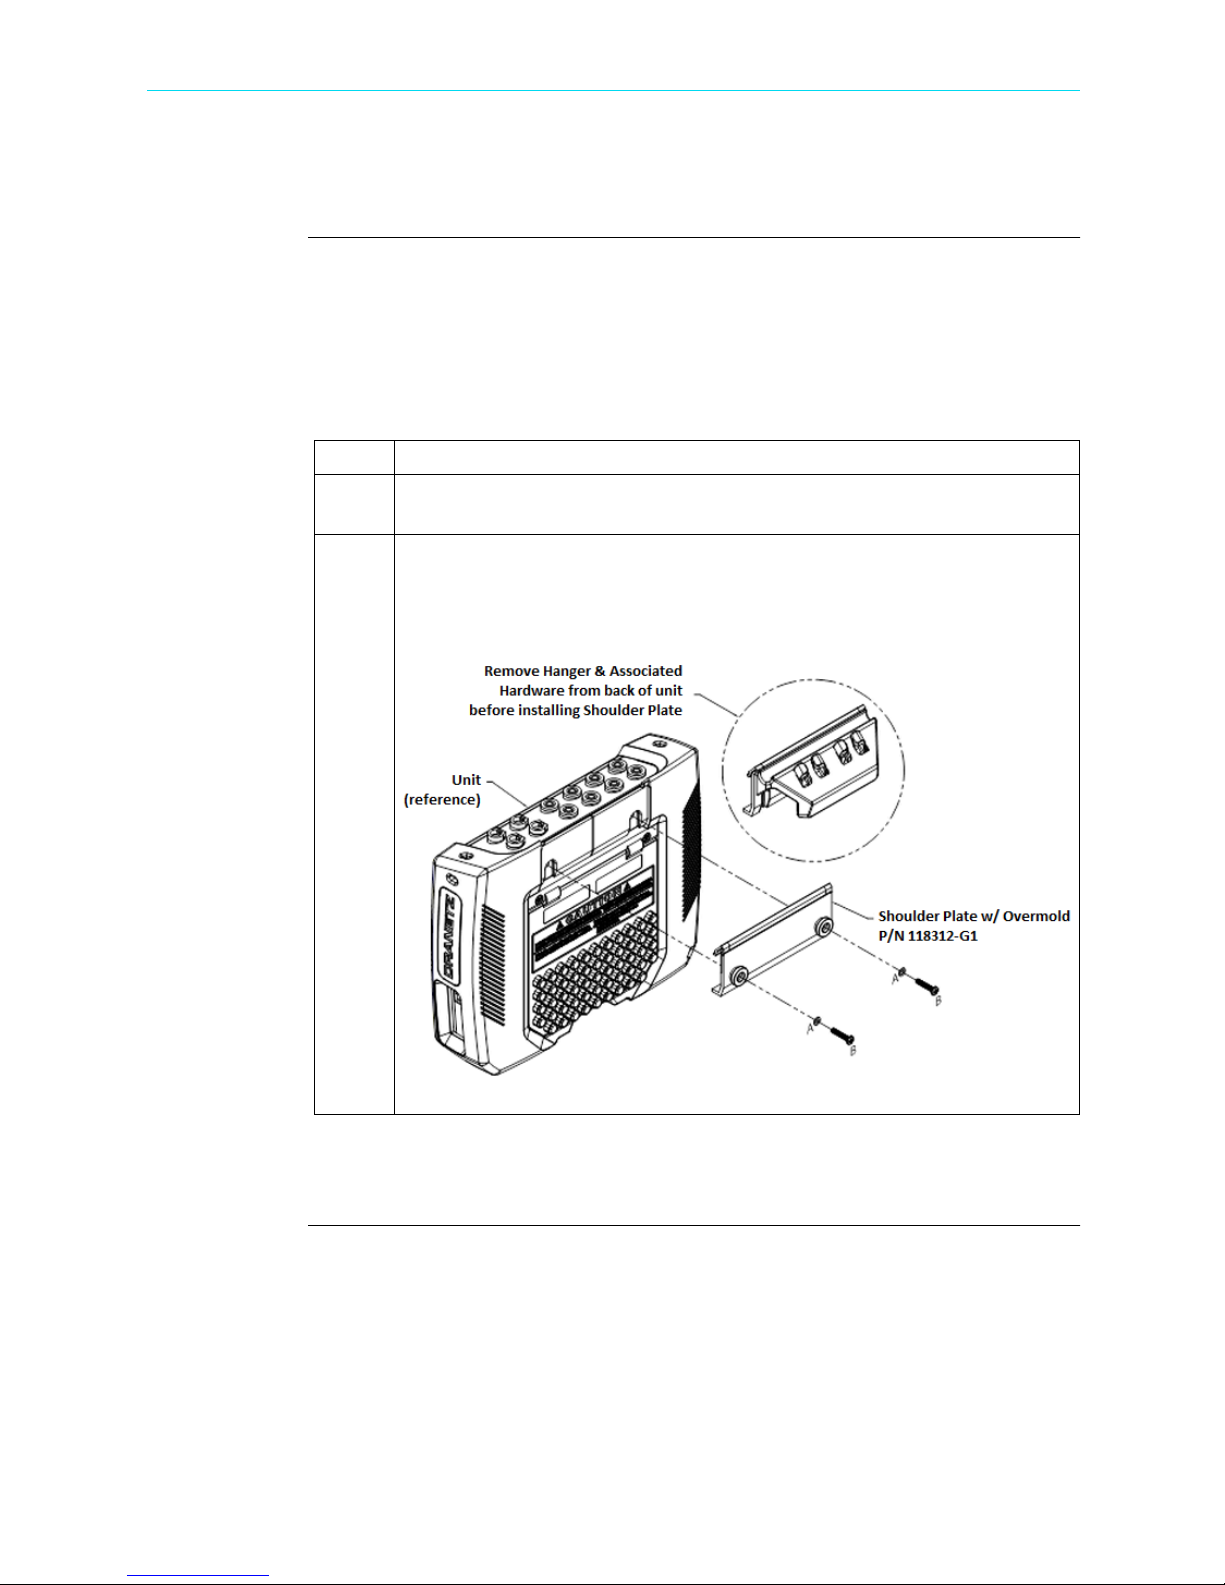
Keyhole
mounting kit
The Keyhole Mounting Kit (P/N 118313-G1) is a standard accessory that comes with
your purchase of the HDPQ Xplorer, Guide, or Visa, and can be used to replace the
mounting hanger bracket. Instead of hanging the instrument on a panel, you can use the
kit to have the instrument wall mounted or installed in the optional Weather Resistant
Enclosure (P/N ENCL-HDPQ). The procedure below shows how to replace the
mounting hanger bracket with the keyhole mounting kit.
Step Action
1 Remove the hanger bracket from the instrument by removing two #6-32 x 5/
16" long screws and two flat washers from the hanger bracket.
Replace the hanger bracket with the keyhole mounting plate (P/N 118312-
2
G1) and secure it to the instrument with the supplied hardware (two #6-32 x
3/4" inch long screws and two flat washers) as shown below.
Contact Dranetz Customer Service if you need information on the optional Weather
Resistant Enclosure (P/N ENCL-HDPQ).
Shop for Power Metering products online at:
www.PowerMet erStore.com
1-11
1.877.766.5412
Page 26
Upgrading Firmware
Continued on next page
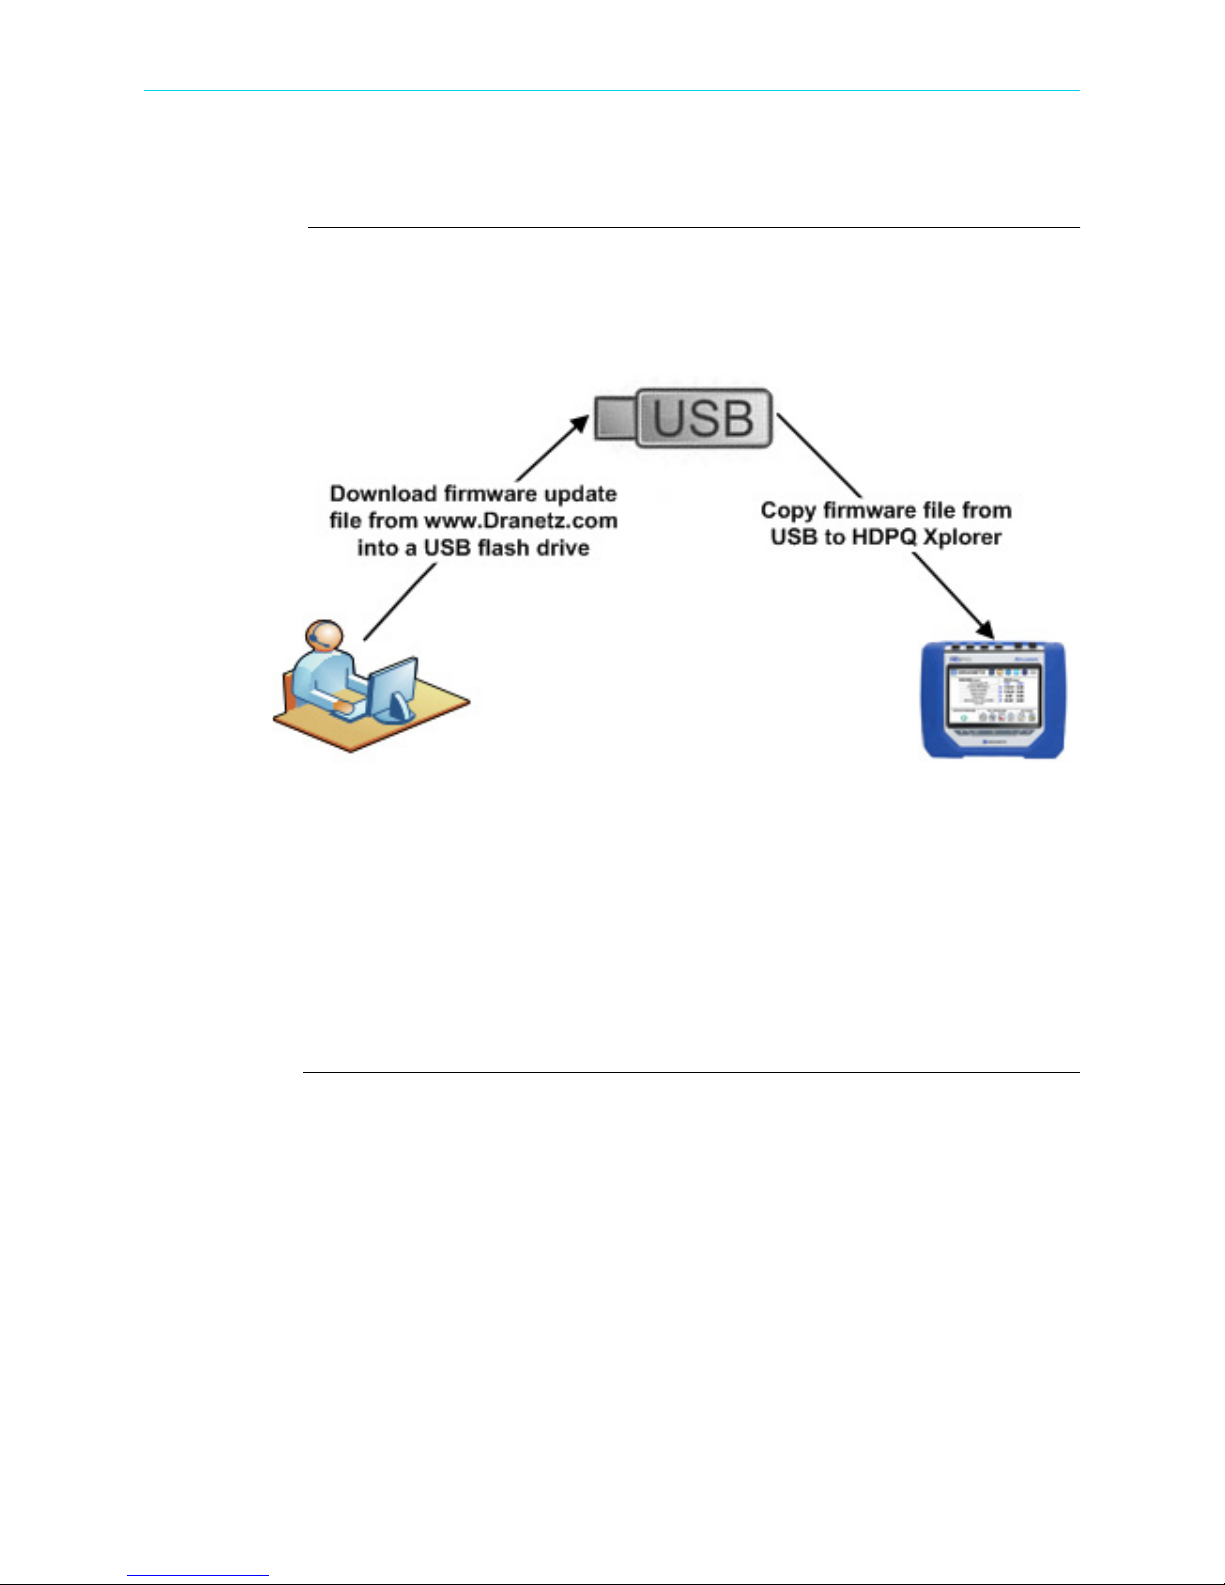
Upgrading Firmware
HDPQ Xplorer
firmware
upgrade
You can upgrade the HDPQ Xplorer internal program by downloading the latest
firmware update release from the web to install into internal memory.
Illustration below shows the high level process for updating firmware:
• Download the latest firmware update release from the Dranetz website into the root
directory of a USB flash drive.
• Once the firmware file is copied, insert the USB flash drive into the USB connector
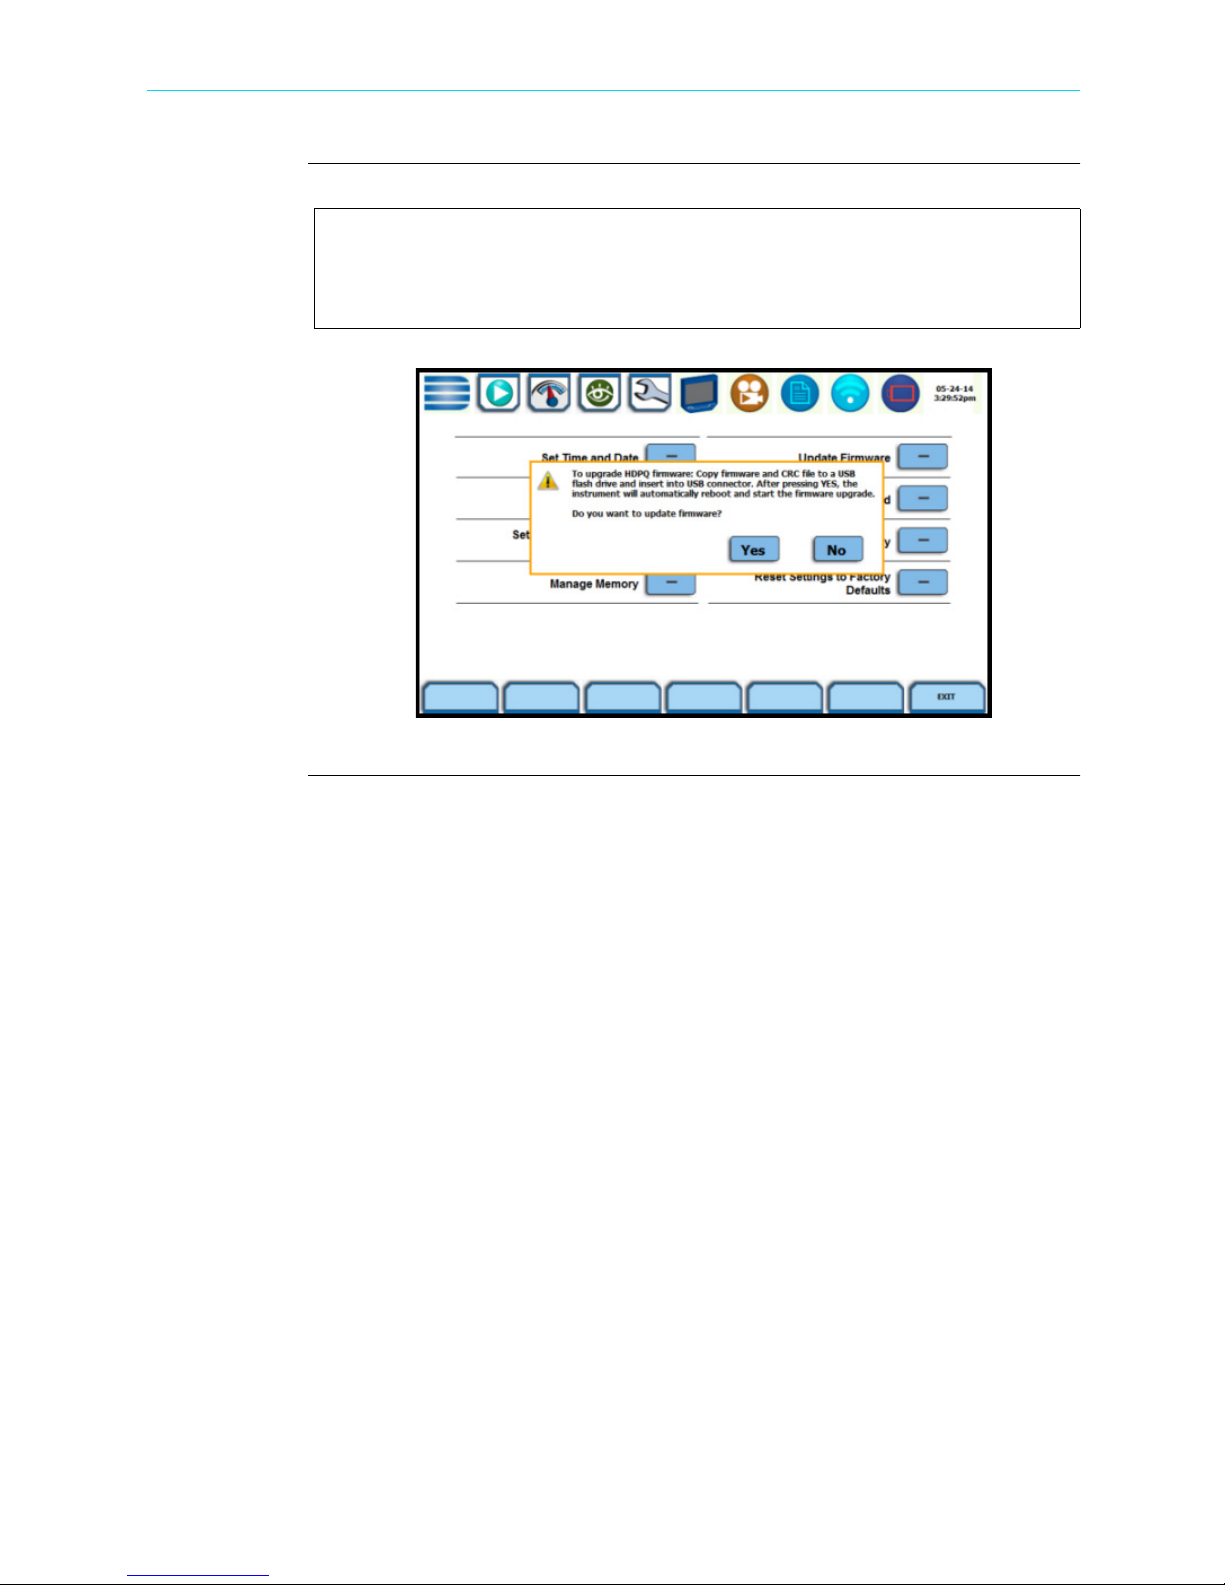
on the right panel of the instrument.
• Click on the Setup Instrument icon to bring up the Instrument Settings menu, and
proceed to press Update Firmware. The following dialog box appears to prompt
whether or not you want to upgrade firmware.
1-12
Shop for Power Metering products online at:
www.PowerMet erStore.com
1.877.766.5412
Page 27
HDPQ Xplorer
firmware
upgrade
(continued)
CH 1/ Getting Started
Refer to Chapter 5 Instrument Settings > Update Firmware for the
detailed steps on how to upgrade firmware.
HDPQ-514
Shop for Power Metering products online at:
www.PowerMet erStore.com
1-13
1.877.766.5412
Page 28
HDPQ Xplorer UI Touchscreen Features
HDPQ Xplorer UI Touchscreen Features
Touchscreen
functions
All HDPQ Xplorer screen functions are operable using the color LCD touch screen
display. Use your finger and/or a stylus to apply light pressure to the LCD screen to
result in touch screen recognition. The touch screen display is also workable with
lineman gloves on. Touch screen buttons will change color to show visual feedback of
contact along with audible feedback. In order to reduce power consumption, the
backlight of the LCD screen times-out after a specified programmable time of no user
activity. The backlight reactivates by touching any part of the screen.
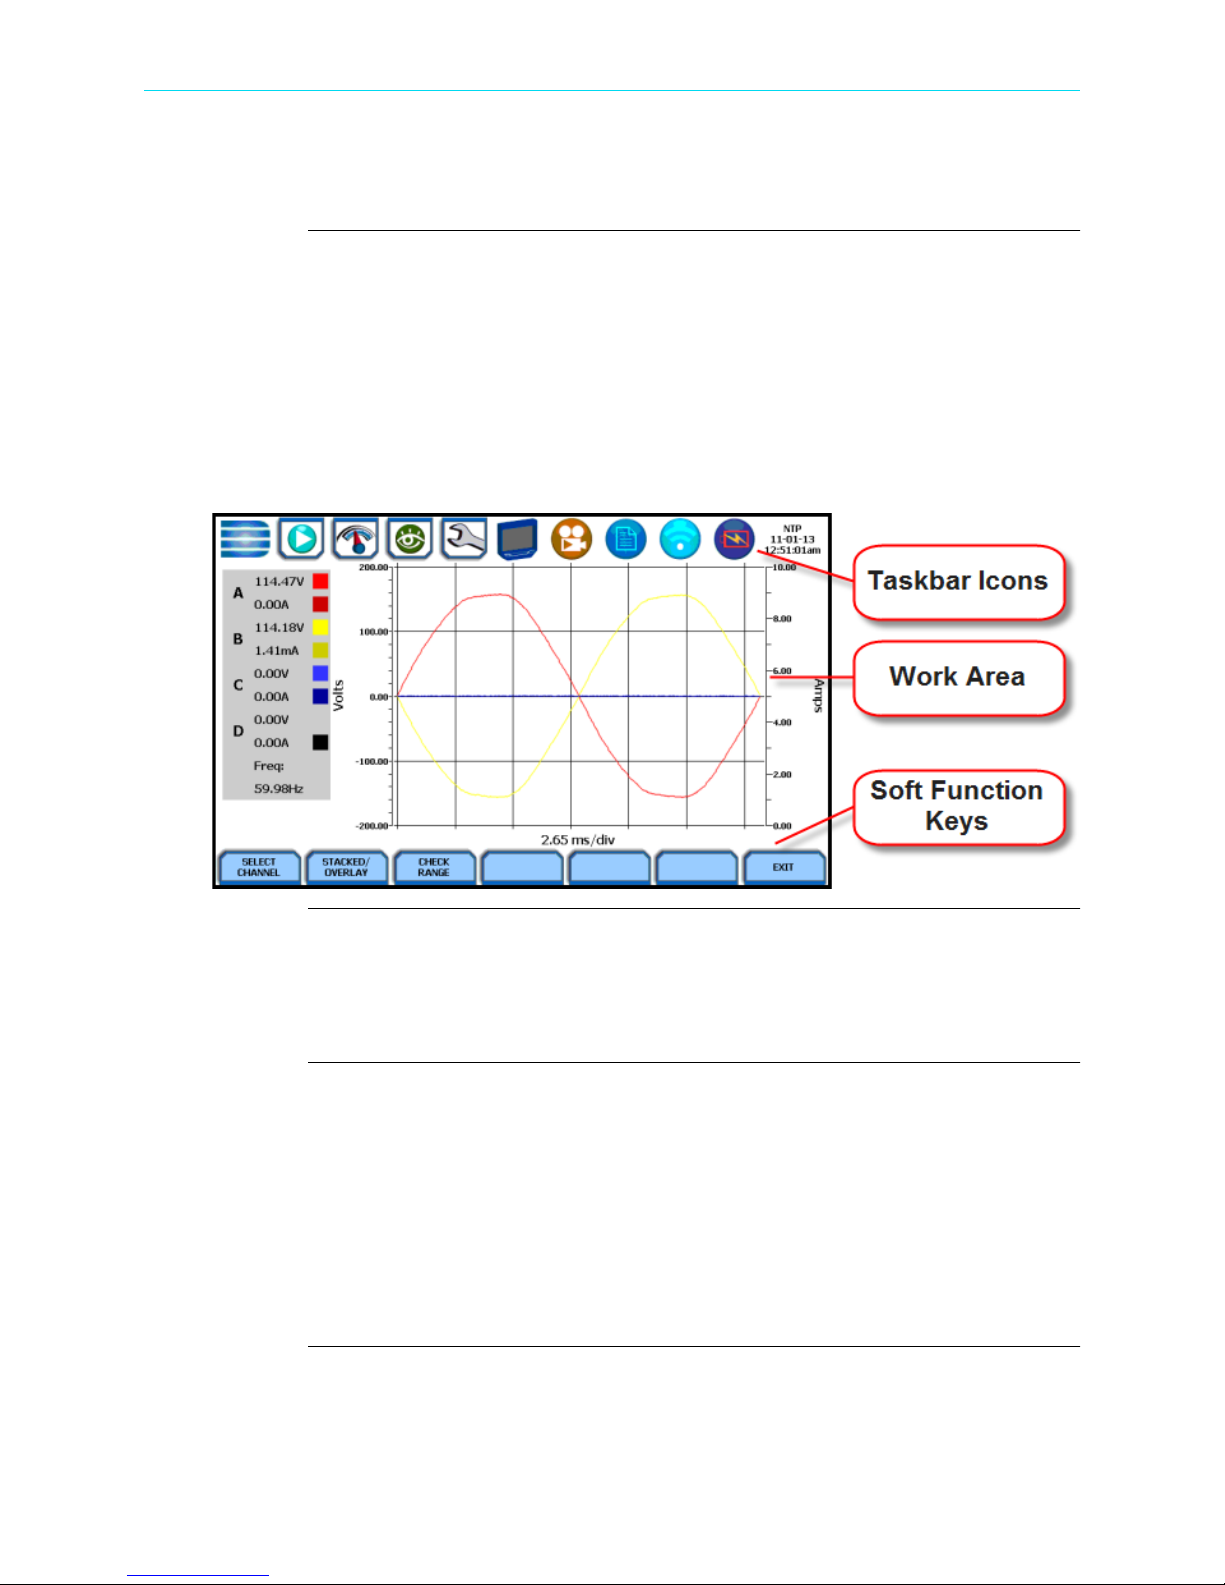
Sample touchscreen working area window shown below:
1-14
Taskbar Icons
The Taskbar features interactive icon graphics located at the top of the user interface.
These icons are used as shortcuts to common instrument functions, status and controls.
They are generally used to navigate between different operations of the instrument.
Work Area with Soft Function Keys
Each displayable function will appear in the work window. The work window displays
the selected data, function, control, etc.
Depending on the data function on display, the work window may show soft function
keys, the definitions of which can change based on the context of the screen. These soft
keys are generally used to access sub-menus or pop-up screens as part of the operation
of the active screen, such as zoom in/out, data entry, etc. The Exit or Done key typically
closes the present viewing screen and returns to the previous screen.
Shop for Power Metering products online at:
www.PowerMet erStore.com
1.877.766.5412
Page 29
CH 1/ Getting Started
Continued on next page
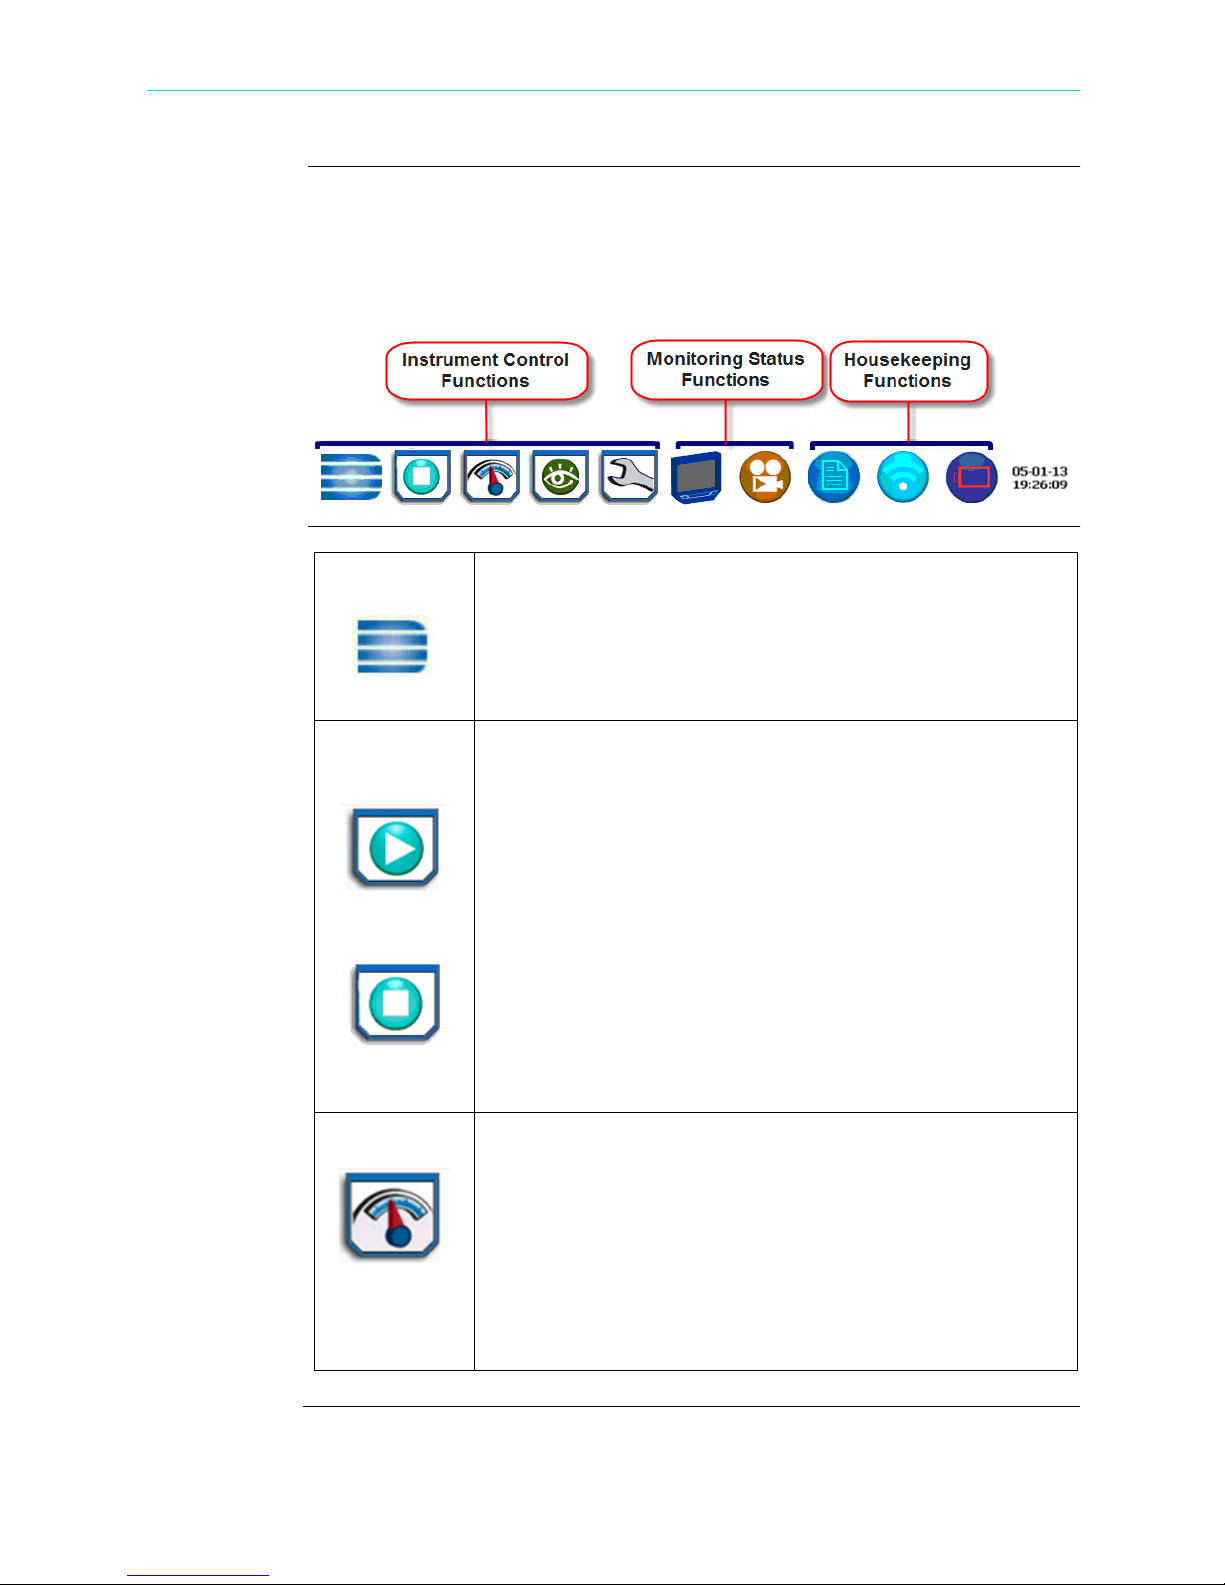
Taskbar icons
Instrument
control functions
Common functions described below are accessible from the taskbar, generally divided
into three areas - Instrument Control Functions, Monitoring Status Functions and
Housekeeping Functions. The current date and time is also featured on the rightmost
side. You can configure date and time settings, discussed on Chapter 5 Instrument
Settings - Time and Date Settings.
Home The Home page displays large shortcuts of the major functions of
the instrument once it completes the power on sequence and loads
the program and setups. The shortcut buttons include Start
Monitoring, Real Time Data, Recorded Data and Instrument Setup.
Repeated pressing of the Dranetz logo alternately displays the
Home page and the Home Monitoring page.
Start/Stop
Monitoring
Start Monitoring
The Start Monitoring shortcut takes you next page to begin setup
monitoring. Monitoring may be via Automatic Setup which
utilizes auto-configured settings and allows you to proceed directly
with data monitoring or via Wizard Setup which follows a step-bystep sequence where you go through a series of setup screens. If
monitoring is ON, a warning message will be displayed requiring
monitoring to be stopped before invoking. Note the Start
Monitoring icon changes into Stop Monitoring when monitoring is
on, and vice versa.
Stop Monitoring
Real-time Data The Real-Time Data displays a menu of available real time meters
Shop for Power Metering products online at:
Menu options to monitor the same circuit, begin monitoring
immediately or at a specified time and date, load and view stored
setups or data are also available. Setup is a configuration of
parameter thresholds that control the data recorded by HDPQ
Xplorer.
such as Meters, Scope, Phasors and Harmonics. One instance of
this can be invoked while the other screen is open; display will
return to the prior screen once closed.
• Dial Meters - Six dial type meters can be displayed for any of
the channel/parameters that are journalled. The default are
Va,Vb,Vc, Ia, Ib, Ic. Axis (end points of meter) can be changed
on per meter basis, as well as showing the journal limits as
bands of colors on the dial face.
www.PowerMet erStore.com
1-15
1.877.766.5412
Page 30

HDPQ Xplorer UI Touchscreen Features, continued
Continued on next page
Instrument
control functions
(continued)
Real-time Data
(cont.)
• Text Display Meters - Meter mode also functions as a true rms
voltmeter, a true rms ammeter, and a watt meter. Voltage,
current, power measurements, along with hundreds of other
calculated and advanced power and power quality parameters,
are displayed on the meter screens in textual/tabular format.
• Scope Mode - Scope mode functions as an oscilloscope,
displaying real-time waveforms of voltage and current for up to
eight channels simultaneously, updated at approximately once
every three seconds. The colors of waveform display are user
programmable. Scope mode also provides a textual display of
rms values, division for axis values, and frequency.
• Dashboard - Dashboard presents a visual way of seeing present
values as well as if any events occurred, such as out-of-limit
conditions, for each of the displayed parameter. The dashboard
displays status summary for Power Quality, Energy/Demand,
and Motor Quality parameters. It displays meter data (or event
count) in a 2x3, 3x4, or 4x6 matrix. It is also color coded to
indicate whether or not the parameter is within limits.
• Phasor Diagram - The phasor screen displays a graph that
indicates phase and magnitude relations between voltage and
current based upon the angles at the fundamental frequency, as
determined by Fourier analysis. Phasor diagram displays voltage
and current phasors for all channels.
Functioning as a phase angle meter, the unit can display system
imbalance conditions and provides such information in textual
form also. The phase angle display can also verify if monitoring
connections have been made correctly. Animated phasor demo
rotations demonstrating resistive, inductive and capacitive loads
can be displayed.
• Harmonics - Harmonics and interharmonics display the
amplitude and phase of each harmonic to the 127th harmonic in
both graphical and textual format.
1-16
Shop for Power Metering products online at:
www.PowerMet erStore.com
1.877.766.5412
Page 31

CH 1/ Getting Started
Instrument
control functions
(continued)
Recorded Data Recorded Data displays captured information in either graphic or
textual form, including events and trends, along with voltage
compliance and mini-reports. These include both trended data and
events generated from user programmed triggers or thresholds.
One instance of this can be invoked while another screen is open
and will return to prior screen upon exit.
•Trend - You can generate plots for all journalled data combined
with min/max recordings of that parameter. Most journal
parameters have multiple channels to plot.
• Event - An event occurs when a programmed threshold limit is
crossed. An event consists of the pre-trigger cycle(s), trigger
cycle(s), and post-trigger cycle(s).
• Reports - You can view and set up compliance data in various
report format, depending on your application:
Voltage Quality of Supply (QOS) compliance displays statistical
reports based on an analysis of the voltage as per requirements
of the EN50160 standard. Compliance data is presented in bar
charts, statistical tables, and graphs. Statistical data is calculated
on the required parameters specified in EN50160 over one week
interval to produce a PASS/FAIL decision of QOS compliance.
Setup
Instrument
Energy & Demand Report allows you to monitor demand and
energy parameters for energy audits, efficiency studies and cost
reduction programs.
Harmonics Statistics Report allows you to set up harmonics
statistical reports, based on the 3-second data calculating the
95% and 99% values per IEC 61000-4-7 and IEEE 519.
Mini-Report Viewer allows you to view, delete or save
monitoring setups and/or status into a report file. You can also
save the active image on screen and append it to the report as
visual aid.
This function covers instrument configuration settings such as time
and date display preferences, language selection, communications
options, manage memory, firmware upgrade, etc.
Shop for Power Metering products online at:
www.PowerMet erStore.com
1-17
1.877.766.5412
Page 32

HDPQ Xplorer UI Touchscreen Features, continued
Monitoring
status functions
Monitoring status presents the current status of the instrument such as monitoring on/
off, errors/warnings, etc. These functions invoke pop-up windows and return to the
prior screen upon exit.
Instrument
Status
This window displays status information about the instrument,
including versions of firmware, serial number, MAC address, line
synch status, input status, the last three error messages. It indicates
the health of the instrument and whether or not there is any error
or warning conditions that require attention. Example Instrument
Status screen shown below.
Monitoring
Summary
HDPQ-102
Displays a page showing a summary of the current monitoring
session. This window also includes event and timed reading
counts, last event, monitoring status and start, percent of memory
used and the remaining estimate. Example Monitoring Summary
screen shown below.
HDPQ-103
1-18
Shop for Power Metering products online at:
www.PowerMet erStore.com
1.877.766.5412
Page 33

CH 1/ Getting Started
Continued on next page
Housekeeping
functions
Housekeeping includes generic functions such as mini-report status, Bluetooth or
network wireless connection, and power supply/battery gage. These functions invoke
pop-up windows and return to the prior screen upon exit.
Mini-Report
Mini-Report Status allows you to view report setups and status.
Status
HDPQ-104
Communications
Options
Press Setup Instrument to configure the instrument’s Wireless
(WiFi) and Bluetooth communications options. The Xplorer
requires the addition of a Dranetz supplied Bluetooth external
adapter in order to connect to a wireless-enabled device using the
Bluetooth networking mode. The Bluetooth interface uses a PAN
network that is only available on PC based devices.
Signal strong
Signal weak
Signal
unavailable
HDPQ-105
Shop for Power Metering products online at:
www.PowerMet erStore.com
1-19
1.877.766.5412
Page 34

HDPQ Xplorer UI Touchscreen Features, continued
Housekeeping
functions
(continued)
Battery / Power
Supply Status
Displays battery charge status when powered externally. Displays
battery percent charge remaining when operating from internal
battery as well as charging level if power supply is plugged in to a
valid AC source.
When battery is not charging:
Taskbar displays battery icon indicating the percentage of battery
life that HDPQ Xplorer has remaining.
HDPQ-106
Time/Date
Battery life:
When battery is charging:
Taskbar displays battery icon indicating the percentage of battery
charge.
Battery charge:
Displays the current time and date. See Chapter 5 Instrument
Settings - Time and Date Settings.
100%
75%100%
75% 50%
50%
25%
25%
0%
0%
1-20
Shop for Power Metering products online at:
www.PowerMet erStore.com
1.877.766.5412
Page 35

CH 1/ Getting Started
General
navigation
functions
General navigation screens include the numeric and alphanumeric keypads.
Numeric
Keypad
Features numeric keypad window for multiple uses. Press a
numeric entry field to display the numeric keypad. This keypad
also appears automatically when you press a screen that requires
numeric entry.
Alphanumeric
Keypad
Features generic alphanumeric keyboard in QWERTY format.
Press a text entry field to display the alphanumeric keypad. This
keypad also appears automatically when you press a screen that
requires text entry.
HDPQ-107
Shop for Power Metering products online at:
www.PowerMet erStore.com
HDPQ-108
1-21
1.877.766.5412
Page 36

HDPQ Xplorer Touch Icon Buttons
HDPQ Xplorer Touch Icon Buttons
Touch icon
functions
There are three touch icons located below the LCD screen - Snapshot, Mini-Report
Capture and Help. The icon buttons allow you to perform functions specific to the
screen on display, as described below:
Snapshot Icon
This icon captures the image on the screen as a .bmp file. The captured image includes
the top and bottom row of buttons. The instrument appends the captured image to a
mini-report if one is open. If no report is open, it saves the image to internal memory as
a .bmp file.
Mini-Report Capture Icon
This icon saves the active screen image to a report file. Pressing the left touch icon is
similar to doing a Cntrl-PrintScrn on Windows
screen to an open report file. Prior to pressing, use the middle key to open a MiniReport (see Chapter 6 - Section C Reports - Mini-Report Viewer). Pressing the MiniReport Capture icon without an open file will bring up the Mini-Report Start menu,
which lets you create a new report file. The instrument allows only one (1) file to be
opened at a time. Graphics are saved as images in .bmp format while alphanumeric
content is saved as xml file. After a report is opened, pressing this icon a second time
allows you to close the report list.
Help Icon
This icon allows you to access instant on screen Help. It is context sensitive, in that it
displays the pertinent Help information based on the active screen.
®
. It appends the image of the active
1-22
Shop for Power Metering products online at:
www.PowerMet erStore.com
1.877.766.5412
Page 37

Basic Operation
CH 1/ Getting Started
Introduction
Battery pack
AC power
source
The normal power source for the HDPQ Xplorer is its internal battery pack. The AC
Adapter/Battery Charger is used to charge the battery. Always charge the battery fully
before use. HDPQ Xplorer will always operate on the charger and is designed to do so,
regardless of the state of charge of the battery.
Sealed, rechargeable NiMH (Nickel Metal Hydride) cells.
Type:
Length of operation
approximately three (3) hours of continuous use.
Charging
Charger to the HDPQ Xplorer. A screen warning will appear during operation when
battery charge is low. A depleted battery pack can be recharged in three (3) hours
whether the unit is on or off. While charging, the taskbar displays a battery icon
indicating the percent of battery charge.
HDPQ Xplorer can be operated from a 50/60 Hz 120/240V AC power source with or
without the battery pack installed.
Connect the AC Adapter output cable to the input connector on the left side of the unit.
Connect the AC Adapter to an appropriate outlet using the appropriate adapter plug.
: The battery pack can be charged by connecting the AC Adapter/Battery
: HDPQ can operate on a fully charged battery pack for
Refer to Appendix C for the specifications and replacement of the batteries contained
in HDPQ Xplorer.
Shop for Power Metering products online at:
www.PowerMet erStore.com
1-23
1.877.766.5412
Page 38

Basic Operation, continued
Power-on
sequence
Follow these steps to turn on the HDPQ Xplorer and display the Home page.
Step Action
1 Connect the AC adapter/battery charger plug into the left side of the
instrument.
2 Plug the AC adapter into an AC power source.
3 Press the On/Off power switch located at the left side to turn the instrument
on.
: The Dranetz logo will be displayed while the instrument is booting.
Result
HDPQ-109
4 After the instrument completes the power on sequence and loads the
program and setups in, the Home screen displays the large shortcut buttons
of the major functions of the instrument. This allows you to easily select the
first function after power up.
: The Home page will be displayed. The icons represent four main
Result
instrument functions: Start Monitoring, Real Time Data, Recorded Data
(events, data, reports) and Setup Instrument.
HDPQ-110a
NOTE: If the instrument was shut down while monitoring, the instrument
will resume monitoring upon power up.
1-24
Shop for Power Metering products online at:
www.PowerMet erStore.com
1.877.766.5412
Page 39

CH 1/ Getting Started
Home start-up
page
Home
monitoring page
Upon start-up, the Home page serves as the access point for major instrument control
functionalities, as described below:
Start Monitoring - You have the option to use Automatic Setup and proceed directly
with data monitoring or configure the instrument step-by-step using the Wizard Setup.
You can also load previously saved setups or previously saved data from memory.
Setup is a configuration of parameter thresholds that control the data recorded by
HDPQ Xplorer. See Chapter 4 Setup Monitoring.
Real-Time Data - Displays voltage and current measurements, along with other
calculated parameters in different modes. See Chapter 3 Real Time Data.
Recorded Data - Displays recorded data in either graphic or textual form, including
events and trends, along with mini-reports and voltage compliance (EN50160) reports.
See Chapter 6 View Event Data & Reports.
Setup Instrument - You may perform instrument configuration settings such as time
and date display preferences, language selection, communications options, firmware
update, etc. See Chapter 5 Instrument Settings.
After the instrument has been powered up and monitoring is turned ON (and
subsequently if monitoring is DONE), the Home Monitoring page becomes the start-up
page.
Note the Start Monitoring icon changes into Stop Monitoring when monitoring
status is on, and vice versa.
Home Monitoring page allows you to view monitoring status and setups as configured.
The taskbar located on top of the screen features shortcuts to common instrument
functions. Icons to access real time meters and to view recorded data/reports are found
at the bottom of screen. This is the home page from which all other functions launch
and eventually return back to using the Exit function key.
HDPQ-111b
Shop for Power Metering products online at:
www.PowerMet erStore.com
1-25
1.877.766.5412
Page 40

This page intentionally left blank.
1-26
Shop for Power Metering products online at:
www.PowerMet erStore.com
1.877.766.5412
Page 41

CHAPTER 2
Continued on next page
Voltage Measurement Cable and Current Probe Connections
Overview
Introduction
In this chapter
WARNING Death, serious injury, or fire hazard could result from improper connection of this
This section describes how to connect the HDPQ Xplorer to make basic single phase
voltage measurements. For multi-phase connection diagrams, refer to Appendix E.
The following topics are covered in this c
Topic See Page
Connecting Voltage Measurement Cables 2-4
Connecting Current Probes 2-10
instrument. Read and understand this manual before connecting this instrument.
Follow all installation and operating instructions while using this instrument.
Connection of this instrument must be performed in compliance with the National
Electrical Code (ANSI/NFPA 70-2014) and any additional safety requirements
applicable to your installation.
Installation, operation, and maintenance of this instrument must be performed by
qualified personnel only. The National Electrical Code defines a qualified person
as one who has the skills and knowledge related to the construction and operation
of the electrical equipment and installations, and who has received safety training
on the hazards involved.
hapter.
Qualified personnel who work on or near exposed energized electrical conductors
must follow applicable safety related work practices and procedures including
appropriate personal protective equipment in compliance with the Standard for
Electrical Safety Requirements for Employee Workplaces (ANSI/NFPA 70E-2012)
of USA and any additional workplace safety requirements applicable to your
installation.
Shop for Power Metering products online at:
www.PowerMet erStore.com
2-1
1.877.766.5412
Page 42

Overview, continued
ADVERTENCIA
Una conexión incorrecta de este instrumento puede producir la muerte, lesiones
graves y riesgo de incendio. Lea y entienda este manual antes de conectar. Observe
todas las instrucciones de instalación y operación durante el uso de este
instrumento.
La conexión de este instrumento debe ser hecha de acuerdo con las normas del
Código Eléctrico Nacional (ANSI/NFPA 70-2014) de EE. UU., además de
cualquier otra norma de seguridad correspondiente a su establecimiento.
La instalación, operación y mantenimiento de este instrumento debe ser realizada
por personal calificado solamente. El Código Eléctrico Nacional define a una
persona calificada como "una que esté familiarizada con la construcción y
operación del equipo y con los riesgos involucrados."
El personal cualificado que trabaja encendido o acerca a los conductores
eléctricos energizados expuestos debe seguir prácticas y procedimientos
relacionados seguridad aplicable del trabajo incluyendo el equipo protector
personal apropiado en conformidad con el estándar para los requisitos de
seguridad eléctricos para los lugares de trabajo del empleado (ANSI/NFPA 70E-
2012) de los E.E.U.U. y cualquier requisito de seguridad adicional del lugar de
trabajo aplicable a su instalación.
AVERTISSEMENT
Si l'instrument est mal connecté, la mort, des blessures graves, ou un danger
d'incendie peuvent s'en suivre. Lisez attentivement ce manuel avant de connecter
l'instrument. Lorsque vous utilisez l'instrument, suivez toutes les instructions
d'installation et de service.
Cet instrument doit être connecté conformément au National Electrical Code
(ANSI/NFPA 70-2014) des Etats-Unis et à toutes les exigences de sécurité
applicables à votre installation.
Cet instrument doit être installé, utilisé et entretenu uniquement par un personnel
qualifié. Selon le National Electrical Code, une personne est qualifiée si "elle
connaît bien la construction et l'utilisation de l'équipement, ainsi que les dangers
que cela implique".
Le personnel qualifié qui travaillent dessus ou s'approchent des conducteurs
électriques activés exposés doit suivre des pratiques en matière et des procédures
reliées par sûreté applicable de travail comprenant le matériel de protection
personnel approprié conformément à la norme pour des conditions de sûreté
électriques pour les lieux de travail des employés (ANSI/NFPA 70E-2012) des
Etats-Unis et toutes les conditions de sûreté additionnelles de lieu de travail
applicables à votre installation.
2-2
Shop for Power Metering products online at:
www.PowerMet erStore.com
1.877.766.5412
Page 43

CH 2/ Voltage Measurement Cables and Current Probe Connections
Continued on next page
WARNUNG Der falsche Anschluß dieses Gerätes kann Tod, schwere Verletzungen oder Feuer
verursachen. Bevor Sie dieses Instrument anschließen, müssen Sie die Anleitung
lesen und verstanden haben. Bei der Verwendung dieses Instruments müssen alle
Installation- und Betriebsanweisungen beachtet werden.
Der Anschluß dieses Instruments muß in Übereinstimmung mit den nationalen
Bestimmungen für Elektrizität (ANSI/NFPA 70-2014) der Vereinigten Staaten,
sowie allen weiteren, in Ihrem Fall anwendbaren Sicherheitsbestimmungen,
vorgenommen werden.
Installation, Betrieb und Wartung dieses Instruments dürfen nur von
Fachpersonal durchgeführt werden. In dem nationalen Bestimmungen für
Elektrizität wird ein Fachmann als eine Person bezeichnet, welche "mit der
Bauweise und dem Betrieb des Gerätes sowie den dazugehörigen Gefahren
vertraut ist."
Qualifiziertes Personal, das an bearbeiten oder herausgestellte angezogene
elektrische Leiter sich nähern, muß anwendbare Sicherheit bezogener Arbeit
Praxis und Verfahren einschließlich passende persönliche schützende Ausrüstung
gemäß dem Standard für elektrische Sicherheitsauflagen für AngestelltArbeitsplätze (ANSI/NFPA 70E-2012) der Vereinigten Staaten und alle
zusätzlichen Arbeitsplatzsicherheitsauflagen folgen, die auf Ihre Installation
anwendbar sind.
Safety
precautions
The following safety precautions must be followed whenever any type of voltage or
current connection is being made to the HDPQ Xplorer.
• Review NFPA70-E Standard for Electrical Safety Requirements for Employee
Workplaces for applicable safety requirements for potential electrical hazards that
may be encountered.
• Wear proper Personal Protective Equipment, including safety glasses and insulated
gloves when making connections to power circuits.
• Hands, shoes and floor must be dry when making any connection to a power line.
• Before each use, inspect all cables for breaks or cracks in the insulation. Replace
immediately if defective.
• Press the HDPQ Xplorer On/Off power switch to Off.
• Before connecting to electric circuits to be monitored, open their related circuit
breakers or disconnects. DO NOT install any connection of the HDPQ Xplorer to
live power lines.
• Connections must be made to the HDPQ Xplorer first, then connect to the circuit to
be monitored.
• If the equipment is used in a manner not specified in this User Guide, the protection
provided by the equipment may be impaired.
Shop for Power Metering products online at:
www.PowerMet erStore.com
2-3
1.877.766.5412
Page 44

Connecting Voltage Measurement Cables
Continued on next page
Connecting Voltage Measurement Cables
Measurement
cable set
Optional fused
voltage adapter
Description
stored in a cable pouch as part of the measurement cable set, P/N VSC-HDPQ. Each
cable set consists of a cable and alligator clip.
Voltage Rating
VCAT III Vrms max. For measuring voltages greater than 1000 Vrms, potential
transformers (PTs) must be used.
Contents
optional fused voltage adapter is shown on page 2-6. A cable set consists of eight, 6foot channel measurement cable assemblies (probes), each with a detachable, alligator
jaw, safety clip assembly (maximum jaw opening, 3/4 in (20 mm)). There are four (4)
black and four (4) white safety clips. While there are eight (8) black cables with
different color wire markers to identify which phase or circuit wire each is connected
to.
A pouch for storage of the cables and the AC adapter/battery charger is included in the
contents of the measurement cable set, but is not shown in the figure.
There are two optional fuse voltage adapter accessory kits available for use with the
measurement cables for the HDPQ Xplorer. A single kit (P/N FVA-1K1) contains one
(1) fuse voltage adapter and one (1) black measurement connecting cable 50 cm in
length. The other kit (P/N FVA-1K4) contains four (4) fuse voltage adapters and four
(4) black measurement connecting cables 50 cm in length. These fuse voltage adapters
are rated up to 1000V AC/DC applications.
: Voltage measurement cables are provided as standard accessories and are
: Direct connection of all voltage measurement cables are rated at 1000
: Example photo of HDPQ Xplorer with voltage measurement cable and
Wire markers
2-4
A wire marker kit consisting of snap-on wire markers in various colors are also
supplied with each fuse voltage adapter to be used for identifying connections
applicable to your installation.
The single fuse voltage adapter kit is used for one single voltage measurement input.
While the four fuse voltage adapter kit is used for a three phase and neutral voltage
measurement inputs.
Each kit consisting of snap-on wire markers in various colors is supplied as described
in the following table. These wire markers are to be used to identify each wire
connection applicable to your installation.
Shop for Power Metering products online at:
www.PowerMet erStore.com
1.877.766.5412
Page 45

CH 2/ Voltage Measurement Cables and Current Probe Connections
Wire markers
(continued)
• WMV-KIT (118376-G1) wire marker kit is included with the standard measurement
cable set and is used for identifying voltage cables.
• WMI-KIT (118377-G1) wire marker kit is included with the standard measurement
cable set and is used for identifying current probes.
• WMFV-KIT (118376-G2) wire marker kit is supplied with each Fuse Voltage
Adapter and is used for identifying voltage cables.
Wire Marker
Color
Blue 16 4 4
Black 4 4 4
Brown 4 4 4
Orange 4 4 4
Yellow 4 4 4
Red 4 4 4
Green 4 4 4
White 16 4 4
WMV-KIT
Quantity
(0.138 inch diameter)
WMI-KIT
Quantity
(0.218 inch diameter)
WMFV-KIT
Quantity
(0.138 inch diameter)
Shop for Power Metering products online at:
www.PowerMet erStore.com
2-5
1.877.766.5412
Page 46

Connecting Voltage Measurement Cables, continued
Measurement
cable with
optional fuse
voltage adapter
WARNING
WARNING
WARNING
WARNING
To avoid the risk of electric shock or burns, always connect the safety (or earth)
ground before making any other connections.
To reduce the risk of fire, electrical shock, or physical injury it is strongly
recommended to fuse the voltage measurement inputs.
Fuses must be located as close to circuit connection as possible to maximize
protection.
For continued protection against risk of fire or shock hazard replace only with
same type and rating of fuse.
Do not replace fuse again if failure is repeated. Repeated failure indicates a
defective condition that will not clear with replacement of the fuse. Refer
condition to a qualified technician.
Contact Dranetz Customer Service for more information on the fused voltage adapter.
Refer to Dranetz Information Sheet titled Fuse Voltage Adapter 1000V AC/DC FVA1K1 & FVA-1K4, P/N 899220.
2-6
Shop for Power Metering products online at:
www.PowerMet erStore.com
1.877.766.5412
Page 47

CH 2/ Voltage Measurement Cables and Current Probe Connections
Continued on next page
Connection
guidelines
Example: Single
phase
connection
Follow these guidelines when making voltage connections.
• Refer to the measurement cable set figure for probes that connect to input channel
connectors A, B, C, and D.
• Each channel input has plus (+) and minus (-) differential inputs of 1 to 1000 Vrms
max.
The following figure shows a voltage connection to a single phase circuit for channel
A.
Shop for Power Metering products online at:
www.PowerMet erStore.com
HDPQ-901a
2-7
1.877.766.5412
Page 48

Connecting Voltage Measurement Cables, continued
Example:
Neutral to
ground
connection
The following figure shows a voltage connection using channel D as a differential input
for measuring neutral to ground voltage or other applications. Connections are identical
for split phase and wye configurations. One probe connects the source neutral line to
the D+ input. Another probe connects the ground to the D- input.
HDPQ-901c
2-8
Shop for Power Metering products online at:
www.PowerMet erStore.com
1.877.766.5412
Page 49

CH 2/ Voltage Measurement Cables and Current Probe Connections
Safety
precautions
WARNING
ADVERTENCIA
AVERTISSEMENT
The following safety precautions apply to current probe connections in addition to
those safety precautions stated on page 2-3.
• DO NOT attempt to measure current in any circuit in which the circuit to ground
voltage exceeds the insulation rating of the current probe (see Appendix B Technical
Specifications - Current Probes for ratings of current probes).
• Make sure the jaws of the current probe are tightly closed. Keep mating surfaces
clean and free from foreign matter.
DO NOT USE non-insulated current probe cores around a non-insulated wire.
Probes of this type are designed for use around insulated wires only. Use only
completely insulated probe cores with no exposed conductive areas of the core
around non-insulated wires.
NO UTILIZAR transformadores de corriente sin material aislante al rededor de
conductores sin material aislante. Los Transformadores de corriente de este tipo
est‡n dise–ados para ser utilizados solamente con conductores con aislamiento
elŽctrico. Utilizar transformadores de corriente completamente aislados
alrededor de conductores sin aislamiento.
N'EMPLOYEZ PAS les noyaux courants non-isolŽs de sonde autour d'un fil nonisolŽ. Des sondes de ce type sont concues pour l'usage autour des fils isolŽs
seulement. L'utilisation seulement a complŽtement isolŽ des noyaux de sonde
sans des secteurs conducteurs exposŽs du noyau autour des fils non-isolŽs.
WARNUNG
VERWENDEN Sie keine Stromzangen mit nicht isolierten Ferritkernen bei
Messungen an nicht isolierten Leitungen. Stromzangen dieses Typs sind nur fŸr
Messungen an isolierten Leitern geeignet. Bitte verwenden Sie zur Messung an
nicht isolierten Leitungen Stromzangen mit vollstŠndig isoliertem Kernmaterial.
Shop for Power Metering products online at:
www.PowerMet erStore.com
2-9
1.877.766.5412
Page 50

Connecting Current Probes
Continued on next page
Connecting Current Probes
Current probes
Several Dranetz current probes can be used with the HDPQ Xplorer. Actual photos of
typical probes compatible with the HDPQ Xplorer - TR (B Series) probes, PR (B
Series) probes, DRANFLEX (XLB and MHB Series) - are illustrated in the next pages,
with corresponding part numbers and descriptions. Refer to Appendix B Technical
Specifications for detailed specifications of these current probes.
NOTE: Some older probes may be incompatible with the HDPQ Xplorer. Refer to
Appendix A Optional Accessories for the list of compatible probes before connecting
any.
Probe positioning
position the probe with the arrow pointing towards the load when monitoring the line
conductor. Correct position of the probe is necessary for correct power measurements,
where in-phase voltage and current measurements are necessary. A positive watts
reading indicates that the probe is pointed towards the load, and a negative reading
indicates that the probe is pointed towards the source.
: An arrow marking on the handle is a guide to ensure that you
2-10
Shop for Power Metering products online at:
www.PowerMet erStore.com
1.877.766.5412
Page 51

CH 2/ Voltage Measurement Cables and Current Probe Connections
TR (B Series)
current probes
Actual photos of TR (B Series) probes and descriptions are shown below as aid in
probe identification. Note all the typical probes described below and in the next pages
have Hypertronics connectors that plug directly into the current inputs of the HDPQ
Xplorer without any cable adapter. Contact Dranetz Customer Service Department for
information on pricing and availability.
TR (B Series) Probe Description
Model No.
Current Range
Dranetz Part No.
Installation Category
Model No.
Current Range
Dranetz Part No.
Installation Category
Model No.
Current Range
Dranetz Part No.
Installation Category
Model No.
Current Range
Dranetz Part No.
Installation Category
Model No.
Current Range
Dranetz Part No.
Installation Category
: TR-2500B
: 10A to 500A RMS
: 118284-G1
: 600V, CAT III
: TR-2501B
: 100mA to 1.2A RMS
: 118283-G1
: 600V, CAT III
: TR-2510B
: 1A to 10A RMS
: 118285-G1
: 600V, CAT III
: TR-2550B
: 1A to 100A RMS
: 118289-G1
: 600V, CAT III
: TR-2530B
: 20A to 300A RMS
: 118287-G1
: 600V, CAT III
Shop for Power Metering products online at:
Model No.
Current Range
Dranetz Part No.
Installation Category
Model No.
Current Range
Dranetz Part No.
Installation Category
: TR-2540B
: 10A to 1000A RMS
: 118288-G1
: 600V, CAT III
: TR-2520B
: 100A to 3000A RMS
: 118286-G1
: 600V, CAT III
www.PowerMet erStore.com
2-11
1.877.766.5412
Page 52

Connecting Current Probes, continued
PR (B Series)
current probes
Actual photo of PR (B Series) probe is shown below as aid in probe identification.
PR150/SP1B and PR1500/SP7B require an external power supply while PR150/SP2B
and PR1500/SP8B are battery powered. Contact Dranetz Customer Service Department
for information on pricing and availability.
PR (B Series) Probe Description
Model No.
Current Range
Dranetz Part No.
Installation Category
Model No.
Current Range
Dranetz Part No.
Installation Category
Model No.
Current Range
Dranetz Part No.
Installation Category
Model No.
Current Range
Dranetz Part No.
Installation Category
: PR150/SP1B (requires 9V adapter)
: 15A to 150A AC/DC
: 118290-G1
: 600V, CAT III
: PR150/SP2B (9V battery powered)
: 15A to 150A AC/DC
: 118291-G1
: 600V, CAT III
: PR1500/SP7B (requires 9V adapter)
: 150A to 1500A AC/DC
: 118292-G1
: 600V, CAT III
: PR1500/SP8B (9V battery powered)
: 150A to 1500A AC/DC
: 118293-G1
: 600V, CAT III
External power
supply for
PR150/SP1B &
PR1500/SP7B
Battery supply
for PR150/SP2B
& PR1500/SP8B
Reference
material
The PR150/SP1B and PR1500/SP7B current probes require an external 9V power
supply, actual photo shown below. Each probe can be powered by a separate adapter or
by one adapter and an optional RR/PS/4A adapter cable which allows the connection of
4 PR series probes to a single 9VDC source.
9VDC Adapter Description
Model No.
Dranetz Part No.
Input Voltage
Input Plug Type
Output
The PR150/SP2B and PR1500/SP8B current probes are supplied with a 9V battery and
will operate on battery power typically for approximately 75 hours of continuous
operation.
Refer to Dranetz User Instructions titled PR150/SP1, PR150/SP2, PR1500/SP7,
PR1500/SP8 AC/DC Current Probes, P/N 899216.
: PR9VUA
: 118073-G1
: 100-240 VAC, 50/60 Hz
: US, Euro, UK, Australia
: +9VDC, 1.11A
2-12
Shop for Power Metering products online at:
www.PowerMet erStore.com
1.877.766.5412
Page 53

CH 2/ Voltage Measurement Cables and Current Probe Connections
DRANFLEX
XLB & MHB
current probes
Actual photos of DRANFLEX XLB and MHB Series probes are shown below as aid in
probe identification. These probes are available in different sizes, allowing current
measurements in Single Phase or 3 Phase circuits. Contact Dranetz Customer Service
Department for information on pricing and availability.
DRANFLEX Probe Description
Single Phase Probe
3 Phase Probe
Model No.
Current Range
Dranetz Part No.
Installation Category
Model No.
Current Range
Dranetz Part No.
Installation Category
Model No.
Current Range
Dranetz Part No.
Installation Category
Model No.
Current Range
Dranetz Part No.
Installation Category
: DRANFLEX3000XLB
: 30/300/3000A
: 118433-G1 (24 inches)
: 118434-G1 (36 inches)
: 118435-G1 (48 inches)
: 1000V, CAT III
: (600V, CAT IV)
: DRANFLEX6000XLB
: 60/600/6000A
: 118439-G1 (24 inches)
: 118440-G1 (36 inches)
: 118441-G1 (48 inches)
: 1000V, CAT III
: (600V, CAT IV)
: DRANFLEX3003XLB
: 30/300/3000A
: 118436-G1 (24 inches)
: 118437-G1 (36 inches)
: 118438-G1 (48 inches)
: 1000V, CAT III
: (600V, CAT IV)
: DRANFLEX6003XLB
: 60/600/6000A
: 118442-G1 (24 inches)
: 118443-G1 (36 inches)
: 118444-G1 (48 inches)
: 1000V, CAT III
: (600V, CAT IV)
Single Phase Probe
Shop for Power Metering products online at:
Model No.
Current Range
Dranetz Part No.
Installation Category
: DRANFLEX300MHB
: 3/30/300A
: 118430-G1 (6 inches)
: 118431-G1 (8 inches)
: 118432-G1 (12 inches)
: 1000V, CAT III
: (600V, CAT IV)
www.PowerMet erStore.com
2-13
1.877.766.5412
Page 54

Connecting Current Probes, continued
Optional power
supply for
DRANFLEX
probes
If you are using DRANFLEX Series XL or MH (non-B) probes, an external power
supply is recommended for continuous operation. These probes can be operated on
battery power with two standard type "AA" batteries which provide 2000 life hours for
the XL and 80 life hours for the MH type probes.
NOTE: DRANFLEX Series XLB and MHB type probes are powered by the HDPQ
Xplorer instrument and do not require an external power supply.
The two models of optional power supply available for DRANFLEX current probes are
the ISOFLEX-MHXL and ISOFLEX-MHXLU.
ISOFLEX-MHXL
Description
ISOFLEX-MHXL has a 12VDC input that is powered
from the AC adapter supplied as a standard accessory
for HDPQ Xplorer, HDPQ Guide or HDPQ Visa. This
power supply provides a pass through 12VDC output
for connection to power the instrument and a 3VDC
isolated output to power flex type current probes only.
ISOFLEX-MHXLU
Description
ISOFLEX-MHXLU is supplied with an attached wall
plug power supply and is supplied with
interchangeable input plugs for North America,
Europe, UK and Australia. The output of this
accessory provides a 3VDC output to power flex type
current probes only.
2-14
Shop for Power Metering products online at:
www.PowerMet erStore.com
1.877.766.5412
Page 55

CH 2/ Voltage Measurement Cables and Current Probe Connections
Single phase
current probe
connection
example
The following figure shows how to connect a current probe to channel A for current
monitoring of a single phase line.
The current probe may be connected to the return line if desired to measure the return
current when checking for load current leakage, loop current relationships, etc. If
measuring power, position the probe with the arrow pointing towards the load.
HDPQ-901b
NOTE: The connection shown above is not recommended without a voltage
connection to ensure frequency synchronization. If this configuration is used, then an
internal frequency reference must be entered. Refer to Chapter 4 Setup Monitoring Nominal Values.
2-15
Shop for Power Metering products online at:
www.PowerMet erStore.com
1.877.766.5412
Page 56

This page intentionally left blank.
2-16
Shop for Power Metering products online at:
www.PowerMet erStore.com
1.877.766.5412
Page 57

Overview
Continued on next page
CHAPTER 3
Real Time Data
Introduction
Access to real
time data
HDPQ Xplorer allows you to view power quality phenomena as it happens, when it
happens. The instrument is able to capture and process data in real time, and allows you
to view it in Dial Meters (graphical), Tabular Meters (textual), Scope Mode,
Dashboard, Harmonics and Phasor display.
Follow these steps to display the Real-Time Data menu.
Action... Result...
STEP 1: There are three (3)
ways to access the Real-Time
Data icon:
1st: Upon instrument power-up
and prior to monitoring, the
Home page displays shortcut
buttons, one of which is Real-
Time Data. Proceed to Step 2.
HDPQ-110a
2nd: If monitoring is on, the
Home Monitoring page
becomes the start-up page.
Real Time Metering icons on
the work area provide direct
access to the real-time meters
i.e. Scope, Meter, Harmonics
and Phasor. Each of these
functions is discussed in its own
section.
Shop for Power Metering products online at:
www.PowerMet erStore.com
HDPQ-111b
3-1
1.877.766.5412
Page 58

Overview, continued
Access to real
time data
(continued)
Action... Result...
3rd: Real-Time Data icon is
also accessible on the taskbar of
most typical screens, where
shortcuts to common
instrument functions are found.
Example: You can access RealTime Data from the taskbar of
the Communications setup
screen.
HDPQ-302
STEP 2: The Real-Time Data
menu contains selections for
Dial Meters, Text Display
Meters, Scope Mode,
Dashboard, Phasors, Harmonics
and Strip Chart Recorder. Refer
to the particular section for
information on each function.
In this chapter
HDPQ-303
This chapter is divided into the following sections.
Section Title See Page
A Dial Meters 3-3
B Text Display Meters 3-5
C Scope Mode 3-15
D Dashboard 3-19
E Voltage and Current Phasor 3-24
F Harmonics 3-29
G Strip Chart Recorder 3-37
3-2
Shop for Power Metering products online at:
www.PowerMet erStore.com
1.877.766.5412
Page 59

Overview
Continued on next page
CH 3/ Real Time Data
Section A
Dial Meters
Introduction
Dial meters
Dial Meters allow you to define the parameters and create dial-type readings of each
channel or parameter. The readings are updated at approximately once every three
seconds.
The Dial Meters screen can be displayed by pressing Dial Meters from the Real-Time
Data menu. Six dial type meters can be displayed for any of the channel/parameters that
are journalled. By default, the instrument shows dial-type readings for the voltage (V)
and current (I) parameters - Va, Vb, Vc, Ia, Ib, Ic. Axis (end points of meter) can be
changed on per meter basis and journal limits can be shown as bands of colors on the
dial face.
HDPQ-304
Function keys
Shop for Power Metering products online at:
Use the function keys at the bottom of the screen to set up the dial meters.
Select Parameter - allows you to change and select parameters/channels for which you
want to create dial meters. If you press this, the Change Parameter/Channel window for
HDPQ-305
www.PowerMet erStore.com
3-3
1.877.766.5412
Page 60

Dial Meters - Overview, continued
Function keys
(continued)
metered parameters pops up showing groupings and arrangements of parameter/
channel combinations. Check your desired parameter/channel, then click on Exit to
view the selections made. Refer to Section B Text Display Meters for the list of
parameters available for display.
Axis - allows you to change the minimum and maximum values or range of values for
each dial meter on display. If you press this, the numeric keypad pops up where you can
enter new minimum and maximum values for end points of the meter axis.
HDPQ-306
Use the numeric keypad to:
• enter new minimum values for end points of the meter axis
• enter new maximum values for end points of the meter axis
• set the dial meter scale to the fundamental at 100% (full scale) or the largest
component
•Press OK to save any changes made and return to the dial meter screen with new
min-max values as displayed.
•Press Cancel to return to the dial meters screen without changing any of the
displayed min-max values.
Show Limits - allows you to change the display of the dial meter to show the journal
limits. If threshold limits are programmed (Very Low limit, Low limit, High limit, Very
High limit) to trigger events, they can be displayed as colored regions on the dial meter
circular axis. Each color - red, yellow or green - corresponds to threshold limits set in
ranges with high limit (threshold above the normal range) and low limit (threshold
below the normal range). The table below shows the dial meter axis color codes.
Color region display Threshold limit range
The Exit key returns to the Real Time Data menu.
3-4
Shop for Power Metering products online at:
Red Min or 0 to Very Low, Very High to Max
Yellow Very Low to Low, High to Very High
Green Low to High
www.PowerMet erStore.com
1.877.766.5412
Page 61

Overview
CH 3/ Real Time Data
Section B
Text Display Meters
Introduction
Metered
parameters
display
Meter mode is enabled by pressing Text Display Meters from the Real-Time Data
menu or by pressing the real-time Meter icon on the work area of the Home Monitoring
page. Text display meter screens are displayed in tabular form.
NOTE: Meter mode operation does not interfere with any of HDPQ Xplorer’s other
monitoring or recording functions. The individual voltage and current channel meter
readings are not affected by the monitoring setup. Turning monitoring of individual
channels off does not affect meter readings.
The metered parameters available are logically separated into the following tabs:
Standard, Distortion, Unbalance, Advanced Power, Advanced Demand & Energy and
Advanced Flicker. The function keys at the bottom of the meter screens change
depending on the parameter tab selected. Text display meter changes to reflect the
specified set of parameter/channel combination selected. The format of text meter
screens is similar for all, although the amount of data varies. The Exit key returns to the
Real Time Data menu.
HDPQ Xplorer is designed to provide setup as well as data display. Metered parameters
are available for display regardless if they are being journalled under Start Menu >
Wizard Setup > Trigger Limits > Journal Limits.
In this section
The following topics are covered in this section.
Topic See Page
Standard Meter Tab 3-6
Distortion Meter Tab 3-8
Unbalance Meter Tab 3-9
Advanced Meter Tab 3-10
Advanced Demand & Energy Meter Tab 3-11
Advanced Flicker Meter Tab 3-14
3-5
Shop for Power Metering products online at:
www.PowerMet erStore.com
1.877.766.5412
Page 62

Standard Meter Tab
Continued on next page
Standard Meter Tab
Standard meter
list
At start-up, text display meter defaults in the Standard tab featuring the basic power
quality parameters available as shown below.
HDPQ-307
Standard Tab Parameter Name Label
Fx: Volts & Amps Voltage (L-N) V
Voltage (L-L) V
line-neutral
line-line
Current Current
Frequency Freq
DC Volts DC Volts
DC Current DC Current
Fx: Harm & Flicker Voltage THD Voltage THD
Current THD Current THD
Short Term Flicker Pst
Long Term Flicker Plt
Long Term Flicker (Sliding) Plt (Sliding)
3-6
Shop for Power Metering products online at:
www.PowerMet erStore.com
1.877.766.5412
Page 63

CH 3/ Real Time Data
Standard meter
list (continued)
Standard Tab Parameter Name Label
Fx: Power Active Power Active Power
Apparent Power Apparent Pwr
Reactive Power Reactive Pwr
True Power Factor True PF
Displacement Power Factor Displace PF
Fx: Demand Current Demand Dmd Current
Active Power Demand Dmd Watts
Apparent Power Demand Dmd VA
Volts Ampere Reactive Demand Dmd var
Fx: Energy Watt Hours Watt-hrs
Volts Ampere Hours VA-hrs
Vo lt s A mpe re R ea ctive Hours var-hrs
NOTE: See Appendix B Technical Specifications - Computed Parameters for
definition of parameters.
Shop for Power Metering products online at:
www.PowerMet erStore.com
3-7
1.877.766.5412
Page 64

Distortion Meter Tab
Distortion Meter Tab
Distortion meter
list
HDPQ Xplorer is able to meter distortions or uncharacteristic changes in the waveform
of original signals. Distortion calculations measure the deviation of complex
waveshapes from pure sine waves. Harmonics are measured in accordance with IEC
61000-4-7 Class I.
HDPQ-308
Distortion Tab Parameter Name Label
Fx: Distortion Voltage Crest Factor V Crest Factor
Current Crest Factor I Crest Factor
ANSI Transformer Derating Factor Transformer Derating
Transformer K Factor Transformer K factor
Current Total Interharmonic Distortion Current TDD
3-8
Shop for Power Metering products online at:
www.PowerMet erStore.com
1.877.766.5412
Page 65

Unbalance Meter Tab
CH 3/ Real Time Data
Unbalance
meter list
The Unbalance metering tab shows positive, negative and zero sequence components
for voltage and current, as well as the NEMA definition of maximum deviation from
the average of the three phases.
HDPQ-309
Unbalance Tab Parameter Name Label
Fx: V Unbalance Positive Sequence Voltage V Positive Sequence (S1)
Negative Sequence Voltage V Negative Sequence (S2)
Zero Sequence Voltage V Zero Sequence (S0)
V Unbalance (S2/S1) V Unbalance (S2/S1)
V Unbalance (S0/S1) V Unbalance (S0/S1)
Fx: I Unbalance Positive Sequence Current I Positive Sequence (S1)
Negative Sequence Current I Negative Sequence (S2)
Zero Sequence Current I Zero Sequence (S0)
I Unbalance (S2/S1) I Unbalance (S2/S1)
I Unbalance (S0/S1) I Unbalance (S0/S1)
Shop for Power Metering products online at:
www.PowerMet erStore.com
3-9
1.877.766.5412
Page 66

Advanced Meter Tab
Advanced Meter Tab
Advanced meter
list
The Advanced metering tab shows positive, negative and zero sequence components
for voltage and current.
HDPQ-310
Advanced Meter Tab Parameter Name Label
Fx: Current V/I Phase V/I Phase
Residual Current Resid. Current
Net Current Net Current
Fx: V Distortion Voltage Total Harmonic
Distortion
Voltage Telephone Influence
Factor
Vthd RSS
VTIF
3-10
Voltage Total Interharmonic
Distortion
Unsign Harmonic Power Unsigned Harmonic W
Fx: I Distortion Current Total Harmonic
Distortion
Current Total Interharmonic
Distortion
RMS Current Individual Odd
Harmonics
RMS Current Individual Even
Harmonics
IT Product IT Product
VTID
Ithd RSS
ITID
I Odd Harmonic
I Even Harmonic
Shop for Power Metering products online at:
www.PowerMet erStore.com
1.877.766.5412
Page 67

Advanced Demand & Energy Meter Tab
Continued on next page
CH 3/ Real Time Data
Advanced
energy meter list
Advanced energy metering tab meters multiple total apparent power and power factor
parameters, calculated using arithmetic and vector sums of the individual phases. These
methods may produce different values with distorted and/or unbalance phases.
Demand/Advanced Energy include various energy parameters on per phase and total
basis as well as in forward and reverse mode. Some parameters such as displacement
power factor are only valid for the fundamental frequency. The Advanced energy tab
also allows trending of rapid voltage changes that result in light flicker. Flicker
parameters under the Advanced energy tab are used primarily for specialized testing.
Flicker measurements are calculated as per IEC 61000-4-15.
HDPQ-311
Advanced Energy Tab Parameter Name Label
Fx: Forward &
Reverse
Fx: Predicted/Peak Predicted P Demand Predicted P Demand
Forward Frequency W-Hrs Forward W-h
Reverse Frequency W-Hrs Reverse W-h
Fwd Fundamental Frequency var
Hrs
Reverse Fundamental Frequency
var Hrs
Frequency VA Hrs VA-h
Predicted Q Demand Predicted Q Demand
Predicted S Demand Predicted S Demand
Forward Fundamental
var-h
Reverse Fundamental
var-h
Shop for Power Metering products online at:
www.PowerMet erStore.com
3-11
1.877.766.5412
Page 68

Advanced Demand & Energy Meter Tab, continued
Continued on next page
Advanced
energy meter list
(continued)
Advanced Energy Tab Parameter Name Label
Fx: Predicted/Peak Peak Active Power Demand Peak W Dmd
Peak Apparent Power
Demand
Peak Reactive Power
Demand
Peak Current Demand Peak I Dmd
Fx: Peak @ Avg PF @ Peak P Demand Avg PF @ Peak P Demand
S Demand @ Peak P
Demand
Q Demand @ Peak P
Demand
Avg PF @ Peak Q Demand Avg PF @ Peak Q Dmd
P Demand @ Peak Q
Demand
S Demand @ Peak Q
Demand
Avg PF @ Peak S Demand Avg PF @ Peak S Dmd
P Demand @ Peak S
Demand
Q Demand @ Peak S
Demand
Peak VA Dmd
Peak var Dmd
S Demand @ Peak P
Demand
Q Demand @ Peak P
Demand
P Dmd @ Peak Q Dmd
S Dmd @ Peak Q Dmd
P Dmd @ Peak S Dmd
Q Dmd @ Peak S Dmd
3-12
Shop for Power Metering products online at:
www.PowerMet erStore.com
1.877.766.5412
Page 69

Advanced
energy meter list
(continued)
CH 3/ Real Time Data
Advanced Energy Tab Parameter Name Label
Fx: Arith & Vector Arithmetic Sum Power
Factor
Arithmetic Sum
Displacement Power Factor
Arithmetic Sum Volts
Ampere
Fundamental Arithmetic
Sum Volts Ampere
Fundamental Vector Sum
Volts Ampere
Arithmetic Sum PF
Arithmetic Sum DPF
Arithmetic Sum VA
Fundamental Arithmetic
Sum VA
Fnd Vector Sum VA
Shop for Power Metering products online at:
www.PowerMet erStore.com
3-13
1.877.766.5412
Page 70

Advanced Flicker Meter Tab
Advanced Flicker Meter Tab
Advanced
flicker list
The Advanced flicker parameters are used primarily for specialized testing. Flicker
measurements are calculated as per IEC 61000-4-15 and IEEE 1453.
HDPQ-312
Advanced Flicker Tab Parameter Name Label
Fx: Advanced Flicker Instantaneous Flicker PInst
PInst LPF PInst LPF
PInst Square Root PInst Sq Root
Square Root Low-Pass Filter Sq Root LPF
3-14
Shop for Power Metering products online at:
www.PowerMet erStore.com
1.877.766.5412
Page 71

Overview
CH 3/ Real Time Data
Section C
Scope Mode
Introduction
Scope mode
screen
Scope mode allows you to view real-time voltage (V) and current (I) waveforms for up
to eight channels simultaneously (four V and four I). Waveforms may be displayed on a
single or dual axis (overlaid or stacked). A range check function shows the detected
input range for all channels.
The Scope mode screen can be displayed by pressing Scope Mode from the Real-Time
Data menu or by pressing the Scope real-time metering icon on the work area of the
Home Monitoring page.
In this section
HDPQ-313
The following topics are covered in this section.
Topic See Page
Turning Channels On/Off 3-16
Viewing Plots - Stacked/Overlay 3-17
Checking Input Range 3-18
3-15
Shop for Power Metering products online at:
www.PowerMet erStore.com
1.877.766.5412
Page 72

Turning Channels On/Off
Turning Channels On/Off
Select channels
to display
From Scope mode, press Select Channel to turn Volts/Amps channel selection on/off.
The pop-up window lets you select which channels will appear in the Scope mode
display.
HDPQ-314
Doing any of the following actions will turn channels on/off:
• Press the desired Vo lt s/A mp s to turn it on/off.
•Press Vo lt s or Amps to turn on/off all channels of that parameter.
•Press All to turn on/off both the Volts and Amps for all channels.
•Press A/AB, B/BC, C/CA, D to turn on/off both the Volts and Amps for that channel.
Press Accept to save any changes made and return to Scope mode. The channels will
be as displayed in the check boxes.
Press Exit to return to Scope mode without changing any of the displayed channels.
3-16
Shop for Power Metering products online at:
www.PowerMet erStore.com
1.877.766.5412
Page 73

Viewing Plots - Stacked/Overlay
CH 3/ Real Time Data
Plot display
The Stacked/Overlay button from Scope mode toggles between single, multiple or
dual axis plots and views, samples shown below. This function allows you to view all
voltage and current channels either in:
Overlay Plot - single axis plot
HDPQ-315a
Multiple Stacked Plot - separate, multiple plots with voltage and current pairs
from same channel appearing on the same graph
Dual Stacked Plot - separate, two axis plots with one plot showing all voltage
channels and one plot showing all current channels
Shop for Power Metering products online at:
HDPQ-315b
HDPQ-315c
www.PowerMet erStore.com
3-17
1.877.766.5412
Page 74

Checking Input Range
Checking Input Range
Input range
From Scope mode, press Check Range. The input range window pops up showing the
status of the voltage and current input channels, whether under range, normal, or over
range. For Current, under range is reported below 0.4% of full scale and over range is
reported above 200% of full scale. For Voltage, under range is reported below 1% of
full scale and over range is reported above 99% of full scale.
Input Range shows the detected range for all channels. The number after the status
shows the percentage of the input of the instrument’s full range.
HDPQ-316
Input range
description
The input range can only be viewed, not changed. Press OK when done viewing the
input range.
The following table describes the messages that may register on the Input Range
screen. The instrument is able to detect the input range for voltage and current channels
A, B, C, and D.
Input Range Description
OK Within Range
OVER Over Range
UNDER Under Range
N/A Channel Disabled
CLIP Clipping
If input range is OVER, UNDER, or CLIP, then the rms readings will not be accurate.
Using CTs below 10% of Full Scale may also cause inaccuracies in amplitude, phase
and harmonic distortion readings.
3-18
Shop for Power Metering products online at:
www.PowerMet erStore.com
1.877.766.5412
Page 75

Overview
Continued on next page
Pressing and
selecting a cell
will bring up four
function keys - Select Parameters,
Setup Cell, Trend Plot and Event List
- used to view/modify cell parameters.
Deselecting the cell will hide those
keys from view.
HDPQ-317
CH 3/ Real Time Data
Section D
Dashboard
Dashboard
display
The Dashboard is a visual way of seeing present values as well as if any events
occurred, such as out-of-limit conditions, for each of the displayed parameter. The
dashboard displays meter data (or event count) in a 2x3, 3x4, or 4x6 matrix. It is color
coded to indicate whether or not the parameter is within limits.
Status summary for three report types - Power Quality (PQ), Energy/Demand and
Motor Health - can be displayed via the dashboard display. Real time data, event count,
or user specified calculated data is available in 2x3, 3x4, or 4x6 matrix display.
When monitoring is on, the dashboard displays parameter status, whether parameter is
within limits, using a color scheme. Journal data and events can be directly viewed
from the dashboard.
From the Real-Time Data menu, press Dashboard. The dashboard will display
standard Power Quality preset parameters by default, as shown on sample screens
below.
Shop for Power Metering products online at:
www.PowerMet erStore.com
3-19
1.877.766.5412
Page 76

Overview, con tinued
Continued on next page
Dashboard
display
(continued)
Dashboard
function keys
NOTE: Where applicable, the values reported within a parameter in the dashboard
refer to measurements on channels A, B, C, and D respectively. The measurement
values for each channel are updated approximately once per second while monitoring is
on. Display size can also be adjusted with 2x3 (small), 3x4 (medium) or 4x6 (large)
matrix, depending on user application.
Compliance: The dashboard is color coded such that green indicates the parameter is
within limits and/or no events have occurred since the last time the panel was cleared.
Red indicates the parameter is extremely out of limits and/or events of that type have
occurred since the panel was last cleared.
Function keys are available to view preset parameters, change the display size, or
change parameters and channels displayed in the dashboard.
3-20
HDPQ-318
Presets provide a set of default parameters that will be displayed in the dashboard. Use
the corresponding functions keys for the three different presets available:
Power Quality - uses the standard power quality parameters based on IEEE 1159 PQ
standard. The dashboard displays standard Power Quality preset parameters by default.
The default parameters for PQ as displayed in the 3x4 (medium) panel are (from first
row left to right): Vrms, Irms, Freq, Vthd, Pst, Sag, Swell, Transient, Active Power,
Vithd, V neg/pos unbalance, I neg/pos unbalance.
Energy/Demand - default parameters for Energy/Demand as displayed in the 3x4
(medium) panel are (from first row left to right): Energy, Demand, Predicted Demand,
Vrms, Irms, W, VA, VAR, PF, Daily Peak Dmd, Weekly Peak Dmd, Monthly Peak
Dmd.
Shop for Power Metering products online at:
www.PowerMet erStore.com
1.877.766.5412
Page 77

CH 3/ Real Time Data
Dashboard
function keys
(continued)
Motor Health - displays parameters that affect the operation of motors. The default
parameters for Motor Health as displayed in the 3x4 (medium) panel are (from first row
left to right): Vrms, Irms, Freq, Vthd, Horsepower, Derating, Active Power, Reactive
Power, Power Factor, V neg/pos unbalance, I neg/pos unbalance.
Number Of Boxes - toggles through the following panel matrix size - 2x3 (small), 3x4
(medium) or 4x6 (large).
Clear - resets the parameter display since the dashboard was enabled (when monitoring
is on). Once cleared, the dashboard automatically proceeds to report meter data (or
event count) anew.
NOTE: The rest of the keys described below are displayed only once you select a cell
from the dashboard.
Select Parameters - Press Select Parameters to display the Change Parameter window
- used to set limits and enter threshold values. See next section Parameter Details in
Dashboard Display for more information.
Setup Cell - Press Setup Cell to change the name properties of the cell and the limits or
range of values required for the parameter to pass QOS compliance. When monitoring
is on, the dashboard displays the status of a parameter using a color scheme. Parameters
that are extremely out of limits, exceeding Very Low or Very High threshold limits, are
shown in blinking red (indicates Severe state). You can turn off the blinking red box
into a constant red box or you can turn it back on, depending on your display
preference. See next section Parameter Details in Dashboard Display for more
information.
NOTE: The dashboard retains the present configuration every time it is accessed. The
channel/parameter configuration will reset to default anytime a new monitoring session
starts.
T r end Plot - Press T rend Plot to display the plot of journalled data along with min/max
measurements over the interval.
Event List - Press Event List to view a summary list of all captured events in the order
that they occurred.
Press Exit to return to the Real-time Data menu.
3-21
Shop for Power Metering products online at:
www.PowerMet erStore.com
1.877.766.5412
Page 78

Parameter Details in Dashboard Display
Continued on next page
Parameter Details in Dashboard Display
Dashboard color
scheme
Parameter
details
The dashboard displays metered data for the selected parameter. The metered data is
updated once per second. This is the same data that appears in the meter screen, and
used in calculating journals. If the selected parameter is not journalled, the rms event or
transient event count can be selected to appear in the dashboard instead of journalled
data.
Disabled parameters appear in gray. A dashboard display is considered disabled if no ne
of the limits were set. Also cells appear in gray when not monitoring.
Enabled parameters, on the other hand, are color-coded. A dashboard is active while
the instrument is monitoring or by loading a previously saved file from memory. An
active dashboard can have two or three states (Normal, Moderate, or Severe). When
monitoring, parameters that are within limits are shown in green (indicates Normal
state). Those that are moderately out of limits, exceeding Low or High threshold limits,
are shown in yellow (indicates Moderate state). Parameters that are extremely out of
limits, exceeding Very Low or Very High threshold limits, can be shown in blinking red
(indicates Severe state) if this function is turned on.
The following procedure describes how to view parameter details in the dashboard
display. Note that the same procedure applies even when you select different journal
categories to plot.
Action... Result...
STEP 1: Select a cell from the
dashboard to display the soft keys
to edit cell parameters.
FOR EXAMPLE
In the PQ panel, select RMS
Voltage. Four soft keys to edit/
view cell parameters appear .
• To view/modify the parameter
and channel/s displayed on
screen, press Select
Parameters. Go to Step 2.
• To set the cell property name,
parameter threshold limits and
turn on/off the blink function,
press Setup Cell. Go to Step 3.
• T o view plots of journalled data
over time, press Trend Plot.
Go to Chapter 6.
• To view the list of captured
events, press Event List. Go to
Chapter 6.
:
HDPQ-318b
3-22
Shop for Power Metering products online at:
www.PowerMet erStore.com
1.877.766.5412
Page 79

CH 3/ Real Time Data
Parameter
details
(continued)
Action... Result...
STEP 2: Once Select Parameters
is pressed, the Change Parameter/
Channel window showing
groupings and arrangements of
parameter/channel combinations,
is displayed. Check your desired
parameter/channel and then click
on Exit to view the selections
made. Refer to Chapter 3 Real
Time Data for the list of
parameters available for display.
STEP 3: Once Setup Cell is
selected, threshold values crossed
that cause the parameter event, in
this example V RMS, are
displayed on screen. Checkboxes
appear on the left corner of each
enabled channel. Uncheck the box
if you want to disable a channel
parameter.
HDPQ-319
• Cell Name - allows you to
change the cell name display.
Press the name field and use the
alphanumeric key provided.
• Limit fields (High Limit; Low
Limit) - limit values used to
program threshold values.
• Limits Valid - used to enable/
disable the programmed limits.
• Blink On - used to enable/
disable limit display function.
Parameters that are extremely
out of limits, exceeding Very
Low or Very High threshold
limits, can be shown in
blinking red (indicates Severe
state) if this function is turned
on.
• Latch Limit Crossing - when
enabled, the cell will stay red
until you press Clear. When
disabled, the cell will change
colors depending on the current
limit status.
HDPQ-320
NOTE: Parameter thresholds are best left
disabled unless you have an application that
specifically calls for them.
Shop for Power Metering products online at:
www.PowerMet erStore.com
3-23
1.877.766.5412
Page 80

Overview
Overview
Section E
Voltage and Current Phasor
Phasor display
In this section
The phasor screen displays a graph that indicates the phase angle and magnitude
relations between the voltage and current based upon the angles of the fundamentals, as
determined by Fourier analysis.
Phasor screen shows eight phasors autoscaled with zero degrees to the right (normally
channel A voltage) for counterclockwise rotation and with synchronized channels. You
may display up to four channels at any one time for either volts or amps, or a single
channel for both volts and amps, depending on the phases being monitored.
A touch screen Demo button presents an animated phasor demo rotation for resistive,
capacitive and inductive loads.
The following topics are covered in this section.
Topic See Page
Phasor Screen 3-25
Phasor Rotation 3-26
Phasor Channel/Parameter Selection 3-28
3-24
Shop for Power Metering products online at:
www.PowerMet erStore.com
1.877.766.5412
Page 81

Phasor Screen
CH 3/ Real Time Data
Phasor screen
display
The Phasor window is displayed by pressing Phasor from the Real-Time Data menu or
by pressing the Phasor real-time metering icon on the work area of the Home
Monitoring page.
The Phasor window shows eight phasors autoscaled with zero degree to the right for
clockwise rotation and with synchronized channels. The left sidebar shows rms values
for Volts/Amps for channels A, B, C and D. The right sidebar shows zero, positive and
negative values for Volts/Amps; zero, positive and negative sequence component
values for Volts/Amps; as well as negative zero imbalance and maximum deviation
imbalance.
Depending on the phases being monitored, up to four channels may be displayed at any
one time for either Volts or Amps, or a single channel for both Volts and Amps. An
arrow head and channel label are displayed on the vector.
HDPQ-321
3-25
Shop for Power Metering products online at:
www.PowerMet erStore.com
1.877.766.5412
Page 82

Phasor Rotation
Continued on next page
Phasor Rotation
Animated
phasor rotation
Sample 3-Phase,
three wire delta
rotation
Graphic illustration in the form of rotating phasors relative to the sine wave graph of a
four wire wye circuit is available by pressing the Demo button on the Phasor window.
The Demo key will be replaced by Start/Stop once phasor rotation has been viewed.
Press Start to replay animated phasor rotation. You can choose to Stop the phasor demo
rotation at any time.
Phasor vectors are displayed using a counterclockwise rotation from the zero degrees
reference. Animated phasor demo for Resistive, Inductive and Capacitive loads is
available for viewing.
The following diagrams describe the positive phase rotation of voltage and current
phasors (for Resistive, Inductive and Capacitive loads) for a three phase, three wire
delta connection. An arrow head on the line indicates direction pointing toward the
load.
Three phase vectors are displayed as three lines, 120 degrees apart in a Resistive load
Display channel/
parameter selection
Start/Stop demo plot
waveforms as rotate
phasors; press any time
3-26
Shop for Power Metering products online at:
HDPQ-322
Return to
Phasor screen
Switch phasor demo rotation between
Resistive, Inductive and Capacitive load
effects; press any time
www.PowerMet erStore.com
1.877.766.5412
Page 83

CH 3/ Real Time Data
Sample 3-Phase,
three wire delta
rotation
(continued)
The following diagrams describe the positive phase rotation of voltage and current
phasors (for Resistive, Inductive and Capacitive loads) for a three phase, three wire
delta connection. An arrow head on the line indicates direction pointing toward the
load.
Three phase vectors are displayed as three lines, 120 degrees apart in an Inductive load
HDPQ-323
Three phase vectors are displayed as three lines, 120 degrees apart in a Capacitive load
Phasor
diagrams
Shop for Power Metering products online at:
Refer to Appendix E for the diagrams that describe the voltage and current phasors for
the standard type of power connections.
HDPQ-324
www.PowerMet erStore.com
3-27
1.877.766.5412
Page 84

Phasor Channel/Parameter Selection
Phasor Channel/Parameter Selection
Channel/
Parameter
display
The Channel/Parameter selection screen is displayed by pressing Channel &
Parameter on the phasor Demo window. Depending on the phases being monitored, up
to three channels may be displayed at any one time for both Volts or Amps.
HDPQ-325
Press to enable/disable the channel/parameter for display in the animated phasor
rotation.
• Press the desired Volts /Amp s chan nel to turn it on/off.
NOTE: Only one parameter/channel selection is possible at a time.
Press OK to save any changes made and return to the Phasor Demo window. The
phasor demo rotations will display the parameters/channels enabled.
3-28
Shop for Power Metering products online at:
www.PowerMet erStore.com
1.877.766.5412
Page 85

Overview
Continued on next page
CH 3/ Real Time Data
Section F
Harmonics
Harmonics
display
HDPQ Xplorer allows you to view voltage and current harmonics/interharmonics in
graphical or in tabular form. Harmonics are waveform distortion, steady-state
deviations from an ideal power frequency sinusoid and are characterized by the spectral
content of the waveform. Interharmonics are frequency components between the
harmonic frequencies. The IEC 61000-4-7 and IEEE 519 Standards dictate that
harmonic analysis is done using a synchronous window of 10 cycles for 50 Hz, or 12
cycles for 60 Hz. This results in bins which are nominally 5 Hz wide. The actual width
of the bins is equal to the actual frequency divided by 10 if the nominal frequency is 50
Hz, and 12 if 60 Hz. For example, if actually operating at 49.9 Hz, the bin is 4.99 Hz,
but is labelled “5 Hz” as specified by the standard.
You can determine the number or range of harmonic frequencies to trend and view in
detail. There is also the option to select how to plot harmonic/interharmonic data and
specify the units of measure by which harmonic data is calculated.
Harmonic Graph
and IEEE 519. You can choose the unit of measure by which harmonic data is
calculated and graphed, based on a Percentage of the fundamental value or in
Engineering units (volts and amps). Frequency components of harmonic graphs can be
displayed either in Hertz or in Harmonic Number. The graphs can be zoomed and
rescaled.
Harmonic Table
measured values: frequency and harmonic number; magnitude in Engineering units and
percent of fundamental; phase in degrees (for harmonics only). Harmonic table values
are displayed in order of ascending frequency, and can also be sorted in order of
descending magnitude.
: Harmonics are measured in accordance with IEC 61000-4-7 Class 1
: Harmmonic list gives a tabular display of the following for each of the
Harmonic
screen and
function keys
Shop for Power Metering products online at:
Harmonic graph can be displayed by pressing Harmonics from the Real-Time Data
menu or by pressing the Harmonics real-time metering icon on the work area of the
Home Monitoring page. Note that the window defaults to a graphical spectrum display,
similar to sample screen shown below. Use the function keys at the bottom of the
screen to set up the harmonics graph/table.
www.PowerMet erStore.com
3-29
1.877.766.5412
Page 86

Overview, continued
Harmonic
screen and
function keys
(continued)
Channel Parameter - allows you to change and select your desired channel/parameter
with which to create the harmonic graph/table. If you press this, the Change Parameter/
Channel window pops up showing groupings and arrangements of parameter/channel
combinations. One channel/parameter combination can be displayed at a time for the
spectrum graph, magnitude list, or phase angle list for the harmonics. See Harmonic
Channel/Parameter Selection.
HDPQ-326
In this section
Graph/Table - toggles between harmonic graph and tabular display. The screen
defaults to a graphical spectrum display, although you have the option to choose
between the graph or table form. The screen will show a spectral graph featuring the
amplitude of the harmonics relative to the fundamental frequency, as shown above. For
harmonic table display, see Harmonic Graph/Table.
Zoom - allows you to magnify and view harmonic graphs in detail. See Harmonic
Detail.
Scale - allows you to step through the vertical scale maximum value by 100%, 50%,
25% to 10%.
Options - allows you to select the vertical and horizontal measurement scale. The
percent magnitude of the first 127 harmonics are graphed relative to the fundamental.
See Harmonic Options.
The Exit key returns to the Real Time Data menu.
The following topics are covered in this section.
Topic See Page
Harmonic Channel/Parameter Selection 3-31
Harmonic Graph/Table 3-32
Harmonic Detail 3-34
Harmonic Options 3-35
3-30
Shop for Power Metering products online at:
www.PowerMet erStore.com
1.877.766.5412
Page 87

Harmonic Channel/Parameter Selection
CH 3/ Real Time Data
Channel/
Parameter
display
From the Harmonic Graph window, press Channel Parameter to turn Volts/Amps/
Watts channel selection on/off. One channel/parameter combination can be displayed at
a time for the spectrum graph, magnitude list, or phase angle list for the harmonics.
Selections can be made from Channels A, B, C and D, and Parameters V, I, W.
HDPQ-327
Doing any of the following actions will turn channels/parameters on/off:
• Press the desired Volts/Amps/Watts channel to turn it on/off.
NOTE: Only one parameter/channel selection is possible at a time.
Press Accept to save any changes made and return to harmonic display with channels
as displayed in the check boxes.
Press Cancel to return to harmonic display without changing any of the displayed
channels.
Shop for Power Metering products online at:
www.PowerMet erStore.com
3-31
1.877.766.5412
Page 88

Harmonic Graph/Table
Harmonic Graph/Table
Harmonic
graph/table
display
The Graph/Table function key toggles between spectrum graph to table of magnitude
and phase in text form. Use this key if you want to switch views between harmonic
graph to harmonic magnitude table, as shown below.
HDPQ-328
The harmonic parameters displayed on list include: (from leftmost column) the
harmonic/interharmonic frequency in Hz, frequency in number, voltage rms or
maximum load of current (depending on parameter selected), percent amplitude of
harmonics, and harmonic phase angle value.
By default, harmonic and interharmonic frequency values are arranged in order of
increasing frequency. Use the Sort button to organize harmonic text display in order of
decreasing magnitude. The harmonic values are shown in boldface.
*The odd contribution is the square root of the sum of the squares of the relative
amplitudes of harmonics 3, 5, and 7 through N-1, where N is a function of sampling
frequency. The even contribution is similar for harmonics 2, 4, and 6 through N. Total
value is the square root of the sum of the squares of the odd and even distortions.
3-32
Shop for Power Metering products online at:
HDPQ-329
www.PowerMet erStore.com
1.877.766.5412
Page 89

CH 3/ Real Time Data
Harmonic
graph/table
display
(continued)
Harmonic phase degree values from 1 to 127 are displayed for voltage and current;
phase degree values from 1 to 127 are displayed for harmonic watts. Harmonic phase
angle values can be normalized to the phase of the fundamental of the displayed
channel. Use the Norm button to show the normalized phase angle values.
HDPQ-330
Toggle between
Normalized and
UnNormalized
phase values
Organize harmonic text
display in order of
decreasing magnitude
Shop for Power Metering products online at:
HDPQ-331
www.PowerMet erStore.com
3-33
1.877.766.5412
Page 90

Harmonic Detail
Harmonic Detail
Harmonic graph
details
HDPQ Xplorer allows you to determine the number or the range of harmonic
frequencies to trend.
HDPQ-332
The Zoom function allows you to zoom in/out of the plot display using the controls
described below.
•Zoom In (+) - press to zoom in the amount defined by the zoom box; press Zoom+
to display the zoomed area and view event cycles in greater detail. You may
repeatedly zoom in on a plot for up to seven (7) bins.
•Zoom Out (-) - press Zoom-(n) to unzoom the last step.
• Go to start (|<<) - single action; displays plot to the beginning of the harmonic
range.
•Pan Left (<<) - press to step to 10% lower in harmonic range.
•Pan Right (>>) - press to go up 10% in harmonic range.
•Go to end (>>|) - single action; displays plot to the end of the harmonic range, and
shows one screen's worth of data.
• Exit - single action; return to the previous screen.
3-34
Shop for Power Metering products online at:
www.PowerMet erStore.com
1.877.766.5412
Page 91

Harmonic Options
CH 3/ Real Time Data
Harmonic/
Interharmonic
data plots
The voltage and current harmonics and/or interharmonics for each phase channel can
be trended using the Options button. The properties specified under Harmonic Options
apply when harmonic/interharmonic data is viewed in either graph or tabular form.
Properties under Calculate Harmonics as pertain to both the graph and the table, and
determine how the harmonics and interharmonics are used.
If calculate Harmonics only is enabled, then only the actual harmonics are shown.
If calculate Harmonics and interharmonics is enabled, the spectrum will include all
the (nominal) 5 Hz bins, which includes the actual interharmonics as well. On the
graph, the harmonics are shown in the channel color, while interharmonics are shown
in gray color. On the table, the harmonics are shown in boldface.
If calculate including adjacent harmonics is enabled, the interharmonics are not
explicitly shown but the harmonic values include the adjacent interharmonic values in
their calculation, as specified by IEC 61000-4-7 or IEEE 519.
The rest of the properties under harmonic options described below pertain to the way
the graph (not the table) is labelled.
The horizontal axis can be in Hz or Harmonic Number.
The vertical scale can be in Percent or Engineering units, and Scale to Fundamental
(full scale) can be chosen to be the fundamental at 100% or the largest component. The
engineering unit for voltage is volts and for current is amperes.
Press Accept to save any changes made and return to harmonic display with channels
as displayed in check boxes.
Press Cancel to return to harmonic display without changing any of the displayed
channels.
Shop for Power Metering products online at:
HDPQ-333
www.PowerMet erStore.com
3-35
1.877.766.5412
Page 92

Harmonic Options, continued
0.0%
0.5%
1.0%
1.5%
2.0%
2.5%
3.0%
… 130 135 140 145 150 155 160 165 170 175 180 185 190 195 200 205 210 215 220 …
3rd harmonic
+
2 adjacent
interharmonics
4th harmonic
+
2 adjacent
interharmonics
Harmonic
computation
The IEC 61000-4-7 and IEEE 519 Standards specify that the interharmonic bins
adjacent to the harmonic be included in the computation of that harmonic called
grouping, for example, if there was a 3rd harmonic (150 Hz) of 10%, and the value of
the 145 Hz bin was 1%, and the value of the 155 Hz bin was 2%, then the value
reported in the bin labelled “150 Hz” would also include contributions from the 145 Hz
and 155 Hz bins. This would give approximately 10.2%, not 10%.
The following graphs illustrate harmonic computation as per IEC 61000-4-7 Standard.
Harmonic Computation for 50 Hz
Harmonic Computation for 60 Hz
Shop for Power Metering products online at:
3-36
www.PowerMet erStore.com
1.877.766.5412
Page 93

Overview
CH 3/ Real Time Data
Section G
Strip Chart Recorder
Introduction
Strip chart
display
Strip Chart Recorder displays a real-time auto-scaled graph of selected parameters,
updated once every 3 seconds. The initial strip chart screen records up to 10-minutes
worth of horizontal scale data, with the vertical axis also initially on auto-scale. Once
the 10-minutes worth of data is complete, the horizontal scale continues to shift
forward in time with each update. This process continues until the Clear function key is
pressed.
The Strip chart screen can be displayed by pressing Strip Chart Recorder from the
Real-Time Data menu.
Function keys
HDPQ-334
Use the function keys at the bottom of the screen to set up the strip chart recorder.
Select Parameter - allows you to change and select parameters to plot. If you press
this, the Change Parameter/Channel window pops up showing groupings and
arrangements of parameter/channel combinations. You have the option to enable/
disable channels for any of the single or dual axis plot display. The plot display area
will resize according to the number of parameters/channels enabled/disabled for
display.
Stacked/Overlay - toggles between single or multiple axis plot views. This function
allows you to view all voltage and current channels in the same, single axis plot or in
separate, multiple or dual axis plots. Multiple stacked plot displays plots with voltage
and current pairs from same channel appearing on the same graph. Dual stacked plot
has one plot showing all voltage channels and one plot showing all current channels.
Clear - clears the parameter display on plot since the strip chart was enabled. Once
cleared, the strip chart automatically proceeds to record data anew.
The Exit key returns to the Real-Time Data menu.
3-37
Shop for Power Metering products online at:
www.PowerMet erStore.com
1.877.766.5412
Page 94

This page intentionally left blank.
3-38
Shop for Power Metering products online at:
www.PowerMet erStore.com
1.877.766.5412
Page 95

Overview
CHAPTER 4
Setup Monitoring
Start menu
options
The Start Menu allows you to perform the following: set up HDPQ Xplorer for
monitoring of an electrical system, load previously saved setups, and load data files
from memory.
HDPQ-401
There are two ways to set up the instrument for monitoring - via Automatic Setup or
Wizard Setup. Experienced users have the ability to turn on any available parameter
and set threshold limits to any value within the acceptable range. The length of time to
monitor a circuit can vary from a few hours to a few months or more depending on the
user application.
Automatic Setup
current channels, and parameter thresholds. The auto-configured setup enables you to
proceed directly with data monitoring. HDPQ Xplorer allows you to perform automatic
setup for power quality or for energy/demand, depending on your application.
Wizard Setup
circuit to be monitored and monitoring settings. The instrument turns on the
appropriate voltage and current channels when you select a circuit type. Parameter
thresholds are initially set based on the line voltage and current values that you enter.
Threshold limits for capturing events are also set according to the monitoring mode
selected. Selection of a setup mode typically depends on the user’s application and
extent of familiarity with the operation of the intrument.
automatically configures the instrument’s circuit type, voltage and
takes you through a series of screens prompting for information about the
Monitor same circuit
Load setup template
memory or from an external USB device.
Load data file from memory
recordings that are saved to memory while monitoring is on.
Change Instrument Configuration
manage the instrument according to your setup preferences and application.
View/Save Monitoring Setup
Shop for Power Metering products online at:
makes use of the previous setup for monitoring.
allows you to load previously saved setup templates from internal
brings up a list of recorded session data files containing
brings up the instrument settings menu to help you
displays the list of parameter settings for application setup.
www.PowerMet erStore.com
4-1
1.877.766.5412
Page 96

Overview, continued
Continued on next page
Displaying Start
Menu
Follow these steps to display the Start Menu.
Action... Result...
STEP 1: There are three (3) ways
to access the Start Monitoring
icon:
1st: Upon instrument power-up
and prior to monitoring, the Home
page displays shortcut buttons,
one of which is Start
Monitoring. Proceed to Step 2.
NOTE: Repeated pressing of the
Dranetz logo, located at the top
left of the taskbar, alternates
between the Home page and the
Home Monitoring page (screen
below), back and forth.
2nd: The Home Monitoring page
also displays the icon to Start
Monitoring.
HDPQ-110a
NOTE: The Start Monitoring
icon changes into Stop
Monitoring when monitoring is
on.
The instrument should be able to
detect data for monitoring.
3rd: Start/Stop Monitoring icon
is also accessible on the taskbar of
most typical screens, where
shortcuts to common instrument
functions are found.
Example: You can access Start/
Stop Monitoring from the taskbar
of the Communications setup
screen.
HDPQ-111c
HDPQ-302
4-2
Shop for Power Metering products online at:
www.PowerMet erStore.com
1.877.766.5412
Page 97

CH 4/ Setup Monitoring
Displaying Start
Menu
(continued)
In this chapter
Action... Result...
STEP 2: Start Menu contains
menu selections for Automatic
Setup for Power Quality,
Automatic Setup for Energy/
Demand, Wizard Setup, Monitor
same circuit, Load setup template,
Load data file from memory,
Change Instrument Configuration
and View/Save Monitoring Setup.
Refer to the particular section for
information on each function.
This chapter is divided into eight sections:
Section Title See Page
A Automatic Setup for Power Quality 4-4
B Automatic Setup for Energy/Demand 4-7
C Wizard Setup 4-10
D Monitor Same Circuit 4-49
E Load Setup Template 4-55
HDPQ-401
F Load Data File from Memory 4-56
G Change Instrument Configuration 4-58
H View/Save Monitoring Setup 4-59
Shop for Power Metering products online at:
www.PowerMet erStore.com
4-3
1.877.766.5412
Page 98

Overview
Continued on next page
Overview
Section A
Automatic Setup for Power Quality
Automatic Setup
procedure
Automatically configures the setup for monitoring quality of supply based on IEEE and
IEC typical trigger settings. Automatic Setup is a one-stop process using pre-defined
values to set up the unit automatically. You have the option to view the summary list of
parameter settings, change probe types if current will be monitored, and/or proceed
directly with data monitoring. Follow these steps to perform Automatic Setup for PQ.
Action... Result...
STEP 1: From the Start Menu,
press Automatic Setup for
Power Quality. The autoconfigured circuit type, nominal
voltage, current and frequency
values appear on screen. The
remaining free space in GB is
shown, and you have the ability to
specify the name in which the PQ
setup file can be saved.
• To view the list of parameter
settings for Automatic Setup, press
Summary. Proceed to Step 2 on
page 4-5.
• To display/change probe types for
current monitoring, press Probes.
Proceed to Step 3 on page 4-5.
• To display real-time waveforms of
voltage and current for enabled
channels, press Scope. By default,
the Scope diagram is already
displayed at the bottom right
corner of the screen.
• To display voltage and current
phasors for all enabled channels,
press Phasor. The Phasor diagram
replaces Scope at the bottom right
of screen.
•Press Accept to save any changes
made and return to the Home
Monitoring page with monitoring
ON.
•Press Exit to return to the Start
Menu without changing the
monitoring status.
NOTE 1: If the message “No valid wiring
configuration found” comes up, you must
connect the inputs to a live circuit or override
circuit type in the Wizard Setup. You need to
configure the circuit type appropriate to your
application.
NOTE 2: List of default settings for Automatic
Setup for Power Quality can be found in
Appendix B Technical Specifications.
HDPQ-402
4-4
Shop for Power Metering products online at:
www.PowerMet erStore.com
1.877.766.5412
Page 99

CH 4/ Setup Monitoring
Continued on next page
Automatic Setup
procedure
(continued)
Action... Result...
STEP 2: Summary displays the
list of parameter settings for
Automatic Setup for Power
Quality. The setup summary is
available for review before,
during and after monitoring.
• Press and drag the scroll bar to
move the page up or down.
• When done reviewing the
Setup Summary, press Exit.
The screen will return to
Automatic Setup for Power
Quality.
STEP 3: Various probe types are
available for each channel for
current monitoring.
Probe Selection
• If current will be monitored,
press the corresponding Probe
Channel/Parameter window to
display the probe types
available for each channel.
HDPQ-403
• If you want to make all
channels have the same setup
as Channel A current, press Set
Same as Channel A. The
display will change to show
only one probe selection for all
channels. Press the window
drop down arrow to display the
probe types available.
• Select your desired probe type.
• Range corresponds to the
usable input range for each
probe type.
• If the current probe that you are
using is not on the list, select
Other. Then set the Scale to
define the CT scale factor on
the current probe.
HDPQ-404
Shop for Power Metering products online at:
www.PowerMet erStore.com
4-5
1.877.766.5412
Page 100

Overview, continued
Automatic Setup
procedure
(continued)
Action... Result...
CT Scale Factor
Set the CT scale factor when
using a current probe that is not
on the list or if there are
additional scale factors from other
CTs in the system that need to be
taken into account. See sample
scale factor calculation on page 4-
15.
• To reset all of the V and I Scale
factors to the default value 1.0,
press to enable Reset to 1.0.
• To make all of the channels
have the same scale factors as
Channel A current and voltage,
press Set Same as Channel A.
The display will change to
show only one scale factor
value for all V and I channels.
Press the scale factor window
to enter the CT scale factor on
the current probe.
• Press the corresponding Scale
Channel/Parameter to show the
numeric window to enter the
CT scale factor on the current
probe.
• Pressing Exit will return the
Auto Setup page.
4-6
Shop for Power Metering products online at:
www.PowerMet erStore.com
1.877.766.5412
 Loading...