

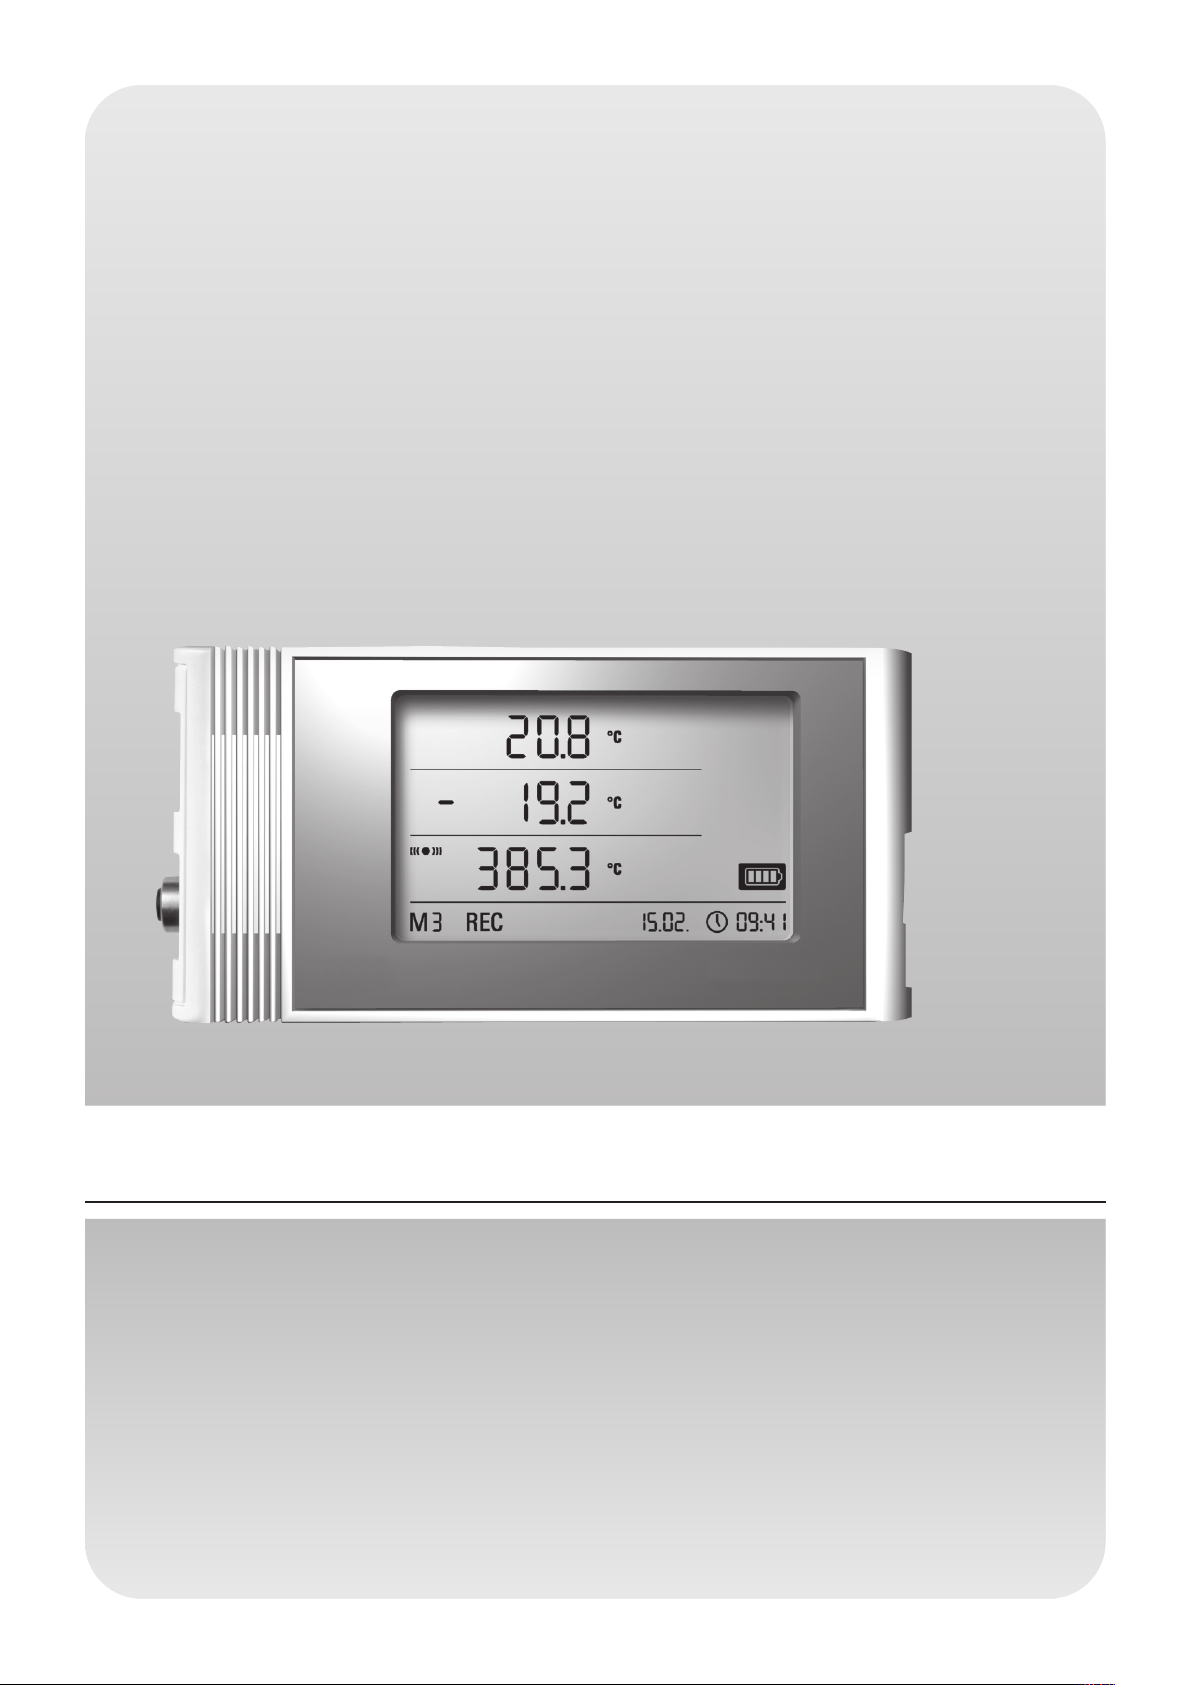
Operating manual
OPUS20E
for external sensors
BA-OP20E-03-EN

Table of contents
Content Page
1. Safety 2
2. Intended use 2
3. Equipment 3
4. Scope of supply 4
5. Preparation before starting 4
5.1. Software . . . . . . . . . . . . . . . . . . . . . . . . . . . . . . . . . . . . . . . . . . . .4
5.1.1. Installation conditions . . . . . . . . . . . . . . . . . . . . . . . . . . . .4
5.1.2. Installation of the SmartGraph software . . . . . . . . . . . . . .4
5.1.3 Preparing data logger configuration . . . . . . . . . . . . . . . . .4
5.2. Note at initial startup . . . . . . . . . . . . . . . . . . . . . . . . . . . . . . . . . . .4
6. Operation 4
6.1. Switching on and off . . . . . . . . . . . . . . . . . . . . . . . . . . . . . . . . . . .4
6.2. Basic settings and operating modes . . . . . . . . . . . . . . . . . . . . . . .4
6.2.1. The four operating modes . . . . . . . . . . . . . . . . . . . . . . . .5
6.2.2. Network function (M51) . . . . . . . . . . . . . . . . . . . . . . . . . .5
6.2.3. Factory settings (M52) . . . . . . . . . . . . . . . . . . . . . . . . . . .6
6.2.4. Acoustic function (M53) . . . . . . . . . . . . . . . . . . . . . . . . . .6
7. Connection and configuration of external sensors 6
7.1 BUS sensors . . . . . . . . . . . . . . . . . . . . . . . . . . . . . . . . . . . . . . . . .6
7.1.1 Connection of BUS sensors . . . . . . . . . . . . . . . . . . . . . . . .6
7.1.2 Configuration of BUS sensors (M6x) . . . . . . . . . . . . . . . . .6
7.1.3 Logging the BUS sensors (M7x) off . . . . . . . . . . . . . . . . . .7
7.2 Connection of analogue sensors . . . . . . . . . . . . . . . . . . . . . . . . . .7
7.2.1 Sensors for measuring voltage 0 - 1V . . . . . . . . . . . . . . .7
7.2.2 Sensors for measuring current, 2-cable 4 - 20 mA
and 3-cable 0 - 20 mA . . . . . . . . . . . . . . . . . . . . . . . . . . .7
7.2.3 Pt100 sensors in 3- and 4-cable switching . . . . . . . . . . .8
7.2.4 Thermal elements . . . . . . . . . . . . . . . . . . . . . . . . . . . . . .8
7.3 Configuration of analogue sensors (M81) . . . . . . . . . . . . . . . . . . .8
8. Measured values display and data recording 9
8.1. Channel groups and measuring channels . . . . . . . . . . . . . . . . . . .9
8.2 Processing channels for converting measured values . . . . . . . . . .9
8.3. Displaying measured values . . . . . . . . . . . . . . . . . . . . . . . . . . . . .9
8.4. Data recording . . . . . . . . . . . . . . . . . . . . . . . . . . . . . . . . . . . . . . .9
9. Alarm function 11
9.1. Alarm configuration . . . . . . . . . . . . . . . . . . . . . . . . . . . . . . . . . .11
9.2. Alarm display . . . . . . . . . . . . . . . . . . . . . . . . . . . . . . . . . . . . . . .11
9.3. Acoustic alarm . . . . . . . . . . . . . . . . . . . . . . . . . . . . . . . . . . . . . .11
9.4. Using the alarm hysteresis . . . . . . . . . . . . . . . . . . . . . . . . . . . . .11
10. Notes on maintenance and operation 12
10.1. Battery change . . . . . . . . . . . . . . . . . . . . . . . . . . . . . . . . . . . . . .12
10.2. Deleting measured data . . . . . . . . . . . . . . . . . . . . . . . . . . . . . . .12
10.3. Positioning for mobile use . . . . . . . . . . . . . . . . . . . . . . . . . . . . . .12
10.4. Mounting on a wall . . . . . . . . . . . . . . . . . . . . . . . . . . . . . . . . . . .12
10.5. Moving to another site . . . . . . . . . . . . . . . . . . . . . . . . . . . . . . . .12
11. Technical data 13
12. Status codes 14
In order to use your data logger according to its intended use and utilise its complete range of functions, carefully read all documentation about this device.
This operating manual describes the functions of the hardware.
A separate manual – the software manual – describes how to use the software
and configure the data logger with the software and can be opened after the
software has been installed by using the help function in the software.
Your new data logger was built according to current state-of-the-art technology
and fulfils valid European and national directives. This conformity has been
tested and the corresponding declarations and documents are kept on file by
the manufacturer.
To keep this condition and ensure safe operation, as a user, you must observe
the following safety instructions:
1. Safety
We accept no liability for damages caused by non-observance of this manual
or unprofessional handling. Any warranty claims are voided in such cases !
Before starting the measuring device for the first time, read this
manual from front to back !
For reasons of safety and conformity (CE), any unauthorised change made to
the device construction or components which are to be used with the measuring
device are prohibited!
Before using the device, observe the following:
• Never measure live parts.
• Observe the storage and operating conditions.
• The only party responsible for determining measured results to be valid,
drawing conclusions and deriving actions is the user ! The correctness of
the results presented is excluded from any liability or guarantee.
Liability for damages which have been caused by utilising the
presented measured results is strictly excluded.
2. Intended use
The OPUS20E data logger is designed to detect and record a range of measured
values that are detected by the measuring device and the connected external
sensors. The measured data can be detected at variable selectable recording or
request intervals, then saved and transmitted to a connected PC.
The measuring device may only be used for this intended use while complying
with specified technical data for the measuring device and external sensors.
Any other use is considered misuse and contrary to the intended use.
The product must not be disposed of with household waste.
Dispose of this device in a manner according to the relevant
legal requirements.
This release replaces all previous releases. No part of this publication may be reproduced without written permission. The same applies for electronically processing, duplicating or spreading the publication. Subject to technical changes. All rights
reserved. Trademarks are used without guarantee that they may be used freely and primarily following the spelling of the manufacturer. The product names used are registered and should be treated appropriately. Changes to construction in the
interests of constant improvements to the product, as well as changes to the shape and colour are reserved. The delivered product may vary from product images. This document was produced with all due care. We accept no liability whatsoever
for mistakes or omissions.
EN
OPUS20E operating manual for external sensors
2
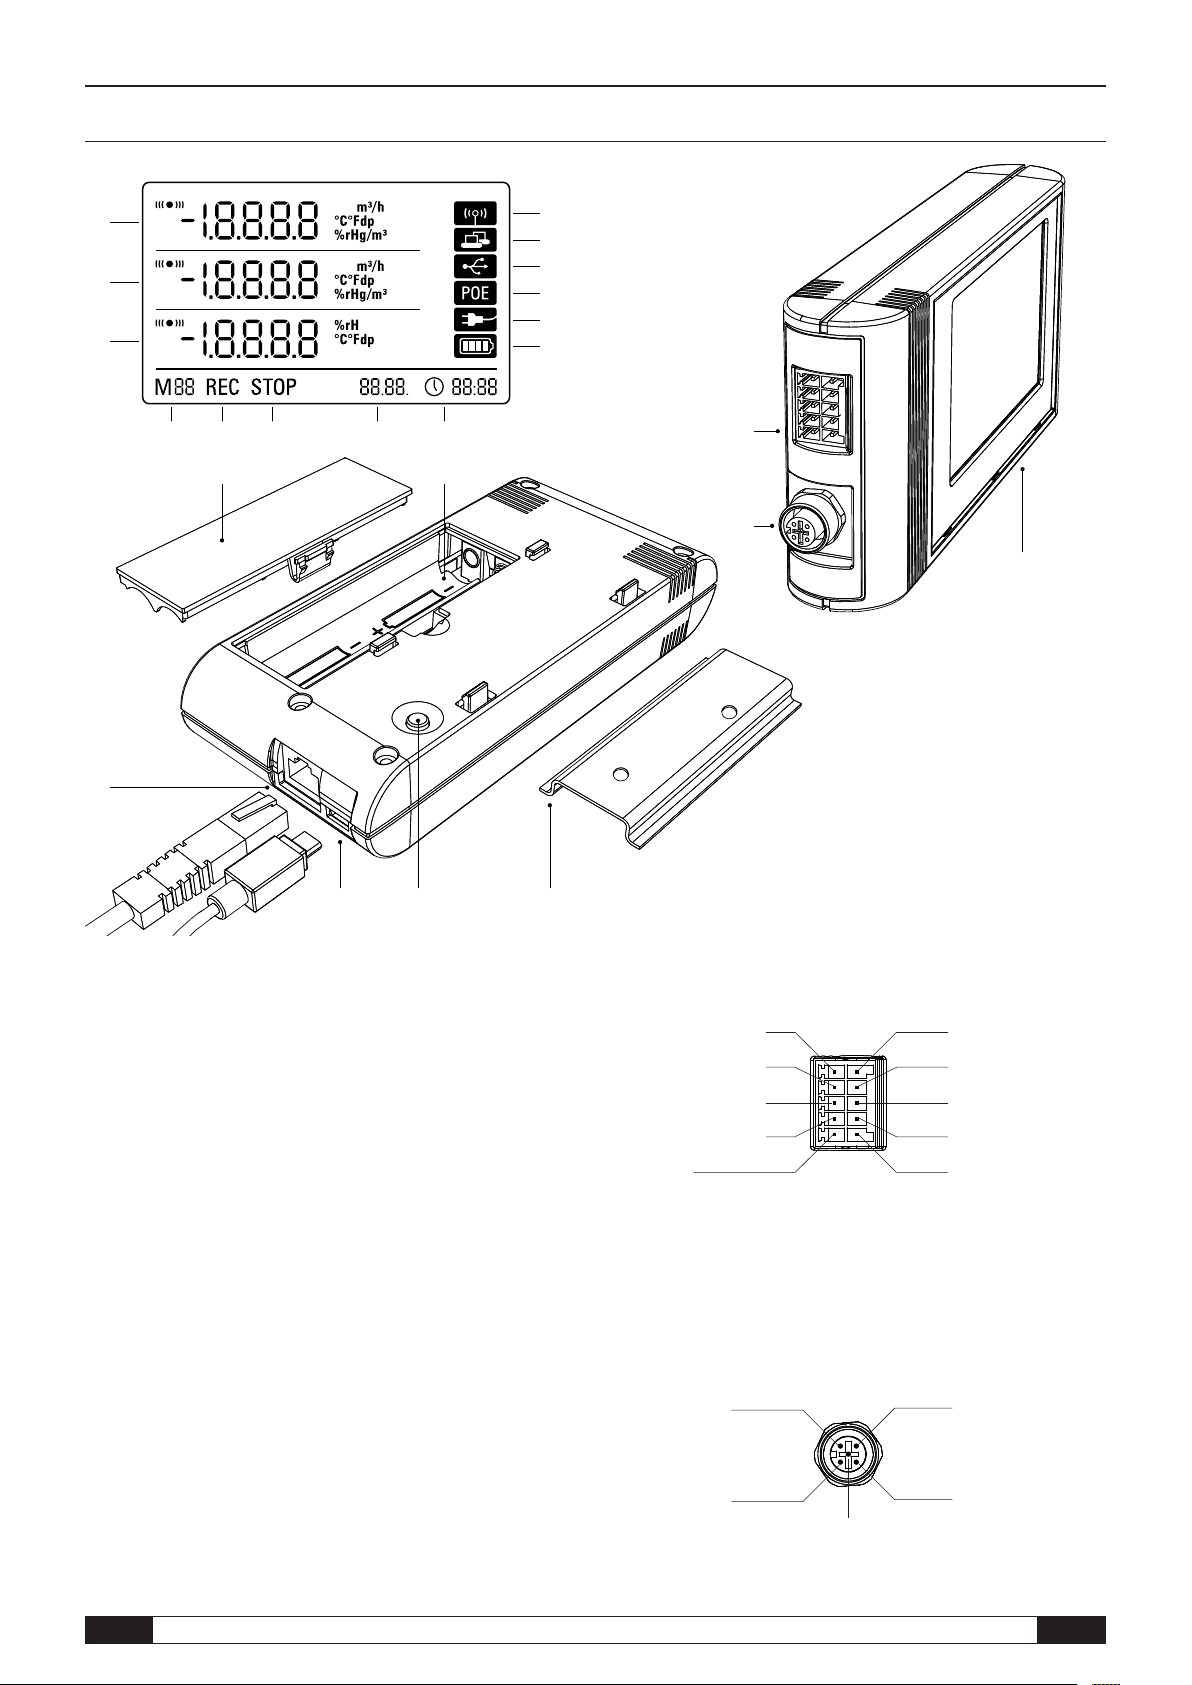
3. Equipment
Battery compartment
Battery cover
PC connection USB type micro B
Network connection RJ45
Mount track for fastening
LCD display:
Measured value row 1
Measured value row 2
Measured value row 3
Display symbol for active acoustic signal
Display symbol for active network connection
Display symbol for active USB connection
Display symbol for power supply over a network
Display symbol for power supply over USB
Display for battery level
Display for mode marker
Display for active measured value recording
Display for inactive measured value recording
Display for date
Display for time
Mode selection button
Data logger for connecting to external sensors
10-pin terminal with two independent input channels for
connecting up to two analogue sensors:
Pin 9: Terminal C0
Pin 7: Terminal A0
Pin 5: Terminal C1
Pin 3: Terminal A1
Pin 1: Terminal +24V (input, ext.
supply for data logger for stationary
operation); also as external power
supply
Pin 10: Terminal D0
Pin 8: Terminal B0
Pin 6: Terminal D1
Pin 4: Terminal B1
Pin 2: Terminal GND
(Supply voltage GND)
5-pin round connector M12 for connecting up to four digital BUS-compatible sensors:
Pin 2:
Data B
Pin 1:
Supply sensor
(output)
Pin 5: n.c.
(not connected)
Pin 3: Data A
Pin 4: GND (reference
potential)
EN
OPUS20E operating manual for external sensors
3
4. Scope of supply
The following components are included in the standard scope of supply:
• Data logger
• USB connection cable
• CD-ROM with operating manual, SmartGraph software
and software manual
• 4 x AA batteries
• Factory certificate
.2. Note at initial startup
5
After starting the device for the first time, the message “SET TIME”
b
on the device. The time synchronises itself with the PC time automatically when
connected to the SmartGraph software for the first time.
appears on the display. However, no settings need to be made directly
6. Operation
The PC software SmartGraph is the central configuration interface for your data
logger. All additional configuration and visualisation specifications can only be
set by software.
5. Preparation before starting
5.1. Software
5.1.1. Installation conditions
To configure your data logger and read the recorded measured values, the
SmartGraph software must be installed on a PC with the following minimum
requirements.
Supported operating systems:
• Windows XP from Service Pack 3 (32 bit or 64 bit version)
• Windows Vista (32 bit or 64 bit version)
• Windows 7 (32 bit or 64 bit version)
Hardware requirements:
• Processor speed: 1 GHz, minimum
• CD-ROM drive
• USB or network connection RJ45
• 512 MB RAM, minimum
• 4 GB of free hard disk space, minimum
• Adobe Acrobat Reader software
5.1.2. Installation of the SmartGraph software
Insert the CD-ROM into your PC drive and install the software by following the
instructions in the installation wizard.
5.1.3 Preparing data logger configuration
If necessary, connect the external sensors which are needed for detecting
measured values to the external connections of your data logger.
Information about connecting and configuring suitable sensors is provided
in chapters 7 and 11. Follow the instructions in chapter 7 for connecting external sensors and then continue with startup.
Afterwards, connect the data logger to your PC via the USB cable provided in
the scope of supply. The measuring device is automatically detected by the
SmartGraph software.
Alternatively, you can configure your data logger via a LAN connection over
your local network if the network function is enabled. Further information about
the network function is provided in chapter 6.2.2.
Basic settings can be directly configured with one-button operation by using
the mode selection button on your data logger.
You can restrict the one-button operation with the mode selection button from
your software if necessary (key lock). It is not possible to operate your data
logger with the mode selection button in this case.
6.1. Switching on and off
When current is being supplied, the data logger cannot completely switch off,
but can only be set to an operating mode with minimal energy consumption
(M1). In this mode, measured value detection, measured value display and data
recording are inactive. An overview of the four various operating modes is provided in the next chapter.
6.2. Basic settings and operating modes
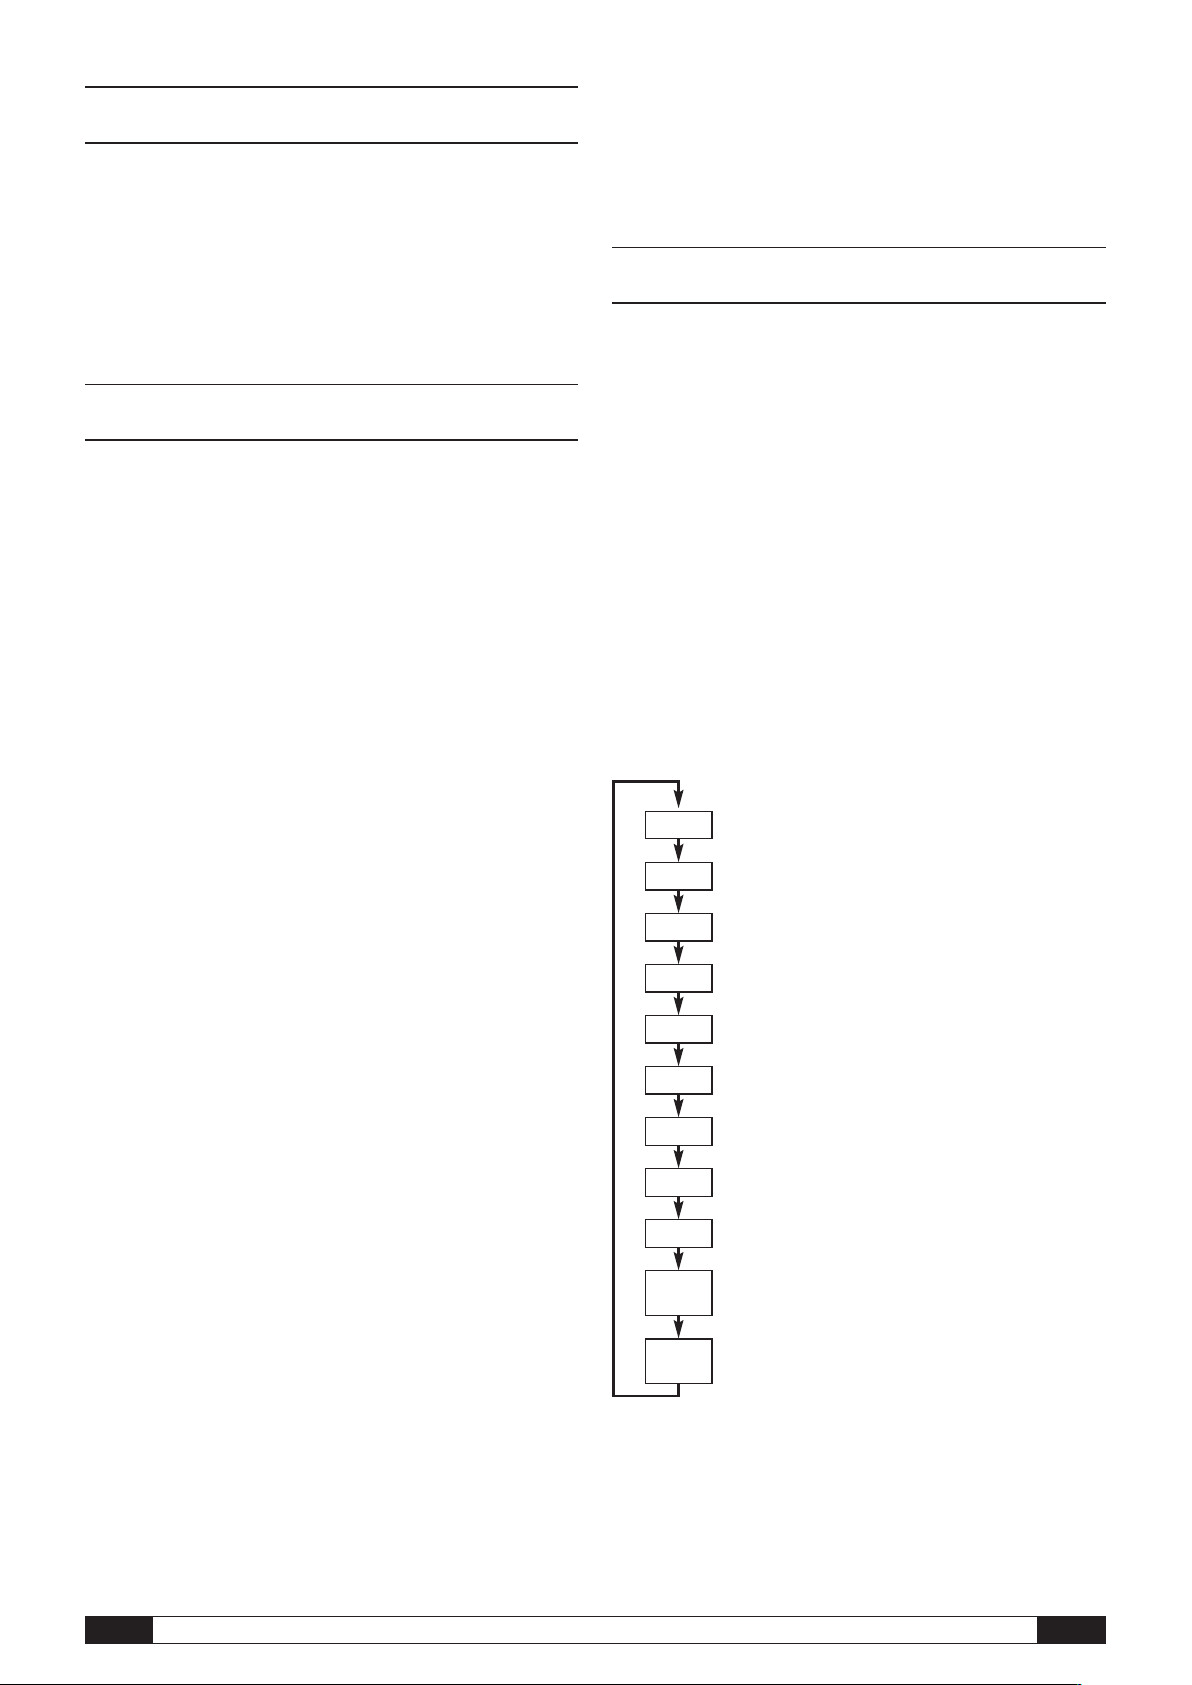
Eleven basic settings can be configured by using the mode
M1
M2
M3
M4
M51
M52
M53
M6x
M7x*
M81
An 0
M81
An 1
selection button. These include the four various operating
modes, the network function, a global reset of settings, the
acoustic function and various settings for configuring external
sensors.
Briefly pressing the mode selection button changes to the
current setting level.
Briefly pressing the mode selection button allows navigation
through the individual setting modes.
Each chosen mode is shown for four seconds and
can be selected.
Within this time, the mode marker flashes in the bottom left
corner of the display (M1, M2, M3, M4, M51, M52, M53, M6x,
M7x, M81 (An0), M81 (An1)).
Pressing the mode selection button for 1 second confirms
your selection.
The data logger then changes to the selected mode.
If no selection is confirmed within the four second period, the
setting level is left and the display returns back to the original
mode without making changes.
* This function is only available if a BUS sensor has already
been registered (M61).
Start the SmartGraph software. The program automatically detects the connected
data logger and adds it to the list of available data loggers. The data logger can
now be configured via the software.
Further detailed information about using the software is provided in the
software manual which you can open from the help function of the SmartGraph software.
EN
OPUS20E operating manual for external sensors
4
.2.1. The four operating modes
6
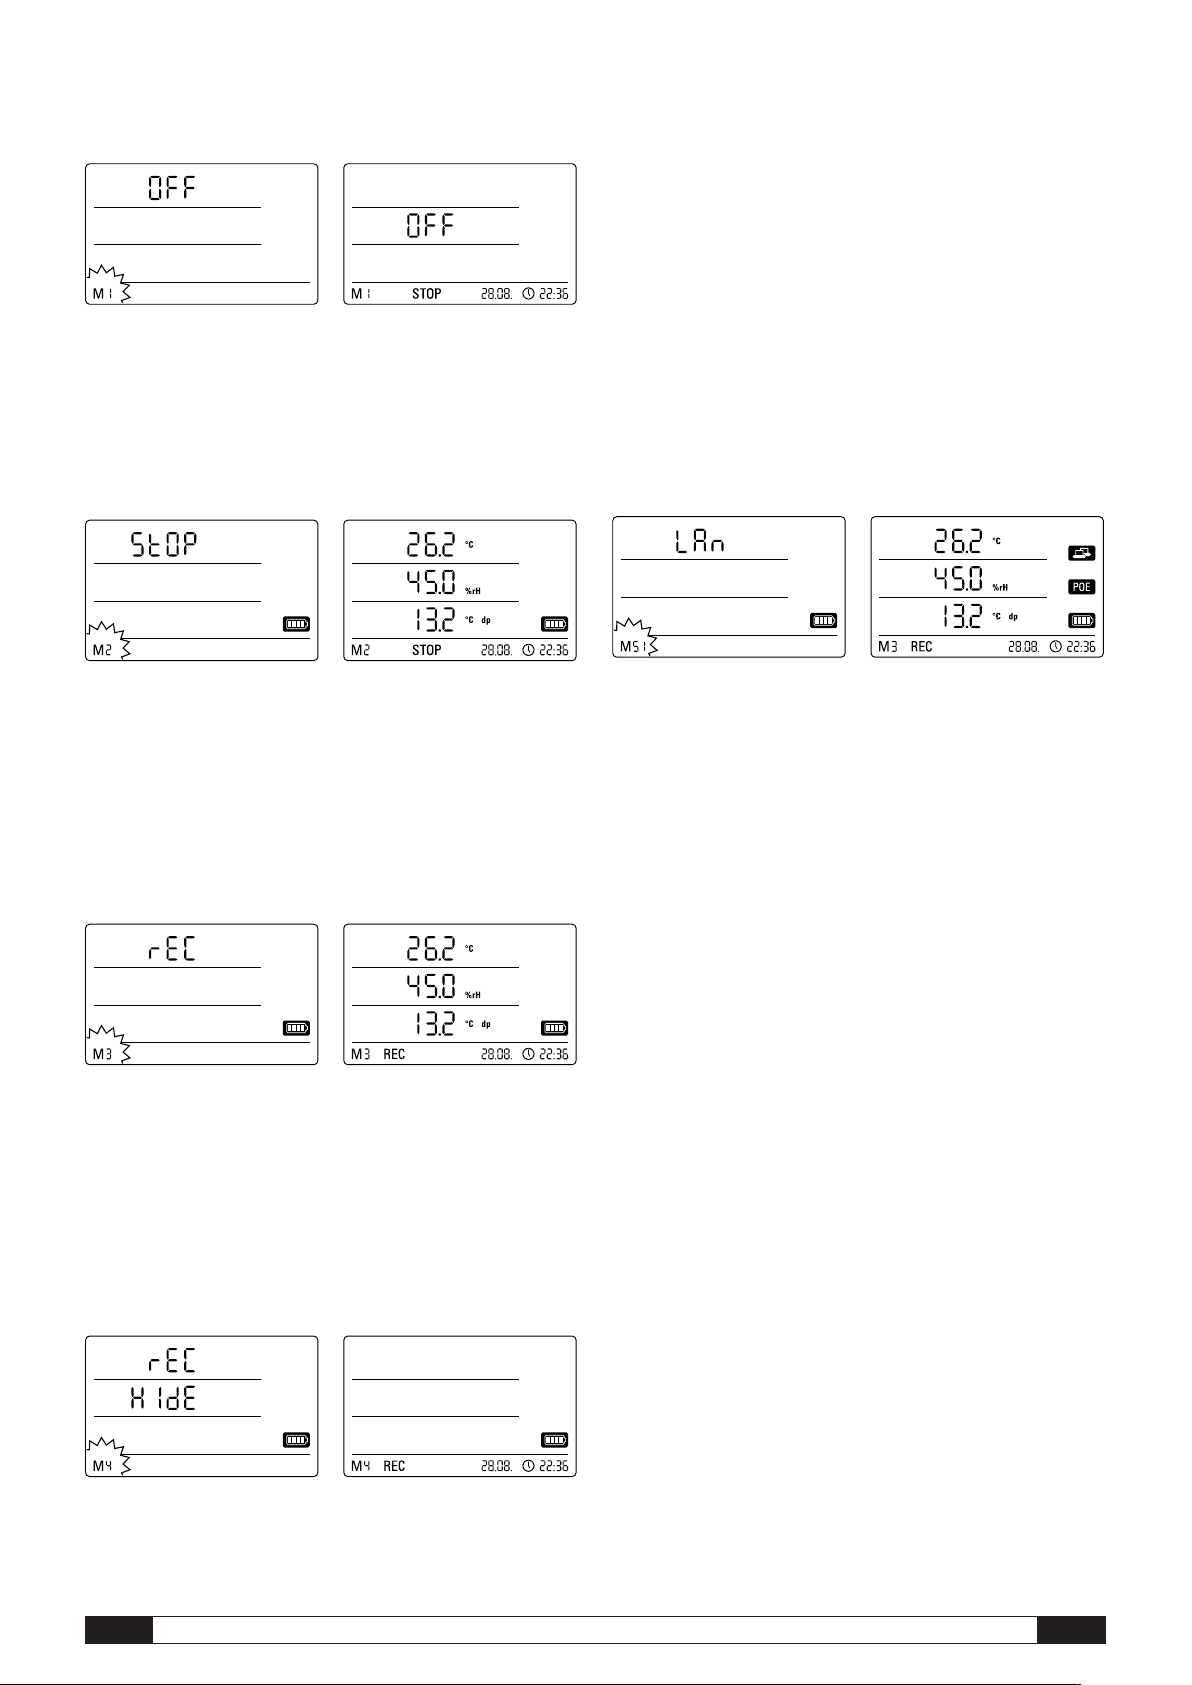
Operating mode M1
Selection of the operating mode M1 Display of the operating mode M1
Measured value recording is inactive. “OFF” is shown in the second measured
value row. The STOP symbol is shown.
In this operating mode (data logger delivery state), the power consumption is
minimal because measured values cannot be requested or shown.
Measured values are not shown in any of the three measured value rows. Still,
in this operating mode, up to twenty measuring channels, which can be selected
in the SmartGraph software, are stored in the measured value memory. The
display for measured value recording thus shows REC (data recording).
6.2.2. Network function (M51)
Requirements for connecting over a IPv4 network.
To automatically identify the IP configuration of a data logger (which has received
an IP address in the IP network via DHCP for example), it is necessary that UDP
broadcasts are allowed through the network.
Note: Based on their concept, UDP broadcasts do not operate
b
the data logger is outside of the network, using fixed IP addresses through a
system administrator is highly recommended.
through a router (NAT), but instead only within its own network. If
Operating mode M2
Selection of the operating mode M2 Example display of the operating mode M2
Measured value detection is active. The measured values which have been configured in the SmartGraph software are shown in all three measured value rows
at the selected sensing rate.
In this operating mode, data recording is inactive; the displayed measured
values are not saved in the memory. The display for measured value recording
thus shows STOP (no data recording).
Operating mode M3
Selection of the operating mode M3 Example display of the operating mode M3
Connect to the network
election of the network function M51
S
If the data logger is connected to a local network and the network function is activated, then software configuration and data reading from the data logger can
be carried out over the network.
A signal which is broadcast from the data logger over UDP allows the SmartGraph
software to automatically find the measuring device in the local network.
The first time that the data logger is connected to the network (add network
device), it may be necessary to adjust the data logger's network settings to the
configuration of the available network in the SmartGraph software. The factory
preset is DHCP.
Further information about the network function is provided in the
software manual which you can open from the help function
of the SmartGraph software.
With the professional version of the SmartGraph software, it is also possible to
retrieve and log current and saved measured values of the data logger in adjustable request intervals over the network.
xample display of the network function M51
E
Measured value detection and data recording are active. The measured values
which have been configured in the SmartGraph software are shown in all three
measured value rows at the selected sensing rate.
Additionally, in this operating mode, up to twenty measuring channels, which can
be selected in the SmartGraph software, are stored in the measured value memory.
The display for measured value recording thus shows REC (data recording).
Operating mode M4
Selection of the operating mode M4 Display of the operating mode M4
Measured value detection and data recording are active; but measured value
display is inactive.
EN
OPUS20E operating manual for external sensors
Use in network mode
For continuous use of the network card, the data logger must be mounted on
a wall. There must be a free air convection within a gap of a half metre and the
zone must not be interrupted by external sources of convection (fans, lighting
etc.).
Power supply in network mode
Using the network card, which is built into the data logger, raises the power consumption of the measuring device.
When the device is running on batteries alone and not connected to an external
power supply, it automatically deactivates the network function after 12 minutes
pass without communicating with the network. In this case, the network function
must be restarted by an external power supply either manually or automatically.
When using the data logger in LAN mode, the power should thus
b
In the optionally available PoE design, the data logger can have its power
supplied directly over the network connection.
be supplied by the USB power supply.
5

Information for system administrators
Broadcast over UDP:
PC sends to ....................................UDP:255.255.255.255:52010
(data logger receives at UDP port 52010*)
data logger replies to ......................UDP:255.255.255.255:52005
(PC receives at UDP port 52005*)
Data transmission over TCP:
data logger receives at TCP port 52015*
* The ports can be reconfigured, but this is not recommended.
Open or lost TCP connections are closed by the data logger after a TCP timeout
of 120 seconds.
.2.4. Acoustic function (M53)
6
Activating or deactivating the acoustic function switches the data logger's
acoustic signal either on or off. If the acoustic function is active, the function's
display symbol is shown on the display.
When the acoustic function is active, alarm results are indicated as a tone, provided an active alarm has been preset for one or more of the three display
measured values in the SmartGraph software.
Selection of the acoustic function M53 Example display of the acoustic function M53
6.2.3. Factory settings (M52)
This function resets the device settings
to factory settings.
Even when resetting the device to factory
settings or when there are no batteries
in the device, the measurement data remains in the memory and is not deleted.
Selection of the reset function M52
Information about deleting the measured data is provided in chapter 9.2.
If the acoustic function is not active, then none of the navigations steps which
require the mode selection button on the data logger to be pressed are acknowledged by a tone. The same applies for selecting a mode.
If no selection is made, and thus the setting level is exited, then a tone is also
emitted.
7. Connection and configuration of external sensors
The data logger has a 5-pin round connector M12 for connecting digital BUScompatible sensors (BUS-sensor) and also has a 10-pin terminal with two independent input channels for connecting up to two analogue sensors.
7.1 BUS sensors
7.1.1 Connection of BUS sensors
Attach the BUS sensor to the 5-pin round connector of the data logger (see ,
chapter 3). The sensor is supplied with current via the plug.
By optionally using up to three Y-distributors, a maximum of four digital BUS sensors can be connected to
the data logger.
Further information about the currently available BUS
sensors is provided in the technical data in chapter 11.
7.1.2 Configuration of BUS sensors (M6x)
So that BUS sensors can be used with the data logger, each BUS sensor must
first be registered at the data logger individually.
It is only possible to configure if the data logger is not
in logging mode (M3 or M4)!
The BUS sensors can be configured at the data logger as described below or
otherwise, directly in the SmartGraph software. Further detailed information
about configuration of the BUS sensors in the software is provided in the
software manual which you can open by using the help function of the SmartGraph software.
To configure at the data logger, connect the first BUS sensor to be registered to
the 5-pin round connector of the data logger and then use the mode selec tion button to navigate to the configuration mode M6x – as described in chapter
6.2. The option for registering the BUS sensor is shown on the display (n1 for
the first sensor to n4 for the fourth sensor).
Briefly pressing the mode selection button starts registration of the BUS sensor.
The display then changes to the scan mode and the connected BUS sensor is
automatically detected and identified.
At identification, the sensor is assigned a four-digit BUS ID. The first two digits
of the ID represent the sensor type (e.g. 71 for TFF sensors). The last two digits
represent the sensor number and are automatically assigned according to the
order of registration – 01 for the first to 04 for the fourth registered sensor.
After sensor registration, a message is displayed with information about the
BUS ID – the message symbol in the bottom right corner of the display flashes.
Briefly pressing the mode selection button closes the message.
Tip: Note the BUS ID for measuring in the future
directly on the sensor.
R
EN
OPUS20E operating manual for external sensors
6

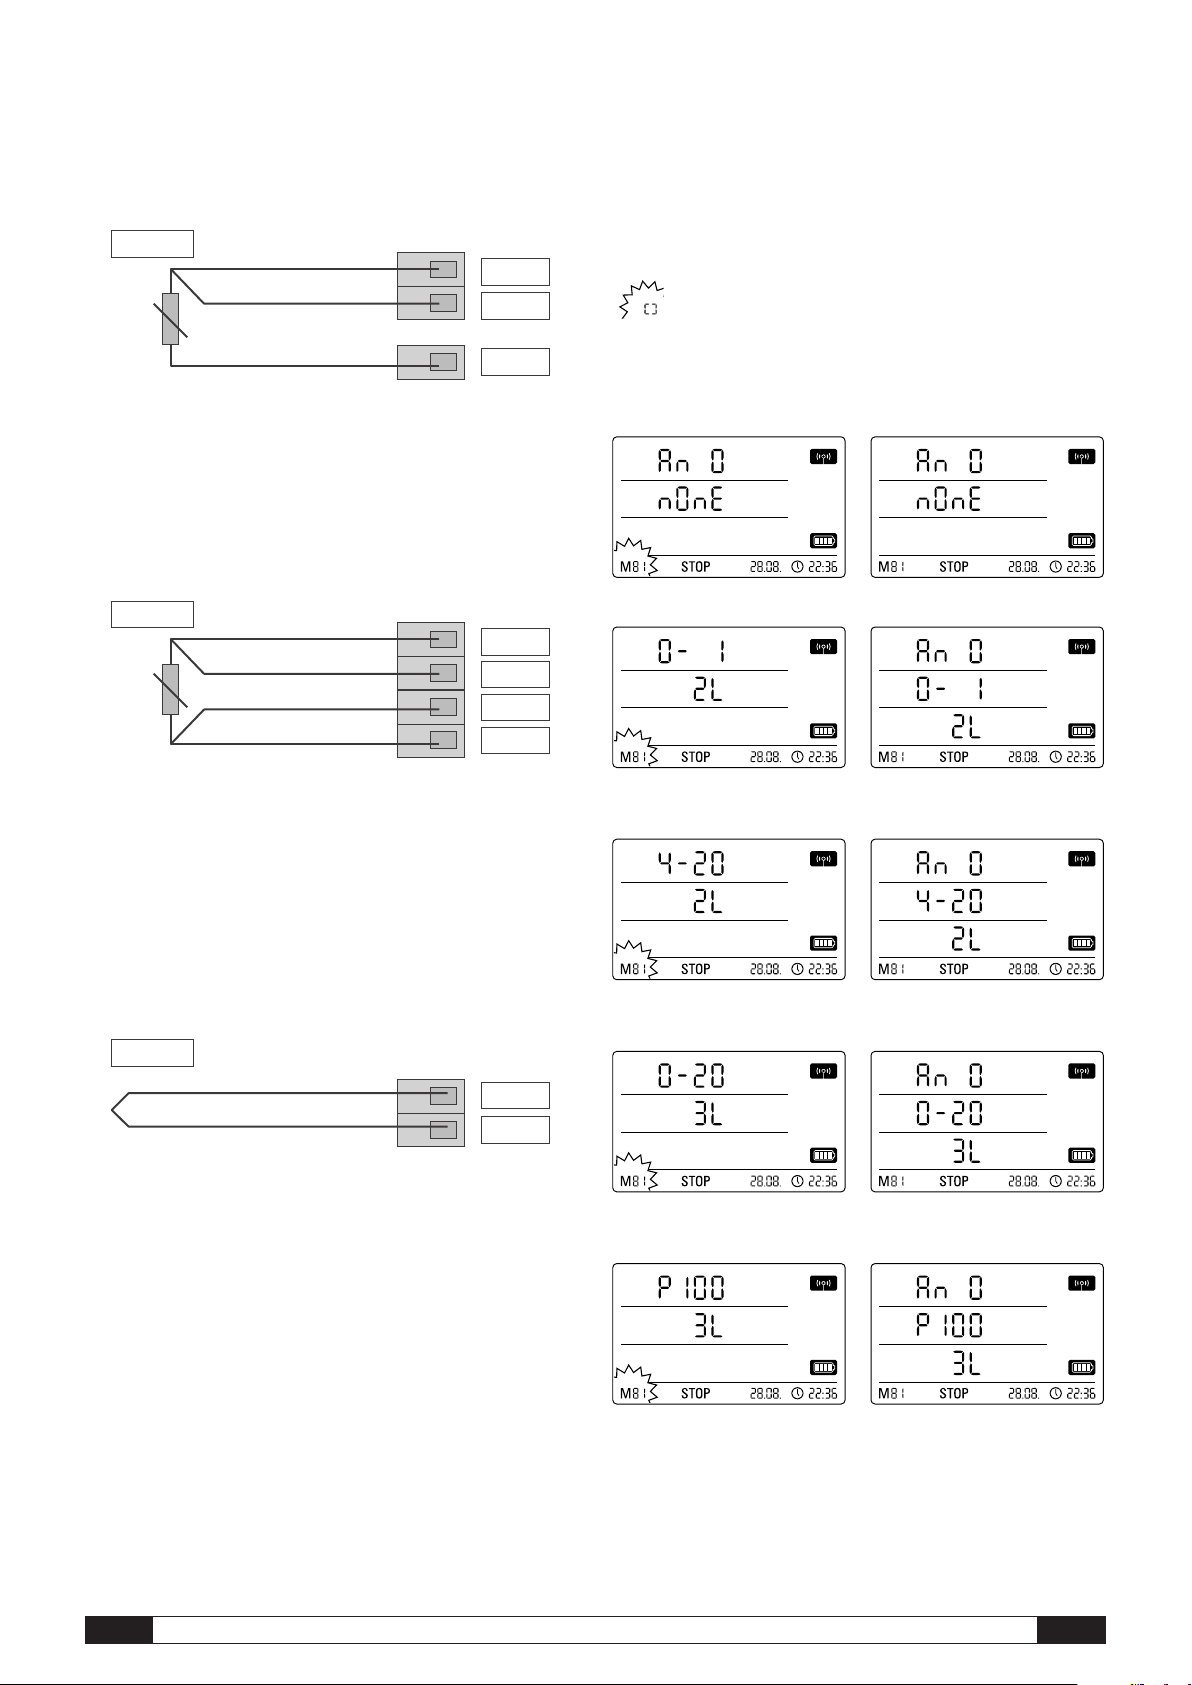
.2.1 Sensors for measuring voltage 0 - 1V
Ri
+-
Sensor
B0 / B1
A0 / A1
GND
Sensor: 4 … 20 mA
External power supply
A0 / A1
+24V
Sensor
GND
Sensor: 0/ 4 … 20 mA
External power supply
A0 / A1
+24V
Sensor
7
The sources of voltage are connected with the positive pole at terminal B and
with the negative pole at terminal A, as shown in the diagram:
Example display: Registration function
61 selection for registering the first
M
BUS sensor (n1).
Important: If several sensors are used, each sensor must first
b
signed a BUS ID in this manner. The registration process cannot be carried
out if more than one sensor is connected to the BUS !
T
to the BUS for registration.
This restriction only applies for the registration process. After all sensors
have been individually registered, it is possible to use several BUS sensors
without difficulty, of course.
Otherwise, the BUS sensors can be configured directly
in the SmartGraph software.
Further detailed information about configuration of the BUS sensors in the
software is provided in the software manual which you can open by using
the help function of the SmartGraph software.
be individually connected to the data logger, registered and as-
hus, ensure that only the applicable sensor is connected
Example display: Message specifying
he BUS ID (71.01) for the first registered
t
BUS sensor.
7.1.3 Logging the BUS sensors (M7x) off
Important: The voltage input is a real difference input.
too long, it might be necessary to connect the sensor via shielded cabling.
The cable shield should be connected to the GND terminal.
To register and configure sensors for measuring voltage at the data logger,
follow the instructions in chapter 7.3.
f the sensor is connected to the data logger via cables which are
I
7.2.2 Sensors for measuring current, 2-cable 4 - 20 mA
and 3-cable 0 - 20 mA
The switching supports current measurement in 2-cable and 3-cable operation.
For 2-cable operation, sensor supply and supply for the OPUS20E must have
identical reference potential. In 2-cable and 3-cable operation, the sensor
current is fed into the A0/A1 terminal.
Wiring diagram for measuring current in 2-cable operation:
Example display: Log off function M70
selection for logging off the first selected
sensor.
To log off a registered BUS sensor from the data logger again, use the mode
selection button to navigate to the configuration mode M7x. The option for re-
moving the first BUS sensor is shown on the display.
To log off, it is not necessary to connect the sensor to the device!
If several BUS sensors had already been connected and a BUS sensor which is
not the first is to be removed, press the mode selection button until the BUS ID
shows the sensor to be removed.
Briefly pressing the mode selection button now starts BUS sensor log off. After
sensor log off, a message is displayed with information about the BUS ID – the
message symbol in the bottom right corner of the display flashes. Briefly press -
ing the mode selection button closes the message.
Example display: Message specifying
the BUS ID (71.01) for the logged off
BUS sensor.
7.2 Connection of analogue sensors
The data logger has a 10-pin terminal with two independent input channels for
connecting up to two analogue sensors. Input channel 1 has pins 1, 3, 5, 7 and
9 while input channel 2 has pins 2, 4, 6, 8 and 10 (see , chapter 3).
Both of the input channels support the sensor configurations listed in
the following subchapters.
EN
OPUS20E operating manual for external sensors
The sensor current is converted into voltage in the OPUS20E at a load. The load
has a resistance of <50 Ω. Both the sensor and the OPUS20E can be supplied
via an external source of voltage.
Wiring diagram for measuring current in 3-cable operation:
This switching is used for sensors whose own current usage is over 4 mA, such
as gas sensors for example.
To register and configure sensors for measuring current at the data logger,
follow the instructions in chapter 7.3.
7
.2.3 Pt100 sensors in 3- and 4-cable switching
D0 / D1
B0 / B1
A0 / A1
Pt100
D0 / D1
B0 / B1
A0 / A1
C0 / C1
Pt100
TC+
TC(-)
B0 / B1
A0 / A1
Sensor
7
For 3-cable switching, the PT100 is connected to the measurement switching
ia 3 cables. The measuring current is fed into the sensor via the D0/D1 cable.
v
The resistance of the PT100 is determined from the terminal voltages B0/B1,
0/C1 and D0/D1:
C
Important: The OPUS20E is able to compensate cable resistances
up to 10 Ω. The compensation typically reduces the influence of
the cable resistance by a factor of 100.
For 4-cable switching, the PT100 is connected to the measurement switching
via 4 cables. The measuring current is fed into the sensor via the D0/D1 and
C0/C1 cable. The resistance of the PT100 is determined from the terminal
currents B0/B1, A0/A1:
At initial startup, there is no sensor assignment preset in the factory; at later
configurations, previous specifications are preset. Pressing and holding the
mode selection button makes it possible to now change to the configuration
menu for the analogue sensor specifications.
Press the mode selection button again until the desired sensor specification
appears on the screen. Then, press and hold the mode selection button to
confirm the desired sensor specification.
After sensor registration, a message is displayed with information
about the desired sensor configuration – the message symbol in the
bottom right corner of the display flashes. Briefly pressing the mode
selection button closes the message.
Example LCD displays of sensor specification for registering
an analogue sensor at the first input channel (AN0):
Selection for specifying no sensor assignment at the first input channel.
Status indicating that no sensor is
registered at the first input channel.
For exact temperature measurements, 4-cable switching is recommended.
To register and configure PT100 sensors at the data logger,
follow the instructions in chapter 7.3.
7.2.4 Thermal elements
The data logger supports the connection of thermal elements of the types J, K
and S. The thermal element is connected with the positive pole at terminal B
and with the negative pole at terminal A:
Important: When connecting thermal elements,
observe the polarity.
To register and configure thermal elements at the data logger, follow the in structions in chapter 7.3.
7.3 Configuration of analogue sensors (M81)
So that analogue sensors can be used with the data logger, their specification
at the data logger must be configured correctly.
Selection of a sensor for measuring
voltage 0 - 1V.
Selection of a sensor for measuring
current in 2-cable operation.
Selection of a sensor for measuring
current in 3-cable operation.
Status indicating that a sensor is
registered for measuring voltage 0 - 1V
at the first input channel.
Status indicating that a sensor is registered for measuring current in 2-cable
operation at the first input channel.
Status indicating that a sensor is registered for measuring current in 3-cable
operation at the first input channel.
It is only possible to configure if the data logger is not in logging mode
(M3 or M4)!
To configure the sensors, use the mode selection button to navigate to the configuration mode M81 (AN0) – as described in chapter 6.2 – in order to configure
the specification of a sensor for the first input channel. Alternatively, navigate to
the configuration mode M81 (AN1) to configure the specification of a sensor for
the second input channel. The option for configuring the first analogue sensor is
shown on the display.
EN
OPUS20E operating manual for external sensors
Selection of a PT100 sensor in 3-cable
operation.
Status indicating that a PT100 sensor is
registered in 3-cable operation at the first
input channel.
8

election of a PT100 sensor in 4-cable
S
operation.
tatus indicating that a PT100 sensor is
S
registered in 4-cable operation at the first
nput channel.
i
election of a thermal element of the
S
J type at the first input channel.
tatus indicating that a thermal element
S
of the J type is registered at the first
nput channel.
i
election of a thermal element of the
S
K type.
tatus indicating that a thermal element
S
of the K type is registered at the first
input channel.
election of a thermal element of the
S
S type at the first input channel.
8. Measured values display and data recording
8.1. Channel groups and measuring channels
Each measured value in the specified measuring unit which is detected by a
connected sensor represents a channel group.
A temperature sensor with the specifiable measuring units °C or °F represents
for example two channel groups (temperature °C and temperature °F).
The amount of channel groups which can be detected by a BUS sensor depends
on the sensor design. The BUS sensor of the TFF type can detect seven different
channel groups for example.
Analogue sensors for measuring voltage and current can only detect one channel
group each; analogue sensors for measuring temperature can detect two channel
groups (°C and °F).
For each channel group, there are then four measuring channels for recording:
Current measured value (cur), minimum measured value (min), maximum measured value (max) and average measured value (mid).
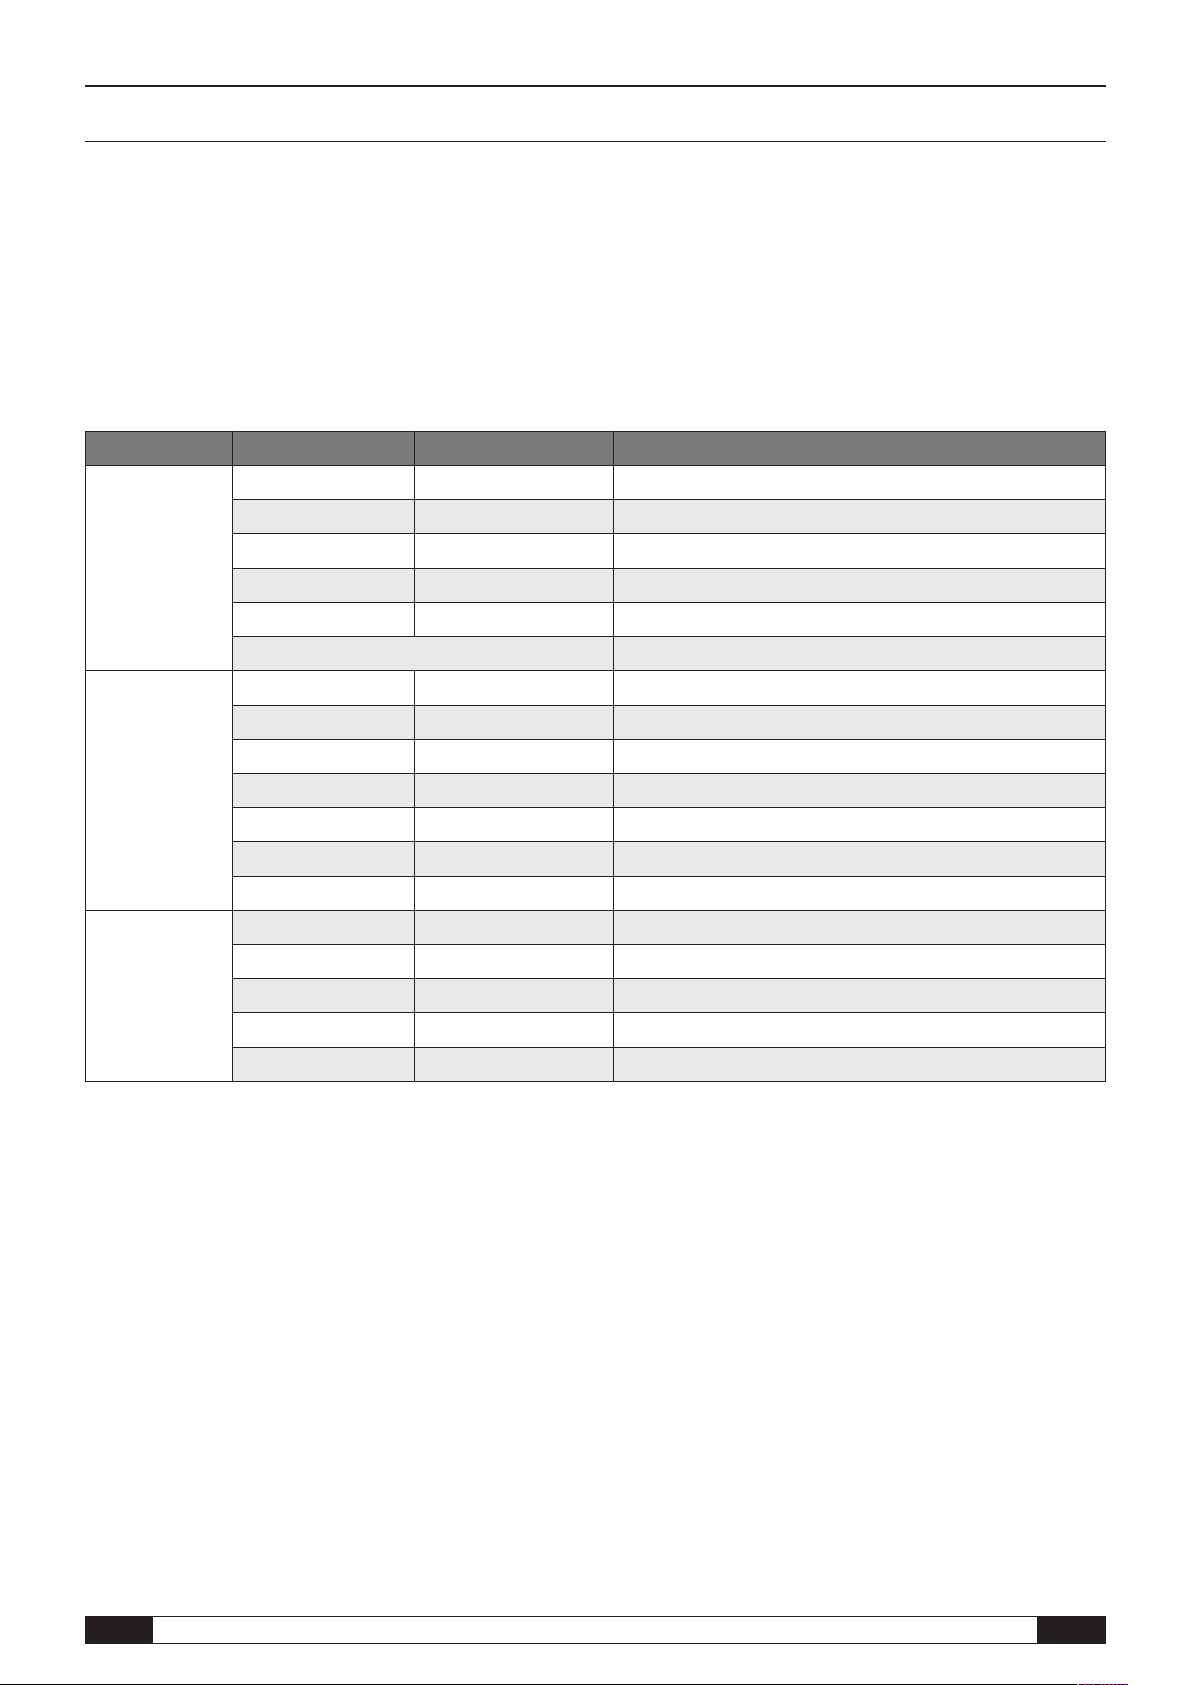
When all sensors are assigned with a total of four connected BUS sensors of
the TFF type and two connected analogue PT100 sensors, the data logger can
detect a total of 32 channel groups and 128 measuring channels, as shown in
table 2.
Further detailed information about configuration of the processing channels
in the software is provided in the software manual which you can open by using the help function of the SmartGraph software.
8.3. Displaying measured values
One of the channel groups specified in table 1 for displaying measured values
can be configured to be displayed on each of the three measured value rows.
Here, the current measured value is always shown on the display.
8.4. Data recording
If either of the operating modes M3 or M4 are selected, then the data logger is
in logging mode (REC) and the measured values of the measuring channels selected for recording are saved in the device.
Up to 20 of the measuring channels specified in table 2 can be simultaneously
recorded in the data memory of the measuring device.
Recording begins immediately from the moment that the operating mode M3 or
M4 is selected and is carried out in ring mode. This means that when the
memory limits are reached, the recording does not stop but continues to record.
The older values are simply overwritten by the newest measured values.
tatus indicating that a thermal element
S
of the S type is registered at the first
input channel.
8.2 Processing channels for converting
measured values
With the SmartGraph software, analogue sensors which supply a current or voltage value can be used as processing channels for converting measured values.
Processing channels make it possible to convert the input values of analogue
sensors which supply a current or voltage value into the actual measured value.
Measuring unit, conversion parameter and decimal points can be specified for
each processing channel and assigned to a sensor type (see table 1).
Table 1: Available processing channels for converting measured values
associable
units:
associable
sensor types:
EN
counts, logic, digits, °C, °F, K, °Cdp, °Fdp, %rH, g/kg, g/m³, µm, mm, cm, dm, m, km, in, mil, ft, mi, m/s, km/h, kts, ppm,
mV, V, mA, A, Hz, kHz, bar, mbar, Pa, mPa, hPa, kPa, m³, l, s, ms, µs, %, °, mm/h, m³/h, l/m², in/h, mil/h, g, kg
temperature, relative humidity, absolute humidity, dew point, battery voltage, voltage, current, absolute air pressure, relative
air pressure, building moisture, flow rate, mix ratio, CO2 concentration, particles 0.1 µm, particles 0.2 µm, particles 0.3 µm,
particles 0.5 µm, particles 1 µm, particles 5 µm, particles 10 µm, particles x µm, particles y µm, particles z µm, unknown, inactive, wet-bulb temperature, global radiation, daylight, amount of rain, wind speed, wind direction, analogue/digital input,
ground moisture, leaf wetness
OPUS20E operating manual for external sensors
Tip: Current, minimum, maximum and average measured values
R
for a channel group each represent one measuring channel. If these
values should be available for later documentation and evaluation, each of
the measuring channels must already be selected during memory organi sation for recording, because it is not possible to calculate these values in
the software.
The specifications for type, duration and scope of data recording in the logging
mode can be individually set in the software. Detailed information is provided in
the software manual.
9

Table 2: Overview of available channel groups (measured values) and measuring channels of the data logger
Sensor
assign-
Sensor type Channel group
(measured value)
Unit Available
ment
Temperature °C – cur min max mid
Temperature °F – cur min max mid
BUS
sensor 1
e.g. TFF sensor
BUS class 71
Dew point °C – cur min max mid
Dew point °F – cur min max mid
Relative humidity % – cur min max mid
Absolute humidity g/m³ – cur min max mid
Mix ratio g/kg – cur min max mid
Temperature °C – cur min max mid
Temperature °F – cur min max mid
BUS
sensor 2
(with Y
distributor)
e.g. TFF sensor
BUS class 71
Dew point °C – cur min max mid
Dew point °F – cur min max mid
Relative humidity % – cur min max mid
Absolute humidity g/m³ – cur min max mid
Mix ratio g/kg – cur min max mid
Temperature °C – cur min max mid
Temperature °F – cur min max mid
BUS
sensor 3
(with Y
distributor)
e.g. TFF sensor
BUS class 71
Dew point °C – cur min max mid
Dew point °F – cur min max mid
Relative humidity % – cur min max mid
Absolute humidity g/m³ – cur min max mid
Mix ratio g/kg – cur min max mid
Temperature °C – cur min max mid
Temperature °F – cur min max mid
BUS
sensor 4
(with Y
distributor)
e.g. TFF sensor
BUS class 71
Dew point °C – cur min max mid
Dew point °F – cur min max mid
Relative humidity % – cur min max mid
Absolute humidity g/m³ – cur min max mid
Mix ratio g/kg – cur min max mid
Measuring voltage 0 - 1 V Voltage V
Measuring current in 2-cable operation 4 - 20 mA Current mA cur min max mid
Measuring current in 3-cable operation 0 - 20 mA Current mA cur min max mid
PT100 temperature measurement in 3-cable operation Temperature °C – cur min max mid
Analogue
sensor 1
at input
channel 1
(An0)
PT100 temperature measurement in 3-cable operation Temperature °F – cur min max mid
PT100 temperature measurement in 4-cable operation Temperature °C – cur min max mid
PT100 temperature measurement in 4-cable operation Temperature °F – cur min max mid
Temperature measurement with thermal element K type Temperature °C – cur min max mid
Temperature measurement with thermal element K type Temperature °F – cur min max mid
Temperature measurement with thermal element J type Temperature °C – cur min max mid
Temperature measurement with thermal element J type Temperature °F – cur min max mid
Temperature measurement with thermal element S type Temperature °C – cur min max mid
Temperature measurement with thermal element S type Temperature °F – cur min max mid
Measuring voltage 0 - 1 V Voltage V
Measuring current in 2-cable operation 4 - 20 mA Current mA cur min max mid
Measuring current in 3-cable operation 0 - 20 mA Current mA cur min max mid
PT100 temperature measurement in 3-cable operation Temperature °C – cur min max mid
Analogue
sensor 2
at input
channel 2
(An1)
PT100 temperature measurement in 3-cable operation Temperature °F – cur min max mid
PT100 temperature measurement in 4-cable operation Temperature °C – cur min max mid
PT100 temperature measurement in 4-cable operation Temperature °F – cur min max mid
Temperature measurement with thermal element K type Temperature °C – cur min max mid
Temperature measurement with thermal element K type Temperature °F – cur min max mid
Temperature measurement with thermal element J type Temperature °C – cur min max mid
Temperature measurement with thermal element J type Temperature °F – cur min max mid
Temperature measurement with thermal element S type Temperature °C – cur min max mid
Temperature measurement with thermal element S type Temperature °F – cur min max mid
processing
channels for
converting
measured
yes,
see table 1
yes,
see table 1
values Available measuring
channels for data recording
(max. 20 channels available for
saving) and for displaying
(max. 3 channels for display)
cur min max mid
cur min max mid
EN
OPUS20E operating manual for external sensors
10

9. Alarm function
9.1. Alarm configuration
An alarm function can be configured in the measuring device administration for
each of the measuring channels selected for display or recording.
By defining an upper and lower alarm limit value, a value corridor is specified.
This is the so-called good range and when the range is exited, an alarm sounds.
Note: The alarm function can only be represented on the display for the
channel groups of the three measuring channels selected for measured
value display, and only in the operating modes M2 and M3 !
However, saving alarm results of other selected measuring channels in logging
mode is independent of the selected display of the measured values. That
means that the alarm results of the measuring channels which are not for
display but for data recording are also recorded.
Even in the operating mode M4 when displaying measured values is deactivated,
all preselected alarm results are recorded !
9.2. Alarm display
The alarm display is only possible for
measured values which are preselected
for displaying and which have been configured with an active alarm function.
.3. Acoustic alarm
9
If an alarm goes off while the acoustic function is activated (see chapter 6.2.4.
Acoustic function), then and alarm tone sounds and only stops when the
measured value returns to the good range.
9.4. Using the alarm hysteresis
If you use the alarm function without alarm hysteresis, then an alarm sounds
and is recorded each time the preset limit values are exceeded.
If your limit values have been selected very close to each other, then this means
that an alarm situation occurs very often.
For example, if you set a room temperature of 24 °C as the upper alarm limit
nd a room temperature of 10 °C as the lower alarm limit and the room temper-
a
ature continually deviates between 23.5 and 25 °C during the measuring period,
then there will be many individual alarm signals created and recorded.
To prevent this, you can define an alarm hysteresis. With this setting, you define
a value by which the measured value must have returned to the valid value
corridor, the good range, in order to switch off the alarm.
If an alarm hysteresis of 1 °C was set, the alarm in the previous example would
go off once as 24 °C was exceeded and then only stop as the temperature
drops below 23 °C again.
Upper alarm
imit value
l
If an alarm occurs at one of these measuring channels, the alarm symbol
Example display for an alarm result of the
measuring channel shown in the first
measured value row.
flashes beside the measured value display for this channel while the good
range is exited.
If the measured value then reaches the
defined value corridor, that is, the good range, then the alarm symbol stops
flashing and is shown continually.
This indicates that an alarm result occurred. If the good range is exited during
the course of a measurement, the alarm symbol flashes again.
Reading the measured value memory deletes the alarm display.
Alarm display
Upper alarm
limit value
Valid value
corridor
“good range”
Lower alarm
limit value
flashing
static
Logging mode
Reading the measured value memory
Valid value
corridor
“good range”
Lower alarm
limit value
flashing
static
Upper alarm
limit value
Valid value
corridor
“good range”
Lower alarm
limit value
flashing
static
Alarm display without hysteresis
Logging mode
Alarm display with hysteresis
HYSTERESIS
Logging mode
Additionally, a hysteresis can be set by which the measured value must return
to the valid range to switch off the alarm.
EN
OPUS20E operating manual for external sensors
11

10. Notes on maintenance and operation
10.1. Battery change
If “LO bAtt” appears in the upper row of the display, then the batteries need
to be changed.
No data can be recorded while batteries are being changed. If data
recording is running, pause it and ensure that the data logger is in
perating mode M1 or M2 before changing the batteries.
o
To replace the batteries, open the battery compartment, remove the used batteries and then insert new batteries, while observing the correct poles.
The time is maintained for at least a minute during battery change,
even when batteries are not inserted.
Only use appropriate batteries which comply with the technical data. Other types
f batteries can cause operating errors. Do not use rechargeable batteries !
o
Do not dispose of used batteries in the household rubbish or throw them in the
fire; instead, dispose of them according to the relevant legal requirements.
10.2. Deleting measured data
The detected measured data are permanently saved in the internal Flash
memory. Even when resetting the device to factory settings or when there are
no batteries in the device, the measurement data remains in the memory and is
not deleted.
Saved data can only be deleted via the SmartGraph3 software as a whole and
not individually.
10.3. Positioning for mobile use
For mobile measured value recording, the data logger can be positioned at any
site. Observe the permissible ambient conditions for operation (see technical
data). Due to its compact dimensions, the data logger can be hidden for non intrusive applications.
10.4. Mounting on a wall
For stationary data detection, the data logger can also be mounted on a wall
or a similar holding device. A mount track is included in the scope of supply
for fastening.
For network operation, wall mounting is absolutely necessary.
Additional information about network operation is provided
in chapter 6.2.2.
10.5. Moving to another site
Especially when moving from cold to warm ambient conditions, e.g. when
moving into a heated room after storage in a car over night, depending on humidity in the room, condensation may form on the printed circuit board.
This physical trait can lead to false measured values. Unfortunately, it is neces sary for the construction and cannot be prevented in any measuring devices.
In these cases, please wait approx. 5 minutes until the measuring device has
“acclimatised” before starting to measure.
The deletion process takes approx. 2
minutes. During this time, the following
messages appears on the display:
“FOMA FLSH xxx %”.
During the entire deleting period, access
to the device is not possible and it does
Display for deleting measured data.
In the display, 6 % of the data have been
deleted so far.
on the display. Afterwards, the display returns to normal operation.
Further detailed information about using the software is provided in the
software manual which you can open from the help function of the SmartGraph software.
not respond to requests from the Smart-
Graph3 software.
After memory has been completely
deleted, “FOMA FLSH 100 %” is shown
EN
OPUS20E operating manual for external sensors
12

11. Technical data
OPUS20E data logger for external sensors
Voltage input
0 - 1 V
Voltage
measurement
Thermal element K
Thermal element J
Thermal element S
easuring range
M
Accuracy ±200 µV ± 0.1 % of measured value
Resolution < 500 µV
Measuring range 2-cable operation: 4 … 20 mA, 3-cable operation: 0 … 20 mA
Accuracy ± 4 µA ± 0.1 % of measured value
Resolution < 5 µA
Total load approx. 50 Ω
Measuring range -200 °C … 1,200 °C
Accuracy
Resolution < 0.2 °C
Measuring range -200 °C … 1,200 °C
Accuracy
Resolution < 0.2 °C
Measuring range -50 °C … 1,700 °C
Accuracy
Resolution < 0.2 °C
± 1 °C ± 0.5 % of the measured value at -200 °C … 0 °C,
± 1 °C ± 0.2 % of the measured value at 0 °C … 1,200 °C
± 1 °C ± 0.5 % of the measured value at -200 °C … 0 °C,
± 1 °C ± 0.2 % of the measured value at 0 °C … 1,200 °C
± 1 °C ± 0.5 % of the measured value at -50 °C … 0 °C,
± 1 °C ± 0.2 % of the measured value at 0 °C … 1,700 °C
… 1 V
0
Pt100
Memory
organisation
Configuration and
dimensions
Power supply
Permissible
operating ambient
conditions
Measuring range -200 °C … 500 °C
Accuracy ± 0.2 °C ± 0.1 % of the measured value
Resolution < 0.02 °C
Sensing interval 10 / 30 s, 1 / 10 / 12 / 15 / 30 min, 1 / 3 / 6 / 12 / 24 h
Saving interval 1 / 10 / 12 / 15 / 30 min, 1 / 3 / 6 / 12 / 24 h
Data storage 16 MB, approx. 3,200,000 measured values
Data recording up to 20 simultaneous measuring channels
LCD display W 90 x H 64 mm
Housing Plastic
Dimensions L 180 x W 32 x H 78 mm
Weight approx. 250 g
Interfaces USB, LAN, RS485 (Sensor BUS)
internal
external
Air temperature -20 °C to +50 °C
Relative humidity 0 to 95 % RH, < 20 g / m³ (non-condensing)
Height 10,000 m above sea level
4 x LR6 AA batteries, battery life > 1 year
(depending on connected sensor and configuration)
USB, LAN (PoE configuration),
terminals for external power supply to supply the sensor
Scope of supply
EN
Measuring device, CD-ROM with SmartGraph 3 PC software for representing the evaluation
Standard
Optional Measuring device in PoE configuration, TFF sensors
OPUS20E operating manual for external sensors
of measured values graphically and numerically and operating manual,
USB connection cable, batteries
13
12. Status codes
In the event of a sensor error, the following codes may appear on one of the three LCD rows instead of the measured value
E 2C.........Initialisation error at the sensor
E 27 .........Faulty calibration data
E 36 .........Channel disabled (e.g. channel configured in the LCD,
but sensor logged off or removed)
E 50 .........Value to be displayed too large to fit on display
Sensor Status Measuring range Code
0 … 1 V
4 … 20 mA
egative polarity
N
Limit range -0.024 V … 0.000 V Displayed: 0.000V
Normal operation mode 0.000 V … 1.000 V
Limit range 1.000 V … 1.024 V Displayed: 1.000V
Overvoltage approx. > 1.024 V 0x52 (CHANNEL_OVERRANGE)
Special case: open Input floating, e.g. CHANNEL_OVERRANGE, so 0x52
Negative polarity approx. < -0.48 mA 0x53 (CHANNEL_UNDERRANGE)
Sensor breakage approx. -0.48 mA … 0.30 mA 0x55 (MEAS_UNABLE)
Fault current 0.30 mA … 3.00 mA 0x51 (VALUE_UNDERFLOW)
Limit range 3.00 mA … 4.00 mA Displayed: 04.00mA
pprox. < -0.024 V
a
E 51 .........Value to be displayed too small to fit on display
E 52 .........Channel value in the saturation (upper limit)
E 53 .........Channel value in the saturation (lower limit)
54 .........Data error. Received data are not plausible
E
E 55 .........Measurement not possible of sensor not reachable
0
x53 (CHANNEL_UNDERRANGE)
0 … 20 mA
Normal operation mode 4.00 mA … 20.00 mA
Limit range 20.00 mA … 20.48 mA Displayed: 20.00mA
Overcurrent approx. > 20.48 mA 0x52 (CHANNEL_OVERRANGE)
Negative polarity approx. < -0.48 mA 0x53 (CHANNEL_UNDERRANGE)
Limit range -0.48 mA … 0.00 mA Displayed: 0.00mA
Normal operation mode 0.00 mA … 20.00 mA
Limit range 20.00 mA … 20.48 mA Displayed: 20.00mA
Overcurrent approx. > 20.48 mA 0x52 (CHANNEL_OVERRANGE)
EN
OPUS20E operating manual for external sensors
14
 Loading...