

Page 1
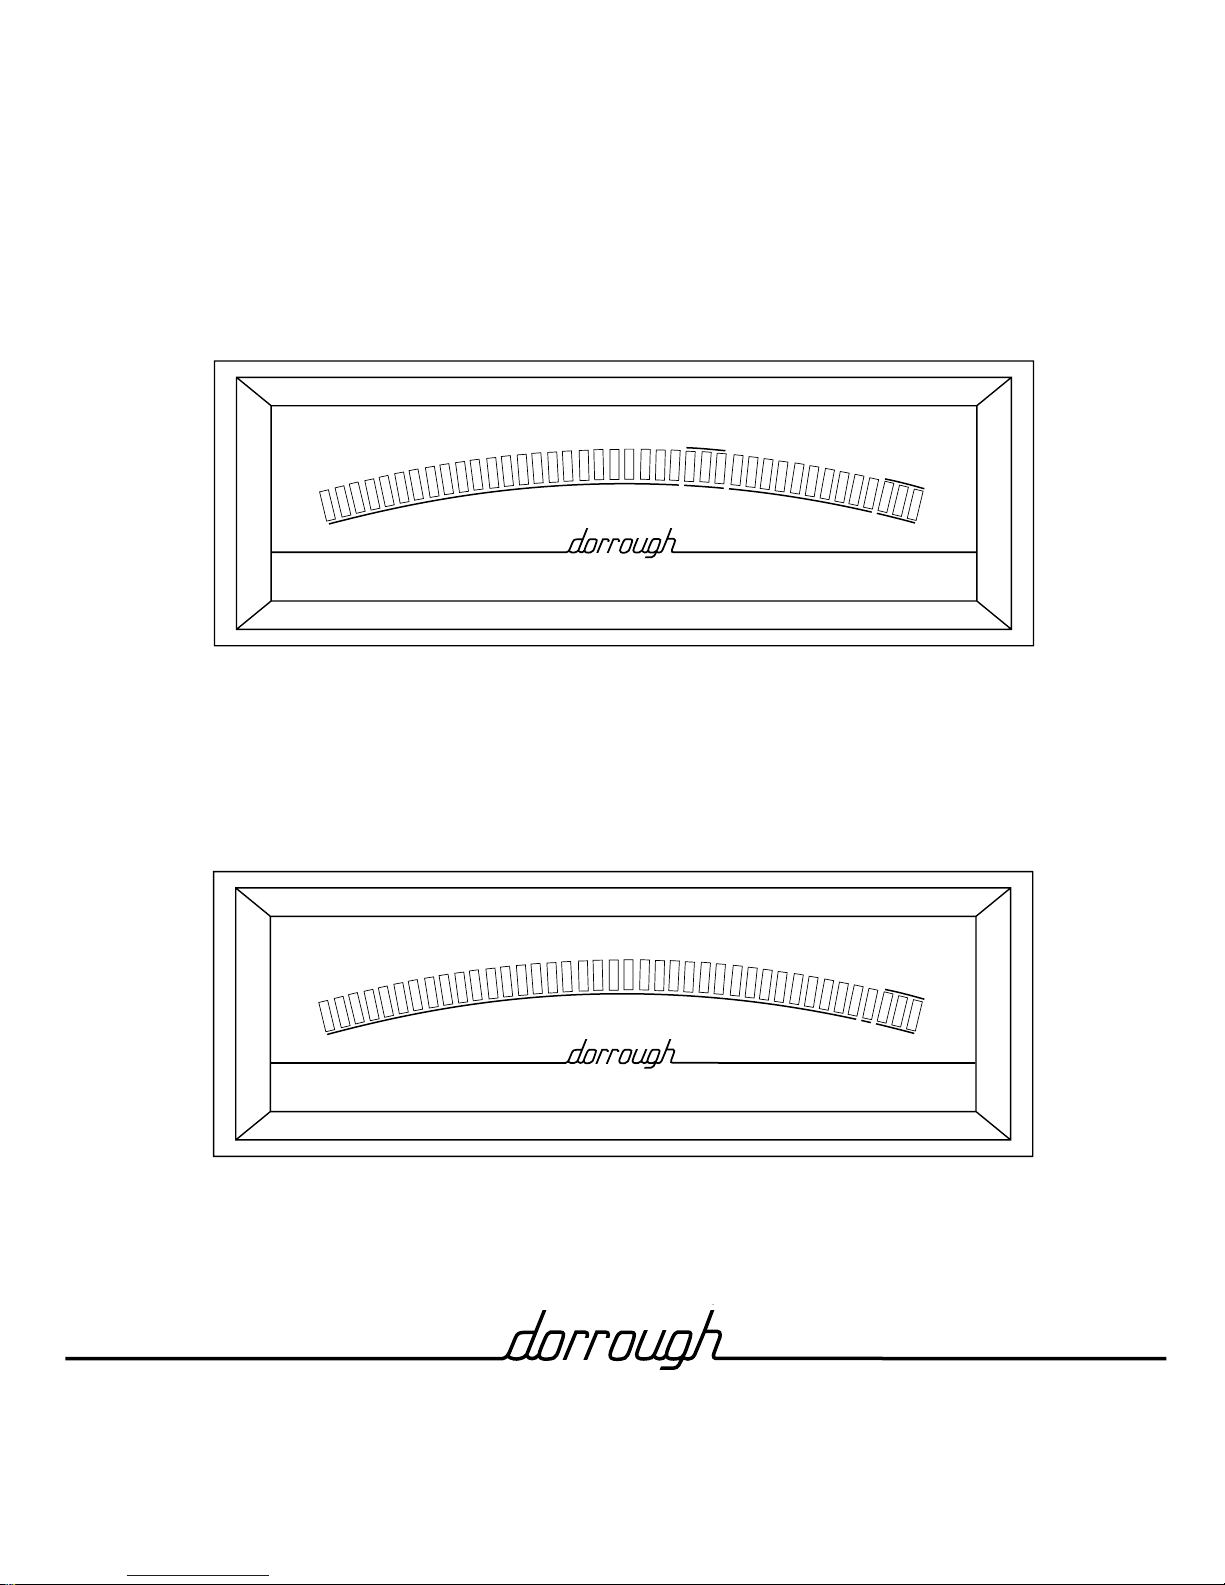
Technical Instruction Manual
DORROUGH
LOUDNESS MONITOR
Model 40-A
- 4
- 6
- 8
-10
-12
-14
-16
-18
-20
-22
-25
dB
NORMAL
PERSIS
TENCE
RANGE
- 2
0
+ 2
+ 4
+ 6
+ 8
+10
+12
NORMAL
PEAK
RANGE
+14
dB
LOUDNESS MONITOR
DORROUGH
RELATIVE LOUDNESS
TO PEAK MODULATION
Model 40-B
10
LATION
-30
5
4
-26
-28
% MODU
3.2
2.5
2
1.6
-32
-34
-36
dB
RELATIVE LOUDNESS TO PEAK MODULATION
6.3
-24
-22
8
-20
-18
MODEL 40-A
-10
% MODU
32
- 8
LATION
40
50
63
80
100
125
- 6
- 4
- 2
0
+1
+2
+3
dB
MODEL 40-B
16
12
-16
-14
20
25
-12
Also covers Models 10-A(B), 12-A(B), 20-A(B), and 21-A(B)
DORROUGH ELECTRONICS
5221 Collier Place
Woodland Hills, CA 91364
(818) 999-1132
Page 2

INTRODUCTION
Today’s audio requires careful attention to precise level control. The consumer now has audio playback systems that stretch the limits of program
dynamics. With all this new equipment, the modern listener is able to hear
subtle differences in level and distortion within program material and make
critical program choices based on the quality of sound.
Now it is more critical for the engineer to obtain the maximum loudness with
the minimum of distortion components in order to fully utilize the dynamic
range available. With the dynamic range that digital audio offers, and the
bandwidth now available to film and video productions, it has become of
paramount importance that there be a new method of monitoring and
establishing the maximum safe level at which a system can operate.
The Weston (VU) Meter
The American Standard...
80
100
60
40
-2
-1
-3
20
0
-20
VU
-5
+1
-7
-10
+2
+3
The European Standard...
4
3
2
1
5
6
7
The Weston meter, introduced in 1939, was the standard for level monitoring.
It met the then new standard for VU (Volume Unit) meters, and those same
specifications are still the standard for all VU meters in use today. VU
meters are really nothing more than voltmeters calibrated in power, and
their ballistics were chosen to represent program material of the early days of
radio and film.
A VU meter is classified as a quasi-average reading device. It almost completely ignores peak waveforms. With the somewhat arbitrarily chosen rise
time of 300 µs, engineers have developed certain compensations, such as
riding dialogue 3 to 5 dB below music, to control the peak levels in an
attempt to attain consistent listening levels. The standard broadcast practice
is to allow for a crest factor of at least 10 dB to cover the peak excursions of
the waveform that the VU meter is too slow to indicate.
The VU meter was never intended to provide acoustical comparisons between processed and unprocessed program material. Nor was it ever
intended to provide indications of peak excursions. Clearly, the VU meter
has some dramatic shortcomings with today’s dynamic program material .
The PPM Meter
The PPM (Program Peak Meter) meter is not quite as old as the VU meter,
being only about a forty-year-old standard, but like the old VU meter, the
original standards are still on the books today. The PPM meter was the first
answer to the obvious shortcomings of the VU meter, but, because it displays
and holds only the peak level of the waveforms, the integration time of
quasi-average program level is almost completely ignored.
The PPM also has a scale that does not relate directly to measured program
levels, but only indicates relative levels. The numbers are arbitrary and
could be just as well represented by fruit symbols or stick figures. Modern
technology has eliminated the need to stare at a narrow mechanical needle
oscillating in an analog motion to set level.
1
Page 3

Peak hold circuits have been suggested as a solution, but while holding a
peak reading, they ignore any information that occurs during the decay time.
An engineer must make an adjustment, then wait while the peak hold circuit
decays to get an indication of the new setting. Obviously this method cannot
be used because of the need to respond to program material in real time.
Most contemporary studios have tried to solve their metering problems by
using both VU and PPM meters on the same source in an attempt to get the
maximum usable level out of a piece of program material. This has led to
cramped and overly complex metering bridges and panels, and does not
overcome the limitations inherent in these systems. Even the switchable bar
graph meters offered as a solution by some console manufacturers suffer
from the same ballistic limitations.
Loudness Meter
A new standard...
8
LATION
6.3
5
% MODU
4
3.2
2.5
2
1.6
-34
-36
dB
RELATIVE LOUDNESS TO PEAK MODULATION
-22
-24
-26
-28
-30
-32
Years of hands-on experience and frustration with both VU and PPM metering led to the development of the DORROUGH Loudness Monitors.
10
-16
-18
-20
LATION
32
40
50
63
80
100
-14
-12
-10
125
- 8
- 6
- 4
- 2
0
+1
+2
+3
MODEL 40-B
% MODU
16
12
20
25
DORROUGH’s research has established the relationship between integration
time, RMS metering and the display of peak levels.
dB
The DORROUGH Loudness Monitor displays, in an easy-to-read format, the
actual energy content of the program material, regardless of frequency, while
still indicating the peak amplitude of the complex audio signal. It allows the
operator to ride levels in a manner such that all program material can be
adjusted for equal perceived loudness while protecting the peak of the
waveform. Now, one meter gives you more complete and more usable
information than any combination of peak hold, VU and PPM indicators.
The DORROUGH Loudness Monitor integrates on the same scale, two
ballistics, showing the relationship between the average and the peak. It
simultaneously displays peak and average, and the relative difference, in dB,
between these two ballistics is derived from the integration time of the
persistence scale.
The operator has only to adjust the level until either the peak or persistence
reference is reached. This will result in the maximum level, regardless of
program content. Material with or without compression can easily be
matched for the same listening level.
Each DORROUGH Loudness Monitor features Right and Left inputs for use
in stereo mixing applications. With one instrument, the operator can easily
see the stereo mix and avoid the classic in-phase/out-of-phase problem.
“Center channel build-up,” the addition of in-phase or monophonic material
which causes the mix to be perceived as louder, will appear as a sudden
increase in level. This is especially important in preparing stereo program
material for broadcast, while still being able to maintain monaural compatibility.
2
Page 4

INSTALLATION
To install your DORROUGH Loudness Monitor, perform the procedures
described in the following sections.
Unpacking
Your DORROUGH Loudness Monitor was carefully packed at the factory.
Take a moment to examine the unit for any signs of shipping damage. If
damage is evident, retain the carton and notify the transit carrier and your
local distributor about your claim.
Once you are satisfied with the physical integrity of the unit, proceed with
Initial Set-Up to align the meter to match your operating level requirements.
Initial Set-up
You can set the operating level either on the bench or at the installation
location. For set-up at the installation site, refer to the section on Mounting
Considerations prior to performing the following procedure.
1. Plug the AC cord into a convenient AC line and observe that the display
becomes backlit.
☛
☛
NOTE: If you do not see this action, make sure the AC line has power and the
Power Switch (recessed in the back panel) is in the ON (up) poasition, or test the
internal 0.25 A fuse for continuity.
2. While observing polarity, feed a 1000 Hz sine-wave at a standard operating level (i.e., -10, +4, +8, etc.) into the left input, as shown in Fig. 1.
3. Adjust the input level control (Fig. 1) on the rear panel for an indication
of “0” on the meter scale. This step applies to all models.
NOTE: The peak excursion and the persistence amplitude are equal under
steady state sine-wave conditions.
4. Next, remove the signal from the left channel and feed the signal in the
same polarity to the right input, making the same adjustment.
5. Following the adjustments for both the left and right inputs, feed the
signal to both inputs simultaneously. The summing amplifier will
algebraically add the two inputs for an indication of +6, as read on the
PEAK scale. This action applies only to an "A" Type meter; a "B" Type
meter would be "off scale" for the same summing condition.
Continued on Page 4...
3
Page 5

...Continued from Page 3
In actual practice, a "B" Type meter is generally used as a discrete
monitor to indicate either a left or right channel. However, for Sum and
Difference monitoring, repeat steps 3 and 4 (previous page), and adjust
each input level control for a -6 dB indication on the meter scale for an
individual channel. This action will result in a proper sum of "0" on the
"B" Type meter scale.
☛
ON
NOTE: Different amplitudes and phase angles between the left and right input
signals will produce different algebraic sums. This display is essential in
indicating center channel buildup in some program material and will aid an
operator in making the proper adjustment to program operating level. For mono
signals, use the suggested connections shown in Fig. 2.
PAT. PEND.
+- - +
LIN RIN
Meter Connections
DORROUGH ELECTRONICS USA
WOODLAND HILLS, CA 91364
LR
Recessed
Power Switch
AC Cord
Input Gain Controls
VR13 (L) and VR14 (R)
Fig. 1. Back panel of DORROUGH Loudness Monitor, Model 40-A or
Model 40-B.
Fig. 2. Meter connections for mono and stereo input signals.
For mono use, connect mono input signal to L+ and L- terminals
and turn R Input Gain Control to the full counterclockwise
position.
4
+Mono
Input
+- - +
Stereo L
Input
Stereo R
Input
Page 6
Mounting Considerations
The DORROUGH Loudness Monitor is available with or without a case, and
is manufactured in several versions to accommodate differing customer
needs. For example, "A" Type models are the standard Loudness Monitors,
while "B" Type models measure Relative Loudness to Peak Modulation (see
front cover).
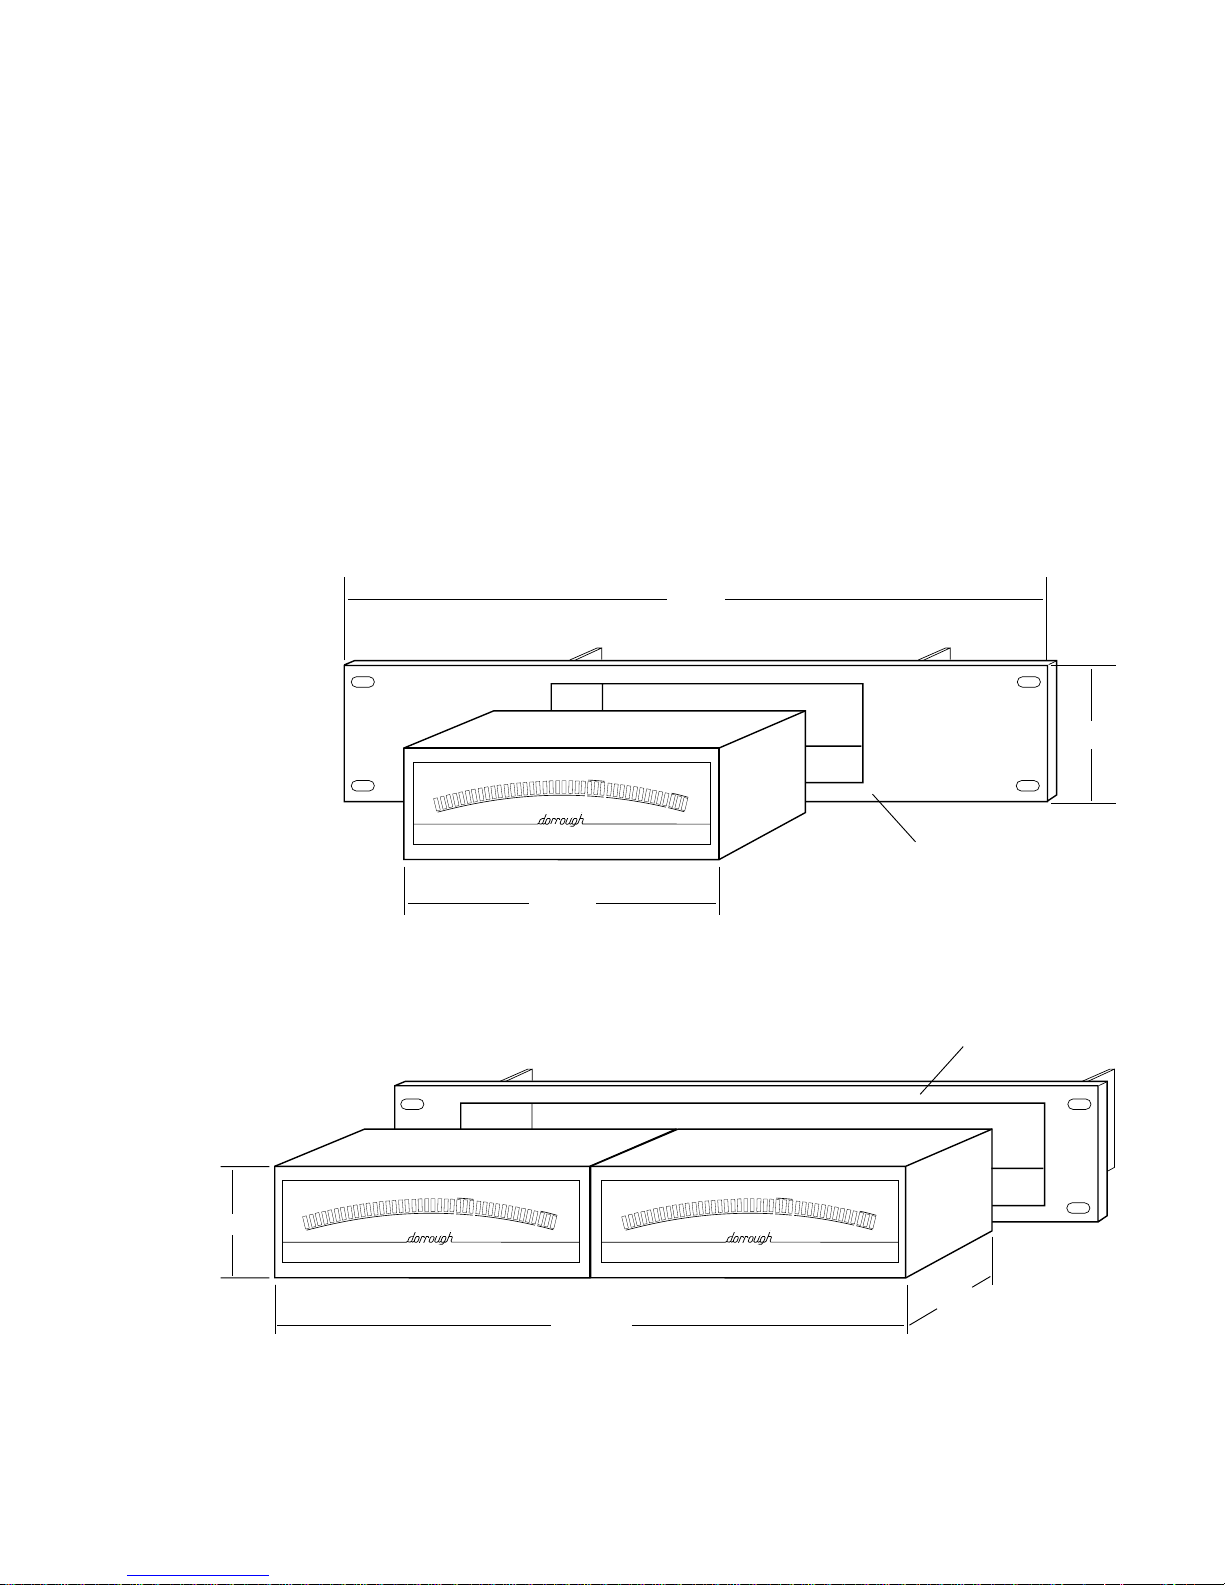
Fig. 3 and Fig. 4 show the physical specifications for mounting one or two
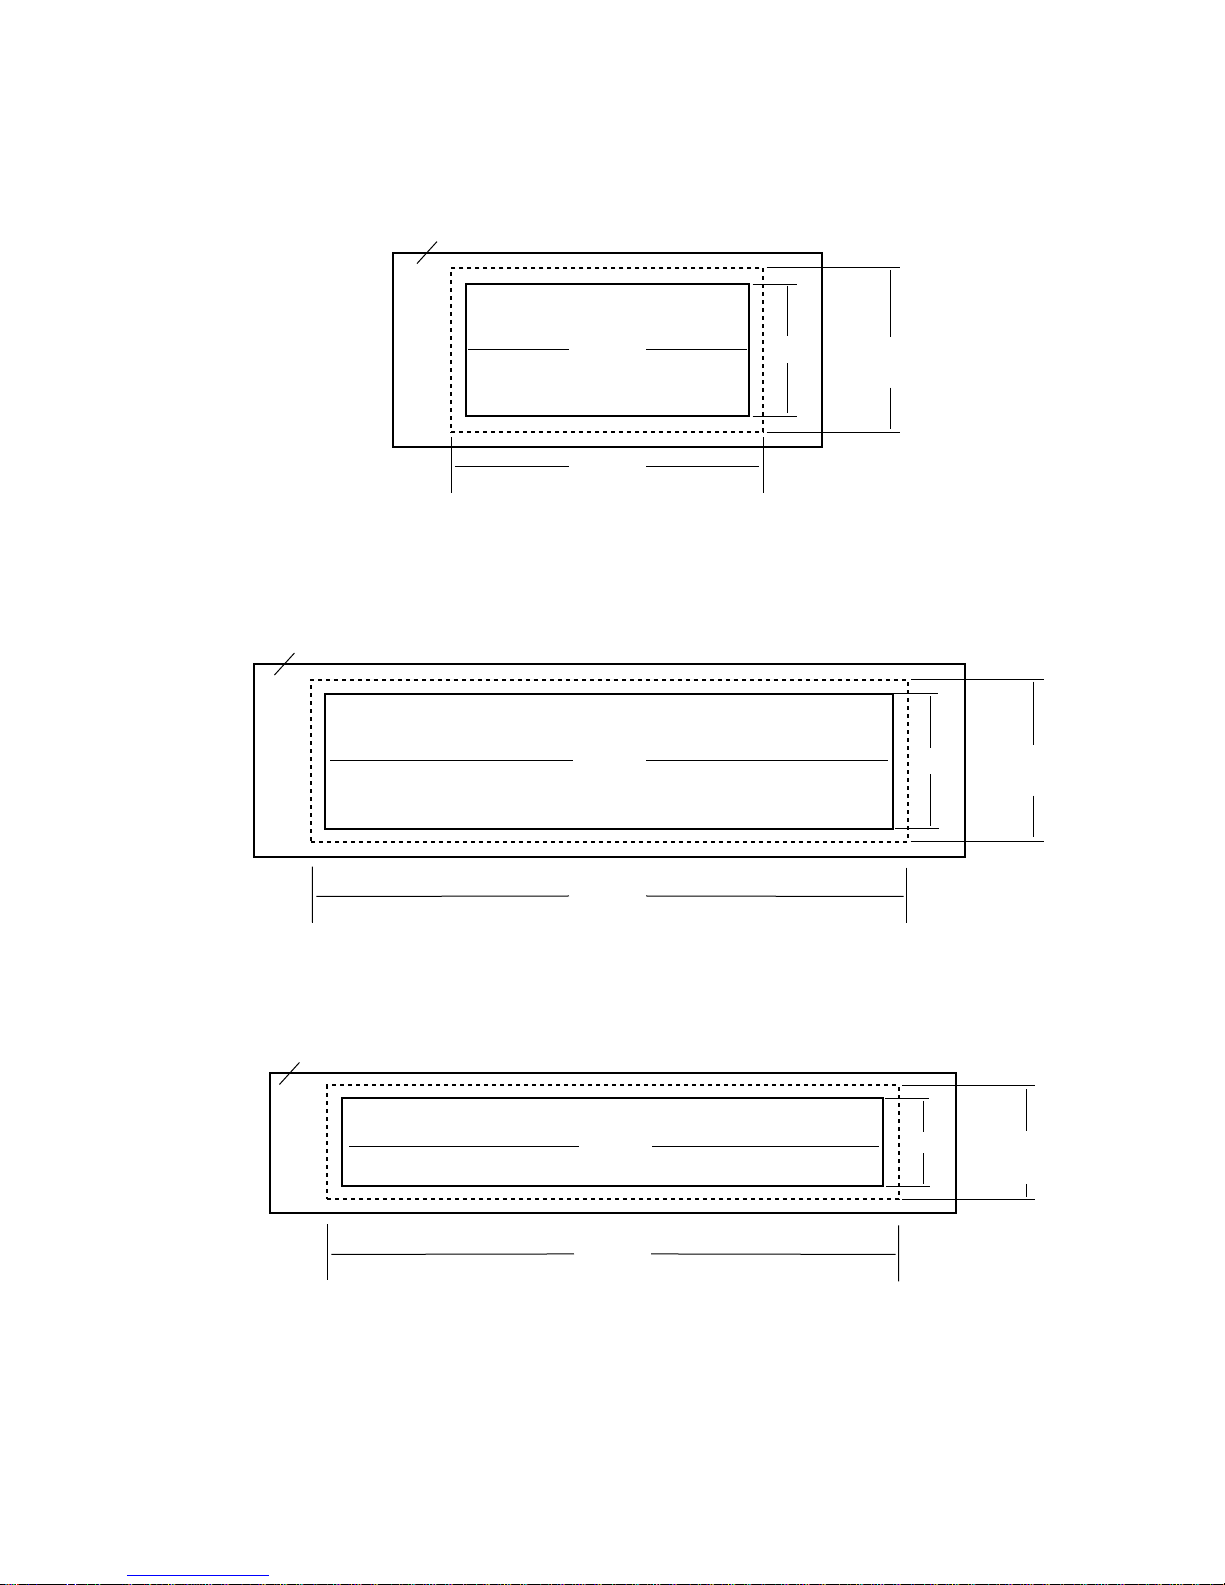
meters with their cases in a rack panel. Fig. 5 shows the physical mounting
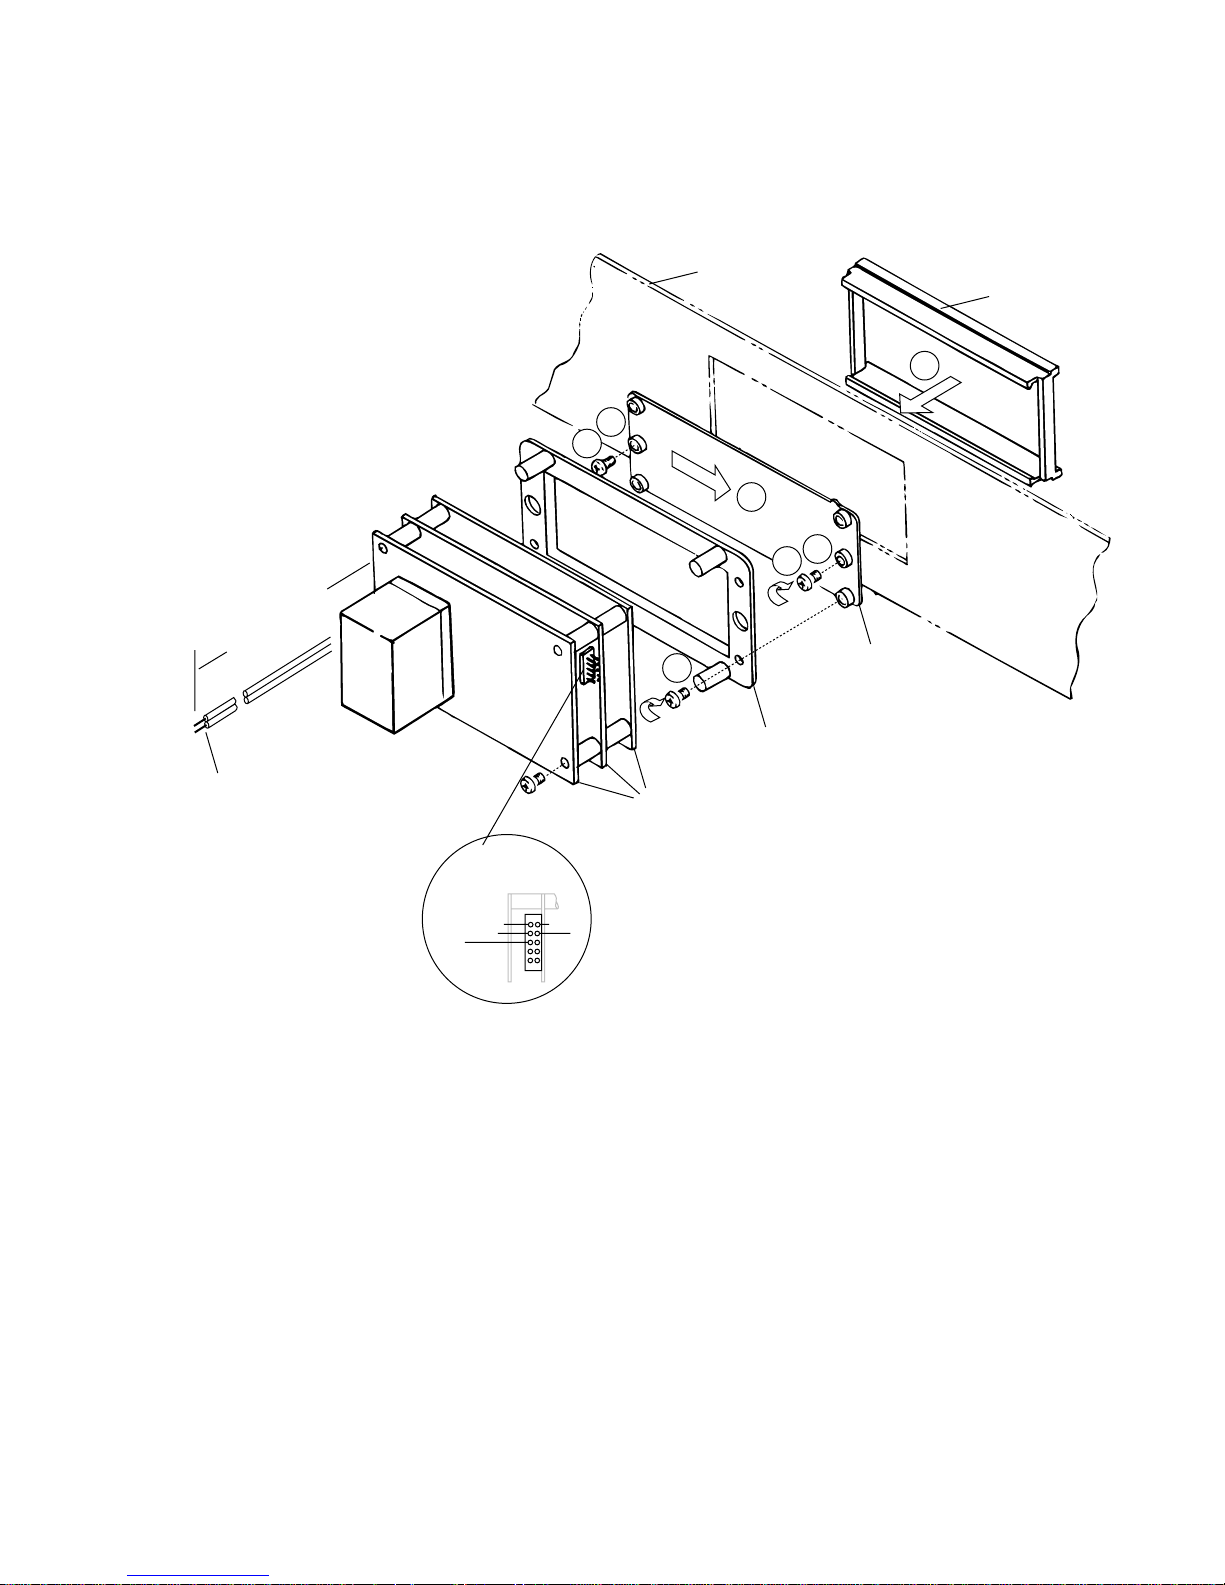
specifications for each panel mount model (no case), while Fig. 6 illustrates
the procedure for installing a panel mount meter.
19.00 "
3.50 "
- 4
- 6
- 2
- 8
-20
-22
-25
dB
NORMAL
LOUDNESS MONITOR
-10
-12
-14
-16
-18
RANGE
TENCE
PERSIS
0
+ 2
+ 4
+ 6
+ 8
+10
+12
NORMAL
+14
PEAK
dB
RANGE
MODEL 40-A
PANEL #40A-S
3.00 "
-20
-22
-25
dB
NORMAL
LOUDNESS MONITOR
8.125 "
Fig. 3. Physical specifications for mounting a single meter in a rack panel.
As an installation aid, an optional rack panel (40A-S) is available from the
factory. Meter slides in from the back and is fastened to the tray with two
4-40 x 3/4" screws.
PANEL #40A-D
- 4
- 6
- 2
- 8
-10
-12
-14
-16
-18
RANGE
TENCE
PERSIS
0
+ 2
NORMAL
+ 4
+ 6
+ 8
+10
+12
+14
PEAK
dB
RANGE
MODEL 40-A
-25
dB
LOUDNESS MONITOR
-14
-16
-18
-20
-22
TENCE
PERSIS
NORMAL
- 4
- 6
- 2
- 8
-10
-12
RANGE
0
+ 2
+ 4
+ 6
+ 8
+10
+12
NORMAL
+14
PEAK
dB
RANGE
MODEL 40-A
6.50 "
16.250 "
Fig. 4. Physical specifications for mounting two meters in a standard rack
panel. As an installation aid, an optional rack panel (40A-D) is available from
the factory. Meter slides in from the back and is fastened to the tray with
four 4-40 x 3/4" screws.
5
Page 7
CUSTOMER'S PANEL
MODEL 10-A(B) OPENING
(single console or panel mount meter)
(a) Model 10-A(B) panel mount specifications.
CUSTOMER'S PANEL
4.250 "
(5.5 " maximum depth)
(METER CLEARANCE BEHIND PANEL)
5.000 "
MODEL 12-A(B) OPENING
(dual console or panel mount meter)
8.562 "
(5.5 " maximum depth)
(METER CLEARANCE BEHIND PANEL)
8.750 "
2.00 " 2.50 "
(METER CLEARANCE
BEHIND PANEL)
2.00 " 2.50 "
(METER CLEARANCE
BEHIND PANEL)
(b) Model 12-A(B) panel mount specifications.
CUSTOMER'S PANEL
MODEL 20-A(B) OR 21-A(B) OPENING
(console or panel mount meter-straight lined LED's)
7.900 "
(5.5 " maximum depth)
(METER CLEARANCE BEHIND PANEL)
8.560 "
1.30 "
1.75 "
(METER CLEARANCE
BEHIND PANEL)
(c) Model 20-A(B) or Model 21-A(B) panel mount specifications. Model 21A(B) is a vertical panel mount meter.
Fig. 5. Physical specifications for several panel mount models.
6
Page 8
CUSTOMER'S
PANEL
BEZEL
2
4
1
3
4
1
12" LEAD PAIR
to 110 VAC
+R
AUDIO
INPUTS
+L
GND
5
WINDOW
PCB MOUNT
METER
ELECTRONICS
-L
+R
1. Install "jacking screws" into WINDOW so
that tip of each screw is flush with far side of
WINDOW.
2. Insert BEZEL through panel and hold in
place by hand.
3. Slide WINDOW into BEZEL.
4. Center the WINDOW and turn the "jacking
screws" clockwise, until BEZEL is pulled
snug against the panel.
5. Secure the PCB mount to the WINDOW at
outboard holes with four screws.
Fig. 6. Installation procedure for mounting a panel mount meter. Follow the
listed steps while referring to the guide numbers in the illustration.
7
Page 9
OPERATION & APPLICATIONS
Operation
Stereophonic material, in the form of left and right inputs, is fed to the meter
at the terminal strip located in the rear of the meter, as shown in Fig. 1.
Individual gain controls for the left and right inputs are also located on the
rear panel.
These sources feed a 20K balanced bridging amplifier. Unbalanced 10K
bridging input is accomplished by converting the minus (-) input terminal to
chassis ground on the rear terminal strip.
The meter is shipped with each individual input control set for +4 dB as
referenced to “0” on the meter face. Levels as low as -30 dB can be referenced to “0” by changing the value of R-18 from 20K to 100K. Refer to Fig.
15 and Fig. 16 for the location of this component on the Power and Signal
Board.
If your program reference is different than that of +4 dB, simple adjustments
to some other standard can be made by the following the procedure listed in
the Field Alignment section.
Applications
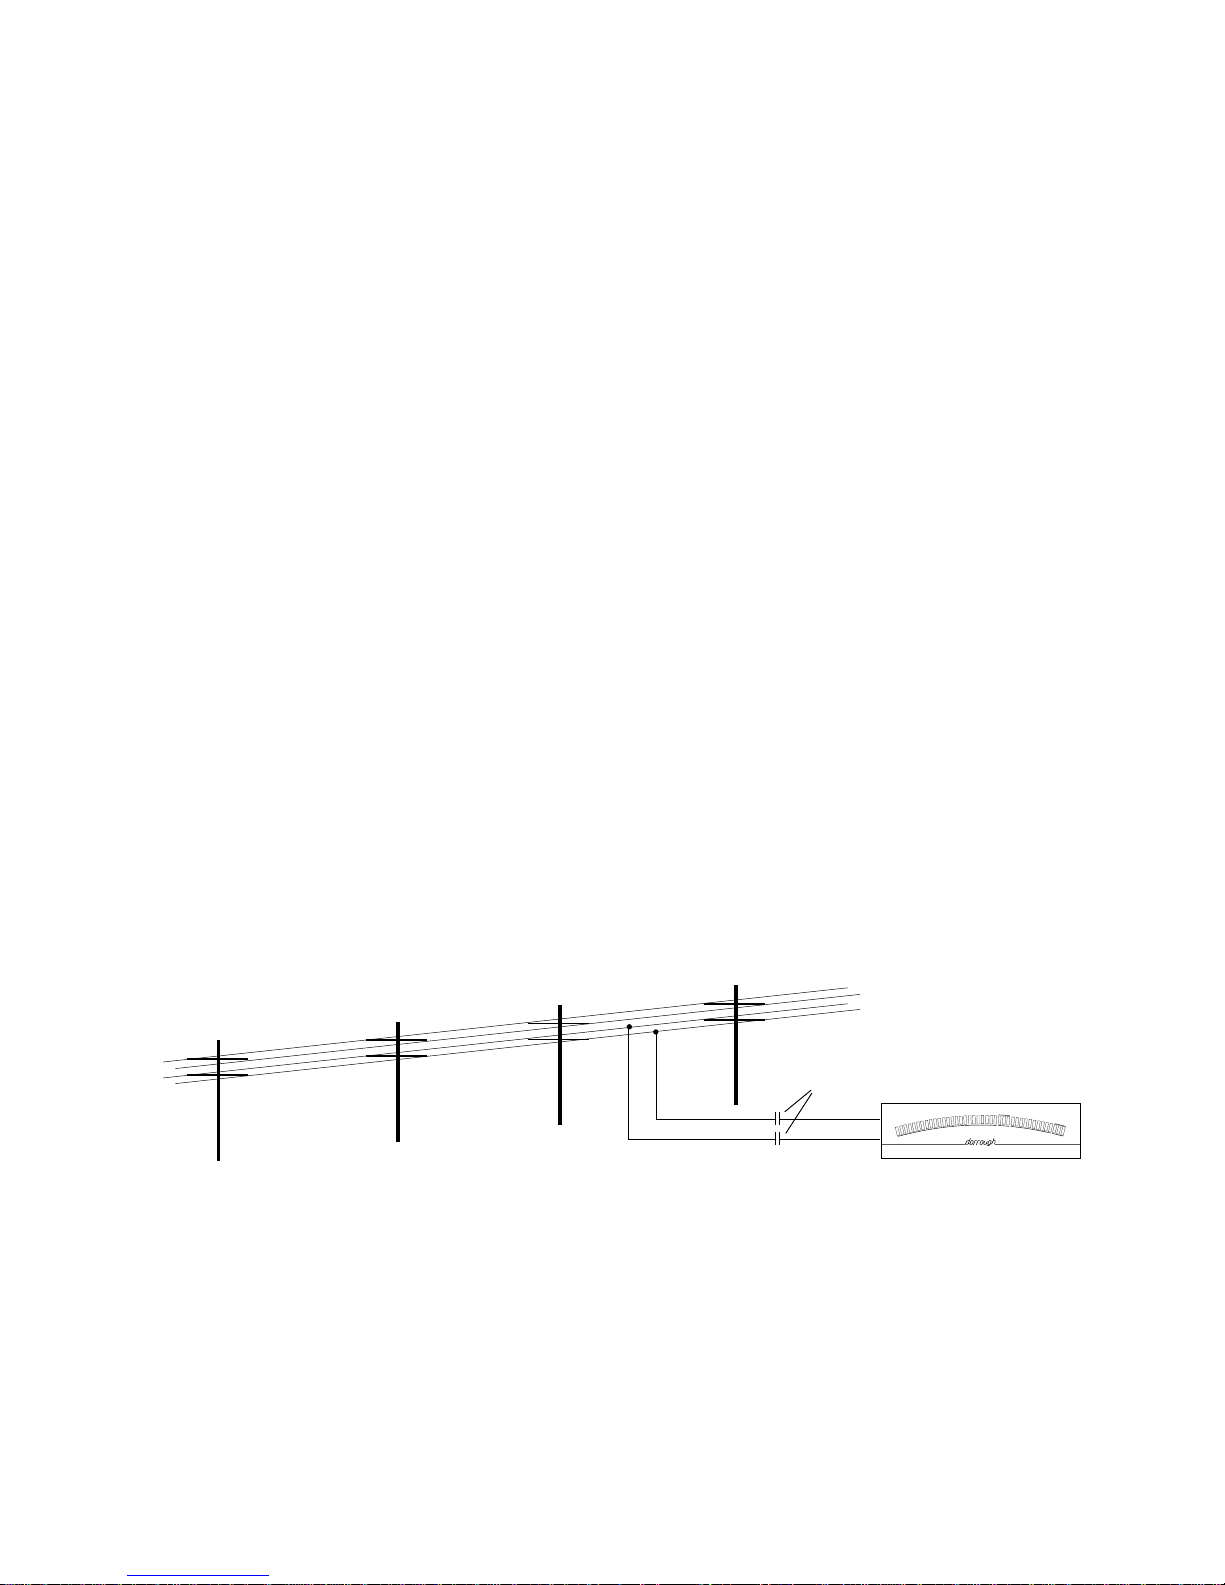
DORROUGH Loudness Monitors can be used in a number of applications, as
shown in Fig. 7 through Fig. 13, including: Telephone/Transmission, AM
Mono Broadcast, Analog/Digital Tape Saturation Monitor, Sum & Difference
Monitor, Stereo Television Broadcast, Disk Mastering, and Sound Reinforcement.
ISOLATION CAPACITORS
- 4
- 6
- 2
- 8
0
-10
-12
-14
-16
-18
-20
-22
-25
TENCE
PERSIS
dB
NORMAL
LOUDNESS MONITOR
Fig. 7. Telephone and/or Transmission Applications. The DORROUGH
Loudness Monitor ("A" Type or "B" Type) can be utilized to monitor power
line condition or telephone line signal, as shown in the above line drawing.
Make sure that some form of isolation, either transformers or capacitors, is
used in this application.
+ 2
+ 4
+ 6
+ 8
+10
+12
RANGE
+14
NORMAL
PEAK
RANGE
MODEL 40-A
dB
8
Page 10
STL
+
SUM
DIFF
STEREO FEED
R
L
+
-
+
-
-R +-L
LOUDNESS MONITOR
MODEL 40-A
-25
-22
-20
-18
-16
-14
-12
-10
- 8
- 6
- 4
- 2
0
+ 2
+ 4
+ 6
+ 8
+10
+12
+14
NORMAL
PEAK
RANGE
NORMAL
RANGE
PERSIS
TENCE
dB
dB
AUDIO FEED
FROM CONSOLE
POST
PRE
+-
+
-
+
-
LOUDNESS MONITOR
MODEL 40-A
-25
-22
-20
-18
-16
-14
-12
-10
- 8
- 6
- 4
- 2
0
+ 2
+ 4
+ 6
+ 8
+10
+12
+14
NORMAL
PEAK
RANGE
NORMAL
RANGE
PERSIS
TENCE
dB
dB
- 4
- 6
- 2
- 8
0
-10
-22
-25
dB
LOUDNESS MONITOR
-12
-14
-16
-18
-20
TENCE
PERSIS
NORMAL
+ 2
+ 4
+ 6
+ 8
+10
+12
RANGE
+14
NORMAL
PEAK
dB
RANGE
MODEL 40-A
TRANSMITTER
"A" TYPE
% MODU
16
12
20
10
25
1.6
-36
dB
RELATIVE LOUDNESS TO PEAK MODULATION
-22
-24
-26
-28
-30
-32
-34
8
LATION
6.3
5
% MODU
4
3.2
2.5
2
-18
-20
LATION
32
40
50
63
80
100
-16
-14
-12
125
-10
- 8
- 6
- 4
- 2
0
+1
+2
+3
dB
MODEL 40-B
MODULATION
MONITOR
"B" TYPE
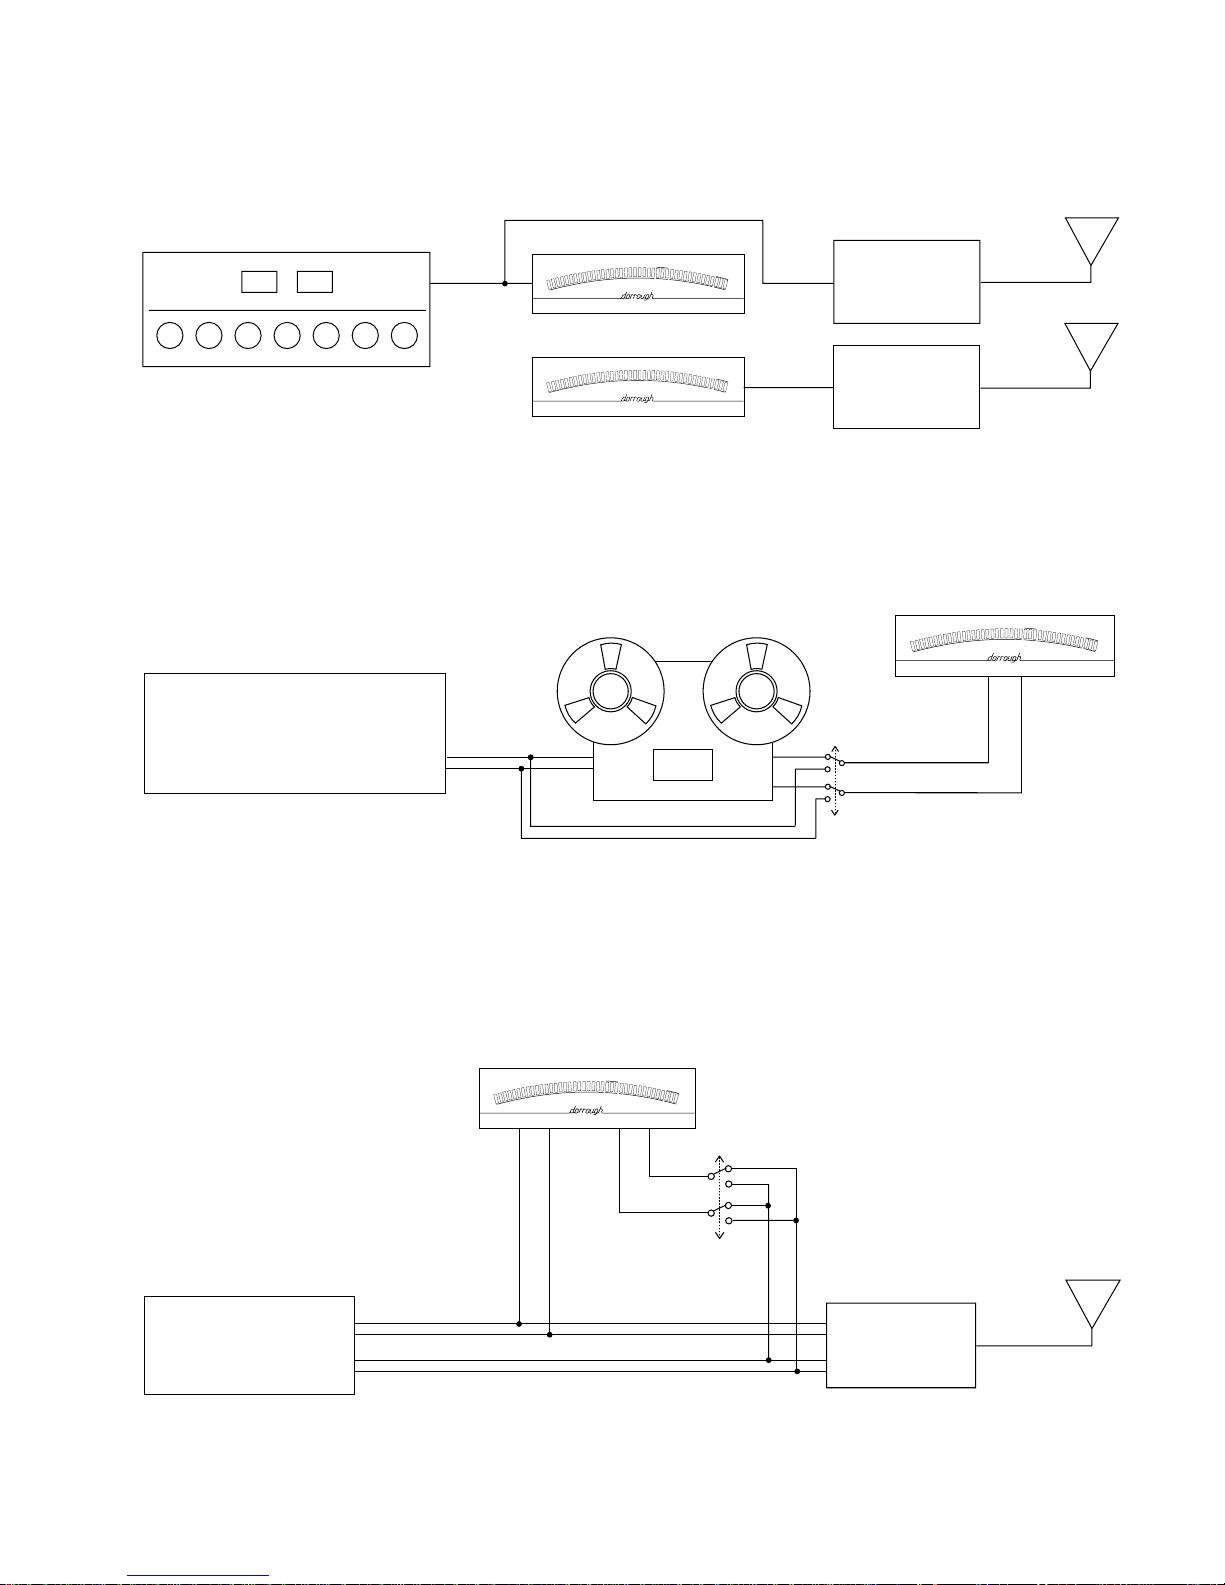
Fig. 8. Broadcast Monaural Applications. This line drawing shows a typical
broadcast application. Most stations use an "A" Type DORROUGH
Loudness Monitor to monitor the "unprocessed" Transmitter signal and
either an "A" or B" Type DORROUGH Loudness Monitor to verify the Off-Air
signals in real time. The "B" Type Monitor is the preferred instrument for
verifying peak headroom.
Fig. 9. Analog/Digital Tape Saturation Monitor. This interconnect drawing
shows an example of monitoring tape saturation by comparing pre- and posttape signal levels. Once saturation is reached, the post-tape readings will no
longer track increases in pre-tape signal levels. NOTE: This example
assumes the tape deck is aligned for unity gain. Although a "B" Type
DORROUGH Loudness Monitor is preferred, an "A" Type is acceptable.
Fig. 10. Sum and Difference Monitor (1 Meter). This interconnect drawing
shows a Sum and Difference Monitor setup by utilizing a single "A" or "B"
Type DORROUGH Loudess Monitor.
9
Page 11
STEREO FEED
SUM DIFFERENCE
-22
-25
dB
LOUDNESS MONITOR
+
- 4
- 6
- 2
- 8
0
-10
-12
-14
-16
-18
-20
TENCE
PERSIS
NORMAL
+ 2
+ 4
+ 6
+ 8
+10
+12
RANGE
+14
NORMAL
PEAK
dB
RANGE
MODEL 40-A
-22
-25
dB
LOUDNESS MONITOR
-20
NORMAL
-R+-L + -R +-L
-18
- 4
- 6
- 2
- 8
0
-10
-12
-14
-16
TENCE
PERSIS
+ 2
+ 4
+ 6
+ 8
+10
+12
RANGE
+14
NORMAL
PEAK
dB
RANGE
MODEL 40-A
+
-
R
+
L
-
STL
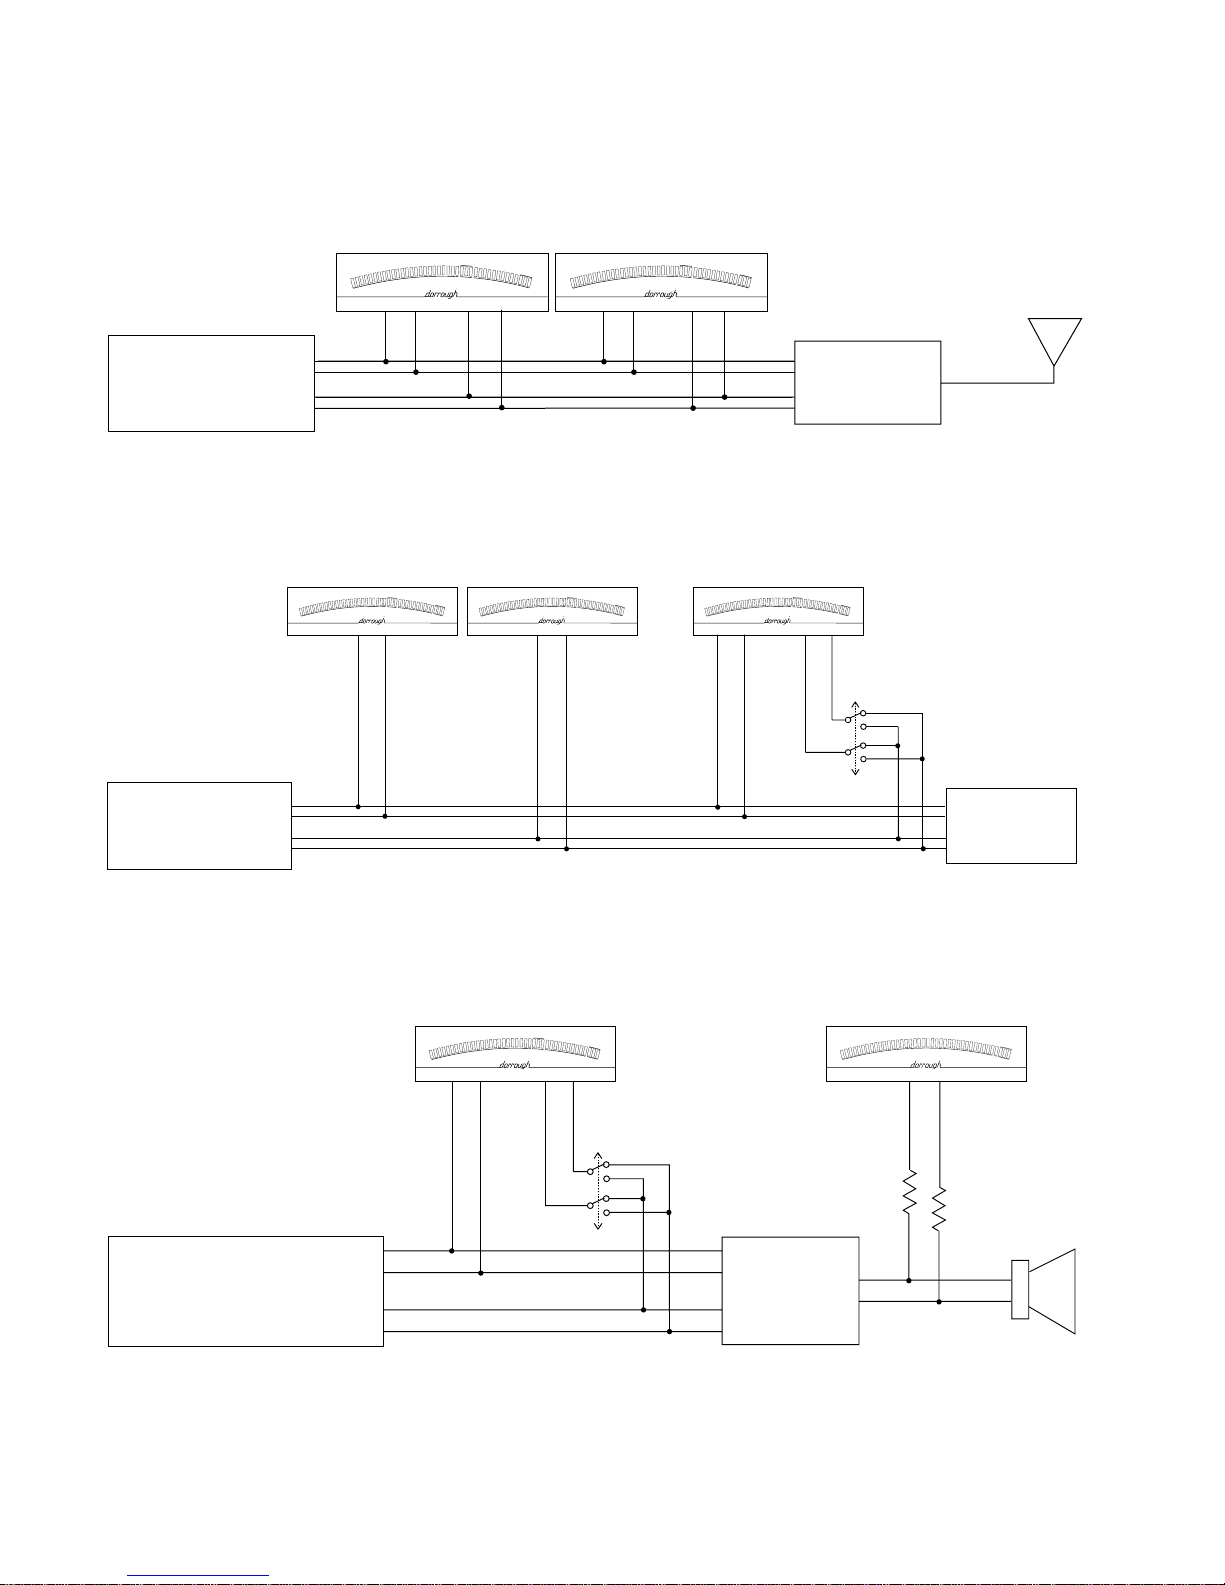
Fig. 11. Sum and Difference Monitors (2 Meters). This interconnect drawing
shows a Sum and Difference Monitor setup by utilizing two "A" or "B" Type
DORROUGH Loudess Monitors. In this application, Sum and Difference
signals can be monitored in real time.
STEREO FEED
R
L
-22
-25
dB
LOUDNESS MONITOR
+
-
+
-
-18
-20
NORMAL
RIGHT
-12
-14
-16
RANGE
TENCE
PERSIS
+
- 4
- 6
- 2
- 8
0
-10
+ 2 + 4
+ 6
+ 8
+10
+12
+14
NORMAL
PEAK
dB
RANGE
MODEL 40-A
-
-22
-25
dB
LOUDNESS MONITOR
-20
NORMAL
LEFT
- 4
- 6
- 8
-10
-12
-14
-16
-18
RANGE
TENCE
PERSIS
+-
- 4
- 2
0
+ 2 + 4
+ 6
+ 8
+10
+12
+14
NORMAL
PEAK
dB
RANGE
MODEL 40-A
-22
-25
dB
LOUDNESS MONITOR
- 6
- 2
- 8
0
-10
+ 2 + 4
-12
-14
-16
-18
-20
RANGE
TENCE
PERSIS
NORMAL
+ 6
+ 8
+10
+12
+14
NORMAL
PEAK
dB
RANGE
MODEL 40-A
+ -R +-L
SUM
DIFF
STL OR
CUTTING
SYSTEM
Fig. 12. Broadcast Stereo or Disk Mastering Applications. This interconnect
drawing shows a typical setup for monitoring stereo signals in real time. In
addition, a selectable Sum or Difference Monitor allows the operator to check
the critical phase integrity of the monitored signals. Use either "A" Type or
"B" Type DORROUGH Loudness Monitors.
-25
dB
LOUDNESS MONITOR
RANGE
TENCE
PERSIS
NORMAL
- 6
- 8
-10
-12
-14
-16
-18
-20
-22
+ -R +-L
- 4
- 2
0
+ 2
+ 4
+ 6
+ 8
+10
+12
+14
NORMAL
PEAK
dB
RANGE
MODEL 40-A
1.6
-36
dB
RELATIVE LOUDNESS TO PEAK MODULATION
8
LATION
6.3
5
% MODU
4
3.2
2.5
2
-22
-24
-26
-28
-30
-32
-34
+-
SUM
% MODU
16
12
20
10
25
LATION
32
40
50
63
-16
-18
-20
80
-14
-12
-10
- 8
- 6
- 4
- 2
100
0
+1
+2
MODEL 40-B
125
+3
dB
+
AUDIO FEEDS
FROM CONSOLE
+
-
Fig. 13. Sound Reinforcement Applications. An "A" Type DORROUGH
Loudness Monitor can be utilized to verify phase integrity of signal pairs
feeding a bank of power amplifiers. In addition, a "B" Type DORROUGH
Loudness Monitor can be used (with bridging resistors) to monitor the
outputs for any power amplifier failure.
10
DIFF
POWER
AMPLIFIERS
+
-
Page 12
CIRCUIT THEORY
The circuits that make up the DORROUGH Loudness Monitor (and Relative
Loudness to Peak Modulation meter) are grouped onto two circuit boards:
an Input Signal Processing Board (including Power Supply), and a Bar and
Peak Driver Circuit Board.
LEFT
RIGHT
DIFFERENTIAL
AMPLIFIER
DIFFERENTIAL
AMPLIFIER
☛
SUMMING
AMPLIFIER
NOTE: On Panel Type Meters, the Power Supply is a separate circuit board.
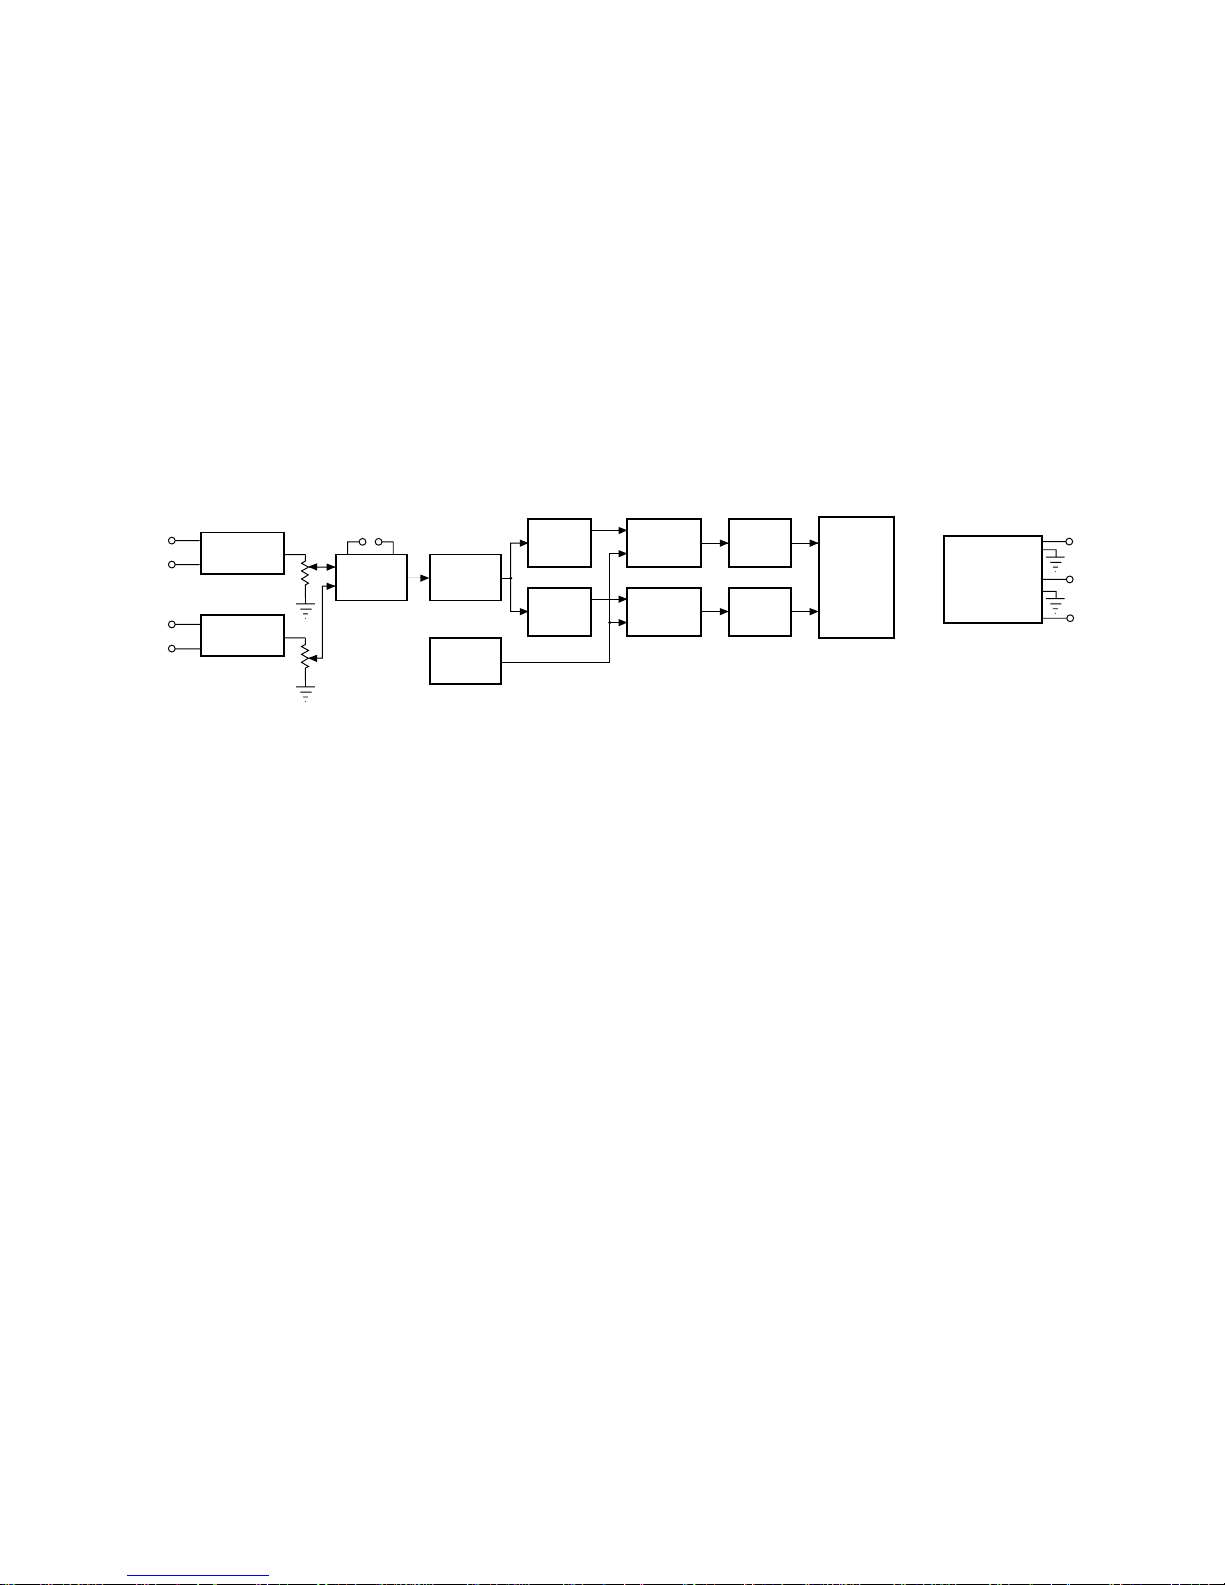
A block diagram, shown in Fig. 14, discloses the circuit elements and connections in a simplified form. Refer to this diagram, as well as the circuit
schematics (back of manual), throughout the following discussion.
PRECISION
RECTIFIER
REFERENCE
GENERATOR
PEAK
DETECTOR
AND HOLD
LIMITER
FILTER
LINEAR
LOGARITHMIC
CONVERTOR
LINEAR
LOGARITHMIC
CONVERTOR
DOT
LED
DRIVER
BAR
GRAPH
LED
DRIVER
LED
ARRAY
POWER
SUPPLY
+V LED
+V
-V
Fig. 14. Block Diagram of DORROUGH Loudness Monitor.
The input is fed into the left and right differential amplifiers. The differential
inputs are configured so that the input impedance is 20K for balanced inputs
and 10K for unbalanced inputs (negative terminal is grounded for unbalanced operation).
The left input level is controlled by R-13 and the right input by R-14. The
output of these two controls are fed to a summing amplifier. The feedback
resistor R-18 controls the input sensitivity of the instrument. As shipped,
the value of R-18 is 20K, which provides an input sensitivity of -18 dB.
Changing the value of R-18 to 100K increases the sensitivity to -30 dB.
The output of the summing amplifier feeds a precision rectifier. The output
of the precision rectifier feeds a split to the PEAK and PERSISTENCE circuits.
Since the desired display is to be logarithmic, the signals are fed to corresponding “linear/logarithmic” converters. The outputs of these converters
feed the display drivers. The driver for the PEAK display is configured as a
dot, while the driver for the PERSISTENCE display is configured as a
bargraph.
Each of the 40 LEDs derives an input from both of the drivers (only on all "A"
Type Monitors), with the exception of the red LEDs designated as -1, 0,+1.
These particular LEDs have no input from the dot driver, and therefore do
not display PEAK information. This provision was made to eliminate
possible confusion relative to PEAK and PERSISTENCE amplitudes at this
reference. With the exception of these LEDs, a steady state sine-wave will
illuminate a bargraph at a given amplitude, with the last displayed LED
brighter than the remainder. This gives indication that the amplitude of the
PERSISTENCE and the amplitude of the PEAK are equal, showing proper
alignment of the instrument.
11
Page 13

FIELD ALIGNMENT
To occasionally check the accuracy of your DORROUGH Loudness Monitor,
perform the Field Alignment listed in this section. Although the meter is
designed for exceptionally stable performance, you may want to satisfy your
curiosity or verify performance after a change has been made.
All adjustments for the alignment of the LED display are located on the
Input Signal Processing Board. To gain access to these controls (40-A and
40-B Models), the instrument is placed bottom-side-up and the six screws are
removed. Once the screws are removed, place the unit right-side-up and the
cabinet can be lifted from the remainder of the chassis, exposing the adjustments. Refer to Fig. 15 for circuit board part locations as you perform the
following instructions. Use Fig. 16, Fig. 17, and Fig. 18, for Panel Type
Models 10-A(B), 12-A(B), 20-A(B), and 21-A(B).
"A" Type Monitor Alignment Procedure
1. Connect the output from a test oscillator to the meter’s left input terminals (see Fig. 1 ).
2. Feed a 1000 Hz sine-wave, at a reference level of “0” dB, into the meter.
3. Adjust the left input gain control VR-13 so that DS-1 is off and DS-2, -3, -4
are on.
☛
☛
4. Adjust the input signal to -25 dB.
5. Adjust the low PERSISTENCE level control VR-44 so only the first LED
(-25 dB on meter scale) at the bottom of the PERSISTENCE scale is
illuminated.
6. Adjust the low PEAK level control VR-46 so only the first LED (-25 dB on
meter scale) at the bottom of the PERSISTENCE scale brightens.
NOTE: This indicates that both the PEAK and the PERSISTENCE drivers are
providing current to this LED.
7. Change the input signal to +5 dB (a 30 dB increase).
8. Adjust the high PERSISTENCE level control VR-48 so that the bargraph
illuminates LEDs up to and including the +5 dB LED.
9. Adjust the high PEAK level control VR-49 so that the +5 dB LED brightens.
NOTE: This indicates that both the PEAK and the PERSISTENCE drivers are
both providing current to this LED.
10. Increase input signal to +14 dB and observe that the +14 dB LED illuminates.
☛
12
NOTE: The +14 dB LED should indicate drive from both PEAK and PERSISTENCE drivers.
Page 14

11. Decrease input signal to +13 dB ; observe that the +14 dB LED turns off.
12. Decrease input signal to +4 dB and adjust VR-13 for 0 dB on the scale.
13. Then, feed input signal of +4 dB to right input terminals, and adjust
VR-14 for 0 dB on the scale. This duplicates the factory settings.
14. After both channels have been aligned, follow the procedure for setting-
up the operating level as described in the Initial Set-Up section (see
Installation).
Once you have completed this procedure, re-assemble the meter and place
the unit back in service.
VR14 VR13
-25 dB (A)
R18
VR44 VR48 VR49 VR46
POWER & SIGNAL BOARD
DS2 DS3DS1
DS4
0 dB (A)
+5 dB (A)
+14 dB (A)
-36 dB (B)
-11 dB (B) -6 dB (B)
+3 dB (B)
LED DRIVER BOARD
Fig. 15. Simplified view of key alignment components on Model 40-A (40-B)
circuit boards.
13
Page 15

"B" Type Monitor Alignment Procedure
1. Connect the output from a test oscillator to the meter’s left input terminals (see Fig. 1 ).
2. Feed a 1000 Hz sine-wave, at a reference level of “0” dB, into the meter.
3. Adjust the left input gain control VR-13 so that DS-1 is off and DS-2, -3, -4
are on.
4. Adjust the input signal to -25 dB.
5. Adjust the low PERSISTENCE level control VR-44 so only the first LED
(-36 dB on meter scale) at the bottom of the PERSISTENCE scale is
illuminated.
6. Adjust the low PEAK level control VR-46 so only the first LED (-36 dB on
meter scale) at the bottom of the PERSISTENCE scale brightens.
☛
☛
☛
NOTE: This indicates that both the PEAK and the PERSISTENCE drivers are
providing current to this LED.
7. Change the input signal to +5 dB (a 30 dB increase).
8. Adjust the high PERSISTENCE level control VR-48 so that the bargraph
illuminates LEDs up to and including the -6 dB LED.
9. Adjust the high PEAK level control VR-49 until the -6 dB LED brightens.
NOTE: This indicates that both the PEAK and the PERSISTENCE drivers are
both providing current to this LED.
10. Increase input signal to +14 dB and observe that the +3 dB LED illuminates.
NOTE: The +3dB LED should indicate drive from both PEAK and PERSISTENCE drivers.
11. Decrease input signal to +13 dB ; observe that the +3 dB LED turns off.
12. Decrease input signal to +4 dB and adjust VR-13 for -11 dB onthe scale.
13. Then, feed input signal of +4 dB to right input terminals, and adjust
VR-14 for -11 dB on the scale. This duplicates the factory settings.
14. After both channels have been aligned, follow the procedure for setting-
Once you have completed this procedure, re-assemble the meter and place
the unit back in service.
14
up the operating level as described in the Initial Set-Up section (see
Installation).
Page 16
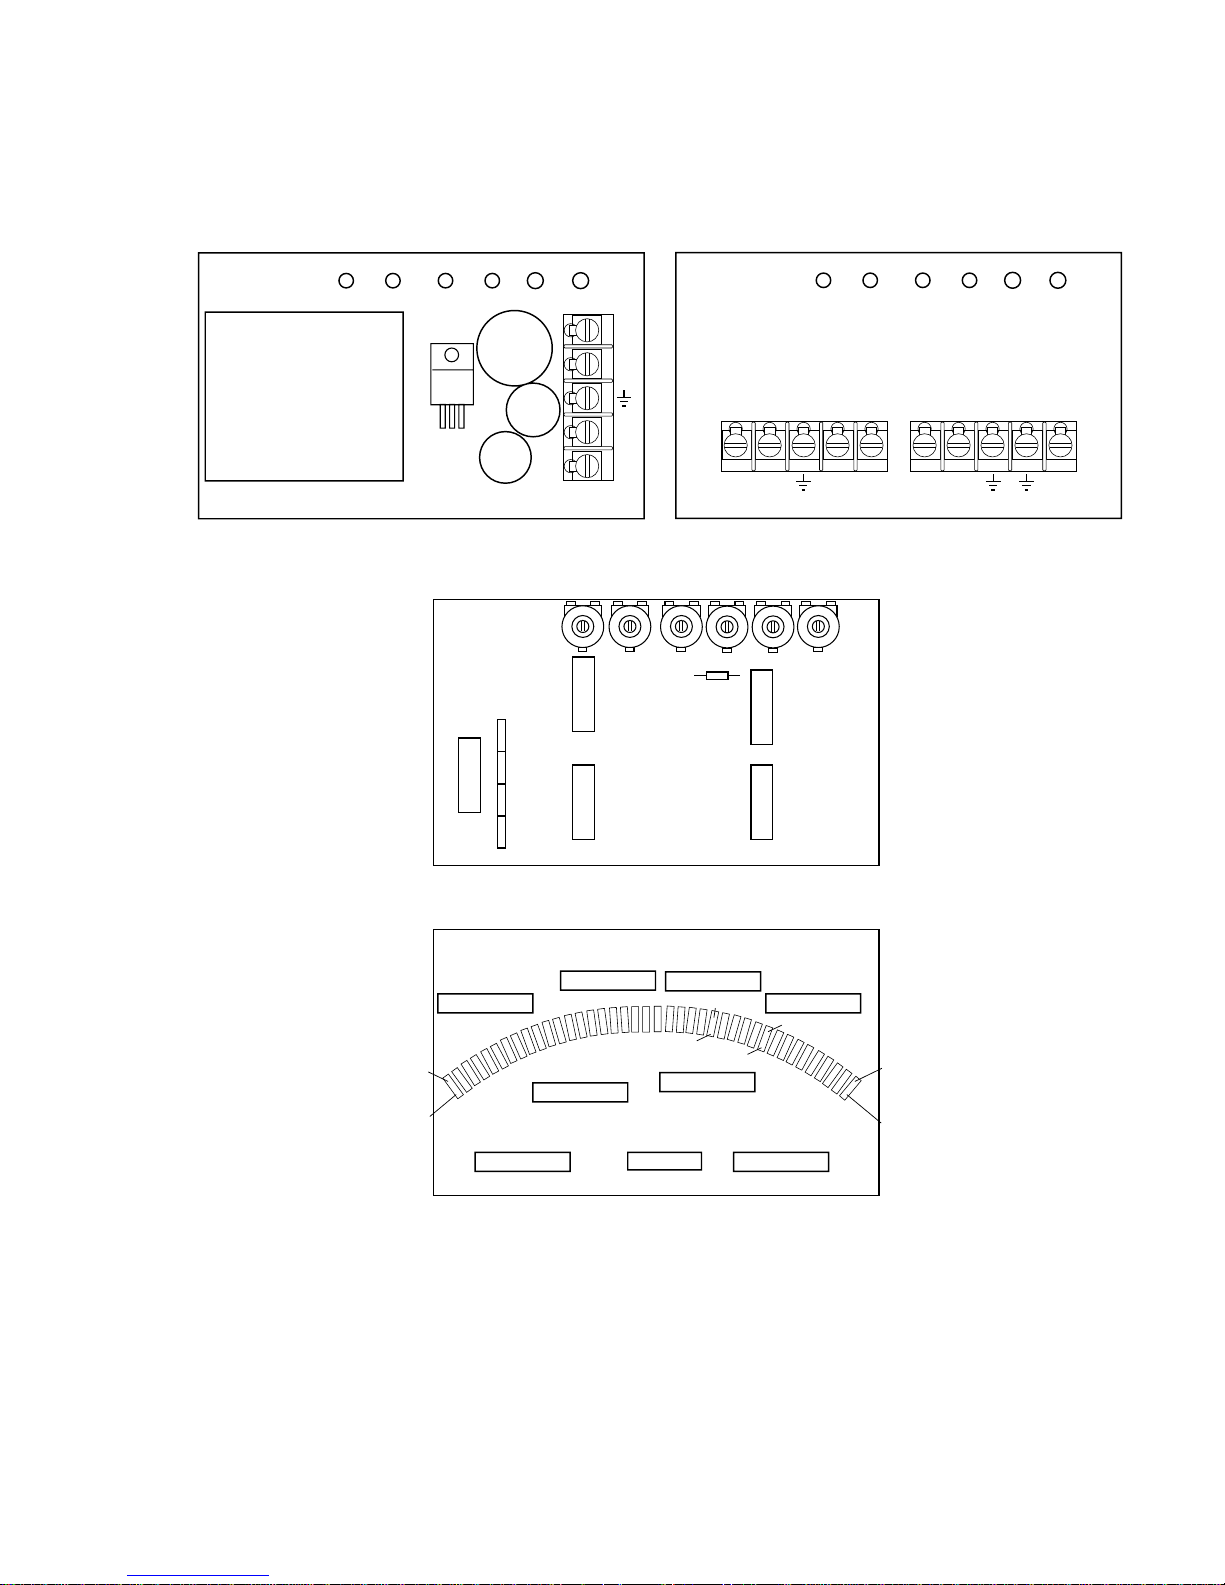
VR49 VR48 VR44 VR46 VR14 VR13
RL
VR49 VR48 VR44 VR46 VR14 VR13
RL
L+
L-
R+
R-
+L -L +R -R -15 +15 +5
POWER SUPPLY BOARD
- 25 dB (A)
INTERFACE BOARD (CUSTOMER'S POWER SUPPLY)
VR49 VR48 VR44 VR46 VR14 VR13
R18
DS1
DS2
DS3
DS4
SIGNAL BOARD
-11 dB (B)
-6 dB (B)
RL
0 dB (A)
+5 dB (A)
+14 dB (A)
- 36 dB (B)
+3 dB (B)
LED DRIVER BOARD
Fig. 16. Simplified view of key alignment components on Model 10-A (10-B)
circuit boards. Refer to Fig. 5 and Fig. 6 for specific panel mounting
instructions. An optional Interface Board is available from the factory (as a
replacement for the standard Power Supply Board) for use with a customer's
power supply.
15
Page 17
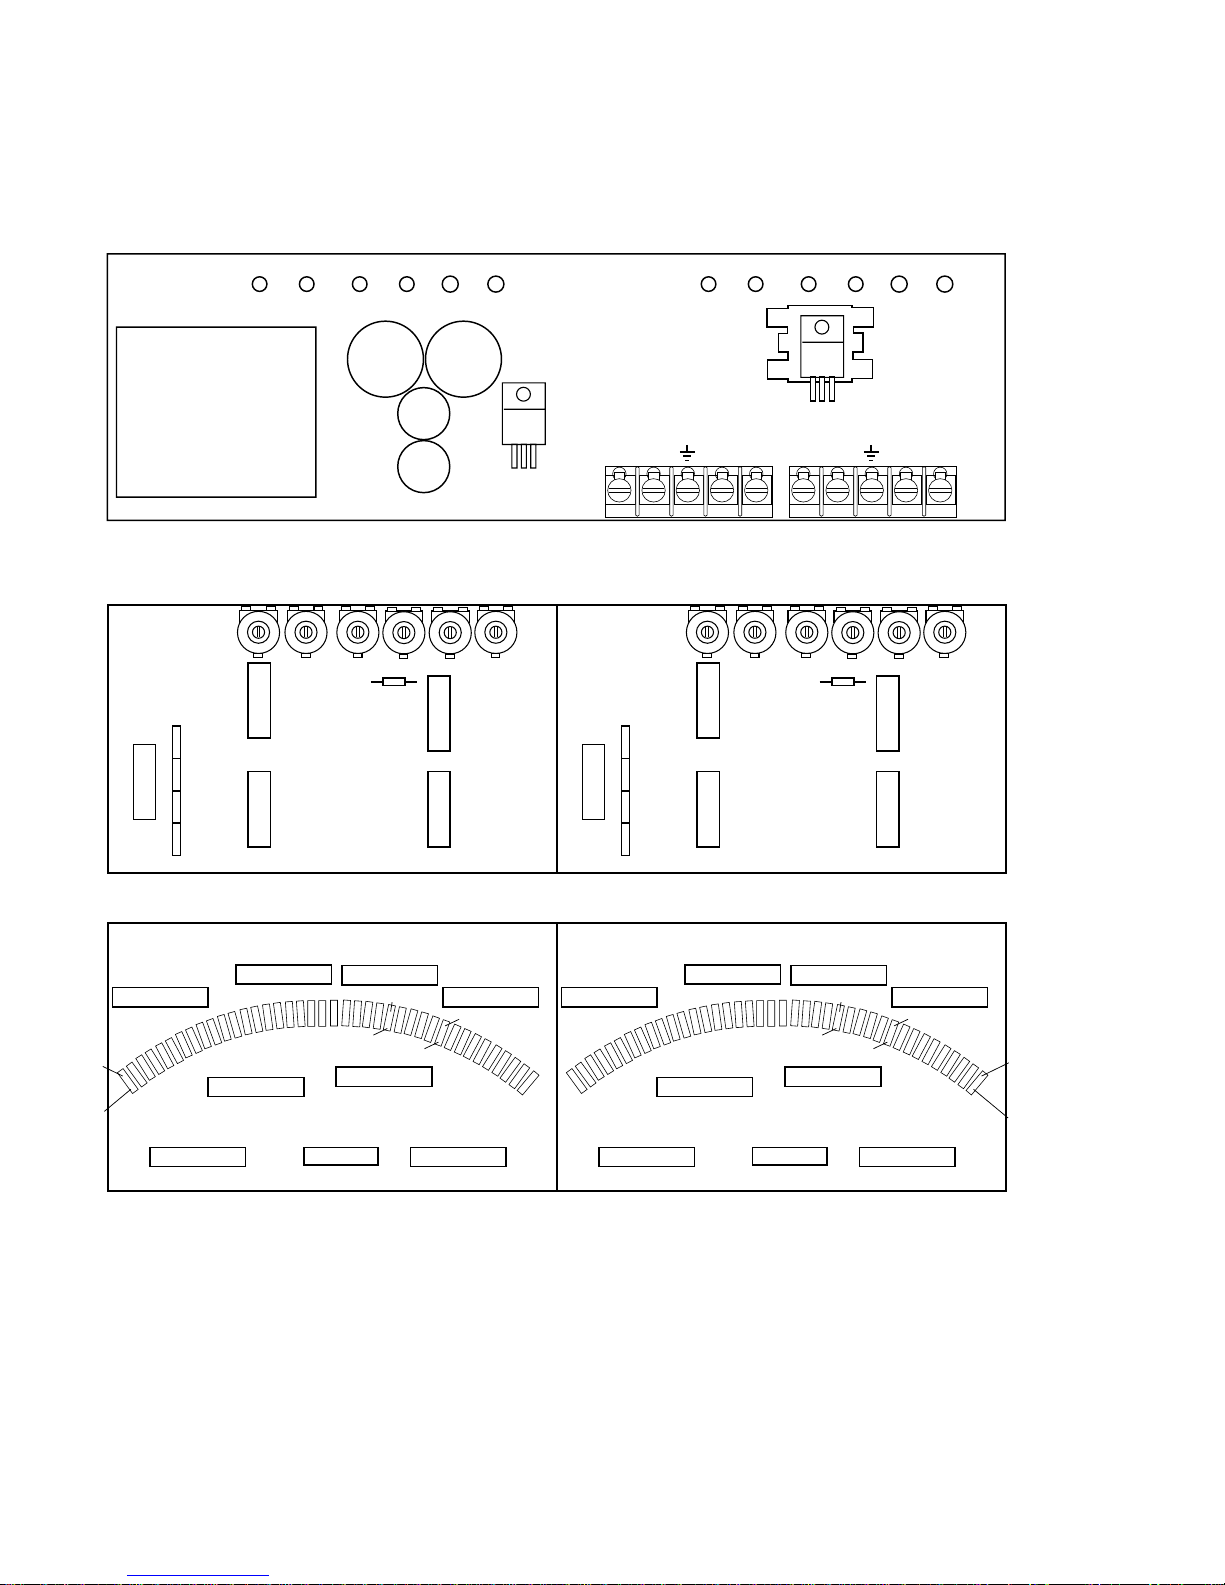
VR49 VR48 VR44 VR46 VR14 VR13
RL
POWER SUPPLY BOARD
VR49 VR48 VR44 VR46 VR14 VR13
RL
+L -L +R -R +L -L +R -R
- 25 dB (A)
- 36 dB (B)
VR49 VR48 VR44 VR46 VR14 VR13
R18
DS1
DS2
DS3
DS4
-11 dB (B)
-6 dB (B)
0 dB (A)
RL
2 SIGNAL BOARDS
+5 dB (A)
VR49 VR48 VR44 VR46 VR14 VR13
R18
DS1
DS2
DS3
DS4
0 dB (A)
-11 dB (B)
-6 dB (B)
RL
+5 dB (A)
+14 dB (A)
+3 dB (B)
Fig. 17. Simplified view of key alignment components on Model 12-A (12-B)
circuit boards. Refer to Fig. 5 and Fig. 6 for specific panel mounting
instructions. Check with the factory on availabilty of an optional Interface
Board (as a replacement for the standard Power Supply Board) for use with
a customer's power supply.
16
2 LED DRIVER BOARDS
Page 18
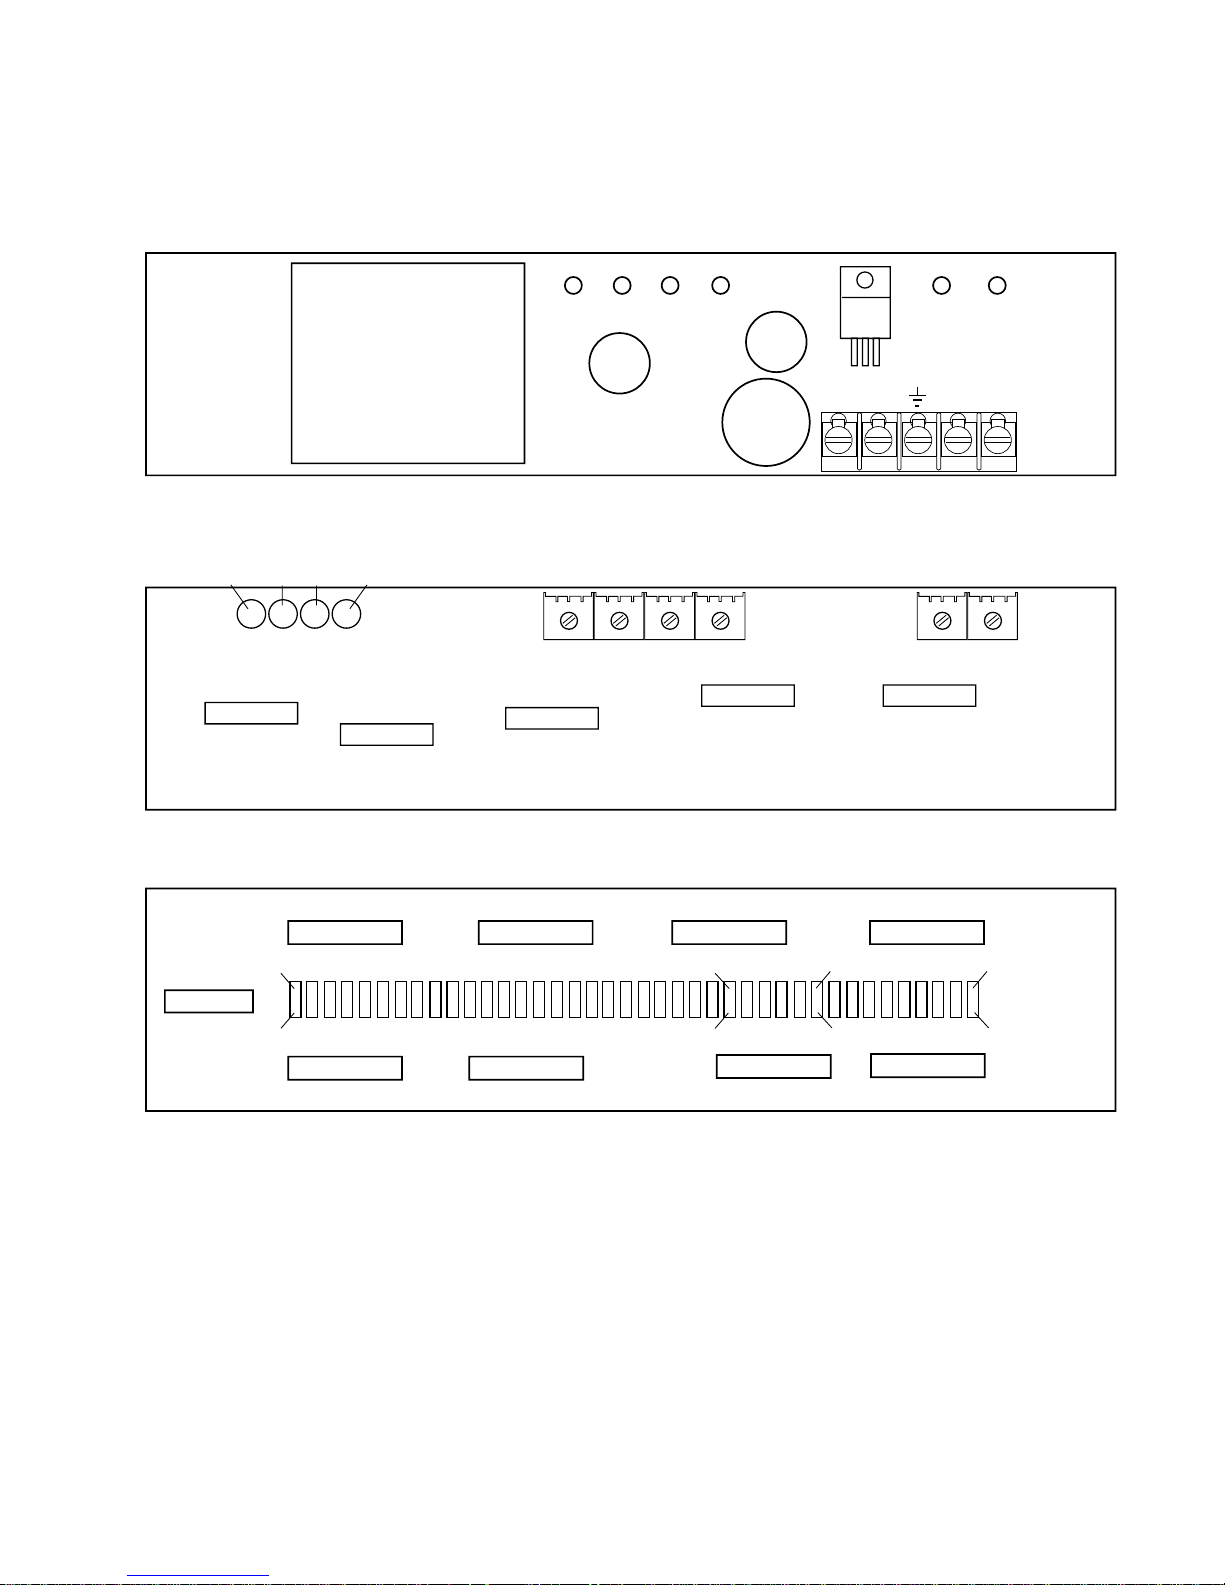
VR49 VR48 VR46 VR44 VR14 VR13
+L -L +R -R
POWER SUPPLY BOARD
RL
DS2DS1 DS3 DS4
-25 dB (A)
-36 dB (B)
VR49 VR48 VR46 VR44
SIGNAL BOARD
0 dB (A)
-11 dB (B)
LED DRIVER BOARD
+5 dB (A)
-6 dB (B)
VR14 VR13
RL
+14 dB (A)
+3 dB (B)
Fig. 18. Simplified view of key alignment components on horizontal Model
20-A (20-B) or vertical Model 21-A (20-B) circuit boards. Refer to Fig. 5 and
Fig. 6 for specific panel mounting instructions. Check with factory on
availabilty of an optional Interface Board (as a replacement for the standard
Power Supply Board) for use with a customer's power supply.
17
Page 19

NOTES
18
 Loading...