

Page 1
DNAPac PA200 Document No. 065036 Page 1 of 25
PRODUCT MANUAL
DNAPAC PA200 ANALYTICAL COLUMN
(4 x 250mm, P/N 063000)
DNAPAC PA200 GUARD COLUMN
(4 x 50mm, P/N 062998)
©DIONEX Corporation
Document No. 065036
Revision 01
20 August 2004
Page 2

DNAPac PA200 Document No. 065036 Page 2 of 25
TABLE OF CONTENTS
SECTION 1 - INTRODUCTION ...................................................................................................................4
1.1 DNAP
1.2 BIOLC S
1.3 G
1.4 DNAPAC PA200 A
1.5 DNAP
AC
PA200 ................................................................................................................................ 4
YSTEM (WITHOUT COLUMNS
UARD COLUMN USE
NION EXCHANGE COLUMNS
AC COLUMN FAMILY
) .............................................................................................. 4
........................................................................................................................ 5
............................................................................... 5
............................................................................................................... 5
SECTION 2 - OPERATION AND SYSTEM REQUIREMENTS ..............................................................6
2.1 S
2.2 S
2.3 DNAPAC PA200 C
YSTEM REQUIREMENTS
YSTEM OPERATION REQUIREMENTS
.................................................................................................................... 6
OLUMN OPERATIONAL PARAMETERS
................................................................................................ 6
................................................................. 7
SECTION 3 - PURITY REQUIREMENTS FOR CHEMICALS............................................................... 8
3.1 D
3.2 I
3.3 S
EIONIZED WATER
NORGANIC CHEMICALS
OLVENTS
.......................................................................................................................................... 8
............................................................................................................................ 8
..................................................................................................................... 8
SECTION 4 - QUALITY ASSURANCE.......................................................................................................9
4.1 C
4.2 P
ERTIFICATE OF PERFORMANCE – RESIN BATCH TESTING
RODUCTION TEST CHROMATOGRAMS
........................................................................................... 10
............................................................... 9
SECTION 5 - METHODS DEVELOPMENT............................................................................................. 11
5.1 S
5.2 E
5.3
AMPLE CLEANUP
LUTION ORDER
E
FFECT OF SALT TYPE ON OLIGONUCLEOTIDE ELUTION
............................................................................................................................ 11
............................................................................................................................... 11
................................................................ 11
5.3.1 Eluent Strength ...................................................................................................................... 11
5.3.2 Loading Capacity................................................................................................................... 11
5.4
G
5.5 E
RADIENT SLOPE
FFECT OF PH AND SOLVENT ON OLIGONUCLEOTIDE CHROMATOGRAPHY
.............................................................................................................................. 12
.................................... 12
5.5.1 Effect of pH on Hydrogen Bond Interactions ........................................................................ 12
5.5.2 Effect of pH on Retention...................................................................................................... 13
5.5.2 Effect of pH on Retention...................................................................................................... 13
5.5.3 Effect of Solvent on Retention............................................................................................... 13
5.5.4 Effect of pH on Selectivity .................................................................................................... 14
5.6 E
5.7
FFECT OF TEMPERATURE ON OLIGONUCLEOTIDE RETENTION
E
FFECT OF TERMINAL BASE ON SELECTIVITY
................................................................................. 16
...................................................... 15
5.7.1 Selectivity in Sodium Chloride (NaCl) Gradients. ................................................................ 16
5.7.2 Selectivity in Sodium Perchlorate (NaClO4) Gradients......................................................... 17
5.8 A
PPLICATION-SPECIFIC MOBILE PHASE RECOMMENDATIONS
........................................................ 18
5.8.1 For synthetic ODNs where the goal is to evaluate purity. ..................................................... 18
5.8.2 When multiple possible ODNs of similar length in the same solution must be resolved...... 18
SECTION 6 - APPLICATIONS................................................................................................................... 19
6.1 D
6.2 E
6.3 P
ENATURING CONDITIONS FOR CONTROL OF SECONDARY STRUCTURE
FFECT OF HIGH TEMPERATURE AND HIGH PH ON COLUMN LIFETIME
HOSPHODIESTER ANALYSIS
........................................................................................................... 20
........................................ 19
.......................................... 19
6.3.1 Sodium Perchlorate Eluent Systems ...................................................................................... 20
6.3.2 Sodium Chloride Eluent Systems .......................................................................................... 21
SECTION 7 - DNAPac™ PA200 RESOURCES.........................................................................................22
Page 3

DNAPac PA200 Document No. 065036 Page 3 of 25
Section 8 - TROUBLESHOOTING GUIDE ...............................................................................................23
8.1 F
8.2 B
8.3 D
8.4
8.5
8.6
8.7
8.8 C
8.9 P
8.10 S
INDING THE SOURCE OF HIGH SYSTEM BACK PRESSURE
ACKPRESSURE ON COLUMN HAS INCREASED
ECREASING PEAK RETENTION TIMES
D
ECREASING PEAK EFFICIENCY AND RESOLUTION
P
OOR PEAK EFFICIENCY AND RESOLUTION
U
NIDENTIFIED PEAKS APPEAR
D
ECREASED DETECTION SENSITIVITY
OLUMN PROBLEMS
EAK EFFICIENCY AND RESOLUTION ARE DECREASING
YSTEM PROBLEMS
........................................................................................................................ 24
.......................................................................................................................... 24
......................................................................................................... 24
............................................................................................ 23
..................................................................................... 24
............................................................................................. 24
.............................................................. 23
................................................................................ 23
......................................................................... 23
................................................................. 24
8.10.1 High Detection Background Caused by the System .............................................................. 24
8.10.2 No Peaks, Poor Peak Area Reproducibility or Unexpectedly Small Peak Area.................... 25
8.10.3 Incorrect or Variable Retention Times .................................................................................. 25
8.11 C
OLUMN CLEANUP
........................................................................................................................... 25
8.11.1 High Salt Wash to Remove Ionic Components ..................................................................... 25
8.11.2 Organic Solvent Wash to Remove Non-Ionic Components .................................................. 25
Page 4
DNAPac PA200 Document No. 065036 Page 4 of 25
SECTION 1 - INTRODUCTION
1.1 DNAPac PA200
The DNAPac PA200 is a pellicular anion exchange column designed specifically to provide high-resolution
separations of single stranded nucleic acids. The DNAPac PA200 provides n, n-1 resolution over a wide range of
oligomer lengths and can perform separations under a variety of denaturing conditions:
• High temperature, pH 8 or below
• High pH (12.4) at 30° or below
Because of the unique pH stability of the packing material, elevated pH conditions can be used to optimize
selectivity for specific oligonucleotides.
The packing material inside the DNAPac PA200 is composed of 130 nm quaternary amine functionalized
MicroBeads™ bound to an 8 µm solvent compatible, non-porous substrate. The non-porous substrate design
provides rapid mass transport resulting in narrow high efficiency peaks. The low column capacity, typical of nonporous packings, is avoided by agglomerating functionalized MicroBeads to the surface of the substrate particle,
resulting in higher loading capacity than is possible with conventional non-porous materials, and good durability.
This produces a column with oligonucleotide resolution superior to columns using 2 to 3 µm resins.
Resin Characteristics:
Particle Size: 8 µm
Pore Size: non porous
Cross-linking: 55%
Ion exchange capacity: ~40 µeq/column
Latex Characteristics:
Functional Group: quaternary ammonium ion
Latex Diameter: ~130 nm
Latex Cross-link: 5 %
Typical Operating Parameters:
pH range: 4-10 unrestricted eluents
2.5-4 and 10-12.5, (Operation at these pH values require co-ion concentration to be
at least equimolar with hydroxide at high pH or H
Temperature: ≤85°C
Pressure: 3,000 psi
Organic Solvent Limit: 100% acetonitrile or methanol for cleaning
Typical eluents: High purity water (18.2 megohm-cm), sodium chloride, sodium perchlorate, buffers,
sodium acetate and sodium hydroxide
1.2 BioLC System (without Columns)
+
at low pH)
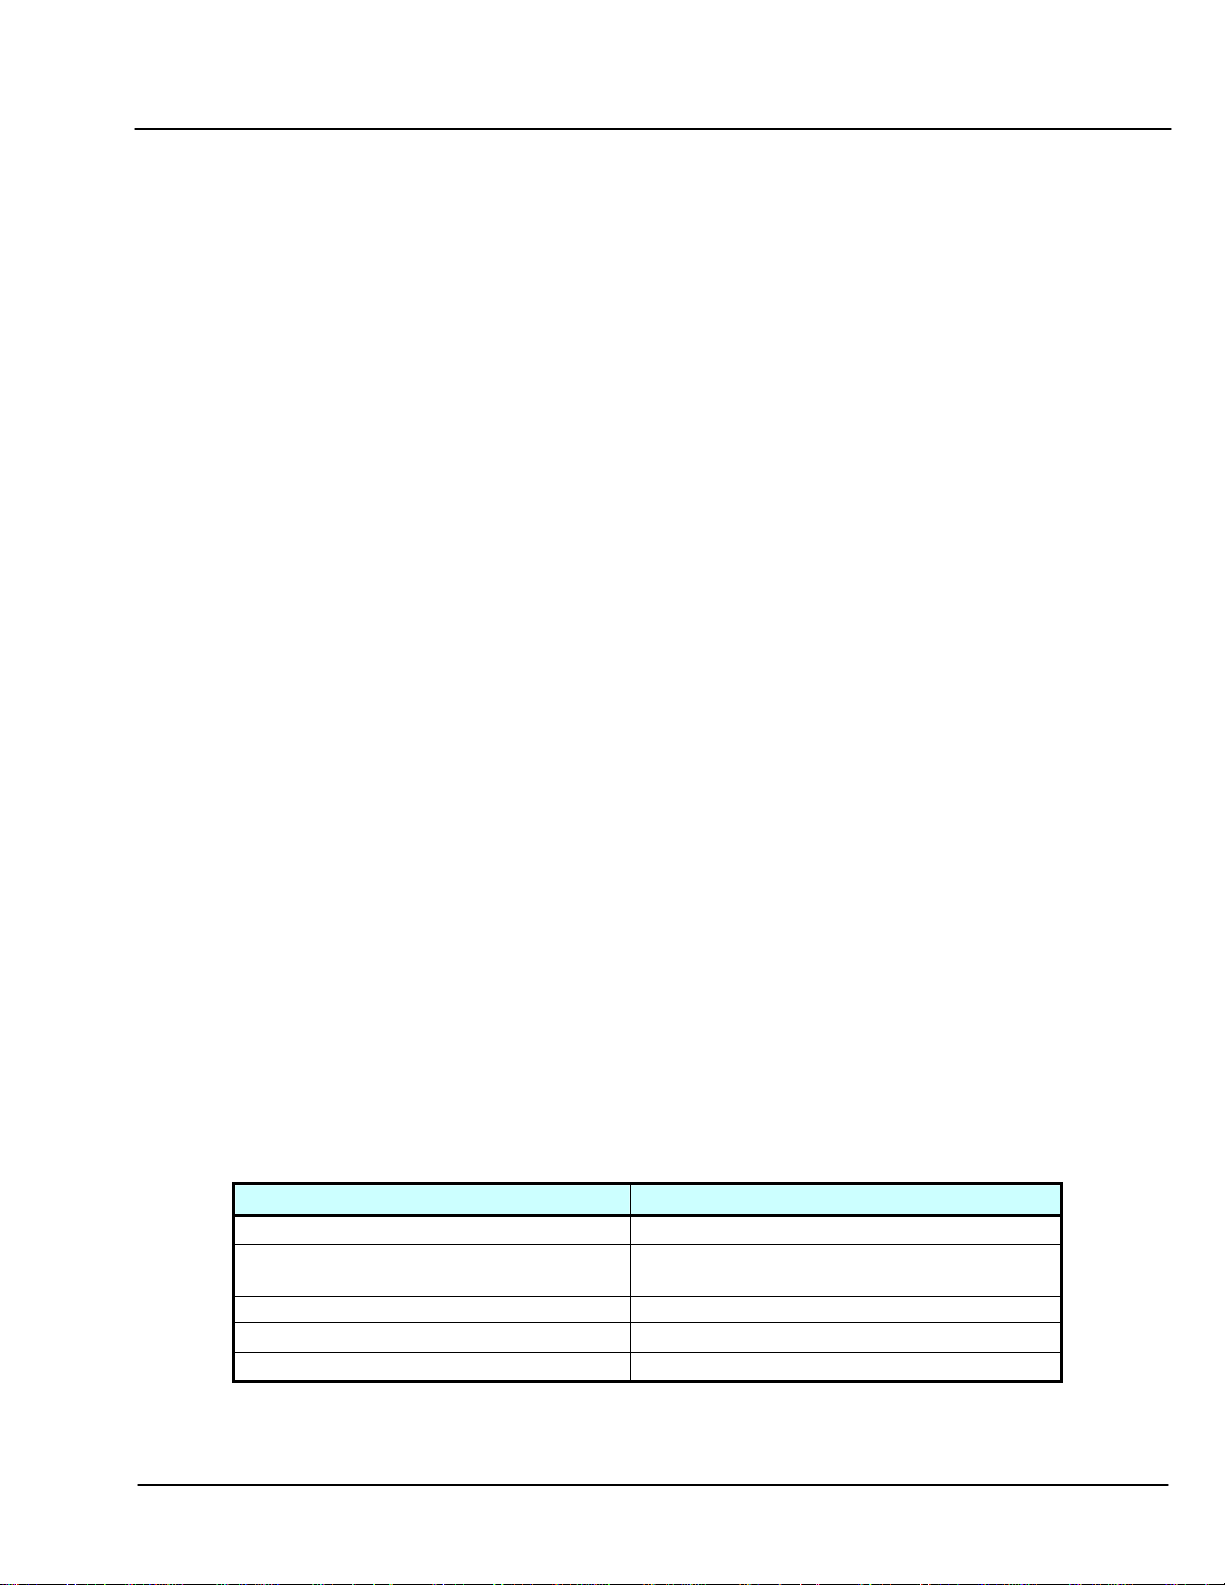
Table 1: System Components Recommended for DNA Analysis
Basic Gradient System Standard Gradient System
BioLC gradient pump, with degas BioLC gradient pump (degas recommended)
Chromatography oven with injection valve
and regulator assembly
Column Oven
Absorbance detector (D2 lamp for UV) Absorbance detector (D2 lamp for UV)
EO1 eluent organizers EO1 Eluent organizers
Autosampler
Page 5

DNAPac PA200 Document No. 065036 Page 5 of 25
1.3 Guard Column Use
A guard column is usually placed before the analytical column to prevent contaminants in the sample from eluting
onto the analytical column. The addition of the guard column increases the net column capacity, which translates
into an increase of about 20% in the retention times for isocratic runs. If a guard is added to a system running a
gradient method that was initially developed for an analytical column alone, the analytes will elute slightly later and
usually with slightly better resolution.
1.4 DNAPAC PA200 Anion Exchange Columns
Part Number Product Description
063000 DNAPac PA200, Analytical (4 x 250mm)
062998 DNAPac PA200, Guard (4 x 50mm)
1.5 DNAPac Column Family
There are two varieties of columns in the DNAPac column family. Both columns are non-porous anion exchangers
that provide high-resolution oligonucleotide separations. The choice of column depends upon the goal of the
separation. The DNAPac PA100 consists of a 13 µm substrate particle with 100 nm functionalized MicroBeads.
This column is available in a variety of formats and should be used when higher capacity is required and if scale-up
to semi-preparative scale separations is anticipated.
The DNAPac PA200 consists of an 8 µm substrate particle with 130 nm functionalized MicroBeads. This column
provides higher resolution than the DNAPac PA100. The DNAPac PA200 is operated at a lower flow rate than the
DNAPac PA100, thus less eluent is consumed during a run. In addition, the DNAPac PA200 has been
manufactured to provide greater stability to high pH at elevated temperature, although this combination is not
recommended.
Assistance is available for any problem that may be encountered during the shipment or operation of
DIONEX instrumentation and columns through the DIONEX North America Technical Call Center at 1800-DIONEX-0 (1-800-346-6390) or through any of the DIONEX offices listed in “DIONEX Worldwide
Offices.”
Page 6
DNAPac PA200 Document No. 065036 Page 6 of 25
SECTION 2 - OPERATION AND SYSTEM REQUIREMENTS
2.1 System Requirements
Oligonucleotide separations with the DNAPac PA200 columns are optimized for use with NON-METALLIC
systems, such as the Dionex BioLC. The key issue is that the eluent flow path from reservoir to detector is metalfree, because the salts used for oligonucleotide elution attack the metallic components of metallic pumps and
tubing. The released metals will irreversibly foul the column.
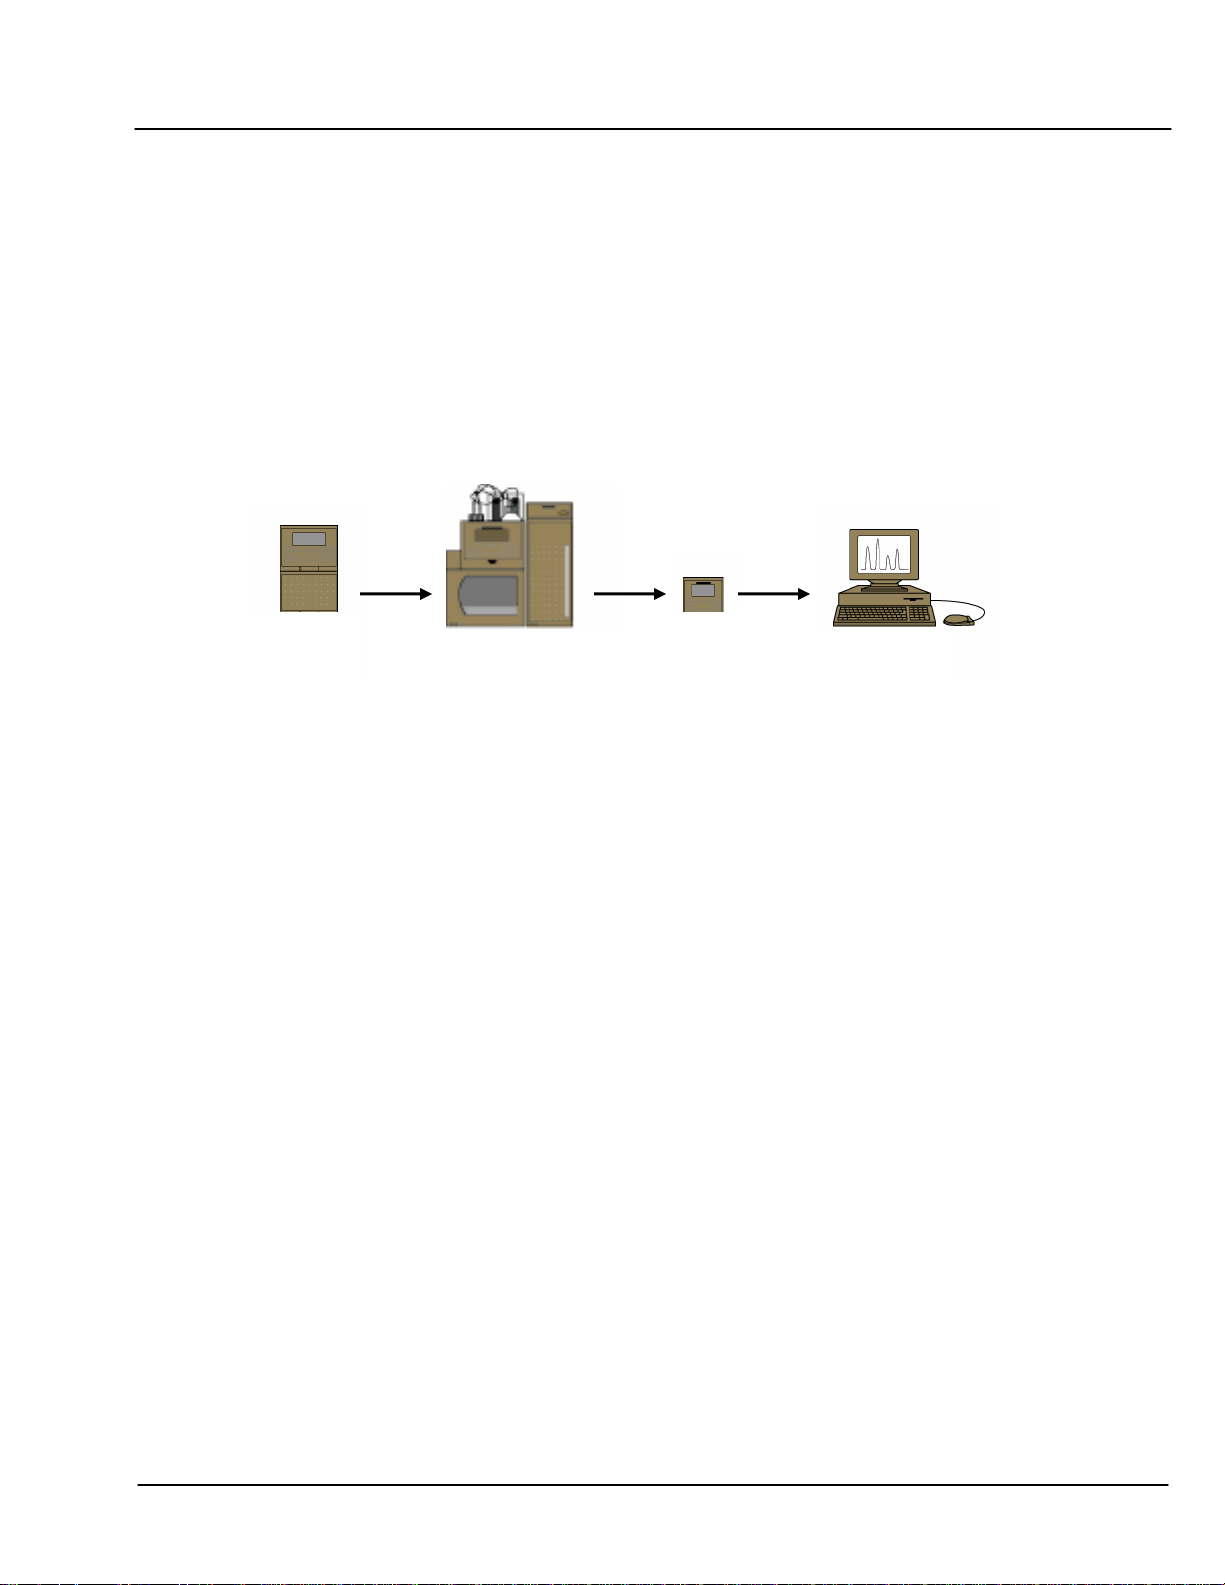
Each of the possible configurations offers multiple sampling options; however, consistently reproducible
quantification and an absence of disturbing artifacts are achieved best using an autosampler and “full loop”
injection mode. Reproducibility of retention time results can be enhanced by regulating the temperature of the
column using a column oven or thermal compartment.
Gradient
Pump
Autosampler
Thermal
Compartment
Absorbance
Detector
Data System
Figure 1 Oligonucleotide System Configuration
2.2 System Operation Requirements
The oligonucleotide analysis systems should be configured with Dionex modules to provide the following
attributes:
a) All components of the fluid path are non-metallic, to eliminate column poisoning.
b) Mobile phase components are kept under helium or nitrogen to minimize out-gassing (bubble formation)
in the detector cell. On-line degassing of eluents may be provided with the eluent degas option on Dionex
pump modules.
c) Accurate reproducible flow and gradient generation at settings between 0.20 and 2.0 mL/min.
d) Minimal contribution to the background signal by contaminants from the system and reagents.
e) Thermostated column compartment for consistent temperature control of the guard and separation
columns.
f) Minimal system volumes (employ low volume unions and minimal tubing length).
• 4-mm operation, liquid line inside diameter (I.D.) should be between .007” and 0.01”.
• 2mm operation, liquid line inside diameter (I.D.) should be between .003” and 0.005”.
In both operations, PEEK tubing is preferred as it does not contribute to metal leaching.
Page 7
DNAPac PA200 Document No. 065036 Page 7 of 25
2.3 DNAPAC PA200 Column Operational Parameters
TABLE 2 Column Operational Parameters
pH
= 4-10 (unrestricted eluents)
pH
pH Range:
Temperature Limit:
Pressure Limit:
Organic Solvent Limit:
Chaotrope Limit:
Typical Eluents:
Detergent
Compatibility:
CAUTION:
Do not use anionic detergents. Anionic detergents will bind irreversibly to the column.
= 2.5- 4, and 10-12.5: Operation at these pH values require co-ion
concentration (e.g., Cl
pH) to be at least equimolar with hydroxide at high pH or H
-
or ClO
-
at high pH and Na+ or NH
4
+
at low
4
+
at
low pH.
<
85°C
4,000 psi
100% Acetonitrile, or methanol, if required for cleaning.
30% formamide, 6 M Urea.
Note:
Use of these chaotropes will increase back pressure, and
reduce column lifetime.
High purity water (18 megohm-cm), sodium chloride, sodium
perchlorate, buffers, sodium acetate and sodium hydroxide.
Nonionic, cationic or zwitterionic detergents.
Page 8

DNAPac PA200 Document No. 065036 Page 8 of 25
SECTION 3 - PURITY REQUIREMENTS FOR CHEMICALS
Reliable and reproducible results require eluents that are prepared consistently and are free from impurities.
3.1 Deionized Water
The de-ionized (DI) water, used to prepare eluents, should be Type I reagent grade water with a specific resistance
of 18 megohm-cm. The water should be free from ionized impurities, organics, microorganisms, and particulate
matter. Ultra Violet (UV) treatment in the water purification unit is recommended. Follow the manufacturer’s
instructions regarding the replacement of ion exchange and adsorbent cartridges. All filters used for water
purification must be free from UV absorbing components. Contaminated water in eluents causes high background
signals, gradient artifacts, and even sample degradation due to nucleases arising from microbial contamination.
3.2 Inorganic Chemicals
Inorganic chemicals of reagent grade or better should be used to prepare ionic eluents. Whenever possible,
inorganic chemicals that meet or surpass the latest American Chemical Society standard for purity should be used.
These products will include detailed lot analyses on their labels.
3.3 Solvents
Solvents can be added to the ionic eluents used in DNAPac PA200 columns to modify the ion exchange process.
The solvents used must be free from ionic impurities; however, since most manufacturers of solvents do not test for
ionic impurities, it is important that the highest grade of solvents available be used. Currently, several
manufacturers are making “ultra high” purity solvents that are compatible with HPLC and spectrophotometric
applications. These “ultra high” purity solvents will usually be of sufficient purity to ensure that your
chromatography is not affected by ionic impurities in the solvent. At Dionex, we have obtained consistent results
using High Purity Solvents manufactured by Burdick and Jackson or Optima Solvents by Fischer Scientific.
When using an ionic eluent with solvent, column generated back pressure will depend on the solvent used, the
concentration of the solvent, the ionic strength of the eluent, and the flow rate applied. The column backpressure
will also vary if the composition of the water-solvent mixture varies. The practical backpressure limit for the
DNAPac PA200 is 4,000 psi (27.6 MPa). The DNAPac PA200 can withstand common HPLC solvents in a
concentration range of 0-100%. Solvents and water should be premixed in concentrations which allow proper
mixing by the gradient pump and to minimize out-gassing. Ensure that all of the inorganic chemicals are soluble in
the highest solvent concentration to be used during the analysis.
Solvent-Water mixtures are usually specified with a volume to volume basis. If a procedure requires an eluent of
90% acetonitrile; prepare the eluent by adding 900 mL of acetonitrile to an eluent reservoir. Then add 100 mL of
deionized water, or eluent concentrate, to the acetonitrile in the reservoir. Using this procedure to mix solvents with
water will ensure that a consistent true volume/volume eluent is obtained. Premixing water with solvent will also
minimize the possibility of out gassing which causes bubble formation in the detector cell. If you choose to mix
eluents containing solvents with those that do not – the eluent degas option for the pump is highly recommended.
As a second choice, pre-degassing the eluents and covering the eluent reservoir with Helium gas to limit gas
dissolution into the eluents will help limit out-gassing.
Page 9

DNAPac PA200 Document No. 065036 Page 9 of 25
SECTION 4 - QUALITY ASSURANCE
The chromatograms in this section were obtained using a calibrated system that meets the operational parameters listed
in Section 2. Different systems will differ slightly in performance due to slight variations in column sets, system void
volumes, liquid sweep-out times, different component volumes, and laboratory temperature.
4.1 Certificate of Performance – Resin Batch Testing
Each batch of resin used for packing the DNAPac PA200 columns is tested to ensure reliable performance and
resolution. Separations of dT
compared. This procedure ensures that resins with the highest quality are used, and produces consistent column
performance.
Eluent 1: 25 mM Tris pH 8
Eluent 2: 25 mM Tris pH 8, 1.25 M NaCl
Flow rate: 1.20 mL/minute
Detection: Absorbance (260 nm)
Injection: 25 µL
Storage Solution: Eluent 2
Gradient: Time
0.0 68 32 Equilibration solution
0.1 68 32 Equilibration solution
10.1 53.6 46.4 Gradient ramp 400 – 580 mM NaCl
10.11 35 60 Column wash start
11.11 35 60 Column Wash end
14.12 68 32 End equilibration
with DNAPac PA200 columns, packed with both production and test resins, are
19-24
%1 %2 Comments
11.2 68 32 Re-Equilibration solution
Sample: dT
25
1.5 µg each / mL
19-24
Flow: 1.20 ml/min
60.0
60.0
dT20
dT21
dT22
dT24
dT23
46.4
46.4
dT19
260
mA
1.25M NaCl:
32..0 %
0
0.0 4.0 8.0 12.0
Time (min)
CHART 1 Certificate of Performance
Page 10

DNAPac PA200 Document No. 065036 Page 10 of 25
4.2 Production Test Chromatograms
To guarantee that all DNAPac PA200 analytical columns meet high quality and reproducible performance
specification standards, all columns undergo the following production control test. Because gradient separation is
not an accurate test for determining column capacity and packing quality, an isocratic separation of seven inorganic
anions is employed to measure individual column performance utilizing a sodium carbonate, bicarbonate eluent.
The retention time of sulfate is used to measure the capacity of the column. Peak efficiency and peak symmetry of
sulfate are used to measure the packing quality of the column. Retention times and resolution of chloride, nitrate,
and phosphate are used to measure the overall selectivity of the column.
Eluent 1: 1.28mM NaHCO
1.35 mM Na2CO3
3
Flow rate: 1.00 mL/minute
Detection: Conductivity (Suppressed)
Sample: 7 Anion Standard with (1/10 dilution)
Injection Volume: 25 µL
Storage Solution: 25 mM Tris pH 8, 1.25M NaCl
30
30
-
-
NO
Cl
Cl
NO
NO
NO
3
3
-
-
2
2
-
-
Br
Br
-
-
F
µS
µS
F
=
PO
PO
=
=
4
4
SO
SO
=
4
4
Col # 102, 25.0
Col # 102, 25.0
0
0
0.0 2.0 4.0 6.0 8.0 10.0
0.0 2.0 4.0 6.0 8.0 10.0
CHART 2 Production Test Chromatogram
Time (min)
Time (min)
Page 11

DNAPac PA200 Document No. 065036 Page 11 of 25
SECTION 5 - METHODS DEVELOPMENT
5.1 Sample Cleanup
This table lists some sample preparation and matrix removal guidelines, for oligonucleotide samples, prior to
injection onto the DNAPac PA200 column.
TABLE 3 Sample Preparation and Matrix Removal Guidelines
Matrix
Interferent
Halides High concentrations of salts in
Anionic
Detergents
5.2 Elution Order
The native elution order of oligonucleotide bases from the DNAPac PA200 phase using linear gradients
of NaCl or NaClO4 is as follows:
Effect Possible Removal
Dialysis, dilution, ethanol precipitation,
the sample will affect the
retention time of analytes
Will bind irreversibly to the
column
cleanup with Reversed-phase
cartridges.
Dialysis, dilution, solid phase extraction
using the OnGuard RP Cartridge
DNA > RNA (DNA is more retained than RNA)
Homopolymer Series:
pH 8: G > C > T > A
pH 12: G > T > C > A
NOTE:
Heteropolymer Series:
Elution is influenced by the base composition (especially % G +T), terminal base sequence, pH, solvent
Poly-G will form extensive tetrad ladders at pH values below ~10.5. These are not readily disrupted,
even at 85°C in salt solutions.
concentration, and eluent salt. At pH 12 each T or G base contributes a negative charge from tautomeric
oxygen atoms; as pH shifts from 10.5 – 12.5, hydrogen bond interactions decrease yielding the expected
chromatographic patterns.
5.3 Effect of Salt Type on Oligonucleotide Elution
5.3.1 Eluent Strength
Sodium perchlorate (NaClO
DNAPac columns. Sodium perchlorate is a stronger eluent than sodium chloride, so a higher concentration of
sodium chloride than of sodium perchlorate is required for any given separation. For example, typically ~0.2M
NaClO
5.3.2 Loading Capacity
will elute a 75-base oligonucleotide at pH 8, while ~0.7M NaCl would be required.
4
) and sodium chloride (NaCl) are the two eluent salts used most commonly with
4
Column loading capacity is the maximum amount of a given oligonucleotide that can be loaded onto the
column before the peak shape starts to deteriorate. Column loading capacity is affected by the salt type. The
stronger the salt, the lower the loading capacity. Thus, use of NaClO
lower sample loading concentration than a NaCl eluent.
would result in peak broadening at a
4
Page 12

DNAPac PA200 Document No. 065036 Page 12 of 25
5.4 Gradient slope
Phosphodiester oligonucleotides generally exhibit good peak shape when the gradient slope is ~15 mM/mL (NaCl)
or ~5 mM/mL (NaClO
). Higher values will generally result in shorter run times, but result in poorer resolution.
4
Conversely lower values may produce improved resolution, but also require longer run times.
5.5 Effect of pH and Solvent on Oligonucleotide Chromatography
Use of elevated pH offers two advantages over chromatography at neutral pH. First, elevated pH allows control of
hydrogen bonding interactions. At pH 11 and above, (pH 12.4 is the recommended upper limit for the DNAPac
columns), Watson-Crick and poly-G hydrogen bonds break. Hence, at high pH chromatographic analysis of
oligonucleotides with self-complementary sequences results in sharp, well-resolved peaks. Second, for each
Thymine (T) and Guanine (G) residue, an increase in oligonucleotide charge is generated with rising pH values due
to ionization of the tautomeric oxygen on these bases. Between pH 9 and 11, oxyanion formation on these bases
increases retention of oligonucleotides in proportion to the number of T and G residues on the molecule. This offers
opportunity to control of oligonucleotide selectivity with eluent pH.
5.5.1 Effect of pH on Hydrogen Bond Interactions
In the chart below, the chromatography of a PdG
sample at 25°C and pH 8 (bottom trace) reveals the
12-18
absence of identifiable peaks. Under these conditions, poly-G tracts form tetrad ladders with 8 hydrogen bonds
between each set of bases. Chromatography at 85°C (pH 8, middle trace) dramatically increases the detector
noise compared to pH8 and 25°C, but still no identifiable peaks are eluted. However, at 25°C and pH 12 each
of the sample components are clearly eluted, and completely resolved from all the other components.
40.0
40.0
Flow: 1.20 ml/min
Flow: 1.20 ml/min
75.0
75.0
66.7
66.7
260
260
mA
mA
25 °C, pH12
d(G)
3
3
d(G)
25 °C, pH12
12-18
12-18
A 85 °C, pH8
d(G)
2
2
d(G)
A 85 °C, pH8
12-18
12-18
36.4
0.33M NaClO4:
1
1
0.0
0.0
0 8 16 24
0 8 16 24
0.33M NaClO4:
33.4 %
33.4 %
d(G)
d(G)
25 °C, pH8
25 °C, pH8
12-18
12-18
Time (min)
Time (min)
36.4
CHART 3 Controlling H-bond interactions in poly-G Tracts:
Comparison of High pH and High Temperature
Page 13

DNAPac PA200 Document No. 065036 Page 13 of 25
R
R
5.5.2 Effect of pH on Retention
The next chart illustrates the influence of pH on oligonucleotide retention.
An oligonucleotide with base composition of G
6C5A5T9
was eluted with a
gradient of NaCl over 30 minutes at pH 6.5 to 12. Between pH 9 and 11, a
substantial increase in retention is observed. As shown in Figure 2, this is
due to the formation of an oxyanion on the tautomeric oxygen on each
G and T.
FIGURE 2
260
260
mA
mA
7.41’
7.41’
6.88’
6.15’
6.15’
6.88’
pH 6.5
pH 6.5
1.25M
1.25M
NaCl:
NaCl:
26.4 %
26.4 %
15.04’
15.04’
pH 9
pH 9
pH 8
pH 8
0
0
10 20 30
10 20 30
Time (min)
Time (min)
CHART 4 Effect of pH on Retention
22.74’
22.74’
22.57’
22.57’
pH 10
pH 10
O
No CH3CN
No CH3CN
Flow: 1.20 ml/min
Flow: 1.20 ml/min
HN
pH7
O
N
HO
O
N
N
pH1
80.0
80.0
72.0
72.0
pH 12
pH 12
pH 11
pH 11
26.3
26.3
5.5.3 Effect of Solvent on Retention
As shown in the next chart, addition of acetonitrile to the eluent will mask some of the native selectivity of the
DNAPac PA200, and reduce retention of oligonucleotides. In some cases, resolution of closely spaced or coeluting oligonucleotides may be assisted by adding solvent. These effects can be seen clearly by comparing
Chart 4 with Chart 5. The scales have been aligned to make this comparison easier.
Flow: 1.20 ml/min
Flow: 1.20 ml/min
20% CH3CN
20% CH3CN
13.80’
13.80’
pH12
pH12
pH11
pH11
14.35’
14.35’
260
260
mA
mA
6.02’
6.02’
5.42’
5.42’
4.61’
4.61’
0 10 20
0 10 20
pH6.5
pH6.5
pH8
pH8
9.93’
9.93’
pH9
pH9
Time (min)
Time (min)
pH10
pH10
CHART 5 Effect of Solvent on Retention
Page 14

DNAPac PA200 Document No. 065036 Page 14 of 25
5.5.4 Effect of pH on Selectivity
The figure below illustrates the influence of pH on oligonucleotide selectivity. Here the elution patterns of two
23-base oligonucleotides differing only in their 5’ and 3’ terminal bases are compared between pH 9 and pH
11.
The top trace for each pair of chromatograms has an additional T at the 5’ end of the molecule, and lacks the 3’
A. The oligonucleotide chromatographed in the bottom trace lacks the 5’ T, but has the 3’A. At pH 9 - 9.5
(bottom 2 pairs of traces) these oligos are unresolved.
At pH 10, the 5’ TG-3’G oligonucleotide is eluted earlier than the 5’ G-3’ GA oligonucleotide, and the two are
only partially resolved. However, at pH 10.5 and 11 this elution order is reversed, due to the relative
contributions of T and A to retention at these pH values.
The base composition of these 23-base oligos is 5’ X-G
4C4A3T7
-Y 3’, and optimal resolution is observed at pH
10.5.
75
75
mAU
mAU
Flow: 1.20 ml/min
Flow: 1.20 ml/min
WVL:260 nm
WVL:260 nm
X=TGA, Y=TG, pH 11
10
1010
9
99
8
88
7
77
6
66
5
55
4
44
3
33
X=TGA, Y=TG, pH 11
X=GA, Y=TGA, pH 11
X=GA, Y=TGA, pH 11
X=TGA, Y=TG, pH 10
X=TGA, Y=TG, pH 10
X=GA, Y=TGA, pH 10
X=GA, Y=TGA, pH 10
X=TGA, Y=TG, p H 9.5
X=TGA, Y=TG, p H 9.5
X=GA, Y=TGA, pH 9.5
X=GA, Y=TGA, pH 9.5
X=TGA, Y=TG, pH 10.5
X=TGA, Y=TG, pH 10.5
X=GA, Y=TGA pH 10.5
X=GA, Y=TGA pH 10.5
2
22
1
1
1
0
0
56 7 910118
4 12
4 12
56 7 910118
X=TGA, Y=TG, pH 9
X=TGA, Y=TG, pH 9
X=GA, Y=TGA, pH 9
X=GA, Y=TGA, pH 9
Time (Min)
Time (Min)
CHART 6 Effect of pH on Selectivity
Page 15

DNAPac PA200 Document No. 065036 Page 15 of 25
5.6 Effect of Temperature on Oligonucleotide Retention
Elevated temperature is often used to limit or eliminate Watson-Crick, and poly-G hydrogen bonding within, and
between oligonucleotides that have self-complementary sequences.
NOTE: Dionex does NOT recommend combining the use of elevated temperatures with high pH elution
systems. Such conditions will accelerate degradation of the DNAPac PA200 stationary phase.
At relatively low pH, 9 or below, increased temperature may have mixed effects on nucleic acid retention.
Nucleoside monophosphates and very short, 2-3 base, oligonucleotides may exhibit decreased retention times at
elevated temperatures. Nucleoside triphosphates and oligonucleotides greater than a few bases long usually exhibit
increased retention as the temperature increases. The chart below illustrates the influence of increased temperature
at constant pH (8). As the chromatographic temperature increases, retention of the oligonucleotides also increases,
in this case by an average of ~ 2.7 min per 10°C.
100
mAU
4
3
2
1
0
0.0 4.0 8.0 12.0 16.0 20.0
Flow: 1.20 ml/min
0.33M NaClO4:
21.2 %
d(AC)x-xi 55 °C
d(AC)x-xi 45 °C
d(AC)x-xi 35 °C
d(AC)x-xi 25 °C
WVL:260 nm
75.0
51.5
22.1
min
CHART 7 Effect of Temperature on Retention of Oligonucleotides
d(AC)
: pH 8, 5 mM NaClO4 / mL
10-11
Page 16

DNAPac PA200 Document No. 065036 Page 16 of 25
5.7 Effect of Terminal Base on Selectivity
5.7.1 Selectivity in Sodium Chloride (NaCl) Gradients
The influence of the 5’ and 3’ terminal base on retention is shown below for NaCl eluents. These examples
consist of mixed-base oligonucleotide (ODN) 25 mers with identical sequence except for the 3’ and 5’ terminal
bases. The samples are chromatographed at pH 9, 10 & 11.
In each panel, the top 4 traces show elution of ODNs with identical 5’ termini, and altered only at the 3’ base.
The bottom 4 traces show elution of ODNs with identical 3’ termini, and altered only at the 5’ base. The
middle trace is common to both sets.
Using NaCl as the salt, all of the ODNs differing only at the 3’ base are resolved at pH 9 or 10. The ODNs
differing only at the 5’ base are also at least partially resolved at pH 9 or 10. In each case, C contributes the
least to retention at either the 5’ or 3’ end, and G contributes the most.
The relative contributions of A and T at either end are pH dependent. At pH 9, A contributes more than T but
at the higher pH values it contributes less.
Addition of solvent (e.g., CH
CN) tends to reduce retention, and minimize hydrophobic interactions. This may
3
in some cases improve selectivity and resolution, (chart not shown).
140
140
mA
mA
Flow: 1.20 ml/min
Flow: 1.20 ml/min
pH 9
pH 9
7
7
6
6
5
5
4
4
3
3
X=C, Y=G
X=C, Y=G
X=C, Y=C
X=C, Y=C
X=C, Y=T
X=C, Y=T
X=C, Y=A
X=C, Y=A
X=T, Y=A
X=T, Y=A
140
140
mA
mA
Flow: 1.20 ml/min
Flow: 1.20 ml/min
7
7
6
6
5
5
4
4
3
3
pH 10
pH 10
X=C, Y=C
X=C, Y=C
X=C, Y=A
X=C, Y=A
X=C, Y=G
X=C, Y=G
X=C, Y=T
X=C, Y=T
X=T, Y=A
X=T, Y=A
X=A, Y=A
2
2
X=A, Y=A
2
2
X=G, Y=A
1
1
-1
-1
5.5
5.5 6.5 7.5 8.5
X=G, Y=A
6.5 7.5 8.5
Time (min)
Time (min)
1
1
-1
-1
13.5 14.5 15.5 16.5
13.5 14.5 15.5 16.5
X=A, Y=A
X=A, Y=A
Time (min)
Time (min)
X=G, Y=A
X=G, Y=A
140
140
mA
mA
Flow: 1.20 ml/min
Flow: 1.20 ml/min
pH 11
pH 11
7
7
X=C, Y=C
X=C, Y=C
6
6
5
5
X=C, Y=A
X=C, Y=A
4
4
3
3
X=A, Y=A
X=A, Y=A
2
2
1
1
-1
-1
21.5 22.5 23.5 24.5
21.5 22.5 23.5 24.5
Time (min)
Time (min)
X=C, Y=G
X=C, Y=G
X=C, Y=T
X=C, Y=T
X=T, Y=A
X=T, Y=A
X=G, Y=A
X=G, Y=A
CHART 8 Effect of pH on Retention (by Terminal Base):
15 mM/mL NaCl gradient, 0% CH
CN, 5’X-G6C3A5T9 -Y3’, pH 9-11
3
Page 17

DNAPac PA200 Document No. 065036 Page 17 of 25
5.7.2 Selectivity in Sodium Perchlorate (NaClO4) Gradients
When NaCl eluent is replaced with NaClO
(see below), the retention differences are less pronounced, and the
4
effect of pH on retention is also reduced. However, all of the ODNs with 3’ base substitutions are again
resolved, and those with 5’ substitutions are at least partially resolved, at pH 9 or 10. Addition of solvent to
NaClO
eluent will reduce retention and minimize hydrophobic interactions, resulting in smaller selectivity
4
changes due to terminal base differences at these pH values.
99
99
mAU
mAU
Flow: 1.20 ml/min
Flow: 1.20 ml/min
pH 9
7
7
6
6
pH 9
5
5
4
4
X=C, Y=G
X=C, Y=G
X=C, Y=C
X=C, Y=C
X=C, Y=T
X=C, Y=T
X=C, Y=A
X=C, Y=A
99
99
mAU
mAU
7
7
6
6
5
5
4
4
Flow: 1.20 ml/min
Flow: 1.20 ml/min
pH 10
pH 10
X=C, Y=G
X=C, Y=G
X=C, Y=C
X=C, Y=C
X=C, Y=T
X=C, Y=T
X=C, Y=A
X=C, Y=A
99
99
mAU
mAU
7
7
6
6
5
5
4
4
Flow: 1.20 ml/min
Flow: 1.20 ml/min
pH 11
pH 11
X=C, Y=G
X=C, Y=G
X=C, Y=C
X=C, Y=C
X=C, Y=T
X=C, Y=T
X=C, Y=A
X=C, Y=A
X=T, Y=A
3
3
2
2
X=T, Y=A
X=A, Y=A
X=A, Y=A
3
3
2
2
X=T, Y=A
X=T, Y=A
X=A, Y=A
X=A, Y=A
X=T, Y=A
3
3
2
2
X=T, Y=A
X=A, Y=A
X=A, Y=A
X=G, Y=A
1
1
-1
-1
7 8 9 10
7 8 9 10
Time (min)
Time (min)
X=G, Y=A
CHART 9 Effect of pH on Retention (by Terminal Base):
5 mM/mL NaClO
X=G, Y=A
1
1
-1
-1
9.5 10.5 11.5 12.5
9.5 10.5 11.5 12.5
gradient, 0% CH3CN, 5’X-G6C3A5T9 -Y3’, pH 9-11
4
X=G, Y=A
Time (min)
Time (min)
1
1
-1
-1
13 14 15 16
13 14 15 16
X=G, Y=A
X=G, Y=A
Time (min)
Time (min)
Page 18

DNAPac PA200 Document No. 065036 Page 18 of 25
5.8 Application-Specific Mobile Phase Recommendations
From the observations detailed in the preceding sections, the following suggestions can be made:
5.8.1 Eluent Systems Minimizing Base-Specific Retention
For synthetic ODNs where the goal is to evaluate purity, determine the coupling efficiency, or purify the fulllength component from “n-1” and “n+1” impurities in the sample, eluent systems minimizing base-specific
retention would produce the best results. Hence, solvent-containing NaClO
pH-induced ionization is further minimized, would be the logical choice.
5.8.2 Eluent Systems Maximizing Base-Specific Retention
When multiple possible ODNs of similar length in the same solution must be resolved, eluents maximizing
base-specific retention would provide the best probability of success. Examples of such samples include:
Identification of all primers in a multiplex PCR amplification cocktail, QA / QC of multiple primers in
amplification-based diagnostic kits, identification of the different components in “n-1” or “n+1” impurities
when troubleshooting nucleic acid synthesis protocols. For these applications, NaCl without solvent, at pH
values between 9 and 11 would be more likely to produce the desired separations.
5.8.3 Exploitation of Interactions Between The stationary phase and ODN Derivatives
When hydrophobic interactions between some bases and the phase are suspected, interactions between the
phase and additional ODN derivatives may also be exploited. Examples of such derivatives include numerous
fluorescent dyes, and the “Trityl” group used to protect the oligo from unwanted base additions at each
elongation step during ODN synthesis.
eluent at pH 9 or below, where
4
Page 19

DNAPac PA200 Document No. 065036 Page 19 of 25
y
y
SECTION 6 - APPLICATIONS
6.1 Denaturing Conditions for Control of Secondary Structure
Single-stranded nucleic acids may contain inter-, and/or intra-, strand hydrogen bonding. Such interactions, if
sufficiently strong, result in spurious peaks and a general inability to distinguish between the oligonucleotide
components in the sample. There are three common methods to restrict these interactions; high temperature,
addition of chaotropic agents such as urea or formamide, and use of high pH. Both the temperature used and the
concentration of chaotropic agent used depend upon the extent of hydrogen bonding. For pH, values between pH
11-12.4 are effective at controlling both Watson-Crick, and non Watson-Crick oligonucleotide interactions.
While the DNAPac PA200 can be used with any of the above methods for controlling secondary structure, there are
certain considerations that should be taken into account when deciding which approach to use:
a) The use of a chaotropic agent, such as formamide or urea, tends to reduce the lifetime of the column.
b) The use of elevated temperature tends to reduce the lifetime of the column
c) Elevating the temperature of the DNAPac PA200 will increase the retention time of the oligonucleotide.
This means that more eluent will be required to elute the oligonucleotide, and thus the amount of salt
eluting with it will be increased
d) Increasing the pH of the eluent will also generally increase retention of oligonucleotides, but in a manner
that allows control of oligonucleotide selectivity.
6.2 Effect of High Temperature and High pH on Column Lifetime
The combination of both high temperature and high pH reduces the useful life of the DNAPac columns, as shown
in the Chart below. DNAPac PA100 is more susceptible to column degradation when the combination of high
temperature and high pH are employed. However, even the DNAPac PA200 shows some phase degradation when
operated at 65
0
C and pH 12, and this combination is not recommended.
Isocratic Col umn Degradation:
Isocratic Column Degradation:
pH 12.4 vs. Temp erature: D NAPac PA100
pH 12.4 vs. Temp erature: D NAPac PA100
1.0
1.0
0.8
0.8
25 °C pH 12
25 °C pH 12
1.0
1.0
0.8
0.8
Isocratic Column Degradation:
Isocratic Column Degradation:
pH 12.4 vs. Temperature: Prototype
pH 12.4 vs. Temperature: Prototype
25 °C pH 12
25 °C pH 12
45 °C pH 12
45 °C pH 12
65 °C pH 12
65 °C pH 12
0.6
0.6
0.4
0.4
45 °C pH 12
45 °C pH 12
Fraction of Initial Capacit
Fraction of Initial Capacit
0.2
0.2
0.0
0.0
0 20 40 60 80 100 120
0 20 40 60 80 100 120
65 °C pH 12
65 °C pH 12
Hours Exposure
Hours Exposure
0.6
0.6
0.4
0.4
Fraction of Initial Capacity
Fraction of Initial Capacity
0.2
0.2
0.0
0.0
0 20 40 60 80 100 120
0 20 40 60 80 100 120
Hours Exposure
Hours Exposure
CHART 10 Summary of Phase Stability in A lkali: DNAPac PA100 vs. PA200
Page 20

DNAPac PA200 Document No. 065036 Page 20 of 25
(
)
6.3 Phosphodiester Analysis
6.3.1 Sodium Perchlorate Eluent S y st ems
The following separation represents a good starting guideline for developing sodium perchlorate (NaClO
based methods for longer oligonucleotides.
In this example, phosphorylated deoxycytosine oligomers, 19 – 24 bases long, were injected onto a DNAPac
PA200 column and eluted according to the conditions listed below. At pH 8, this gradient is effective for
resolving the “full-length” oligonucleotide phosphodiesters, up to 25 bases long, from the n-1 components.
The same gradient of 5 mM NaClO
components between pH 8 and pH 12, using other buffers, e.g., AMPS, Na
Conditions: 22 minute gradient from 70 to 202 mM NaClO
Flow rate: 1.2 mL/minute.
Injection volume: 6 µL.
Sample: 1 A
per mL of eluent can also be used to resolve full length from n-1
4
PO4, etc.
3
mA
260
P(dC)
19-24
min
Time
CHART 11 N, N-1 Separation of Phosphorylated Deoxycytosine Oligomers
/mL solution of phosphorylated deoxycytosine oligomers, Temperature: 25°C
260
in 20 mM Tris buffered eluent at pH 8.
4
)
4
Page 21

DNAPac PA200 Document No. 065036 Page 21 of 25
6.3.2 Sodium Chloride Eluent Systems
The following separation represents a good starting guideline for developing sodium chloride (NaCl) based
methods for longer oligonucleotides.
In this example, deoxythymidine oligomers, 19 – 24 bases long, were injected onto a DNAPac PA200 column
and eluted according to the conditions listed below. At pH 12, this gradient is effective for resolving the “fulllength” oligonucleotide phosphodiesters, up to 25 bases long, from the n-1 components.
The same gradient of 15 mM NaCl per mL of eluent can also be used to resolve full length from n-1
components, between pH 8 and pH 12, using other buffered eluent systems, e.g., Tris, AMPS, Na
PO4, etc.
3
15.0
15.0
Flow: 1.20 ml/min
Flow: 1.20 ml/min
80.0
80.0
80.0
dT22
dT22
dT24
dT23
dT23
dT24
dT21
dT19
dT19
dT21
dT20
dT20
72.0
72.0
72.0
260
260
mA
mA
26.4
26.4
0.0
0.0
1.25M NaCl:
1.25M NaCl:
26.4 %
26.4 %
0.0 5.0 10.0 15.0 20.0 25.0 30.0 35.0
0.0 5.0 10.0 15.0 20.0 25.0 30.0 35.0
Time (min)
Time (min)
26.4
CHART 12 N, N-1 Separation of Deoxyth ymi dine Oligomers
Conditions: 31.5 minute gradient of 330 to 900 mM NaCl in 20 mM NaOH (pH 12.4).
Flow rate: 1.2 mL/minute.
Injection volume: 4 µL.
Sample: 1 A
/mL solution of deoxythymidine oligomers, Temperature: 25°C.
260
Page 22

DNAPac PA200 Document No. 065036 Page 22 of 25
SECTION 7 - DNAPac™ PA200 RESOURCES
This list is not intended to be comprehensive. However, these resources can be used to determine initial conditions for
separations on the DNAPac PA200.
Posters: Available from Dionex Sales Support.
a) Oligonucleotide purity analysis with an improved anion-exchange phase: Selectivity control using pH and
eluent composition. Presented at the Tides 2004 conference in Las Vegas NV, April 25-29, 2004. Authors:
J. R. Thayer
b) Control of oligonucleotide resolution on a new strong anion-exchange column: Optimization using pH and
eluent composition. Presented at HPLC 2004 in Philadelphia PA, June 12-18, 2004. Authors: J. R. Thayer
Victor Barreto, Christopher Pohl, Dionex Corporation, Sunnyvale, CA, USA.
, Victor Barreto, Christopher Pohl, Dionex Corporation, Sunnyvale, CA, USA
,
Page 23

DNAPac PA200 Document No. 065036 Page 23 of 25
SECTION 8 - TROUBLESHOOTING GUIDE
The following instructions will help you to locate and eliminate problems traceable to hardware and chemistry issues. It
also provides a selection of cleanup and reconditioning procedures that have been found effective by users.
Some problems may be related to parts of your experimental protocol (sample contamination, imprecision during
sample transfer, problems during oligonucleotide deprotection, etc.)
8.1 Finding the Source of High System Back Pressure
a) A significant increase in system backpressure may be caused by a plugged inlet frit.
b) Before replacing the inlet bed support assembly of the column, make sure that the column is the cause of
the excessive backpressure.
c) Check for pinched tubing or obstructed fittings from the pump outlet, throughout the eluent flow path to
the detector cell outlet. To do this, disconnect the eluent line at the pump outlet and observe the
backpressure at the usual flow rate. It should not exceed 50 psi. Continue adding components (injection
valve, column, and detector) one by one while monitoring the system backpressure.
• Addition of the 4 x 250 mm DNAPac PA200 should add no more than 2400 psi back pressure at 1
mL/min.
• Addition of the 4 x 50 mm DNAPac PA200 should add no more than 1000 psi back pressure at 1
mL/min.
No other component should add more than 100 psi (0.7 MPa) to the system back pressure.
NOTE:
8.2 Backpressure on Column Has Increased
Inclusion of solvent to eluent will often increase column backpressure by 10-30%.
The DNAPac PA200 (4 x 250 mm) operates at < 2400 psi at 1 mL/min in the absence of solvent. If the high
backpressure is due to the column, first try cleaning the column.
If the high backpressure persists, replace the column bed support. Note the color of the original bed support. If the
inlet side of the used bed support is discolored (light brown to grey-black) metal contamination is the primary
suspect. Metals in non-inert systems are susceptible to corrosion by the halide eluent systems used on the DNAPac
PA200 columns. The presence of metals on the frits suggests that considerable fouling by metals may have
occurred. Metal fouling can cause increased backpressure, loss of efficiency, and changes in selectivity on DNAPac
columns.
To eliminate metal fouling, Dionex strongly recommends the use of inert “PEEK-based” pumping systems (e.g.,
Dionex GP50), PEEK tubing, and connected fittings.
8.3 Decreasing Peak Retention Times
Eluent contaminants may be decreasing the capacity of the column. Use de-ionized water with a specific resistance
of 18.2 megohm-cm. Sterilize by filtering through a 0.2-µm, or 0.45-µm filter. Also, check for changes in eluent
concentration and pH. If column cleanup and use of clean fresh eluents fail to restore retention, the column cleanup
process, later in this section, should be performed.
8.4 Decreasing Peak Efficiency and Resolution
a) If changes to the system plumbing have been made, check for excess lengths of tubing, larger than normal
tubing diameter and leaks.
b) The column may be fouled. Perform a column cleanup procedure.
c) The column may have been subjected to pressures above 4000 psi (34.5 MPa), causing irreversible bed
compression. This requires column replacement.
Page 24

DNAPac PA200 Document No. 065036 Page 24 of 25
8.5 Poor Peak Efficiency and Resolution
Try alternate eluents such as NaClO4. If this fails to improve matters, try operating under denaturing conditions.
8.6 Unidentified Peaks Appear
a) Intra- or intermolecular oligonucleotide associations may cause unidentified peaks. Operate under
denaturing conditions.
b) The sample may be degrading. When appropriate, check for nucleotide degradation and
dephosphorylation.
c) The eluents may be contaminated. Prepare new eluents using fresh deionized filtered water.
8.7 Decreased Detection Sensitivity
Detection sensitivity may be caused by sample degradation, column degradation leading to increased peak width
(lower peak height), or limitations to light throughput in the absorbance detector (e.g., dirty or improperly installed
flow cell, near failure of D
lamp).
2
8.8 Column Problems CAUTION:
To determine if the column set is the source of the high background replace the column with a section of PEEK
tubing. If the background reading returns to normal after the columns are replaced then the column was the cause.
The guard column protects the main column not only from contamination but also from
excessive pressure fluctuations caused by the instrument or by operator errors. Have the
guard column installed at all times. To prevent accidental over pressure, disconnect the guard
column only during troubleshooting described in this section, or when priming the pump.
8.9 Peak Efficiency and Resolution Are Decreasing
Peak deformations may sometimes be caused by sample matrix. Always have a spare guard available
a) Run a standard separation with the Guard column removed from the system. If the separation improves
with the old Guard removed, install a new Guard column. It is quite common to replace the Guard column
several times during the lifetime of the analytical column.
b) Verify that 0.01” ID or smaller tubing is installed for all connections between injector and detector (for
Dionex tubing, black = 0.010”, red = 0.005”, and yellow = 0.003” ID. For Upchurch/Scivex tubing, yellow
= 0.007” ID)
c) Verify that the shortest possible length of 0.010” I.D. tubing (black) is installed between the column and
detector.
d) Check for proper installation of ferrules on all PEEK tubing, starting with the injector outlet and all other
connectors to the detector cell inlet.
e) Check temperature settings in your method and/or the actual temperature in your column oven.
f) The column may be overloaded. Try a smaller injection volume, or reduced sample concentration.
g) If all of the above does not lead to an improved separation, the resin bed of the main separator column has
been damaged and column must be replaced.
8.10 System Problems
8.10.1 High Detection Background Caused by the System
a) Verify the problem is not related to the detector or column.
b) Prepare new eluents with freshly filtered deionized water.
c) Rinse all eluent lines with the new eluents (at least 40mL using the priming syringe)
d) If new eluent introduces high background without the column set installed, your deionized water
source, or eluent components have become contaminated.
Page 25

DNAPac PA200 Document No. 065036 Page 25 of 25
8.10.2 No Peaks, Poor Peak Area Reproducibility or Unexpectedly Small Peak Area.
a) Check the position and filling levels of sample vials in the autosampler.
b) Check injector needle-height setting.
c) Check each line of the schedule for proper injector parameters. Employ full loop methods if other
injection modes (partial loop fill) do not provide acceptable reproducibility.
d) Service the injection valve (check for leaks, rotor fragments, or sediments inside the valve)
e) Check sampling needle for bits of vial septa clogging the flow path.
8.10.3 Incorrect or Variable Retention Times
a) Check your eluent preparation procedure for possible errors.
b) Prime the pump if necessary.
c) Measure the flow rate by weighing out the eluent collected during exactly five minutes of flow.
Recalibrate the pump if necessary.
d) Set the eluent composition for 100% for each eluent and draw out at least 40mL of eluent from each
of the lines to verify pump is primed.
e) Check and/or service the pump’s proportioning valve. With the pumping turned off, the flow through
the pump outlet tubing (disconnected from the injector) should be zero in all eluent positions. Check
this separately for each eluent line.
8.11 Column Cleanup
If contamination of the column, the most common cause of column-contributed high background signal and loss of
retention, is suspected the column can be cleaned with the following processes:
8.11.1 High Salt Wash to Remove Ionic Components
This cleanup procedure should be performed when component retention decreases. This solution will
protonate most organic acids (1 mM HCl = pH 3). The NaClO
will still be largely ionized so it will elute the
4
organic acids. The solvent will aid in removing components bound primarily by hydrophobic interactions
a) Rinse column with 15 volumes (~ 50 mL) of deionized water.
b) Wash column with 15 volumes (~ 50 mL) of a solution containing:
0.4 M NaClO
4
1 mM HCl
30% CH
CN
3
c) Rinse column with 15 volumes (~ 50 mL) of deionized water.
d) Regenerate column with 1 volume (~ 3 mL) of high concentration eluent used for column wash at the
end of each chromatographic run.
e) Equilibrate column with 2 volumes (~ 6 mL) of eluent used at the start of each chromatographic run.
8.11.2 Organic Solvent Wash to Remove Non-Ionic Components
Use this approach when band broadening without loss of retention occurs, or when the background signal is
elevated. This solution will elute neutral compounds bound primarily by hydrophobic interactions (e.g., nonionic detergents).
a) Rinse column with 15 volumes (~ 50 mL) of deionized water.
b) Wash column with 15 volumes (~ 50 mL) of 100% CH
CN.
3
c) Rinse column with 15 volumes (~ 50 mL) of deionized water.
d) Regenerate column with 1 volume (~ 3 mL) of high concentration eluent used for column wash at the
end of each chromatographic run.
e) Equilibrate column with 2 volumes (~ 6 mL) of eluent used at the start of each chromatographic run.
 Loading...