

Dialog Semiconductor DA852 Series, DA8521-00-BC-1, DA8522-00-BD-1, DA8523-00-BE-1, DA8524-00-BF-1 User Manual

Display Controllers
© Dialog Semiconductor 2008. All rights reserved.
User Guide Release 2.0
DA852X E Ink Evaluation Kit
1 Summary
This document describes the hardware and software produced by Dialog Semiconductor to allow users to evaluate E Ink
segmented displays along with the DA852X family of driver ICs from Dialog Semiconductor. The system is designed with
the following objectives:
• To assess the suitability of the E Ink technology for a given product concept,
• To quickly evaluate the performance of the display (for example, in terms of its contrast ratio, look
and feel, and transition speed),
• To design the display (particularly its size, segmentation, and other parameters),
• To evaluate different driving waveforms, and
• To start the design of the software for the microcontroller being used in the system.
The software uses a PC operating Windows 2000/XP with a USB1.1 or USB2 interface. The software has not been
extensively tested on Windows Vista, but has been shown to function. See Section 3.1.2
1.1 Product Lineup
The DA852X E Ink Evaluation Kit series has been produced to allow evaluation of the DA852X series drivers
These currently comprise:
Product Lineup
Device P/N Description Package Evaluation Kit
P/N
DA8521-00-BC-1 64 segments 80-pin 5x5mm VTLGA DA8521-eval
DA8522-00-BD-1 96 segments 112-pin 6x6mm VTLGA DA8522-eval
DA8523-00-BE-1 192 segments 208-pin 12x7mm VTLGA DA8523-eval
DA8524-00-BF-1 256 segments 272-pin 20x10mm VTLGA DA8524-eval
All kits include a CD ROM containing documentation and driver files. The driver software uses a simple graphical
interface, allowing the DA852X series board to be controlled via a USB port of a PC. The software is the same for all the
different kits.
1.2 Feedback/Contact Details
We welcome feedback of all types in order to make this kit and User Guide accelerate your project development. Please
direct any comments, questions, support issues or general remarks, to the Display Driver Applications Department at
Dialog Semiconductor, contact details below:
Contact: Display Driver Applications Department
Company: Dialog Semiconductor
Address: Windmill Hill,
Whitehill Way,
Swindon. SN5 6PJ.
UK
Telephone: +44 1793 875327
Fax: +44 1793 875328
E-mail: EPDsupport@diasemi.com
All brand and product names are trademarks or service marks of their respective owners. Printed in Europe.
DA852x-UG02-608 Page 1 of 47

© Dialog Semiconductor 2008. All rights reserved.
Display Controllers
User Guide Release 2.0
DA852X E Ink Evaluation Kit
1 SUMMARY...........................................................................................................1
1.1 Product Lineup.....................................................................................................1
1.2 Feedback/Contact Details....................................................................................1
2 HARDWARE.........................................................................................................5
2.1 DA852X Evaluation Board....................................................................................5
2.1.1 USB Connector...................................................................................................5
2.1.2 Power Supplies...................................................................................................5
2.1.3 Jumpers..............................................................................................................5
2.1.4 Expansion Input..................................................................................................6
2.1.5 Expansion Output...............................................................................................6
2.1.6 Flex Connection..................................................................................................7
2.1.7 Output Connectors..............................................................................................7
3 SOFTWARE.........................................................................................................9
3.1.1 Release Notes....................................................................................................9
3.1.2 Installation..........................................................................................................9
3.1.3 Control Panel....................................................................................................11
3.1.4 Interface Description.........................................................................................12
3.2 Common Controls..............................................................................................12
3.2.1 Device Type......................................................................................................12
3.2.2 Top Plane Connection(s)..................................................................................12
3.2.3 Field Connection(s)...........................................................................................12
3.2.4 Status Message................................................................................................12
3.2.5 USB OK? Indicator...........................................................................................12
3.3 DA852X Panel.....................................................................................................12
3.3.1 Direct Control....................................................................................................13
3.4 Parameter Control Panel....................................................................................13
3.4.1 Waveform Selection..........................................................................................15
3.4.2 File Menu..........................................................................................................16
3.4.3 Toolbar.............................................................................................................17
3.4.4 Image Controls.................................................................................................18
3.4.5 Image Information.............................................................................................20
3.5 File Formats........................................................................................................21
3.5.1 The Configuration Files.....................................................................................21
3.5.2 The Image File..................................................................................................22
3.5.3 The Map File.....................................................................................................23
3.5.4 The Slide File...................................................................................................24
3.5.5 Slide file names for numbers and alphanumerics..............................................25
All brand and product names are trademarks or service marks of their respective owners. Printed in Europe.
DA852x-UG02-608 Page 2 of 47

© Dialog Semiconductor 2008. All rights reserved.
Display Controllers
User Guide Release 2.0
3.5.6 Number Entry...................................................................................................25
3.5.7 Alphanumeric Entry..........................................................................................26
3.6 Programming Information..................................................................................28
3.6.1 Decode states to provide drive waveform.........................................................29
3.6.2 Creating a Hex string from state outputs...........................................................30
3.6.3 Decode a hex string to state array....................................................................30
DA852X E Ink Evaluation Kit
4 TUTORIAL – A MEMORY GAUGE EXAMPLE..................................................31
4.1 Connecting the Display Hardware.....................................................................31
4.2 Creating a New Project.......................................................................................33
4.3 Top Plane Connection........................................................................................34
4.4 Load Image of Display........................................................................................34
4.5 Mapping the Segments......................................................................................35
4.6 Creating the Map File.........................................................................................36
4.7 Creating a Slide Show........................................................................................39
5 WAVEFORM PHASE TABLE............................................................................40
6 CASCADE CONNECTION.................................................................................43
7 FLEX CONNECTION..........................................................................................44
8 TROUBLESHOOTING.......................................................................................45
8.1 Software issues..................................................................................................45
8.2 Hardware Issues.................................................................................................45
9 RELEASE NOTES FOR VERSION 2.0..............................................................46
All brand and product names are trademarks or service marks of their respective owners. Printed in Europe.
DA852X-UG02-608 Page 3 of 47

© Dialog Semiconductor 2008. All rights reserved.
Display Controllers
User Guide Release 2.0
DA852X E Ink Evaluation Kit
Notices
Dialog Semiconductor provides this evaluation kit (the “product”) for engineering evaluation purposes only. It is not
considered suitable for use in end products.
This product contains static sensitive devices and care should be taken that it is handled appropriately to avoid damage
from electrostatic discharge. Dialog Semiconductor does not assume responsibility for the safe handling of the product
after it has been delivered and subsequent disposal.
As a prototype the product has not been subject to any regulatory approval (CE, FCC, etc.) and may not meet the
technical requirements from such bodies for electromagnetic compatibility. Dialog Semiconductor does assume
responsibility for such compliance.
Whilst care has been taken in the design of the product, Dialog Semiconductor assumes no liability from the user for any
indirect, incidental or consequential damages resulting from use of the product or from applications assistance given in
support of the product.
Dialog Semiconductor reserves the right to alter without notice the specification, design, price or condition of sale of this
product.
Before using the product we recommend that the user reads both the guide and the product datasheet to familiarise
themselves with the operation of the product.
Maximum supply voltages for this product are defined within this guide; operation outside these voltages may result in
permanent damage to the product. Applying loads outside the range specified in this guide or the product datasheet may
also result in permanent damage. It is possible that during operation with high load currents or voltages being applied,
some components may operate at an elevated temperature. Care should be exercised when touching components on
the board in such circumstances.
All brand and product names are trademarks or service marks of their respective owners. Printed in Europe.
DA852x-UG02-608 Page 4 of 47
© Dialog Semiconductor 2008. All rights reserved.
Display Controllers
User Guide Release 2.0
DA852X E Ink Evaluation Kit
2 Hardware
2.1 DA852X Evaluation Board
The DA852X Evaluation Board comprises the DA852X device, a USB bridge for PC communication with the device, and
a few external active components to reduce the requirement for external equipment. The device U3 is a level shifter,
used to move the digital control signals from the 3.3v domain to the chip supply domain.
The board can be used flexibly with external hardware, and can accept connections from an external microcontroller.
The board is designed to be cascadable with other DA852X boards, to allow connection of large displays with more than
256 segments.
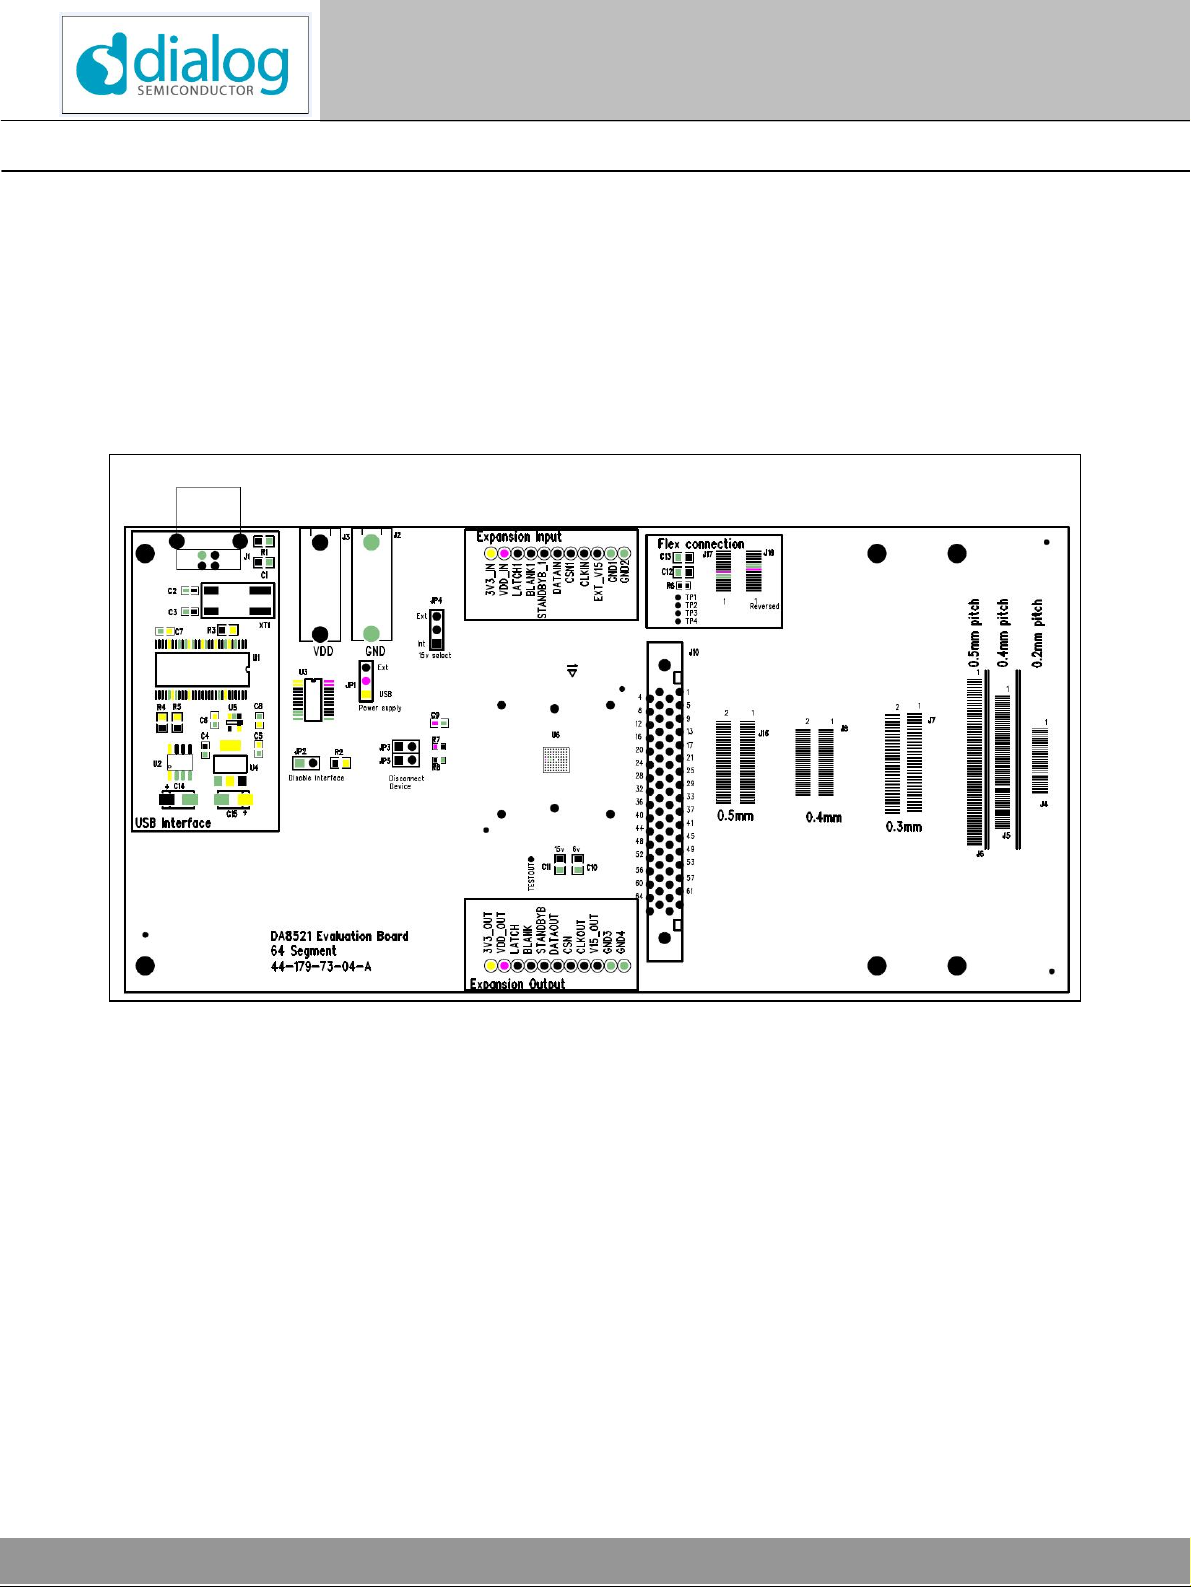
Figure 1. DA8521 PCB layout
The hardware solution is based upon PCBs numbered 44-179-73-04/05/06/07-A for the 64, 96, 192 and 256 segment
driver devices respectively.
2.1.1 USB Connector
The USB interface is used to control the board from the PC. The USB interface may also be used to power the board.
The USB interface consumes approximately 50ma in the standby state.
2.1.2 Power Supplies
The board is intended to be supplied by a single 1.8v-3.3v supply attached to the two 4mm banana sockets marked
VDD and GND.
It may also be powered with 3.3v directly from the USB interface by setting jumper JP1 to the USB position. Note: If JP1
is set to the External position, VDD should be powered before, or as soon as possible after the USB lead is plugged in.
2.1.3 Jumpers
JP1 This will connect VDD to the 3.3v supply generated by the USB module.
All brand and product names are trademarks or service marks of their respective owners. Printed in Europe.
DA852X-UG02-608 Page 5 of 47

© Dialog Semiconductor 2008. All rights reserved.
Display Controllers
User Guide Release 2.0
JP2 Removing this disables the digital I/O signals from the level shifter to the DA852X. This allows direct access and
control of the chip from an external controller via the expansion input pins
JP3 Removal of this disables the Chip Select signal to the DA852X device. This would only be done if using the
external Flex connection.
JP5 Removal of this disables the StandbyB signal to the DA852X device. This would be done if the device is using
an external 15v supply, or is being operated as a slave cascaded device.
JP4 Selects the 15volt supply either from the internal charge pump, or from the EXT_V15 pin.
The normal positions of the jumpers are as shown below in red:
DA852X E Ink Evaluation Kit
Figure 2. Normal Position of Jumpers
2.1.4 Expansion Input
This series of test points can be used to
• Monitor the control signals from the USB interface
• Transmit the signals to external hardware (e.g. the DA852X device mounted onto a flexible PCB).
• Allow an external microcontroller to provide the control signals to the DA852X device. (Remove JP2)
• Accept the signals from the Expansion Output port of another DA852X board. (Remove JP2)
• Note that CSN1 is Active High, labelling on the PCB is incorrect
2.1.5 Expansion Output
This series of test points can be used to
• Monitor the control signals from the USB interface
• Send the control signals to the Expansion Input port of another DA852X board.
• Note that CSN is an Active High output, labelling on the PCB is incorrect.
Note that the signals DATAOUT and CLKOUT are different from the Expansion Input port. These are passed from the
DATAOUT and CLKOUT pins of the DA852X device and allow cascade connection of devices
The 3V3_OUT power supply is intended to supply the USB interface components of the second board, which will not be
plugged into the USB port.
All brand and product names are trademarks or service marks of their respective owners. Printed in Europe.
DA852x-UG02-608 Page 6 of 47

© Dialog Semiconductor 2008. All rights reserved.
Display Controllers
User Guide Release 2.0
2.1.6 Flex Connection
The connectors J17 and J18 have 16 connections on a 0.5mm pitch. This is intended to connect via a suitable FPC
socket or direct connection to an assembly which contains both the display surface and the driver device mounted on a
flex PCB.
2.1.7 Output Connectors
The segment outputs from the DA852X device are routed to a series of parallel-connected interfaces. Note that ALL
connectors are numbered from 1 upwards, whereas segment outputs are numbered from 0 upwards. That is connector
pin 1 is driven by DA852X signal DD0 and connector pin 20 is driven by DA852X signal DD19.
It is anticipated that the E Ink Display has a flexible tail of at least 4mm, with a pitch down to 0.2mm. Some will be
intended for direct-to-board bonding using ACF material, others will be intended to connect via an inline or low profile
FPC socket. It is not possible for us to predict all the possible variations, so we have allowed for the following:
0.2mm pitch FPC connection direct-to-board
0.4mm and 0.5mm FPC connection direct-to-board or socket (64,96 output versions only).
0.3mm narrow pitch connector with staggered pins. This gives 0.6mm pitch on solder pins
0.4mm and 0.5mm narrow pitch connector with in-line pins (64,96 output versions only).
1.27mm IDC sockets for connection via ribbon cable.
Typically, inline FPC sockets, for direct insertion of the FPC tail, are available for up to about 70 ways. Low profile
sockets, using complementary mating halves on PCB and flexible tail, are available for up to about 160ways. Typical
manufacturers are JAE, Panasonic, Hirose, Molex etc.
DA852X E Ink Evaluation Kit
These connections are present on both sides of the PCB, allowing for top-side and bottom side connections. However, if
the display in use has the connections on the same side as the visible surface, it should be appreciated that part of the
display may be masked by the PCB if the flexible tail is short, as it is not possible for all the connector positions to be at
the edge of the PCB.
For such a display, there are several solutions:
a) Connect the display to the top side connectors and bend the display to make the display surface visible. The
user should take care to avoid cracking of the flexible tail.
b) Add an extender PCB (flexible or rigid) to extend the tail
c) Use an FPC socket (if available) with top side contacts.
d) Make or purchase an interface PCB to convert from FPC to wired or Insulation Displacement connector, and
use the IDC connections on the board.
Device type DA8521 DA8522
Outputs 64 96 192 256
Board no 44-179-73-04-A 44-179-73-05-A 44-179-73-07-A 44-179-73-07-A
Connectors 0.2mm FPC 0.2mm FPC 0.2mm FPC 0.2mm FPC
0.4mm FPC 0.4mm FPC
0.5mm FPC 0.5mm FPC
0.3mm skt 0.3mm skt 0.3mm skt 0.3mm skt
0.4mm skt 0.4mm skt 0.4mm skt
0.5mm skt 0.5mm skt
68 way 1.27mm 100 way
1.27mm
DA8523 DA8524
3x68 way
1.27mm
4x68way
1.27mm
All brand and product names are trademarks or service marks of their respective owners. Printed in Europe.
DA852X-UG02-608 Page 7 of 47

© Dialog Semiconductor 2008. All rights reserved.
Display Controllers
User Guide Release 2.0
The 1.27mm pitch IDC sockets we have chosen are the TX3 pin header series from JAE, which use the TX2 series IDC
sockets for flat ribbon cable. These are available from several suppliers. Other connectors compatible with the PCB
footprint are available (e.g. www.gtk.co.uk, www.hirose.co.jp).
Device type DA8521 DA8522
Outputs 64 96 192 256
Board no 44-179-73-04-A 44-179-73-05-A 44-179-73-07-A 44-179-73-07-A
Connector 68 way 1.27mm 100 way
1.27mm
Part number TX3-68P-D2ST-
LN1E
Distributor Farnell 996-4940 Farnell 996 RS 509-9077 RS 509-9099 RS 509-9077 RS 509-9077
Mating IDC TX2-68S-D2P1-
1CE
RS 509-8939 Farnell 996-
TX3-100PD2ST-LN1E
4967
TX2-100SD2P1-1CE
4860
DA8523 DA8524
3x68 way
1.27mm
TX3-68PD2ST-LN1E
Farnell 9964940
TX2-68SD2P1-1CE
RS 509-8939 RS 509-8939
DA852X E Ink Evaluation Kit
4x68way
1.27mm
TX3-68P-D2STLN1E
Farnell 9964940
TX2-68S-D2P11CE
All brand and product names are trademarks or service marks of their respective owners. Printed in Europe.
DA852x-UG02-608 Page 8 of 47

© Dialog Semiconductor 2008. All rights reserved.
Display Controllers
User Guide Release 2.0
DA852X E Ink Evaluation Kit
3 Software
The E Ink Evaluation Kit software allows you to activate and deactivate the segments of the target display using a user
friendly graphical user interface. This section describes version 2.0 of the software.
3.1.1 Release Notes
Version 2.0 has been upgraded extensively from earlier versions, with a new image interface. Several new features have
been added, such as Inverse mode, and Waveform definitions to control the look and operation of the display transitions.
Alphanumeric and numeric entry have been simplified, and the ability to modify recorded sequences included.
Compatibility of sequence and initialisation files is retained, except for embedded special codes which have changed
slightly. See details below in Section 9.
3.1.2 Installation
Insert the CD containing the software. If the installation does not start automatically, run the program ‘setup.exe’ from the
CD containing the software. (This will be found in the directory ‘Software’ on the CD). An automated script will install the
program on your PC. By default, the directory C:\ Dialog Semiconductor\Display Controllers\DA852X will be used to
(hopefully) be more compatible with Windows Vista.
Plug in the USB cable, and Windows will detect the USB device. It will prompt for the drivers, which should be
automatically located on the root directory of the CD. The setup file is Dlgezusb.inf.
The following images show the procedure step by step.
First step - Select “No, not this time” then “Next” Second step – Select “Install automatically”
All brand and product names are trademarks or service marks of their respective owners. Printed in Europe.
DA852X-UG02-608 Page 9 of 47

© Dialog Semiconductor 2008. All rights reserved.
Display Controllers
User Guide Release 2.0
Third step – Select Dialog USB Driver Fourth step – “Continue Anyway”
DA852X E Ink Evaluation Kit
Fifth step – (not always produced) If prompted, select Sixth Step – Select “Finish”.
D: (or your CDROM drive letter)
All brand and product names are trademarks or service marks of their respective owners. Printed in Europe.
DA852x-UG02-608 Page 10 of 47

© Dialog Semiconductor 2008. All rights reserved.
Display Controllers
User Guide Release 2.0
If installed correctly, Dialog USB Driver (EZUSB) should be listed on Device Manager as shown above.
If you are using Windows XP, you may get a message saying that a USB2 device is attached to a USB1.1 port. This can
safely be ignored.
To uninstall the software please use the Windows ‘Add/Remove Programs’ function that can be found under ‘Start’-
>’Settings’->’Control Panel’.
Note: This procedure may need to be repeated if the USB Interface is plugged into a different USB Port. This is a
“feature” of Windows, which identifies a USB driver as “belonging” to the port on which it was installed.
The software has not been tested extensively on Windows Vista, but no problems have been identified with the software
or device driver installation. If the software is installed into the “Program Files” directory, it may not be possible to edit
text files, since these are “virtualised” into the Users home folder. The software will (probably) require an administrator
privelige to install.
3.1.3 Control Panel
Run the “DA852X” program by clicking the shortcut in the Start menu Start>Programs>Dialog Semiconductor>Display
Controllers>DA852X_nnn.exe (where nnn is the latest version number). The best setting for the PC display size is
1024x768 pixels.. It is important to note that a display size other than the recommended setting may affect the way in
which the panels appear. It will operate with both normal and large fonts.
DA852X E Ink Evaluation Kit
Figure 3. Initial Interface
All brand and product names are trademarks or service marks of their respective owners. Printed in Europe.
DA852X-UG02-608 Page 11 of 47

© Dialog Semiconductor 2008. All rights reserved.
Display Controllers
User Guide Release 2.0
3.1.4 Interface Description
The interface comprises three tabbed panels, DA852X, Image, Parameter Control Panel and some common controls
Device Type, Top Plane Connection(s), Field Connection(s), Status Message, and USB indicator.
The interface has file menu items, toolbar icons and keyboard shortcuts for many of the common functions.
Hovering the mouse over controls on the selected panel produces floating “tooltip” text with helpful descriptions of the
controls.
DA852X E Ink Evaluation Kit
3.2 Common Controls
3.2.1 Device Type
This pulldown menu selects a current Project, or allows the creation of a new User Project. We have pre-defined the first
4 and included data appropriate to those device sizes.
The user will normally select “Add Item”, (or alternatively select “New Project” on the File Menu, or “Start a New Project”
on the toolbar ), provide a meaningful project name, and provide the number of output segments in use for that project.
This number can be more (implying a cascade connection) or less that the outputs available on the chip.
A subdirectory under the Data directory is created to hold all the information relevant to this project.
Once a project has been created, it is added to the pulldown menu, and will be reloaded whenever the software is
started.
3.2.2 Top Plane Connection(s)
The user must manually enter the output connected to the top plane connection. Usually this is easily available from the
documentation provided with the display panel and by inspection of the display panel to PCB interface. If not, it can be
deduced, see Tutorial.
Where the physical display has multiple connection tabs, it is possible that each tab has a connection to the top plane
and field (background). If each tab were connected to an Evaluation board, two outputs with opposite phase could be
shorted out. Therefore the software allows multiple top planes to be entered, e.g. “63,127,191”. All these outputs will then
switch in synchronism.
3.2.3 Field Connection(s)
Entering information here is optional, but if multiple top plane connections above are being used, this allows mutiple field
connection to be entered also. The connections entered will switch together always.
3.2.4 Status Message
This message box will display the current mode of the software. This is especially useful to communicate Map entry and
zoom modes.
3.2.5 USB OK? Indicator
A green light here shows that the USB interface is functioning correctly.
If offline mode is in use (offline=1 in [Setup] section of DA852X.ini) then the system will temporarily go online and operate
the hardware if available. The offline mode is not cancelled, however, so a restart of the software will return to offline
mode.
3.3 DA852X Panel
This is the simplest interface to the attached panel, showing the current state of the segments. The number of segments
shown reflects the size of the device selected. For large numbers of segments, scroll bars appear to allow access to the
higher numbers.
All brand and product names are trademarks or service marks of their respective owners. Printed in Europe.
DA852x-UG02-608 Page 12 of 47

© Dialog Semiconductor 2008. All rights reserved.
Display Controllers
User Guide Release 2.0
The software operates by keeping track of the state of the panel, i.e. which segments are black and which are white.
Operation of the segment controls, image interface and sequences results in a change from an old_state to a
new_state, under control of a wavefrom selection, which affects how the transition looks. Upon completion of the
transition, new_state is copied to the old_state. The state of a segment does not indicate whether its physical output
connection is high or low.
3.3.1 Direct Control
Clicking on any control will turn that segment dark or light. If the display has been mapped, the appropriate segment will
be shown in the small thumbnail image alongside the controls.
Please note that these states do not necessarily indicate the output voltage of the segment outputs.
The segment designated as the top plane connection, or connections, are greyed out and cannot be activated
separately. It will, however, be controlled by the software.
If you have not used the software before, the device type selected will be DA8521 (a 64 segment device). An image of a
suitable E Ink display appears alongside.
3.3.1.1 Direct Input
The Direct Input box allows entry of a string of hex digits representing the individual states. The length of this string
should be number of states/4 . If the length of the string entered is less than this, the characters entered will affect the
lowest numbered states. The length of the string that can be entered is limited automatically to number of states/4 .
This box has a few practical uses, such as providing a fast way of filling all or part of the image (e.g. enter FFFFFF…
until the entry limit is reached), or entering a string that is cut-and-pasted from the user’s own software to verify correct
operation during system development.
DA852X E Ink Evaluation Kit
3.3.1.2 Hex equivalent
The Hex equivalent box shows the current output state expressed in hexadecimal. It can be useful during software
development to cut-and-paste this string into external software.
3.4 Parameter Control Panel
This is used to adjust settings which affect the appearance of the panel between state changes , to change slideshow
and signal timings and to access test features.
All brand and product names are trademarks or service marks of their respective owners. Printed in Europe.
DA852X-UG02-608 Page 13 of 47

© Dialog Semiconductor 2008. All rights reserved.
Display Controllers
User Guide Release 2.0
DA852X E Ink Evaluation Kit
Figure 4. Parameter Control Panel
The user is able to adjust display control timings, and activate the charge pump for a longer period to make
measurements etc.
Clock Period This adjusts the timing of the serial interface. A clock period of 5 will result in each bit being transmitted
at a rate of 1.14Mb/s (250ns+5x125ns). The maximum rate using this software is 4Mb/s. The value
should should be adjusted to the minimum value consistent with correct transfer across the hardware.
Standby Delay This adjusts the amount of time that the 15volt generator is allowed to charge to its final value before
data is sent and the display is enabled. A typical figure is 20ms for VDD=3.3v. It is only required that
the output voltage has reached its working voltage before the display is enabled. This can be verified
on an oscilloscope by monitoring pins BLANK and V15_OUT.
Standby Extend This adjusts the amount of time that the 15v generator is enabled after the transition is complete. This
should be small, and can usually be zero to conserve power.
Sequence Update Rate This sets the rate at which new sequences are displayed when in “Loop” mode. This control
can be updated from within sequence files (see Section “The Slide File “).
StandbyB Switching this to the “Always On” position allows the charge pump to be enabled for the period shown
in the box below. It will revert back at the end of the period. This is for protection of any attached
display, to avoid power being applied for a prolonged period. This control is only used during
development, investigating parameters such as the level of 15v ripple.
All brand and product names are trademarks or service marks of their respective owners. Printed in Europe.
DA852x-UG02-608 Page 14 of 47

© Dialog Semiconductor 2008. All rights reserved.
Display Controllers
User Guide Release 2.0
Output Enable This will override the programmed Enable Period to enable the output drive permanently. This allows
measurment and inspection of the output drives during development.
Dialog Test Allows access to internal test modes and automated test for Dialog Semiconductor use. Requires
password which will not normally be provided.
Export Current Phase Table This will generate a text file containing the current phase table.
See Section 5 Waveform Phase Table
3.4.1 Waveform Selection
Each tab contains the parameters necessary to control 6 different predefined types of transition appearance, and one
type which can be defined by the user, see 5 Waveform Phase Table. Selecting a tab changes the state transition to that
mode. The mode selection is stored in the project configuration file.
The waveform can be changed temporarily (i.e. not stored in the configuration file) under control of sequence events, see
section 3.5.4 “The Slide File”.
Detailed selection of the parameters will not be covered in this section.
The user should ensure that the parameters T0, T1 and P0 are long enough to allow complete switching of the segment.
If the values are too short, a grey level will be produced. The default is 280ms.
The types are:
DA852X E Ink Evaluation Kit
Local White then Black This is a local update waveform. Only the pixels that have a different ending state from their
starting state switch.
The black-to-white (B->W) transition happens before the white-to-black (W->B) transition. This waveform is useful for
non-flashy updates; however, repeated updates or long dwell times in between updates may cause image artifacts.
Local Black then White This is a local update waveform. Only the pixels that have a different ending state from their
starting state switch. This is better used for inverse mode operation.
The black-to-white (B->W) transition happens before the black-to-white (B->W) transition. This waveform is useful for
non-flashy updates; however, repeated updates or long dwell times in between updates may cause image artifacts.
Slideshow White
This is a slide show waveform. Every transition travels through white.
This waveform gives a clean transition appearance when switching characters. This is useful to use when updating
alphanumeric displays since it completely erases the old information before the new information is displayed. This is
recommended for use with white backgrounds.
Slideshow Black This is a slide show waveform. Every transition travels through black.
This waveform gives a clean transition appearance when switching characters. This is useful to use when updating
alphanumeric displays since it completely erases the old information before the new information is
displayed. This is recommended for use with inverse mode operation.
Global White then Black This is a global update waveform. All pixels switch during a transition.
The display will switch to white then to black, before displaying the final image. This waveform is useful to clear image
artifacts from the display. With optimal settings, it provides the best image performance.
Global Black then White This is a global update waveform. All pixels switch during a transition.
The display will switch to black then to white, before displaying the final image. This waveform is useful to clear image
artifacts from the display. With optimal settings, it provides the best image performance for inverse mode operation.
User Defined This allows the user to import his own phase table (see 5 Waveform Phase Table). The transition will be
shown as a waveform or bi-level view. This is obviously an advanced function, but can be useful during system
development.
All brand and product names are trademarks or service marks of their respective owners. Printed in Europe.
DA852X-UG02-608 Page 15 of 47

© Dialog Semiconductor 2008. All rights reserved.
Display Controllers
User Guide Release 2.0
The waveforms are shown in two possible modes:
Wave Mode shows the drive waveform in differential mode. This is the voltage difference between the segment and the
top plane connections. A positive value drives the segment towards black, and a negative value drives the segment
towards white. The assumption here is that the top plane is always zero.
This visualisation of the transition can be the easiest to see the effect of parameter changes.
Note that the device drivers does not use negative voltages, so these waveforms are conceptual.
Bilevel Mode shows the waveform as logic values, and includes control over the top plane. This mode is closest to what
is actually ocurring at the device driver pins. This mode is useful to create and visualise custom phase tables (see
Appendix 2) as the order of the state changes (W-B, B-W, W-W, B-B, TP) are the same as those in the phase table.
3.4.2 File Menu
File>New Project Keyboard shortcut Ctrl+N . Prompts the user for a project name and number of outputs.
Creates directory for project name, and .ini configuration file to store changes.
File>Open Project Keyboard shortcut Ctrl+O. Displays a list of current projects, allowing selection of new
project.
File>Import Project Allows an existing directory to be added to the Project list. This might be a project previously
deleted, or a directory manually copied from another location. The directory must contain an
.ini file with the same name as the directory.
DA852X E Ink Evaluation Kit
File>Copy Project Allows the creation of a copy of the existing selected project with a new name. This is
especially useful to allow a different set of slide files to be selected, or a different map file to
link to different hardware.
File>Delete Project Displays a list of current projects. Select to the left of a project to delete that project from the
list.
A prompt box allows cancelling of the selection if performed in error, with a final confirmation
afterward.
File>Load Image Keyboard shortcut Ctrl+I. Opens a dialog box to select an existing Windows Bitmap (.bmp)
image, which should reside in the project directory. Right-clicking here allows various
navigation and copy-paste activities.
File>Load Map Keyboard shortcut Ctrl+P. Opens a dialog box to select an existing map file (.map). For a new
project this would not exist, but it could be a copy of an existing file for a similar project. Rightclicking here allows various navigation and copy-paste activities.
File>Export Phase Table This writes the current phase table to a selected file. This phase table may be modified to
achieve a new transition appearance or to remove display artifacts. See Section 5.
File>Reset Display This resets the display by ignoring its current state, and setting the display to all-white, all-
black, then all-white again. This is performed if development and testing has resulted in grey
or partially on segments which cannot be cleared by a View>Clear command.
The Reset command will usually result in a white display again. Repeat if necessary.
If the Invert Mode has been set, the display will finish in the black state.
File>Exit Keyboard shortcut Alt+F4. Shuts down the software, leaving the display intact.
All brand and product names are trademarks or service marks of their respective owners. Printed in Europe.
DA852x-UG02-608 Page 16 of 47

© Dialog Semiconductor 2008. All rights reserved.
Display Controllers
User Guide Release 2.0
Map>Load Number Offset File This specifies the number offset file to be used to facilitate simple entry of numbers on
the display
Map>Load Alpha Offset File This specifies the alphanumeric offset file to be used to facilitate simple entry of
alphanumeric strings on the display
Map>Undo Last Map Entry Keyboard shortcut Ctrl+Z. In map entry mode, this highlights the last box to be entered and
allows it to be deleted.
Edit>Map Entry Mode Keyboard shortcut Ctrl+L. Toggles Map Entry Mode
View>Refresh Keyboard shortcut F5. Refresh the PC display with no change to status.
View>Invert Toggles Invert mode. This will invert the current display and all slides.
View>Zoom Zoom in to image area.
View>Zoom Full Show entire image area
View>Map Keyboard shortcut Ctrl+M. Toggles viewing of map boxes on the image
View>Fill This toggles Fill mode. Normal mode is enabled, which allows the PC screen to reflect the
physical display. The fill colour is selectable.
View>Clear Keyboard shortcut Ctrl+Y. Clears the image area and display.
DA852X E Ink Evaluation Kit
3.4.3 Toolbar
Reset Display identical to File>Reset Display
Start New Project identical to File>New Project and Add Item in Device Type pulldown
Open Project identical to File>Open Project and selecting Item in Device Type pulldown
Undo identical to Edit>Undo Last Map Entry
Zoom identical to View>Zoom
Zoom Full identical to View>Zoom Full
Clear identical to View>Clear
Refresh identical to View>Refresh
Show Map identical to View>Map
Map Entry mode identical to Map>Map Entry Mode
All brand and product names are trademarks or service marks of their respective owners. Printed in Europe.
DA852X-UG02-608 Page 17 of 47

© Dialog Semiconductor 2008. All rights reserved.
Display Controllers
User Guide Release 2.0
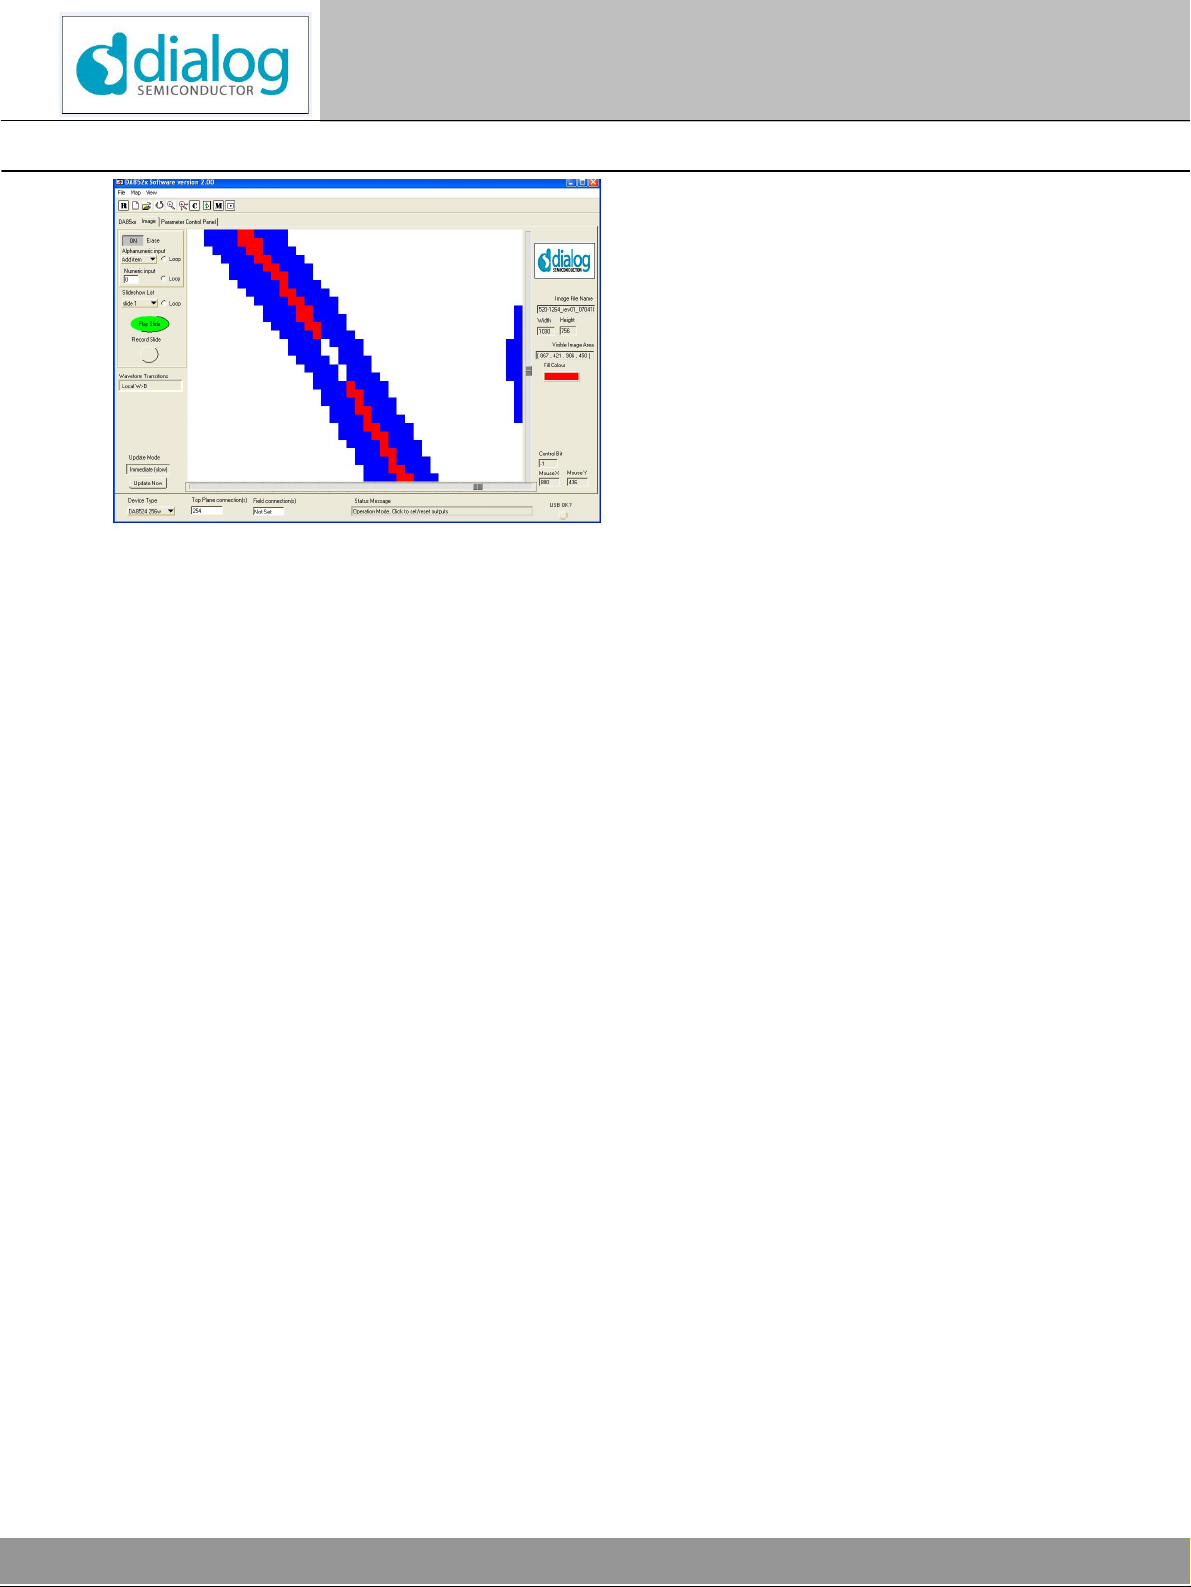
3.4.4 Image Controls
DA852X E Ink Evaluation Kit
Figure 5. Image panel showing loaded bitmap and filled symbols
Alphanumeric Input Selecting “Add item” allows entry of an alphanumeric string, which will be decoded into a
series of slides. If the “Erase “ button is off, the alphanumeric string is added to the existing
display, else the screen is cleared before display.
Selecting an existing item in the list displays that item. Right-clicking on the control brings up
a control panel , which allows reordering and deletion of alphanumeric items.
Click on the text to highlight the item, then Move Item Up or Down to reorder it in the list.
Clicking on the check mark beside any alphanumeric will toggle the selection. Any unchecked
items will be removed after pressing the “Delete Unchecked” button which closes the panel.
Figure 6. Alphanumeric Control panel
All brand and product names are trademarks or service marks of their respective owners. Printed in Europe.
DA852x-UG02-608 Page 18 of 47

© Dialog Semiconductor 2008. All rights reserved.
Display Controllers
User Guide Release 2.0
Alphanumeric loop Checking this item causes all the alphanumeric items in the list to be displayed endlessly until
it is unchecked
Numeric Input Allows entry of a single number, which will be decoded into a series of slides. If the “Erase “
button is off, the number is displayed on top of the existing display, else the screen is cleared
before display.
Numeric Loop Checking this item cycles all numbers up to 999 endlessly until it is unchecked.
Slideshow List Selecting “Add item” allows selection of multiple, previously recorded sequences which will
be added to the list. The control panel Figure 7 is then active to allow reordering or further
selection. Selecting an existing item in the list displays that item.
Alternatively, right-clicking on the control brings up the control panel, Figure 7, to allow
addition, reordering, temporary selection and deletion of sequence items.
Click on the text to highlight the item, then Move Item Up or Down to reorder it in the list.
Clicking on the check mark beside any alphanumeric will toggle the selection.
Further files may be added to the list by pressing the “Add Files” button.
Any unchecked items will be temporarily disabled after pressing the “Disable Unchecked” or
“OK” button which closes the panel.
Any unchecked items will be removed after pressing the “Delete Unchecked” button which
closes the panel.
DA852X E Ink Evaluation Kit
Selecting “Cancel” closes the panel with no changes made.
All changes are reflected into the sequence list box, and also stored in the configuration file.
Figure 7. Sequence Control Panel
Erase Causes Alphanumeric and numeric inputs to be preceded by a Clear command. Use erase if
the alphanumerics or numerics are simply being looped independently, but turn it off if
alphanumeric or number input are being used as part of a slide creation.
Slideshow Loop Checking this item causes all the slideshow items in the list to be displayed endlessly until it
is unchecked. The time between sequences is controlled by the Sequence Update Rate in the
Configuration panel.
Play Slide Opens a Dialog box to choose single sequence to display.
All brand and product names are trademarks or service marks of their respective owners. Printed in Europe.
DA852X-UG02-608 Page 19 of 47

© Dialog Semiconductor 2008. All rights reserved.
Display Controllers
User Guide Release 2.0
Record Slide Clicking this starts recording of all mouse clicks which toggle segment outputs. The control
turns red to indicate recording mode. Clicking Record Slide again causes the recording mode
to finish, opening a dialog box to prompt a filename for the slide. It is not necessary to add the
.txt suffix, this will be done automatically. If an existing file is selected, the option to Replace
or Cancel is provided.
Waveform Transitions Indicates the type of transitions in use. See Section 3.4.1
Update Mode If Update Mode is Synchronous, mouse clicks are not transmitted immediately to display. If
mode is Immediate, mouse clicks are transmitted immediately, but this could result in fairly
slow response due to the Enable time of the display. The default mode is Immediate.
Update Now Updates the display with stored mouse clicks if mode is Synchronous.
3.4.5 Image Information
Image File Name Displays Image file name
Width, Height Displays Image file width and height in pixels.
Visible Image Area Displays top left and bottom right coordinates of viewed area of image. This is updated during
zoom operations.
DA852X E Ink Evaluation Kit
Control Bit Displays segment output associated with clicked area of the image. If area is not associated
with a segment in the map file, displays -1
MouseX, MouseY Displays position of mouse click on the panel in Bitmap units. 0,0 is in the top left of the
image.
Scroll Bars These can be used when the image is zoomed in to pan the image vertically or horizontally.
The scroll bars will not allow the image to be scrolled past the limits of the bitmap.
Fill Colour This allows modification of the colour which will be used to infill the symbols on the PC
display. This should not be the same colour as the outline of the symbols.
All brand and product names are trademarks or service marks of their respective owners. Printed in Europe.
DA852x-UG02-608 Page 20 of 47

© Dialog Semiconductor 2008. All rights reserved.
Display Controllers
User Guide Release 2.0
DA852X E Ink Evaluation Kit
3.5 File Formats
3.5.1 The Configuration Files
Plain text configuration files (.ini) are used to store all settings that will be restored when the program is started.
DA852X.ini, stored in the Data subdirectory, contains some basic setups such as the device index selected, and the list
of user-added projects. This ini file is editable if the program is not running.
[Setup]
offline=0
Device_index = 3
[User Projects]
User project8 = "cascade,128"
User project12 = "numerics,30"
User project13 = "memory,32"
If the line “offline=0” is changed to “offline=1”, this flags to the software that hardware is not attached.
Filename.ini, stored in the subdirectory filename in the Data directory is used to store settings specific to that project.
This includes the number of outputs, the location of the Map and Image files, timing parameters, and lists of sequences
and alphanumerics.
The file allows the project to be reopened with all parameters and settings intact from previous sessions.
[Setup]
Device = 64
ImageFile = " 520-1264_rev01_070410.BMP"
Clock Period = 5
Blank Period = 350
Standby Delay = 20
Standby Period = 420
Backplane = 63
Sequence Update Rate = 0.1
FillColour = 16711680
Fill = 1
Waveform Select = 7
MapFile = " 520-1264_rev01_070410.map"
Invert = 0
Number Offset File = Number_defs.txt"
[Alphanumerics]
Alpha1 = "a"
Alpha2 = "b"
Alpha3 = "c"
[Waveform 3]
T0 = 280
T1 = 280
T2 = 280
P0 = 280
P1 = 280
P2 = 280
P3 = 280
P4 = 280
P5 = 280
[Waveform 2]
P0 = 280
[Waveform 4]
T0 = 280
All brand and product names are trademarks or service marks of their respective owners. Printed in Europe.
DA852X-UG02-608 Page 21 of 47

© Dialog Semiconductor 2008. All rights reserved.
Display Controllers
User Guide Release 2.0
T1 = 280
T2 = 280
P0 = 240
P1 = 280
P2 = 200
P3 = 160
P4 = 280
P5 = 130
[Waveform 6]
T0 = 280
T1 = 280
P0 = 170
P1 = 140
[Waveform 1]
P0 = 280
[Waveform 7]
Configuration File = " phase.txt"
[Waveform 5]
T0 = 280
P0 = 220
P1 = 170
[Sequences]
Sequence1 = " slide 1.txt"
Sequence2 = " slide 2.txt"
Sequence3 = " slide 3.txt"
Sequence4 = " slide 4.txt"
Sequence5 = " slide 5.txt"
Sequence7 = " slide 6.txt"
DA852X E Ink Evaluation Kit
3.5.2 The Image File
The Image File is a representation of the E Ink display to be used. It will normally be generated from the CAD database
used to define the Display for the manufacturer.
The Image file is a standard Windows Bitmap file (.bmp) in any colour depth, size or resolution. The software will fit this
file into the available display area.
The image should have clean feature lines, do not convert from a JPEG file if this can be avoided. The feature lines can
be any suitable colour. The background of the image must be white. In order for the fill routines to work correctly, there
should be no breaks in the symbol outlines, and all parts of the symbol interior should be connected by white pixels in the
vertical or horizontal directions. The Windows program Paint uses the same method for its own PaintFill routine, so this
can be used to test the requirements.
All brand and product names are trademarks or service marks of their respective owners. Printed in Europe.
DA852x-UG02-608 Page 22 of 47
© Dialog Semiconductor 2008. All rights reserved.
Display Controllers
User Guide Release 2.0
Figure 8. Detail of image, showing area that fill routine cannot reach
3.5.3 The Map File
The Map file is usually created by the software interactively, but can be generated by other means if this should be more
efficient, particularly for large displays.
DA852X E Ink Evaluation Kit
The file (.map) is a simple text file, editable with Notepad or similar, containing the mapping of bitmap rectangles to
segment control outputs.
The format is Left, Top, Right, Bottom coordinate of a bounding rectangle, followed by the Channel number which
controls that segment. All the coordinates refer to the Image bitmap, where 0,0 is in the top left corner. For example,
//X1 Y1 X2 Y2 Channel
648 608 712 694 61
718 667 732 689 60
738 653 754 689 59
Comment lines are supported with // at the beginning or within a line.
Note that multiple lines in the file may refer to the same control channel. Overlapping rectangles which contain the
same channel number are allowed as the map file will be searched in line order.
When the “Undo” function is performed in the software, the last line of this file is deleted.
It is possible to edit the file manually, but this is best performed while the file is not being used, to avoid conflict with the
internal copy of the data. This can be done by stopping the software, or by switching the project to another temporarily.
For large displays which have a number of identical complex symbols, as in the example below, it can be more efficient
to create the map interactively for one symbol only, then to import this information into a spreadsheet.
The map data for the remaining symbols can be created by adding position (X,Y) offsets and channel number offsets,
assuming that the connection assignments to the display are regular and predictable. The spreadsheet data can then be
re-exported to the text file.
All brand and product names are trademarks or service marks of their respective owners. Printed in Europe.
DA852X-UG02-608 Page 23 of 47

© Dialog Semiconductor 2008. All rights reserved.
Display Controllers
User Guide Release 2.0
Figure 9. Example of part of a large display with many segments
.
3.5.4 The Slide File
This is a simple text file (.txt) file that can be created or edited using Notepad or similar. The most usual way to create
these files is from within the software, as a recorded series of mouse clicks.
DA852X E Ink Evaluation Kit
The sequence file will be a copy of the state of the display when the recording is finished. Only segments which are
“black” are recorded in the file, as there is a “clear” function performed before the display of each slide.
Slide files are the key to producing effective “slideshows” using the display. Slide file names can be any alphanumeric
characters to show meaning of the contents, but certain naming conventions are used to decode numbers and
alphanumeric strings on the display. See the next section.
The slide consists of a series of BitmapX,Y coordinates that lie within mapped areas, along with the desired state of the
segment (black=1, white=-1). This data is a recording of the mouse activity in recording mode. Coordinates are relative
to the Image Bitmap, with 0,0 at the top left of the image.
The program computes the hex equivalent of the state of all the output segments at the end of the recording and
presents this as a comment, which can be useful during software development.
Comment lines are supported with // at the beginning or within a line.
Five “special” codes are supported in the file that can be entered manually:
-1 00 forces a “clear display” to be performed before any other processing.
It is especially useful to create a file “Erase.txt” containing only these codes, and being able to insert
this anywhere in the sequence list.
-1 -1 0 or 1 Changes the Invert mode (0=Black on White, 1=White on Black). This persists until changed again.
-1 -2 nnnn Changes the Sequence Update Rate to a new value (0-9999) milliseconds. This value will persist until
changed again.
All brand and product names are trademarks or service marks of their respective owners. Printed in Europe.
DA852x-UG02-608 Page 24 of 47

© Dialog Semiconductor 2008. All rights reserved.
Display Controllers
User Guide Release 2.0
It is especially useful to create a file “Delaynn.txt” containing only these codes, and being able to insert
this anywhere in the sequence list. This allows the sequence to run at variable speeds.
-1 -3 no Changes the Waveform Transition type (valid numbers 1-7). . This value will persist until changed
again.
-1 -4 Performs Reset Display to remove any greying of the display or ghosting of the segments.
The best method to use these codes is to create a suitably named slide file with just a single code.
Example file
//BitmapX BitmapY State
-1 -2 10 //delay
680 651
725 678 -1
746 671 1
769 664 -1
790 655 1
814 648 -1
//Hex data = 3f00000000000000
When the slide file is loaded, all lines are processed to derive a new state from the existing old state.
DA852X E Ink Evaluation Kit
3.5.5 Slide file names for numbers and alphanumerics
To allow simple entry of numbers and other alphanumerics from the Image panel, a special naming of the slide files is
required so that the number and alphanumeric entries can be broken down into individual characters. This is simply an
aid to performing common functions, the same can be achieved by using specific sequences files if required.
3.5.6 Number Entry
A numeric such as 12345678 must be broken down into its constituent parts to be displayed as in Figure 10 below
Figure 10. A typical Numeric display
All brand and product names are trademarks or service marks of their respective owners. Printed in Europe.
DA852X-UG02-608 Page 25 of 47

© Dialog Semiconductor 2008. All rights reserved.
Display Controllers
User Guide Release 2.0
Figure 11. Segments making up each numeric
The number 1 must appear in the leftmost segment display position (10 in the figure above), number 2 in the next
position etc. As the software cannot know where these segments are located, a sequence file is required for each
number 0-9.
The procedure is as follows:
1. Capture a sequence which represents the number 0 in any segment position. This would involve clicking
on segments A-F. Save this as filename 0.txt . Clear the display and repeat for numbers 1 thru 9.
2. Test the numbers 0-9 using the Numeric Loop button.
3. Create a file (default name is number_defs.txt). This should contain the following:
DA852X E Ink Evaluation Kit
0 X0 Y0
1 X1 Y1
2 X2 Y2
Etc for all numbers…
X0,Y0 is a reference position of the character location used to generate the numerics 0-9. It can be any identifiable point
of the symbol, such as the centre point, or lower left. The only requirement is that the same identifiable point is present
on all copies of the character.
X1,Y1 is the identified position of the units location. (This is probably the same as X0,Y0).
X2, Y2 is the identified position of the tens location.
X3,Y3 thru Xn,Yn will be the identified position for the hundreds position and upwards.
Test the number decode at any point using the Numeric Input box.
This file will be used to shift the numeric slide files into the correct locations to make up a number on the screen (up to
2,000,000,000).
3.5.7 Alphanumeric Entry
To enter the word “TEST” using the alphanumeric entry box, to appear on the display shown in Figure 9 must be
involves some breaking down of the entry string.
The letter T must appear in the leftmost position, then E followed by S and T in the last position. The DA852X software
contains some routines to allow this to happen if slide files are generated with the correct naming convention.
All brand and product names are trademarks or service marks of their respective owners. Printed in Europe.
DA852x-UG02-608 Page 26 of 47

© Dialog Semiconductor 2008. All rights reserved.
Display Controllers
User Guide Release 2.0
The procedure is as follows:
1. Capture a slide which represents the letter A in any segment position. This would involve clicking on
segments A-N. Save this as filename A.txt . Clear the display and repeat for letters B through Z and 0
through 9.
2. Test the letters A-Z 0-9 using the Alphanumeric input control.
3. Create a file (default name is alpha_defs.txt). This should contain the following:
0 X0 Y0
DA852X E Ink Evaluation Kit
Figure 12. Example Alphanumeric display
1 X1 Y1
2 X2 Y2
Etc for all alphanumeric character locations
X0,Y0 is a reference position of the character location used to generate the alphanumerics A-Z, 0-9. It can be any
identifiable point of the symbol, such as the centre point, or lower left. The only requirement is that the same identifiable
point is present on all copies of the character.
X1,Y1 is the identified position of the leftmost location. (This may be the same as X0,Y0).
X2, Y2 is the identified position of the next location to the right.
X3,Y3 through Xn,Yn will be the identified position for the next positions to the right.
It is always possible to construct a slide for a defined word that does not use this mechanism, e.g. create a sequence
“TEST.txt” which places the word TEST on the above display. You are free to choose whichever method is most
convenient to you.
All brand and product names are trademarks or service marks of their respective owners. Printed in Europe.
DA852X-UG02-608 Page 27 of 47

© Dialog Semiconductor 2008. All rights reserved.
Display Controllers
User Guide Release 2.0
DA852X E Ink Evaluation Kit
3.6 Programming Information
This section provides information useful to the software developer in programming an application using the DA852X
device.
The DA852X EPD driver is a very simple device with an SPI interface. Serial data is streamed into the device and
latched by the LATCH signal if the CS signal is high. The last data bit sent will appear at output DD0. Databits in the
bitstream will cause the appropriate outputs to switch to 15volts for a period determined by the BLANK signal.
The E-Paper process requires a differential voltage across each segment, such that +15v will switch the segment to
black, -15v will switch to white. The DA852X driver achieves this using only a single +15v supply by switching the TopPlane connection as one of its outputs to achieve the differential voltage. This does, however, cause slightly more
complication in the software since the connection designated as the Top Plane must be managed.
Consider two adjacent segments S1 and S0. The connected outputs are D1 and D0 with TOP as the top plane
connection
S0 S1 TOP D0 D1 Comment
White White 0v 0v 0v Initial state
Black White 0v +15v 0v
Black Black 0v 0v +15v
White Black +15v 0v +15v
White White +15v +15v 0v
S0 switches on,
S1 remains off
S1 switches on,
S0 remains on
S0 switches off,
S1 remains on
S1 switches off,
S0 remains off
As you can see, the outputs D0 and D1 depend upon previous state as well as the desired state. The term state is used
here to denote the desired display condition of a segment, black or white.
For transition between each state, we can express the following relationships.
1. If any segment switches from a Black state to a White state, the Top-Plane shall be high, else it is low.
2. For each segment that must switch from Black to White, its Data output shall be zero.
3. If any segment remains constant while the Top-Plane is high, its Data output shall be one.
4. For each segment that must switch from White to Black, while Top-Plane is zero, its Data output shall be one.
In simple terms this means that Data outputs will be the same state as the Top-Plane if they are not to change,
and opposite to the Top-plane if they are to change. It will be understood from this if some segments change
from White to Black, and others from Black to White, then two separate operations are required.
The reason behind this “complication” is to retain charge balancing in the display. It is required that only one packet of
charge switches the display elements in a positive or negative direction. Successive packets in the same direction will
cause overdriving, resulting in a partially stuck segment, which appears as a “ghost”. Another way to view this to say that
DC balance must be maintained at zero.
The following code snippets are provided as an aid to the developer. They are written in ANSI C, so should be
transportable to most development environments with minimal change. They are provided as is.
All brand and product names are trademarks or service marks of their respective owners. Printed in Europe.
DA852x-UG02-608 Page 28 of 47

© Dialog Semiconductor 2008. All rights reserved.
Display Controllers
User Guide Release 2.0
3.6.1 Decode states to provide drive waveform
These two functions Decode_Transitions, and senddata are the principal means by which changes of state are converted
into bit outputs.
They both use the following global variables, although these could obviously be modified to pass the data as parameters.
device=number of outputs in use (Global variable)
state[]=desired state of segment outputs (Global variable)
old_state[]=current state of segment outputs (Global variable)
/*-----------------------------------------------------------------------------*/
int Decode_Transitions (short int *change_state)
//Take state[] and old_state[] to decide transitions for each bit.
//return array change_state, which is in same format as phase table.
// new old
// W>W is 4 0 0
// B>W is 2 0 1
// W>B is 1 1 0
// B>B is 8 1 1
// TP is 16 - Top Plane is not used here.
{ short i,a,b;
for (i=0;i<device;i++){
a=state[i]&0x01;b=old_state[i]&0x01;
change_state[i]=((a&&b)<<3)|((!a&&!b)<<2)|((!a&&b)<<1)|((a&&!b));
}
return 0;
}
/*---------------------------------------------------------------------------*/
void senddata(void)
//Uses array Phase_table[], and phase_count to drive outputs. These are global
variables.
//Phase table contains details of transitions and delays
//Bits 0 to 3 are WB,BW,WW,BB in that order, Bit 4 is TP
//Next byte is delay in ms/10
//phase length is number of transitions
{
int i,j;
short change_state[MAX_OUTPUTS];
Decode_Transitions (&change_state[0]);
//set Standby off
setbit(ONOFFB,1);
Delay(standby_delay/1000);
for (j=0;j<phase_length;j++){
for (i=0;i<device;i++) {
d[i]=(change_state[i]&(phase_table[j*2]&0x0F))?1:0; //bitwise AND
}
d[topplane]=((phase_table[j*2]&TP)&TP)?1:0; //bitwise AND
LoadVector(); //Construct serial bitstream with d[] and clocks.
Output(); //Output bitstream
Delay((double)phase_table[j*2+1] *0.01); //Delay in 10ms increments
setbit(BLANK,1);
}
//Blank is high while transmitting data.
DA852X E Ink Evaluation Kit
All brand and product names are trademarks or service marks of their respective owners. Printed in Europe.
DA852X-UG02-608 Page 29 of 47

© Dialog Semiconductor 2008. All rights reserved.
Display Controllers
User Guide Release 2.0
Delay((standby_extend)/1000);
setbit(ONOFFB,0);
//now update old_state[] with current values
for (i=0;i<device;i++) {
old_state[i]=state[i];
}
return;
}
3.6.2 Creating a Hex string from state outputs
It may be convenient to treat long arrays as hex strings, for import and export purposes.
This function will convert between hex string and state array.
Input: state[] array as global variable
Output: OutputString as global variable
Globals: topplane, device
void Create_String(void)
{
int i,val;
char string[MAX_OUTPUTS]="";
state[topplane]=0;
for (i=device-1;i>=3;i=i-4) {
val=state[i]*8+state[i-1]*4+state[i-2]*2+state[i-3];
sprintf(string,"%s%x",string,val);
}
strcpy (OutputString,string);
return ;
}
DA852X E Ink Evaluation Kit
3.6.3 Decode a hex string to state array
It may be convenient to treat long arrays as hex strings, for import and export purposes.
This function will convert between hex string and state array.
Input: pointer to data string
Output: state[] array as global variable
Globals: topplane, device
Int String_to_Array ( char *data)
{ int i,j,val,length;
int index;
char *poi=NULL;
for (i=0;i<(length);i++){
poi=&data[length-1-i]; //rightmost character
sscanf (poi, "%1x", &val); //convert one character
//decode variable into its constituent 4 bits
for (j=0;j<=3;j++){
index=4*i+j;
if ((index<=device-1)&(index>=0)&(index!=topplane))
state[index]=(val>>j)&0x01;
}
}
return 0;
}
length=strlen(data);
// to decimal equivalent.
All brand and product names are trademarks or service marks of their respective owners. Printed in Europe.
DA852x-UG02-608 Page 30 of 47
© Dialog Semiconductor 2008. All rights reserved.
Display Controllers
User Guide Release 2.0
DA852X E Ink Evaluation Kit
4 Tutorial – A Memory Gauge Example
This section of the guide takes you step-by-step through the process of connecting and setting up a new display. We’ll use a fairly
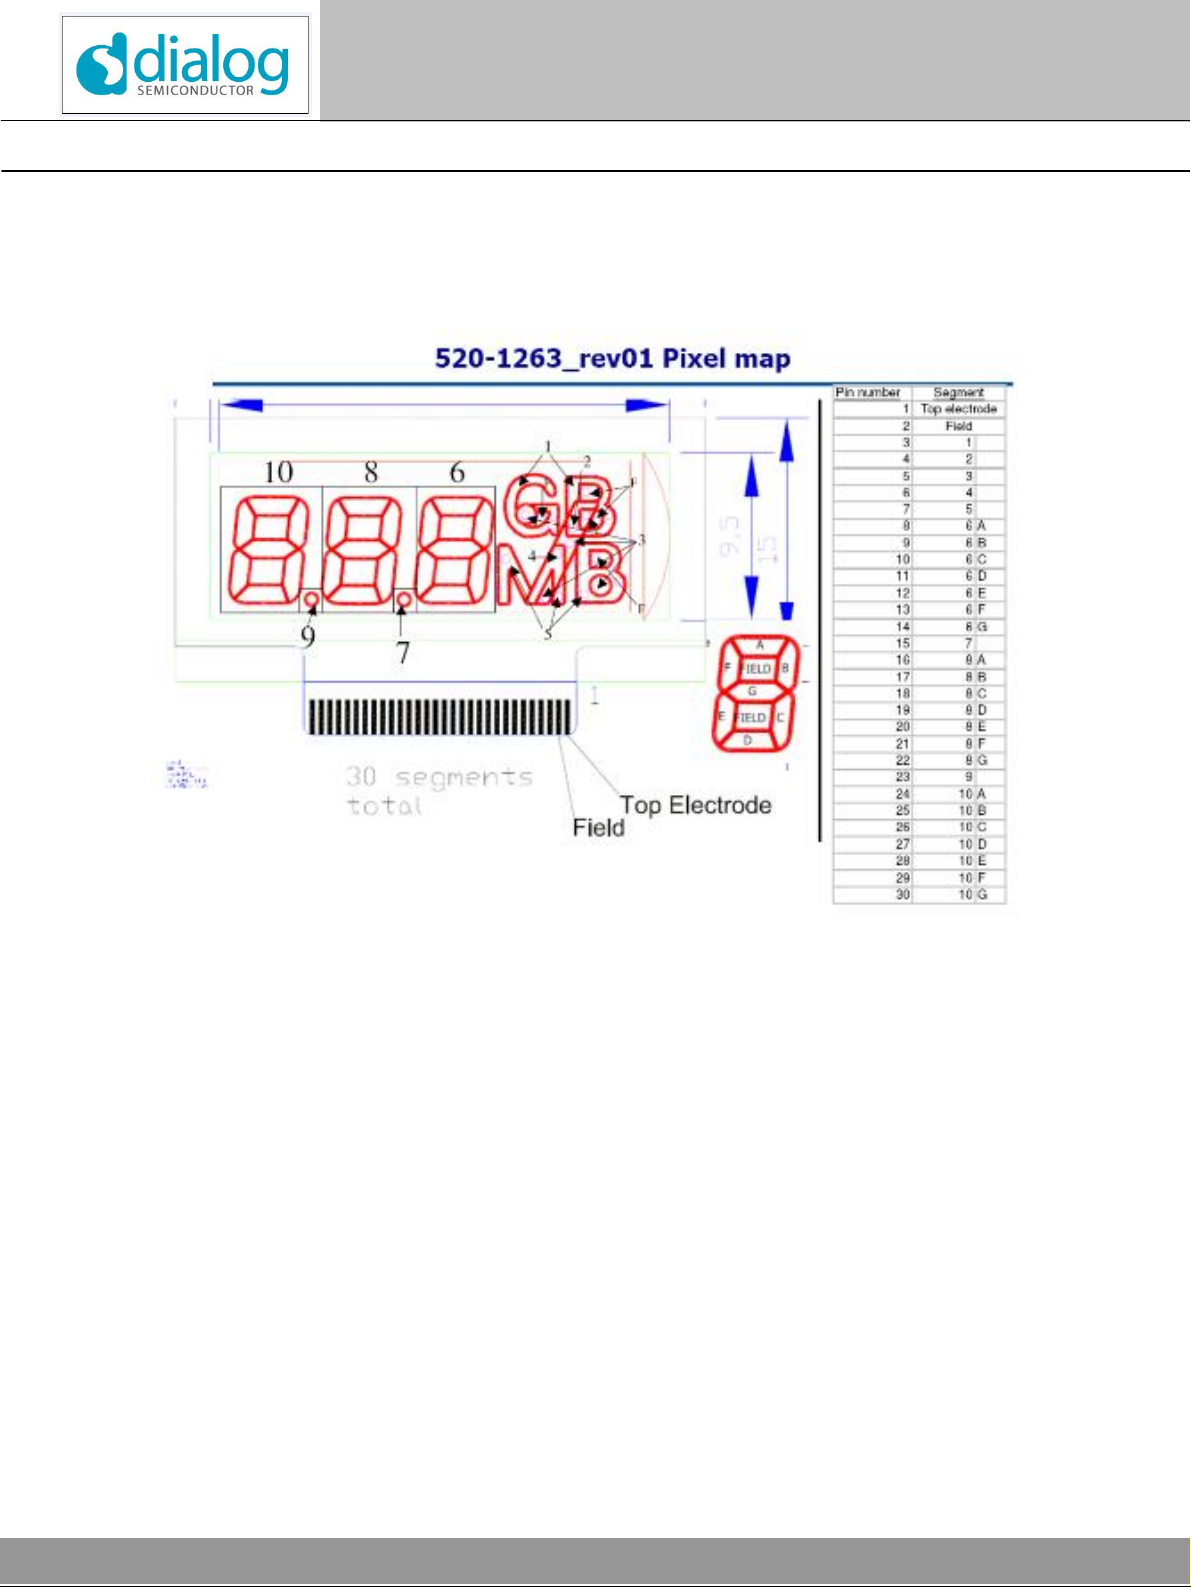
simple numeric “Memory Gauge” display as an example, as shown in Figure 13.
Figure 13. Details of Memory Display
The display is 33mm x 15mm overall size, with 30 active segments. The connector is 32 ways 0.5mm pitch contacts on
the bottom of the display, with pins 31 and 32 uncommitted.
We are going to connect this display to the DA8521 Evaluation 64 Segment Board. We’ll assume that the display is to
be connected to the board directly, and that FPC connectors will not be used.
This information has been provided by E-ink, which should allow simple connection and allocation of the segments.
It is possible that you do not have this information to hand, (i.e. the person who has it is on holiday!), or the information
might be out of date, in which case I will lead you through the steps to sort this out later in this tutorial.
4.1 Connecting the Display Hardware
First, connect the display to the PCB. This is achieved by positioning the display contacts on the 0.5mm pitch connector
J6 on the top side of the PCB (see Figure 14), securing the contact with a piece of matt adhesive tape. Use a type with
low stickiness to avoid leaving residue on the PCB. For the 0.5mm pitch the connector of this display, it is just possible to
align the connector correctly with the naked eye. For smaller pitch connectors, some magnification is required.
All brand and product names are trademarks or service marks of their respective owners. Printed in Europe.
DA852X-UG02-608 Page 31 of 47

© Dialog Semiconductor 2008. All rights reserved.
Display Controllers
User Guide Release 2.0
DA852X E Ink Evaluation Kit
Figure 14. Evaluation board with display connected
You are free to choose where to position the display contacts relative to the connector. Here I have chosen to align
the leftmost contact (pin 32 on the display) with pin 1 of the connector. Therefore the Top Electrode will be at pin 32
of J6 (or segment output 31). We will need this information later.
Figure 15. Close up of connections
All brand and product names are trademarks or service marks of their respective owners. Printed in Europe.
DA852x-UG02-608 Page 32 of 47

© Dialog Semiconductor 2008. All rights reserved.
Display Controllers
User Guide Release 2.0
Use the clamp provided to ensure a good connection with an even pressure. Don’t tighten the clamp too much, it
can flex and give a less effective pressure.
DA852X E Ink Evaluation Kit
Figure 16. Clamp fitted to ensure good connections
That is job done, we move on now to working with the software.
For troubleshooting, see Section 8.2.
4.2 Creating a New Project
We’ll assume that you have followed the instruction on page 9 onwards, and have successfully installed the software and
USB driver. If not, do it now.
Start the software by selecting Start>Programs>Dialog Semiconductor>Display Controllers>DA852X.
You will be greeted by the image in Figure 17.
All brand and product names are trademarks or service marks of their respective owners. Printed in Europe.
DA852X-UG02-608 Page 33 of 47

© Dialog Semiconductor 2008. All rights reserved.
Display Controllers
User Guide Release 2.0
Figure 17. Initial screen
You will now want to create a new project to match the fitted display. We’ll call it „memory“.
Press the „New Project“ icon and enter „memory“ into the popup box. Enter „32“ for the number of outputs, as the
display has 32 connections, even though 2 of them are not used. The number of outputs tells the software what is the
maximum output used.
DA852X E Ink Evaluation Kit
4.3 Top Plane Connection
Next, enter the output number for the top plane connection into the box at the bottom of the screen. In our example case
this is easy, the information tells us that it is the rightmost connection, which is attached to pin 32. This is output segment
31 in the software. Watch out for this- pins of connectors are always numbered from 1, but outputs from many chips
including this one, number from 0. Enter 31 into the box.
What happens if you don’t know the pin number of the top plane connection? It will usually be the last used pin on the left
or right of the display, there may be dummy connections outside. The top plane connection is visible on the right or left of
the display by a large rectangular „blob“ , so the position of this will tell you which end of the connector is used for the top
plane.
4.4 Load Image of Display
Next we need to load in a bitmap image of the display to be used.
With any luck, you have a CAD database with a clean artwork for the display. You can export a bitmap from this in
Windows .bmp format. Size and bit depth is irrelevant.
If not, the information may be present in a Adobe Acrobat .pdf document as in Figure 17 of this document. You can
select an appropriate area, copy it, and paste into Windows Paint program or any other graphical editor. Some
retouching can be carried out to remove arrows, text etc if you wish.
Save this file into the newly created directory
c:\Dialog Semiconductor\Display Controllers\DA852X\Data\Memory
Press the tab „Image“ to change to the image view:
All brand and product names are trademarks or service marks of their respective owners. Printed in Europe.
DA852x-UG02-608 Page 34 of 47

© Dialog Semiconductor 2008. All rights reserved.
Display Controllers
User Guide Release 2.0
Select File>Load Image (or Ctrl I if you prefer) and select the image you have just saved.
You will now see Figure 18 Error! Reference source not found. on the screen. The bitmap may look a little different
depending on how much cleaning up you have done.
DA852X E Ink Evaluation Kit
Figure 18. Image Screen with bitmap loaded
4.5 Mapping the Segments
Now is the fun part, we need to map the segments of the display to the connected segment outputs.
There are two ways to do this: calculation from the supplied information, or interactively on the display.
From the information in Figure 13, and by inspection of the connections that we previously made, segment G of location
10 (pin 30) would be assigned to output 2 (3rd connection on display), segment F would be output 3 etc. The field
connection is output 330, and the top plane output 31.
We could therefore add the list of outputs to a paper copy of figure 11.
The second method, if the information is not readily available, is to activate individual segment outputs by using the
controls on the DA852X tab. Clicking the round numbered controls will switch the outputs individually. The change in
state of the segment on the display can be observed, and the number written onto a paper copy of the display inside the
segment. Repeat until finished!
All brand and product names are trademarks or service marks of their respective owners. Printed in Europe.
DA852X-UG02-608 Page 35 of 47

© Dialog Semiconductor 2008. All rights reserved.
Display Controllers
User Guide Release 2.0
4.6 Creating the Map File
Select Edit>Map Entry Mode (or Ctrl L).
This enters Map Entry mode (signified by the cursor changing to a rectangle) where it is expected that you will click on a
position on the image map, drag the mouse to create a rectangle, and release the mouse. For proper operation of the fill
routine on the image, it is required that the centre dot lies within the symbol. (This forms the initial point for the fill). A box
will then popup, prompting you to enter a segment output number, derived by one of the two methods above. For odd
shapes or diagonal shapes, it is quite acceptable to create multiple rectangles, even overlapping, which all have the
same output segment number.
If different symbols, or parts of symbols, are electrically connected on the display and will turn on together, the above
should be repeated with boxes with the same segment number for each. This doesn’t affect the appearance of the
physical display, only the PC image.
DA852X E Ink Evaluation Kit
Figure 19. Map Entry mode
Selecting View>Map, Ctl M or the Map icon allow the previously defined boxes to be displayed.
A zoom function is available View>Zoom or the Zoom icon allows you to get close in as in Figure 20 below. This
shows the use of overlapping rectangles. The scroll bars allows you to pan around. Note that the dot at the centre of
each rectangle should lie within the symbol. The rectangles represent the area in which you can click to activate the
segment. The fill program will colour the whole of the segment. Boxes may not overlap if they are associated with
different segments.
All brand and product names are trademarks or service marks of their respective owners. Printed in Europe.
DA852x-UG02-608 Page 36 of 47

© Dialog Semiconductor 2008. All rights reserved.
Display Controllers
User Guide Release 2.0
Figure 20. Zoomed image showing map areas
DA852X E Ink Evaluation Kit
If you make a mistake, use Undo (Edit>Undo Last map Entry, Ctrl Z, or the Undo icon to highlight and delete a box.
You can view the full display again by View>Zoom Full or the icon , and refresh the display by View>Refresh, Ctrl F5,
or the icon .
When you have completed this, and mapped all areas to segment outputs, you can turn off Map Entry mode, turn off the
Map view mode, and test the mapping.
First reset the display by File>Reset Display. The display should turn black, then all white.
Make sure that Update Mode is set to Immediate.
Now click on any segment on the image map. The segment should fill with the colour you have selected and the
corresponding segment on the display should turn black.
If all segments are correct, enjoy the moment, grab a coffee, you’re most of the way there!
If there are segments not mapped yet, enter map entry mode again and add more rectangles.
All brand and product names are trademarks or service marks of their respective owners. Printed in Europe.
DA852X-UG02-608 Page 37 of 47

© Dialog Semiconductor 2008. All rights reserved.
Display Controllers
User Guide Release 2.0
If there are segments in error, you can either do multiple Undo’s, which could be painful, or you can manually edit the
map file. First, move the mouse over the segment in error and note the Control Bit from the box on the lower right hand
side of the display.
Open the file with Notepad or similar simple text editor. Each entry in the map file contains the X,Y coordinate of the
upper left and lower right of the bounding rectangle you created, and the linked segment output.
//X1 Y1 X2 Y2 Channel
648 608 712 694 61
718 667 732 689 60
738 653 754 689 59
You can find the line in error from the channel number you noted earlier and delete it.
DA852X E Ink Evaluation Kit
Save the file again.
Click the Map Icon twice to reload the map file, and the offending rectangle will be removed. It can then be entered
correctly.
Figure 21. A completed map
All brand and product names are trademarks or service marks of their respective owners. Printed in Europe.
DA852x-UG02-608 Page 38 of 47

© Dialog Semiconductor 2008. All rights reserved.
Display Controllers
User Guide Release 2.0
DA852X E Ink Evaluation Kit
4.7 Creating a Slide Show
The next part of the process will be largely specified by you. You will be storing sequences of mouse clicks to produce a
series of displays, possibly for demonstration purposes, but also for engineering development.
For the purposes of this tutorial, I’ll assume that the primary motivation is to get a demonstrator ready in short order, with
a representative series of displays or slideshow.
At this point, you can either create a set of slides with random numbers, or generate sequences for all the possible
numbers for automatic incrementing.
The first option is obviously quicker. We’ll do this first.
Clear the display by pressing the Clear button , then press the Record Sequence button.
Click inside the appropriate segments of the digits to create 123MB, save as “123MB”. The software will add the suffix
“.txt“.
Similarly create any other numbers you wish, possibly including the decimal point and the GB symbol.
Suppose we now have the files 123MB.txt, 456MB.txt, 1GB2.txt and 840MB.txt stored. These can now be added to the
sequence list by clicking on “Add Item” on the Sequence control. A popup file select box opens to allow you to select
these files.
Hold Control key while clicking to select multiple files, or Shift key to select a consecutive group of files. Click the “Add”
key, then “OK”. Now you can reorder, delete, or add more files before clicking “OK” or “Delete Unchecked”.
To run this sequence, click the “Loop” button next to the sequence list.
Your sequences will now cycle and repeat indefinitely until the “loop” button is unchecked. To change the speed of the
slideshow globally, press the “Parameter Control Panel” tab, and change the Slideshow Update Rate at the top centre.
This slideshow might very well be suitable, but what options are available to modify it?
The first modification is a variable sequence update rate. We can have some slides run longer than others.
Create a text file “Delay 100ms.txt” using Notepad or similar program. Enter in the file the line “-1 -2 100”, and save the
file. The “-1” number signals a special code, “-2” signals delay code , and the “100” means 100milliseconds.
If this file is included in the sequence list, the Sequence Update Rate will be changed to 100ms. Creating multiple files
with different update rates will allow variable delay times.
The second method of sequence generation for this display is automatic number generation.
I’ll refer you back to page 25 at this point for the details. The crucial point is that you have to create files 0.txt through
9.txt, and the number_defs.txt file. For this display, a slideshow of a number counting up may be a little dull, but it can
work well for other segmented displays.
Obviously this tutorial is necessarily limited in scope, but hopefully it covers the basic procedures to get you up-andrunning with your display. The slideshow mode is most satisfying to generate, allowing you to prototype your product
very quickly.
We’ll be very happy to receive feedback on the software and this document, with bugs, request for features,
appreciations and criticisms, all most welcome. See the contact details in section 1.2.
All brand and product names are trademarks or service marks of their respective owners. Printed in Europe.
DA852X-UG02-608 Page 39 of 47

© Dialog Semiconductor 2008. All rights reserved.
Display Controllers
User Guide Release 2.0
DA852X E Ink Evaluation Kit
5 Waveform Phase Table
The Appearance of the transitions between slides is controlled by the Waveform selection, 6 of which are already defined
(Local White then Black, Local Black then White, Slideshow White, Slideshow Black, Global White then Black, Global
Black then White). All use the concept of a waveform phase table as their core.
The ability to import a phase table permits fine control over image transitions, or allows new transition types to be
generated. Please note however that it is possible to generate waveforms which could damage the display by application
of incorrect signals.
The phase table is made up of up to 64 pairs of bytes. The first code byte describes the state of an individual output and
the top plane connection at an instant in time during the transition from one state to another.
A segment can only have one of 4 possible conditions when moving between states:
White > White , White > Black , Black > White, Black > Black as shown in the diagram below.
Since these cannot be accomplished at the same time, the Top Plane (TP) is controlled by the phase table.
0 0 0 Top Plane Black>Black White>White Black>White White>Black
A one in any location implies that any output of the device will be high if its state change matches the entry in the phase
table entry.
The second byte defines the duration of the phase in units of 10ms.
It is probably easiest to see this in action by considering the following waveform, taken from one of the predefined
waveforms. The parameters have been adjusted to give a larger number of transitions, and do not necessarily produce a
good image transition.
All brand and product names are trademarks or service marks of their respective owners. Printed in Europe.
DA852x-UG02-608 Page 40 of 47

© Dialog Semiconductor 2008. All rights reserved.
Display Controllers
User Guide Release 2.0
The above images show the Wave view and Bilevel view for the same transition.
The wave view is indicating the voltage across the segment, which is the difference between the segment drive and the
Top Plane voltage. This can be positive or negative.
DA852X E Ink Evaluation Kit
The Bilevel view is indicating the actual drive voltage, and is easier to decode and modify the phase transition table. For
this waveform, the exported phase table is
//Phase is TP,B>B W>W B>W W>B
//Duration is x10ms
//Phase Duration
0x15 19
0x17 9
0x00 5
0x0f 18
0x0b 6
0x0a 2
0x08 2
0x00 5
0x19 18
0x1d 13
0x00 0
It can be seen that the values in the phase table are visible by the hex value of the bi-level waveform at each time point.
The phase table is a very powerful and flexible way to manage the transition between states.
Phase Duration TP B<B W>W B>W W>B Elapsed time ms
0x15 19 1 0 1 0 1 0
0x17 9 1 0 1 1 1 190
0x00 5 0 0 0 0 0 280
0x1f 18 1 1 1 1 1 330
0x0b 6 0 1 0 1 1 510
0x0a 2 0 1 0 1 0 570
0x08 2 0 1 0 0 0 590
0x00 5 0 0 0 0 0 610
0x19 18 1 1 0 0 1 660
0x1d 13 1 1 1 0 1 840
0x00 0 0 0 0 0 0 970
Manipulation of the timings can effectively remove any traces of ghosting and fade.
All brand and product names are trademarks or service marks of their respective owners. Printed in Europe.
DA852X-UG02-608 Page 41 of 47

© Dialog Semiconductor 2008. All rights reserved.
Display Controllers
User Guide Release 2.0
An example of an alternative phase table is given by the following file:
//Phase is TP,W>B B>W W>W B>B
//Duration is x10ms
//Phase Duration
0x1d 3
0x01 3
0x1d 3
0x01 3
0x1d 3
0x01 3
0x1d 3
0x01 3
0x1d 3
0x01 3
0x1d 3
0x01 3
0x1d 3
0x01 3
0x1d 3
0x01 3
0x1d 3
0x01 3
0x1d 3
0x01 3
This results in the following waveform:
The White to Black and Black to White transitions have been shortened to 30ms and alternated 10 times. Each transition
is not long enough to result in a complete Black to White, or White to Black change, but after 10 such cycles the change
is accomplished.
DA852X E Ink Evaluation Kit
The visual effect of this waveform is that Black to White and White to Black transitions effectively take place
simultaneously.
All brand and product names are trademarks or service marks of their respective owners. Printed in Europe.
DA852x-UG02-608 Page 42 of 47

© Dialog Semiconductor 2008. All rights reserved.
Display Controllers
User Guide Release 2.0
DA852X E Ink Evaluation Kit
6 Cascade Connection
Using the Expansion connectors, multiple boards of any type can be connected together to produce a display driver of
any size. The software supports this mode of operation. It is assumed that the output connectors used will be the
1.27mm IDC headers, connected via ribbon cable to a remote display, unless the display in use has multiple connection
tapes.
A special PCB (part number 44-179-73-08A) is required to connect boards together, please contact your supplier if this
has not been supplied with a purchase of two or more eval kits.
Points to note:
• The second (slave) driver is configured for external power supply and external 15v.
• The second (slave) driver board has jumpers JP2 and JP3 removed.
USB cable
Remove
All brand and product names are trademarks or service marks of their respective owners. Printed in Europe.
DA852X-UG02-608 Page 43 of 47
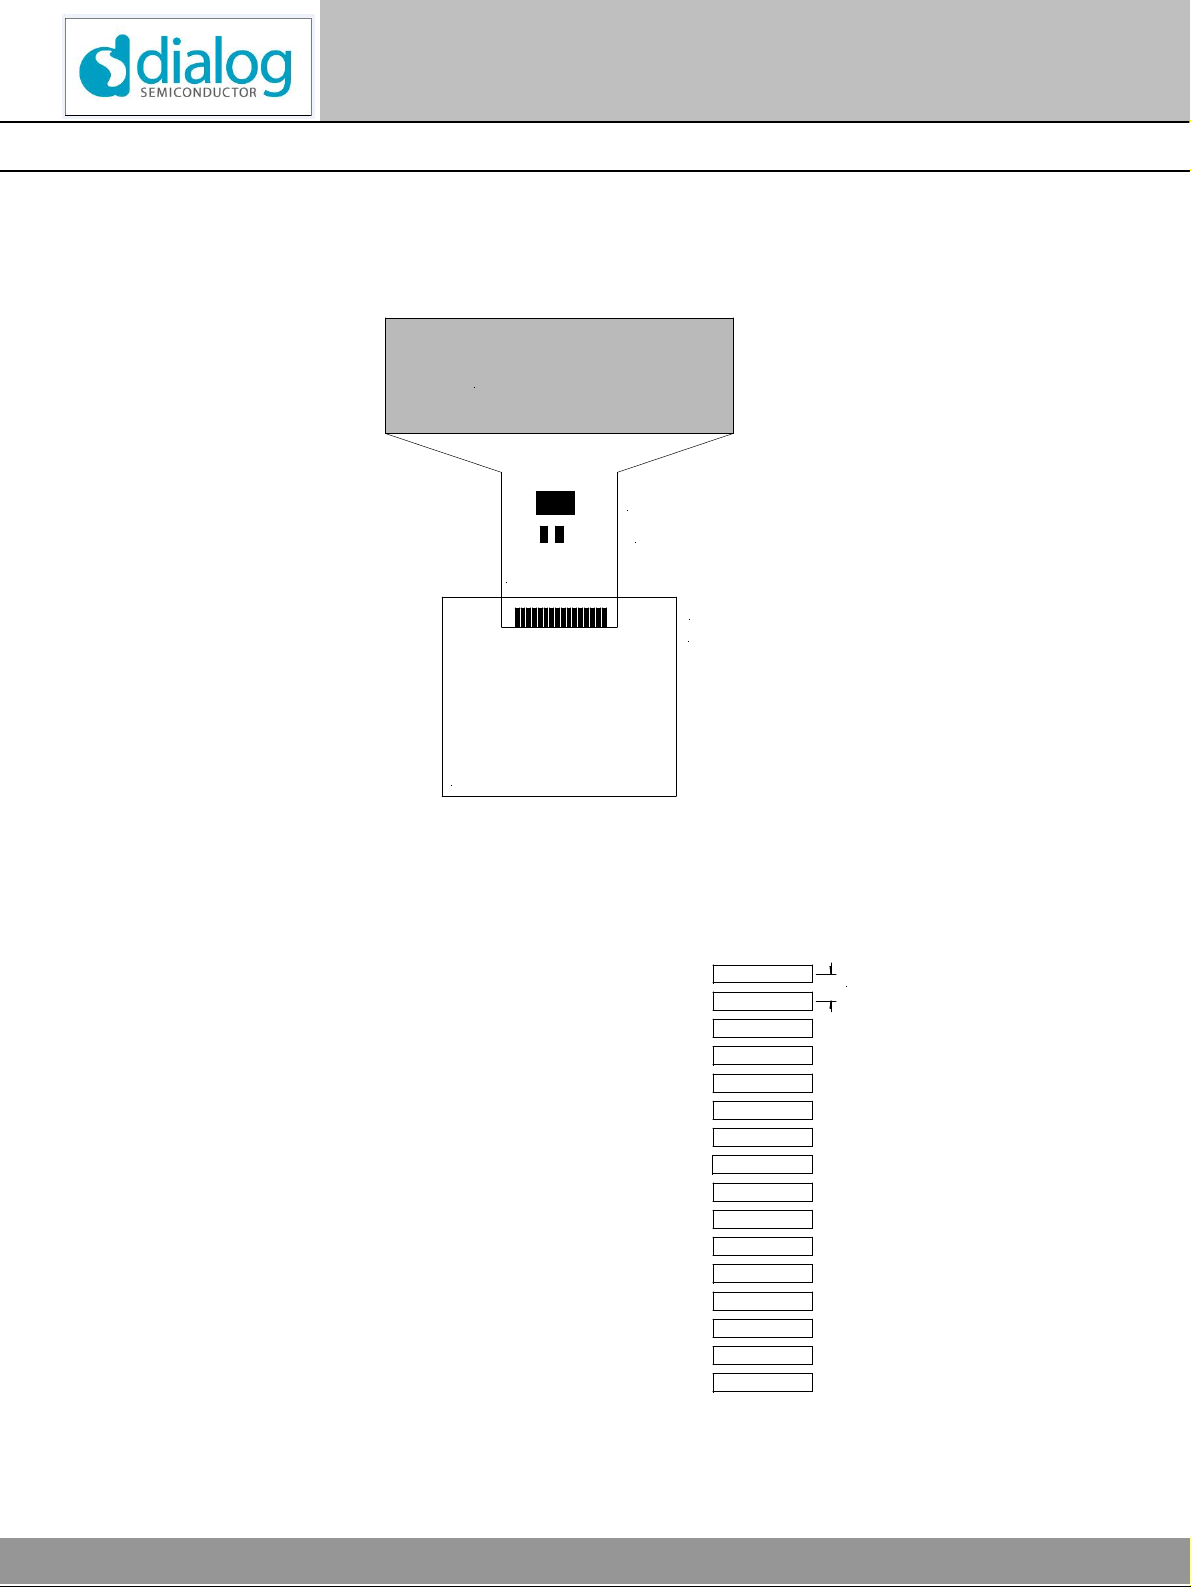
© Dialog Semiconductor 2008. All rights reserved.
Display Controllers
User Guide Release 2.0
DA852X E Ink Evaluation Kit
7 Flex Connection
It is possible to use the evaluation board to interface between a PC and a DA852X mounted on a flex cable, which is the
“tail” of an E Ink display.
Display
Bumped die
Capacitors
Flex PCB
ZIF connector
or clamp
Eval kit PCB
Figure 22. Concept of die on FPC
The connector pin numbers have been chosen to make the routing to the chip on the FPC as simple as possible. For
convenience, the second connector J18 is reversed from J17 to allow for a flex with connections on the top.
Figure 23. FPC Connector signal assignments (J17 shown)
CS
LATCH
STANDBYB
DATAIN
CLKIN
BLANK
TESTEN
TESTOUT
VDD
VSS
AVSS
DATAOUT
CLKOUT
15VOUT
15VIN
6VOUT
0.5 mm
All brand and product names are trademarks or service marks of their respective owners. Printed in Europe.
DA852x-UG02-608 Page 44 of 47

© Dialog Semiconductor 2008. All rights reserved.
Display Controllers
User Guide Release 2.0
DA852X E Ink Evaluation Kit
8 Troubleshooting
8.1 Software issues
The USB device should install without difficulty automatically. Make sure that the installation finds and uses the driver
contained on the CD.
The software may require administrator privileges to install on the machine to be used.
If the software is started before the USB kit is plugged in, the program will prompt for Offline mode, which can be useful
to familiarise oneself with the software without the hardware attached.
The software is optimised for a display screen size of 1024 by 768 pixels or greater, with Fonts set to Normal (96dpi).
There have been reported issues of unpredictable display effects when large fonts (120dpi) are used. This can be
changed by right-clicking on the desktop, select Properties. Select the Settings tab, select Advanced, then Normal size
from the drop-down box.
If no image is present on the Image panel, perform the “Load Image” and “Load Map” operations again.
If the display does not change when a segment on the image is clicked, check that the “Update mode” button is set to
“Immediate”. Also check that the correct project is loaded. Does the number of segments match the PCB and display in
use?
8.2 Hardware Issues
To verify that the hardware is correctly communicating with the software, monitor signal “StandbyB” at the edge of the
board with a Digital Voltmeter or oscilloscope. This should switch high and low when the toggle switch “StandbyB” on
the “Parameter Control Panel” is toggled.
If signal V15_OUT is monitored, this will switch between 0v and 15v at the same time.
If no output is being produced, check that the jumpers are in the correct positions, see Figure 2. Especially check that the
Power Supply jumper JP1 is in the correct position.
It is important to align the display correctly onto the connector. Any misalignment can result in two outputs being shorted
together. When this happens, the 15v charge pump will be overloaded and fail to reach the correct voltage.
If possible, use a microscope or magnifying glass to perform the alignment, and a piece of “Magic Tape” or similar to hold
the display connector in position while the connector is being clamped.
If the display in use has multiple connectors, it is very likely that each connector has a connection to the Top Plane and
the Field connection. Any outputs driving these connectors are then effectively in parallel. It is vital that the Top Plane
connections box and the Field Connection box have the correct entries., e.g if outputs 95 and 191 are top_plane, and 94
and 190 are field connection, then the boxes should contain “95,191” and “94, 190” respectively.
All brand and product names are trademarks or service marks of their respective owners. Printed in Europe.
DA852X-UG02-608 Page 45 of 47

© Dialog Semiconductor 2008. All rights reserved.
Display Controllers
User Guide Release 2.0
DA852X E Ink Evaluation Kit
9 Release Notes for Version 2.0
This is a major release, with many new features.
As far as possible, this has been made backwards compatible with the previous version 1.2.
Some changes may be necessary to slide files, as these are no longer incremental (i.e. slide files now contain all black
segments of the display, not just changes).
1. Implement flood fill as well as red dots for showing set segments.
Mode to be selectable in View Menu, and colour to be selectable.
2. Implement new method for alphanumerics and numbers.
File Alpha_def.txt contains origin coordinates for all similar alphanumerics.
File Number_def.txt contains origin coordinates for all similar numbers.
File format is [number] x-origin, y-origin.
[number] is the position.
For numbers this is units, tens, hundreds etc.
For alphaumerics this is left pos, left+1 etc.
For each alpha or number, take each coordinate in turn, subtract x and y offset of 1st char,
then add the value onto each sucessive origin value.
e.g.
Alpha_def.txt contains 0 120 250
1 320 250
2 420 250
File a.txt contains
//BitmapX BitmapY
127 439
127 340
195 262
271 341
271 437
156 391
240 391
//Hex data = 0000000000764400
To write AAA we take A.txt, subtract 120 from each X, add 120 to each X, subtract 250 from each Y, add 250
to each Y, then set this position.
Then we take A.txt, subtract 120 from each X, add 320 to each X, subtract 250 from each Y, add 250 to
each Y, then set this position.
Then we take A.txt, subtract 120 from each X, add 420 to each X, subtract 250 from each Y, add 250 to
each Y, then set this position.
3. Find memory leak from pictures.
4. Make load of image from file be once only, not each time it is refreshed. Need to hold copy of original bitmap in
memory, and bitmap modifed by files etc.
5. New Waveform function. Selectable waveform definitions. Define by Eink.
Each waveform should open new dialog box with parameters and waveform picture.
6. Make mouse position boxes be pixel coordinates, not canvas coordinates.
7. Make direct entry box of hex values MUCH faster- cut down on processing and screen rewrites.
8. Clean up Icons.Need better images.Use capital letter for simplicity.
All brand and product names are trademarks or service marks of their respective owners. Printed in Europe.
DA852x-UG02-608 Page 46 of 47

© Dialog Semiconductor 2008. All rights reserved.
Display Controllers
User Guide Release 2.0
9. Make Update immediately mode be the default.
10. Make box select and zoom selection be able to do any direction, top left to bottom right, top right to bottom left,
or bottom left to top right, or bottom right to top left.
11. Fix multiple zooming.
12. Add toolbar button for Reset.
13. Get rid of error message in offline mode.
14. Make offline mode safe if used with USB. Needs to initialise if possible to define output states.
15. Changing top plane position should delete other top plane positions.
16. Add multiple positions for top plane and field for cascaded displays.
17. 20way display DA8520 no longer offered.
18. During recording, add radio click, hex input,alpha inputs and number inputs.
19. Fix bug of map boxes disappearing during zoom.
20. Implement Invert mode. Add special code to sequence file to automate.
21. Record Sequence append mode should remove matching entry with opposite phase.
22. Scale Image panel to allow for max size. (Main panel scales, Image does not).
22. Change selected Waveform type tab to red.
23. When selecting new colour, refresh screen with new selected colour.
24. Reflect active tab of waveform onto image panel
25. Move Export Phase table button to parameter panel.
26. Make Offline mode work correctly. Pressing USB OK? goes to USB attempt and does not start timer.
Allow Quit gracefully
27. Trap overlapping boxes of different channel numbers when adding map boxes.
28. Right click on image implements "Last View", after a zoom operation.
29. Allow multiple coupled Field connections even if no couple Top Plane connections.
30. Remove term "sequence" and replace everywhere with "slide".
31. When recording a slide, add into the file all the existing set bits, so that slide is complete and not incremental.
32. During rapid mouse clicks, remember the mouse position when the click was made, rather than position when it is
processed.
33. Resequenced Waveform options to Local W>B, Local B>W, Slideshow W>B, Slideshow B>W,
Global W>B, Global B>W, User_Defined
34. Fix bug in User Waveform selection.
35. Unload map and image on opening new project.
DA852X E Ink Evaluation Kit
All brand and product names are trademarks or service marks of their respective owners. Printed in Europe.
DA852X-UG02-608 Page 47 of 47

© Dialog Semiconductor 2008. All rights reserved.
Display Controllers
User Guide Release 2.0
36. Make filenames in ini files local UNLESS selected filename is not in current project directory.
37. Fixed bug in switching projects if scroll bar used.
38. Add Cancel buttons to Sequence list and alpha list to "do nothing"
39. Fixed bug in vertical scroll bar which allowed it to scroll too far.
40. Cancel in "Load Image" deletes existing image.
41. Added cancel to "map entry" dialog box.
42. Added cancel to "delete project" dialog box.
43. Added cancel to "Open project" dialog box.
44. Deselecting Map View mode should cancel map entry mode.
45. Add files in slide list sometimes makes existing files disappear.
46. Fixed broken Synchronous mode.
47. Make Loop controls not active at the same time.
48. Trap invalid or suspect phase table files
49. Added display check routine to Dialog Test page.
50. Fix blank alphanumeric input.
51. Make Slideshow more responsive by polling "Loop" buttons continuously
DA852X E Ink Evaluation Kit
52. Make installation default to “C:\Dialog Semiconductor\Display Controllers\DA852x to allow Vista to process correctly.
All brand and product names are trademarks or service marks of their respective owners. Printed in Europe.
DA852x-UG02-608 Page 48 of 47
 Loading...