

Page 1

User Manual
DA1469x State of Charge (SoC)
Functionality
UM-B-134
Abstract
This user manual describes the use of Dialog Semiconductor's State of Charge (SoC) software.
Besides the State of Charge calculation, an overview is given of the whole process of charging and
discharging a battery. The amount of charge- and discharge current has an impact on the State of
Charge and because of that the battery needs to be characterized (profiled) to minimize errors. The
battery profiling process is also described in this manual. There is also a brief description on the
influence of temperature and aging on a battery.
Page 2

UM-B-134
DA1469x State of Charge Functionality
User Manual
Revision 1.0
17-Nov-2020
2 of 22
© 2020 Dialog Semiconductor
Contents
Abstract ................................................................................................................................................ 1
1 Terms and Definitions ................................................................................................................... 4
2 References ..................................................................................................................................... 4
3 Introduction .................................................................................................................................... 5
3.1.1 State of Charge Estimation Concepts ................................................................... 6
3.1.2 Effect of Temperature on State of Charge ............................................................ 8
4 Charging Process for Li-ion Batteries ...................................................................................... 11
4.1 Phases of the Charging Process ........................................................................................ 11
4.1.1 Phase 1: Pre-Charging ........................................................................................ 11
4.1.2 Phase 2: Constant Current .................................................................................. 11
4.1.3 Phase 3: Constant Voltage .................................................................................. 11
5 SoC Process Overview ............................................................................................................... 12
5.1 Overall Process ................................................................................................................... 12
5.2 Battery profiling process...................................................................................................... 13
5.3 Resulting LUTs .................................................................................................................... 15
6 SoC Algorithm ............................................................................................................................. 16
6.1 Concept ............................................................................................................................... 16
6.2 SOC Calculation .................................................................................................................. 16
6.3 Various Considerations ....................................................................................................... 18
6.3.1 SoC Reporting Error ............................................................................................ 18
6.3.2 Accumulation Error .............................................................................................. 18
6.3.3 Half Battery Charging .......................................................................................... 18
6.3.4 Battery Aging ....................................................................................................... 18
7 Conclusions ................................................................................................................................. 18
Appendix A Battery Conditions and Parameters ........................................................................... 19
A.1 State of Charge (SoC) (%) .................................................................................................. 19
A.2 Depth of Discharge (DoD) (%) ............................................................................................ 19
A.3 Terminal Voltage (V) ........................................................................................................... 19
A.4 Open-Circuit Voltage (OCV) ............................................................................................... 19
A.5 Internal Resistance ............................................................................................................. 19
A.6 Nominal Voltage (V) ............................................................................................................ 19
A.7 Cutoff Voltage ..................................................................................................................... 19
A.8 Capacity or Nominal Capacity (Ah for a Specific C-Rate) .................................................. 19
A.9 Charge Voltage ................................................................................................................... 19
A.10 Float Voltage ....................................................................................................................... 20
A.11 (Recommended) Charge Current ....................................................................................... 20
Revision History ................................................................................................................................ 21
Page 3

UM-B-134
DA1469x State of Charge Functionality
User Manual
Revision 1.0
17-Nov-2020
3 of 22
© 2020 Dialog Semiconductor
Figures
Figure 1: Li-ion Battery at Different States of Charge ........................................................................... 5
Figure 2: Open Circuit Voltage versus State of Charge for Different Discharge Rates ........................ 5
Figure 3: OCV vs SoC where DVL= Discharge Voltage Limit, CVL = Charge Voltage Limit ................ 7
Figure 4: Effect of Temperature on Battery Capacity for Li-ion ............................................................. 9
Figure 5: LUTs for Low- and High Discharging Currents .................................................................... 10
Figure 6: Charging Phases for a Li-ion Battery ................................................................................... 11
Figure 7: Overview of the Process for Characterizing the SoC Algorithm .......................................... 12
Figure 8: Bench Setup for Battery Profiling ......................................................................................... 13
Figure 9: Battery Profiling Process ...................................................................................................... 14
Figure 10: SoC Algorithm Concept Overview...................................................................................... 16
Figure 11: SoC Graph ......................................................................................................................... 17
Tables
Table 1: Lookup Tables for OCV vs SoC for High Load-, Low Load- and Charge Currents ................ 8
Table 2: Generated Lookup Tables ..................................................................................................... 15
Page 4

UM-B-134
DA1469x State of Charge Functionality
User Manual
Revision 1.0
17-Nov-2020
4 of 22
© 2020 Dialog Semiconductor
1 Terms and Definitions
SoC State of Charge
OCVL Open Circuit Voltage for low discharge current
OCVH Open Circuit Voltage for high discharge current
2 References
[1] DA1469x Datasheet, Revision 3.2, Dialog Semiconductor
[2] UM-B-090, DA1469x Getting Started User Manual (PDF), Dialog Semiconductor
Page 5

UM-B-134
DA1469x State of Charge Functionality
User Manual
Revision 1.0
17-Nov-2020
5 of 22
© 2020 Dialog Semiconductor
3 Introduction
Batteries are the main source for storing electrical energy. For wearable systems running on a
rechargeable battery the user would like to know what the remaining amount of energy in the battery
is, to estimate when the device has to be re-charged.The percentage of stored energy is measured
with the parameter called State of Charge (SoC). The SoC is defined as the remaining energy in the
battery as a percentage of a fully charged battery. Normally the rated capacity, expressed in mAh is
used as the reference for SoC estimation. Figure 1 shows the State of Charge of a battery from full
state to empty state.
Figure 1: Li-ion Battery at Different States of Charge
A precise estimation of a battery’s SoC is required to inform the user how long the application can
still work before the battery will need to be recharged. From a safety perspective, SoC makes sure
that battery is not overcharged once 100% is reached. With SoC estimation the user gets an idea of
how long the device can be used before the next charge cycle. A fully charged battery has an SoC of
100% and an empty battery corresponds to a SoC of 0%. SoC can be effectively used to predict how
well the battery system functions relative to its nominal (rated) and end (failed) states. SoC drops
faster for higher load profiles and the provided SoC algorithm takes this into account. SoC
measurements help to select an appropriate charge and discharge profile for a longer life of the
battery.
SoC is proportional to the terminal voltage (Open Circuit Voltage or OCV) of the battery. SoC
decreases along with the decreasing battery voltage. An example graph with the plots of the SoC
against the battery Open Circuit Voltage and the load current is given in Figure 2.
Figure 2: Open Circuit Voltage versus State of Charge for Different Discharge Rates
Page 6

UM-B-134
DA1469x State of Charge Functionality
User Manual
Revision 1.0
17-Nov-2020
6 of 22
© 2020 Dialog Semiconductor
Figure 2 is taken from a typical (Li-ion) battery, discharged at different C-rates. It is well evident that
the SoC is related to the battery voltage and the load/discharge current. The applied load/discharge
current is mentioned as 0.2C, 0.5C, 1C and 2C.
The capacity of a battery is commonly rated at 1C, meaning that a fully charged battery rated at
200 mAh should provide 200 mA for one hour. The same battery discharging at 0.5C should provide
100 mA for two hours, and at 2C the battery delivers 400 mA for 30 minutes.
The SoC and the voltage drop faster for higher discharge currents. The green line in Figure 2
corresponds to a discharge rate of 2C and is the highest. The black line corresponds to the lowest
discharge rate of 0.2C. The voltage drops much slower for 0.2C compared to 2C. Hence the SoC
drops faster for 2C compared to 0.2C. In Figure 2, the value 3.2 V corresponds to the Battery Empty
state. This is the cutoff voltage and the SoC corresponds to 0%.
Every brand and type of battery has its own charge and discharge characteristics. For the algorithm
to provide an accurate SoC estimation, the battery needs to be profiled to determine the relation
between voltage and SoC at various C-rates. Dialog Semiconductor can provide software to run the
battery profiling (or characterization) using lab equipment. This is described in Section 5.12.
3.1.1 State of Charge Estimation Concepts
SoC is the ratio of the currently stored charge Q to the total capacity C. The total capacity can be
found from the battery specification.
SoC = 1 corresponds to a fully charged battery and SoC = 0 corresponds to an empty battery.
Two states at interval tα and tβ are considered for a charge/discharge operation. Qα and Qβ are the
charges corresponding to tα and tβ. Hence the stored/drained charge would be Qα – Qβ.
As Qα changes to Qβ, the SoC changes from SOCα = SOC(tα) to SOCβ = SOC(tβ). By using equation
(1) for tα as well as for tβ and (2), the total capacity of the battery cell can be calculated with:
Equation (3) shows that two accurate SoC measurements and the integrated current between these
two values are enough to calculate the resulting capacity C at tβ.
The SoC and Open Circuit Voltage (OCV) are related and when the SoC changes from SOCα to
SOCβ, the OCV does from OCVα = OCV (tα) to OCVβ = OCV (tβ).
Page 7

UM-B-134
DA1469x State of Charge Functionality
User Manual
Revision 1.0
17-Nov-2020
7 of 22
© 2020 Dialog Semiconductor
Equation (4) can be written as follows:
The linear interpolation relationship of OCV vs SoC can be represented graphically as shown in
Figure 3:
Figure 3: OCV vs SoC where DVL= Discharge Voltage Limit, CVL = Charge Voltage Limit
From the above equation (4) the current capacity of a battery can be found from the amount of
charge, charged or discharged, State of Charge and the Open Circuit Voltage.
As stated in the introduction, for an accurate estimation of the state of charge, the battery needs to
be profiled (or characterized). The role of battery profiling is to charge and discharge the battery with
a known current and to measure the corresponding OCV voltage. Battery profiling starts by preparing
the battery to be at a fully charged level so that SoC corresponds to 100 percent. The battery
profiling tool will draw a certain current for a certain duration that equals to 5% drop in SoC value.
The measured voltage corresponding to this SoC values is recorded. The same is valid for charging
the battery. The battery profiling tool will now charge the battery with a certain current for a certain
duration that equals to 5% increase in SoC value.
Battery profiling generates lookup tables (lut) with SoC and voltages measured for high (hlut)- and
low (llut/OCV) load- and charge currents (clut). The lookup tables generated by the battery profiling
are inserted into the DA1469x SoC software, which can be downloaded from
www.dialog-semiconductor.com.
The SoC software can be added to a customer application and during run time of the application this
will be used to calculate the State of Charge at any point in time.
Details of the battery profiling process are described in Section 5.2 Battery profiling process.
Page 8

UM-B-134
DA1469x State of Charge Functionality
User Manual
Revision 1.0
17-Nov-2020
8 of 22
© 2020 Dialog Semiconductor
An example of the lookup tables is given in Table 1 for reference.
Table 1: Lookup Tables for OCV vs SoC for High Load-, Low Load- and Charge Currents
SoC (%)
llut (mV)
(OCV)
hlut (mV)
clut (mV)
100
4290
4290
4329
95
4185
4160
4326
90
4130
4106
4325
85
4075
4052
4315
80
4025
4001
4261
75
3972
3952
4240
70
3900
3880
4169
65
3876
3856
4124
60
3839
3819
4094
55
3810
3790
4061
50
3786
3766
4033
45
3765
3745
4010
40
3744
3724
3993
35
3722
3702
3981
30
3704
3684
3967
25
3686
3666
3954
20
3670
3650
3932
15
3645
3625
3906
10
3630
3610
3878
5
3545
3525
3815
0
3233
3213
3564
Where llut contains the voltages measured when the battery is discharged with a (very) low current.
The hlut contains the voltages measured when the battery is discharged with a high current and the
clut contains the voltages measured when the battery is charged.
NOTE
The values in the lookup tables need to be measured with the battery in the customer’s
application.
3.1.2 Effect of Temperature on State of Charge
Temperature has a significant influence on the capacity and the state of charge of the Li-ion
batteries. The effect of temperature becomes more significant at low temperatures and when the load
demand is high. The open circuit voltage drops faster at lower temperatures and the voltage drop
rate is even faster when the load demand is high during low temperatures. Hence State of Charge
drops also during low temperature.
Page 9

UM-B-134
DA1469x State of Charge Functionality
User Manual
Revision 1.0
17-Nov-2020
9 of 22
© 2020 Dialog Semiconductor
Figure 4 shows the effect that temperature has on the SoC of Li-ion Batteries.
Figure 4: Effect of Temperature on Battery Capacity for Li-ion
Figure 4 shows that the cell capacity has reduced considerably at subzero temperatures for both
charging and discharging modes in comparison to that at ambient temperatures of 10 °C and 25 °C.
At lower temperatures the internal resistance of the battery increases considerably, and that impacts
the current driving capability of the battery. As a result, the capacity and the State of Charge drops
for a Li-ion battery.
Depending on the requirements, temperature compensation must be considered for battery profiling
and SoC software. Especially for applications that have high load profiles in combination with high
and/or low temperatures.
NOTE
If the battery is used with discharging currents below 0.2C, the temperature does not have that much impact
as long as the operating temperature is > 5 °C and < 35 °C.
NOTE
Since the majority of applications are not exposed to sub-zero temperatures or very high temperatures, the
example SoC software does not use temperature dependent lookup tables. Instead single lookup tables are
used for low-, high- and charge current profiles.
Page 10

UM-B-134
DA1469x State of Charge Functionality
User Manual
Revision 1.0
17-Nov-2020
10 of 22
© 2020 Dialog Semiconductor
Figure 5 is an example lookup table for 21 steps of OCV, for high and low current load at a fixed
temperature (25 oC).
const int16_t socf_lluts[SOCF_TEMP_NUM][VOL2SOC_LUT_SIZE] = {
{ 3233, 3545, 3630, 3645, 3670, 3686, 3704, 3722, 3744, 3765, 3786, 3810, 3839, 3876, 3900,
3972, 4025, 4075, 4130, 4185, 4290 }, //low discharging at 25 oC
};
const int16_t socf_hluts[SOCF_TEMP_NUM][VOL2SOC_LUT_SIZE] = {
{ 3213, 3525, 3610, 3625, 3650, 3666, 3684, 3702, 3724, 3745, 3766, 3790, 3819, 3856, 3880,
3952, 4001, 4052, 4106, 4160, 4290 }, //high discharging at 25 oC
};
Figure 5: LUTs for Low- and High Discharging Currents
Page 11
UM-B-134
DA1469x State of Charge Functionality
User Manual
Revision 1.0
17-Nov-2020
11 of 22
© 2020 Dialog Semiconductor
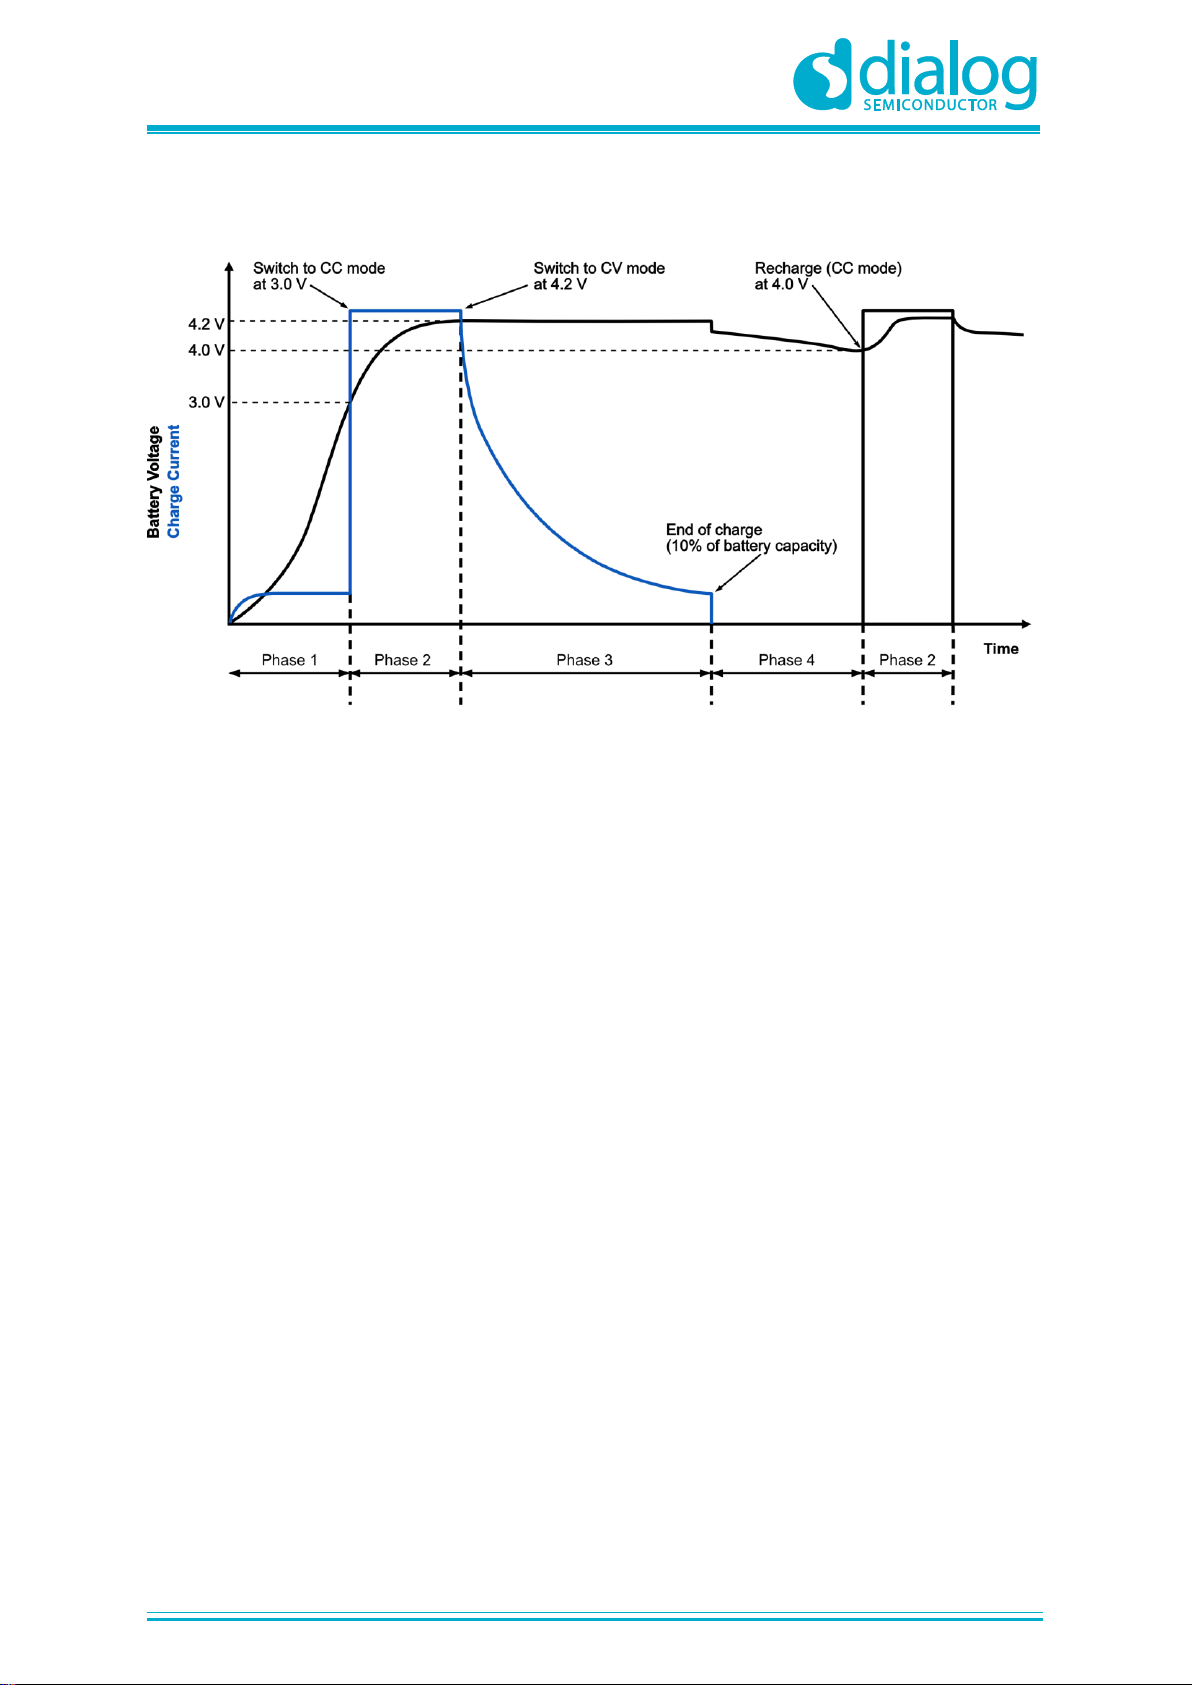
4 Charging Process for Li-ion Batteries
Figure 6: Charging Phases for a Li-ion Battery
Figure 6 shows the charging process of Lithium-ion batteries with the characteristics of battery
voltage, charging current and the phases of the charging process. The 3 steps involved in the battery
charging process are: pre-charging, constant current charging and constant voltage charging.
4.1 Phases of the Charging Process
4.1.1 Phase 1: Pre-Charging
When the battery is in the empty stage (once the battery voltage is less than the cutoff voltage), the
battery must be charged with a low current so that the battery voltage will rise above the cutoff
voltage. This is called Pre-Charging. The charging current in this phase is known as pre-charge
current (IPRECHG). In general the pre-charge current will be less than or equal to 0.1C. Phase 1
corresponds to Pre-Charging.
4.1.2 Phase 2: Constant Current
Once the battery voltage increases to the VPRECHG threshold, the prescribed maximum charge current
can flow. The recommendation is that the charging current is set to 50 to 70% of the battery’s
capacity. This phase is known as the Constant-Current charging phase. For a longer battery life, the
advice is to select a lower value for the charging current. So, 50% would be a good option to go for
when we consider the battery life. But, the charging process will be faster with a higher charging
current.
4.1.3 Phase 3: Constant Voltage
After the battery voltage increases to the set regulation voltage, the charging process enters the
phase known as the Constant Voltage charging phase. In this phase the charging current reduces
until the current equals 10% of the battery capacity after which the charging process stops and the
battery is regarded as fully charged. The typical regulation voltage is 4.2 V for Lithium-ion batteries.
Page 12

UM-B-134
DA1469x State of Charge Functionality
User Manual
Revision 1.0
17-Nov-2020
12 of 22
© 2020 Dialog Semiconductor
5 SoC Process Overview
5.1 Overall Process
The process for characterizing the SoC algorithm consists mainly of two major steps:
1. Battery profiling.
2. SoC algorithm testing.
Figure 7 shows the process in a flowchart.
Figure 7: Overview of the Process for Characterizing the SoC Algorithm
Page 13
UM-B-134
DA1469x State of Charge Functionality
User Manual
Revision 1.0
17-Nov-2020
13 of 22
© 2020 Dialog Semiconductor
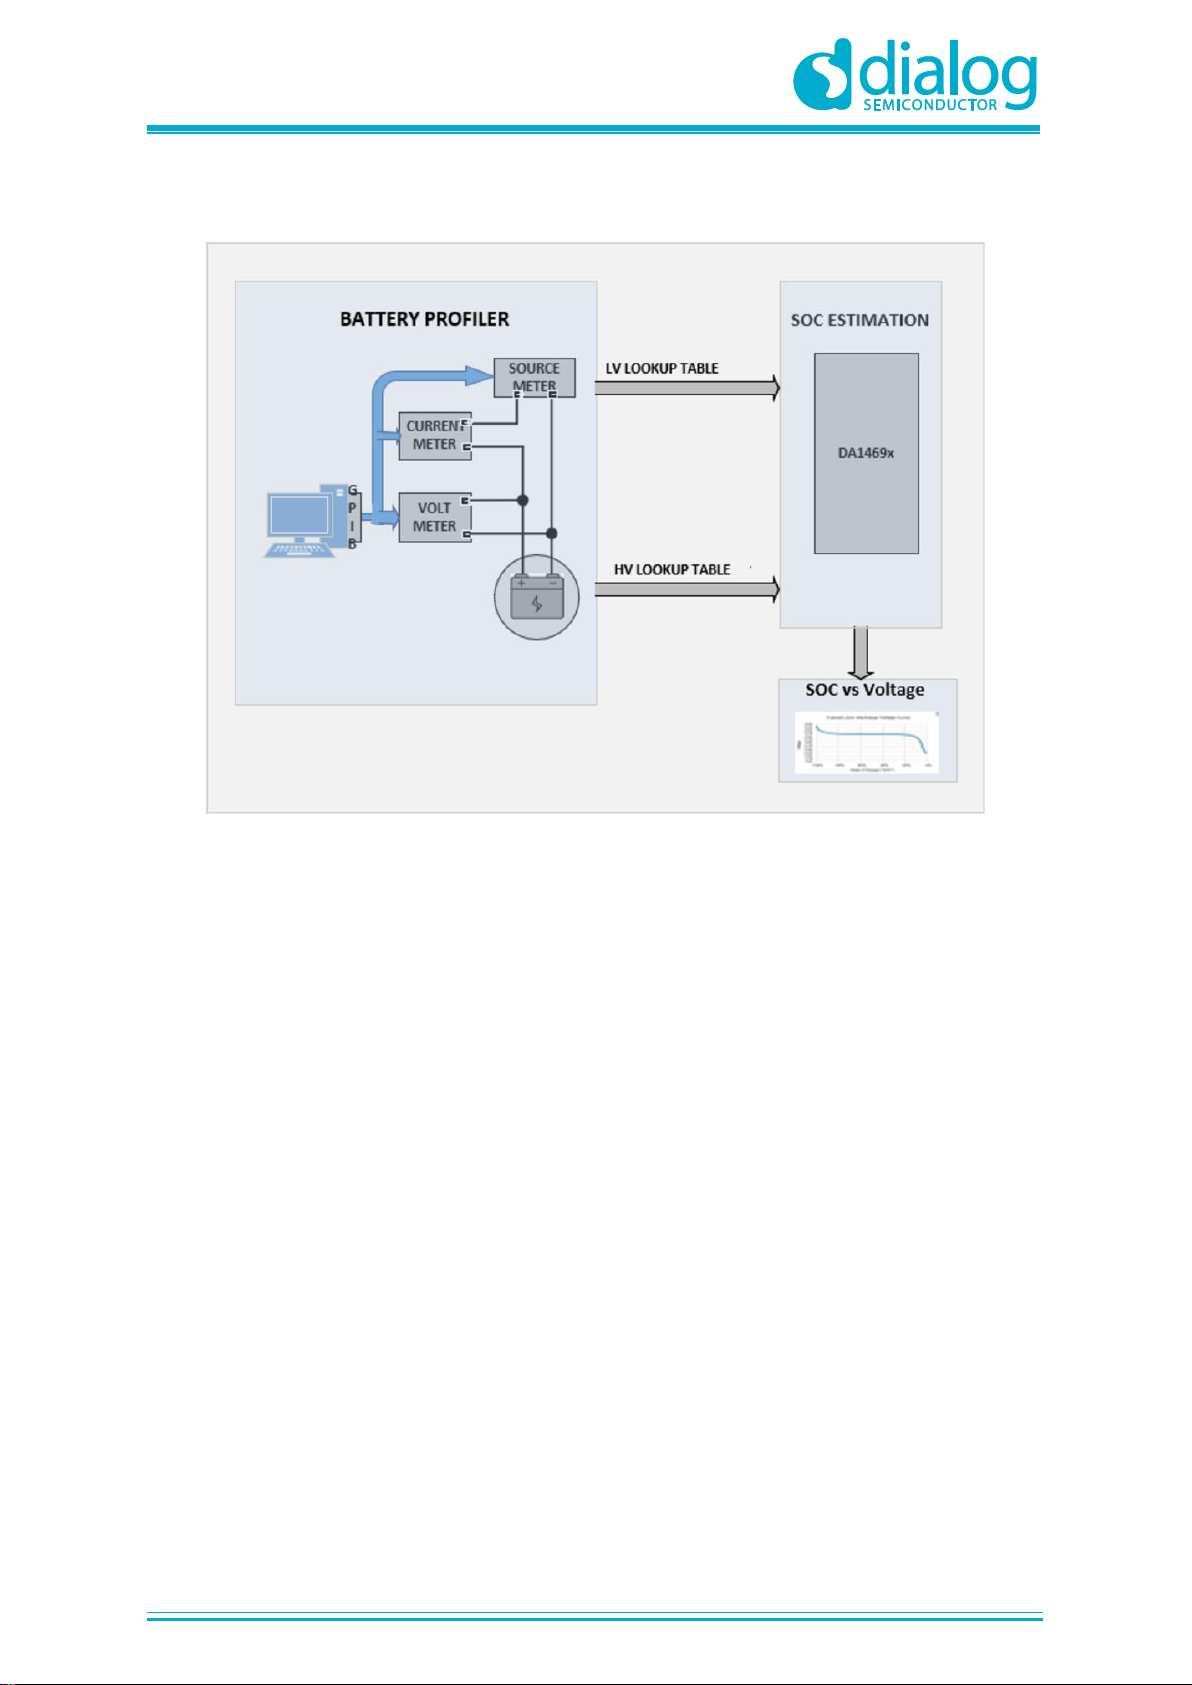
The bench setup for battery profiling and the State of Charge estimation is shown in Figure 8.
Figure 8: Bench Setup for Battery Profiling
5.2 Battery profiling process
The aim of battery profiling is to produce the “Voltage-SoC” LUTs described in detail in section 3.1.1.
For the specific cases with a high current load profile, the battery profiling is done as follows:
1. The Source meter will fully charge the battery at a 0.5C/1C Charge Current (depending on the
battery) until the charge current falls below the 5% EOC limit.
2. Log Vbat, using a fixed sampling interval equal to the number of LUT entries (generates clut).
3. Allow 15 minutes for the battery to rest without any load.
4. Discharge the battery with the high load profile based on the customer requirement.
5. Log Vbat, using a fixed sampling interval equal to the number of LUT entries. Wait 15 minutes for
the battery to recover and measure Vbat again. The first Vbat value goes into hlut and the
second value goes into the llut (OCV).
6. Basic llut, hlut and clut at 25 °C are generated as shown in Figure 9.
Page 14

UM-B-134
DA1469x State of Charge Functionality
User Manual
Revision 1.0
17-Nov-2020
14 of 22
© 2020 Dialog Semiconductor
Figure 9 shows the flowchart for battery profiling.
Figure 9: Battery Profiling Process
Page 15

UM-B-134
DA1469x State of Charge Functionality
User Manual
Revision 1.0
17-Nov-2020
15 of 22
© 2020 Dialog Semiconductor
5.3 Resulting LUTs
There are a number of LUTs generated for the SoC algorithm, as shown in Table 2.
Table 2: Generated Lookup Tables
Number
Name
Description
1
llut
Contains the battery voltage that corresponds to the open circuit voltage (OCV) over a
step of 5% (number of LUT entries) of battery capacity measured at 25 oC
2
hlut
Contains the battery voltage that corresponds to a constant load of average high load
current over a step of 5% of battery capacity measured at 25 oC
3
clut
Contains the battery voltage that corresponds to charging of the battery over a step of 5%
of battery capacity measured at 25 oC
These LUTs only serve the discharging operation and charging operation at a fixed temperature.
Moreover, the number of samples stored in each LUT could be increased for higher precision of the
algorithm (currently contains 21 samples).
NOTE
Temperature compensation is not required if the load demand is less than 0.2C.
Page 16
UM-B-134
DA1469x State of Charge Functionality
User Manual
Revision 1.0
17-Nov-2020
16 of 22
© 2020 Dialog Semiconductor
6 SoC Algorithm
6.1 Concept
The DA1469x SoC software example has several functions to calculate the State of Charge, which
can be integrated in a customer application.
The algorithm used in the SoC software is based on the following assumptions:
● Voltage drop is somehow linear to the discharging current
● The battery voltage under constant power consumption at each SOC is unique
● Voltage change in 5% intervals of SOC under constant discharging current is linear
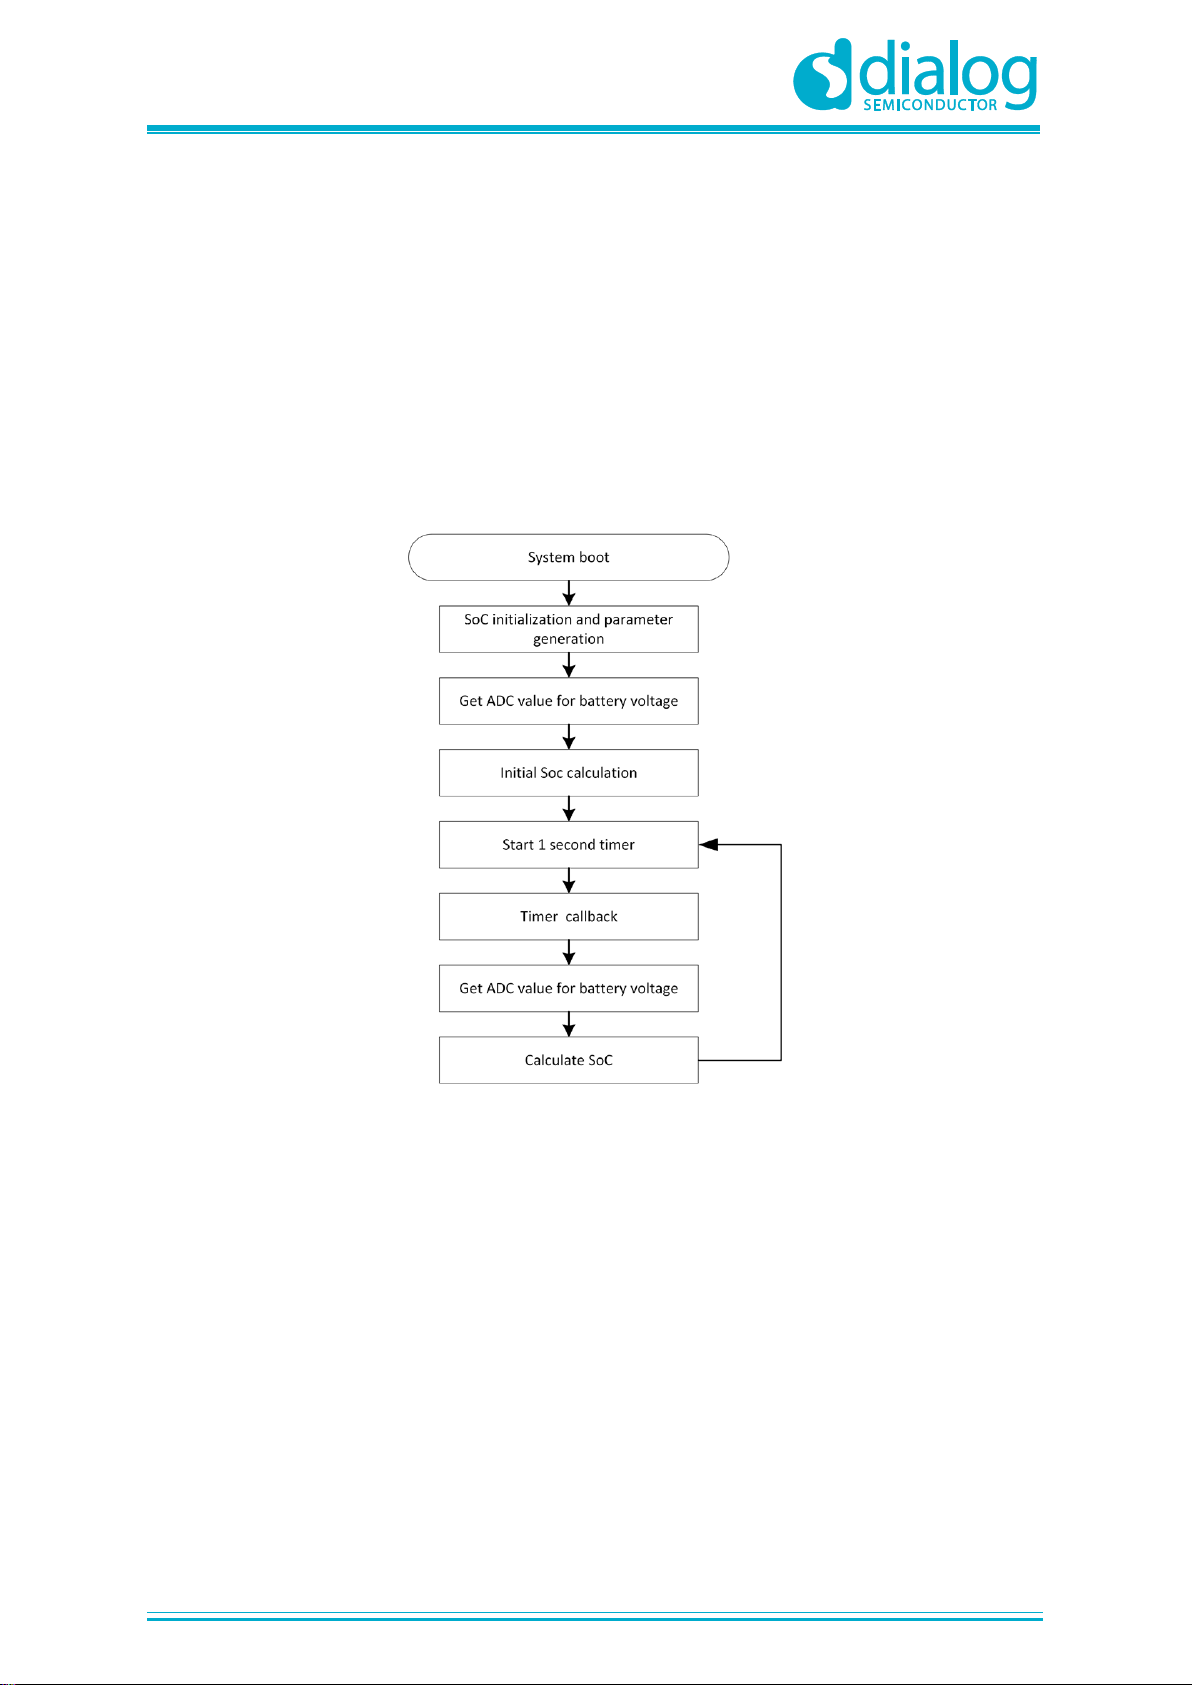
The basic algorithm flow is shown in Figure 10.
Figure 10: SoC Algorithm Concept Overview
Algorithm input parameters are:
● Battery voltage ADC_V(n): This is acquired by reading the GPADC VBAT channel. A single read
providing a 10bit value
● Elapsed time T, between ADC_V(n) and ADC_V(n+1). This is implemented with use of a
hardware timer, currently set at 1 second
The idea - in short - is to read the initial battery voltage assuming an initial SoC value, and then try to
estimate the actual load current and the voltage drop rate. The latter two parameters can be used to
calculate the next point on the graph VBAT/SoC, which in turn will provide the SOC value.
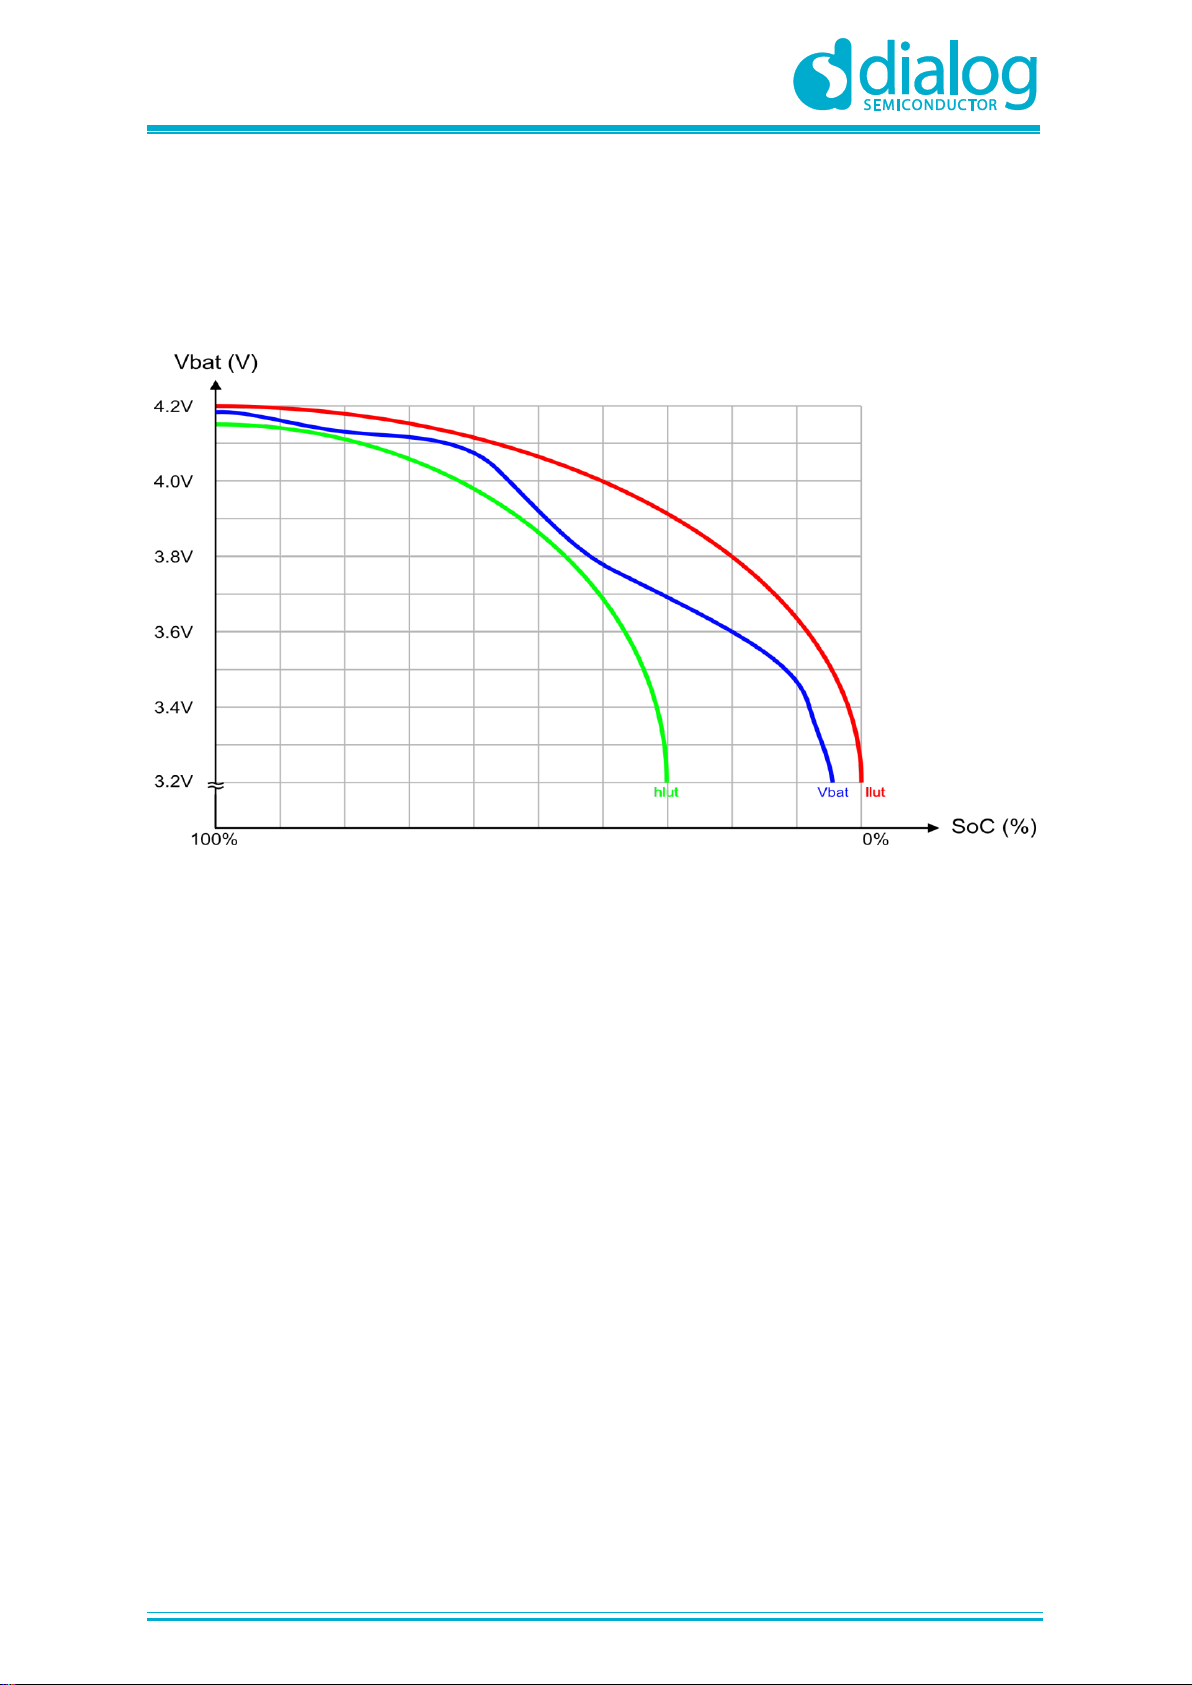
6.2 SOC Calculation
Every LUT can be illustrated as a number of points on a 2-dimensional diagram where the X-axis
shows the state of charge (SoC) values in % and the Y-axis has the battery voltage (VBAT) values in
V. The number of samples are defined by the step during the LUT generation, in this case the step
was 5% (VBAT was read every 5% SoC loss) hence there are 21 samples in this diagram. These 21
samples define a curve that shows the battery voltage decrease over the state of charge.
Page 17
UM-B-134
DA1469x State of Charge Functionality
User Manual
Revision 1.0
17-Nov-2020
17 of 22
© 2020 Dialog Semiconductor
Plotting the llut and hlut on the same diagram will result in what is shown in Figure 11. The green line
represents the hlut while the red line represents the llut. The actual battery voltage over SOC is
defined by the blue line. The algorithm tries to predict the next point on the llut curve, which, by
projecting to the X axis, will provide the next SoC estimate. The aim of the algorithm is to use all
available information to translate the current state of the battery onto the llut curve, from which the
SoC estimate is derived.
Figure 11: SoC Graph
The first step is to estimate the actual current load using inter/extrapolation.
The second step is to calculate the voltage drop rate (dV/T) based on the estimated current load.
This in combination with the previous voltage value, will provide a way to calculate the next point on
the estimated curve.
Finally, the projection of the X coordinate on the SoC (llut) axis will provide the actual state of charge.
As already explained, the assumption is that if the voltage change is small, SoC steps are linear over
a constant current load.
Page 18

UM-B-134
DA1469x State of Charge Functionality
User Manual
Revision 1.0
17-Nov-2020
18 of 22
© 2020 Dialog Semiconductor
6.3 Various Considerations
6.3.1 SoC Reporting Error
The SoC measuring software has been extensively tested with different load profiles, both statically
and dynamically. And with accurate battery profiling the reported State of Charge is well within 5% of
the actual value.
6.3.2 Accumulation Error
Since the first measurement estimates the SoC value, there will be an error. The error might appear
to be higher in the beginning, but will be smoothly adjusted over time.
6.3.3 Half Battery Charging
Even if the highest battery voltage has been reached, but EOC has not yet been reached, the
algorithm will initially make a few large errors, but will gradually get adjusted since the voltage drop
rate will move to the calculated llut curve accordingly. In practical tests, no glitches are observed
whatsoever.
6.3.4 Battery Aging
Battery aging is taken care of by the algorithm since aging will affect the starting battery capacity.
7 Conclusions
Under constant battery load current the Open Circuit Voltage is proportional to the change in State of
Charge. The algorithm can estimate the State of Charge from the graph plotted with the lookup
tables generated by battery profiling well within 5% accuracy.
Page 19

UM-B-134
DA1469x State of Charge Functionality
User Manual
Revision 1.0
17-Nov-2020
19 of 22
© 2020 Dialog Semiconductor
Appendix A Battery Conditions and Parameters
This section explains the parameters used to represent the state or condition of a battery. The
parameters are described below.
A.1 State of Charge (SoC) (%)
An expression of the present battery capacity as a percentage of maximum capacity. SoC is
generally calculated using current integration to determine the change in the battery capacity over
time.
A.2 Depth of Discharge (DoD) (%)
The percentage of battery capacity that has been discharged expressed as a percentage of the
maximum capacity. A discharge to at least 80 % DoD is seen as a deep discharge.
A.3 Terminal Voltage (V)
The voltage between the battery terminals with load applied. Terminal voltage varies with the SoC
and the discharge/charge current.
A.4 Open-Circuit Voltage (OCV)
The voltage between the battery terminals with no load applied. The open-circuit voltage depends on
the battery state of charge and increases along with the state of charge.
A.5 Internal Resistance
Internal resistance is the resistance within the battery and is generally different for charging and
discharging. It also depends on the battery state of charge. As internal resistance increases, the
battery efficiency decreases, and thermal stability is reduced as more of the charging energy is
converted into heat.
A.6 Nominal Voltage (V)
Nominal voltage is the reported or reference voltage of the battery by the vendor.
A.7 Cutoff Voltage
The minimum allowable voltage. It is this voltage that generally defines the “empty” state of the
battery.
A.8 Capacity or Nominal Capacity (Ah for a Specific C-Rate)
The coulometric capacity, the total Amp-hours available when the battery is discharged at a certain
discharge current (specified as a C-rate) from 100 percent state-of-charge to the cutoff voltage.
Capacity is calculated by multiplying the discharge current (in Amps) by the discharge time (in hours)
and decreases with an increasing C-rate.
A.9 Charge Voltage
Charge Voltage is the voltage that the battery is charged to when charged to full capacity. Charging
schemes generally consist of a constant current charging until the battery voltage reaches the charge
voltage, then there is constant voltage charging, allowing the charge current to taper until it is very
small.
Page 20

UM-B-134
DA1469x State of Charge Functionality
User Manual
Revision 1.0
17-Nov-2020
20 of 22
© 2020 Dialog Semiconductor
A.10 Float Voltage
The voltage at which the battery is maintained after being charged to 100 percent SoC to maintain
that capacity by compensating for self-discharge of the battery.
A.11 (Recommended) Charge Current
The ideal current at which the battery is initially charged (to roughly 50 to 70 percent SoC) under
constant charging scheme before transitioning into constant voltage charging.
Page 21

UM-B-134
DA1469x State of Charge Functionality
User Manual
Revision 1.0
17-Nov-2020
21 of 22
© 2020 Dialog Semiconductor
Revision History
Revision
Date
Description
1.0
17-Nov-2020
Initial Release
Page 22

UM-B-134
DA1469x State of Charge Functionality
User Manual
Revision 1.0
17-Nov-2020
22 of 22
© 2020 Dialog Semiconductor
Status Definitions
Status
Definition
DRAFT
The content of this document is under review and subject to formal approval, which may result in modifications or
additions.
APPROVED
or unmarked
The content of this document has been approved for publication.
Disclaimer
Unless otherwise agreed in writing, the Dialog Semiconductor products (and any associated software) referred to in this document are not
designed, authorized or warranted to be suitable for use in life support, life-critical or safety-critical systems or equipment, nor in applications
where failure or malfunction of a Dialog Semiconductor product (or associated software) can reasonably be expected to result in personal injury,
death or severe property or environmental damage. Dialog Semiconductor and its suppliers accept no liability for inclusion and/or use of Dialog
Semiconductor products (and any associated software) in such equipment or applications and therefore such inclusion and/or use is at the
customer’s own risk.
Information in this document is believed to be accurate and reliable. However, Dialog Semiconductor does not give any representations or
warranties, express or implied, as to the accuracy or completeness of such information. Dialog Semiconductor furthermore takes no
responsibility whatsoever for the content in this document if provided by any information source outside of Dialog Semiconductor.
Dialog Semiconductor reserves the right to change without notice the information published in this document, including, without limitation, the
specification and the design of the related semiconductor products, software and applications. Notwithstanding the foregoing, for any automotive
grade version of the device, Dialog Semiconductor reserves the right to change the information published in this document, including, without
limitation, the specification and the design of the related semiconductor products, software and applications, in accordance with its standard
automotive change notification process.
Applications, software, and semiconductor products described in this document are for illustrative purposes only. Dialog Semiconductor makes
no representation or warranty that such applications, software and semiconductor products will be suitable for the specified use without further
testing or modification. Unless otherwise agreed in writing, such testing or modification is the sole responsibility of the customer and Dialog
Semiconductor excludes all liability in this respect.
Nothing in this document may be construed as a license for customer to use the Dialog Semiconductor products, software and applications
referred to in this document. Such license must be separately sought by customer with Dialog Semiconductor.
All use of Dialog Semiconductor products, software and applications referred to in this document is subject to Dialog Semiconductor’s Standard
Terms and Conditions of Sale, available on the company website (www.dialog-semiconductor.com) unless otherwise stated.
Dialog, Dialog Semiconductor and the Dialog logo are trademarks of Dialog Semiconductor Plc or its subsidiaries. All other product or service
names and marks are the property of their respective owners.
© 2020 Dialog Semiconductor. All rights reserved.
RoHS Compliance
Dialog Semiconductor’s suppliers certify that its products are in compliance with the requirements of Directive 2011/65/EU of the European
Parliament on the restriction of the use of certain hazardous substances in electrical and electronic equipment. RoHS certificates from our
suppliers are available on request.
Contacting Dialog Semiconductor
United Kingdom (Headquarters)
Dialog Semiconductor (UK) LTD
Phone: +44 1793 757700
Germany
Dialog Semiconductor GmbH
Phone: +49 7021 805-0
The Netherlands
Dialog Semiconductor B.V.
Phone: +31 73 640 8822
North America
Dialog Semiconductor Inc.
Phone: +1 408 845 8500
Japan
Dialog Semiconductor K. K.
Phone: +81 3 5769 5100
Taiwan
Dialog Semiconductor Taiwan
Phone: +886 281 786 222
Hong Kong
Dialog Semiconductor Hong Kong
Phone: +852 2607 4271
Korea
Dialog Semiconductor Korea
Phone: +82 2 3469 8200
China (Shenzhen)
Dialog Semiconductor China
Phone: +86 755 2981 3669
China (Shanghai)
Dialog Semiconductor China
Phone: +86 21 5424 9058
Email:
enquiry@diasemi.com
Web site:
www.dialog-semiconductor.com
 Loading...