

Page 1
USER’S GUIDE
DEXCOM G4
®
PLATINUM
CONTINUOUS GLUCOSE MONITORING SYSTEM
IMPORTANT CONTACTS AND NUMBERS
Dexcom® Website:
Your Transmitter ID:
Your Receiver ID:
Your Healthcare Professional:
Nearest Hospital:
© 2014 Dexcom, Inc. All rights reserved.
Dexcom, Dexcom G4, Dexcom G4 PLATINUM, Dexcom Studio, SEVEN, Stay Between the Lines and
Dexcom Makes Sense are either registered trademarks or trademarks of Dexcom, Inc. in the United States
and/or other countries. All other product or company names that may be mentioned in this publication are
tradenames, trademarks or registered trademarks of their respective owners.
www.dexcom.com
1
Page 2

DEXCOM G4 PLATINUM CONTINUOUS GLUCOSE MONITORING SYSTEM
table of contents
[Page numbering will be updated after professional layout]
GLOSSARY 6
CHAPTER 1: DEXCOM G4 PLATINUM CONTINUOUS
GLUCOSE MONITORING (CGM) SYSTEM DESCRIPTION 9
1.1 System Contents 11
1.2 Introduction 12
1.3 Sensor Overview 13
1.4 Transmitter Overview 14
1.5 Receiver Overview 15
1.6 Share Overview
CHAPTER 2: INDICATIONS FOR USE AND SAFETY
STATEMENT 17
2.1 INDICATIONS FOR USE 19
2.2 IMPORTANT USER INFORMATION 19
2.3 CONTRAINDICATIONS 20
2.4 WARNINGS 20
2.5 PRECAUTIONS 22
2.6 CAUTION 24
CHAPTER 3: RISKS AND BENEFITS 25
3.1 Risks 27
3.2 Benefits 28
CHAPTER 4: CHARGING YOUR RECEIVER AND THE
RECEIVER MAIN MENU 31
4.1 Charging Your Receiver Battery 33
4.1.1 Charging Your Receiver Battery from an AC Power Outlet 34
4.1.2 Charging Your Receiver Battery from a Windows Compatible
Computer 35
4.1.3 Knowing Your Receiver is Charged 36
4.2 Receiver Menu Options 36
CHAPTER 5: DEXCOM G4 PLATINUM SYSTEM SETUP 39
5.1 Setting Up the Receiver and Pairing with Your Transmitter 41
5.2 The Settings Menu 43
5.2.1 Getting to the Settings Menu 43
5.2.2 Setting Your Receiver Time and Date 43
5.2.3 Entering Your Transmitter ID
5.2.4 Turning On Share On Your Receiver 44
5.3 Checking Information About Your Dexcom G4 PLATINUM
System 45
5.4 Transmitter and Receiver Communication 46
2
Page 3

CHAPTER 6: INSERTING A SENSOR AND STARTING ASENSOR
SESSION 49
6.1 Before You Start 52
6.2 Removing the Sensor from its Packaging 53
6.3 Choosing an Insertion Site 54
6.4 Placing the Sensor 55
6.5 Sensor Insertion 56
6.6 Transmitter Attachment 58
6.7 Starting a Sensor Session 59
6.8 Sensor Startup Period 60
6.9 Taping the Sensor Pod 61
6.10 Temporary Receiver Shutdown 62
6.11 The Dexcom G4 PLATINUM System and Water 63
CHAPTER 7: CALIBRATING YOUR DEXCOM G4 PLATINUM
SYSTEM 65
7.1 Calibration Overview 67
7.2 How to Calibrate 69
7.3 Startup Calibration 72
7.4 12-Hour Calibration Update 73
7.5 Other Reasons You May Need to Calibrate 73
CHAPTER 8: SENSOR GLUCOSE READINGS AND
TRENDS 75
8.1 Sensor Glucose Readings 78
8.2 Rate of Change Arrows 81
8.3 Glucose Status Area Symbols 84
CHAPTER 9: ALERTS, ALARM & PROFILES 87
9.1 Setting Your Alerts 89
9.1.1 Default Alert/Alarm Settings 89
9.1.2 Glucose Alerts & Alarm 91
9.1.2.1 High Glucose Alert 92
9.1.2.2 Low Glucose Alert 92
9.1.2.3 Low Glucose Alarm 93
9.1.3 Getting to the Alerts Menu 93
9.1.4 High and Low Glucose Alerts 94
9.2 Advanced Alerts 95
9.2.1 Setting a Snooze Time for Your High and Low Glucose Alerts
96
9.2.2 Rise and Fall Glucose Rate Alerts 96
9.2.3 Setting the Out of Range Alert 98
9.3 Alert Profiles 100
9.3.1 Alert Profile Options 101
9.3.2 Alert Profile Details 102
CHAPTER 10: EVENTS AND DEXCOM STUDIO™
SOFTWARE 105
10.1 Events 107
3
Page 4

10.1.1 Selecting an Event 107
10.1.2 Setting the Date and Time for an Event 108
10.1.3 Carbohydrates 109
10.1.4 Insulin 110
10.1.5 Exercise 111
10.1.6 Health 112
10.2 Dexcom Studio Software 113
CHAPTER 11: ENDING A SENSOR SESSION 115
11.1 Automatic Sensor Shut-Off 117
11.2 Removing a Sensor 118
11.3 Transmitter Removal 119
CHAPTER 12: TAKING CARE OF YOUR DEXCOM G4
PLATINUM SYSTEM 121
12.1 Maintenance 123
12.2 Storage 123
12.3 Product Disposal 124
CHAPTER 13: TROUBLESHOOTING 125
13.1 Sensor Insertion Troubleshooting 127
13.2 Calibration Troubleshooting 128
13.2.1 Types Of Calibration Prompts 129
13.2.2 What To Do For Calibration Prompts 130
13.3 Calibration Error Troubleshooting 130
13.4 System Glucose Error 131
13.5 Sensor Inaccuracies 132
13.6 Sensor Shut-Off Troubleshooting 134
13.6.1 Early Sensor Shut-Off - Sensor Failure 134
13.6.2 Manual Sensor Shut-Off - “Stop Sensor” 135
13.7 Share Pairing Error Troubleshooting 136
13.8 Battery and Charger Troubleshooting 136
13.9 Receiver and Transmitter Communication Troubleshooting 137
13.9.1 System Recovery Check 137
13.9.2 Receiver Error Code 137
13.9.3 Low Transmitter Battery 138
13.9.4 Transmitter Failed Error Code 138
13.10 Out of Range/No Antenna 138
13.11 Alerts Are Not Working 139
CHAPTER 14: TECHNICAL INFORMATION 141
14.1 Device Performance Characteristics 143
14.2 Product Specifications 162
14.3 FCC Requirements 175
CHAPTER 15: USER ASSISTANCE 177
CHAPTER 16: WARRANTY 181
CHAPTER 17: TRAVEL INFORMATION 189
4
Page 5

CHAPTER 18: APPENDIX 193
Appendix I, Receiver Alerts, Alarm and Prompt 195
Appendix II, Index 204
Appendix III, Symbols Used in Labeling 209
5
Page 6
GLOSSARY
Alternative Site BG
Testing
Applicator
BG Meter
BG Value
Bluetooth
Calibration
CGM
This is when you take a blood glucose value on your meter using a blood sample
from an area on your body other than your fingertip. Do not use alternative site
testing to calibrate your receiver.
A disposable piece that comes attached to the sensor pod and inserts the sensor
under the skin. There is a needle inside the applicator that you remove after you
insert the sensor.
Blood glucose meter. A device used to measure how much glucose is in the blood.
You can use any commercially available meter for testing your blood glucose.
Blood glucose value. The measurement of glucose in the blood. A blood glucose
value taken with your commercially available blood glucose meter.
Bluetooth® wireless technology allows devices to wirelessly communicate with
each other. In this case, communication between the Receiver and your iPhone /
iPod touch device.
When you enter blood glucose values from a blood glucose meter into the
receiver. Calibrations are needed for your receiver to show continuous sensor
glucose readings and trend information. (Do not use alternative site testing for
calibration).
Continuous Glucose Monitoring.
Commercially
Available
Default
Dexcom G4
PLATINUM System
Dexcom Share
System
Glucose Data Gaps
Glucose Trends
Hypoglycemia
Hyperglycemia
Product that may be sold in the United States.
A setting that is selected automatically, unless you choose another option.
The sensor, transmitter, and receiver.
Secondary notification system to the Dexcom G4 PLATINUM System. For more
information, please refer to the Dexcom Share User Manual.
Different symbols show on the trend graph instead of a sensor glucose reading to
let you know that the receiver cannot provide a reading.
Trends let you see the pattern of your glucose levels. The trend graph shows
where your glucose levels have been during the time shown on the screen and
where your glucose levels are now.
Low blood glucose. Same as “low.” The default low alert in your receiver is set to
80 mg/dL. Consult your healthcare provider to determine the appropriate
hypoglycemic setting for you.
High blood glucose. Same as “high.” The default high alert in your receiver is set to
200 mg/dL. Consult your healthcare provider to determine the appropriate
hyperglycemic setting for you.
6
Page 7
HypoRepeat
Optional receiver alert setting that keeps repeating the fixed low alarm every 5
seconds until your sensor glucose value rises above 55 mg/dL or you confirm it.
This profile can be helpful if you want extra awareness for severe lows.
mg/dL
Obstruction
Profiles
Range
Re-Alert
Receiver
Rise and Fall
(Rate of Change)
Alerts
RF
Milligrams per deciliter. The standard unit of measure for sensor glucose readings
in the United States.
Something that blocks the wireless path between the transmitter and receiver.
There are many types of things that could come between the transmitter and
receiver, and Dexcom could not test them all. “Without obstruction” means that we
have not tested whether items blocking the transmitter or receiver could affect the
transmission range.
Sound pattern and volume level settings for your alerts.
The distance between the receiver and transmitter. Keep the two devices within 20
feet of each other without obstruction to get glucose information on your receiver.
A re-alert happens after the first alert is not confirmed.
The small device that collects your glucose information from the
sensor/transmitter. Your results show on the receiver screen as a sensor glucose
reading (mg/dL) and as a trend.
Alerts based on how fast and how much your glucose levels rise or fall.
Radio-frequency transmission used to send glucose information from the
transmitter to the receiver.
Safety Lock
Sensor
Sensor Pod
Snoozing
Startup Period
System Reading
Transmitter
The safety lock keeps the needle inside the applicator before you are ready to
insert the sensor. It also helps you snap the transmitter out of the sensor pod after
your sensor session ends.
The Dexcom G4 PLATINUM System part that includes an applicator and wire. The
applicator inserts the wire under your skin, and the wire measures glucose levels
in your tissue fluid.
The small plastic base of the sensor attached to your belly that holds the
transmitter in place.
The option to delay your alert for a set amount of time. A snooze time can be set
for high and low glucose re-alerts.
The 2-hour period after you tell the receiver you inserted a new sensor. Sensor
glucose readings are not provided during this time.
A sensor glucose reading shown on your receiver. This reading is in mg/dL units
and is updated every 5 minutes.
The Dexcom G4 PLATINUM System part that snaps into the sensor pod and
7
Page 8
wirelessly sends glucose information to your receiver.
Transmitter ID
Transmitter Latch
Trend (Rate of
Change) Arrows
A series of numbers and/or letters that you enter into your receiver to let it
communicate with the transmitter.
The small, disposable piece that snaps the transmitter into the sensor pod. It is
removed after the transmitter is snapped in.
Arrows on trend graphs that show how fast your glucose levels are changing.
There are 7 different arrows that show when your glucose speed and direction
change.
8
Page 9
CHAPTER 1: DEXCOM G4® PLATINUM CONTINUOUS GLUCOSE
MONITORING (CGM) SYSTEM DESCRIPTION
1.1 SYSTEM CONTENTS:
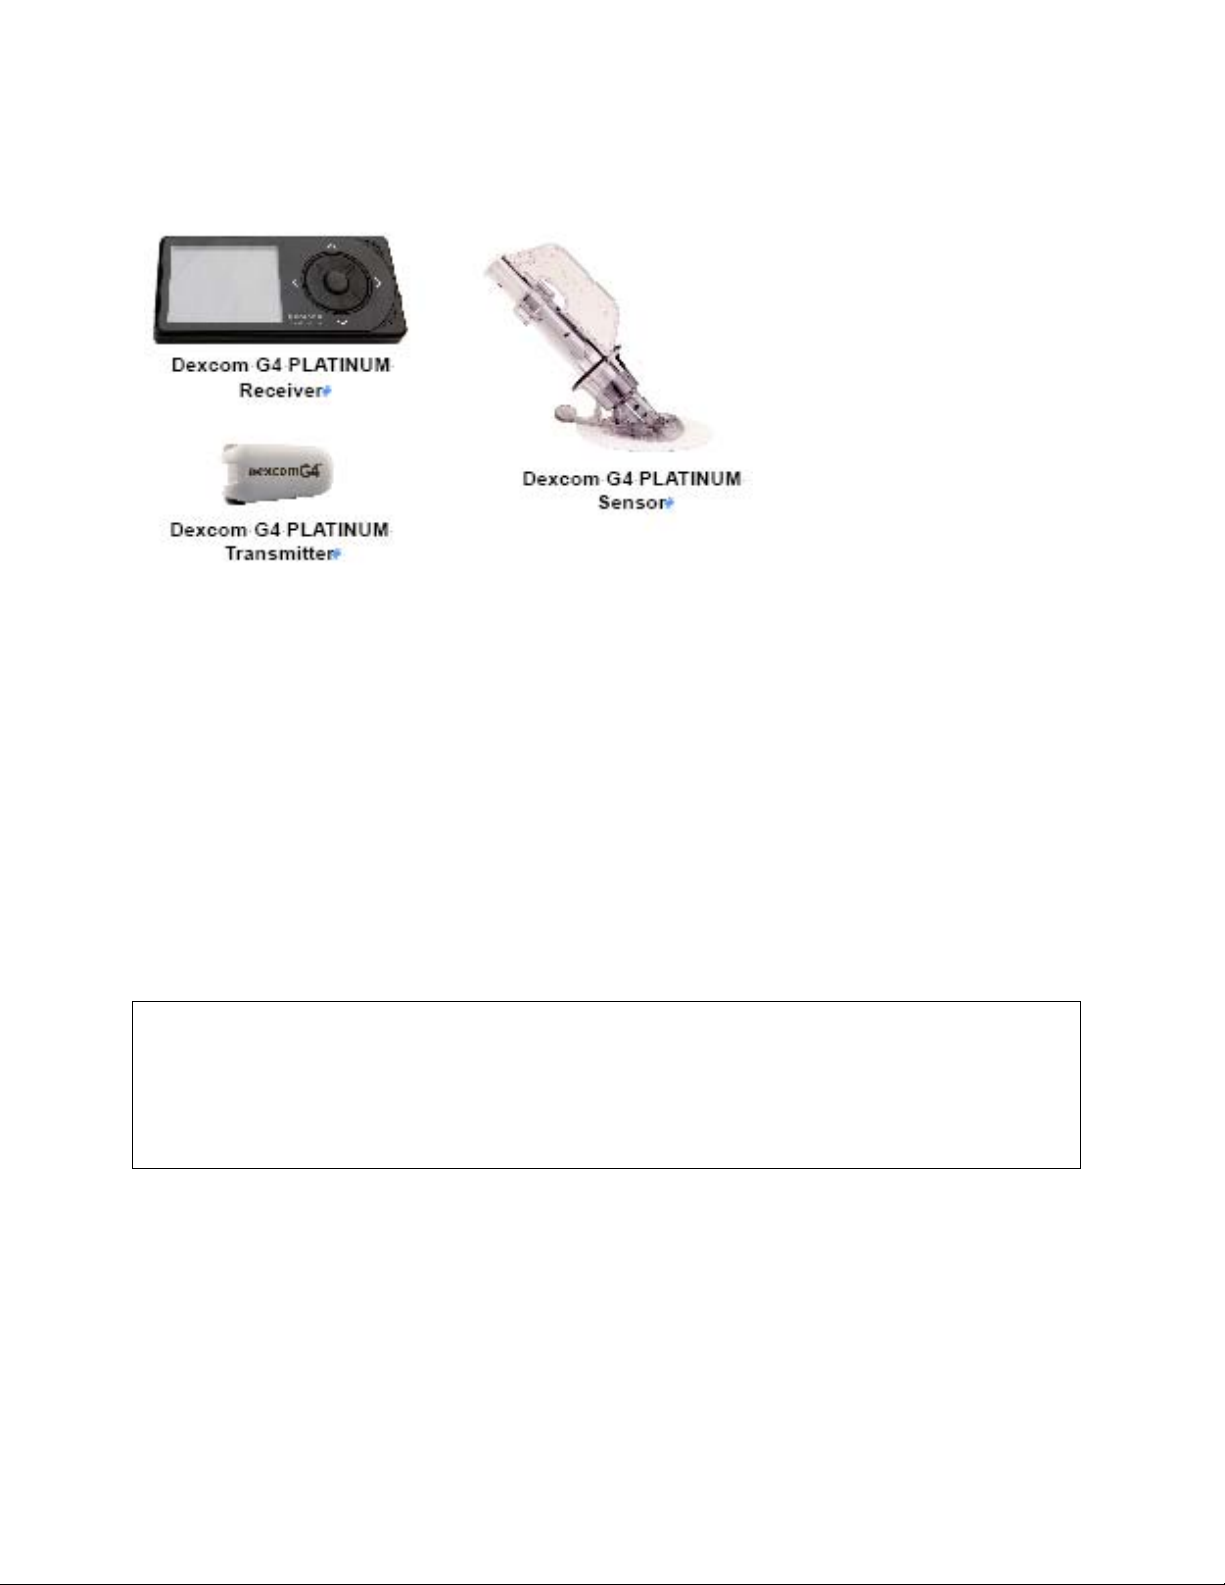
• sensor
• transmitter
• receiver
• receiver USB charging/download cable
• AC power adapter - MT21255
• receiver case
• user’s guide
• quick start guide
• training checklist
• tutorial disc
• Dexcom Studio
Sensors are sold separately. Commercially distributed blood glucose (BG) meter required for use.
PRECAUTION
®
software (available for download online at www.dexcom.com)
The Dexcom G4 PLATINUM Sensor, Transmitter, and Receiver are not compatible
with the SEVEN®/SEVEN® PLUS Transmitter and Receiver. Different generations will
not connect with each other and will not work. Also, make sure to use the correct
version of Dexcom Studio with your system.
1.2 INTRODUCTION
When you use the system, you will see continuous sensor glucose readings updated every 5 minutes for up
to 7 days. These readings will help you notice trends and patterns in your glucose levels.
The system includes the sensor, the transmitter, and the receiver. The sensor is a disposable unit that you
insert under the skin of your abdomen (belly) to continuously monitor your glucose levels for up to 7 days.
The transmitter is a reusable device that wirelessly sends your sensor’s glucose information to your
receiver. The receiver is a hand-held device that receives and displays your glucose information.
9
Page 10
Please read this user’s guide closely. It describes how to use your system.
In addition, Dexcom has a self-guided training tutorial for the Dexcom G4 PLATINUM CGM System.
Some people have found this to be an effective method of product training. Please review the tutorial on
the disc and discuss with your healthcare professional to decide if the Dexcom G4 PLATINUM System
Tutorial is a good training option for you. The tutorial disc can only be used with your computer and
cannot be used in DVD players. The tutorial is also found on the Dexcom website – www.dexcom.com.
1.3 SENSOR OVERVIEW
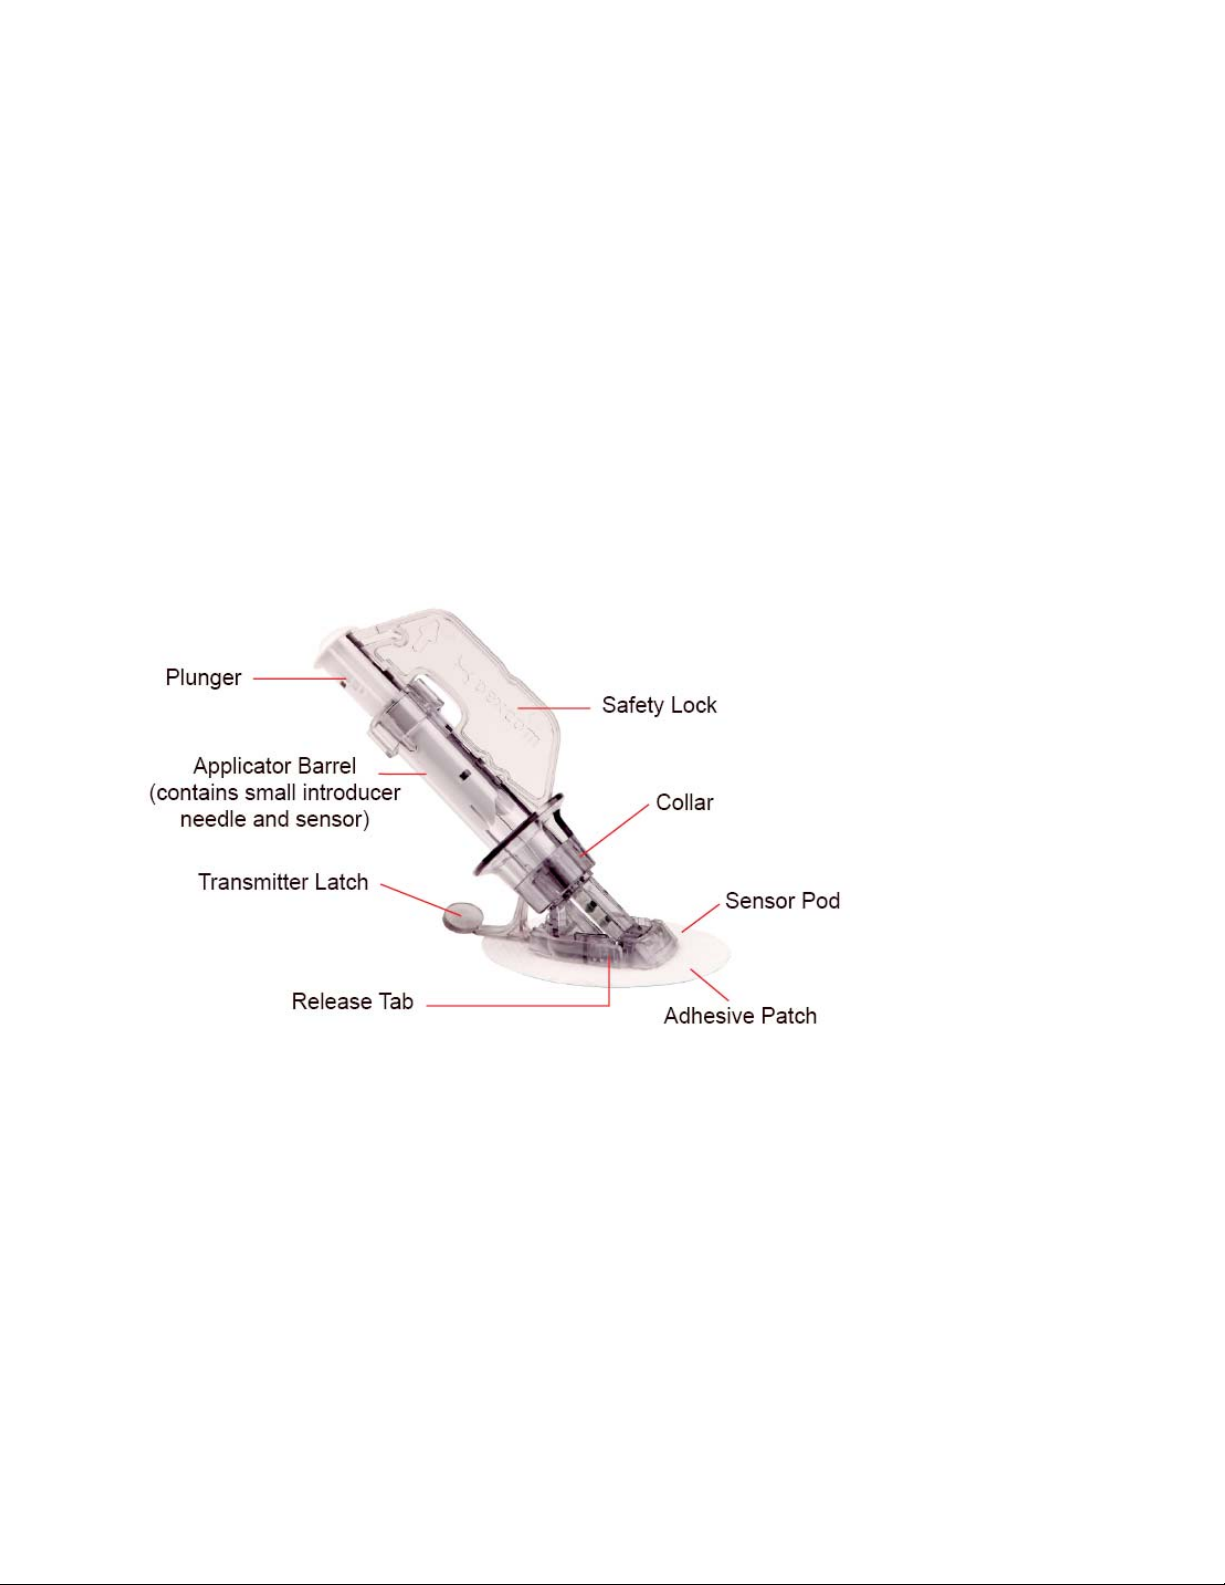
The sensor is the piece that comes in a sterile, sealed sensor pouch. The sensor is made up of an
applicator, a sensor pod, and a sensor wire. You remove the applicator after insertion. The sensor pod stays
on your belly for the entire sensor session, up to 7 days. The pod is made of plastic and an adhesive patch.
The sensor wire is thin and flexible, and inserts just under the skin of your belly. It is attached to the sensor
pod, and is made of silver and platinum metal with polymer membranes. You discard the sensor at the end
of the session.
See Chapter 14 for Product Specifications.
1.4 TRANSMITTER OVERVIEW
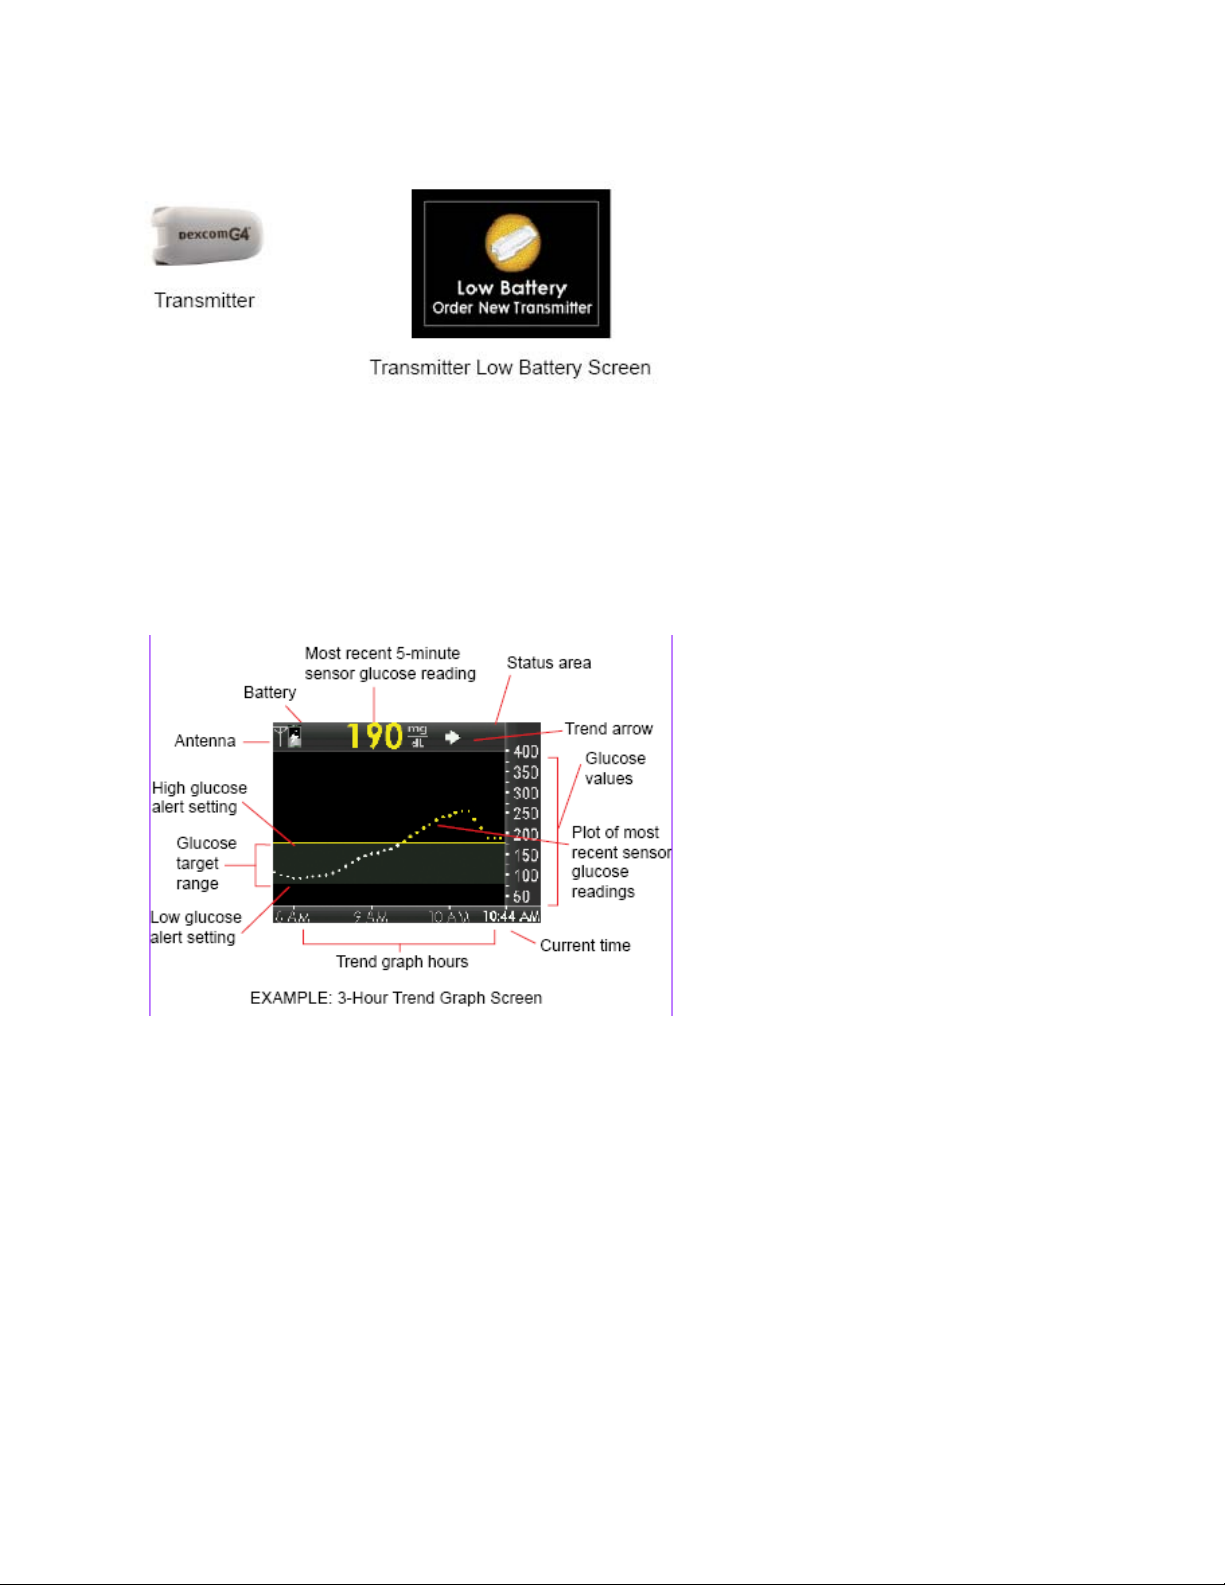
The transmitter is the gray, plastic “chip” that snaps into your sensor pod. The 9438-01 transmitter (including
sensor pod) is 1.5 inches long, 0.9 inches wide and 0.5 inches thick. The 9438-05 transmitter (including
sensor pod) is 1.5 inches long, 0.9 inches wide and 0.4 inches thick. Once snapped into the sensor pod, the
transmitter wirelessly sends your glucose information to the receiver. The transmitter and sensor are water
resistant when properly connected. Do not throw away your transmitter. It is reusable.
The transmission range from the transmitter to the receiver is up to 20 feet without obstruction. Wireless
communication does not work well through water, so the range is much less if you are in a pool, bathtub or
water bed.
The transmitter battery will last at least 6 months. Once you see the transmitter low battery screen, replace
the transmitter as soon as possible. Your transmitter battery may drain as quickly as one week after this
alert appears.
10
Page 11
See Chapter 14 for Product Specifications.
1.5 RECEIVER OVERVIEW
The receiver is the small hand-held device that looks like a cell phone. It is about 4 inches long, 1.8 inches
wide and 0.5 inches thick. It shows your sensor glucose readings, trend graph, direction and rate of change
arrow.
Do not spill fluids on the receiver or drop the receiver into fluids. Keep the micro USB port door closed to
help prevent fluid and dust from getting inside the receiver.
The trend graph screen on your receiver shows your sensor glucose readings, trend graph, direction and
rate of change arrow.
There are five receiver buttons to move you through the screens. The trend graph screens show sensor
glucose readings, trend graphs and trend arrows. The receiver menu screens let you change your receiver
settings.
Your receiver and transmitter wirelessly pair together to communicate securely and only with each other.
You will need a commercially available blood glucose meter to use with your system.
See Section 14 for Product Specifications.
11
Page 12
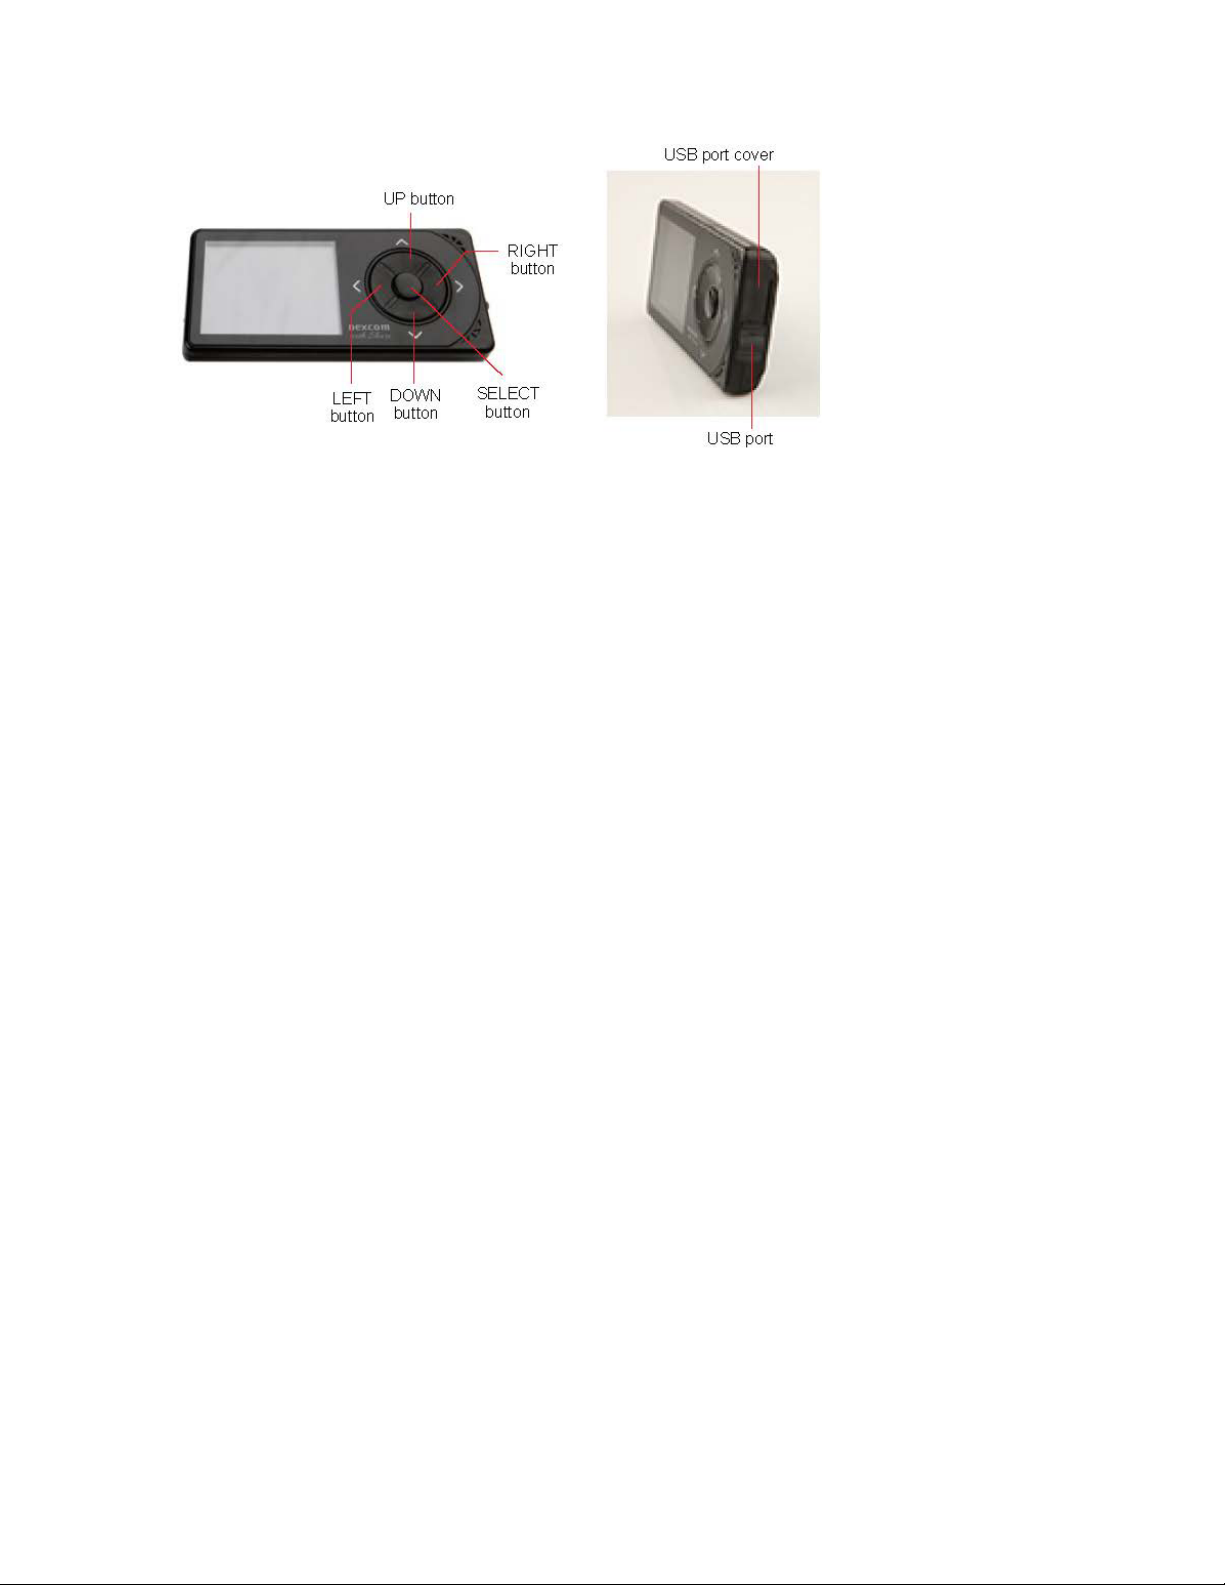
Receiver buttons:
• Press the UP and
• Press the
• Press the
• Press the
SELECT
LEFT
RIGHT
DOWN
button to go back to the last item or screen.
button to highlight the next item.
1.6 SHARE OVERVIEW
Dexcom Share™ remote monitoring system lets one person, the Sharer, transfer Dexcom G4 PLATINUM
Continuous Glucose Monitoring information to another person, the Follower.
Learn more about Dexcom Share by reading the Dexcom Share User Manual.
buttons to scroll through trend screens, highlight menu items, or set values.
button to turn the receiver on or select the highlighted option.
12
Page 13

CHAPTER 2: INDICATIONS FOR USE AND SAFETY STATEMENT
2.1 INDICATIONS FOR USE
The Dexcom G4 PLATINUM Continuous Glucose Monitoring System is a glucose
monitoring device indicated for detecting trends and tracking patterns in persons
and older)
prescription.
The Dexcom G4 PLATINUM System is indicated for use as an adjunctive device to
complement, not replace, information obtained from standard home glucose monitoring
devices.
The Dexcom G4 PLATINUM System aids in the detection of episodes of hyperglycemia
and hypoglycemia, facilitating both acute and long-term therapy adjustments, which may
minimize these excursions. Interpretation of the Dexcom G4 PLATINUM System results
should be based on the trends and patterns seen with several sequential readings over
time.
with diabetes. The system is intended for single patient use and requires a
(age 18
2.2 IMPORTANT USER INFORMATION
Please review your product instructions before using your continuous glucose monitoring
system. Contraindications, warnings, precautions, cautions, and other important user
information can be found in your product instructions. Discuss with your healthcare
professional how you should use your sensor trend information to help manage your
diabetes. Your product instructions contain important information on troubleshooting your
system and on the performance characteristics of the device.
2.3 CONTRAINDICATIONS
Remove the Dexcom G4 PLATINUM Sensor, Transmitter, and Receiver before
Magnetic Resonance Imaging (MRI), Computed Tomography (CT) scan, or diathermy
treatment. The device is MR Unsafe. Do not bring any portion of the device into the MR
environment. The Dexcom G4 PLATINUM System has not been tested during MRI or CT
scans or with diathermy treatment. The magnetic fields and heat could damage the
device so that it might not display sensor glucose readings or provide alerts, and you
might miss a low or high blood glucose value.
• Taking medications with acetaminophen (such as Tylenol®) while wearing the sensor
may falsely raise your sensor glucose readings. The level of inaccuracy depends on the
amount of acetaminophen active in your body and may be different for each person.
2.4 WARNINGS
• Thoroughly review the training materials included with your CGM system before using
the Dexcom G4 PLATINUM CGM System. Incorrect use might lead to you
misunderstanding the information provided by your system, or might affect system
performance, and you might miss a low or high blood glucose value.
• Do not use the Dexcom G4 PLATINUM System for treatment decisions, such as how
much insulin you should take. The Dexcom G4 PLATINUM System does not replace a
13
Page 14

blood glucose meter. Always use the values from your blood glucose meter for treatment
decisions. Blood glucose values may differ from sensor glucose readings. Using the
sensor glucose readings for treatment decisions could lead to low or high blood glucose
value.
• Do not ignore symptoms of high and low glucose. If your sensor glucose readings do not
match your symptoms, measure your blood glucose with a blood glucose meter even if
your sensor is not reading in the high or low range, so you do not miss a low or high blood
glucose value.
• Calibrate at least once every 12 hours. Calibrating less often than every 12 hours might
cause sensor glucose readings to be inaccurate, and you might miss a low or high blood
glucose value.
• Sensors may fracture on rare occasions. If a sensor breaks and no portion of it is visible
above the skin, do not attempt to remove it. Seek professional medical help if you have
symptoms of infection or inflammation—redness, swelling or pain—at the insertion site. If
you experience a broken sensor, please report this to our Technical Support department
at
1.877.339.2664 or 1.858.200.0200.
• The Dexcom G4 PLATINUM System
adolescents, pregnant women or persons on dialysis.
• It is not known how different conditions or medications common to the critically ill
population may affect the performance of the system. Therefore, the use of this system in
the critically ill population is not recommended.
• Sensor placement and insertion
(abdomen).
• If your transmitter or receiver case is damaged/cracked, do not use it. This could create
an electrical safety hazard or malfunction, which might cause electrical shocks.
• Store the sensor at temperatures between 36° F - 77° F for the length of the sensor’s
shelf life. You may store the sensor in the refrigerator if it is within this temperature
range. The sensor should not be stored in a freezer. Storing the sensor improperly
might cause the sensor glucose readings to be inaccurate, and you might miss a low or
high blood glucose value.
2.5 PRECAUTIONS
• Before opening the sensor package, wash your hands with soap and water, and let
them dry. You may contaminate the insertion site and suffer an infection if you have dirty
hands while inserting the sensor.
is not approved for use
is not approved
for sites other than the belly
in children or
• Before inserting the sensor, clean the skin with a topical antimicrobial solution, such as
isopropyl alcohol, and allow to dry. This may help prevent infection. Do not insert the
sensor until the cleaned area is dry so the sensor adhesive will stick better.
• Change the site where you place the sensor with each insertion. Using the same site too
often might not allow the skin to heal, and might cause scarring or skin irritation.
• Avoid inserting the sensor in areas that are likely to be bumped, pushed or compressed
or areas of skin with scarring, tattoos, or irritation as these are not ideal sites to measure
14
Page 15

glucose. Insertion in those areas might affect sensor performance, and you might miss a
low or high blood glucose value.
• Avoid injecting insulin or placing an insulin pump infusion set within 3 inches of the
sensor. The insulin might affect sensor performance, and you might miss a low or high
blood glucose value.
• Do not use the sensor if its sterile package has been damaged or opened. Using an
unsterile sensor might cause infection.
• To calibrate the system, enter the exact blood glucose value that your blood glucose
meter displays within 5 minutes of a carefully performed blood glucose measurement.
Entering incorrect blood glucose values or blood glucose values from more than 5
minutes before entry might affect sensor performance, and you might miss a low or high
blood glucose value.
• Do not calibrate if your blood glucose is changing at a significant rate, typically more
than 2 mg/dL per minute. Do not calibrate when your receiver screen is showing the
rising single arrow or double arrow, which indicates that your blood glucose is rising 2-3
mg/dL/min or more than 3 mg/dL/min. Also, do not calibrate when your receiver screen
is showing the falling single arrow or double arrow, which indicates that your blood
glucose is falling 2-3 mg/dL/min or more than 3 mg/dL/min. Calibrating during significant
rise or fall of blood glucose may affect accuracy of sensor glucose readings.
• The system accuracy may be affected when your glucose is changing at a significant
rate (e.g., 2-3 mg/dL/min or more than 3 mg/dL each minute), such as during exercise
or after a meal.
• The transmission range from the transmitter to the receiver is up to 20 feet without
obstruction. Wireless communication does not work well through water so the range is
much less if you are in a pool, bathtub, or on a water bed, etc. Types of obstruction differ
and have not been tested. If your transmitter and receiver are farther than 20 feet apart or
are separated by an obstruction, they might not communicate or the communication
distance may be shorter and you might miss a low or high blood glucose value.
• Keep the USB port cover on the receiver closed whenever the USB cable is not
attached. If water gets into the USB port, the receiver could become damaged and stop
displaying readings or providing alerts, and you might miss a low or high blood glucose
value.
• Do not use alternative blood glucose site testing (blood from your palm or forearm, etc.)
for calibration. Alternative site blood glucose values may be different than those taken
from a fingerstick blood glucose value and may not represent the timeliest blood glucose
value. Use a blood glucose value taken only from a fingerstick for calibration. Alternative
site blood glucose values might affect sensor performance, and you might miss a low or
high blood glucose value.
• Do not discard your transmitter. It is reusable. The same transmitter is used for each
session until you have reached the end of the transmitter battery life.
15
Page 16

• The Dexcom G4 PLATINUM Sensor, Transmitter, and Receiver are not compatible
with the SEVEN/SEVEN PLUS Transmitter and Receiver. Different generations will not
connect with each other and will not work. Also make sure to use the correct version of
Dexcom Studio with your system.
2.6 CAUTION
U.S. (Federal) law restricts the sale of the Dexcom G4 PLATINUM System to sale by or
on order of a physician.
16
Page 17

CHAPTER 3: RISKS AND BENEFITS
3.1 RISKS
There are some known risks with using real-time CGM.
You will not get sensor glucose alerts when the alert function is turned off, your
transmitter and receiver are out of range, or when your receiver is not showing sensor
glucose readings. You might not notice alerts if you are unable to hear them or feel the
vibration. Sometimes your sensor glucose reading may be slightly different than your
blood glucose meter. For example, your blood glucose meter may show a blood glucose
value of 78 mg/dL, but your sensor glucose reading may show as 82 mg/dL. If your low
alert is set at 80 mg/dL, your system will not alert for a low glucose at this time because
82 mg/dL is still above your low alert setting. In most cases, the sensor glucose readings
will move in the right direction and will alert you of a high or low shortly after. If you do not
get an alert for any reason, and you do not take frequent blood glucose measurements
with your blood glucose meter, you might not be aware of low or high blood glucose
levels. If this happens, and your blood glucose levels are very high or low, there is a
remote chance you might need medical help.
Inserting the sensor and wearing the adhesive patch might cause infection, bleeding, pain
or skin irritations (redness, swelling, bruising, itching, scarring or skin discoloration). There
is a low chance of this happening. In the clinical study for the Dexcom G4 PLATINUM
System, only slight redness and swelling occurred in a few patients. If any of these events
happen, you might feel discomfort in the area the sensor is inserted.
There is a remote chance that a sensor fragment could remain under your skin if the
sensor breaks while you are wearing it. This did not happen in the clinical study for the
Dexcom G4 PLATINUM System. If you think a sensor has broken under your skin,
contact your healthcare provider and call Dexcom’s Technical Support. Sensor breakage
may cause some anxiety, but it is not a significant medical risk.
3.2 BENEFITS
Real-time CGM provides benefits beyond the information you get from a blood glucose
meter. It provides glucose readings every five minutes for up to seven days to help you
detect trends and patterns in your glucose levels. This trend information can help you see
where your glucose is now as well as where your glucose may be heading and how fast
you may be getting there. Understanding your glucose trends may help you take action to
help avoid high or low glucose values.
17
Page 18

Alerts and the low alarm tell you when your glucose is outside of your target glucose
range and may help you avoid low and high blood sugar. Rise and fall glucose alerts can
also provide benefit by alerting you when your glucose is rapidly going down or up. This
way you can be alerted to this information before you are too high or too low and take
action to avoid it. Real-time CGM can help increase time in your target glucose range
without increasing your time in the low or high glucose range.
1
Real-time CGM can help improve diabetes control (lower A1c values, reducing glycemic
variability and time spent in low and high blood glucose ranges)
reduce diabetes related complications.
4, 5
These benefits can be seen especially with
1, 2 , 3
which can help
using real-time CGM at least 6 days per week2 and can be sustained over time.6 In some
cases, patients perceived an increase in their quality of life and peace of mind when using
real-time CGM as well as reporting a high satisfaction with CGM.
1
Garg S, Zisser H, Schwartz S, Bailey T, Kaplan R, Ellis S, Jovanovic L. Improvement in glycemic
excursions with a transcutaneous, real-time continuous glucose sensor: a randomized controlled trial.
Diabetes Care. 2006; 29:44-50.
2
JDRF CGM Study Group. Continuous Glucose Monitoring and Intensive Treatment of Type 1 Diabetes.
NEJM 2008;359:1464-76.
3
Battelino. Effect of continuous glucose monitoring of hypoglycemia in type 1 diabetes. Diabetes Care
2011; 34(4): 795-800.
4
The Diabetes Control and Complications Research Group. The effect of intensive treatment of diabetes on
the development and progression of long-term complications of insulin-dependent diabetes mellitus. N Eng
J Med. 1993; 329:997-1036.
5
Ohkubo Y, Kishikawa H, Araki E, et al. Intensive insulin therapy prevents progression of diabetic
microvascular complications in Japanese patients with non-insulin dependent diabetes mellitus: a
randomized prospective 6-year study. Diabetes Res Clin Pract. 1995; 28:103-117.
6
JDRF CGM Study Group. Sustained Benefit of Continuous Glucose Monitoring on A1c, Glucose Profiles,
and Hypoglycemia in Adults With Type 1 Diabetes, Diabetes Care 2009; 32: 2047-2049.
7
JDRF CGM Study Group. Quality-of-Life Measures in Children and Adults With Type 1 Diabetes. Diabetes
Care 2010; 33: 2175-2177.
7
18
Page 19
CHAPTER 4: CHARGING YOUR RECEIVER AND THE RECEIVER MAIN
MENU
4.1 CHARGING YOUR RECEIVER BATTERY
The receiver battery is rechargeable and will last about 3 days with normal use before you need to charge it.
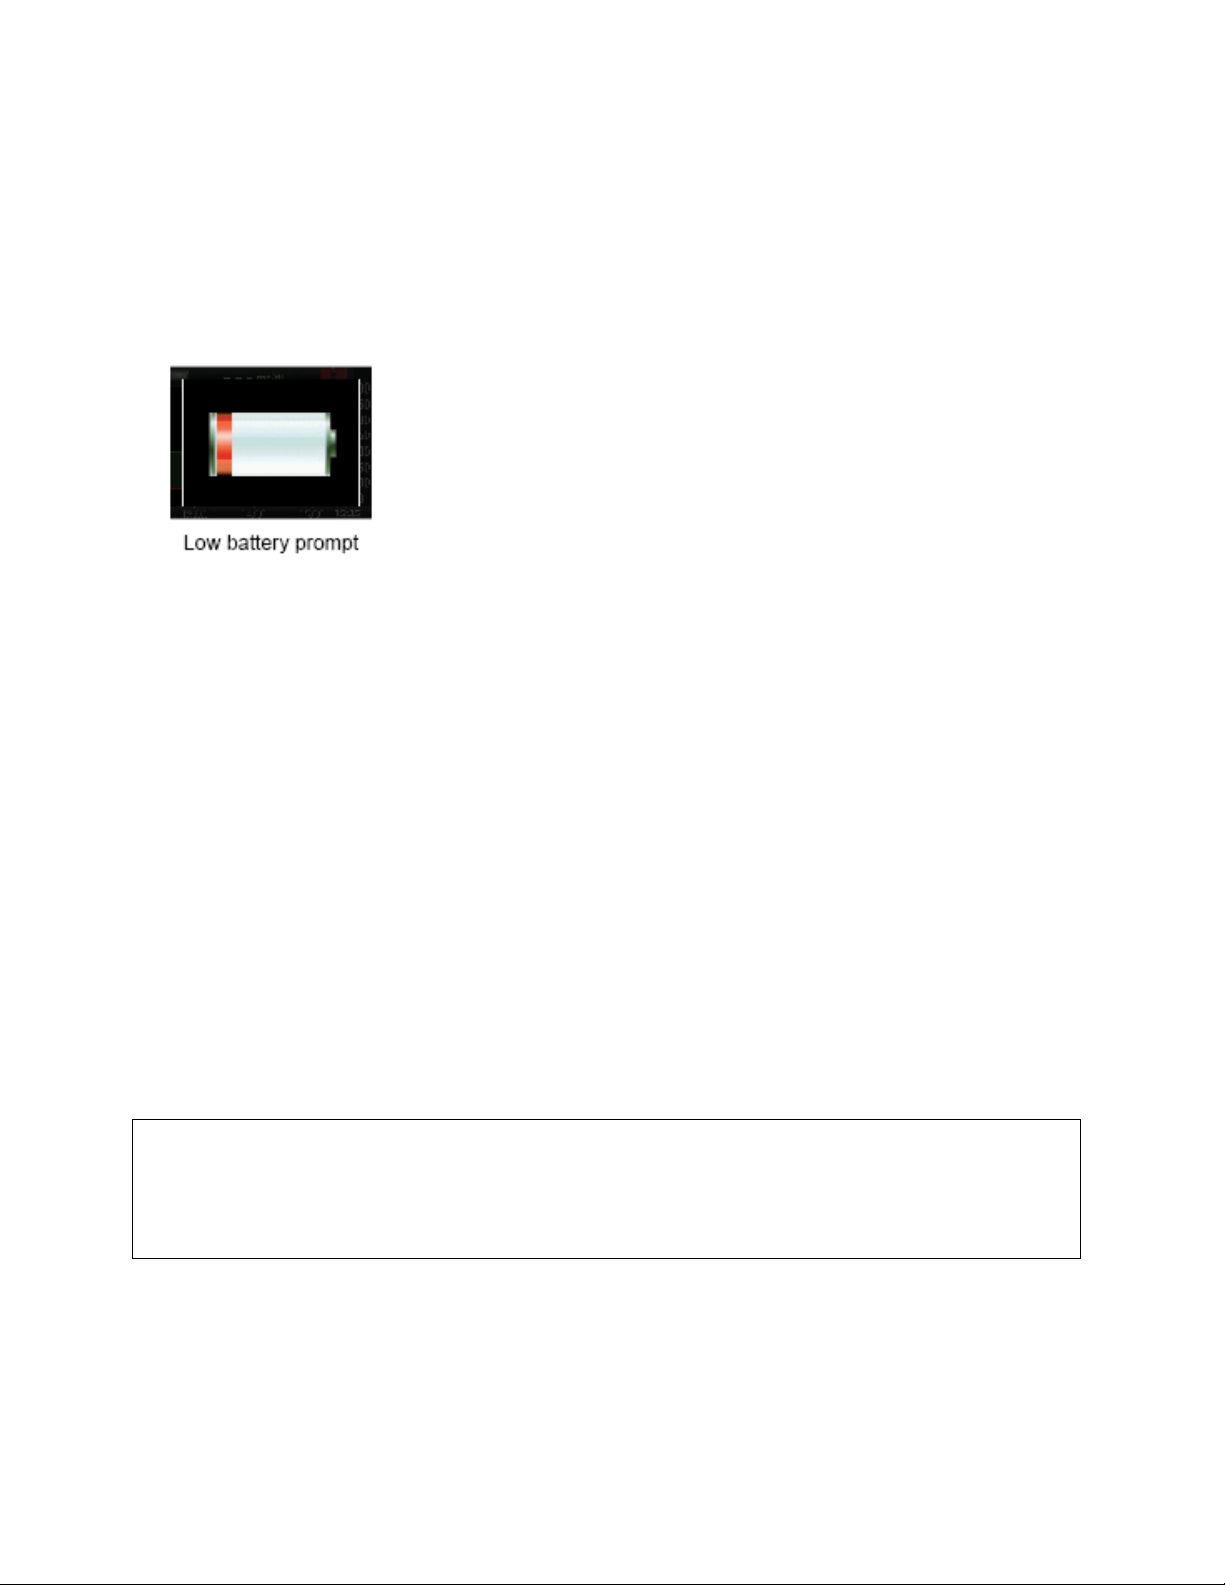
Your battery life depends on how often you press your receiver buttons or get alerts. The receiver will tell
you when the battery charge is low.
Charge the receiver battery using one of these options:
• Section 4.1.1: an AC power outlet
• Section 4.1.2: a personal computer with Windows
PC, Dexcom Studio must be installed. For system requirements and more information, see the Dexcom
website (www.dexcom.com) or the Dexcom Studio Software User’s Guide.)
Only use the Dexcom battery charger provided in the receiver kit. Do not use any other battery charger.
Charge only from a USB port on your computer or the AC power adapter. Do not use an extern al
USB hub. An external USB hub may not provide enough power to charge the receiver.
Fully charging an empty battery takes about 3 hours with the wall charger and about 5 hours with a
computer. The battery does not need to be drained to charge fully.
You may use the receiver while it is charging with an AC power outlet or PC.
Charge your receiver battery before each sensor insertion. Periodically check your battery level to make
sure it has enough charge.
If your battery drains, it will keep the time and date for 3 days without being charged. After 3 days, the
receiver will prompt you to reset the time and date (see Chapter 5, Section 5.2, The Settings Menu).
When the receiver is used in a healthcare facility, charging must take place away from the patient.
WARNING
®
operating system (to charge your receiver from your
It is not known how different conditions or medications common to the critically ill
population may affect the performance of the system. Therefore, the use of this system
in the critically ill population is not recommended.
4.1.1 CHARGING YOUR RECEIVER BATTERY FROM AN AC POWER
OUTLET
To recharge your battery:
19
Page 20
1. Plug the included USB cable into the AC power adapter.
2. Plug the AC power adapter into an AC power outlet.
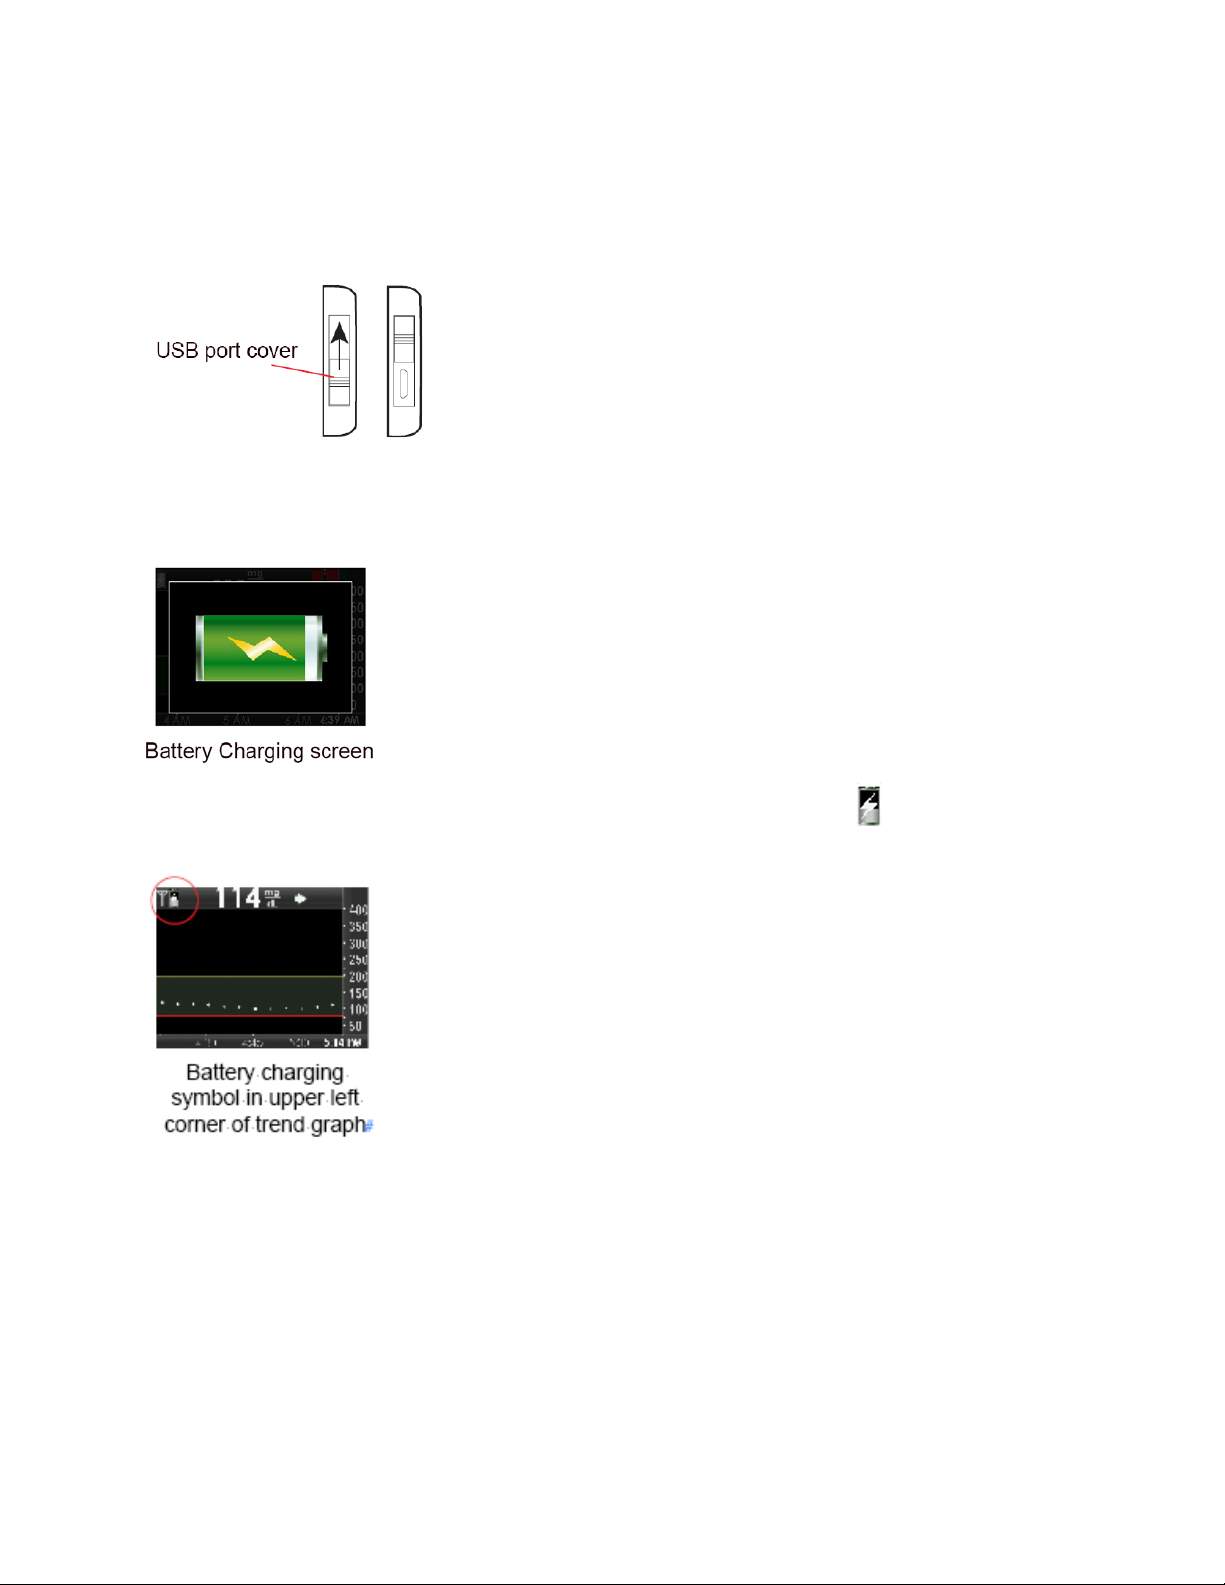
3. Slide open the USB port cover on the side of the receiver to reach the port. Press down firmly with your
thumb when sliding open the USB port cover.
4. Plug the micro USB end of the cable into the receiver USB port.
Keep the USB port cover on the receiver closed whenever the USB cable is not attached.
5. The battery charging screen will show on the receiver.
6. After a few seconds the trend graph will show with the battery charging symbol ( ) in the upper left
corner.
4.1.2 CHARGING YOUR RECEIVER BATTERY FROM A WINDOWS
COMPATIBLE COMPUTER
You must install the Dexcom Studio software to charge your receiver from a computer. Please see
the Dexcom Studio installation card for driver installation instructions.
1. Plug the included USB cable into your computer.
2. Plug the other end of the USB cable into the receiver.
3. The battery charging screen shows on the receiver.
20
Page 21
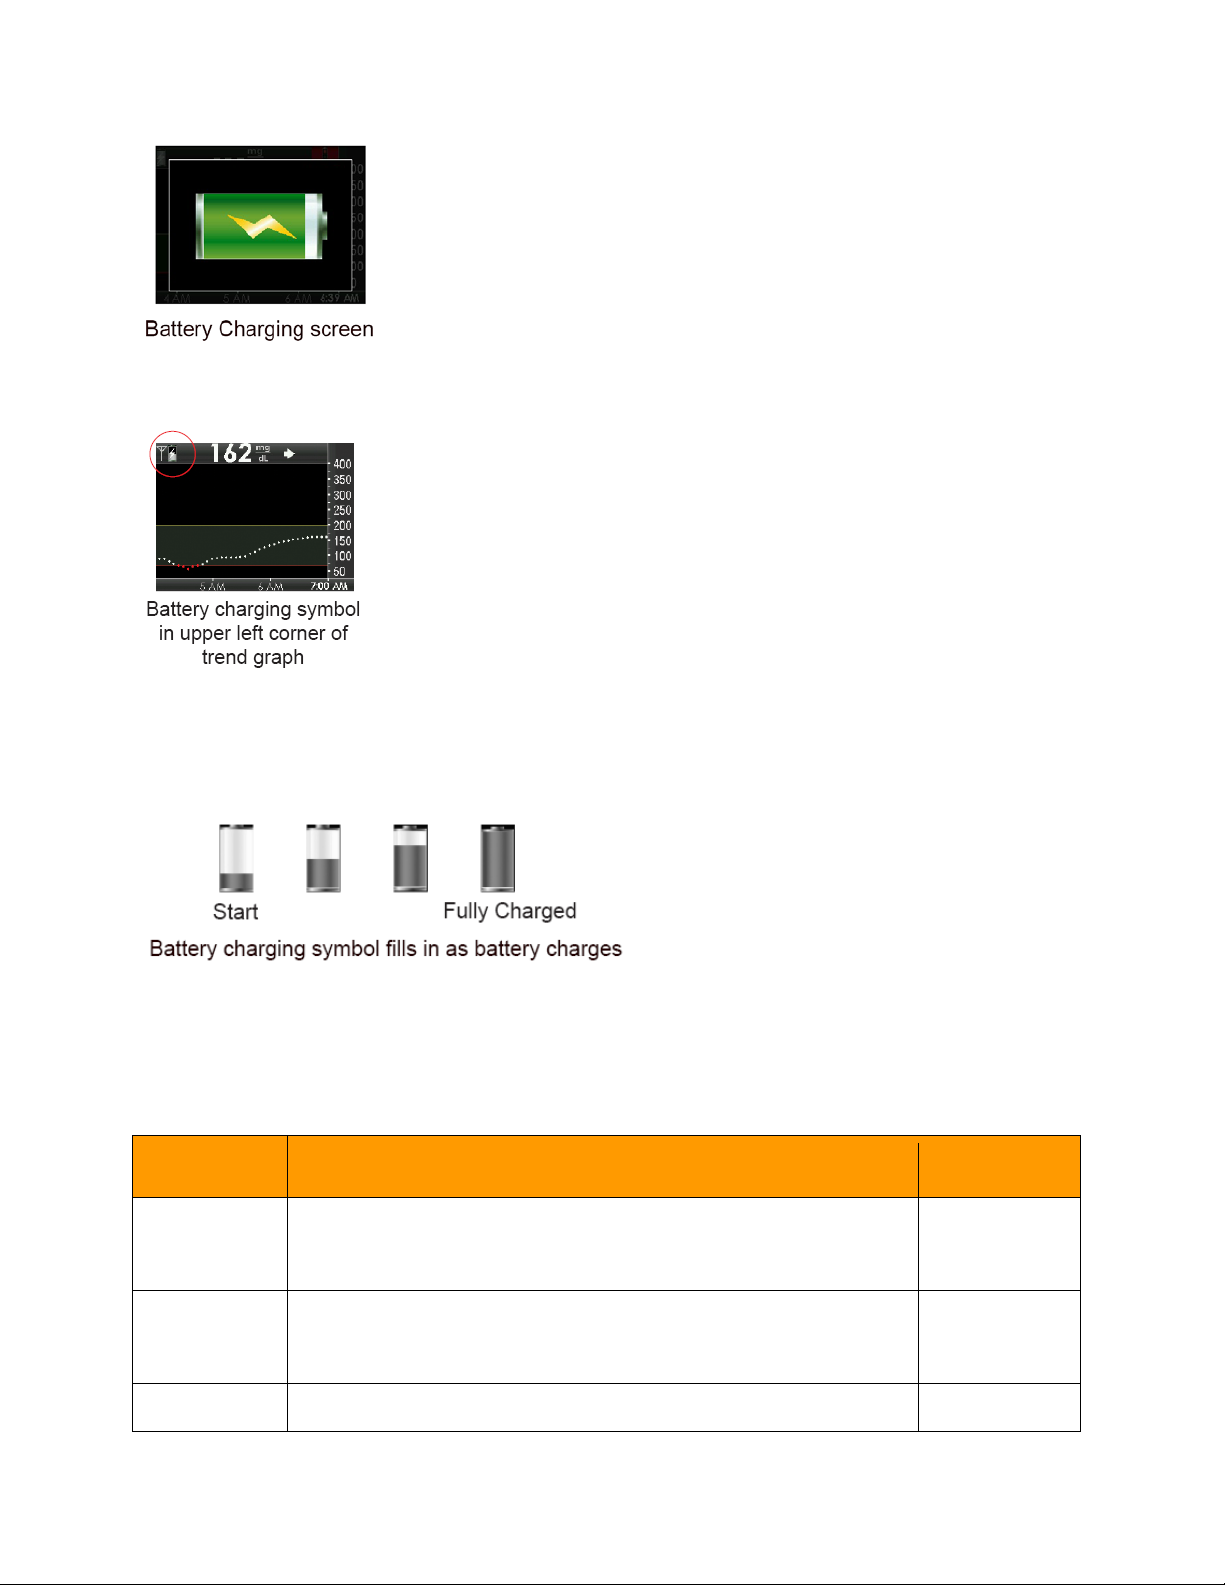
4. After a few seconds, the trend graph screen will show the battery charging symbol in the upper left
corner.
4.1.3 KNOWING YOUR RECEIVER IS CHARGED
As the battery charges, the battery charging symbol fills in. When the battery is fully charged, the battery
charging symbol is completely shaded.
4.2 RECEIVER MENU OPTIONS
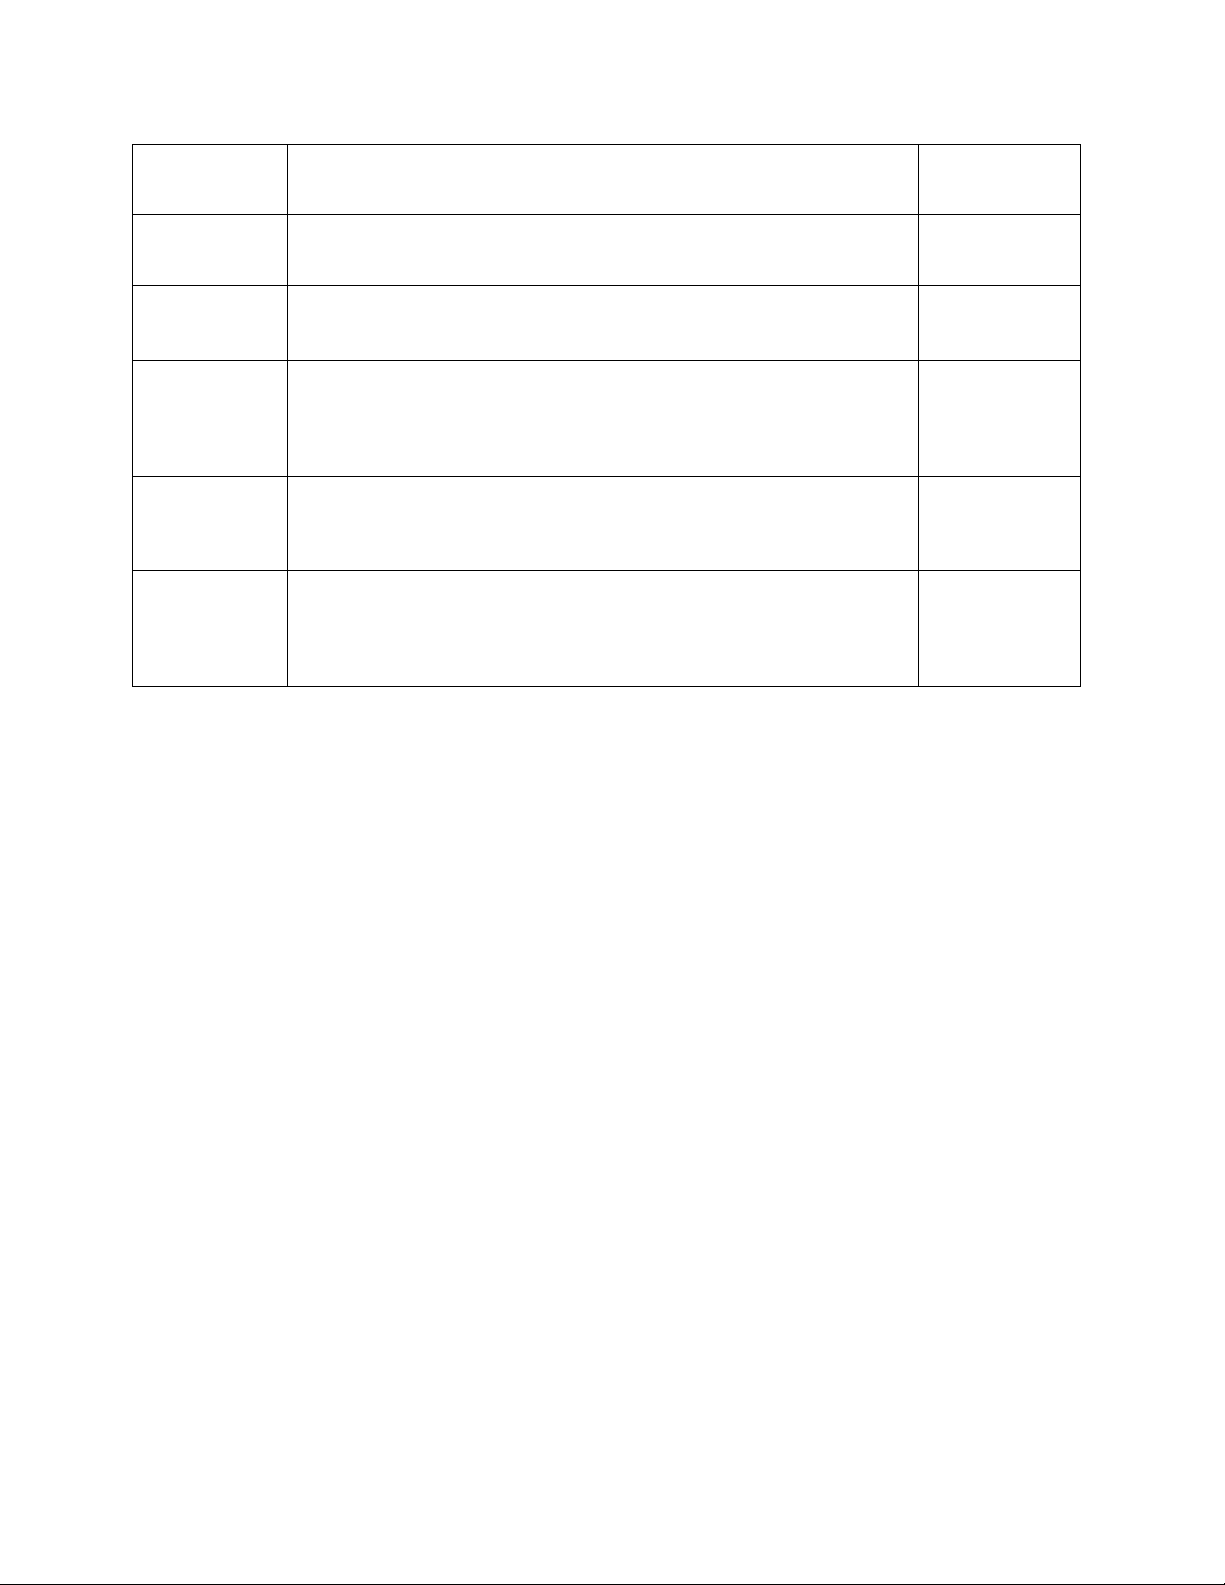
The receiver’s Main Menu lets you scroll through important menu options. This table explains the purpose of
each option. More information on Main Menu options can be found in the chapters listed:
Receiver Main Menu Options
Menu
Trend Graph
Start Sensor
Enter BG
Purpose
To show the trend graphs.
• The 3-hour trend graph is the default screen whenever you turn on
the receiver.
To start a new sensor session.
• This option only shows if you have entered a transmitter ID and you
are not in the middle of a sensor session
To enter your blood glucose values for calibration.
21
User’s Guide
Reference
Chapter 8
Chapter 6
Chapter 7
Page 22
Profiles
Events
Profiles allow you to customize the sound and volume of alerts and
alarm.
To enter personal information about meals, insulin, exercise, and
health status.
Chapter 9
Chapter 10
Alerts,
High/Low
Settings
Shutdown
Stop Sensor
See Chapter 18, Appendix I, Receiver Alerts, Alarm and Prompts, for a list of screens that may show on the
To change the settings for high and low alerts.
To change the time, date and transmitter ID; to turn on the Share
feature; to look up your Dexcom G4 PLATINUM System hardware
and software version numbers; to view transmitter battery status, last
calibration value and sensor insertion time.
To temporarily turn off all communication between your transmitter
and receiver during a sensor session. You will not get sensor glucose
readings, and it will not extend the life of your sensor.
To end a sensor session early.
• This option only shows when you are in the middle of a sensor
session. You will not get sensor glucose readings, and you must
dispose of your sensor if you stop the session.
receiver.
Chapter 9
Chapter 5
Chapter 6
Chapter 13
22
Page 23
CHAPTER 5: DEXCOM G4 PLATINUM SYSTEM SETUP
This chapter helps you when you first set up your Continuous Glucose Monitoring system. Read this chapter
before you start.
5.1 SETTING UP THE RECEIVER AND PAIRING WITH YOUR
TRANSMITTER
The Setup Wizard guides you through setup the first time you turn on your receiver.
1. Remove the transmitter from its packaging. Wait 10 minutes for the transmitter to turn on before setting
up the receiver.
2. Make sure your receiver is fully charged (see Chapter 4, Section 4.1, Charging Your Receiver Battery).
3. Press the
following setup information:
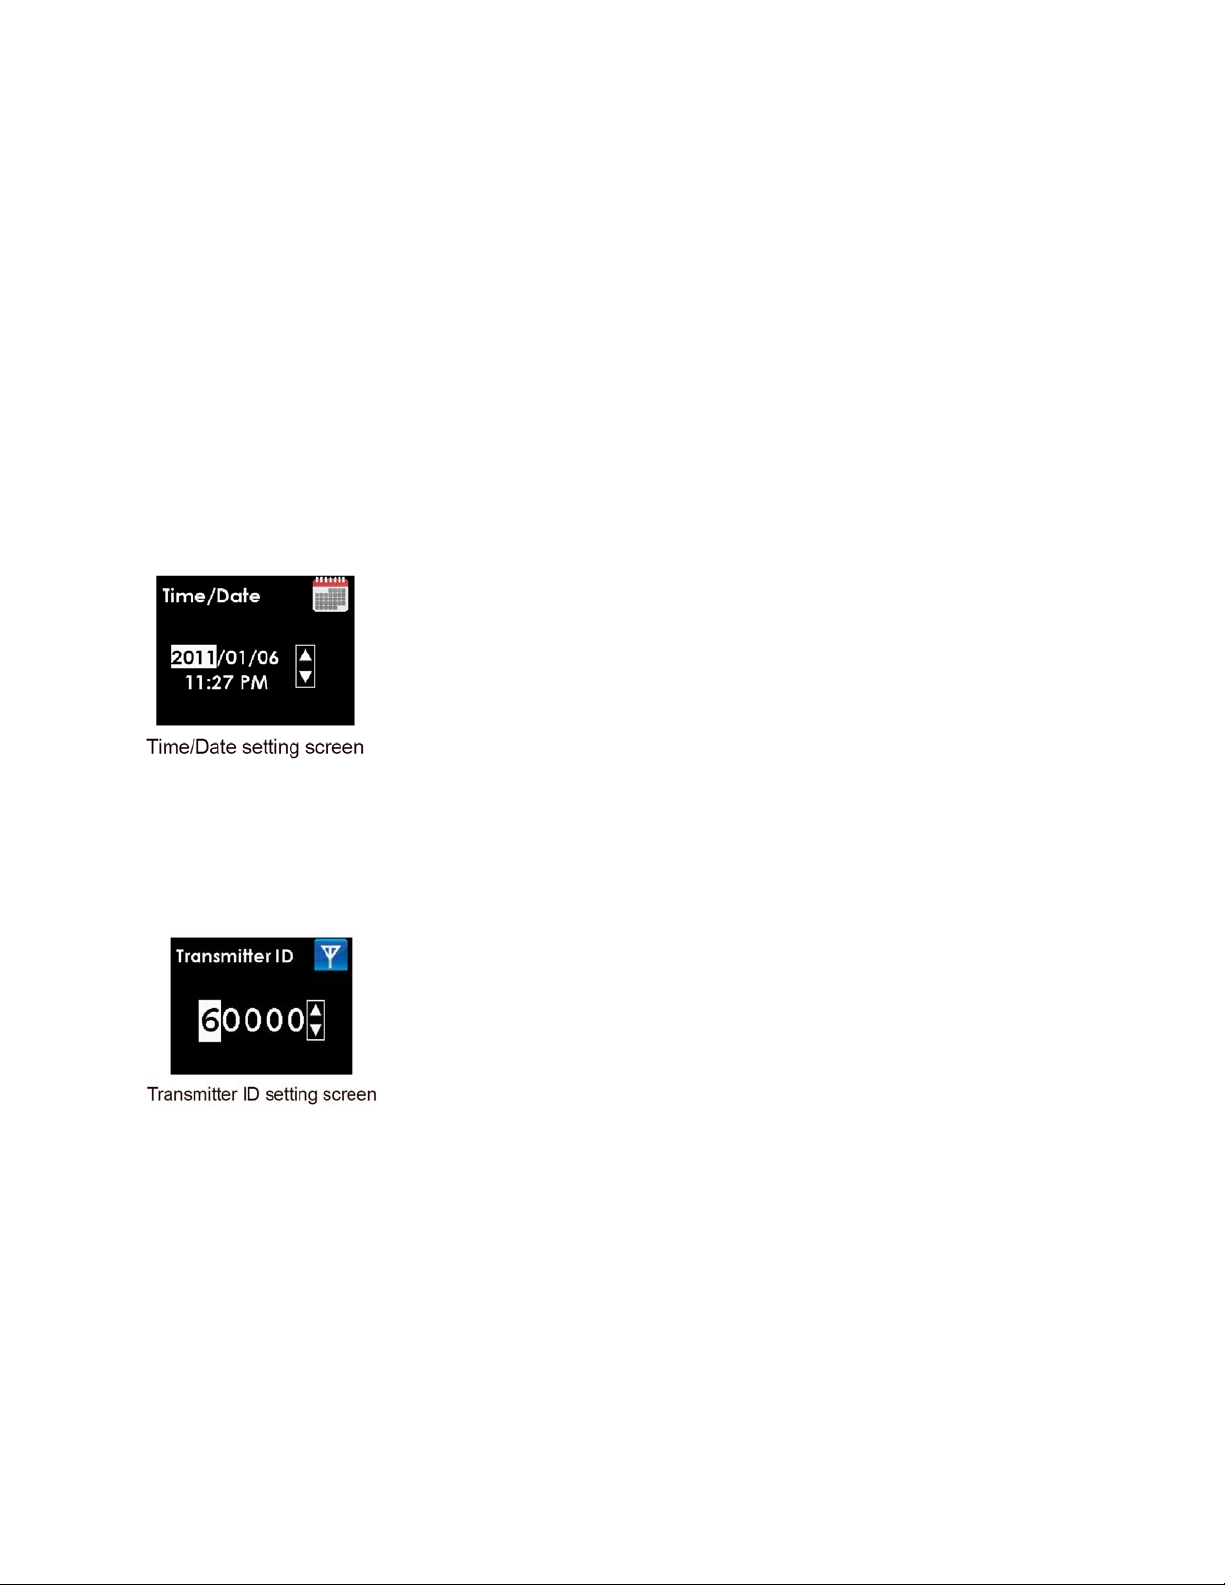
a. Set the time and date. The date format is YYYY/MM/DD.
(1) Press the UP or
(2) Press the
(3) Press the
b. Enter your transmitter ID.
SELECT
button on the receiver to turn it on. The Setup Wizard will guide you to enter the
DOWN
RIGHT
SELECT
button to enter the current date and time.
or
SELECT
button to confirm time and date.
button to move to the next section.
(1) Press the UP or
(2) Press the
(3) Press the
Your transmitter ID is a unique code with 5 numbers and/or letters found in the following locations:
• On the transmitter box label
• On the bottom of the transmitter
c. Set your low and high glucose alert values. Your low and high glucose alerts are pre-set to 80 mg/dL
and 200 mg/dL but can be changed.
DOWN
RIGHT
SELECT
button to enter your transmitter ID.
or
SELECT
button to confirm the transmitter ID.
button to move to the next space.
23
Page 24
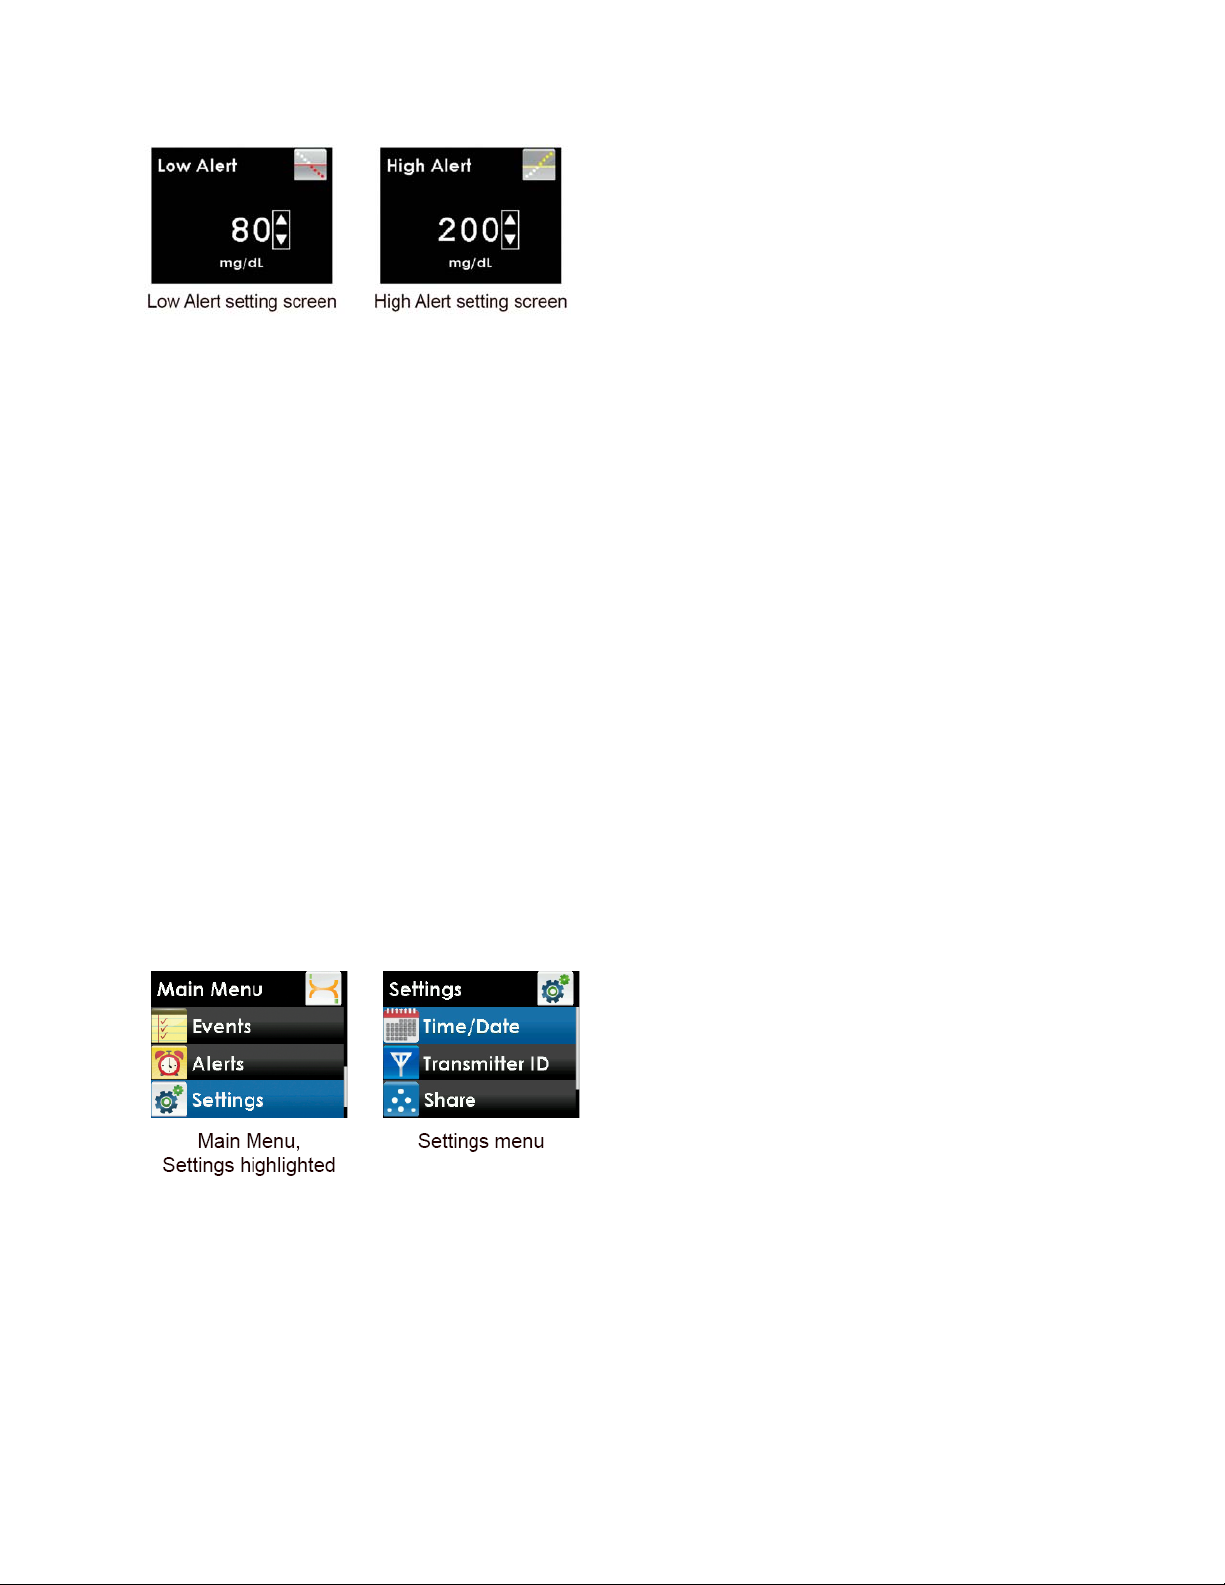
(1) Press the UP or
mg/dL and the high alert can be changed in steps of 10 mg/dL.
(2) Press the
• You can also change your alert levels in the Alerts menu.
• The unit of measure (mg/dL) is not adjustable.
• If you need to change the time, date or transmitter ID after you complete the Setup Wizard see
Section 5.2, The Settings Menu.
The Setup Wizard is now complete. To start using your Dexcom G4 PLATINUM CGM System you must
insert a sensor (see Chapter 6, Inserting a Sensor and Starting a Sensor Session).
DOWN
SELECT
button to select your alert level. The low alert can be changed in steps of 5
button to confirm your alert level.
5.2 THE SETTINGS MENU
The Settings menu lets you change the time, date or transmitter ID. The Setup Wizard only works the first
time you turn on your receiver, but you can always use the Settings menu.
5.2.1 GETTING TO THE SETTINGS MENU
1. Press the
2. Press the
SELECT
SELECT
button to turn on the receiver. The 3-hour trend graph shows.
button to see the Main Menu.
3. From the Main Menu, press the UP or
The Settings menu shows:
DOWN
button to scroll to “Settings” and press the
5.2.2 SETTING YOUR RECEIVER TIME AND DATE
1. From the Settings menu, press the UP or
button.
DOWN
button to scroll to “Time/Date,” and press the
24
SELECT
SELECT
button.
Page 25
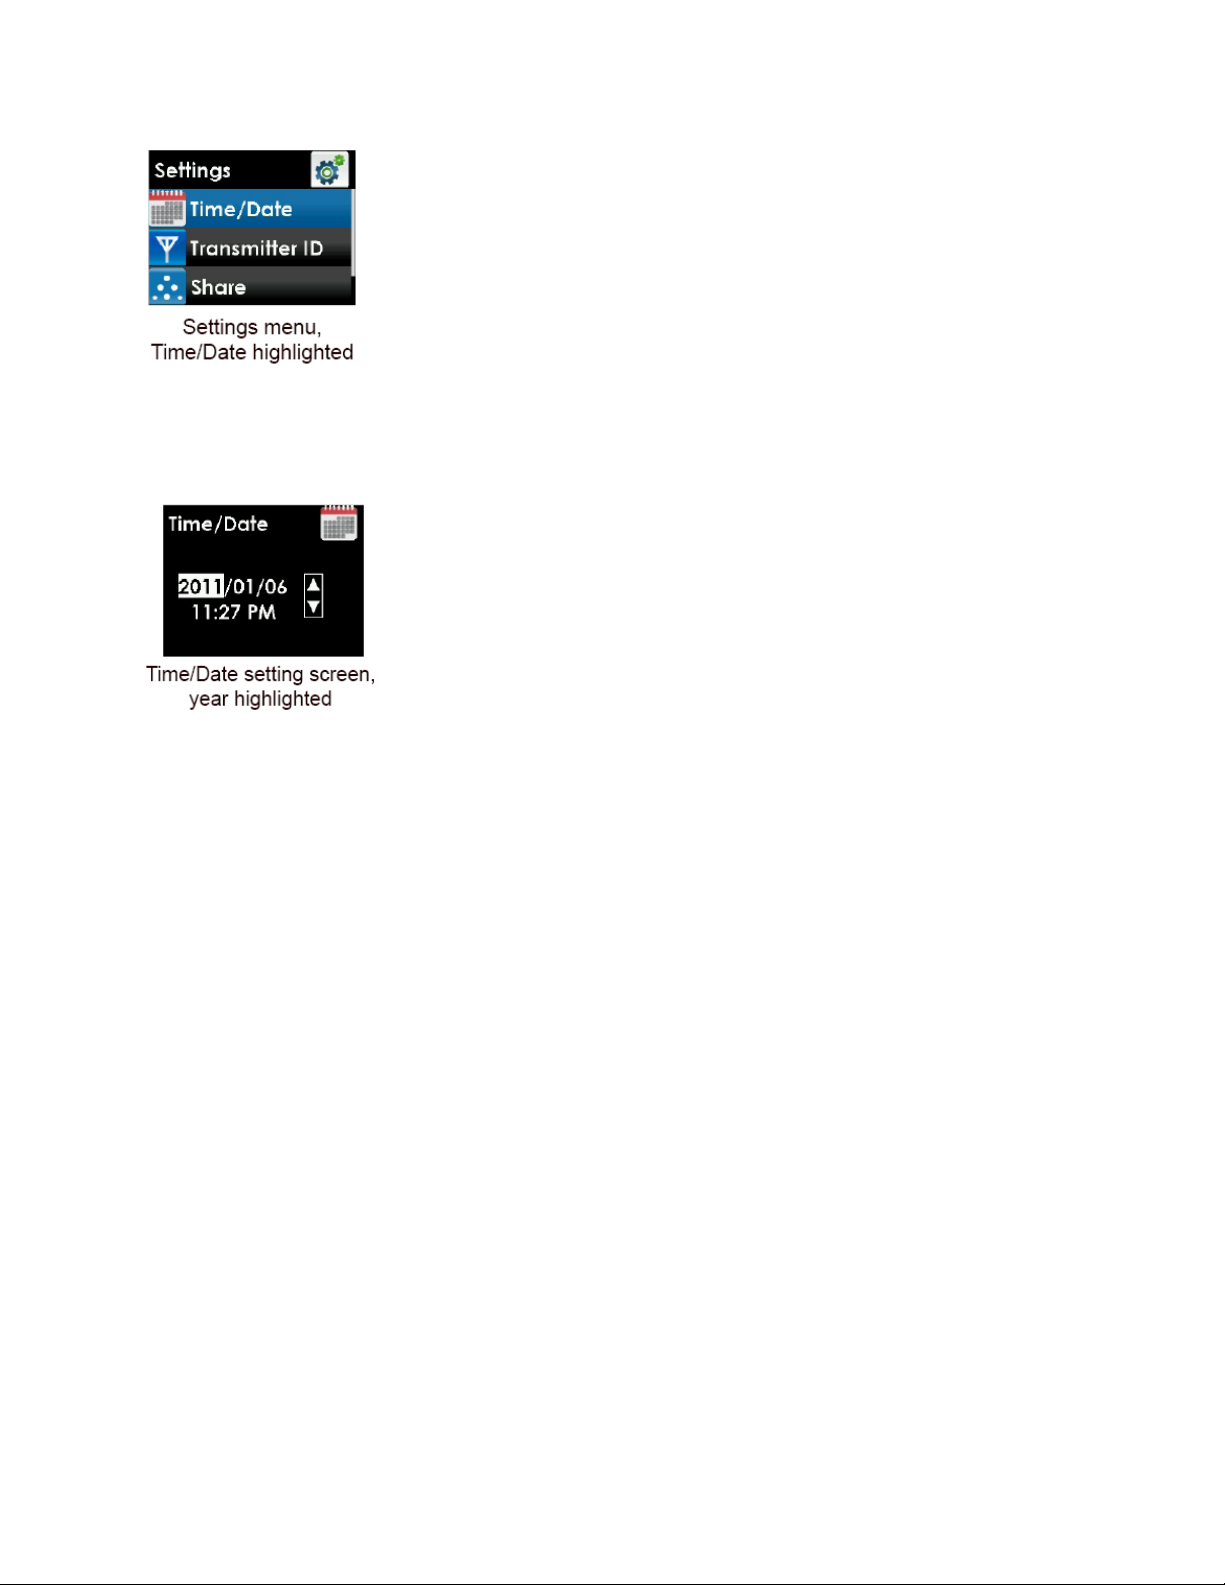
2. Press the
3. Press the UP or
4. Press the
The date format is YYYY/MM/DD.
5. Press the
You might need to reset the receiver’s time and date if the rechargeable battery drains. If this happens,
the receiver will alert you and automatically take you to the Time/Date setting screen.
RIGHT
RIGHT
SELECT
5.2.3 ENTERING YOUR TRANSMITTER ID
Any time you switch to a new transmitter and/or receiver you must enter the transmitter ID into your
receiver. The transmitter ID is a series of 5 numbers and/or letters that can be found in the following
locations:
or
SELECT
DOWN
button to move to the next value.
button after choosing “AM” or “PM.” You will return to the Settings menu.
button to highlight each value in the date and time.
button to make any changes.
• On the transmitter box label
• On the bottom of the transmitter
If you cannot find your transmitter ID, please contact Dexcom Technical Support (see Chapter 15, User
Assistance).
You can only set your transmitter ID when you are not in a sensor session. During a sensor session,
“Transmitter ID” will not be an option on the Settings menu.
To enter the transmitter ID follow these steps:
1. From the Settings menu, press the UP or
SELECT
button.
DOWN
button to scroll to “Transmitter ID” and press the
25
Page 26
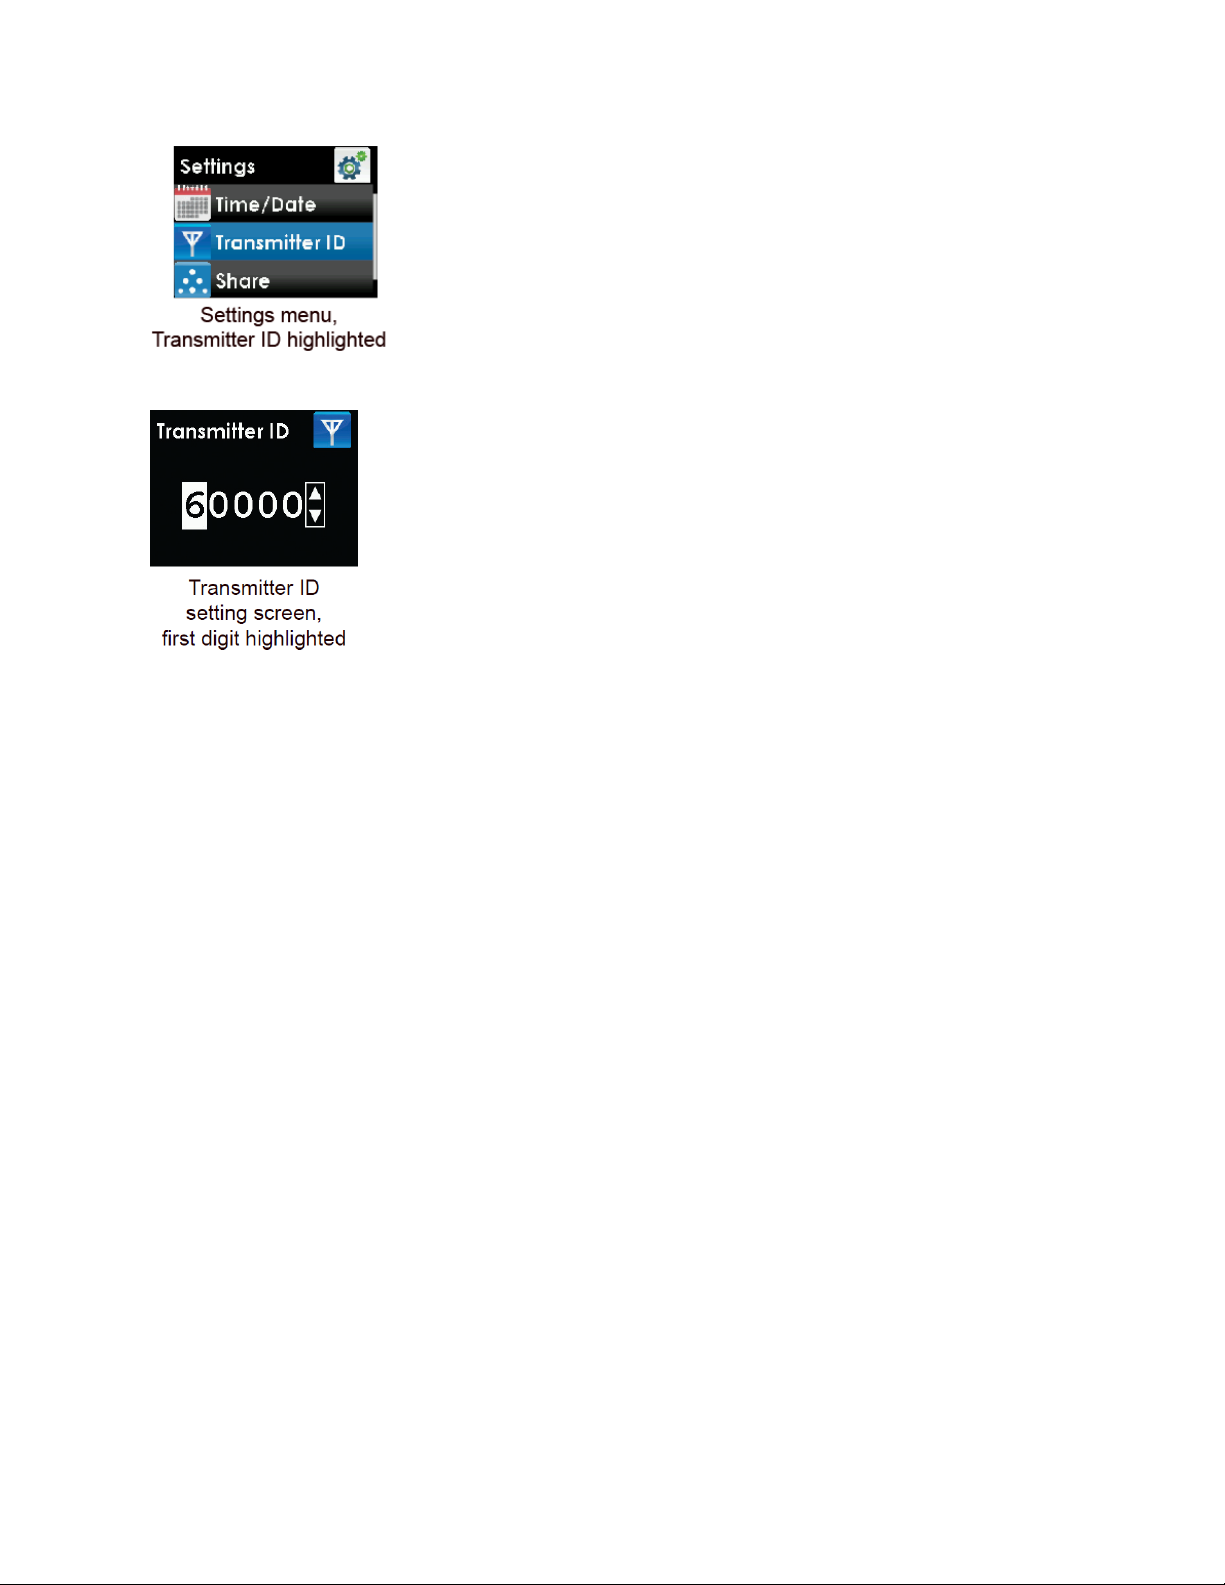
2. Start with the first number or letter (do not enter “SN”):
a. Press the UP or
b. Press the
c. Continue repeating steps a and b to enter the whole transmitter ID.
d. Press the
menu.
NOTE:
not tell you whether the transmitter and receiver are communicating. The “Transmitter ID” menu option
only shows when you are not in a sensor session. See Section 5.4 for the antenna symbol that shows
whether the transmitter and receiver are communicating.
The “Transmitter ID” menu option is marked with an antenna symbol as a graphical flag; it does
DOWN
RIGHT
SELECT
5.2.4 TURNING ON SHARE ON YOUR RECEIVER
Please see the Pairing Receiver section in Chapter Two of your Dexcom Share User Manual to learn how
to turn on the Share feature on your Receiver with Share.
button to show the correct number or letter.
button to move to the next value and repeat step a.
button after you enter the last number or letter. You will return to the Settings
5.3 CHECKING INFORMATION ABOUT YOUR DEXCOM G4 PLATINUM
SYSTEM
You can check your receiver for information about your CGM system at any time.
1. From the Settings menu, press the UP or
DOWN
button to scroll to “Device Info.”
26
Page 27
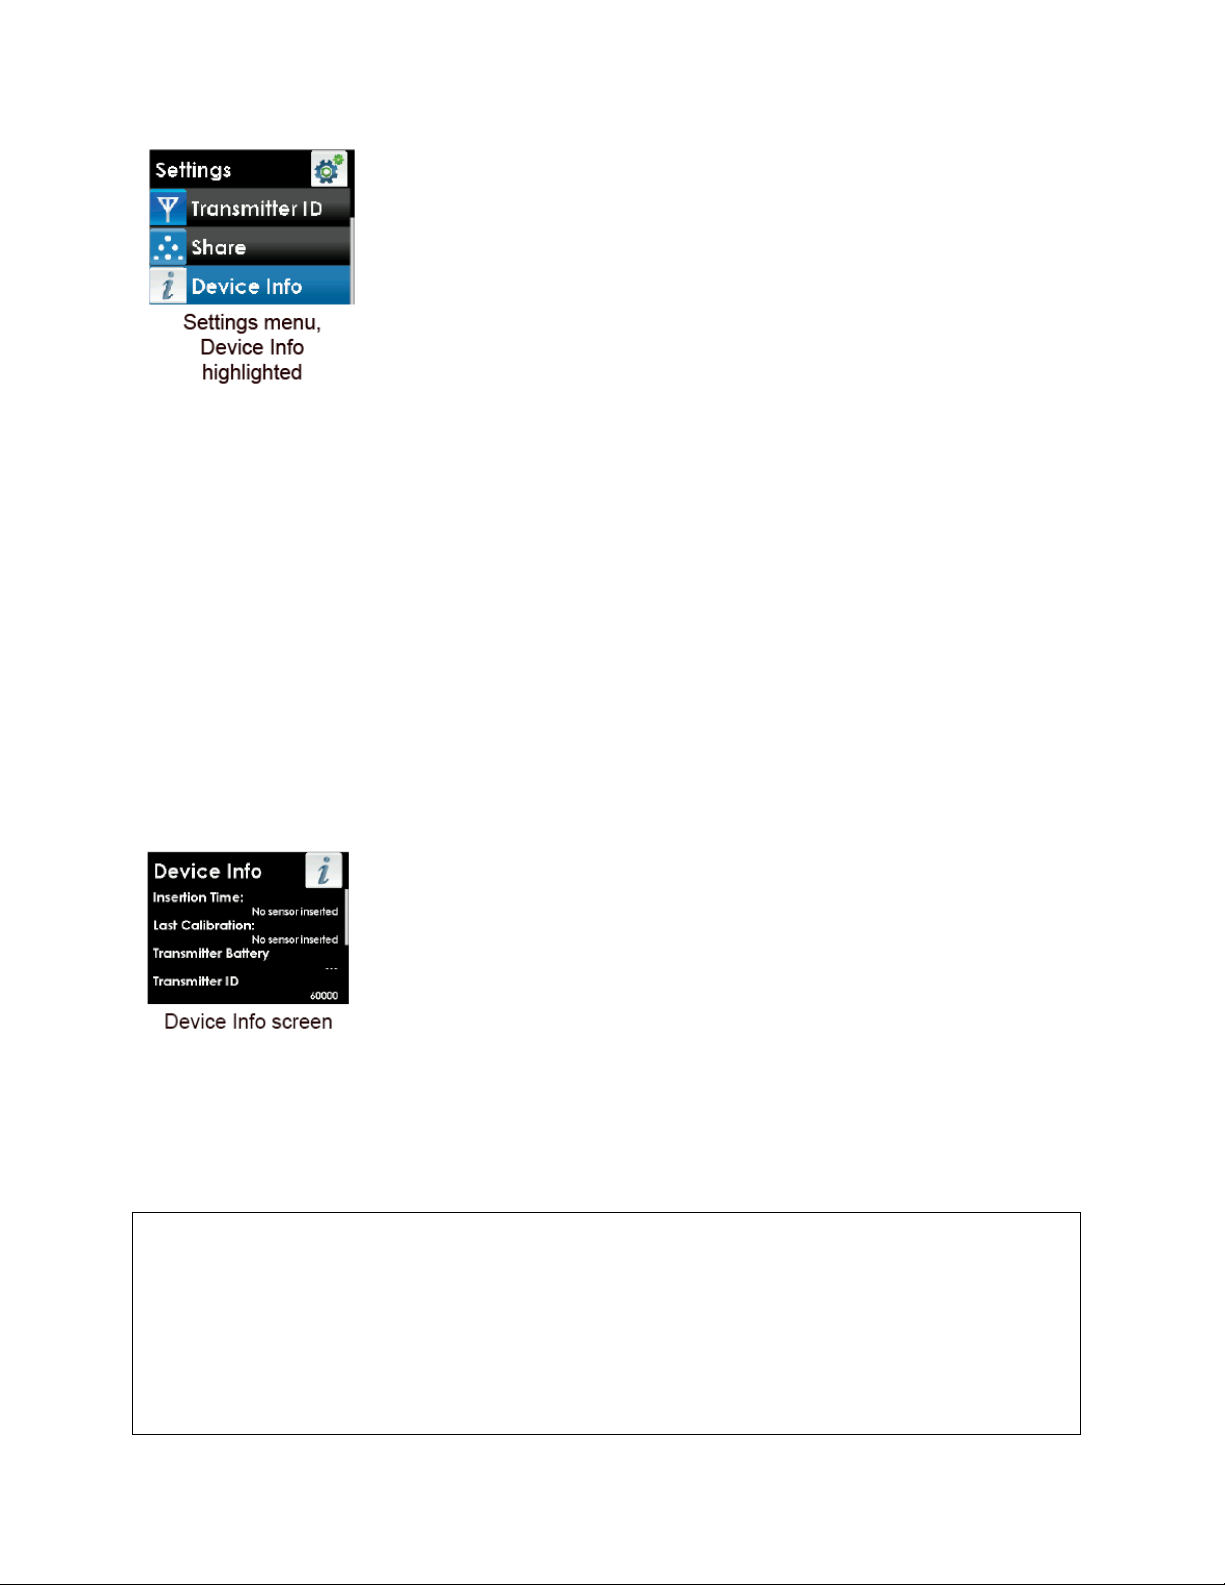
2. Press the
3. Scroll down to see all of the Device Info:
• Insertion Time
• Last Calibration
• Transmitter Battery
• Transmitter ID
• Serial Number
• Part Number
• Part Revision
• Software Number
• Software Revision
SELECT
button. Information about your sensor session and system will show.
4. Press the
button to return to the Settings menu.
LEFT
5.4 TRANSMITTER AND RECEIVER COMMUNICATION
When you are in a sensor session, you can check that the receiver and transmitter are communicating.
CONTRAINDICATION
Remove the Dexcom G4 PLATINUM Sensor, Transmitter, and Receiver before
Magnetic Resonance Imaging (MRI), Computed Tomography (CT) scan, or diathermy
treatment. The Dexcom G4 PLATINUM System has not been tested during MRI or CT
scans or with diathermy treatment. The magnetic fields and heat could damage the
device so that it might not display sensor glucose readings or provide alerts, and you
might miss a low or high blood glucose value.
27
Page 28
PRECAUTION
The transmission range from the transmitter to the receiver is up to 20 feet without
obstruction. Wireless communication does not work well through water so the range is
much less if you are in a pool, bathtub, or on a water bed, etc. Types of obstruction
differ and have not been tested. If your transmitter and receiver are farther than 20 feet
apart or are separated by an obstruction, they might not communicate or the
communication distance may be shorter and you might miss a low or high blood
glucose value.
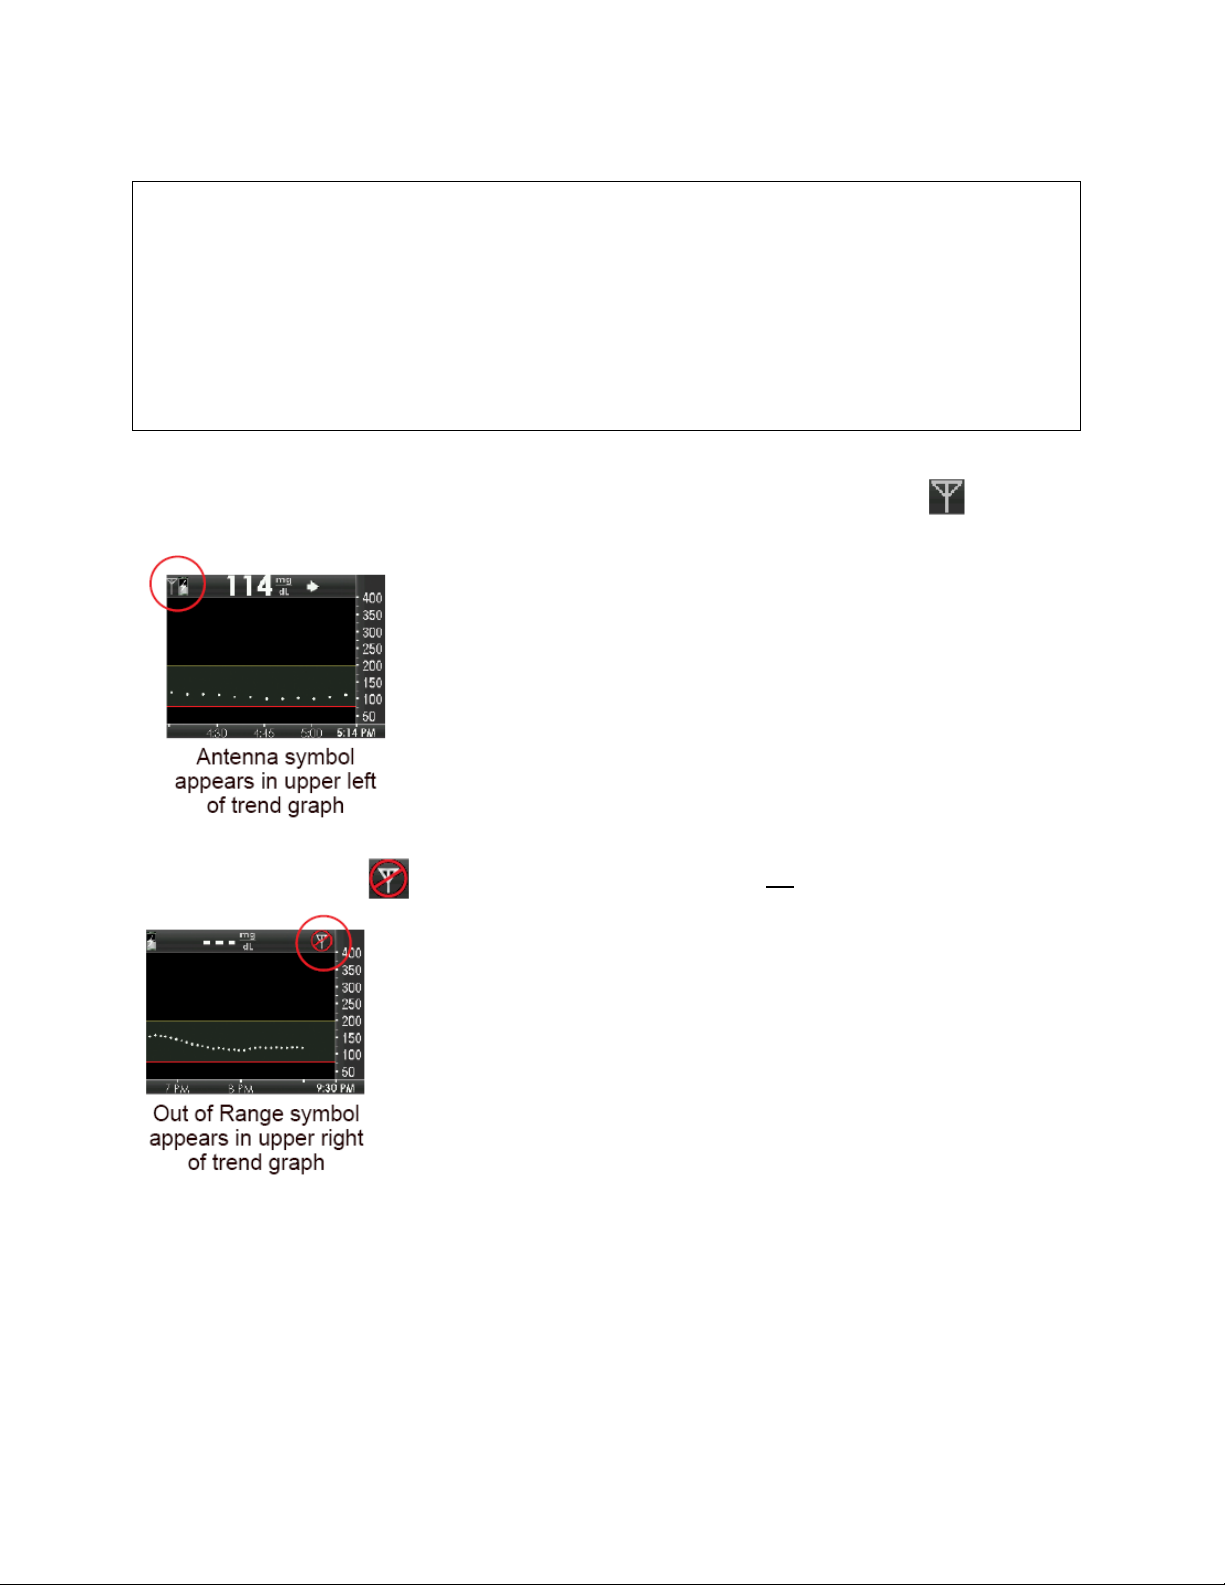
Press the
the transmitter and receiver are communicating.
SELECT, LEFT
or
RIGHT
button to see the trend graph. This antenna symbol shows that
This out of range symbol shows the transmitter and receiver are not communicating.
28
Page 29
CHAPTER 6: INSERTING A SENSOR AND STARTING A SENSOR
SESSION
You need a sensor, a transmitter, and a receiver to use your Dexcom G4 PLATINUM Continuous Glucose
Monitoring System. You also need a blood glucose meter and test strips for calibration. The blood glucose
meter and test strips are not provided in the Dexcom G4 PLATINUM System. The sensor continuously
measures and displays your sensor glucose readings for up to 7 days. The following sections will show you
how to insert the sensor and start a new continuous glucose monitoring session.
Please review the tutorial on the disc in your kit. The tutorial is also available online at www.dexcom.com.
WARNING
Sensors may fracture on rare occasions. If a sensor breaks and no portion of it is
visible above the skin, do not attempt to remove it. Seek professional medical help if
you have symptoms of infection or inflammation—redness, swelling or pain—at the
insertion site. If you experience a broken sensor, please report this to our Technical
Support department at
1.877.339.2664 or 1.858.200.0200.
For patients undergoing an MRI with a retained wire broken off from a Dexcom G4
PLATINUM Sensor, in-vitro MRI testing did not detect any safety hazards. There was
no significant migration or heating of the wire and imaging artifacts were limited to the
area around the wire.
6.1 BEFORE YOU START
• Make sure the correct transmitter ID has been entered into your receiver (see Chapter 5, Section 5.2, The
Settings Menu). You do not need to re-enter the transmitter ID each time you start a sensor session.
• Check the expiration date on the sensor package label. The format is YYYY-MM-DD. Insert sensors on or
before the end of the expiration date calendar day.
• Follow your blood glucose meter’s manufacturer’s instructions to make sure you are getting accurate blood
glucose values for calibration.
• Wipe the bottom of the transmitter with a damp cloth or isopropyl alcohol wipe. Place the transmitter on a
clean, dry cloth, and air dry for 2-3 minutes.
• Make sure your blood glucose meter and receiver date and time match.
WARNING
Store the sensor at temperatures between 36° F - 77° F for the length of the sensor’s
shelf life. You may store the sensor in the refrigerator if it is within this temperature
range. The sensor should not be stored in a freezer. Storing the sensor improperly
might cause the sensor glucose readings to be inaccurate, and you might miss a low
or high blood glucose value.
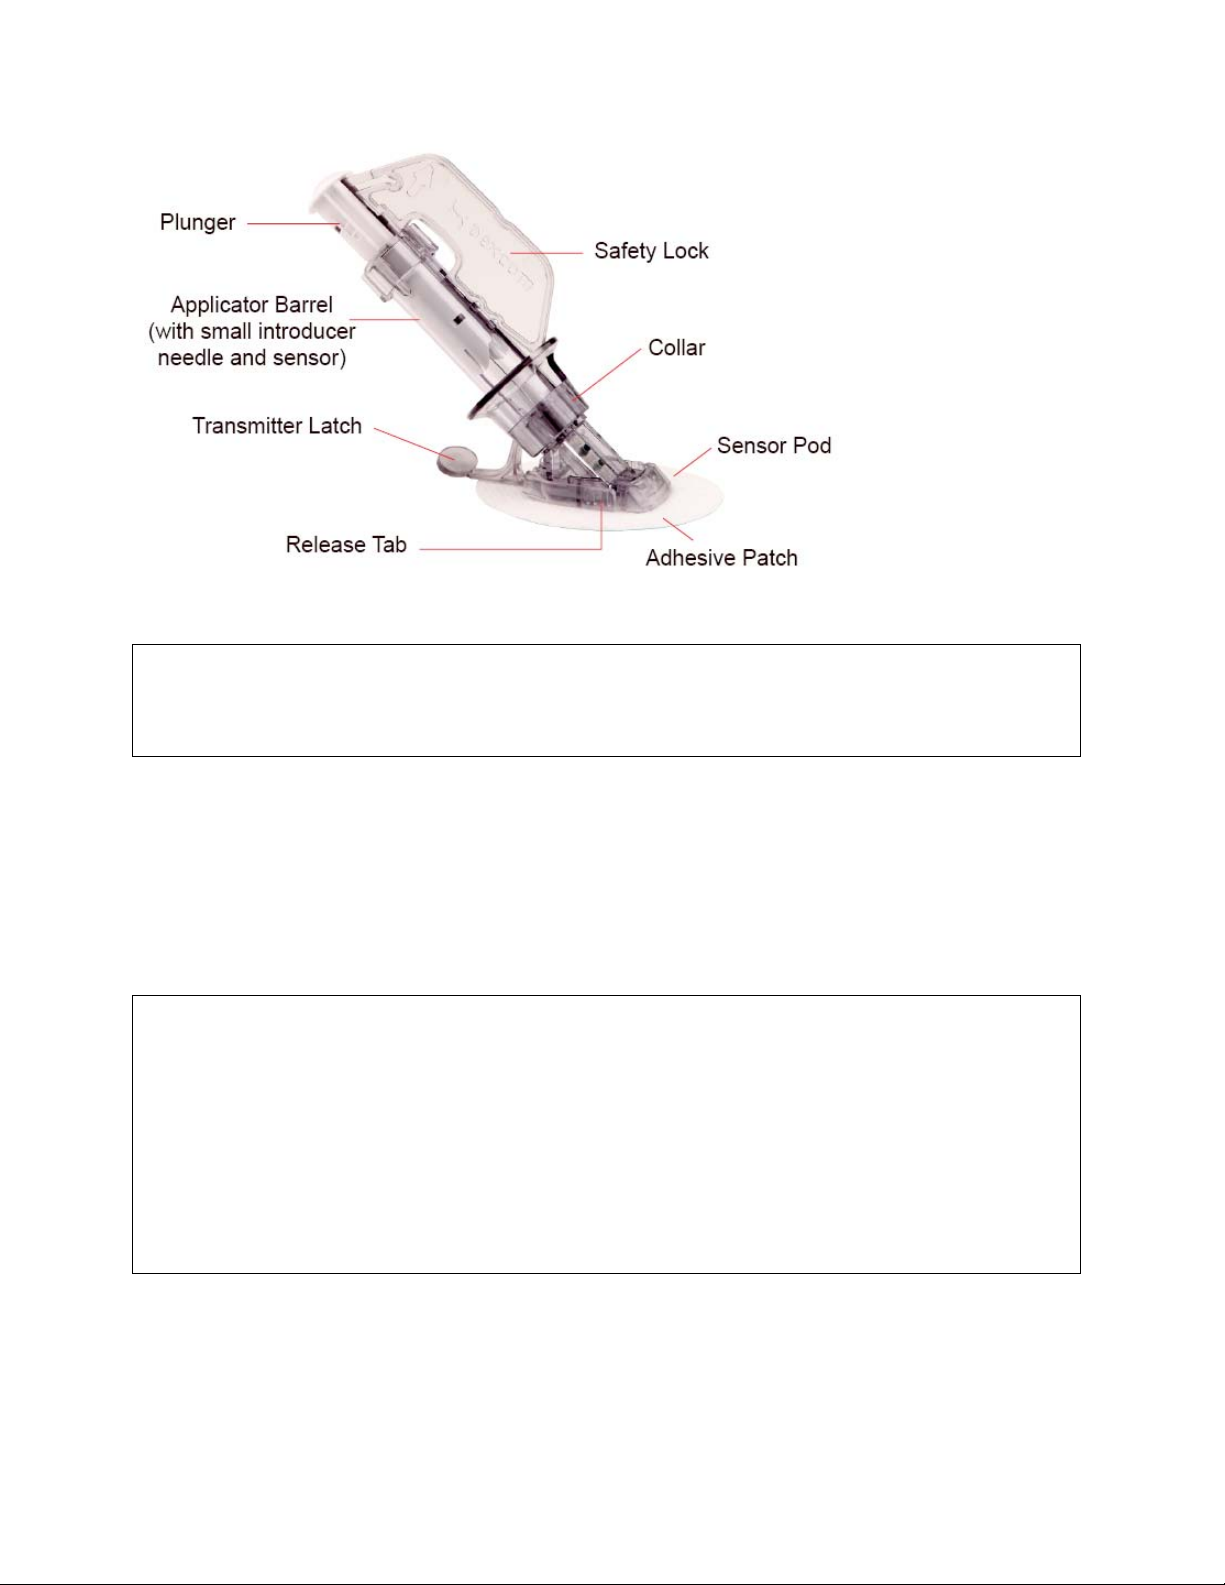
Review the sensor applicator picture before using a new sensor.
29
Page 30
6.2 REMOVING THE SENSOR FROM ITS PACKAGING
PRECAUTION
Do not use the sensor if its sterile package has been damaged or opened. Using an
unsterile sensor might cause infection.
• Wash your hands thoroughly, and dry them.
• Carefully remove the sensor from its packaging. Look closely at the sensor to make sure it is not damaged.
• The applicator is for single use and is disposable.
• The safety lock prevents you from releasing the needle accidentally before you are ready.
6.3 CHOOSING AN INSERTION SITE
PRECAUTION
• Avoid inserting the sensor in areas that are likely to be bumped, pushed or
compressed or areas of skin with scarring, tattoos, or irritation as these are not ideal
sites to measure glucose. Insertion in those areas might affect sensor performance,
and you might miss a low or high blood glucose value.
• Avoid injecting insulin or placing an insulin pump infusion set within 3 inches of the
sensor. The insulin might affect sensor performance, and you might miss a low or high
blood glucose value.
Review the tutorial disc for more help to learn how to insert your sensor.
Choose a site on your belly to place the sensor. You can choose a site above or below your belt line. The
best areas to insert your sensor are usually flat, “pinchable,” and free from where rubbing can occur, such
as along the waist band and seat belt strap.
• Choose an area at least 3 inches from your insulin pump infusion set or injection site.
30
Page 31
• Avoid using the same spot repeatedly for sensor insertion. Never use the same site for 2 sensor sessions
in a row.
• You may need to shave the area where you plan to put the sensor so the adhesive patch sticks securely.
• Make sure there are no traces of lotions, perfumes or medications on the area.
6.4 PLACING THE SENSOR
WARNING
Do not use the Dexcom G4 PLATINUM System for treatment decisions, such as how
much insulin you should take. The Dexcom G4 PLATINUM System does not replace a
blood glucose meter. Always use the values from your blood glucose meter for
treatment decisions. Blood glucose values may differ from sensor glucose readings.
Using the sensor glucose readings for treatment decisions could lead to low or high
blood glucose value.
1. Clean your skin at the sensor placement site with an alcohol wipe. Make sure the area is clean and
completely dry before you insert the sensor.
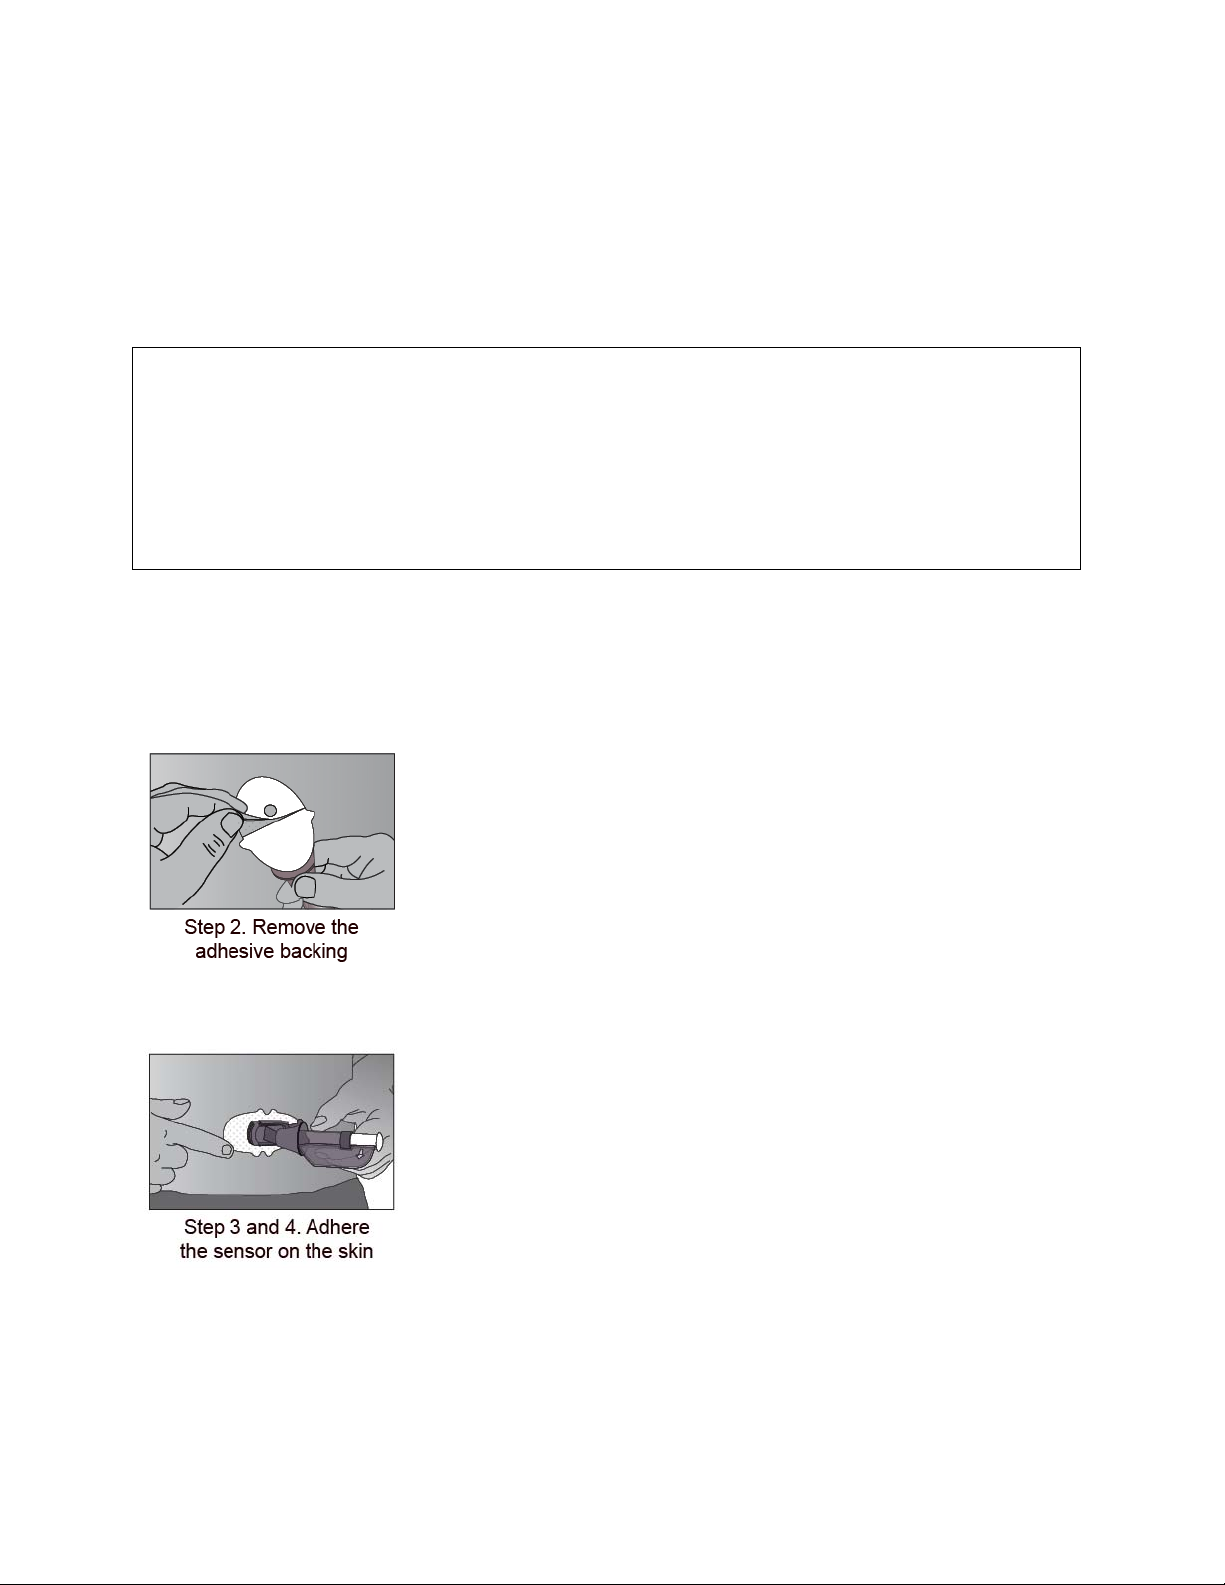
2. Remove the adhesive backing from the sensor pod one half at a time, using the white tabs on the
backing. Hold the sensor by the applicator barrel, and try not to touch the sticky adhesive patch.
3. Place the sensor horizontally, NOT vertically, on your skin.
4. Move your fingers around the adhesive patch to secure the tape to your skin.
5. Hold the applicator, and pull the safety lock straight out away from the applicator, in the direction of the
arrows in the picture.
31
Page 32
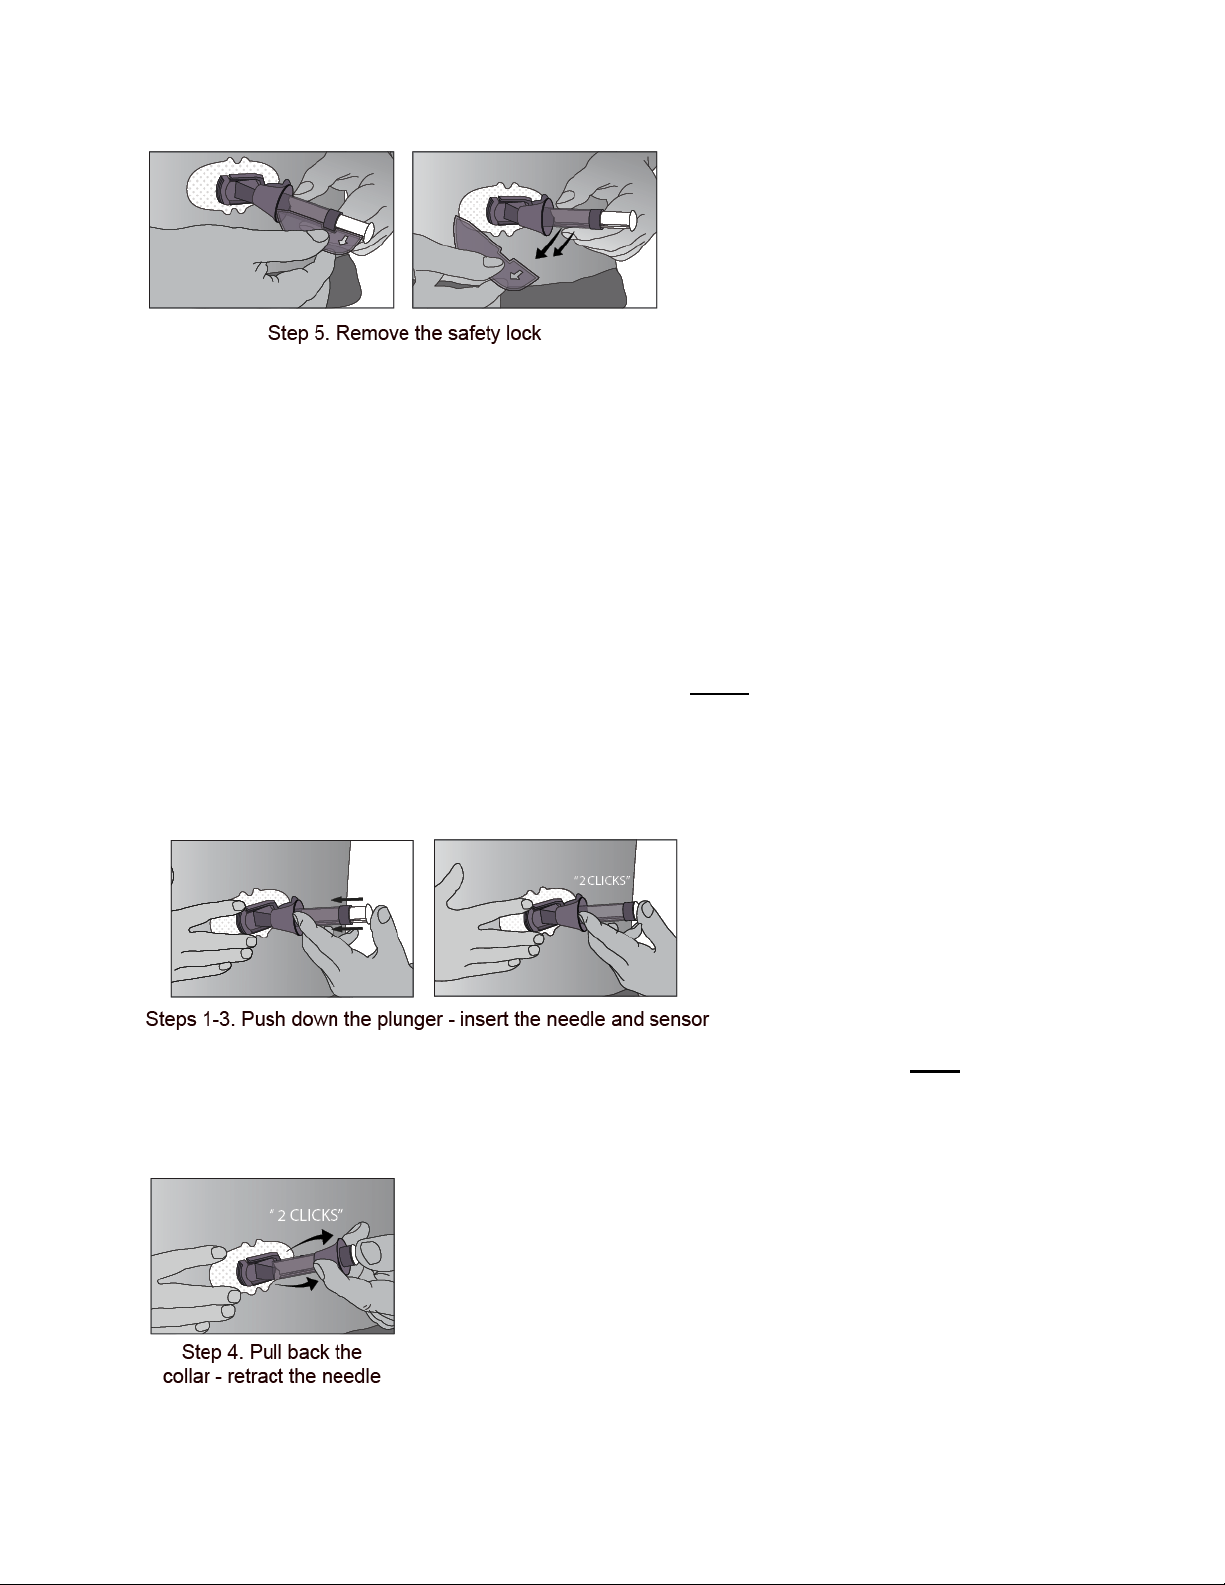
6. Save the safety lock to help you remove the transmitter at the end of your sensor session. The safety lock
can be used for transmitter removal but is not required. When your glucose monitoring session is over,
follow the steps in Chapter 11, Section 11.3, Transmitter Removal, with or without the safety lock.
6.5 SENSOR INSERTION
You are ready to insert the sensor after you place the applicator on your belly and remove the safety lock.
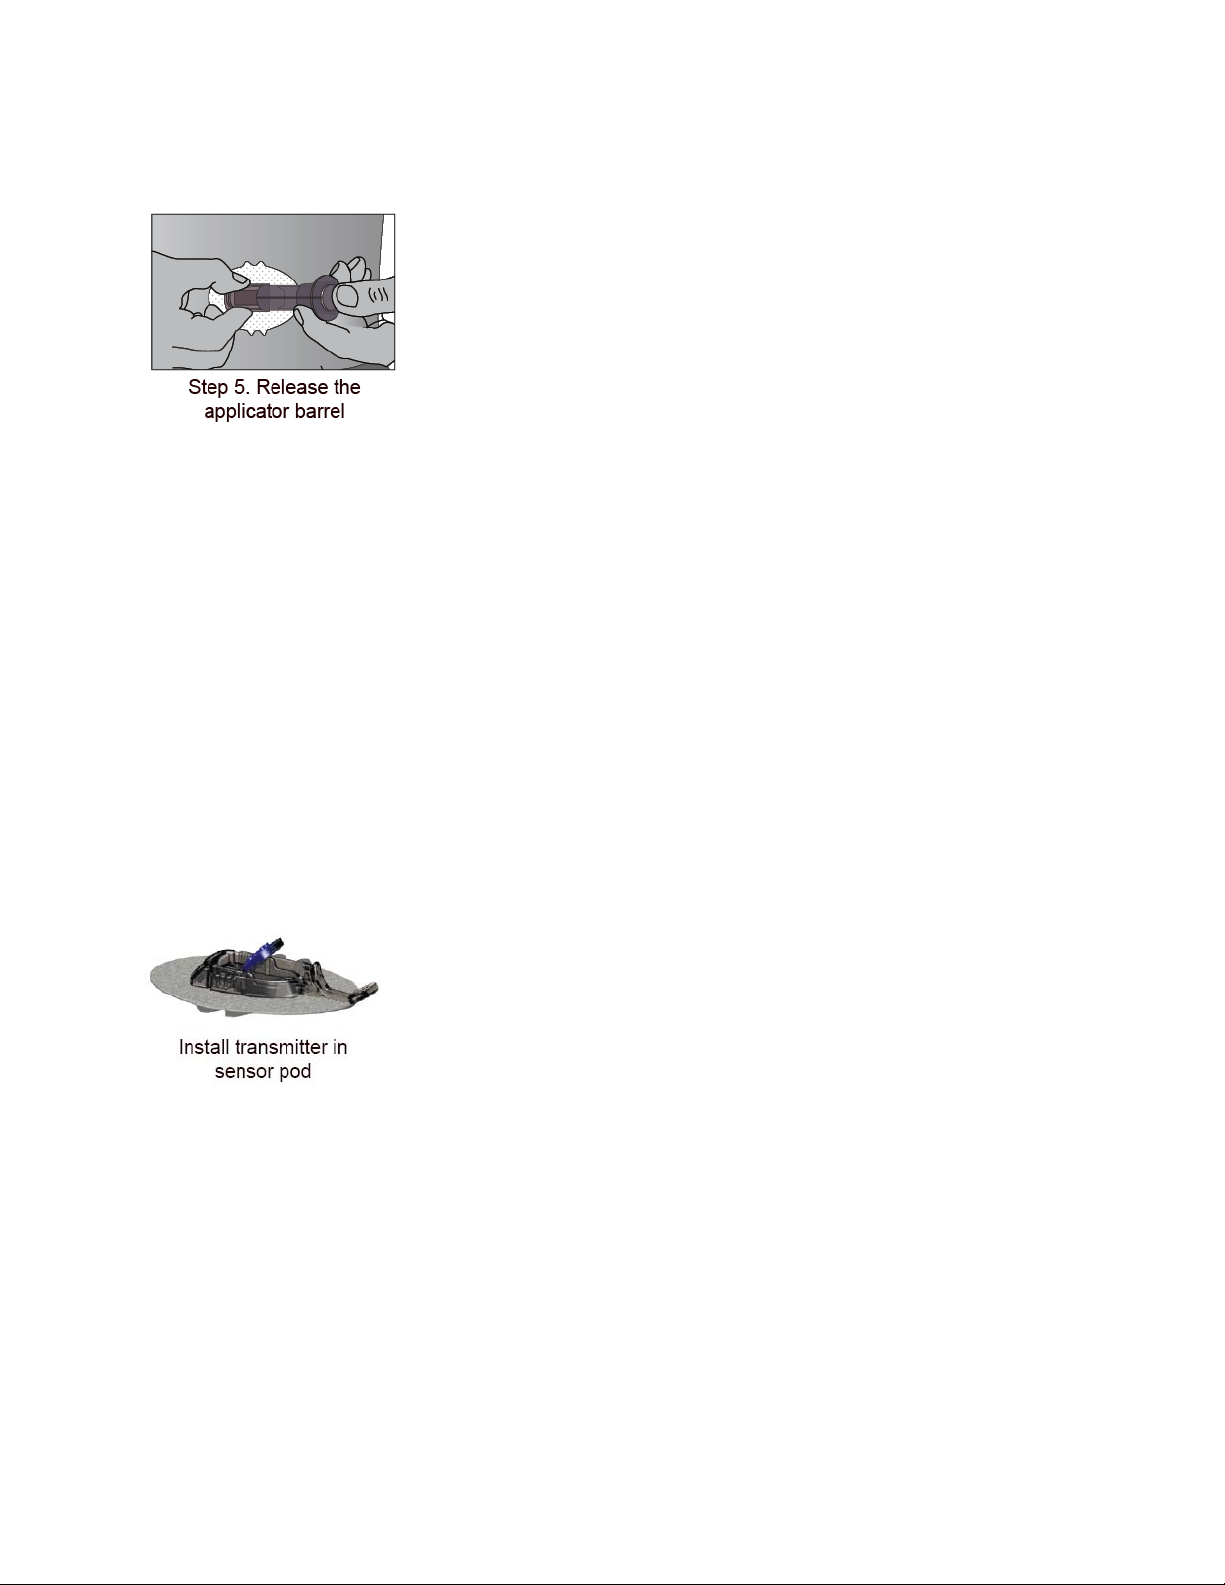
To insert your sensor follow these steps:
1. Place the fingers of one hand at the edge of the white adhesive (at the opposite side of the sensor from
the transmitter latch). You may pinch up on your skin using this hand. Do not pinch up in the middle section
of the plastic base.
2. While still pinching, use your other hand to place two fingers above the collar on the applicator barrel so
they are resting above the collar.
3. Place your thumb on the white plunger. Push the plunger down completely, making sure it is flush against
the applicator barrel. You should hear
When you are pushing down on the plunger, do not pull back on the collar.
2 clicks
. This inserts the needle and sensor under your skin.
4. Keep pinching up on your skin with one hand. With your other hand, place two fingers under the collar.
Keep your thumb lightly on top of the white plunger, and pull the collar back towards your thumb until you
hear
2 clicks
from your body.
or cannot pull back any more. This leaves the sensor under your skin and removes the needle
32
Page 33
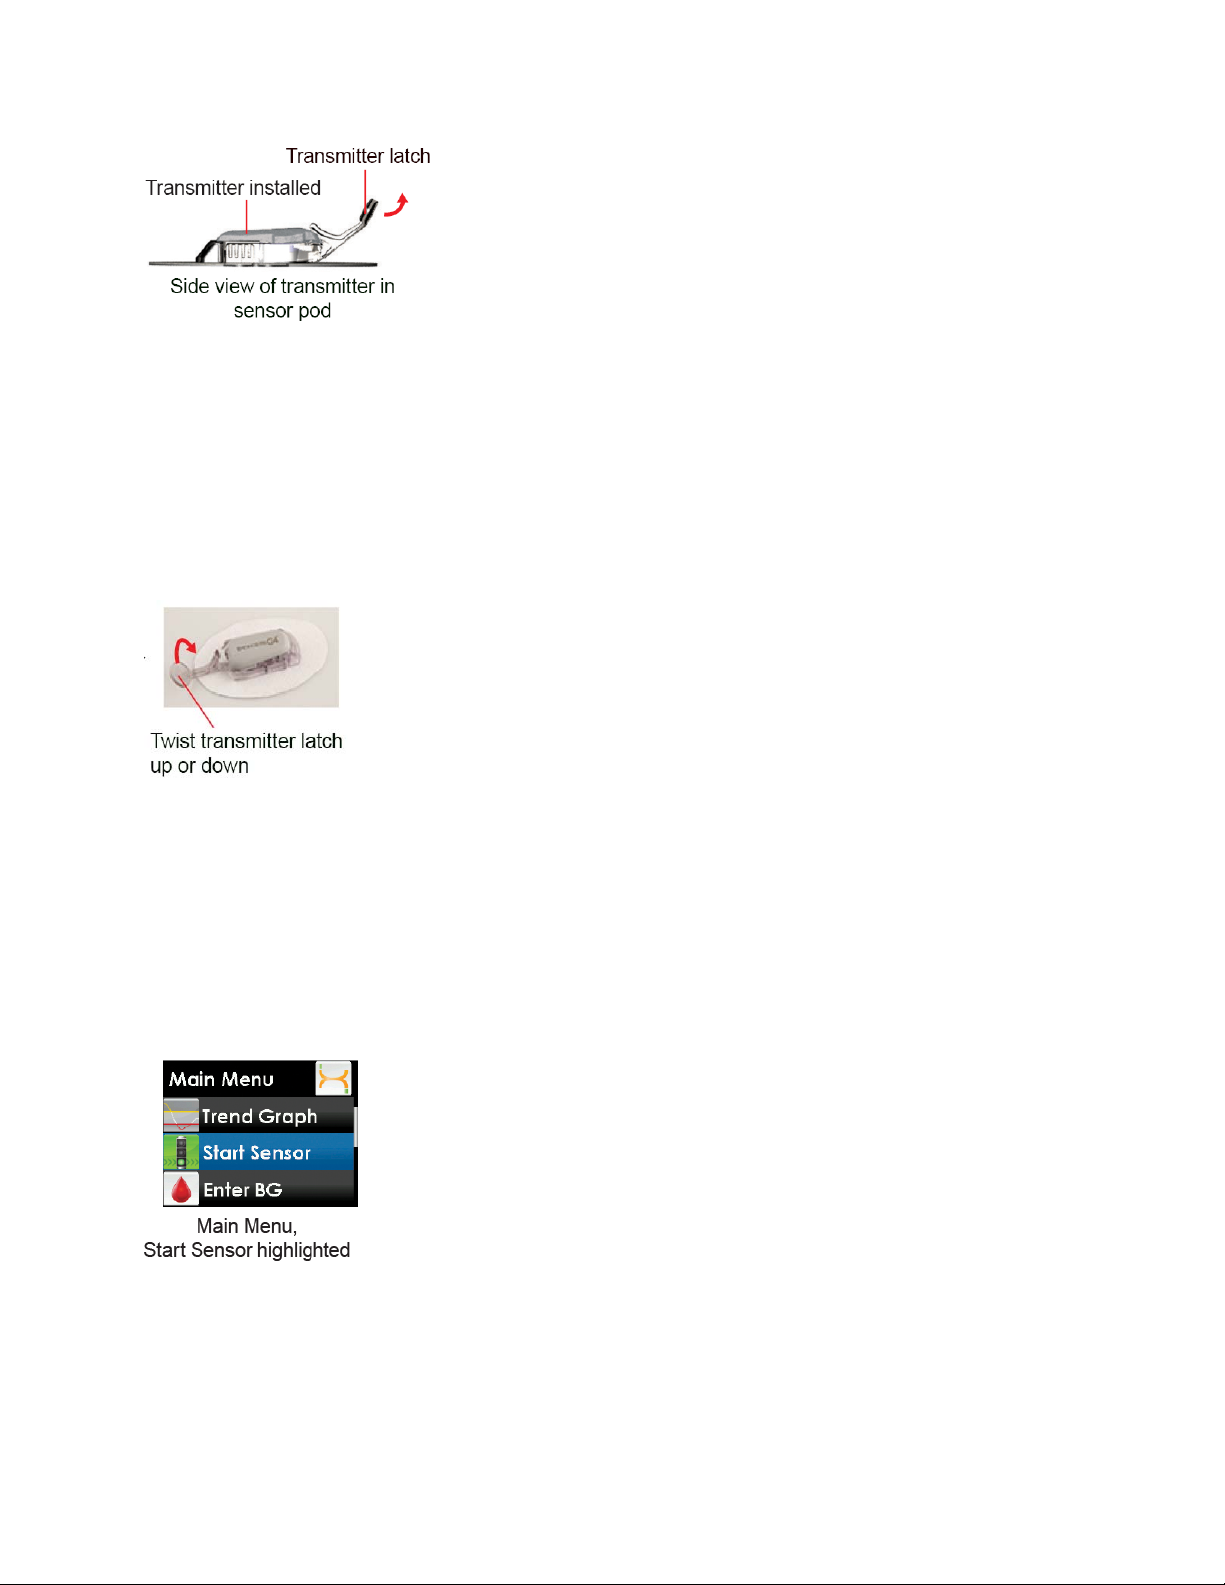
5. Squeeze the center of the ribbed release tabs on the sides of the sensor pod to remove the applicator
barrel. Only the sensor pod will be left on your body.
• Make sure the transmitter latch is down (against your body) before squeezing the tabs to remove the
applicator barrel.
• Squeeze the center of the ribbed part of the release tabs.
• While squeezing the tabs, rock the applicator barrel forward and out away from your body.
If you have any problems with insertion, save the sensor and applicator and contact Dexcom Technical
Support (see Chapter 15, User Assistance).
6.6 TRANSMITTER ATTACHMENT
You must snap the transmitter into the sensor pod after you insert your sensor. Follow these steps to attach
your transmitter.
1. Wipe and dry the bottom of the transmitter with a damp cloth or an alcohol wipe before every use.
Do not to touch the metal circles on the bottom of the transmitter with your skin.
Do not to scratch the bottom of the transmitter as scratches may compromise the waterproof seal.
2. Place the transmitter in the sensor pod (with the flat side down, and the narrower side away from the
transmitter latch).
3. Snap in the transmitter:
a. With one hand, you may want to pinch up on your skin at the front edge of the white adhesive.
b. Place one finger on the transmitter to keep it in place.
c. With your other hand, pull the transmitter latch up and forward, over the transmitter, to snap it into
place. The transmitter should lie flat in the sensor pod.
33
Page 34
• Make sure you hear 2 clicks when you snap the transmitter in place. If it is not fully snapped in, this
may lead to a poor connection and let fluids to get under the transmitter. This can lead to inaccurate sensor
glucose readings.
d. Release your pinch on the adhesive edge at this time.
e. Make sure the transmitter is secure by sliding your fingers under each long side of the sensor pod and
pressing down on the transmitter with your thumb of the same hand, like you are pinching it.
4. Hold the sides of your sensor pod with one hand. Remove the transmitter latch with your other hand by
quickly twisting off the latch away from your body.
5. Do not remove the transmitter from the sensor pod while the pod is attached to your skin.
6.7 STARTING A SENSOR SESSION
Follow the steps below to tell the receiver that you inserted a new sensor.
1. Press the
2. From any trend graph, press the
3. Press the
• The “Start Sensor” menu option will disappear from the main menu after you select it. The option will
only come back after an active sensor session ends. If you do not see the “Start Sensor” option on your
menu screen, you can continue your current session or stop the session (refer to Chapter 13, Section 13.6,
Sensor Shut-off Troubleshooting).
SELECT
DOWN
button to turn on the receiver.
SELECT
button to highlight “Start Sensor.”
button to see the Main Menu.
34
Page 35
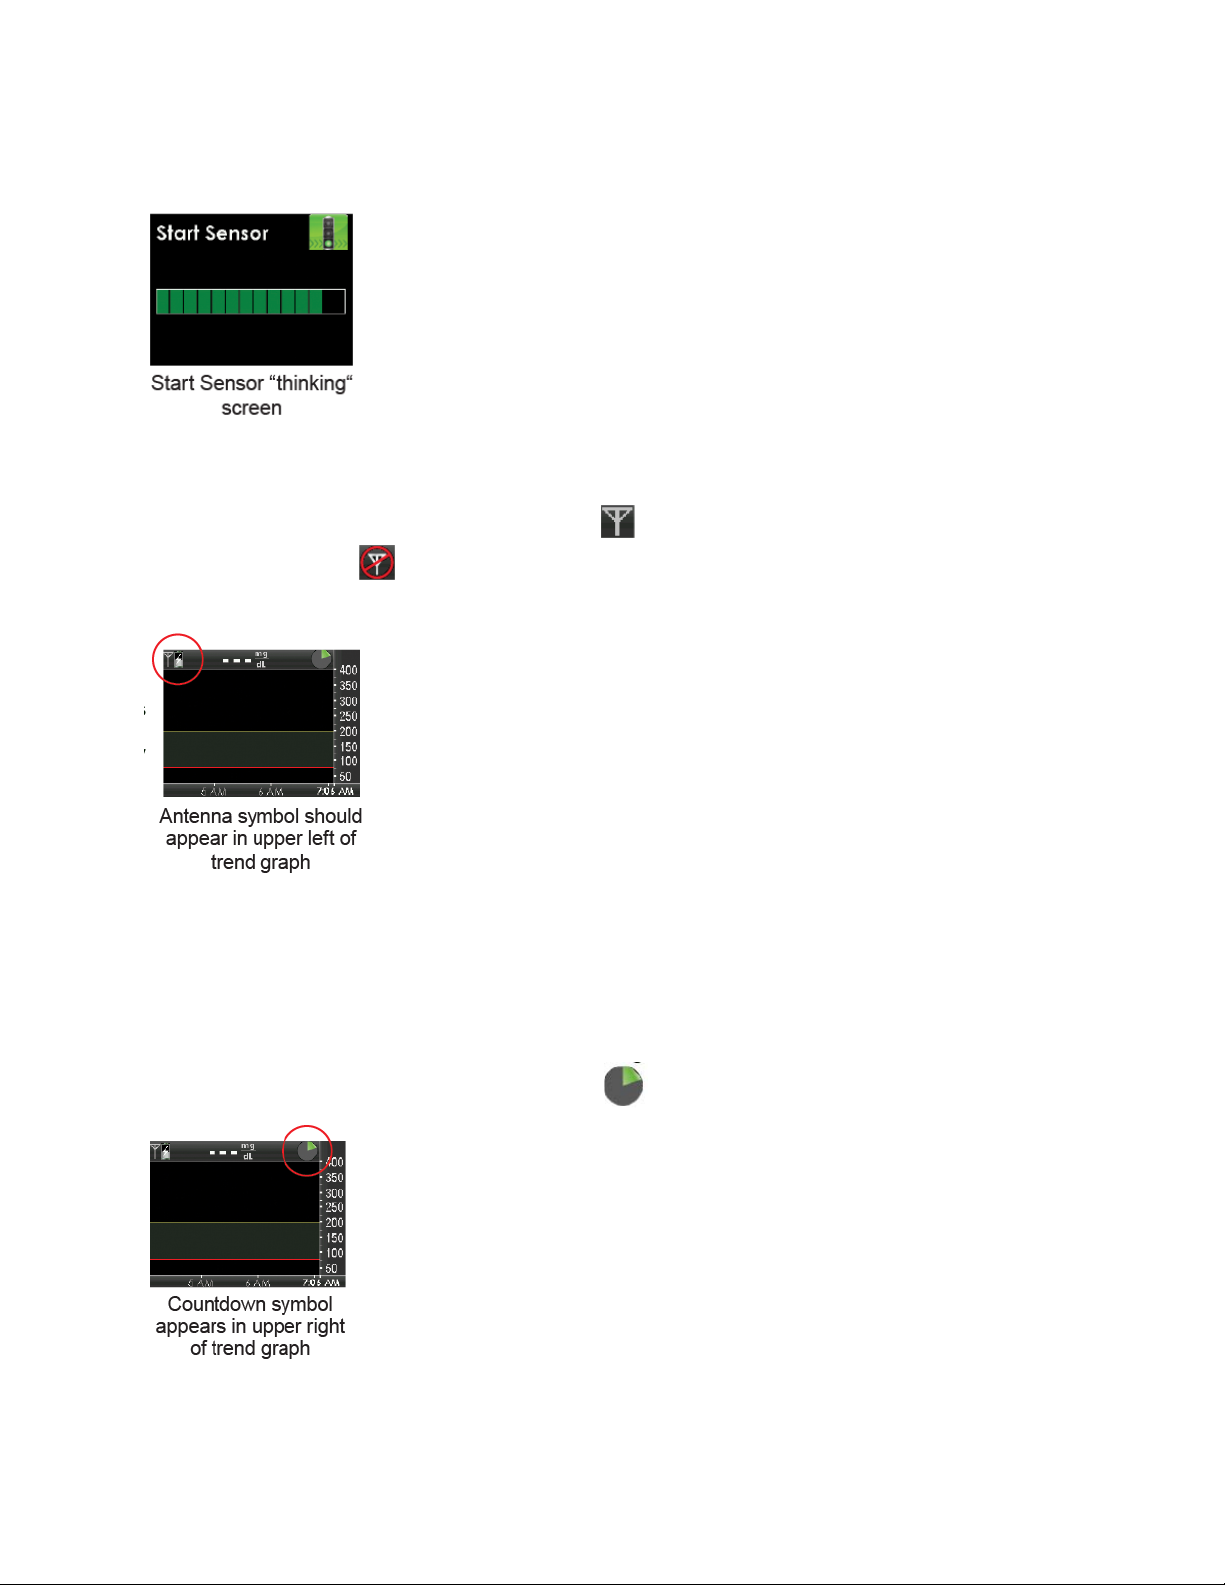
4. Press the
screen lets you know your sensor 2-hour startup has begun.
5. Your receiver returns to the 3-hour trend graph.
6. Check your receiver 10 minutes after starting your sensor session to make sure your receiver and
transmitter are
the out of range symbol shows in the upper right corner of the trend graph, see Chapter 13, Section
13.9, Out of Range/No Antenna.
SELECT
button to confirm the start of a new sensor session. The Start Sensor “thinking”
communicating. The antenna symbol should be in the upper left
corner of trend graph. If
7. You will not get sensor glucose readings or alerts until your 2-hour startup period ends and you complete
your first calibrations. See Chapter 7, Section 7.3, Startup Calibration.
6.8 SENSOR STARTUP PERIOD
The sensor needs a 2-hour startup period to adjust to being under the skin.
Your trend graph shows a 2-hour countdown
symbol in the upper right corner.
1. Press
SELECT
during the startup period to turn the on receiver display and see this symbol.
35
Page 36
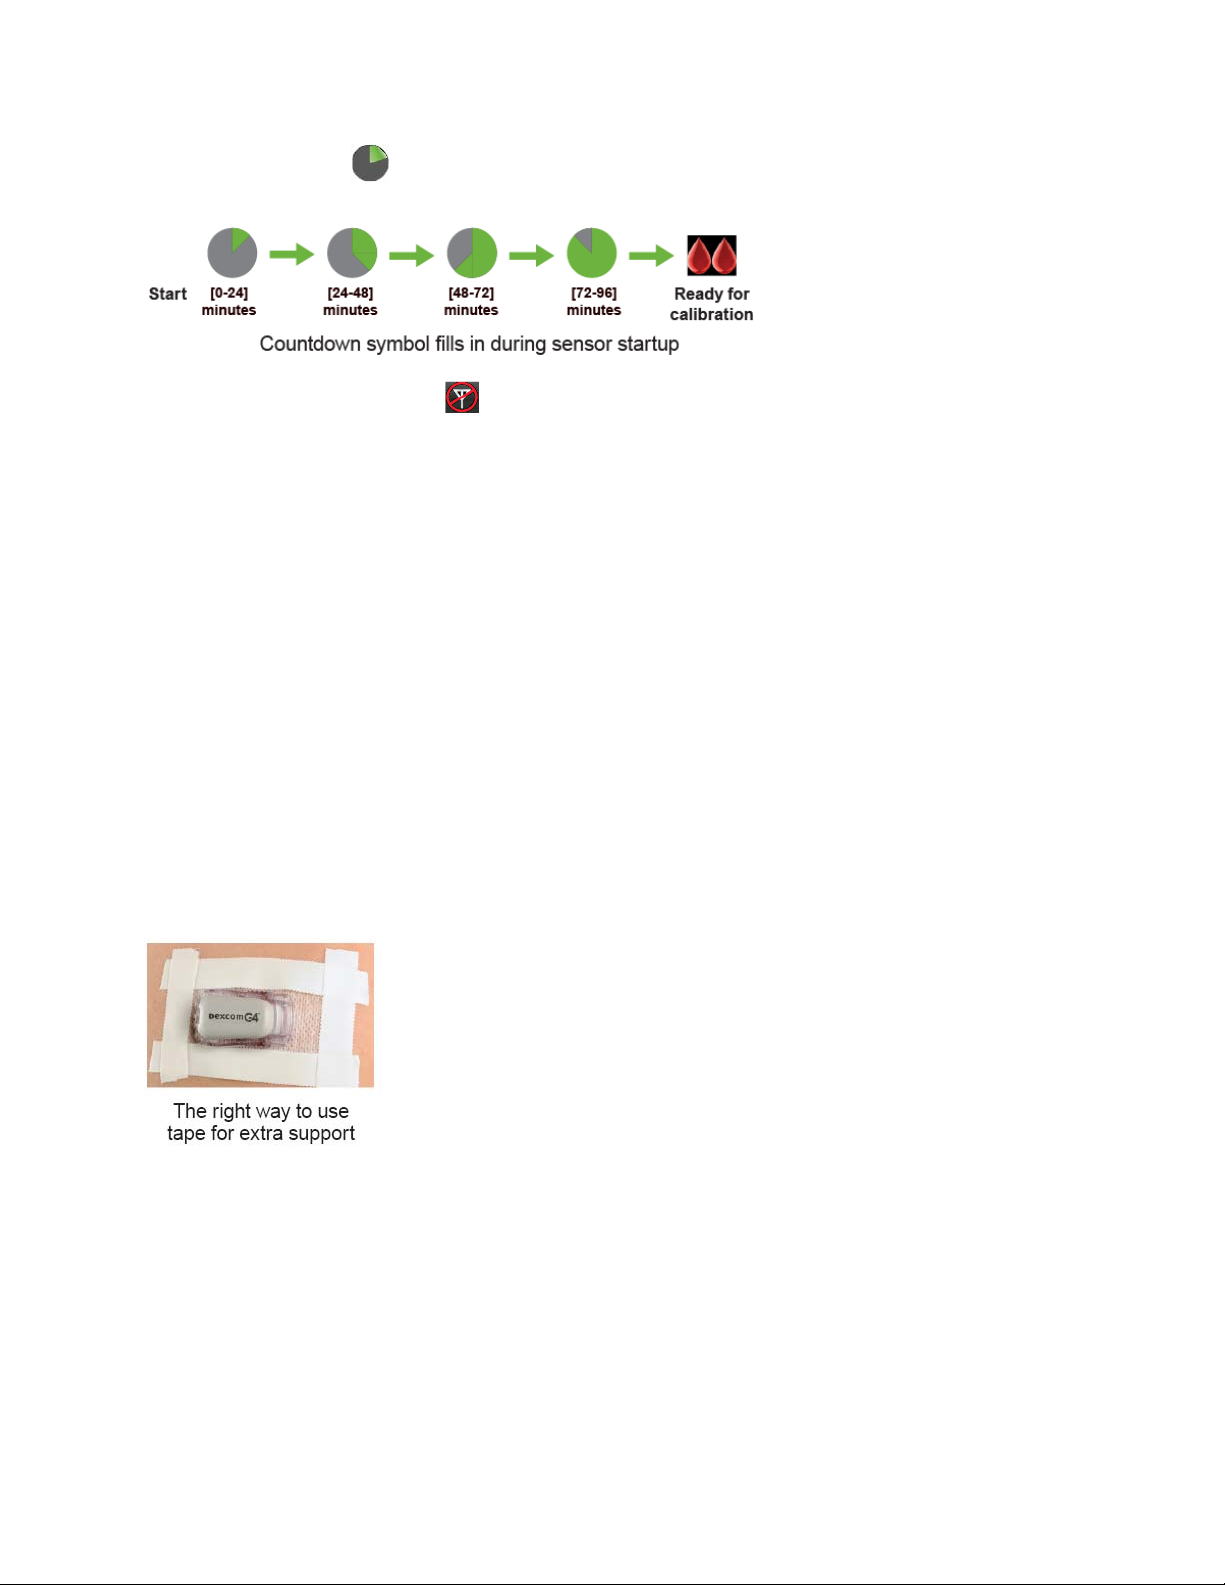
The countdown symbol fills in over time to show that you are getting closer to the first calibration time.
You will not get sensor glucose readings, alerts and alarm during the countdown.
If you see the out of range symbol at the top of the screen during
following troubleshooting tips:
• Make sure your receiver and transmitter are within 20 feet of each other without obstruction. Check in 10
minutes to see if the antenna symbol shows in the upper left corner of the receiver screen.
• If the receiver and transmitter are still not communicating, check the device information screen to make
sure the correct transmitter ID is entered into your receiver (see Chapter 5, Section 5.2, The Settings Menu).
• If the correct transmitter ID is in your receiver and the receiver and transmitter are still not communicating,
contact Dexcom Technical Support (see Chapter 15, User Assistance).
At the end of the 2-hour startup period the receiver lets you know it is time to calibrate your sensor. Chapter
7, Calibrating Your Dexcom G4 PLATINUM System, tells you how to calibrate your sensor.
the 2-hour startup, review the
6.9 TAPING THE SENSOR POD
The sensor pod should stay on your skin using its own adhesive. But, if the patch is peeling up, you can use
medical tape (such as Blenderm, Tegaderm, IV 3000, 3M tape) for extra support. If you use tape, only tape
over the white adhesive patch on all sides for even support. Do not tape over the transmitter or any of the
plastic parts of the sensor pod. Do not tape under the sensor pod or leave any substance on the skin where
you insert the sensor.
6.10 TEMPORARY RECEIVER SHUTDOWN
There may be times when you want to shut down your receiver temporarily. Shutdown stops all
communication between the transmitter and receiver and turns the receiver off. You will not receive sensor
glucose readings or
continue. Follow these steps to shut down your receiver:
1. From the Main Menu, scroll to highlight “Shutdown.” Press the
alerts or alarm while the receiver is shut down, but your current sensor session will
any
SELECT
button.
36
Page 37
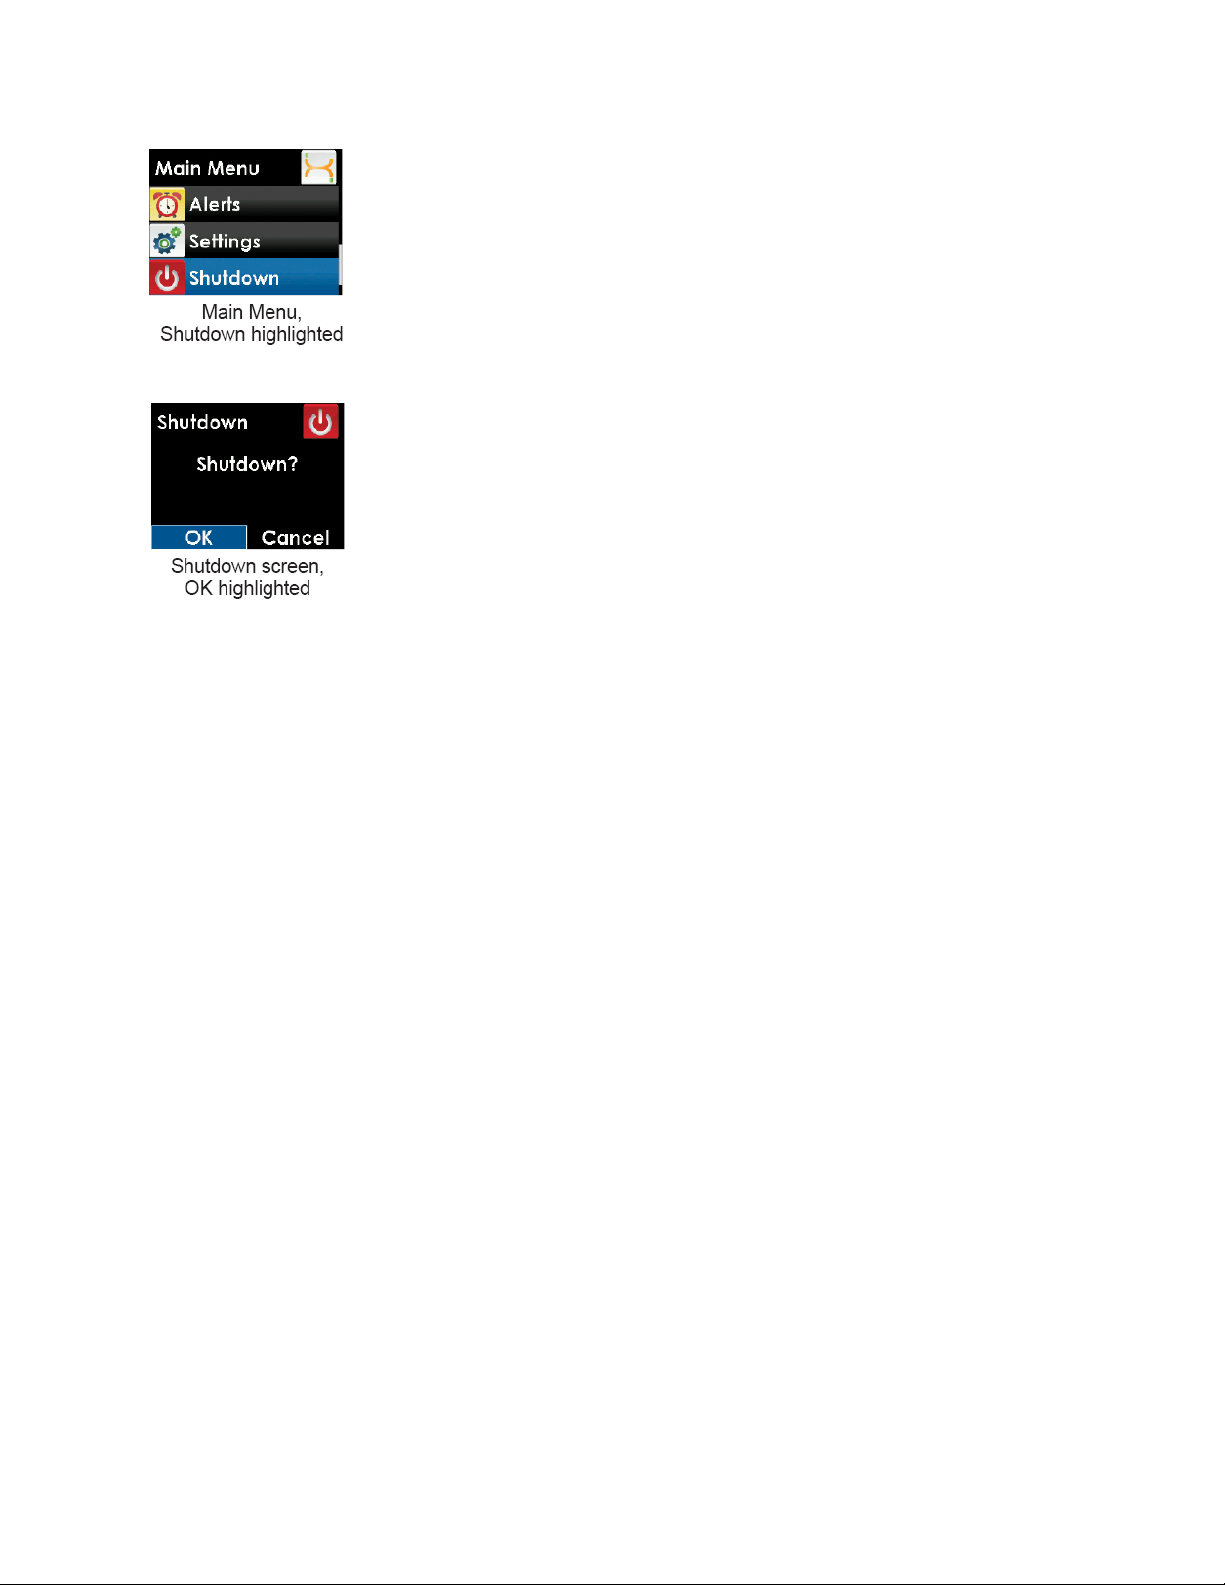
2. Confirm that you want to shut down your receiver.
a. If you want to shut down, press the
b. If you want to cancel the shutdown, press the
the Main Menu.
To turn the receiver back on and resume communication with the transmitter, press the
may take up to 20 seconds for the display to turn back on.
Remember that your alerts and low glucose alarm will not work when the receiver is shut down.
Shutting down the receiver does not extend the sensor life beyond 7 days. Your sensor session will
stop 7 days after you started the sensor session.
button to highlight “OK,” and then press the
LEFT
SELECT
button (with “Cancel” highlighted) to return to
SELECT
SELECT
button.
button. It
6.11 THE DEXCOM G4 PLATINUM SYSTEM AND WATER
Your sensor is water resistant when showering, bathing or swimming if the transmitter is fully snapped in.
The sensor has been tested to be water resistant when submerged for up to 8 feet and up to 24 hours.
Keep the receiver dry. Do not spill fluids on it or drop it into fluids.
to help prevent fluid from getting inside the receiver.
through water so the range is much less if you are in a pool, bathtub or water bed.
If your receiver gets wet, make sure the speaker and vibrate mode are still working. You can do this using
the Try It option in the Profiles menu. See Chapter 9, Section 9.3, Alert Profiles.
Wireless communication does not work well
Keep the micro USB port cover closed
37
Page 38
CHAPTER 7: CALIBRATING YOUR DEXCOM G4 PLATINUM SYSTEM
You must calibrate Dexcom G4 PLATINUM System sensor glucose readings to your blood glucose meter.
CONTRAINDICATION
Taking medications with acetaminophen (such as Tylenol) while wearing the sensor
may falsely raise your sensor glucose readings. The level of inaccuracy depends on
the amount of acetaminophen active in your body and may be different for each
person.
7.1 CALIBRATION OVERVIEW
Your receiver needs calibrations to display continuous sensor glucose readings and trend information.
There are important times when you
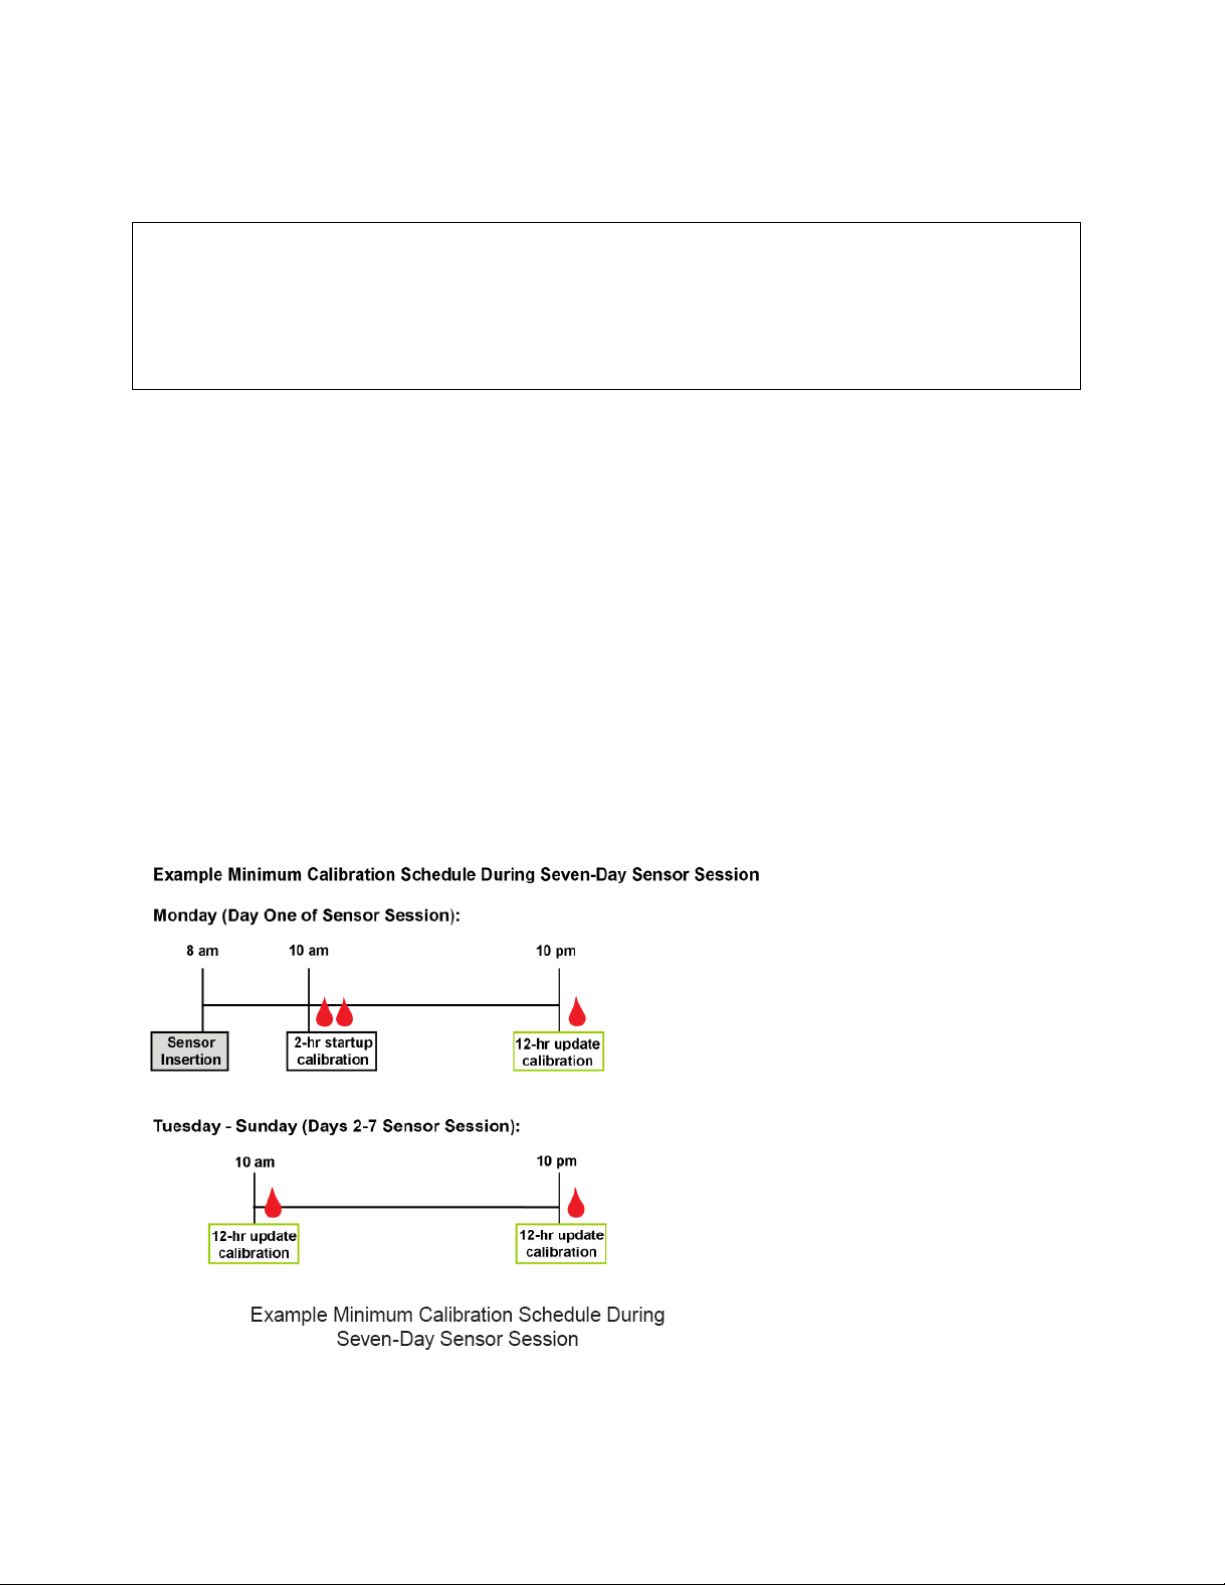
1. 2-hour startup: 2 hours after you insert your sensor
2. 12 hour update: every 12 hours after the 2-hour startup calibration
3. More information needed or other reasons
When calibrating, you must enter your blood glucose values into the receiver by hand. You can use any
commercially available blood glucose meter. You must calibrate with accurate blood glucose meter values
to get accurate sensor glucose readings.
On the first day of your sensor session, you must enter 2 blood glucose values into your receiver. You must
enter 1 blood glucose value calibration 12 hours after your startup calibration. You must enter 1 blood
glucose value every 12 hours. The receiver will remind you when it needs these calibrations. You may be
prompted to enter additional blood glucose values as needed.
must
calibrate:
38
Page 39
PRECAUTION
Do not use alternative blood glucose site testing (blood from your palm or forearm,
etc.) for calibration. Alternative site blood glucose values may be different than those
taken from a fingerstick blood glucose value and may not represent the timeliest blood
glucose value. Use a blood glucose value taken only from a fingerstick for calibration.
Alternative site blood glucose values might affect sensor performance, and you might
miss a low or high blood glucose value.
7.2 HOW TO CALIBRATE
You must enter the exact blood glucose value from your meter for each calibration. Blood glucose values
must be between 40-400 mg/dL and must have been taken within the past 5 minutes.
• Make sure either a sensor glucose reading or a calibration needed symbol shows at the top of the trend
graph before calibrating.
• Your sensor can be calibrated if your meter glucose is 40 mg/dL or above. For safety reasons, if your
blood glucose is low, first treat your low blood sugar.
• Always make sure the antenna symbol is in the upper left corner of
blood glucose values for calibration.
• Always use the same meter to calibrate that you routinely use to measure your blood glucose. Do not
switch your meter in the middle of a sensor session. Blood glucose meter and strip accuracy vary between
blood glucose meter brands.
• The accuracy of the blood glucose meter value used for calibration may affect the accuracy of sensor
glucose readings.
the trend graph before you enter
WARNING
Calibrate at least once every 12 hours. Calibrating less often than every 12 hours
might cause sensor glucose readings to be inaccurate, and you might miss a low or
high blood glucose value.
PRECAUTION
Do not calibrate if your blood glucose is changing at a significant rate, typically
more than 2 mg/dL per minute. Do not calibrate when your receiver screen is
showing the rising single arrow or double arrow, which indicates that your blood
glucose is rising 2-3 mg/dL/min or more than 3 mg/dL/min. Also, do not calibrate
when your receiver screen is showing the falling single arrow or double arrow,
which indicates that your blood glucose is falling 2-3 mg/dL/min or more than 3
mg/dL/min. Calibrating during significant rise or fall of blood glucose may affect
accuracy of sensor glucose readings.
39
Page 40
PRECAUTION
To calibrate the system, enter the exact blood glucose value that your blood
glucose meter displays within 5 minutes of a carefully performed blood glucose
measurement. Entering incorrect blood glucose values or blood glucose values
from more than 5 minutes before entry might affect sensor performance, and you
might miss a low or high blood glucose value.
Only use blood glucose values between 40-400 mg/dL for calibration. If the blood glucose value you enter is
outside of this range, the receiver will not calibrate. You must wait until your blood glucose is in this range to
calibrate.
These steps show you how to enter your blood glucose values for calibration:
1. Wash and dry your hands, make sure your glucose test strips are not expired and have been stored
properly, and make sure your meter is properly coded (if required).
2. Take a blood glucose measurement using your meter.
• Carefully apply the blood sample to the test strip following your meter or test strip instructions.
3. From any trend graph, press the
4. Use the UP or
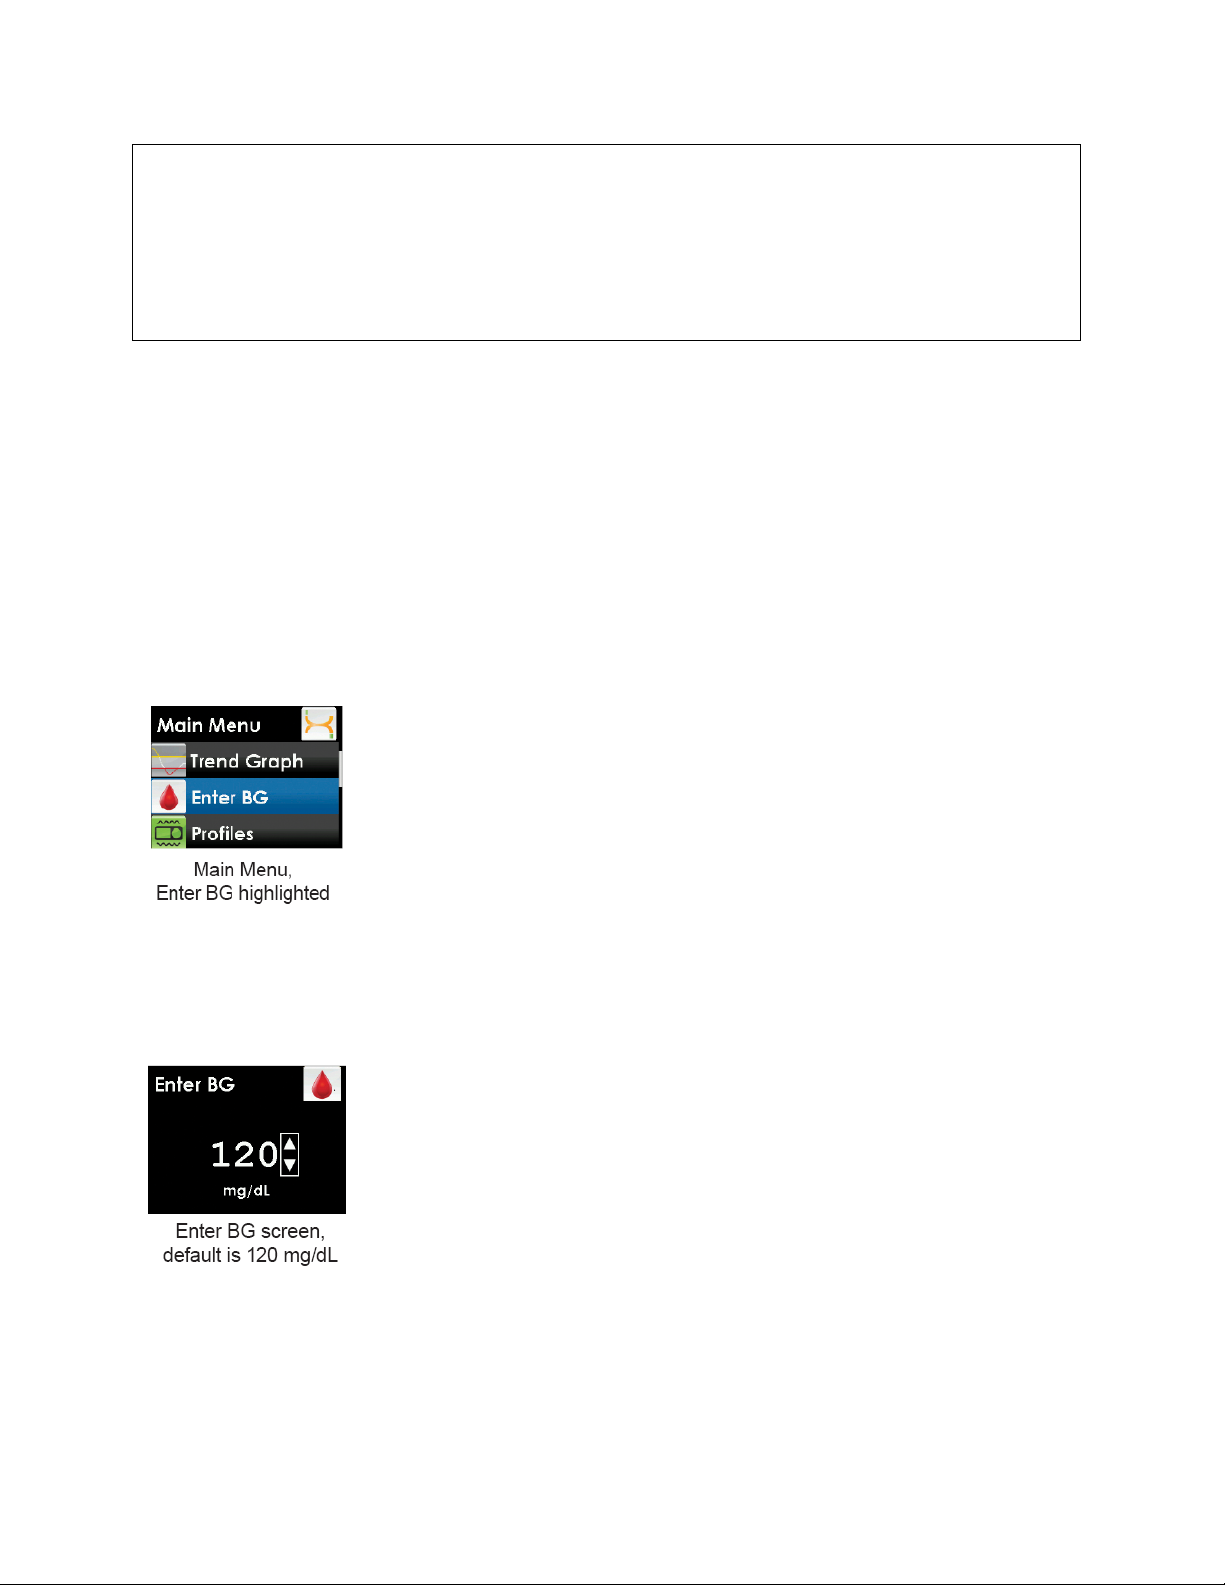
• “Enter BG” will be the second Main Menu option when you are in the middle of a sensor session.
5. Press the
mg/dL units.
a. When the receiver does not have a recent sensor glucose reading the default is 120 mg/dL.
DOWN
SELECT
button to scroll until you highlight “Enter BG”.
button to choose this option. You will see a screen with a blood drop and a number in
SELECT
button to see the Main Menu.
b. If there has been a sensor glucose reading in the past 15 minutes, the Enter BG screen shows your
current sensor glucose reading.
only blood glucose values from your meter.
6. Use the UP or
SELECT
button.
DOWN
button to scroll until you see the correct blood glucose value, and then press the
Do not use the current sensor glucose reading for calibration.
Use
40
Page 41
7.
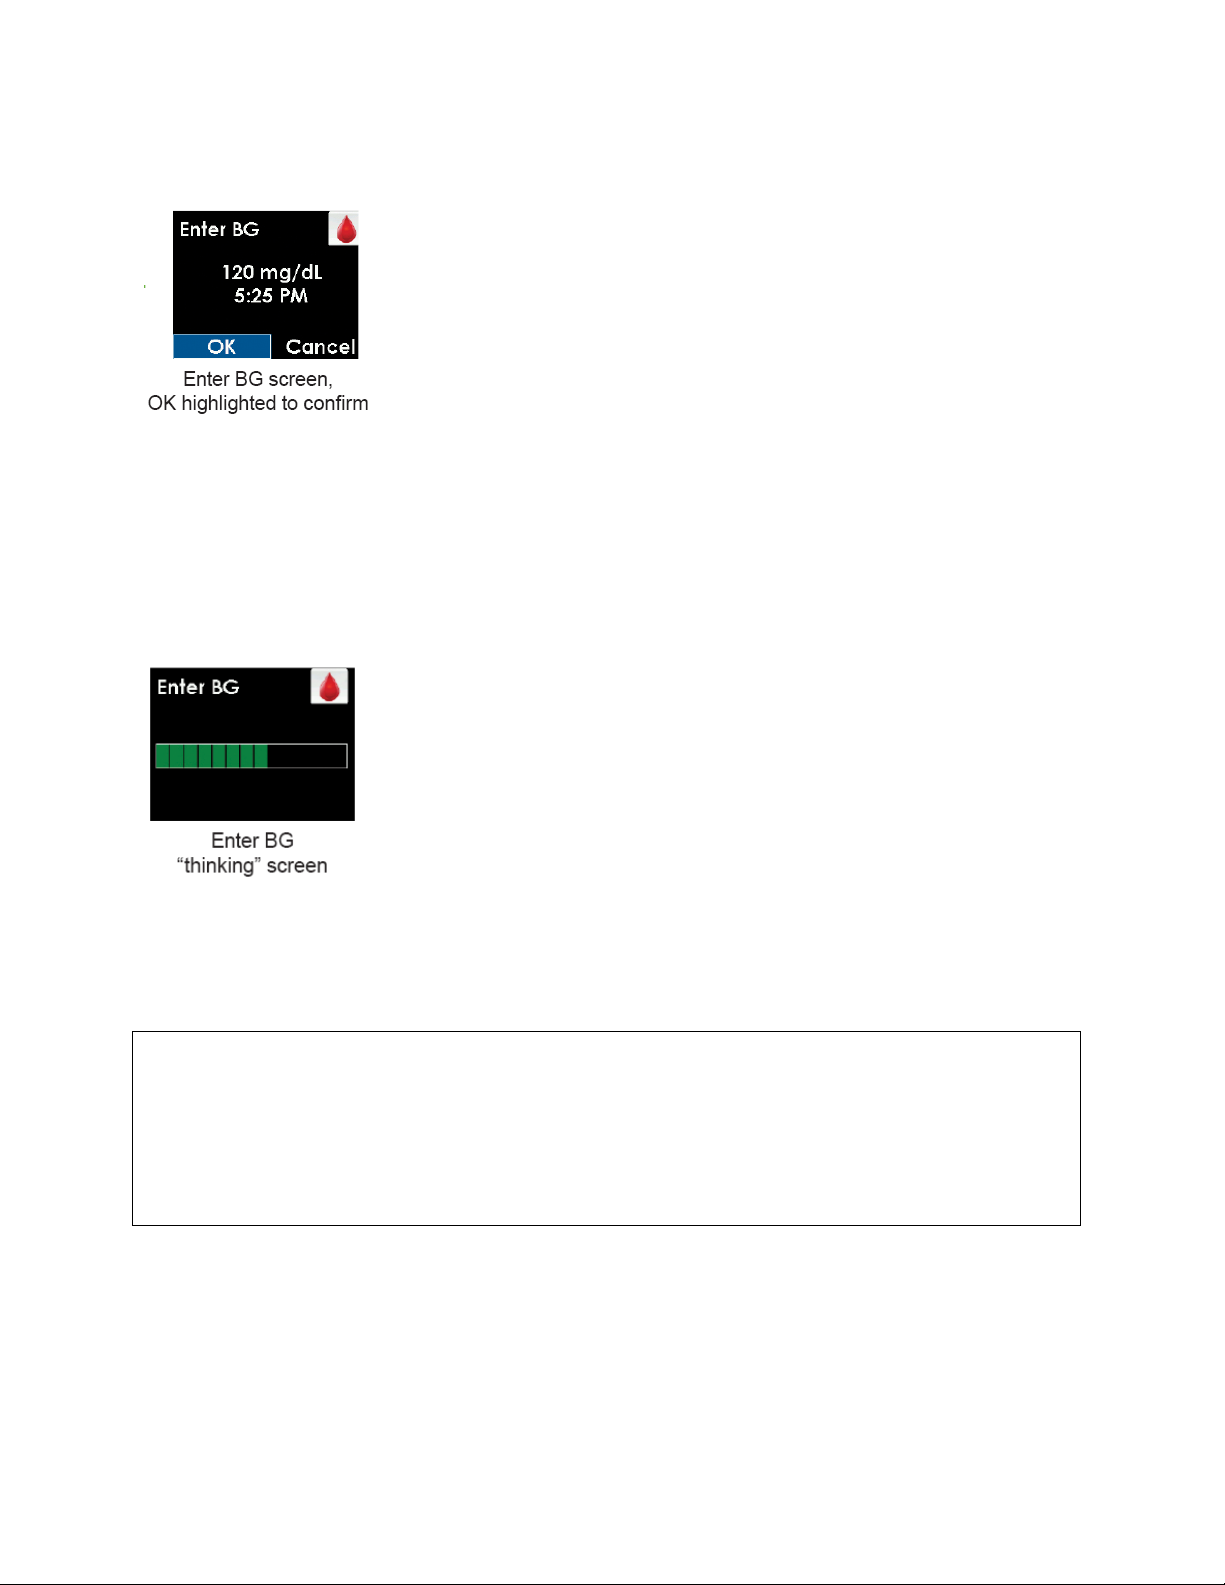
Confirm that the blood glucose value you entered is correct. Entering incorrect values may
affect the sensor accuracy.
a. Press the
b. If the blood glucose value shown is incorrect, press the
press the
glucose value.
c. If you do not press the
recorded for calibration.
8. The Enter BG “thinking” screen lets you know the blood glucose value is being used for calibration.
9. For 2-hour startup calibration, repeat these steps for the second blood glucose value.
A sensor glucose reading appears on the receiver right away, and sensor glucose readings are updated
every 5 minutes.
If readings do not appear immediately, see Chapter 13, Section 13.2, Calibration Troubleshooting.
SELECT
SELECT
button if the blood glucose value displayed is correct.
RIGHT
button to return to the Enter BG screen. Repeat the steps to enter the correct blood
SELECT
button, the receiver will “time out” and no blood glucose value will be
button to highlight “Cancel” then
PRECAUTION
To calibrate the system, enter the exact blood glucose value that your blood glucose
meter displays within 5 minutes of a carefully performed blood glucose measurement.
Entering incorrect blood glucose values or blood glucose values from more than 5
minutes before entry might affect sensor performance, and you might miss a low or
high blood glucose value.
7.3 STARTUP CALIBRATION
Two hours after you start the sensor session (see Chapter 6, Section 6.7, Starting a Sensor Session) the
receiver tells you that you need to calibrate by showing the startup calibration prompt. This means you need
to calibrate with 2 separate blood glucose values from your meter.
readings until the receiver accepts the blood glucose values.
41
You will not see sensor glucose
Page 42
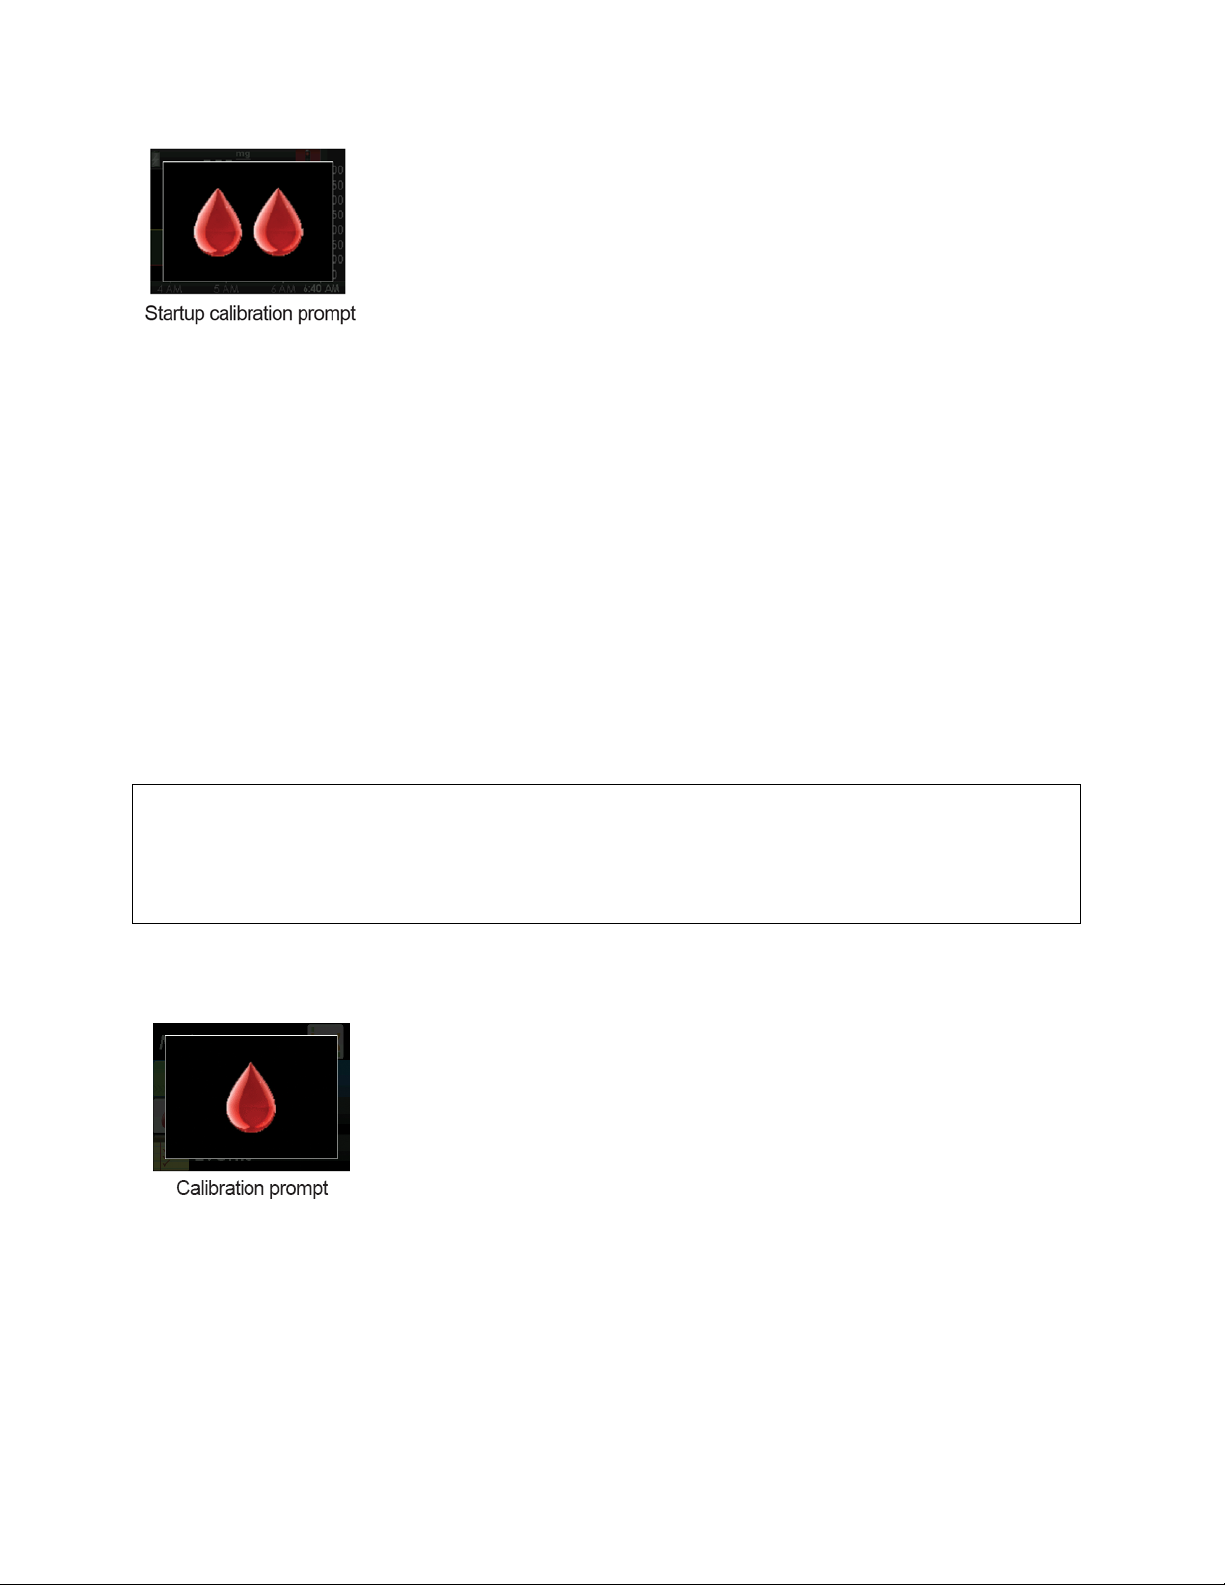
1. When you see this screen, press the
a. The startup calibration symbol will stay at the top of the trend graph until you calibrate.
b. The system will re-alert you every 15 minutes until you enter the blood glucose values.
c. If you do not clear the prompt, the system will re-alert you every 5 minutes.
2. Take 2 separate blood glucose measurements with your meter, and enter the blood glucose values into
the receiver (see Chapter 7, Section 7.2, How to Calibrate).
SELECT
button to clear it.
7.4 12-HOUR CALIBRATION UPDATE
Calibrate your system at least every 12 hours after your first calibration (2-hour startup calibration) to make
sure your sensor glucose readings remain accurate and close to your blood glucose meter values. You can
enter blood glucose values earlier than 12 hours if you want. If you have not entered any blood glucose
values in the past 12 hours, the receiver will ask you to enter a blood glucose value to update its calibration.
WARNING
Calibrate at least once every 12 hours. Calibrating less often than every 12 hours
might cause sensor glucose readings to be inaccurate, and you might miss a low or
high blood glucose value.
The following steps show you how to enter this calibration.
1. When you see this screen, press the
a. The startup calibration needed symbol will stay at the top of the trend graph until you calibrate.
b. The system will re-alert every 15 minutes until you enter the blood glucose values.
2. Take 1 blood glucose measurement with your meter, and enter the blood glucose value into the receiver.
If this screen reappears soon, see Chapter 13, Section 13.2, Calibration Troubleshooting.
SELECT
button to clear it.
7.5 OTHER REASONS YOU MAY NEED TO CALIBRATE
42
Page 43
You may need to calibrate when your system did not accept the last calibration or your blood glucose value
is very different from the sensor glucose reading.
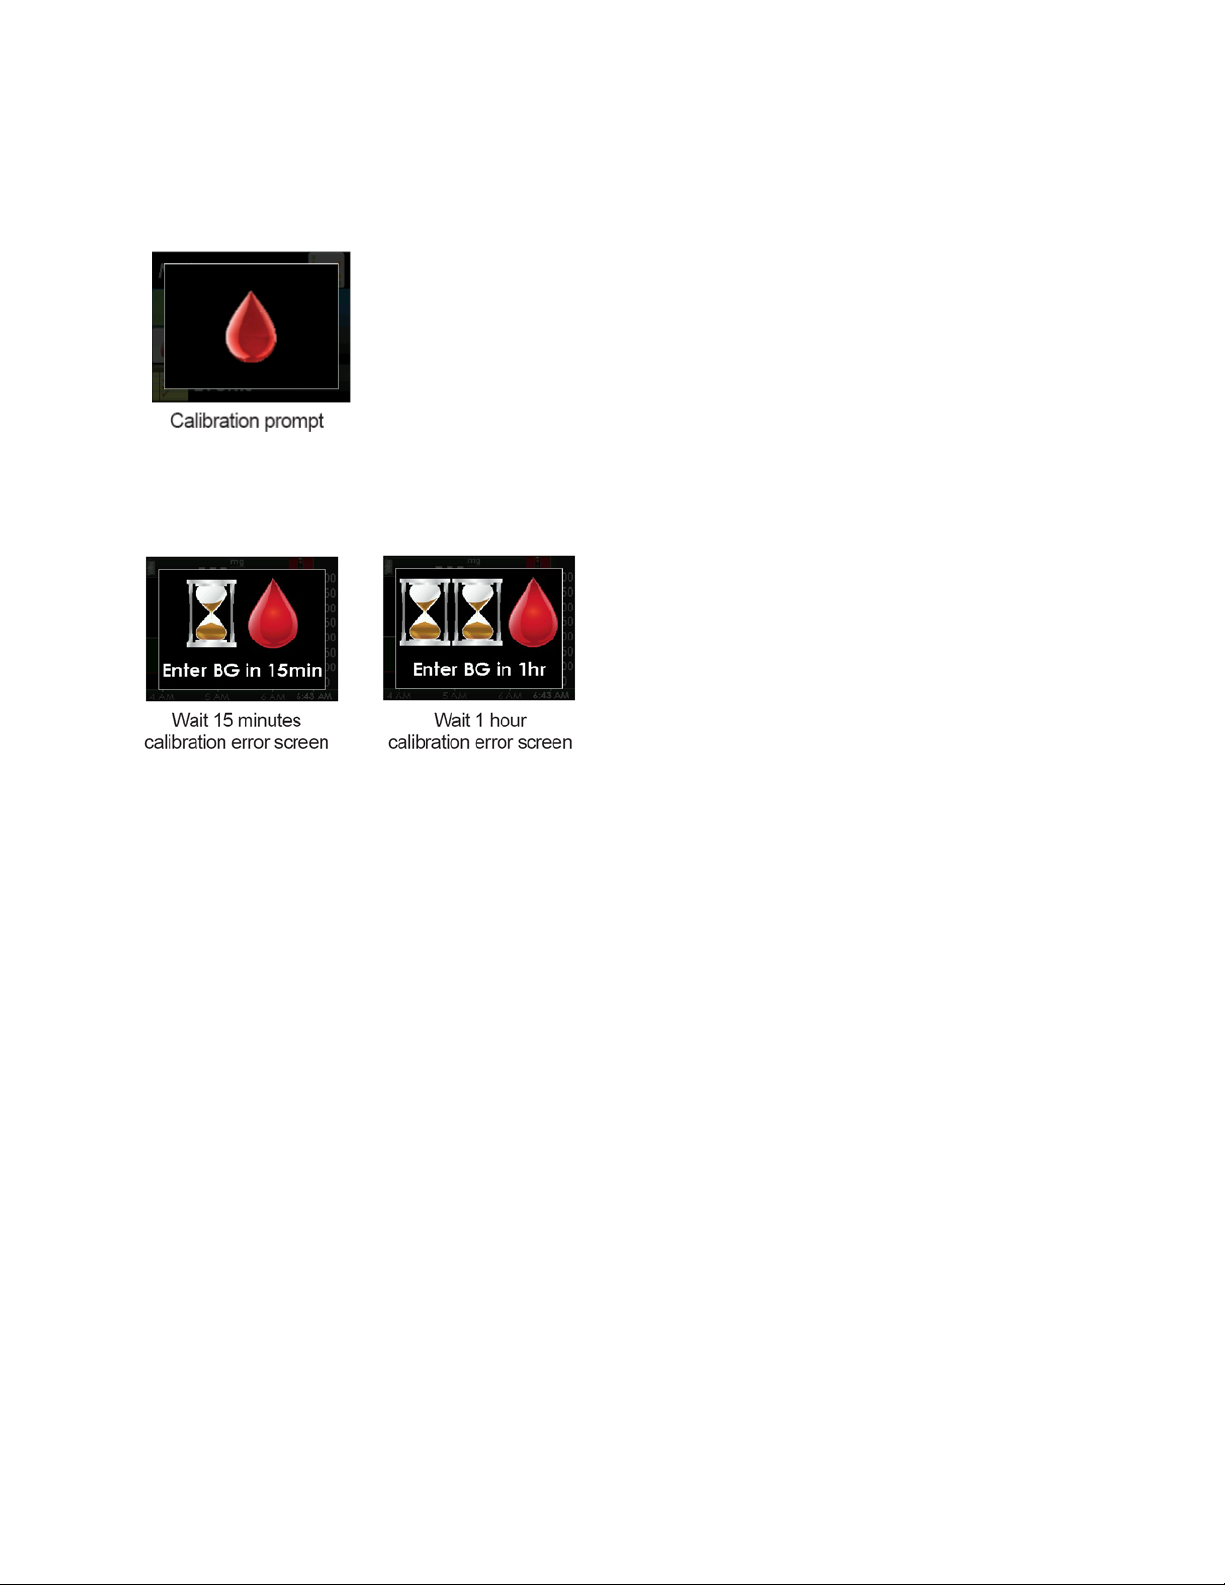
When you see this calibration prompt it means it is time to calibrate with a single blood glucose value.
Take 1 blood glucose measurement with your meter, and enter the blood glucose into the receiver. If this
screen reappears soon, see Chapter 13, Section 13.2.1, Types of Calibration Prompts.
These screens show calibration errors (see Chapter 13, Section 13.3, Calibration Error Troubleshooting).
43
Page 44
CHAPTER 8: SENSOR GLUCOSE READINGS AND TRENDS
This chapter teaches you how to view your sensor glucose readings and trend information. The trend graph
provides additional information that your blood glucose meter does not. It shows your current glucose value,
the direction it is changing and how fast it is changing. The trend graph can also show you where your
glucose has been over time.
CONTRAINDICATION
Taking medications with acetaminophen (such as Tylenol) while wearing the sensor
may falsely raise your sensor glucose readings. The level of inaccuracy depends on
the amount of acetaminophen active in your body and may be different for each
person.
Your blood glucose meter and sensor measure glucose from two different types of body fluids: blood and
interstitial fluid. Therefore, readings from your blood glucose meter and sensor may not match.
The greatest benefit you get from using your Dexcom G4 PLATINUM System will come from the
trending information. It is important that you focus on the trends and rate of change on your
receiver, rather than the exact sensor glucose reading.
If you have trouble reading your receiver in bright sunlight, find a shady spot.
WARNING
Do not use the Dexcom G4 PLATINUM System for treatment decisions, such as how
much insulin you should take. The Dexcom G4 PLATINUM System does not replace a
blood glucose meter. Always use the values from your blood glucose meter for
treatment decisions. Blood glucose values may differ from sensor glucose readings.
Using the sensor glucose readings for treatment decisions could lead to low or high
blood glucose value.
8.1 SENSOR GLUCOSE READINGS
Press the
graph). The 3-hour trend graph shows the following:
SELECT
button to wake up the receiver screen and see the home screen (the 3-hour trend
44
Page 45
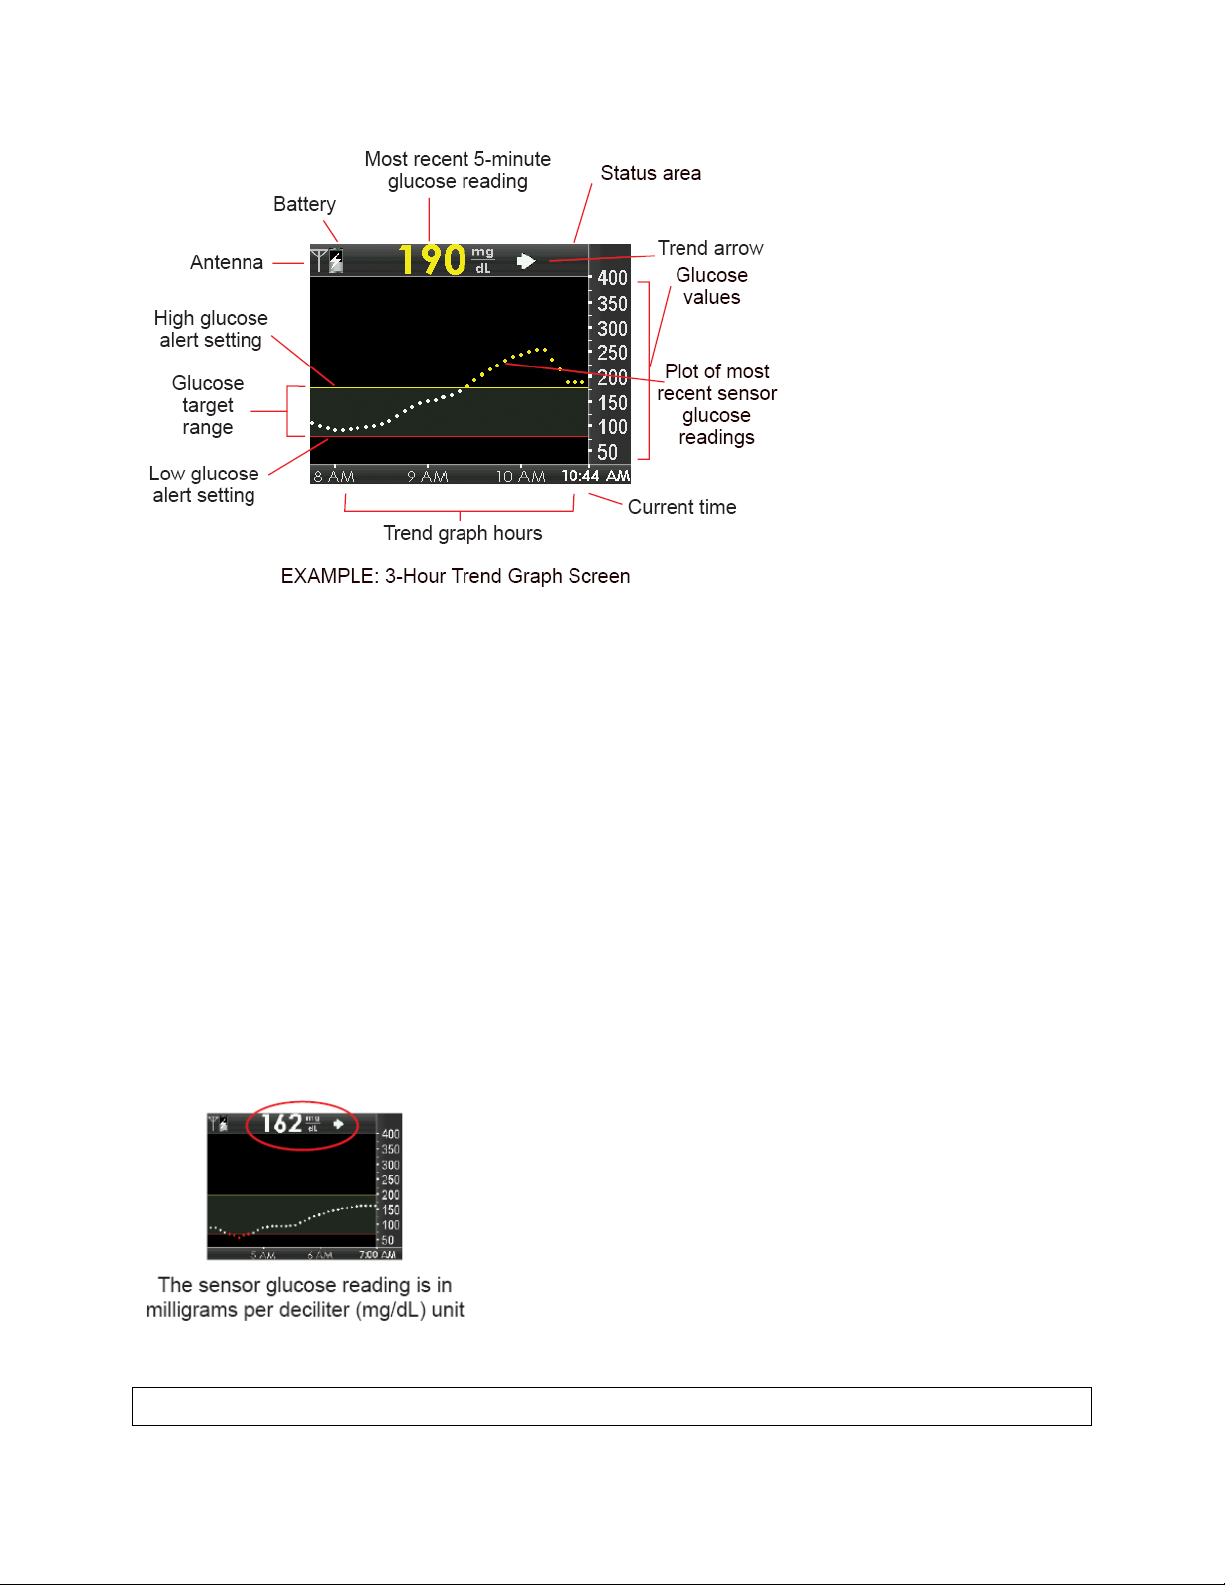
• Each “dot” on the trend graph is a sensor glucose reading reported every 5 minutes.
• The trend graph shows the current time.
• The status area shows needed calibration updates, calibration errors and sensor glucose reading issues.
• Your high alert setting shows as a yellow line across the trend graph.
• Your low alert setting shows as a red line across the trend graph.
• The gray zone highlights your target glucose range, based on your high and low glucose alert settings.
• Your current sensor glucose reading is red if it is low and yellow if it is high, based on your high and low
glucose alert settings.
• If your low glucose alert is not set and your glucose is 55 mg/dL or lower, your glucose value is red.
• If your sensor glucose readings are in between your high and low glucose alert settings, the glucose value
is white.
• The dots on your trend graph change colors based on your high and low alert settings.
You can view your past glucose information on the 1, 3, 6, 12, and 24 hour trend graphs by pressing the UP
or
DOWN
• Your system only reports glucose information between 40-400 mg/dL. Your trend graph shows a flat line or
dots at 400 or 40 mg/dL when your glucose is outside this range.
button.
Which Trend Graph Do You See?
(Scroll up from the 3-hour graph to reach the 1-hour graph)
45
Page 46
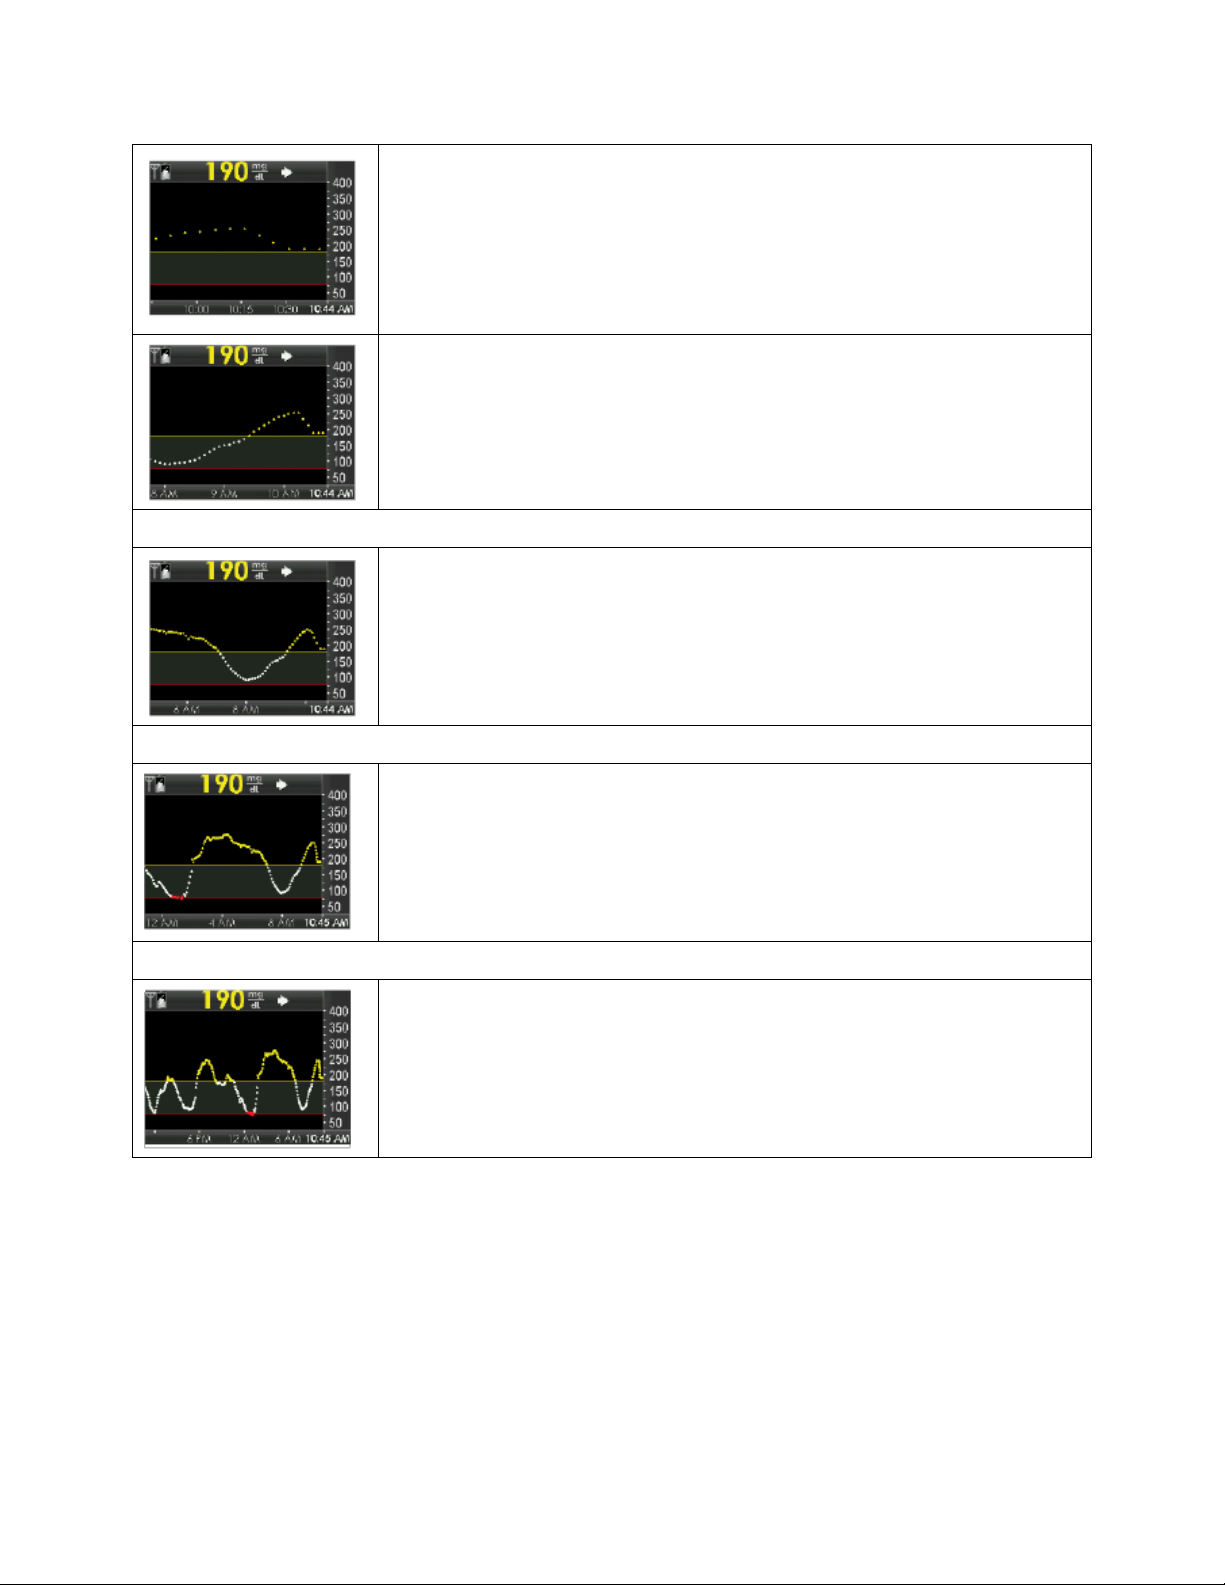
1-Hour Trend Graph: The 1-hour trend graph shows your current sensor
glucose reading and the last 1 hour of sensor glucose readings.
3-Hour Trend Graph: The 3-hour trend graph shows your current sensor
glucose reading and the last 3 hours of sensor glucose readings.
(Scroll down from the 3-hour graph to reach the 6-hour graph)
6-Hour Trend Graph: The 6-hour trend graph shows your current sensor
glucose reading and the last 6 hours of sensor glucose readings.
(Scroll down from the 6-hour graph to reach the 12-hour graph)
12-Hour Trend Graph: The 12-hour trend graph shows your current sensor
glucose reading and the last 12 hours of sensor glucose readings.
(Scroll down from the 12-hour graph to reach the 24-hour graph)
24-Hour Trend Graph: The 24-hour trend graph shows your current sensor
glucose reading and the last 24 hours of sensor glucose readings.
The receiver displays “LOW” when the most recent sensor glucose reading is less than 40 mg/dL and
“HIGH” when the most recent sensor glucose reading is greater than 400 mg/dL.
46
Page 47
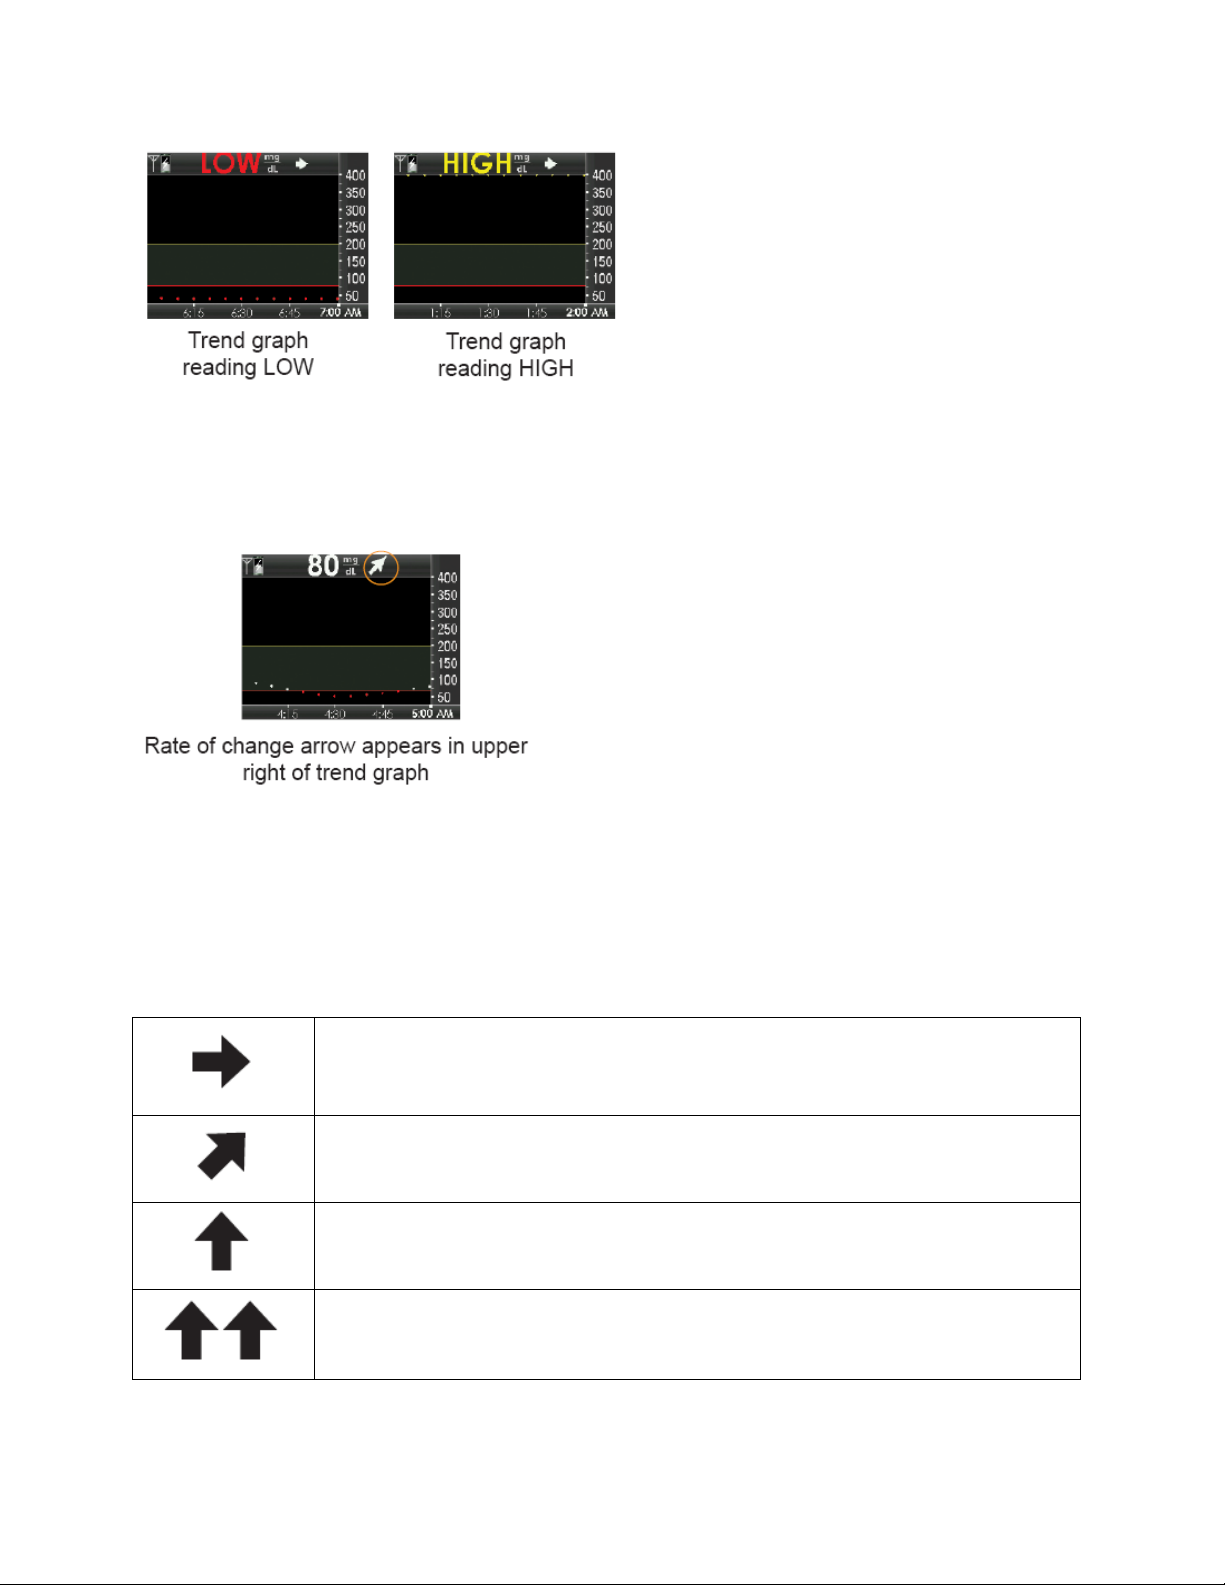
8.2 RATE OF CHANGE ARROWS
Your rate of change arrows add detail about the direction and speed of glucose change over the last 15-20
minutes.
The trend arrows show to the right of your current sensor glucose reading.
Do not overreact to the rate of change arrows.
overall trend graph and your blood glucose value before taking action.
If there are missed communications between the sensor and receiver during the last 15-20 minutes, an
arrow may not display.
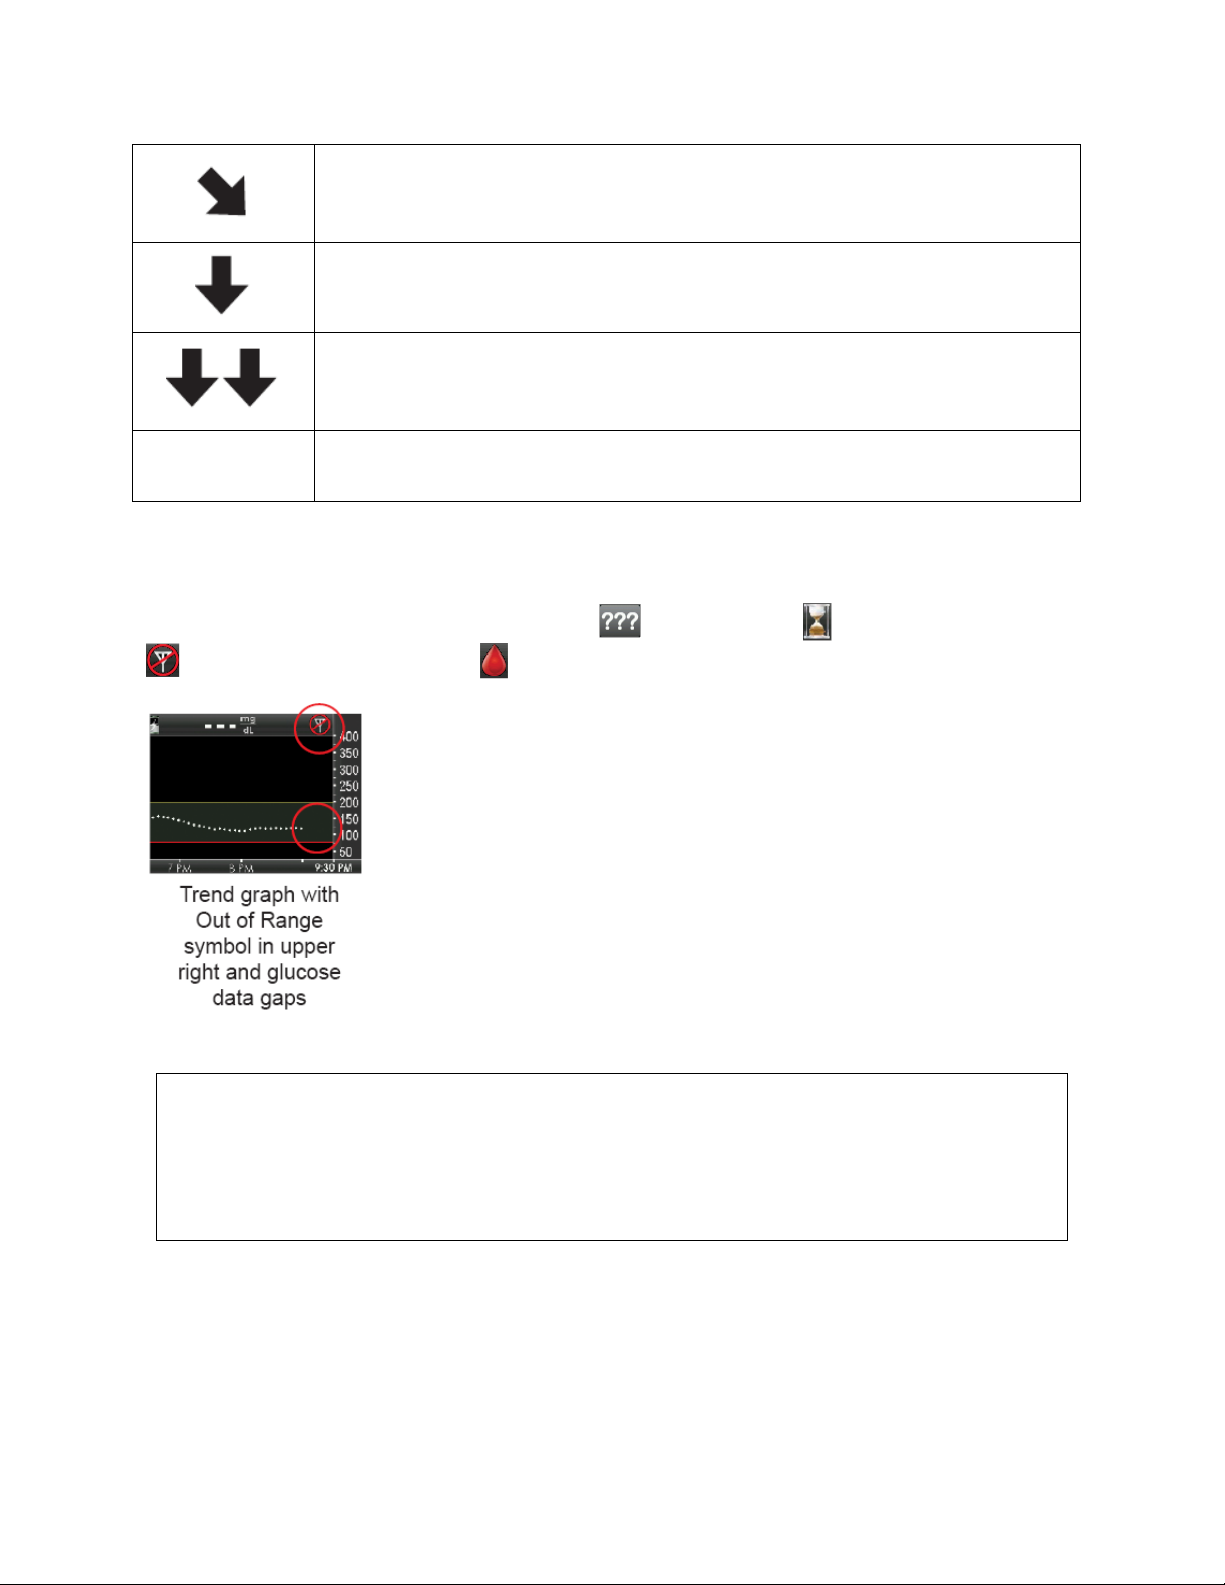
This table shows the different trend arrows your receiver displays:
Consider recent insulin dosing, activity, food intake, your
Trend Arrows
Constant:
each minute). Your glucose could increase or decrease by up to 15 mg/dL in 15
minutes.
Slowly rising:
this rate, your glucose could increase up to 30 mg/dL in 15 minutes.
Rising:
rate, your glucose could increase up to 45 mg/dL in 15 minutes.
Rapidly rising:
rising at this rate, your glucose could increase more than 45 mg/dL in 15 minutes.
Your glucose is steady (not increasing/decreasing more than 1 mg/dL
Your glucose is rising 1-2 mg/dL each minute. If it continued rising at
Your glucose is rising 2-3 mg/dL each minute. If it continued rising at this
Your glucose is rising more than 3 mg/dL each minute. If it continued
47
Page 48
Slowly falling:
this rate, your glucose could decrease up to 30
mg/dL in 15 minutes.
Your glucose is falling 1-2 mg/dL each minute. If it continued falling at
Falling:
No arrow
Trend arrows show to the right of your sensor glucose reading. They tell you more about your glucose’s
Trend arrows do not show when there are glucose data gaps (see Chapter 13, Section 13.4, System
Glucose Error). If the glucose reading error symbol , the wait symbol , the out of range symbol
, or the calibration needed symbol show at the top of the trend graph, the trend arrows will not
show.`
rate, your glucose could decrease up to 45 mg/dL in 15 minutes.
Rapidly falling:
continued falling at this rate, your glucose could decrease more than 45 mg/dL in 15
minutes.
No rate of change information:
is rising or falling at this time.
Your glucose is falling 2-3 mg/dL each minute. If it continued falling at this
Your glucose is falling more than 3 mg/dL each minute. If it
The receiver cannot calculate how fast your glucose
speed and direction.
If the trend arrow is missing, but you are concerned that your blood glucose level may be rising or falling,
take a blood glucose measurement test on your blood glucose meter.
WARNING
Do not ignore symptoms of high and low glucose. If your sensor glucose readings
do not match your symptoms, measure your blood glucose with a blood glucose
meter even if your sensor is not reading in the high or low range, so you do not
miss a low or high blood glucose value.
8.3 GLUCOSE STATUS AREA SYMBOLS
The “status area” at the top of the trend graph may show any of the status symbols below during your
sensor session. You will not get sensor glucose readings during the time a status symbol shows except
during the regular 12-hour calibration prompt.
Status Symbols
48
Page 49
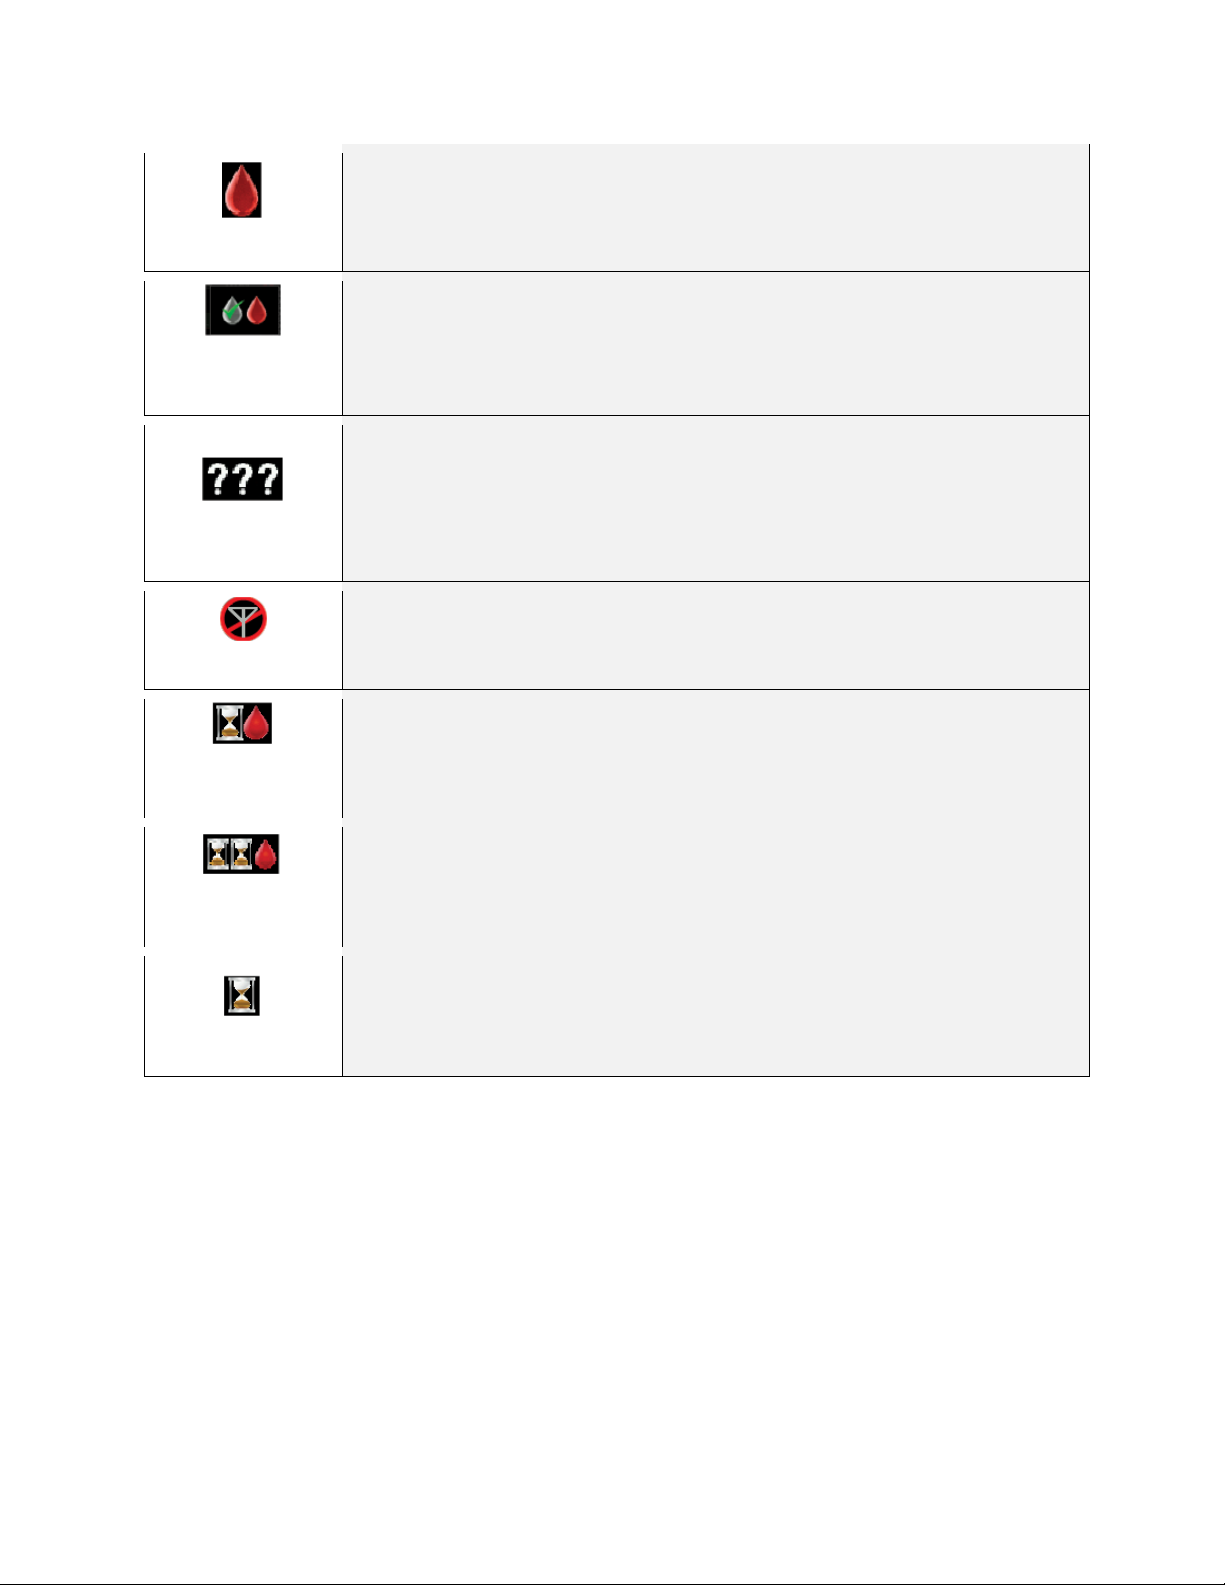
Calibration Needed
This symbol means you need to enter a calibration. This prompt will show when it is
time for your 12-hour calibration update or any other time an additional calibration is
needed (see Chapter 7, Section 7.2, How to Calibrate).
Additional
Calibration Needed
Glucose Reading
Error
Out of Range
Wait 15 Minutes
Calibration Error
Wait 1 Hour
Calibration Error
This symbol means you need to enter one more blood glucose value in order to
calibrate the system and start getting sensor glucose readings.
This symbol means the receiver does not understand the sensor signal but is likely
to recover. This symbol is related to the sensor only. You should wait for more
prompts and
Chapter 13, Section 13.4, System Glucose Error for more information).
This symbol means the receiver and sensor/transmitter are not communicating.
Make sure the receiver and sensor/transmitter are within 20 feet of each other
without obstruction (see Chapter 1, Section 1.4, Transmitter Overview).
This symbol means the sensor cannot calibrate right now. If you see this screen,
enter at least one more calibration blood glucose value after about 10-15 minutes. If
the sensor still cannot calibrate after that, the sensor needs to be removed and a
new sensor needs to be inserted.
This symbol means the sensor is not calibrating correctly. If you see this screen,
wait a minimum of one hour and then enter one more blood glucose value. If no
readings display on the receiver after this, the sensor needs to be removed and a
new sensor needs to be inserted.
do not enter
any blood glucose values when you see this symbol (see
This symbol means the receiver has detected a potential significant problem with
Wait
the sensor signal and may result in a sensor failure. You should wait about 30
minutes for more prompts. Do not enter any blood glucose values when you see this
symbol.
Status symbols show in the upper right of your trend graph.
49
Page 50
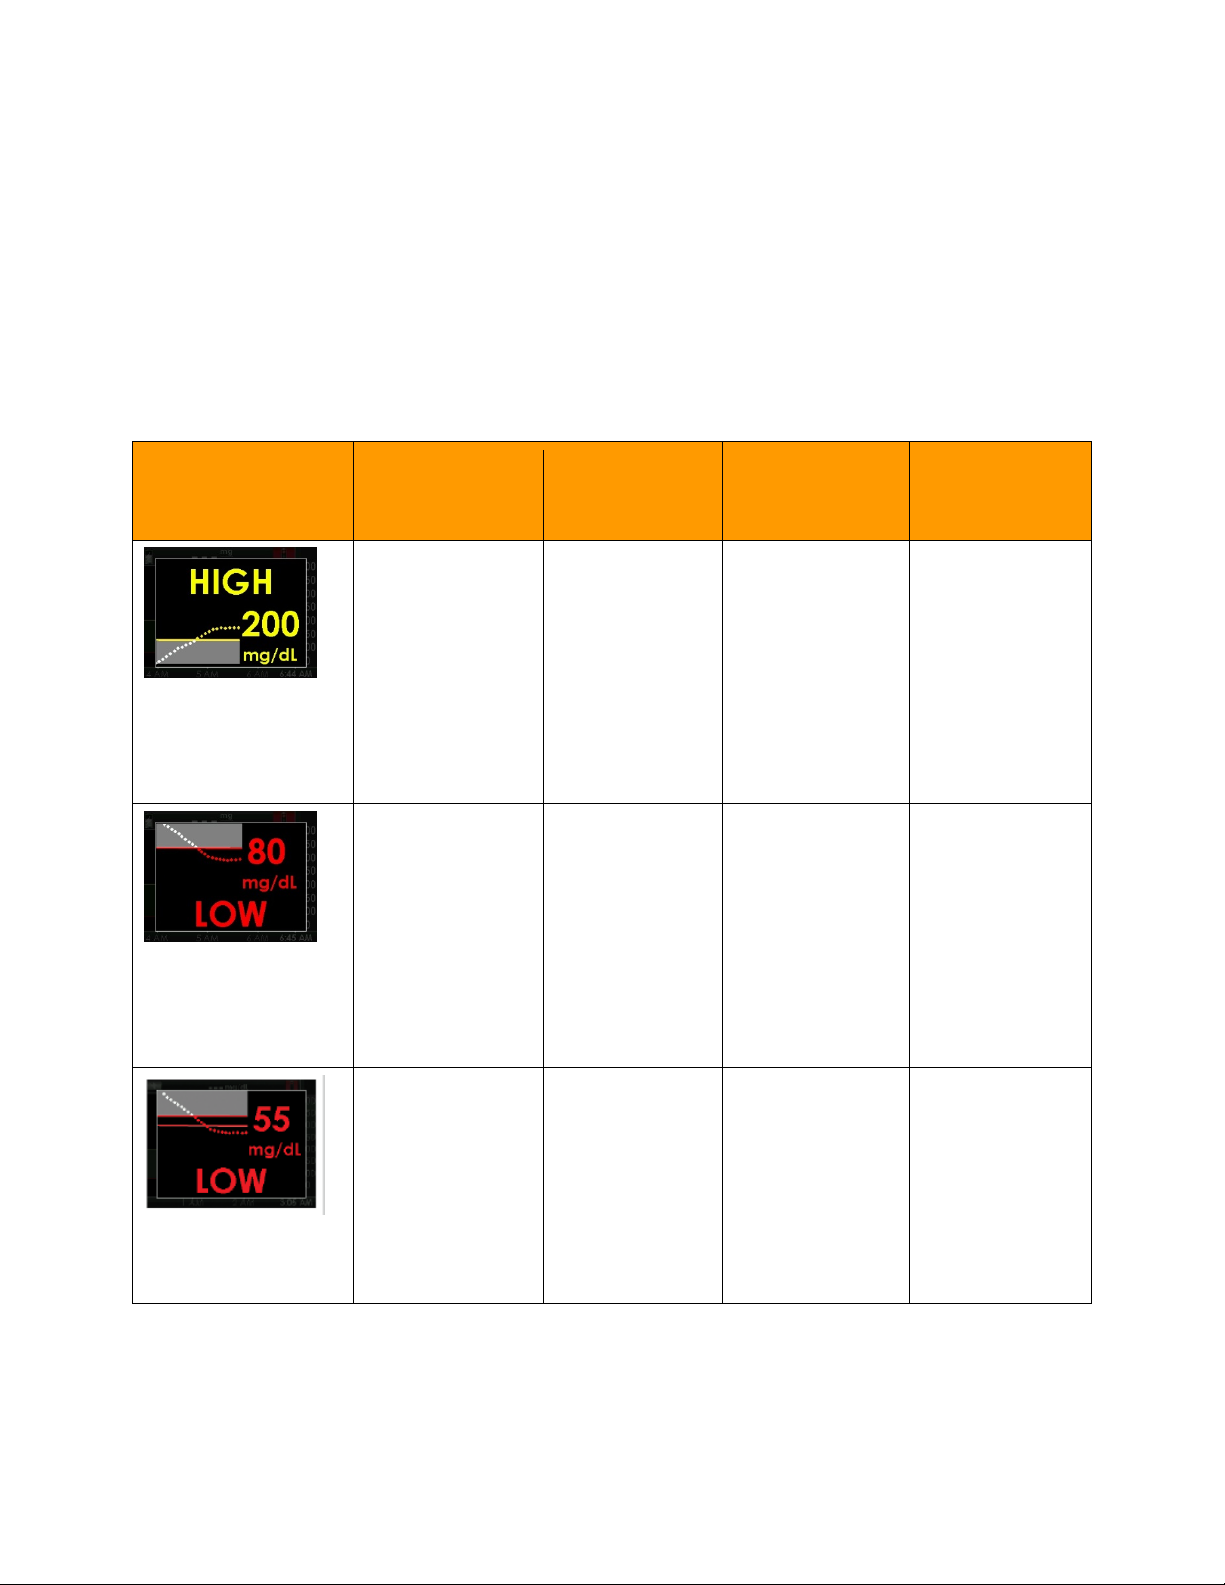
CHAPTER 9: ALERTS, ALARM & PROFILES
This chapter teaches you about your Dexcom G4 PLATINUM CGM System’s many alerts and alarm and
how to set them.
9.1 SETTING YOUR ALERTS
9.1.1 DEFAULT ALERT/ALARM SETTINGS
The following alerts and alarm are preset on your receiver.
Default Alert/Alarm Settings
What will I see on the
receiver screen?
What does this
mean?
High Glucose
Alert
Your most recent
sensor glucose
reading is at or
above the high
alert setting.
Low Glucose
Alert
Your most recent
sensor glucose
reading is at or
below the low alert
setting.
What is the
default setting?
On at
200 mg/dL
On at
80 mg/dL
How will the
receiver notify
me?
Vibrates two times
then
vibrates/beeps two
times every 5
minutes until
confirmed or your
glucose value
drops below the
alert level.
Vibrates three
times then
vibrates/beeps
three times every
5 minutes until
confirmed or your
glucose value
goes above the
alert level.
Will the receiver
re-notify me?
No, unless you
have turned on
the high alert
snooze feature.
No, unless you
have turned on
the low alert
snooze feature.
Low Glucose
Alarm
Your most recent
sensor glucose
reading is at or
below 55 mg/dL
On Vibrates 4 times,
then vibrates/beeps
4 times every five
minutes until
confirmed or your
glucose value
goes above 55
mg/dL.
Yes, every 30
minutes after
each confirmation
until your blood
glucose value
comes back into
range.
50
Page 51
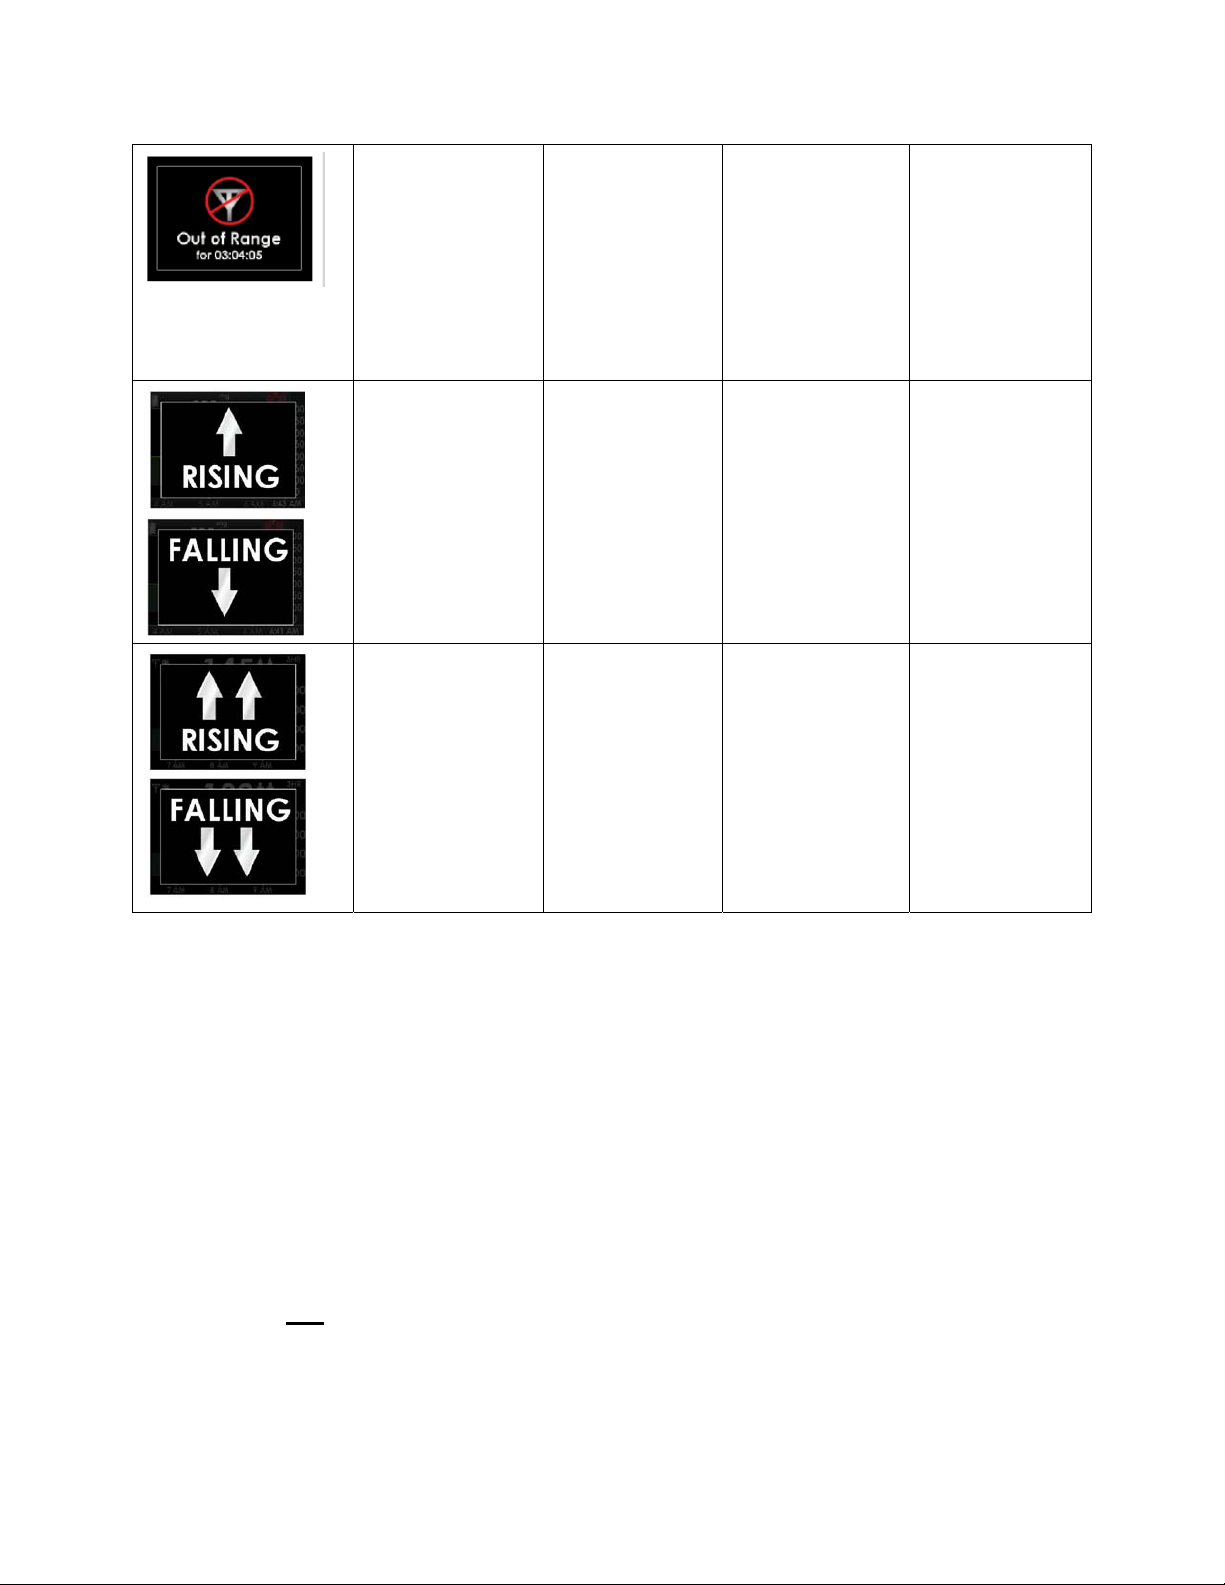
Out of Range
Alert
The
sensor/transmitter
and receiver are
not
communicating to
each other.
Off The alert will not
notify you. You
must change the
settings to receive
this alert.
No
Rise/Fall Alert
Single Arrow
Your glucose is
rising/falling at or
above a rate of
2 mg/dL/min (at
least 30 mg/dL in
15 minutes).
Off The alert will not
notify you. You
must change the
settings to receive
this alert.
No
Rise/Fall Alert
Double Arrow
Your glucose is
rising/falling at or
above a rate of
3 mg/dL/min (at
least 45 mg/dL in
15 minutes).
This table describes the receiver alerts and alarm and explains how the receiver will notify you in the default
setting.
Your receiver may alert you at other times you need to take action, such as low battery, failed sensor, etc.
See Chapter 18, Appendix I, for a detailed list of these other alerts.
Off The alert will not
notify you. You
must change the
settings to receive
this alert.
No
9.1.2 GLUCOSE ALERTS AND ALARM
The Dexcom G4 PLATINUM System lets you create personal settings for how you want the receiver to tell
you what is going on. The low and high glucose alerts tell you when your sensor glucose readings are
outside your target glucose range. Rise and fall (rate of change) alerts let you know when your glucose
levels are changing fast (see Chapter 9, Section 9.2, Advanced Alerts). The Dexcom G4 PLATINUM
System also has a 55 mg/dL low glucose alarm that cannot be changed or turned off. This safety feature
tells you your glucose level may be dangerously low. You can set high and low glucose alerts to vibrate and
beep. This feature can help during sleeping, driving, exercising or during meetings.
When you have both your high and low alerts turned on, a gray zone on your trend graph shows your target
range.
9.1.2.1 HIGH GLUCOSE ALERT
51
Page 52
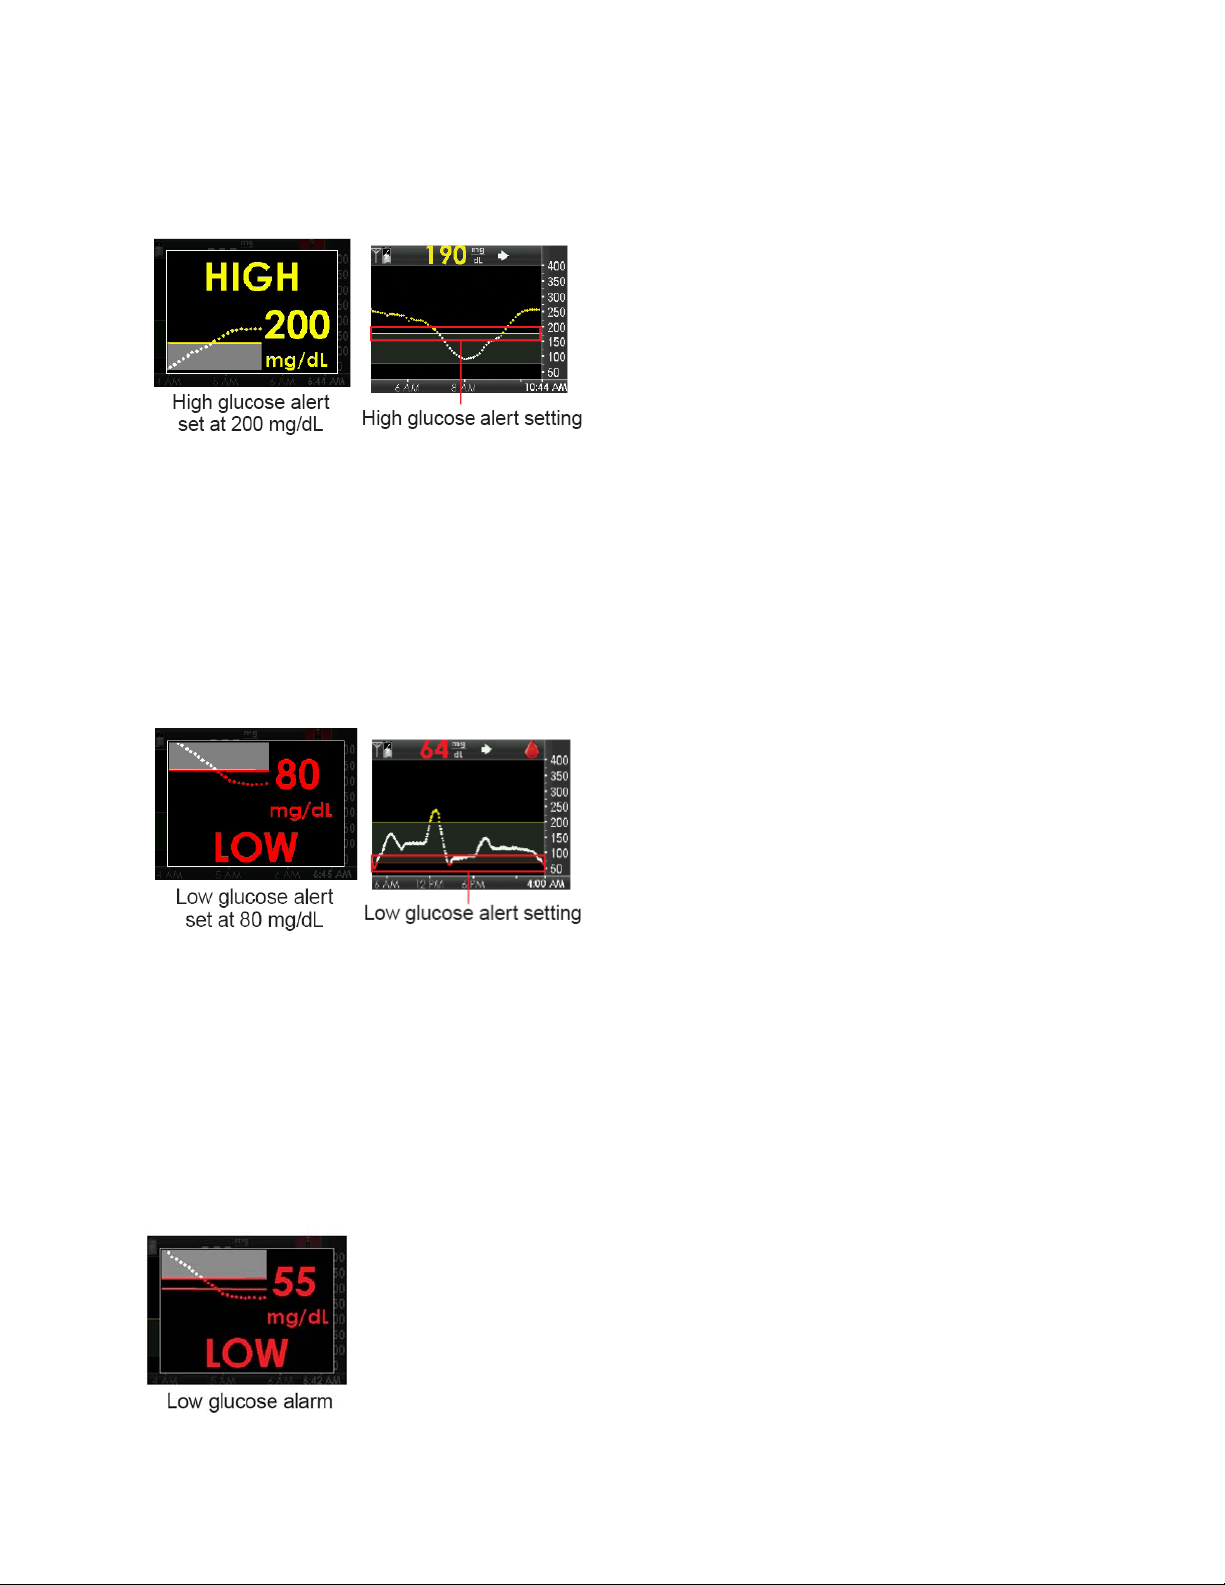
When your sensor glucose readings are at or above your high alert level, this screen shows your high
glucose alert level. Your receiver vibrates and/or beeps depending on your profile setting (see Chapter 9,
Section 9.3, Alert Profiles). This level shows as a yellow line on the trend graph.
The receiver continues to alert until you press the
glucose readings drop below your high glucose alert level. You can have the receiver re-alert after
clearing the alert (to change your snooze settings see Chapter 9, Section 9.2, Advanced Alerts).
SELECT
button to clear the alert or until your sensor
9.1.2.2 LOW GLUCOSE ALERT
When your sensor glucose readings are at or below your low alert level, this screen shows your low glucose
alert level. Your receiver vibrates and/or beeps depending on your profile setting. This level shows as a red
line on the trend graph.
The receiver continues to alert until you press the
glucose readings rise above your low glucose alert level. You can have the receiver re-alert after clearing
the alert (to change your snooze settings see Chapter 9, Section 9.2, Advanced Alerts).
SELECT
button to clear the alert or until your sensor
9.1.2.3 LOW GLUCOSE ALARM
The Dexcom G4 PLATINUM System also has a fixed low alarm at 55 mg/dL. This is different than your low
glucose alert. You cannot change or turn off this alarm or its re-alarm settings.
• The receiver displays the low glucose alarm screen.
52
Page 53
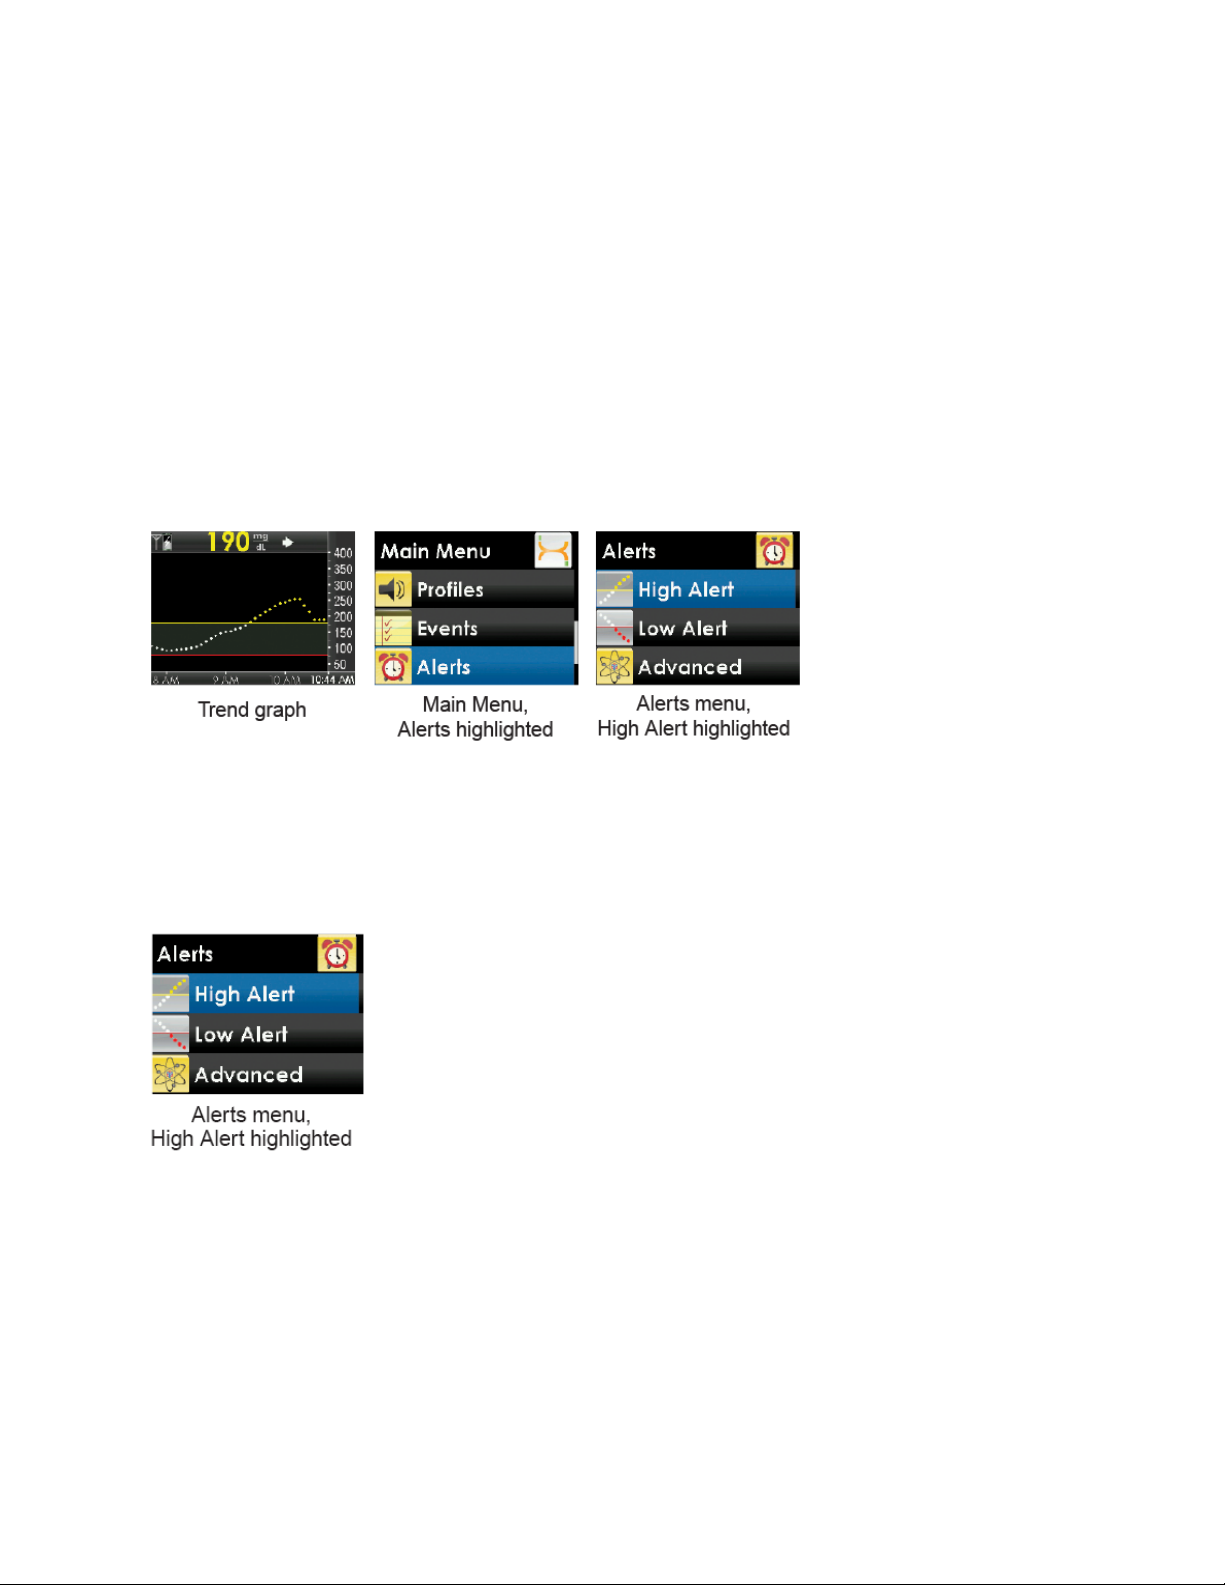
• Re-alarm: The receiver automatically alerts again 30 minutes after you press the
it, if your sensor glucose readings are still at or below 55 mg/dL.
• Your receiver does not alert if you have a sensor glucose reading outside your target range and you
calibrated in the last 5 minutes.
• The receiver alerts if your sensor glucose reading stays outside your target range after five minutes.
SELECT
button to clear
9.1.3 GETTING TO THE ALERTS MENU
1. Press the
2. Press the
3. From the Main Menu, press the UP or
The Alerts menu shows.
SELECT
SELECT
button to turn on the receiver. The 3-hour trend graph shows.
button to see the Main Menu.
DOWN
button to scroll to “Alerts,” and press the
9.1.4 HIGH AND LOW GLUCOSE ALERTS
The steps for setting both the high alert and the low alert are the same.
The following steps show you how to change your high and low alert settings.
1. From the Alerts menu, press the UP or
SELECT
button.
DOWN
button to select “High Alert” or “Low Alert” and press the
SELECT
button.
2. Highlight “On/Off,” and then press the
current setting.
SELECT
button to set this option. A check mark shows next to the
53
Page 54
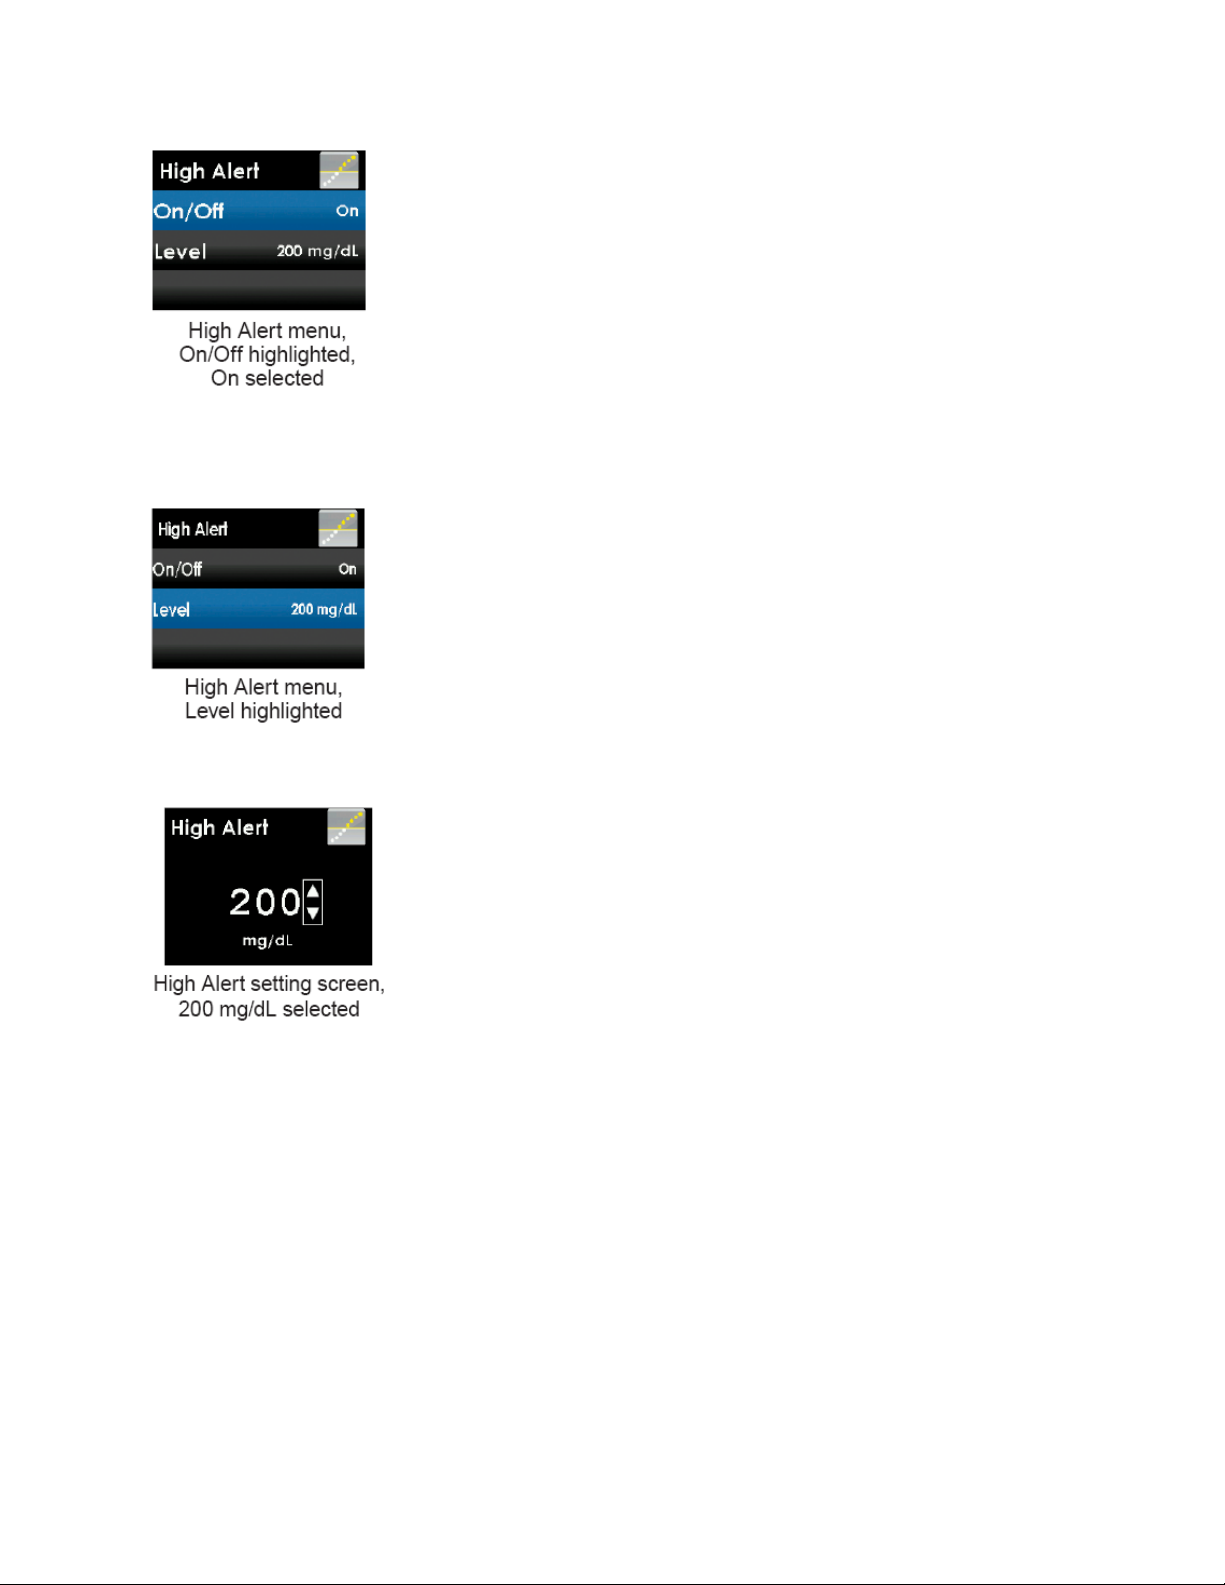
3. Press the
4. Press the
level.
5. To change this number, press the
your high glucose alert level.
button to return to the last screen.
LEFT
DOWN
button to highlight “Level.” The number that shows is your current high glucose alert
SELECT
button, and then press the
UP
or
DOWN
button to select
• Your high glucose alert value can be set between 120 and 400 mg/dL in 10 mg/dL steps.
• Your low glucose alert value can be set between 60 and 100 mg/dL in 5 mg/dL steps.
6. Press the
7. Press the
SELECT
LEFT
button to confirm your alert level.
button to return to the Alerts menu when you finish.
9.2 ADVANCED ALERTS
Advanced alerts include the high and low snooze, rise and fall rate, and out of range alerts. All advanced
alerts follow the following steps.
1. Press the
2. Press the
3. Press the UP or
SELECT
SELECT
button to turn on the receiver.
button to enter the Main Menu.
DOWN
button to highlight “Alerts,” and press the
54
SELECT
button.
Page 55
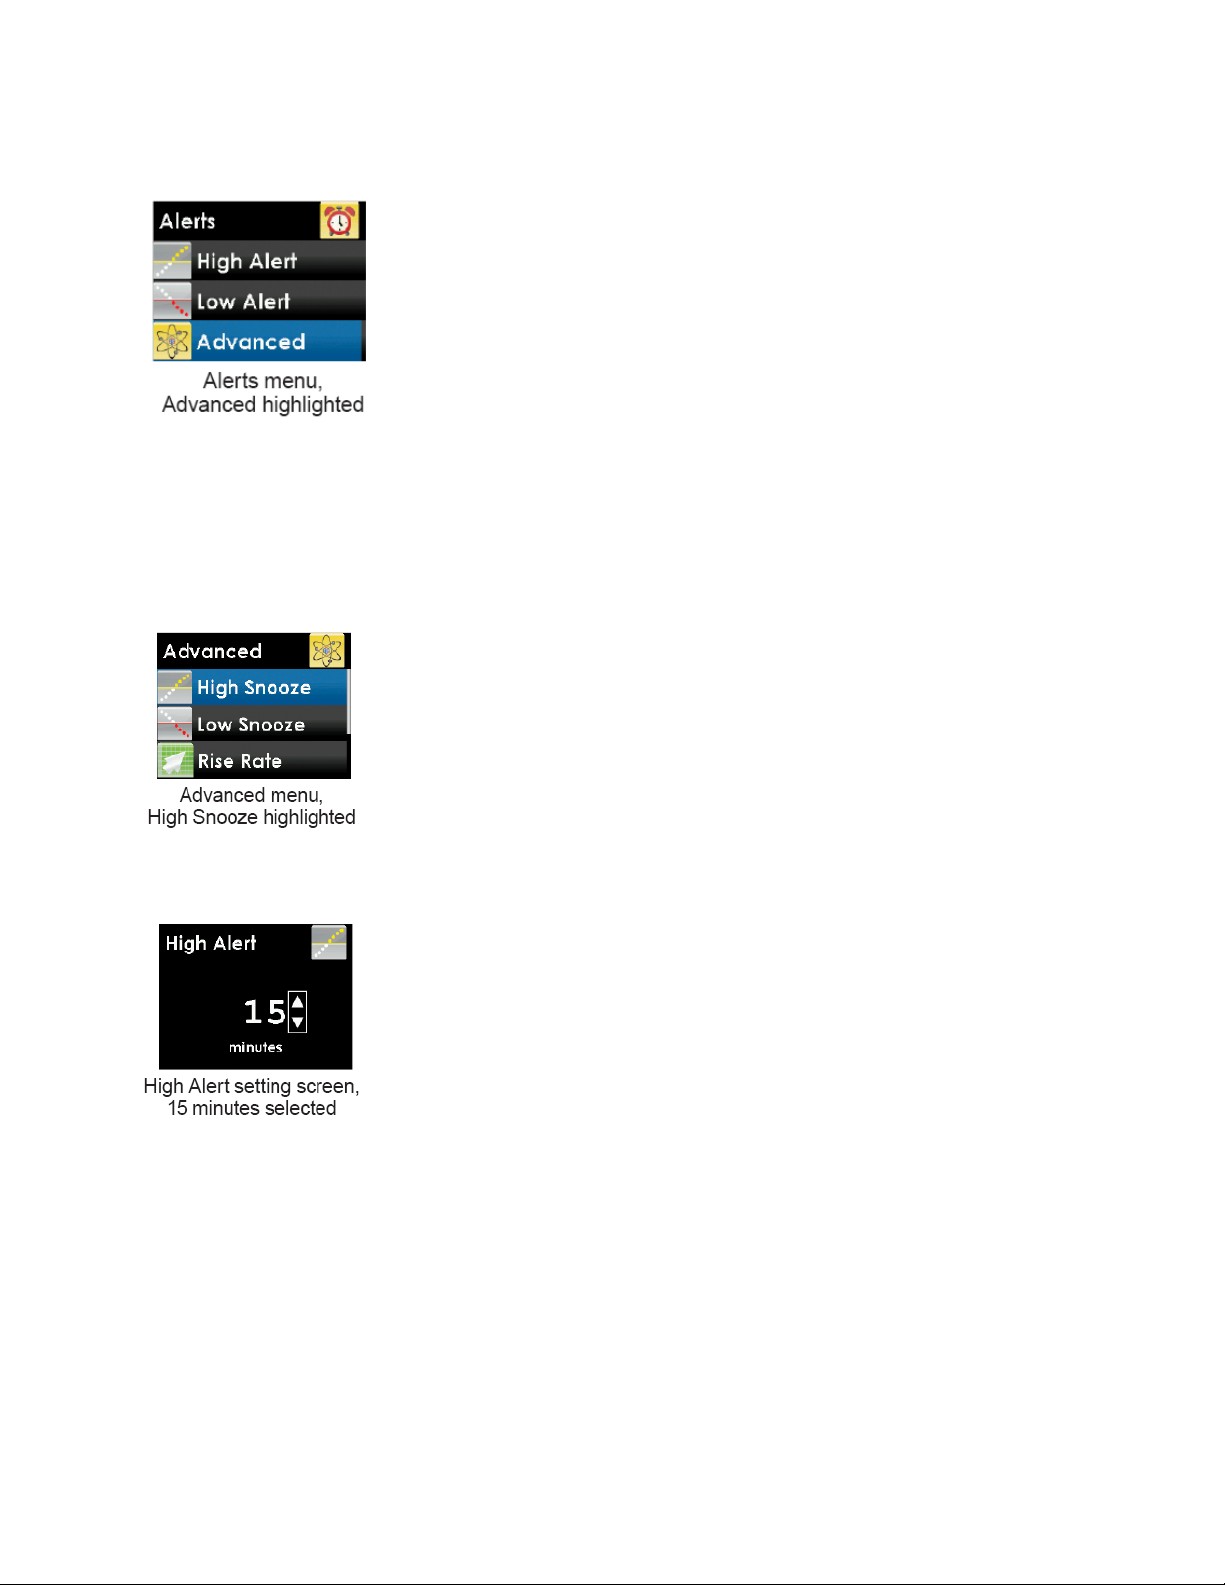
4. From the Alerts menu, press the UP or
button.
DOWN
button to select “Advanced,” and press the
SELECT
9.2.1 SETTING A SNOOZE TIME FOR YOUR HIGH AND LOW GLUCOSE
ALERTS
The snooze feature lets you delay your high and low glucose re-alerts. You have the option to set a snooze
time for every 15 minutes for up to 5 hours.
1. Press the UP or
button.
DOWN
button to highlight “High Snooze” or “Low Snooze” and press the
SELECT
2. Press the UP or
and re-alerts. Press the
• If you set the amount of time to zero there will be no re-alerts
3. Press the
DOWN
button to return to the Alerts menu when you finish.
LEFT
button to select the amount of time (in 15 minute steps) between the first alert
SELECT
button.
.
9.2.2 RISE AND FALL GLUCOSE RATE ALERTS
Rate alerts tell you when your glucose levels are rising (rise alert) or falling (fall alert) and by how much. You
can choose for your receiver to alert when your sensor glucose reading is rising or falling 2 mg/dL or more
per minute, or 3 mg/dL or more per minute.
If you set your fall rate to 2 mg/dL per minute and your sensor glucose readings fall at this rate or faster, the
“FALLING single arrow” screen shows, and the receiver vibrates or beeps in line with your profile settings.
55
Page 56
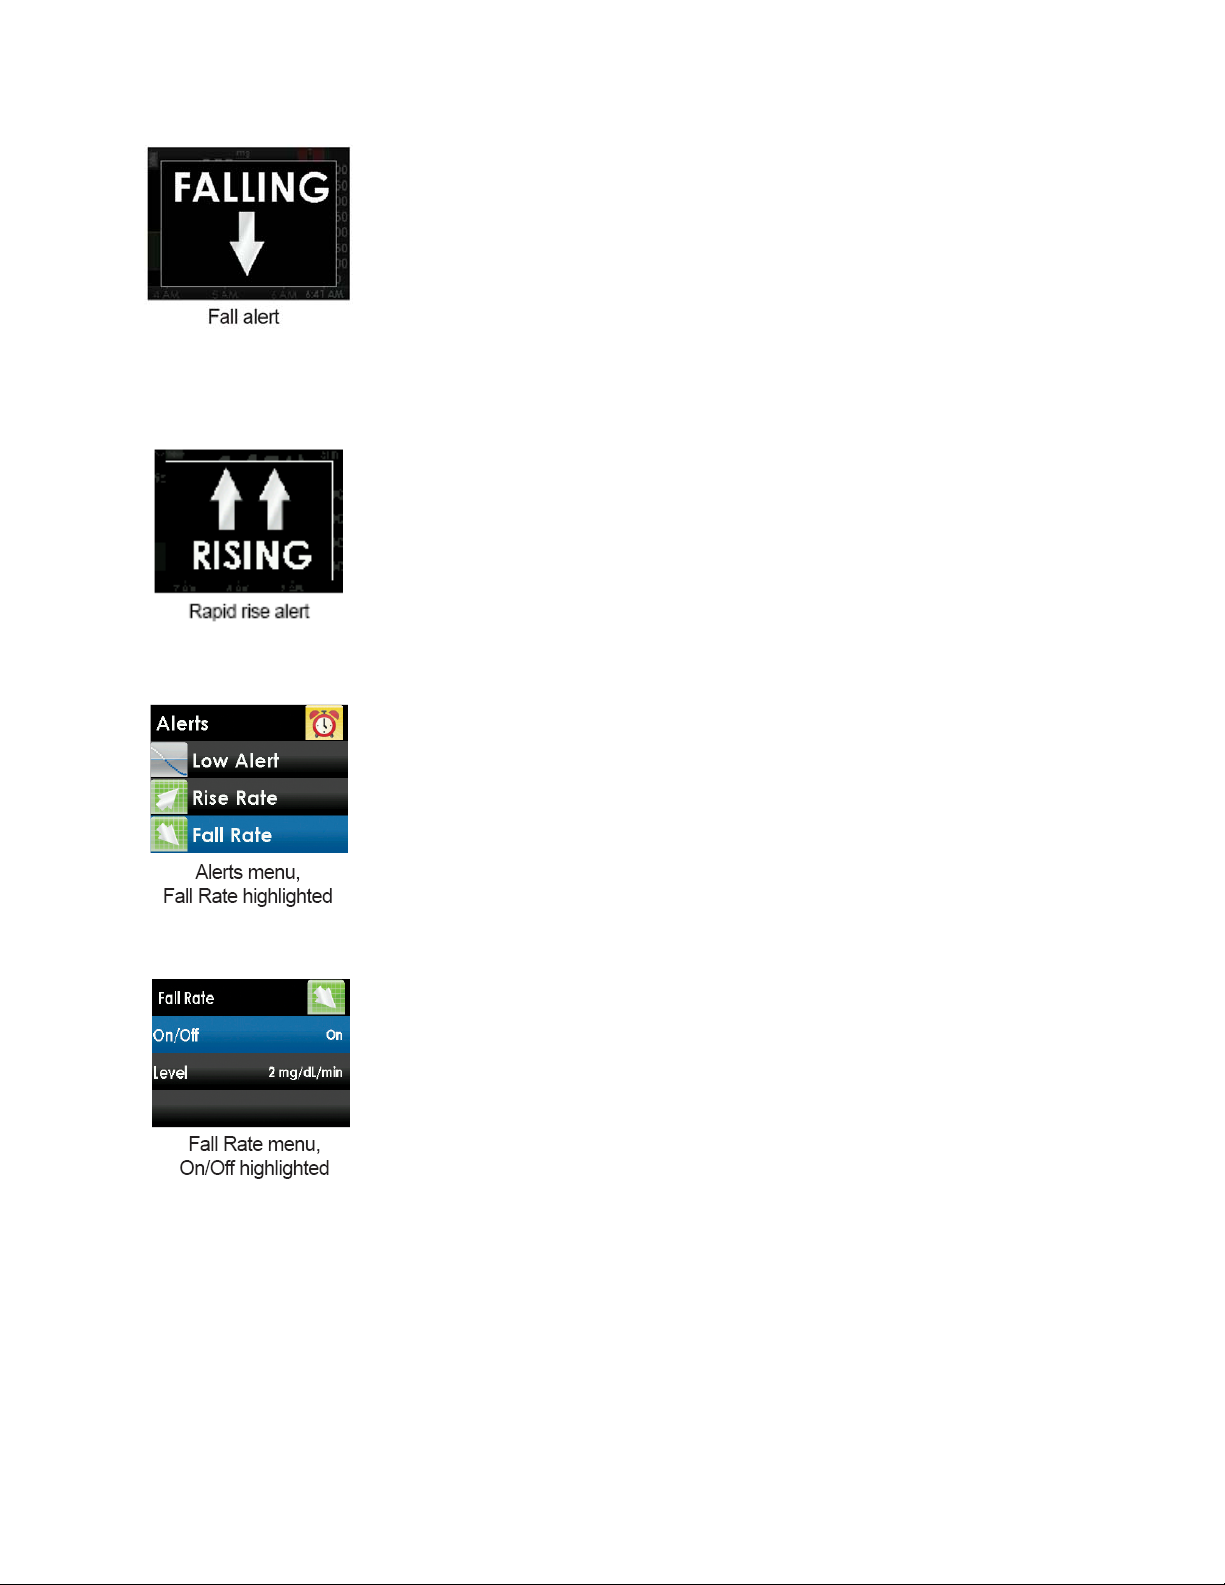
If you set your rise rate to 3 mg/dL per minute and your sensor glucose readings rise at this rate or faster,
the “RISING double arrow” screen shows, and the receiver vibrates or beeps in line with your profile
settings.
These steps show how to change your rise or fall rate alert settings.
1. Press the UP or
2. Highlight “On/Off” and then press the
3. Press the UP or
“Off.”
DOWN
DOWN
button to choose “Rise Rate” or “Fall Rate,” and press the
button to choose “On” or “Off.” Then, press the
SELECT
button.
SELECT
SELECT
button to select “On” or
button.
56
Page 57
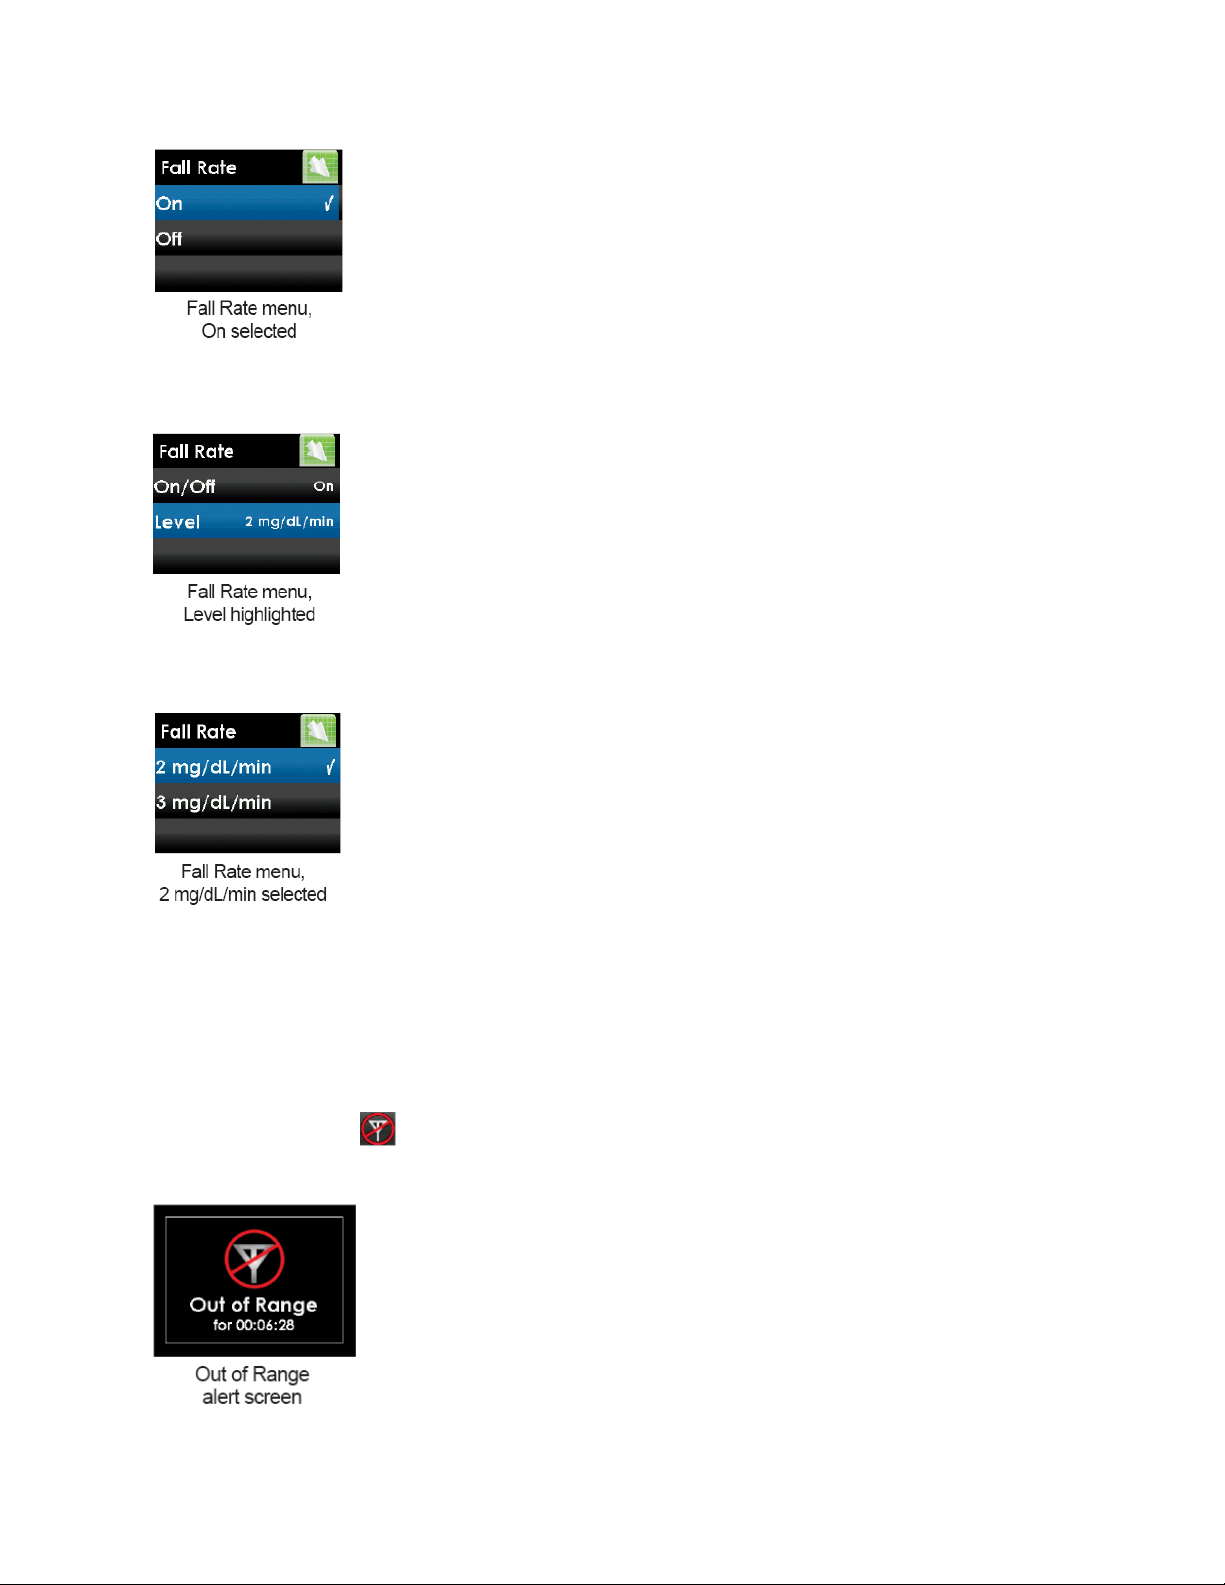
4. Press the
button.
5. Choose “2 mg/dL/min” (2 mg/dL or more per minute) or “3 mg/dL/min” (3 mg/dL or more per minute).
Press the
SELECT
button to go back to the last screen. Highlight “Level” and then press the
LEFT
button.
SELECT
6. Press the
button to return to the Alerts menu when you finish.
LEFT
9.2.3 SETTING THE OUT OF RANGE ALERT
The out of range alert lets you know when the transmitter and receiver are not communicating with each
other. Keep the transmitter and receiver within 20 feet of each other without obstruction. When the
transmitter and receiver are too far apart, you will not get sensor glucose readings.
The out of range symbol in the upper right corner of the trend graph and the Out of Range alert screen
show when the transmitter and receiver are not communicating. The amount of time Out of Range shows on
the out of range alert screen. It will continue to re-alert until they are back in range.
57
Page 58
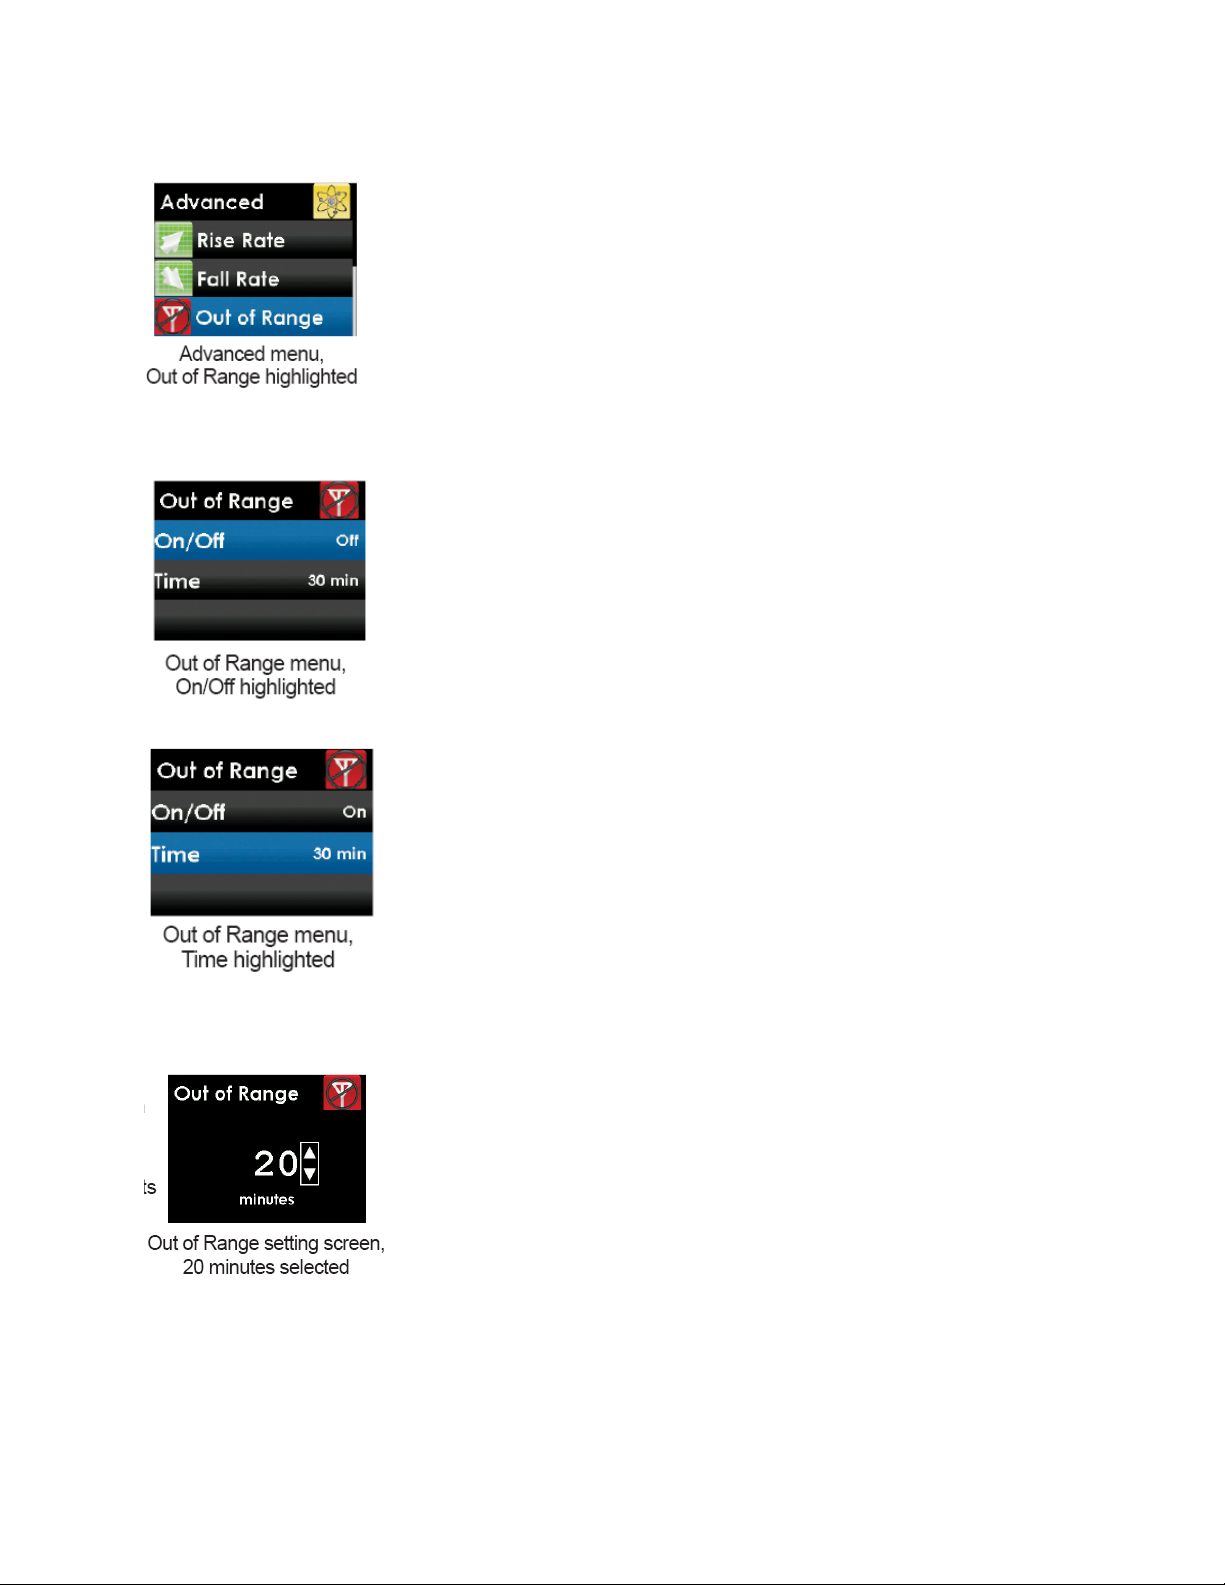
1. Press the UP or
DOWN
button to choose “Out of Range,” and press the
SELECT
button.
2. Press the UP or
you do not want to get out of range alerts press the
3. Press the UP or
DOWN
DOWN
button to choose “On/Off.” Then, press the
button to choose “Time,” and press the
SELECT
SELECT
button again to choose “Off.”
SELECT
button to select “On.” If
button.
4. Press the UP or
alert. Press the
5. Press the
SELECT
LEFT
DOWN
button to return to the Alerts menu when you finish.
button to choose the amount of time out of range after which the receiver will
button.
9.3 ALERT PROFILES
58
Page 59
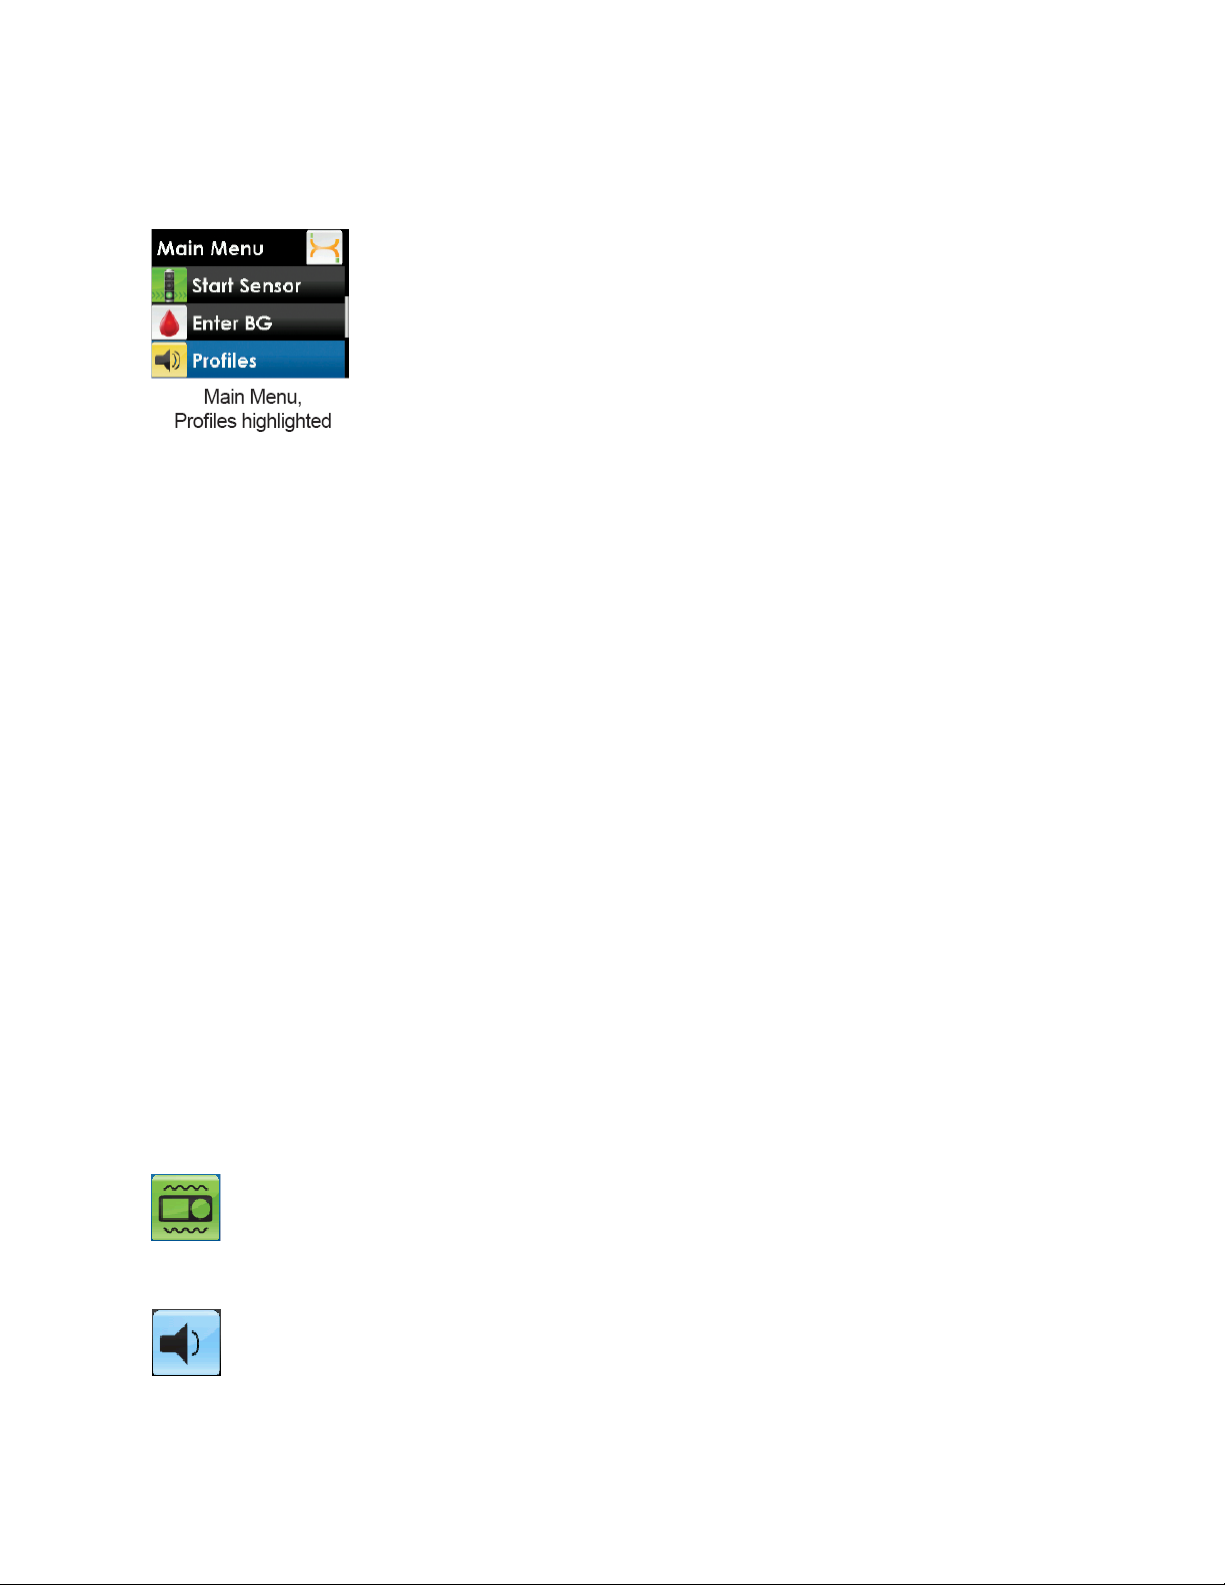
The Dexcom G4 PLATINUM System lets you set profiles to choose the way you want your alerts to act. This
feature is found under the Profiles option on the Main Menu. You can set your profile to the sound pattern
and volume that fits your needs.
Your profile options are:
1. Vibrate
2. Soft
3. Normal
4. Attentive
5. HypoRepeat
For each profile option, the first alert is vibration only.
Regardless of which alert profile you chose, if you confirm the first vibrate alert, you will not get a sound
alert.
When you choose your profile setting this setting applies to all alerts, alarm and prompts.
Within each profile setting, each alert has its own unique sound pattern, tone and volume level. This lets you
to easily identify each alert and alarm and its meaning.
The fixed low alarm at 55 mg/dL cannot be turned off or adjusted.
The soft, normal, attentive and HypoRepeat profiles have the following alert sequence:
• The first alert is vibrate only.
• If the alert is not confirmed in five minutes, the system vibrates and beeps.
• If the alert is not confirmed in five more minutes, the system vibrates and beeps louder. This continues
at the same volume every five minutes until confirmed.
For the HypoRepeat profile only:
• If the alert is confirmed and your sensor glucose readings continue to be at or below 55 mg/dL your
system repeats the alert sequence in 30 minutes.
Press the
SELECT
button to confirm any alert.
9.3.1 ALERT PROFILE OPTIONS
Vibrate profile: when you want to silence the receiver and be alerted by vibration. The only
exception to this is the fixed low alarm at 55 mg/dL, which alerts you as a vibration first, followed by beeps 5
minutes later if not confirmed.
Soft profile: when you need your alert to be less noticeable. This profile sets all the alerts and
alarm to lower volume beeps.
59
Page 60
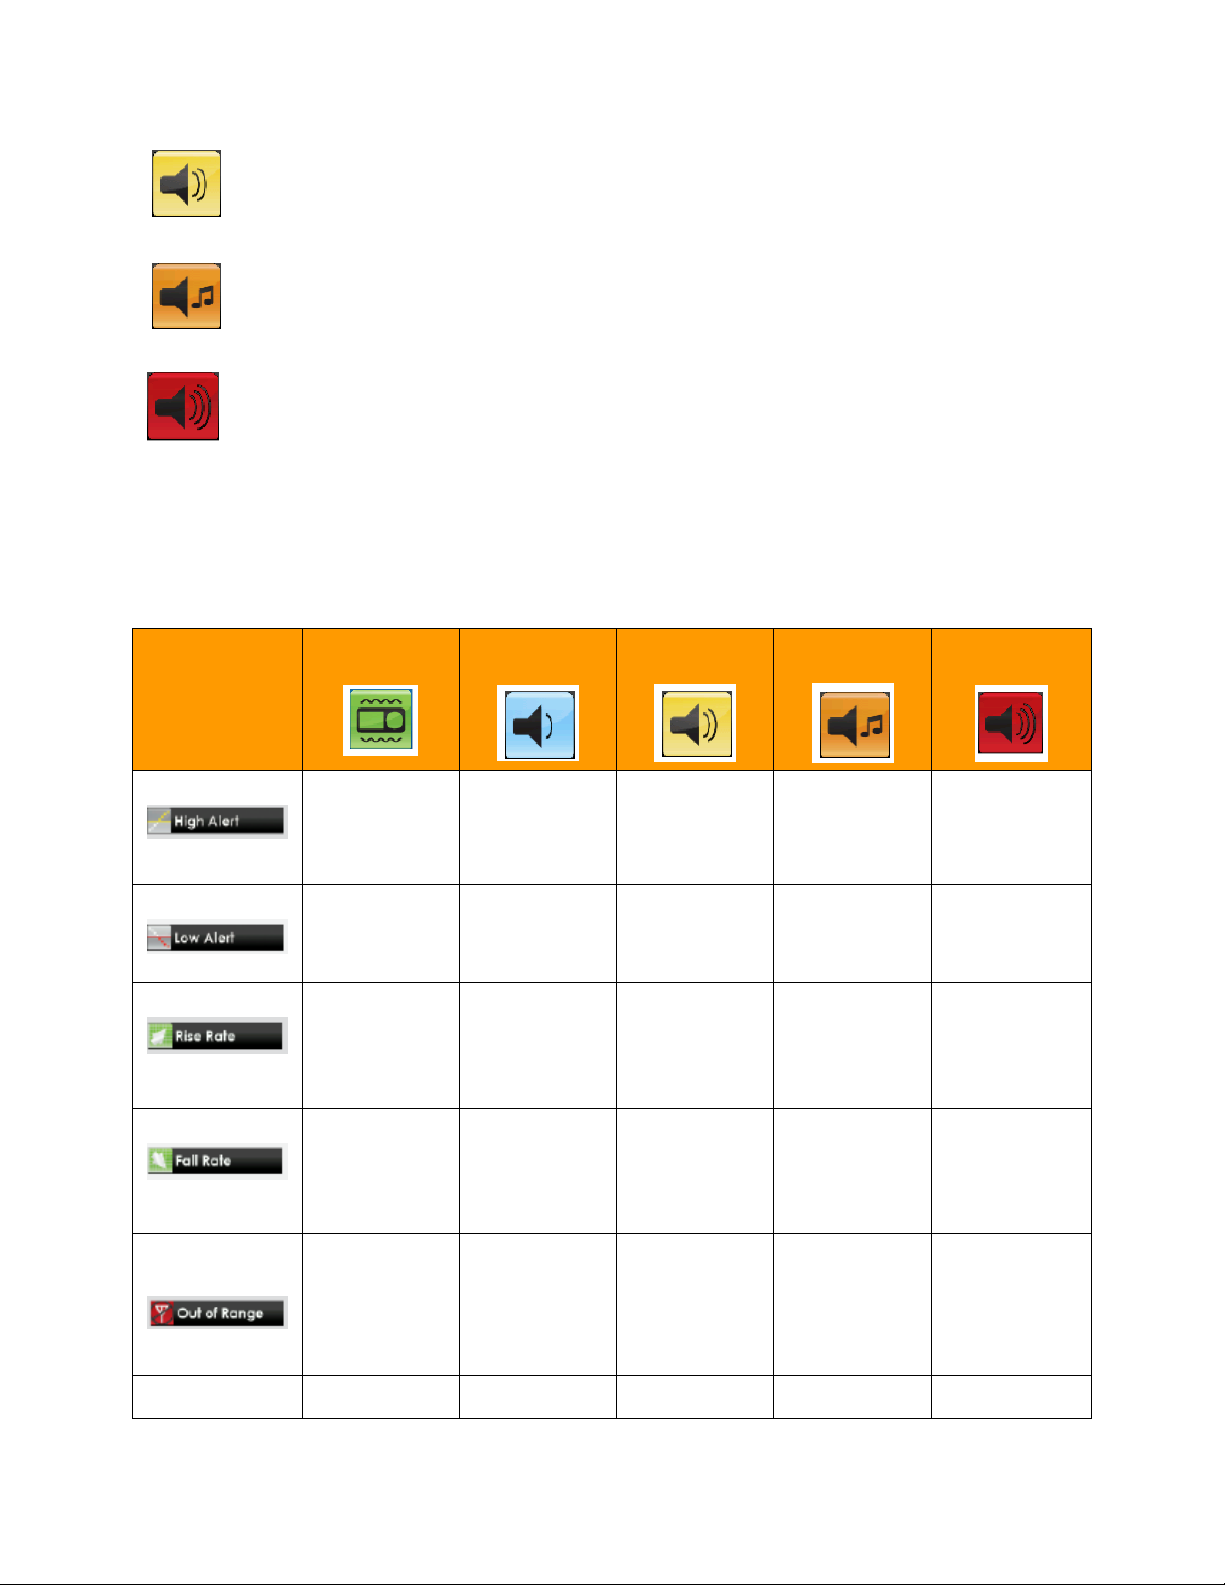
Normal profile: the default profile when you receive your system. This profile sets all alerts and
alarms to higher volume beeps.
Attentive profile: when you need your alert to be the most noticeable. This profile sets all the alerts
and alarm to loud and highly distinctive melodies.
“HypoRepeat” profile: very similar to the normal profile, but it continuously repeats the fixed low
alarm every 5 seconds until your sensor glucose reading rises above 55 mg/dL or is confirmed. This profile
can be helpful if you want extra alerts for severe low sensor glucose readings.
The “Try It” feature is found under the Profiles menu and lets you to hear an example of each alert and
alarm.
9.3.2 ALERT PROFILE DETAILS
PROFILE TYPE
High Alert
Low Alert
Rise Alert
Fall Alert
VIBRATE
SOFT
2 long vibrates 2 long vibrates
3 short vibrates 3 short vibrates
2 long vibrates 2 long vibrates
3 short vibrates 3 short vibrates
+ 2 low beeps
+ 3 low beeps
+ 2 low beeps
+ 3 low beeps
NORMAL
2 long vibrates
+ 2 medium
beeps
3 short vibrates
+ 3 medium
beeps
2 long vibrates
+ 2 medium
beeps
3 short vibrates
+ 3 medium
beeps
ATTENTIVE
2 long vibrates
+ ascending
melody
3 short vibrates
+ descending
melody
2 long vibrates
+ 1 short
ascending
melody
3 short vibrates
+ 2 short
descending
melodies
HYPOREPEAT
2 long vibrates
+ 2 medium
beeps
3 short vibrates
+ 3 medium
beeps
2 long vibrates
+ 2 medium
beeps
3 short
vibrates + 3
medium beeps
Out of Range
Alert
Fixed Low
1 long vibrate
4 short 4 short 4 short vibrates 4 short vibrates 4 short vibrates
1 long vibrate
+ 1 low beep
1 long vibrate
+ 1 medium
beep
1 long vibrate +
3 short
repeating
melodies
1 long vibrate +
1 medium beep
60
Page 61
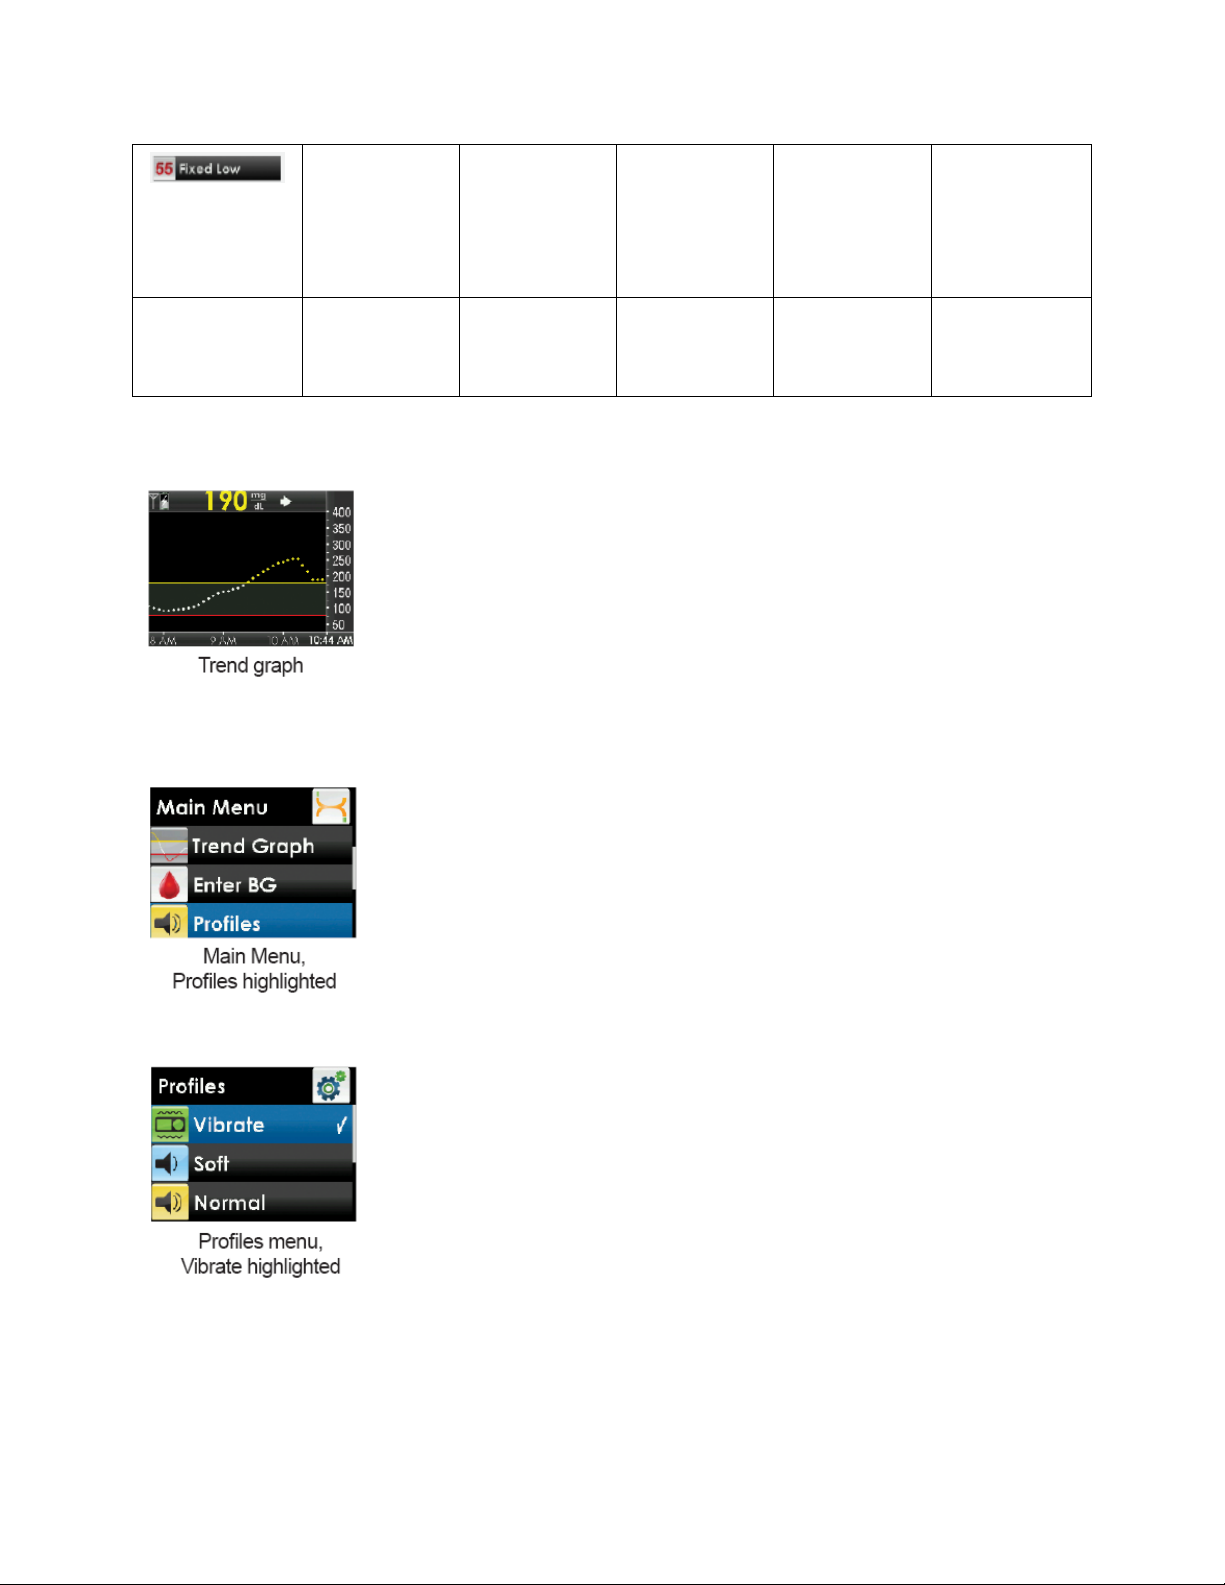
vibrates
+ 4 medium
tone beeps
vibrates + 4
medium tone
beeps
+ 4 medium
tone beeps
+ 2 long
descending
melodies +
pause + 4 low
beeps
+ 4 low beeps
+ pause +
repeat
sequence
All Other Alerts
These steps show you how to select the profile you want.
1. Press the
2. Press the
3. Press the UP or
show.
SELECT
SELECT
1 long vibrate
button to turn on the receiver. The 3-hour trend graph will show.
button to see the Main Menu.
DOWN
button to scroll to “Profiles,” and press the
1 long vibrate
+ 1 low beep
1 long vibrate
+ 1 medium
beep
SELECT
1 long vibrate +
1 short melody
button. The Profiles menu will
1 long vibrate +
1 medium beep
4. Press the UP or
5. Press the
LEFT
DOWN
button to return to the
button to scroll to the profile you want to set, and press the
Main Menu
when you finish.
61
SELECT
button.
Page 62
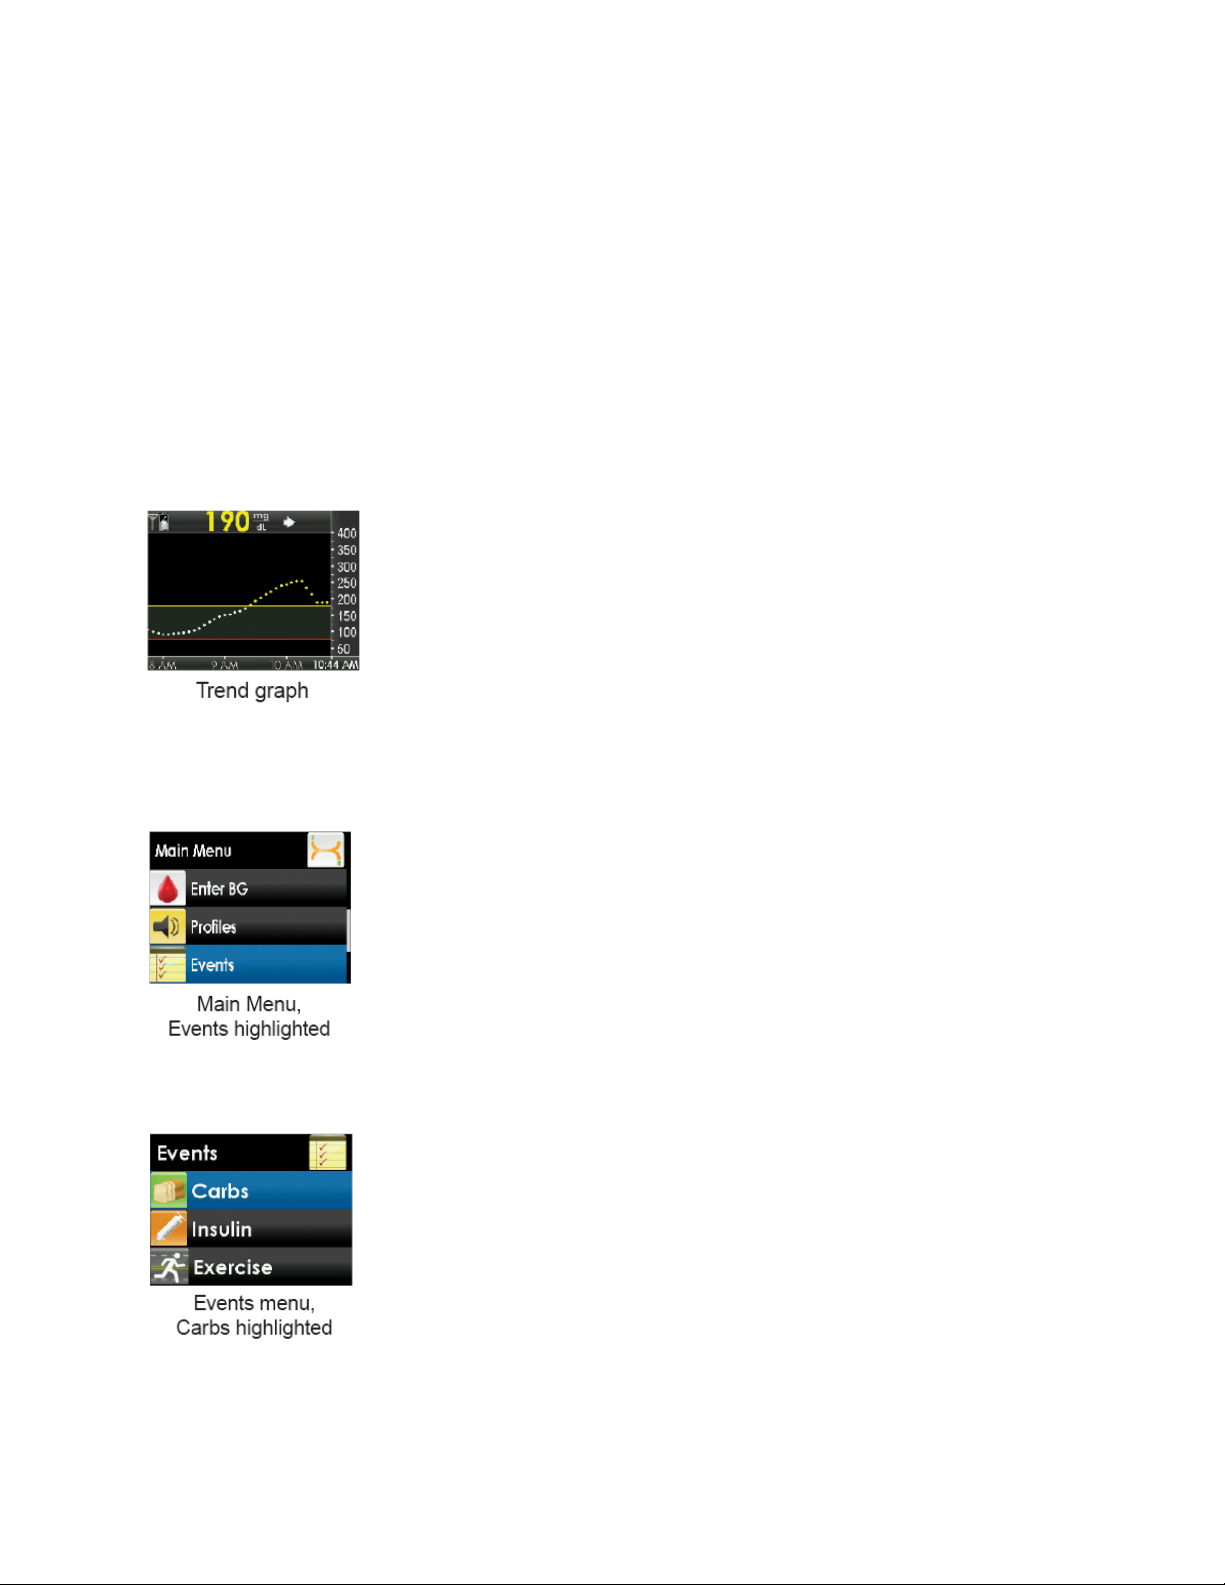
CHAPTER 10: EVENTS
The Events feature lets you record information that may help you and your healthcare professionals better
understand your glucose patterns and trends. You can enter details about carbohydrates, insulin, exercise,
and health issues. You can view these events with your trends and patterns using the Dexcom Studio
software.
10.1 EVENTS
Event markers can be downloaded and viewed in the Dexcom Studio software but cannot be viewed on
your receiver.
10.1.1 SELECTING AN EVENT
1. Press the
2. Press the
3. Press the UP or
show.
SELECT
SELEC
button to turn on the receiver. The 3-hour trend graph will show.
T button to see the Main Menu.
DOWN
button to scroll to “Events,” and press the
SELECT
button. The Events menu will
4. Press the UP or
Press the
SELECT
DOWN
button.
button to choose the event you want: “Carbs,” “Insulin,” “Exercise” or “Health.”
10.1.2 SETTING THE DATE AND TIME FOR AN EVENT
62
Page 63
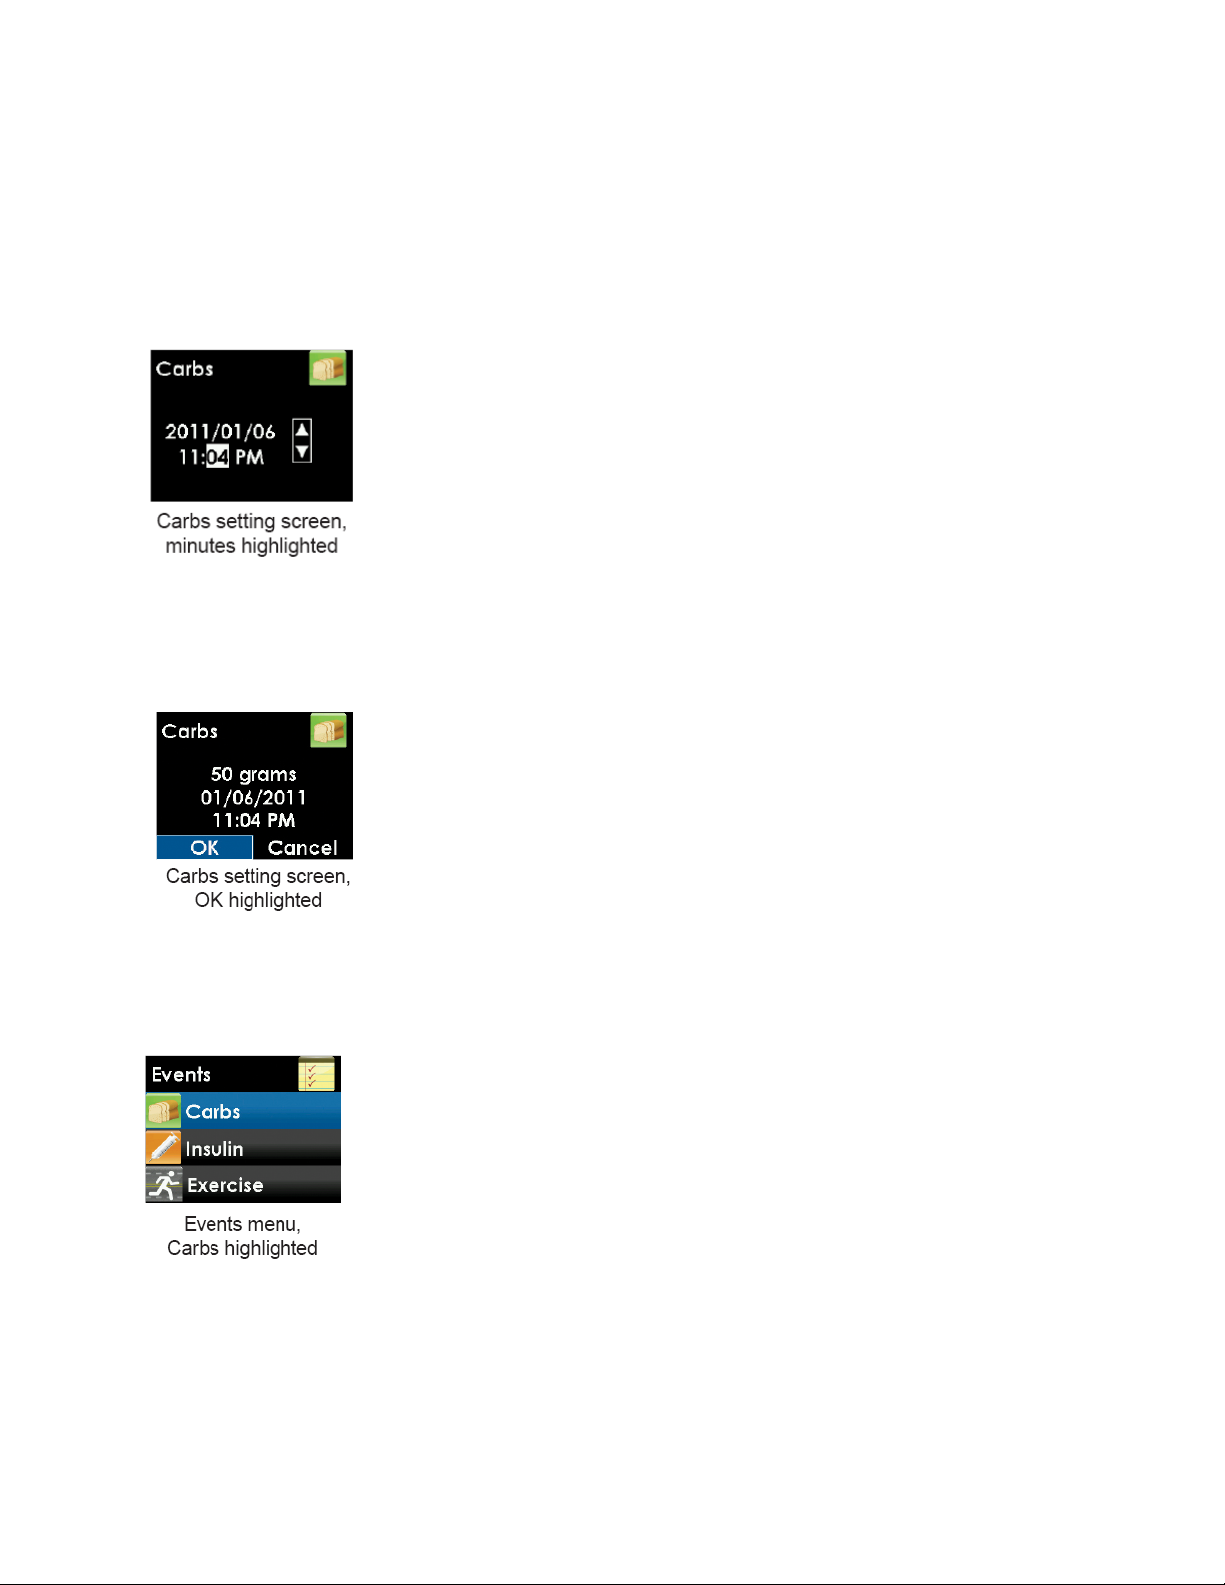
When you enter an event, you must check that the date and time for that event are correct. The default is
the current date and time stored in the receiver. The date format is YYYY/MM/DD.
If you change the date or time for any event, it only applies to that event and will not change the current date
and time in your receiver.
To change the date and time for an event:
1. Press the
2. Press the UP or
next value.
3. Press the
4. Press the
RIGHT
SELECT
SELECT
button to highlight each value in the date and time.
DOWN
button to make any changes, and then press the
button after choosing AM or PM.
button to confirm the entry.
RIGHT
button to move to the
10.1.3 CARBOHYDRATES
The Carbs event lets you enter the amount of carbohydrates you have taken, up to 250 grams.
1. From the Events menu press the UP or
2. Press the UP or
• The number that shows on this screen is the last number you entered or the default amount of 50
grams.
DOWN
button to enter your carb amount (0-250 grams), and press the
DOWN
button to choose “Carbs,” and press the
63
SELECT
SELECT
button.
button.
Page 64
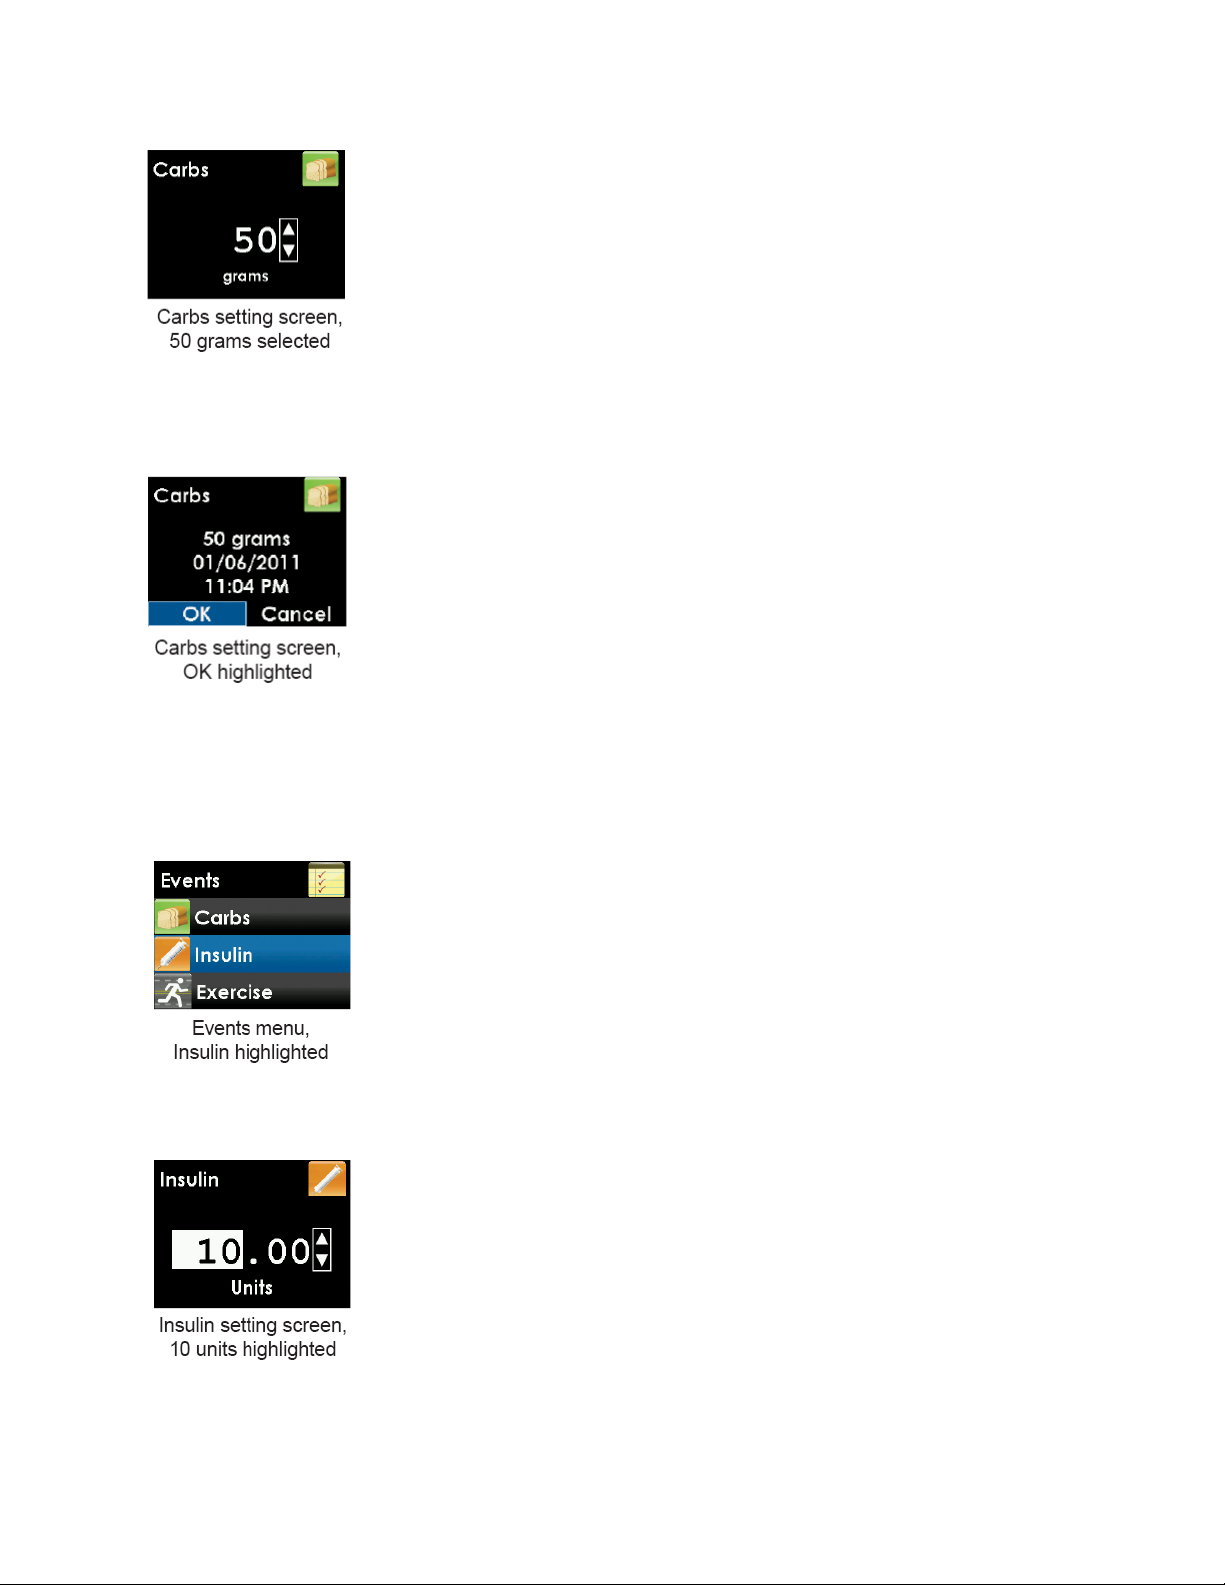
3. Check that the date and time for this entry are correct. Press the
4. Press the
then press the
LEFT
SELECT
or
RIGHT
button to choose either “OK” to confirm or “Cancel” to discard this entry, and
button. You will return to the Events menu.
SELECT
button to confirm.
10.1.4 INSULIN
The Insulin event lets you enter the amount of insulin you have taken, up to 250 units. You can only enter an
insulin amount, not the type of insulin.
1. From the Events menu press the UP or
DOWN
button to choose “Insulin,” and press the
SELECT
button.
2. Press the
• The number that shows on this screen is the last number you entered or the default amount of 10 units.
3. Check that the date and time for this entry are correct. Press the
UP
or
DOWN
button to enter your insulin amount (0-250 units), and press the
SELECT
button to confirm.
SELECT
button.
64
Page 65
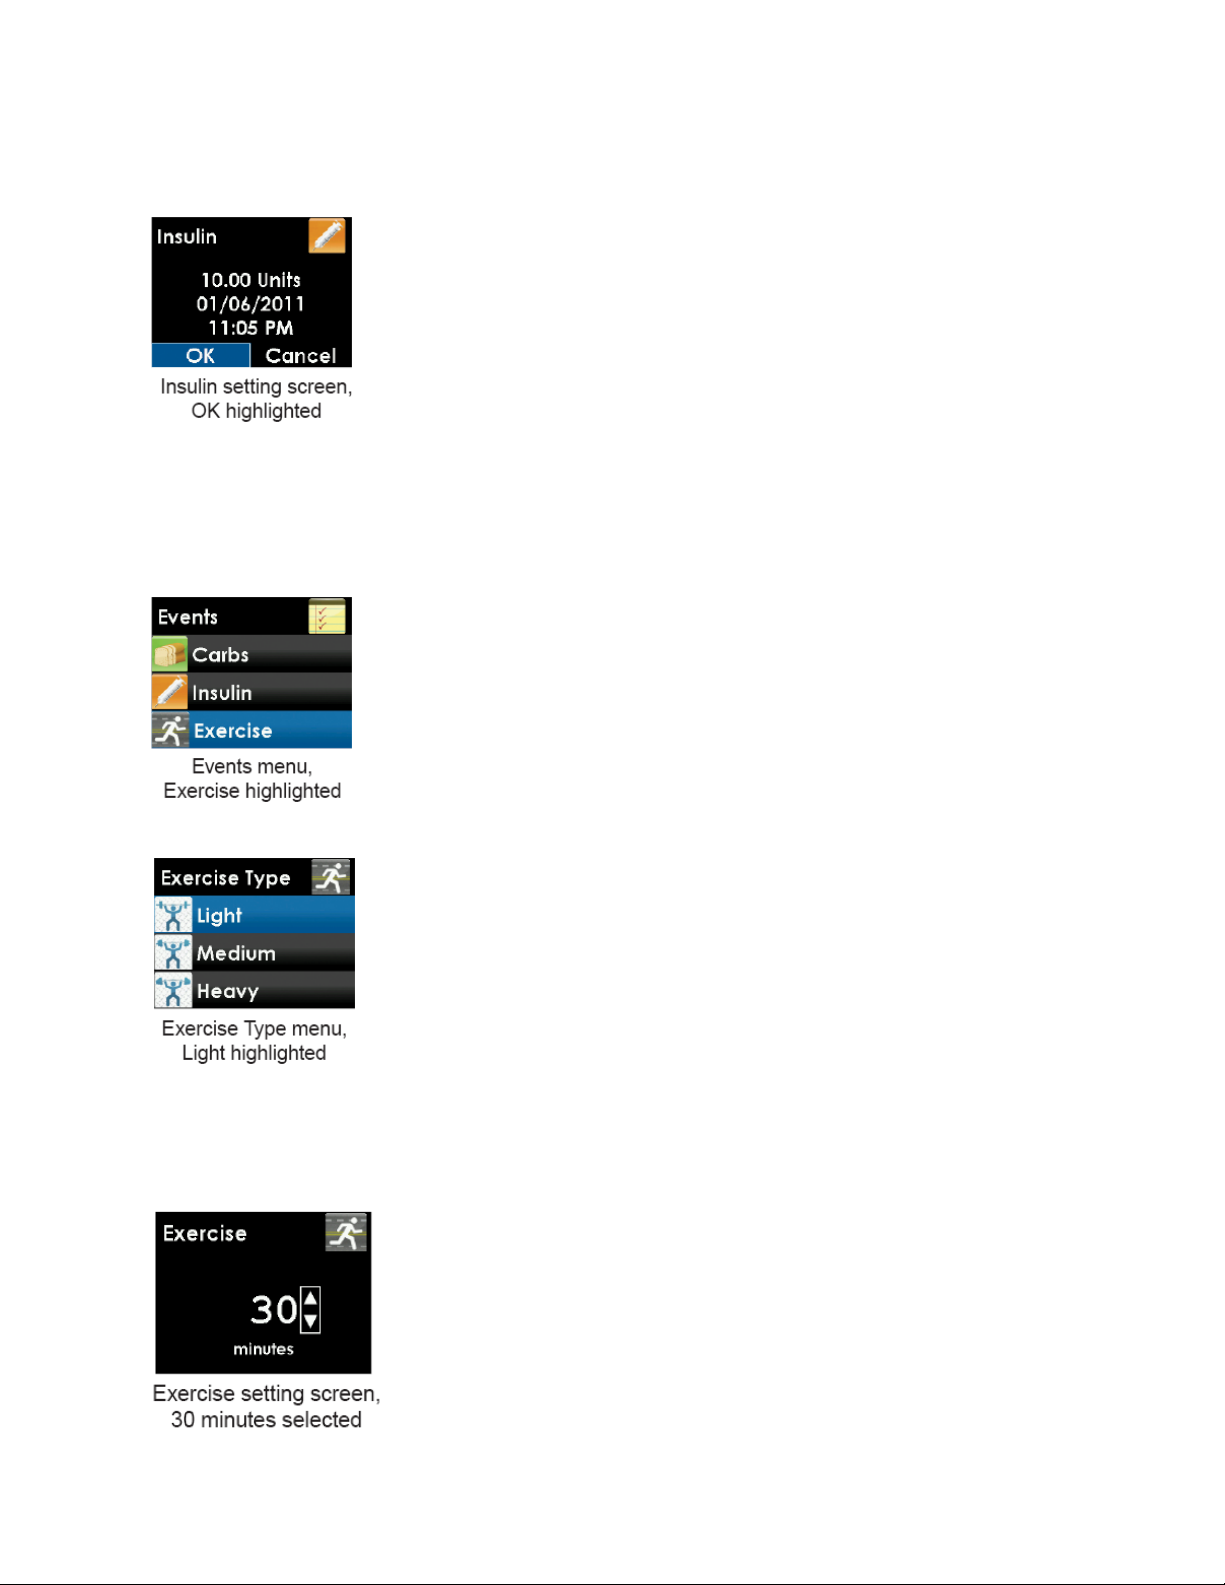
4. Press the
entry, and then press the
LEFT
or
RIGHT
SELECT
button to choose either “OK” to confirm this entry or “Cancel” to discard this
button. You will return to the Events menu.
10.1.5 EXERCISE
The exercise event lets you enter intensity (light, medium, or heavy) and duration (up to 360 minutes).
1. From the Events menu press the UP or
button.
2. Press the UP or
3. Press the UP or
button.
DOWN
DOWN
button to choose your exercise intensity level, and press the
button to enter your exercise duration (0-360 minutes), and press the
DOWN
button to choose “Exercise,” and press the
SELECT
SELECT
button.
SELECT
• The number that shows on this screen is the default amount of 30 minutes.
65
Page 66
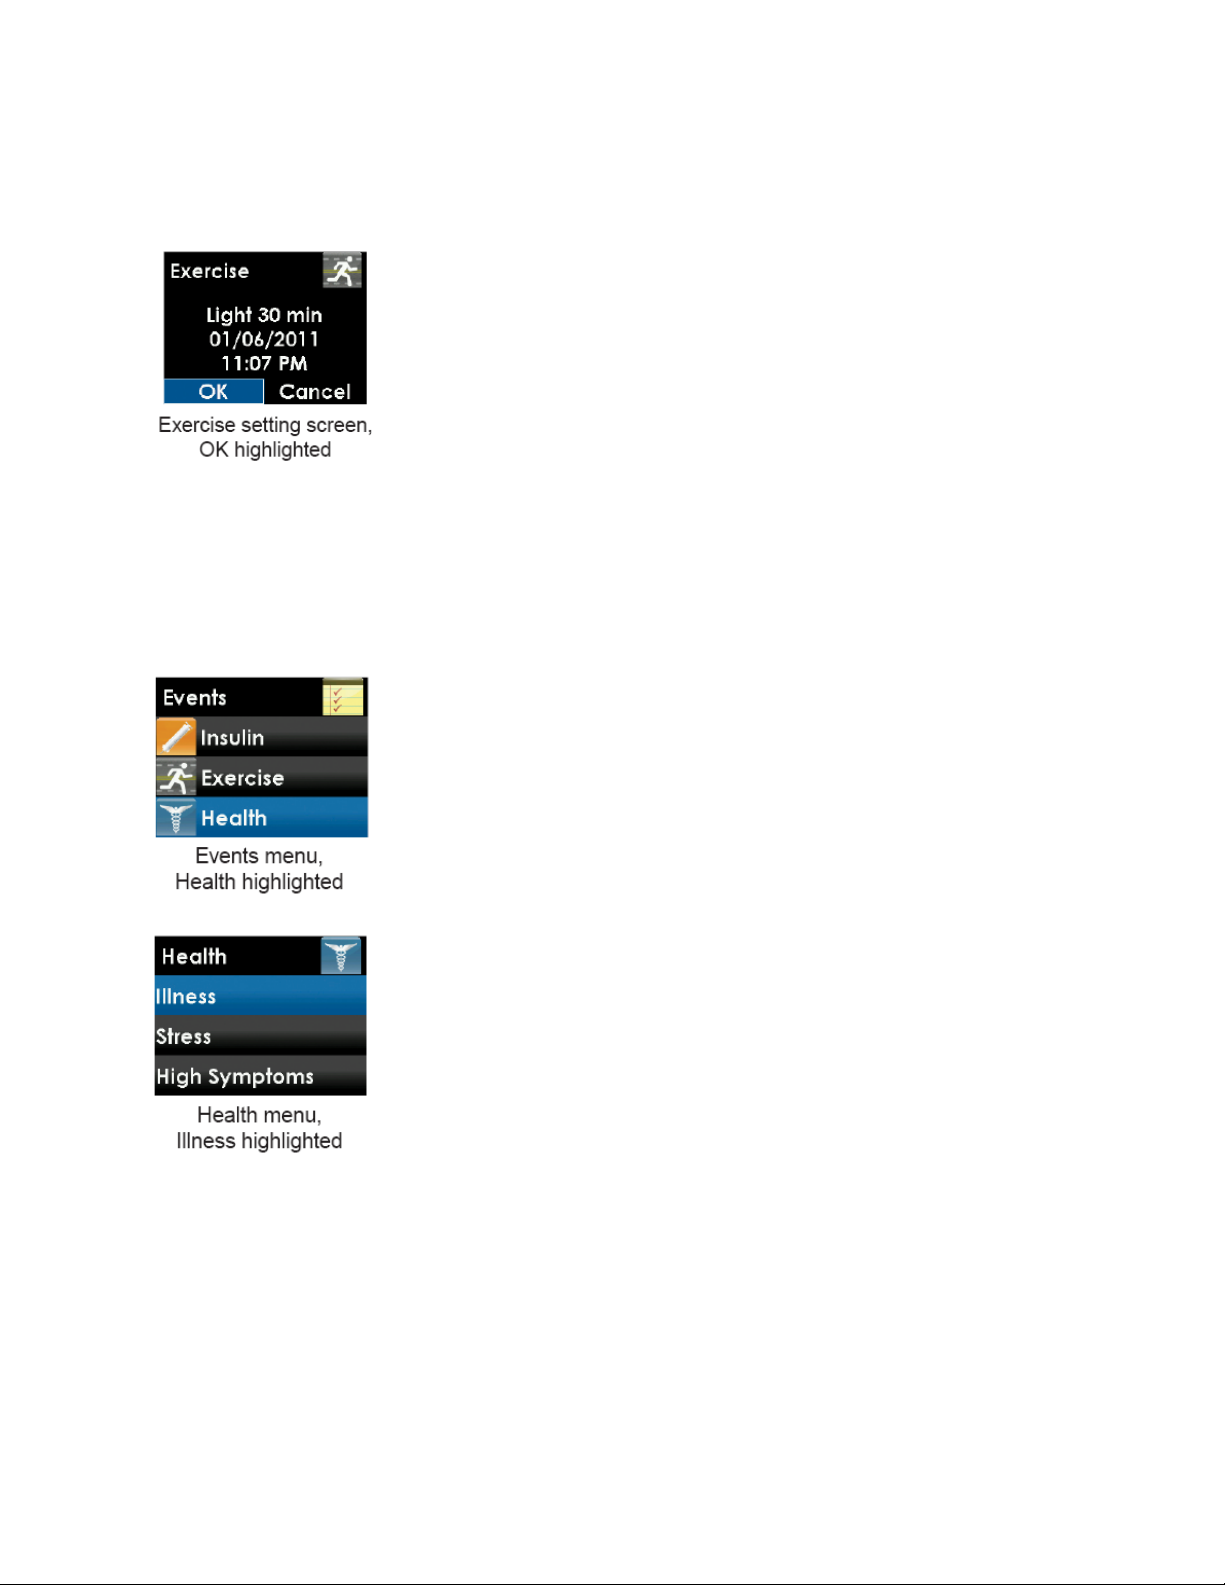
4. Check that the date and time for this entry are correct. Press the
SELECT
button to confirm.
5. Press the
entry, and then press the
LEFT
or
RIGHT
SELECT
button to choose either “OK” to confirm this entry or “Cancel” to discard this
button. You will return to the Events menu.
10.1.6 HEALTH
The Health event lets you enter episodes of illness, stress, high symptoms, low symptoms, cycle
(menstrual) or alcohol consumption.
1. From the Events menu press the UP or
button.
DOWN
button to choose “Health,” and press the
SELECT
2. Press the
3. Check that the date and time for this entry are correct. Press the
4. Press the
entry, and then press the
UP
LEFT
or
DOWN
or
RIGHT
button to choose your health event, and press the
button to choose either “OK” to confirm this entry or “Cancel” to discard this
SELECT
button. You will return to the Events menu.
SELECT
SELECT
button to confirm.
button.
66
Page 67
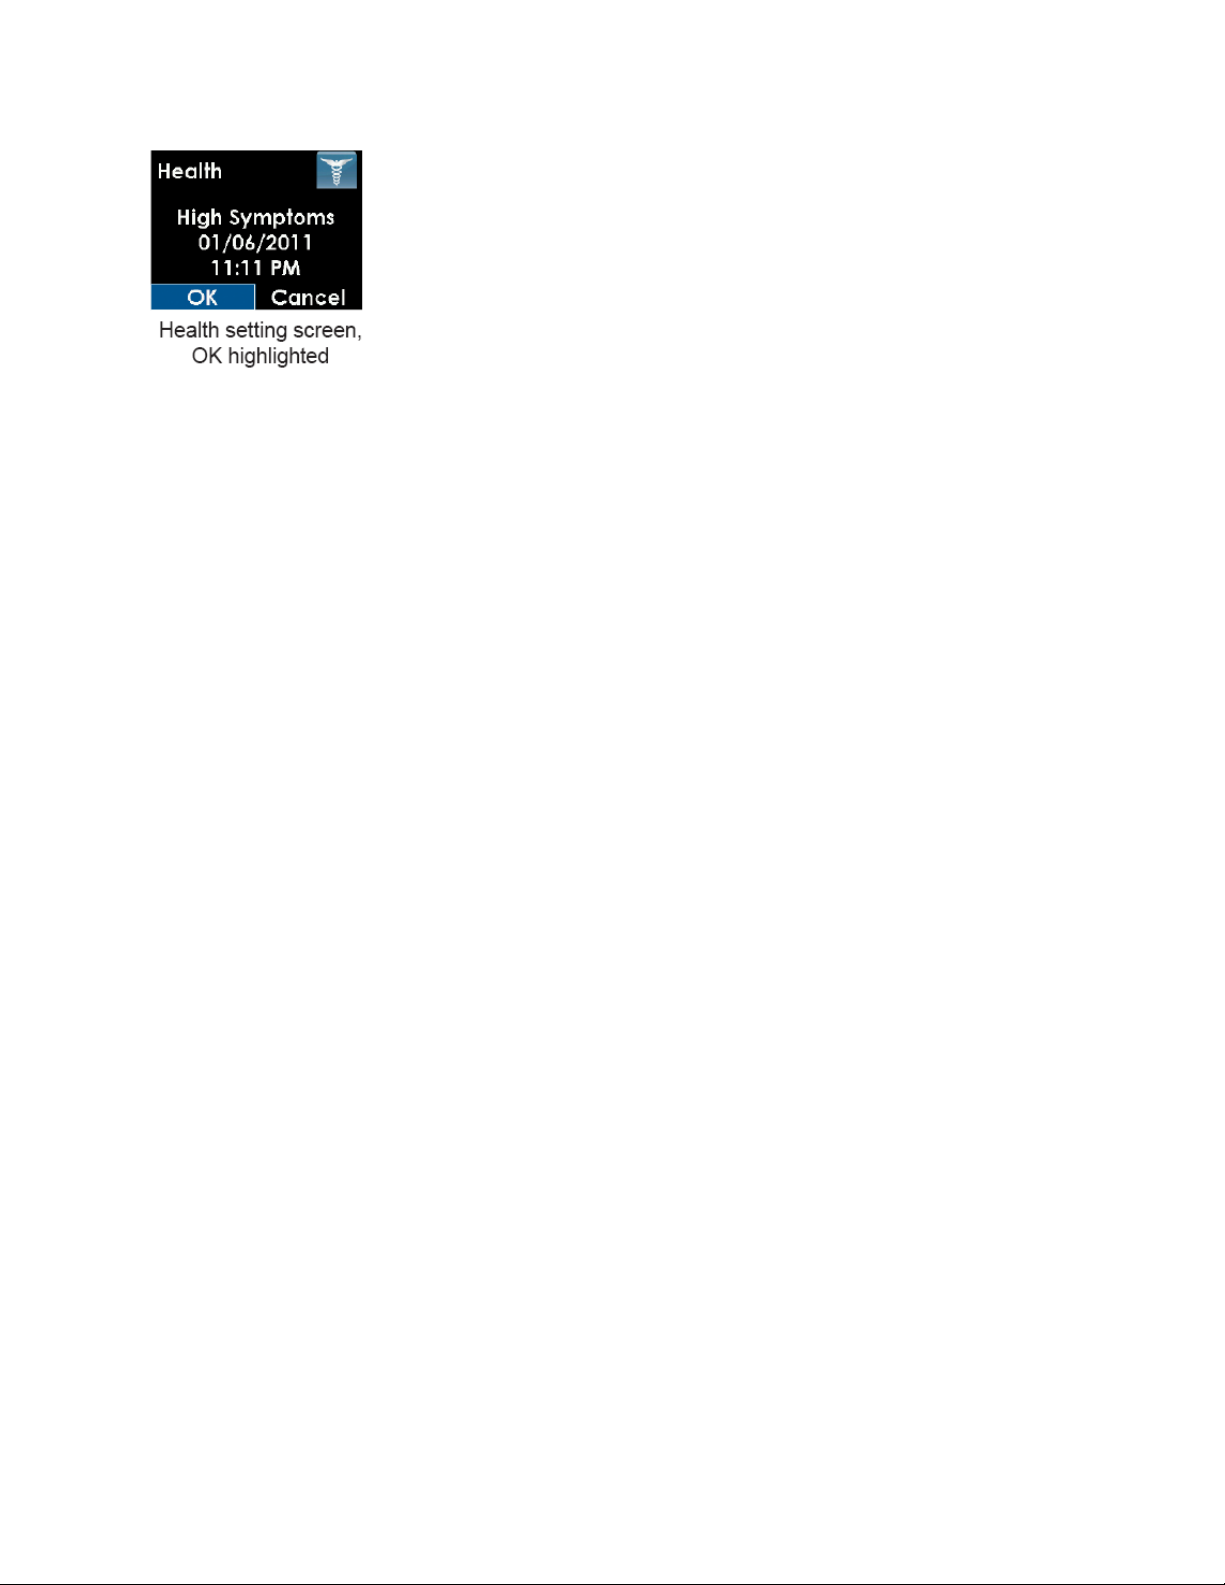
10.2 DEXCOM STUDIO SOFTWARE
The Dexcom Studio software is optional. This software lets you view trends, track patterns and create
custom charts to display your glucose trends.
You can change the date ranges to view long- or short-term patterns and trends. You can use data from
current and older downloads and save or print files for you and your healthcare professionals to review.
For system requirements and more information, see the Dexcom website (www.dexcom.com) or the
Dexcom Studio Software User’s Guide.
67
Page 68
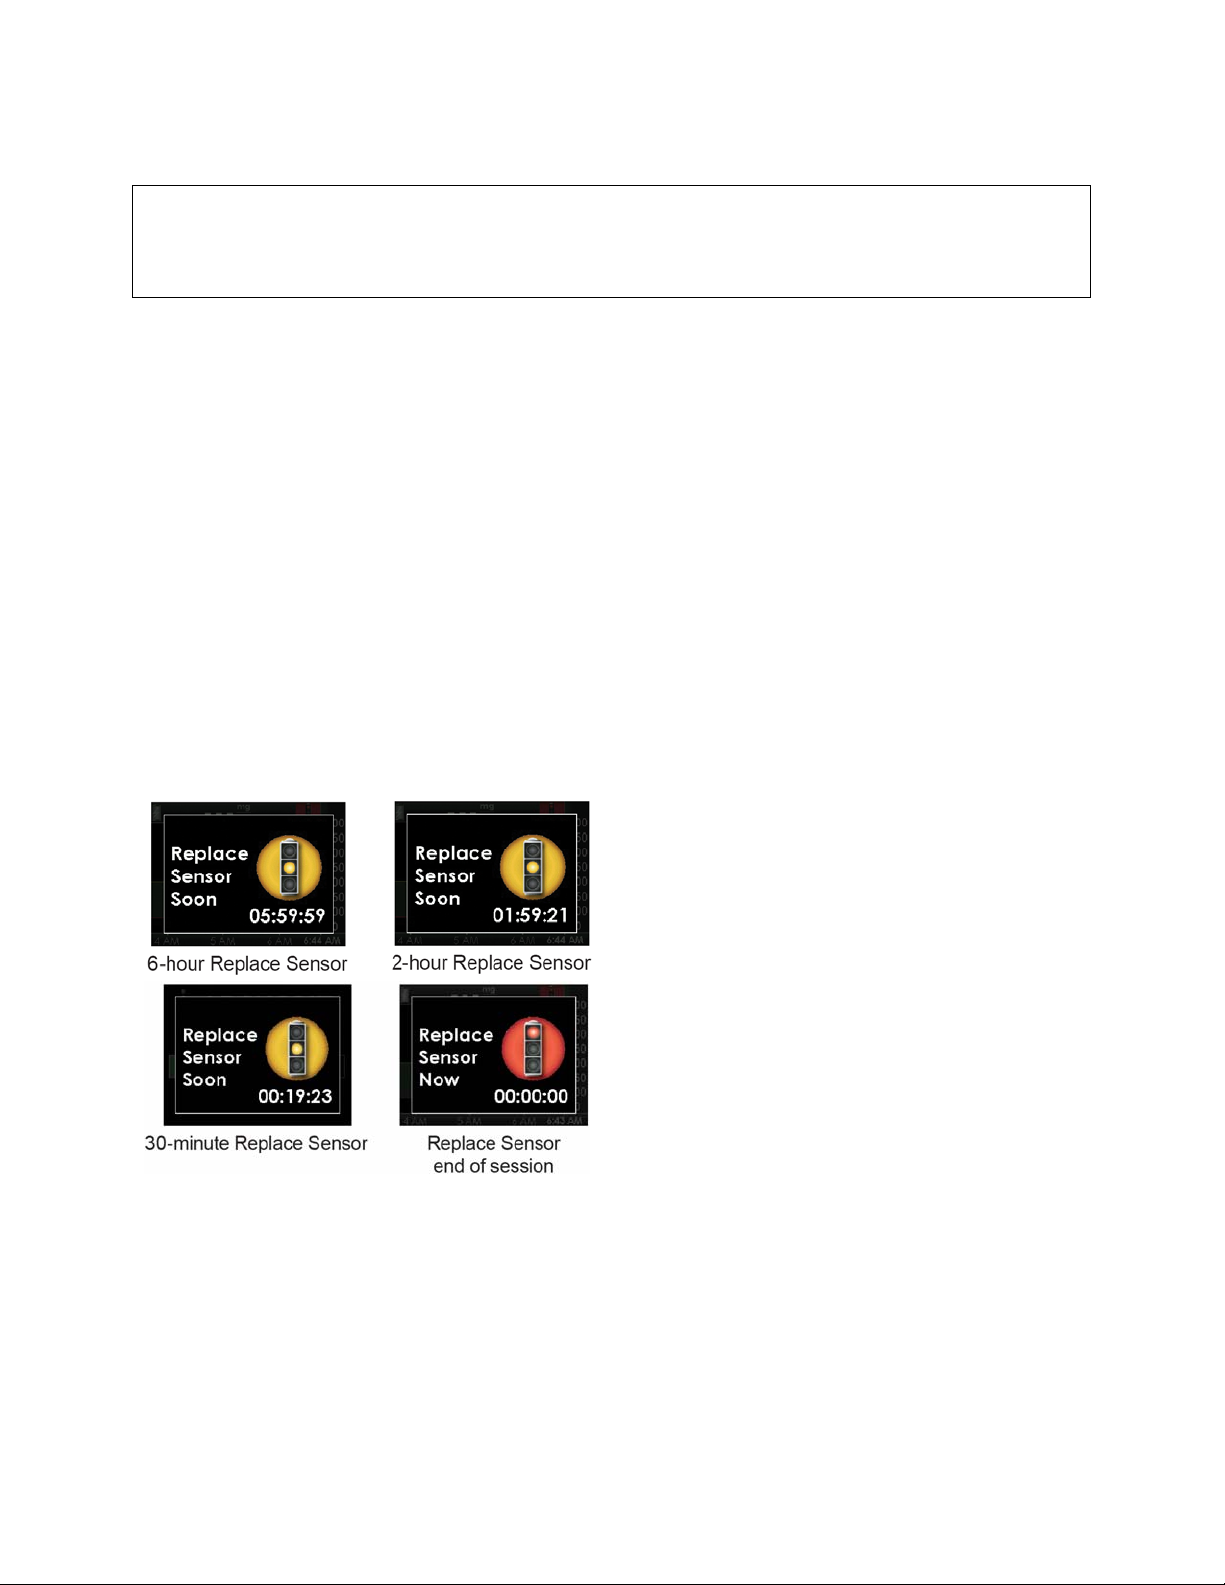
CHAPTER 11: ENDING A SENSOR SESSION
PRECAUTION
Do not discard your transmitter. It is reusable. The same transmitter is used for each
session until you have reached the end of the transmitter battery life.
Your sensor gives you sensor glucose readings for up to seven days. The performance of a sensor has not
been tested beyond seven days.
Information for the end of a sensor session:
• Do not remove the transmitter from the sensor pod while the pod is attached to your skin.
• Consult your local waste management authorities for instructions to dispose of blood contacting parts
(sensor and applicator).
• In some cases, your sensor session may end before you have finished a full 7-day period. If this
happens, see Chapter 13, Section 13.6, Sensor Shut-Off Troubleshooting.
•
Glucose alerts and alarm do not work after the sensor session ends.
11.1 AUTOMATIC SENSOR SHUT-OFF
The receiver tells you how much time you have left until your sensor session is complete. The Replace
Sensor screen shows at 6 hours, 2 hours and 30 minutes before your 7-day sensor session ends.
You can set these alerts with the profiles setting (see Chapter 9, Section 9.3.2, Alert Profile Details, “All
Other Alerts”). After the 6-hour, 2-hour, and 30-minute reminders, you continue to receive sensor glucose
readings. Press
Now screen (00:00:00) shows.
Sensor glucose readings do not show on the receiver after your sensor session ends.
graphs show that the sensor session has ended with a red stoplight symbol at the top.
You must remove your sensor and insert a new sensor.
SELECT
to clear these screens. You must remove your sensor after the Replace Sensor
The trend
68
Page 69
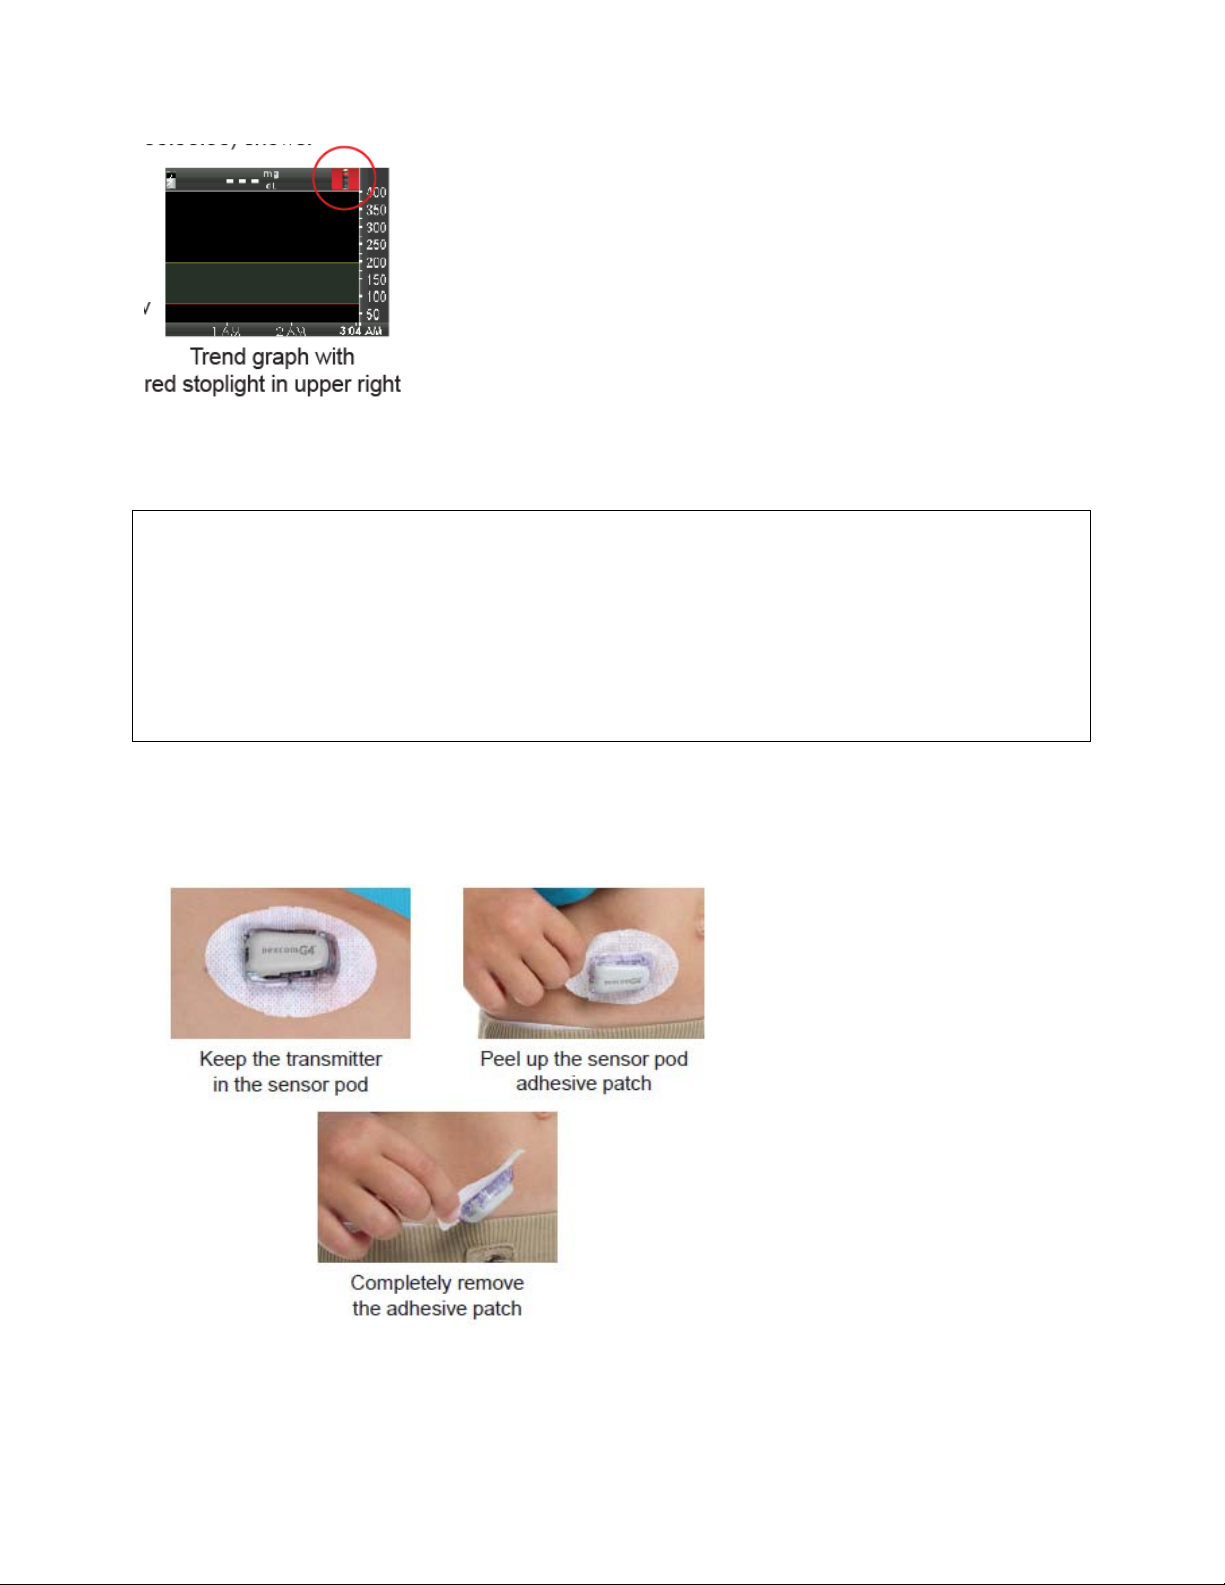
11.2 REMOVING A SENSOR
WARNING
Do not ignore sensor fractures. Sensors may fracture on rare occasions. If a
sensor breaks and no portion of it is visible above the skin, do not attempt to
remove it. Seek professional medical help if you have symptoms of infection or
inflammation—redness, swelling or pain—at the insertion site. If you experience
a broken sensor, please report this to our Technical Support department at
1.877.339.2664 or 1.858.200.0200 24 hours a day, 7 days a week.
When you remove the sensor, make sure to pull out the sensor pod while the transmitter is still
attached.
1. Gently peel up the sensor pod adhesive patch from your skin. This will pull out your sensor.
11.3 TRANSMITTER REMOVAL
69
Page 70
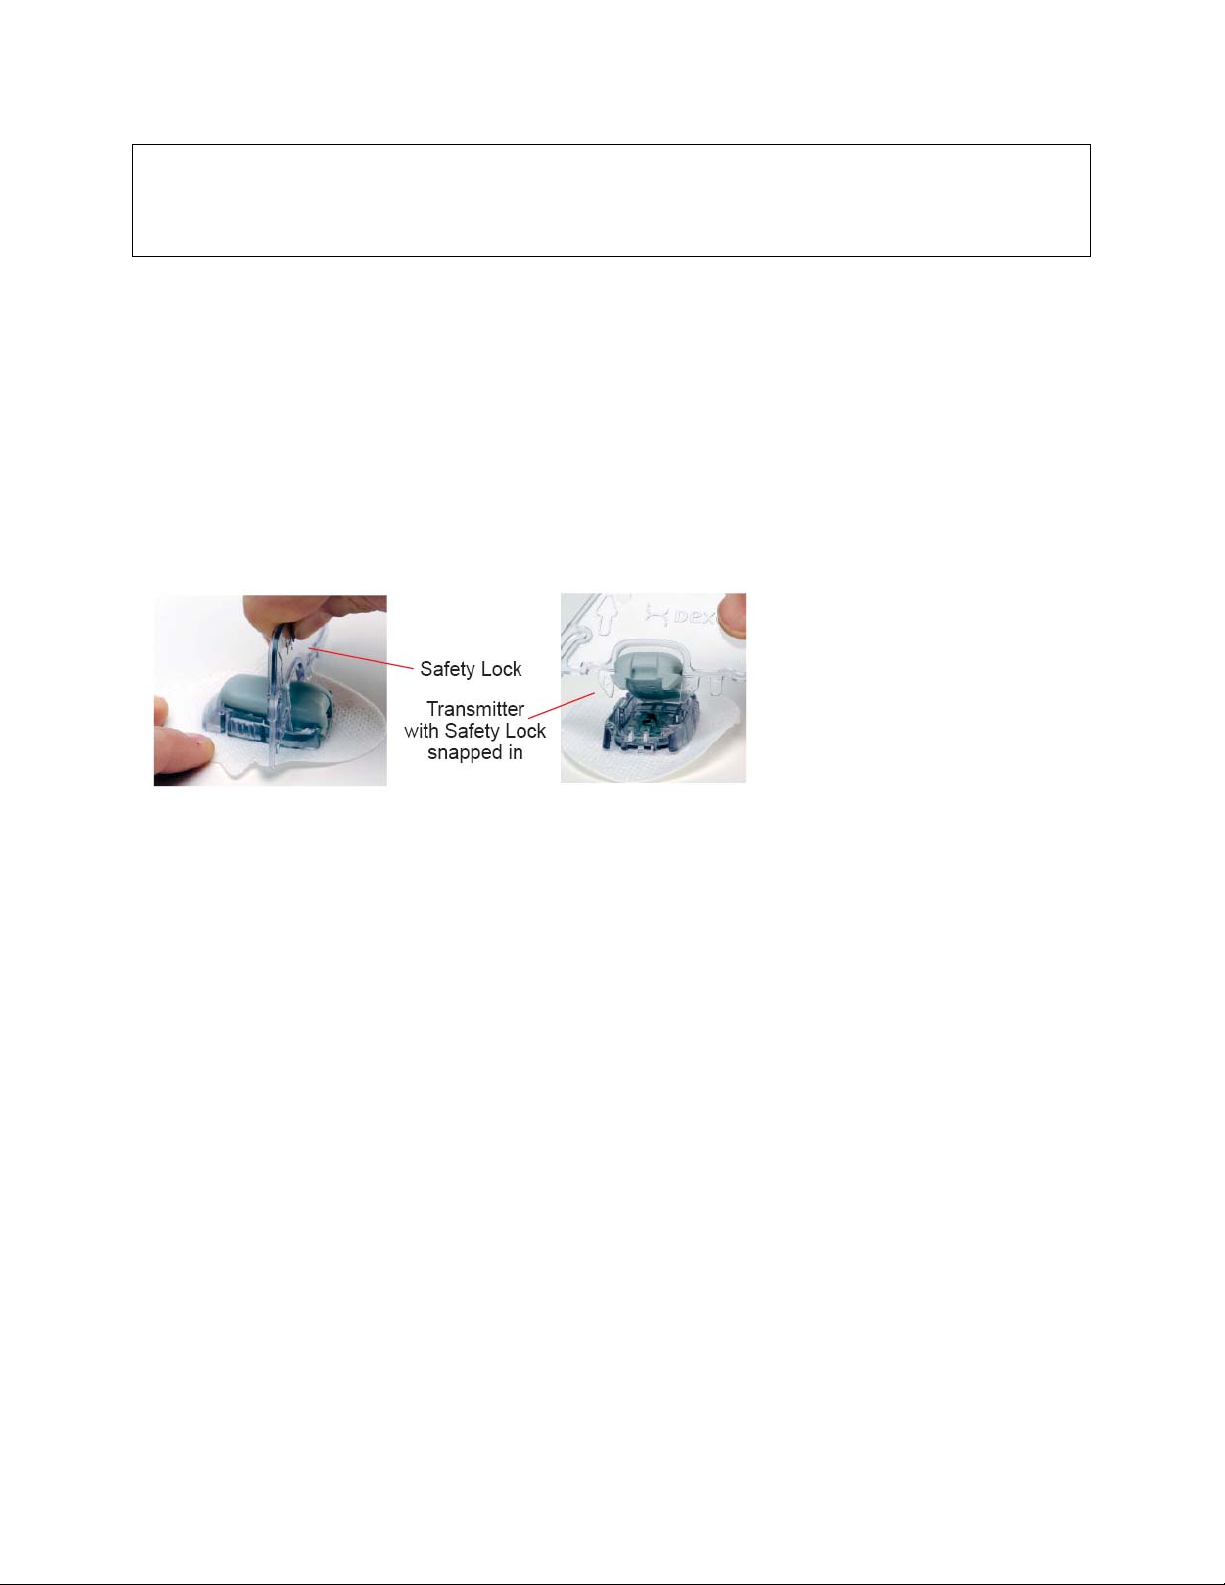
PRECAUTION
Do not discard your transmitter. It is reusable. The same transmitter is used for each
session until you have reached the end of the transmitter battery life.
Do not remove the transmitter while the sensor pod is still attached to the body.
After the sensor pod is off your body, you must remove the transmitter to reuse it. Use either of these two
transmitter removal methods:
Method 1
The safety lock that you removed from the applicator (see Chapter 6, Section 6.4, Placing the Sensor),
can be used as a tool to remove the transmitter.
1. Place the sensor pod/transmitter on a flat surface.
2. Hold the rounded edge of the safety lock.
3. Make sure the jagged edge of the safety lock is facing down, with the arrow pointing up, as shown:
Method 2
Use your fingers to spread out the tabs at the back of the sensor pod (end closest to the sensor pod tab
wings). The transmitter will “pop” out of the sensor pod.
70
Page 71

CHAPTER 12: TAKING CARE OF YOUR DEXCOM G4 PLATINUM
SYSTEM
12.1 MAINTENANCE
Transmitter
• Wipe the outside of the transmitter with a damp cloth or isopropyl alcohol wipe between uses.
• Keep the transmitter protected when not in use.
Receiver
• Do not spill fluid on the receiver or submerge the receiver in liquid.
• Keep the receiver in its carrying case or otherwise protected.
• Charge the receiver when the battery gets low.
•
Keep the micro USB port cover closed to help prevent fluid from getting inside the receiver.
Accessories
• Insert cables only as directed. Do not force cables in place.
• Look at cables for signs of wear and tear.
• Only use Dexcom-supplied parts (including cables and chargers). Use of non-Dexcom supplied parts
may affect safety and performance.
There is no repair service available for your Dexcom G4 PLATINUM CGM System. If you experience
problems with your system contact Dexcom Technical Support (see Chapter 15, User Assistance).
12.2 STORAGE
Sensor
• Keep the sensor in its sterile packaging until you are ready to use it.
• Do not insert sensors past the expiration date. The expiration date format is YYYY-MM-DD. Insert
sensors on or before the end of the calendar day printed on the sensor package label.
• Store at temperatures between 36° F - 77° F. Storing outside this temperature may result in reduced
sensor response to glucose and may cause inaccurate CGM readings. You may store your sensors in the
refrigerator if it is within this temperature range. Sensors should not be stored in a freezer.
• Store at humidity levels between 15% - 85% relative humidity.
Transmitter
• Keep the transmitter protected when not in use.
• Store at temperatures between 32° F - 113° F.
• Store at humidity levels between 10% - 95% relative humidity.
Receiver
• Keep the receiver protected when not in use.
• Fully charge the battery before storing for over 3 months.
• Store at temperatures between 32° F - 113° F.
71
Page 72

• Store at humidity levels between 10% - 95% relative humidity.
12.3 PRODUCT DISPOSAL
Consult your local waste management authorities for instructions to dispose of devices containing
electronic waste (transmitter and receiver) and blood contacting parts (sensor and applicator).
72
Page 73
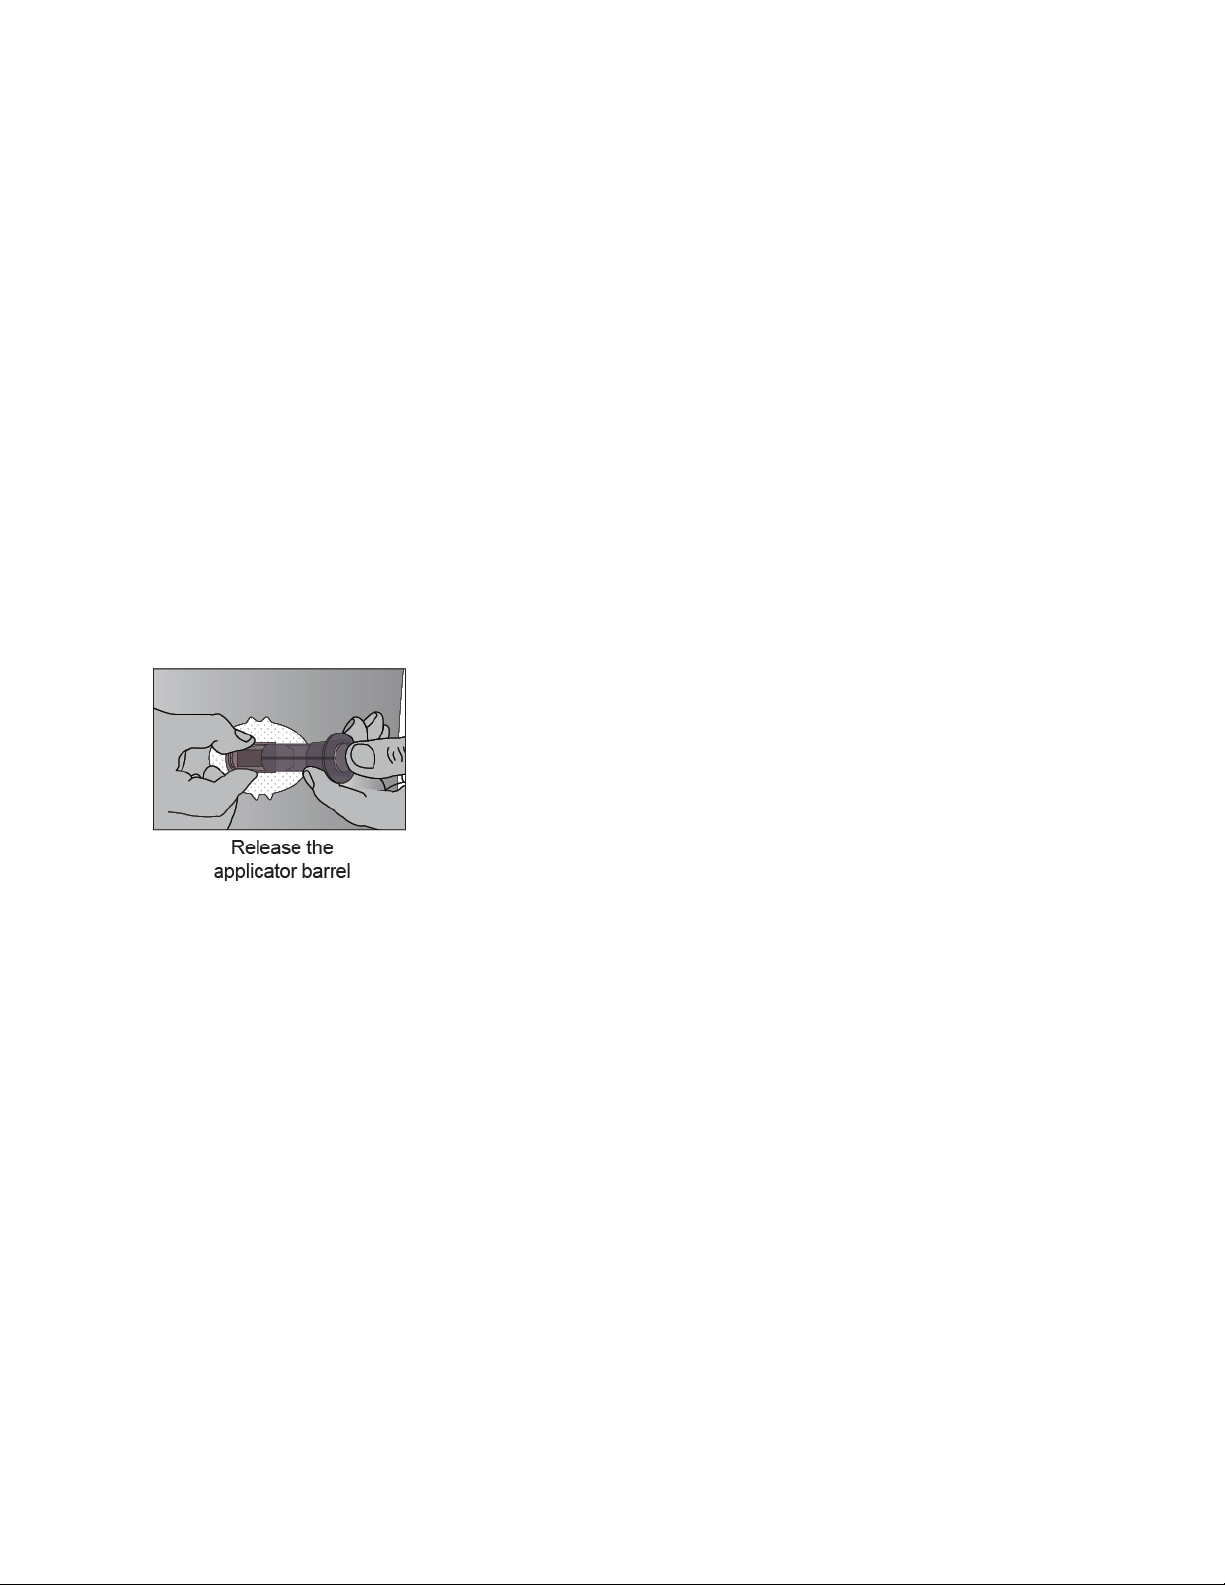
CHAPTER 13: TROUBLESHOOTING
This chapter provides helpful tips and instructions to fix issues you may have while using your Dexcom G4
PLATINUM CGM System.
If any of the troubleshooting steps in this chapter do not fix your issue, contact Dexcom Technical
Support (see Chapter 15, User Assistance).
13.1 SENSOR INSERTION TROUBLESHOOTING
Sensor insertion difficulties
• I am having trouble taking out the safety lock:
- Make sure to pull the safety lock straight out away from your body. Use the arrows on the safety lock as
a guide.
• I am not able to pull the collar up:
- Make sure the white plunger is completely pressed down before pulling the collar up.
- Use force when pulling the collar up.
• I am not able to remove the applicator barrel fr om the sen sor pod:
- Make sure the collar is pulled all the way up. When pulling the collar up you should hear 2 clicks. You
may need to use extra force to pull the collar as close to the top of the applicator as possible.
- Make sure the transmitter latch is flat against the adhesive on your body before squeezing the release
tabs.
- Use force when squeezing the ribbed release tabs on the sides of the sensor pod.
- Lift the applicator in a curving movement away from your body.
• I am not able to remove the transmitter latch:
- Hold the sensor pod with one hand and twist the transmitter latch with the other hand to remove it.
- Do not try to snap it straight off.
Sensor pod is not sticking long enough
- Make sure your skin is clean, clear of any cream or lotion, and completely dry before you insert the
sensor.
- Shave your skin before you insert the sensor if hair is preventing the sensor pod from sticking.
- You may use medical tape (such as Blenderm, Tegaderm, IV 3000, 3M tape) over the white adhesive
patch of the sensor pod, but do not place the tape over the transmitter or the plastic parts of the sensor pod.
13.2 CALIBRATION TROUBLESHOOTING
Calibration prompts may show during your sensor session. Review the following troubleshooting tips for
calibration.
73
Page 74
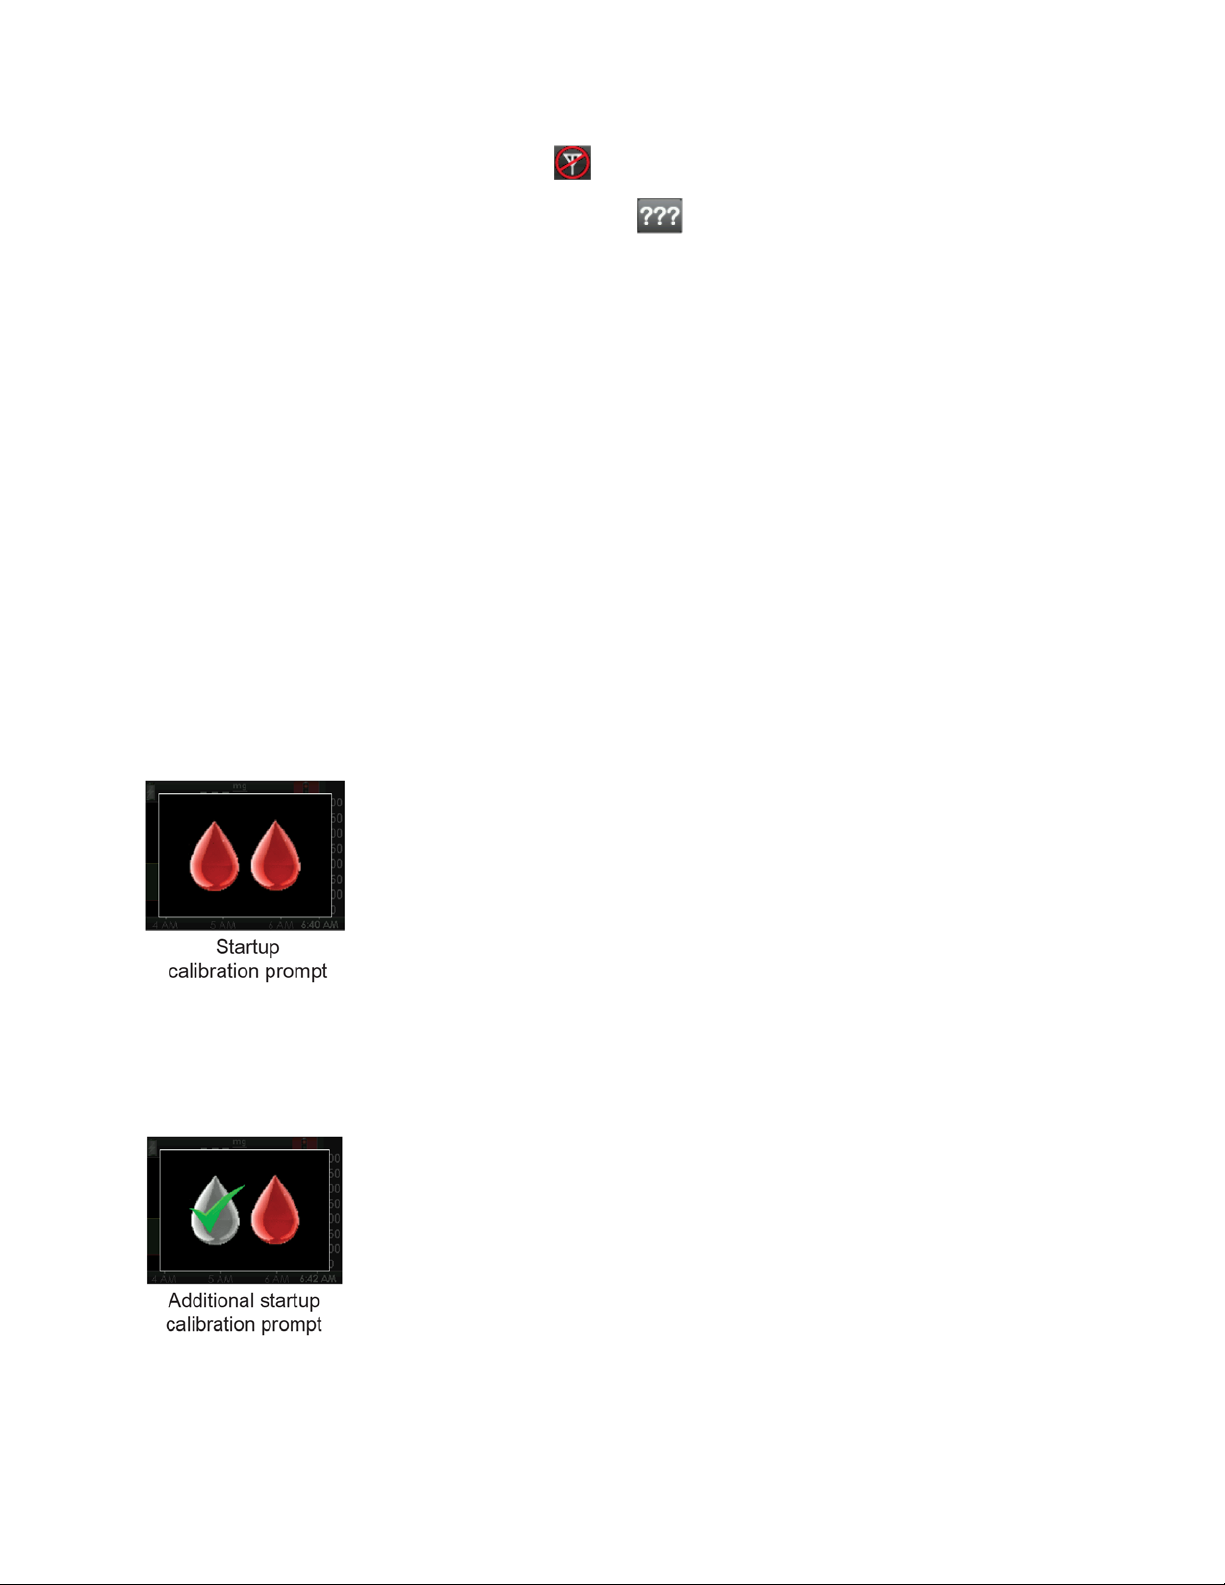
• Do not calibrate if the out of range symbol shows in the status area.
• Do not calibrate if the glucose reading error symbol shows in the status area.
• Do not calibrate if your blood glucose value is below 40 or above 400 mg/dL.
• Before you take a blood glucose value for calibration, wash your hands, make sure your glucose test
strips have been stored properly and are not expired and make sure that your meter is properly coded (if
required). Carefully apply the blood sample to the test strip following the instructions that came with your
meter or test strips.
• Make sure you have not taken any medications containing acetaminophen (such as Tylenol).
• See Chapter 7, Calibrating Your Dexcom G4 PLATINUM System, for further information.
13.2.1 TYPES OF CALIBRATION PROMPTS
This section describes the three calibration symbols. The next section describes what to do when you see
one of these symbols.
Startup calibration prompt
This prompt means the receiver’s 2-hour startup period is complete. You need to enter two blood glucose
values to calibrate the system.
The receiver shows the 2-hour startup calibration prompt screen every 15 minutes until the receiver
accepts the blood glucose values.
Additional startup calibration prompt
This prompt means you need to enter one more blood glucose value to calibrate the system.
The receiver shows the additional startup calibration prompt screen every 15 minutes until the receiver
accepts the blood glucose value.
Calibration prompt
This prompt means you need to enter one blood glucose value. It shows when it is time for your 12-hour
calibration update or any other time you need to calibrate.
74
Page 75
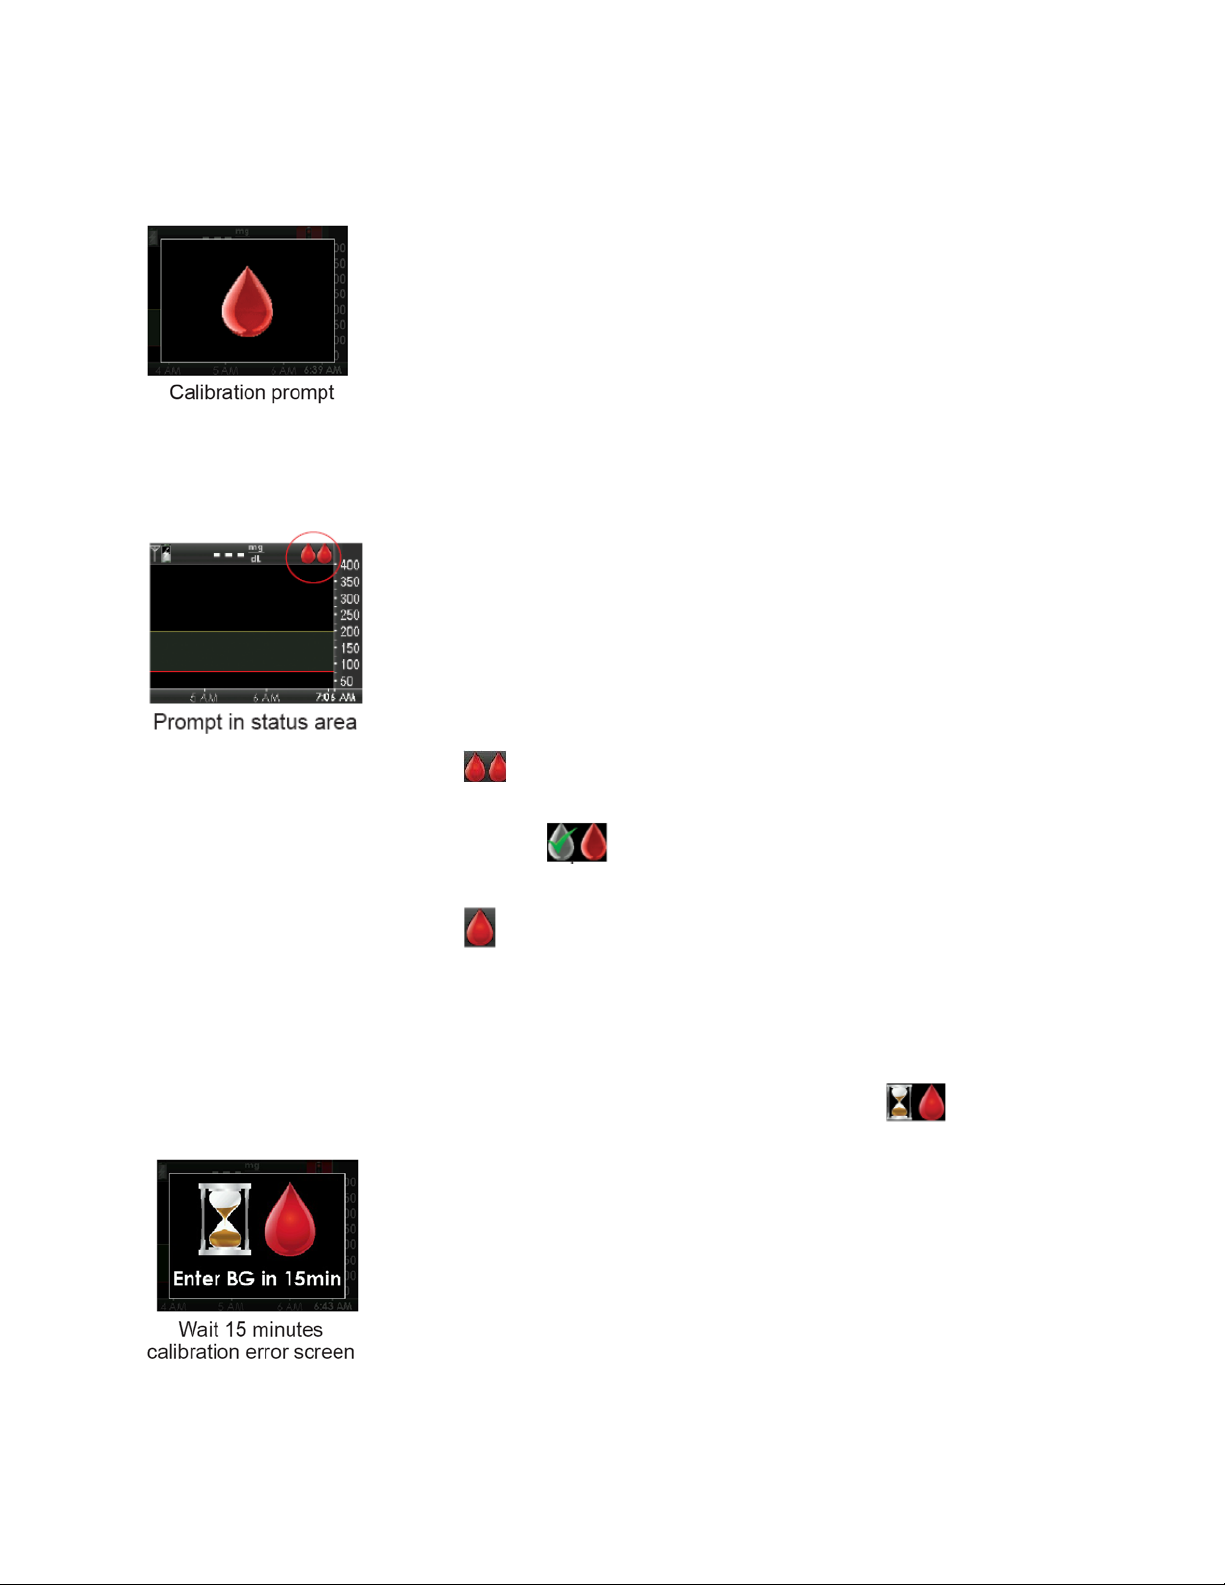
The receiver shows this prompt screen every 15 minutes until the receiver accepts the blood glucose
value.
13.2.2 WHAT TO DO FOR CALIBRATION PROMPTS
1. When you see a calibration prompt, press the
2. Check the status area at the top of the screen.
SELECT
button to clear the prompt.
a. If the startup calibration symbol shows, take 2 more blood glucose values and enter them into
your receiver.
b. If the additional startup calibration symbol shows, take 1 more blood glucose value and enter it
into your receiver.
c. If the calibration needed symbol shows, take 1 more blood glucose value and enter it into your
receiver.
13.3 CALIBRATION ERROR TROUBLESHOOTING
This screen means you recently entered a calibration blood glucose value, and the sensor is having
trouble calibrating. If you press the
status area.
SELECT
button to clear this screen, this symbol
shows in the
75
Page 76
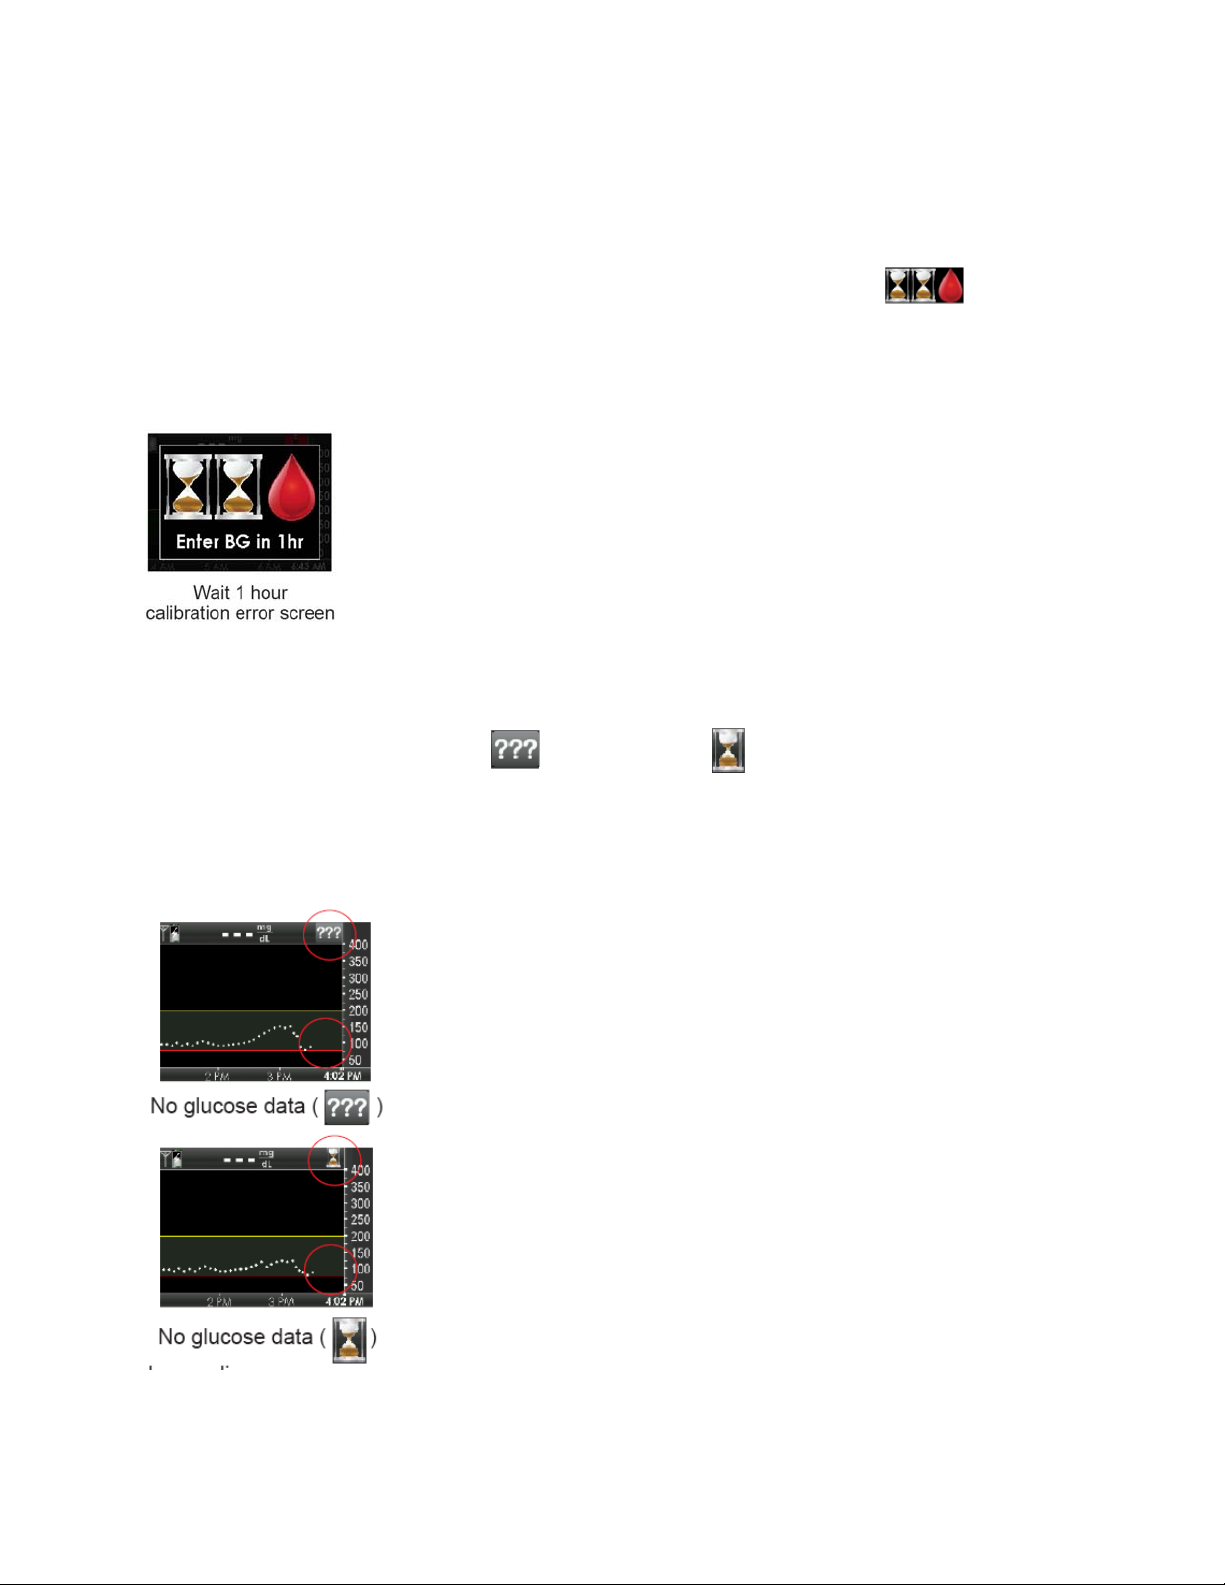
If you see this screen, wait 15 minutes and then enter 1 more calibration blood glucose value. Wait 15
more minutes. If this error screen still shows, enter 1 more blood glucose value. Wait another 15 minutes.
If this error screen still shows, the sensor needs to be replaced.
This screen also means you recently entered a calibration blood glucose value and the sensor is having
trouble calibrating. If you press the
the status area.
If you see this screen, wait at least 1 hour and then enter 1 more calibration blood glucose value. Wait 15
minutes. If this error screen still shows, enter 1 more blood glucose value. Wait another 15 minutes. If this
error screen still shows, the sensor needs to be replaced.
SELECT
button to clear the screen, this symbol
shows in
13.4 SYSTEM GLUCOSE ERROR
The system may tell you that it cannot provide a sensor glucose reading. When this happens you will see
either the glucose reading error symbol or the wait symbol in the status area. These symbols
mean the receiver does not understand the sensor signal temporarily. These symbols are related to the
sensor only.
Wait for more prompts, and
system will not use a blood glucose value for calibration when these symbols show (see Chapter 8,
Section 8.3, Glucose Status Area Symbols).
do not enter
any blood glucose values when you see these symbols. The
76
Page 77
Often, the system can correct the problem and continue providing sensor glucose readings. If it has been
at least 3 hours since your last sensor glucose reading, contact Technical Support (see Chapter 15, User
Assistance).
If you see these system glucose error icons often, follow these troubleshooting tips before inserting
another sensor:
• Make sure your sensor is not expired.
• Make sure your sensor pod is not dislodged or peeling up.
• Make sure your transmitter is snapped in completely.
• Make sure nothing is rubbing the sensor pod (i.e. clothing, seat belts, etc.).
• Make sure you selected a good insertion site (see Chapter 6, Section 6.3, Choosing an Insertion Site).
• Make sure your insertion site is clean and dry before sensor insertion.
• Wipe the bottom of the transmitter with a damp cloth or isopropyl alcohol wipe. Place the transmitter
on a clean, dry cloth and air dry for 2-3 minutes.
13.5 SENSOR INACCURACIES
Inaccuracies are usually related to your sensor only and not your receiver or transmitter. Your sensor
glucose readings are meant to be used for trending purposes only. Your blood glucose meter and sensor
measure your glucose from two different types of body fluids: blood and interstitial fluid. Therefore, your
readings from your blood glucose meter readings and sensor may not match.
WARNING
Calibrate at least once every 12 hours. Calibrating less often than every 12 hours might
cause sensor glucose readings to be inaccurate, and you might miss a low or high
blood glucose value.
PRECAUTION
To calibrate the system, enter the exact blood glucose value that your blood glucose
meter displays within 5 minutes of a carefully performed blood glucose measurement.
Entering incorrect blood glucose values or blood glucose values from more than 5
minutes before entry might affect sensor performance, and you might miss a low or high
blood glucose value.
If the difference between your sensor glucose reading and blood glucose value is greater than 20% of the
blood glucose value for sensor glucose readings > 80 mg/dL or greater than 20 points for sensor glucose
readings < 80 mg/dL, wash your hands and take another blood glucose measurement. If the difference
between this second blood glucose measurement and the sensor is still greater than 20% for sensor
glucose readings > 80 mg/dL or greater than 20 points for sensor glucose readings < 80 mg/dL,
recalibrate your sensor using the second blood glucose value. The sensor glucose reading will correct
over the next 15 minutes. If you see differences between your sensor glucose readings and blood
glucose values outside of this acceptable range, follow the troubleshooting tips below before inserting
another sensor:
• Make sure your sensor is not expired.
• Make sure you do not calibrate when the or is shown.
77
Page 78

• Do not use alternative blood glucose site testing (blood from your palm or forearm, etc.) for calibration
as alternative site readings may be different than those from a blood glucose value. Use a blood glucose
value only from your fingers for calibration.
• Use only blood glucose values between 40-400 mg/dL for calibration. If one or more of your values is
outside of this range, the receiver will not calibrate.
• Use the same meter you routinely use to measure your blood glucose to calibrate. Do not switch your
meter in the middle of a sensor session. Blood glucose meter and strip accuracy vary between blood
glucose meter brands.
• Before taking a blood glucose measurement for calibration, wash your hands, make sure your glucose
test strips have been stored properly and are not expired and make sure that your meter is properly
coded (if required). Carefully apply the blood sample to the test strip following the instructions provided
with your meter or test strips.
• Make sure you are using your blood glucose meter following the manufacturer’s instructions to get
accurate blood glucose values for calibration.
• Make sure you have not taken any medications containing acetaminophen (such as Tylenol) to
ensure you are getting accurate blood glucose values for calibration.
13.6 SENSOR SHUT-OFF TROUBLESHOOTING
In some cases your sensor session may stop or need to be stopped before the end of a full 7-day period.
You must remove your sensor.
13.6.1 EARLY SENSOR SHUT-OFF – SENSOR FAILURE
The receiver may detect issues with your sensor where it cannot determine your sensor glucose reading.
The sensor session ends and the receiver shows the “Sensor Failed” screen. If you see this screen, it
means your CGM session has ended. Press the
SELECT
button to clear this screen.
Remove your sensor and insert a new sensor.
To help improve future sensor performance:
• Make sure your sensor is not expired.
• Make sure your transmitter is snapped in.
• Make sure your sensor pod is not dislodged or peeling up.
• Make sure nothing is rubbing the sensor pod (i.e. clothing, seat belts, etc.).
• Make sure you have selected a good insertion site (see Chapter 6, Section 6.3, Choosing an Insertion
Site).
• Make sure your insertion site is clean and dry prior to sensor insertion.
13.6.2 MANUAL SENSOR SHUT-OFF – “STOP SENSOR”
There may be times that you will want to stop your sensor session before the end of the seven days.
Some of these times may include removing the sensor early due to:
78
Page 79
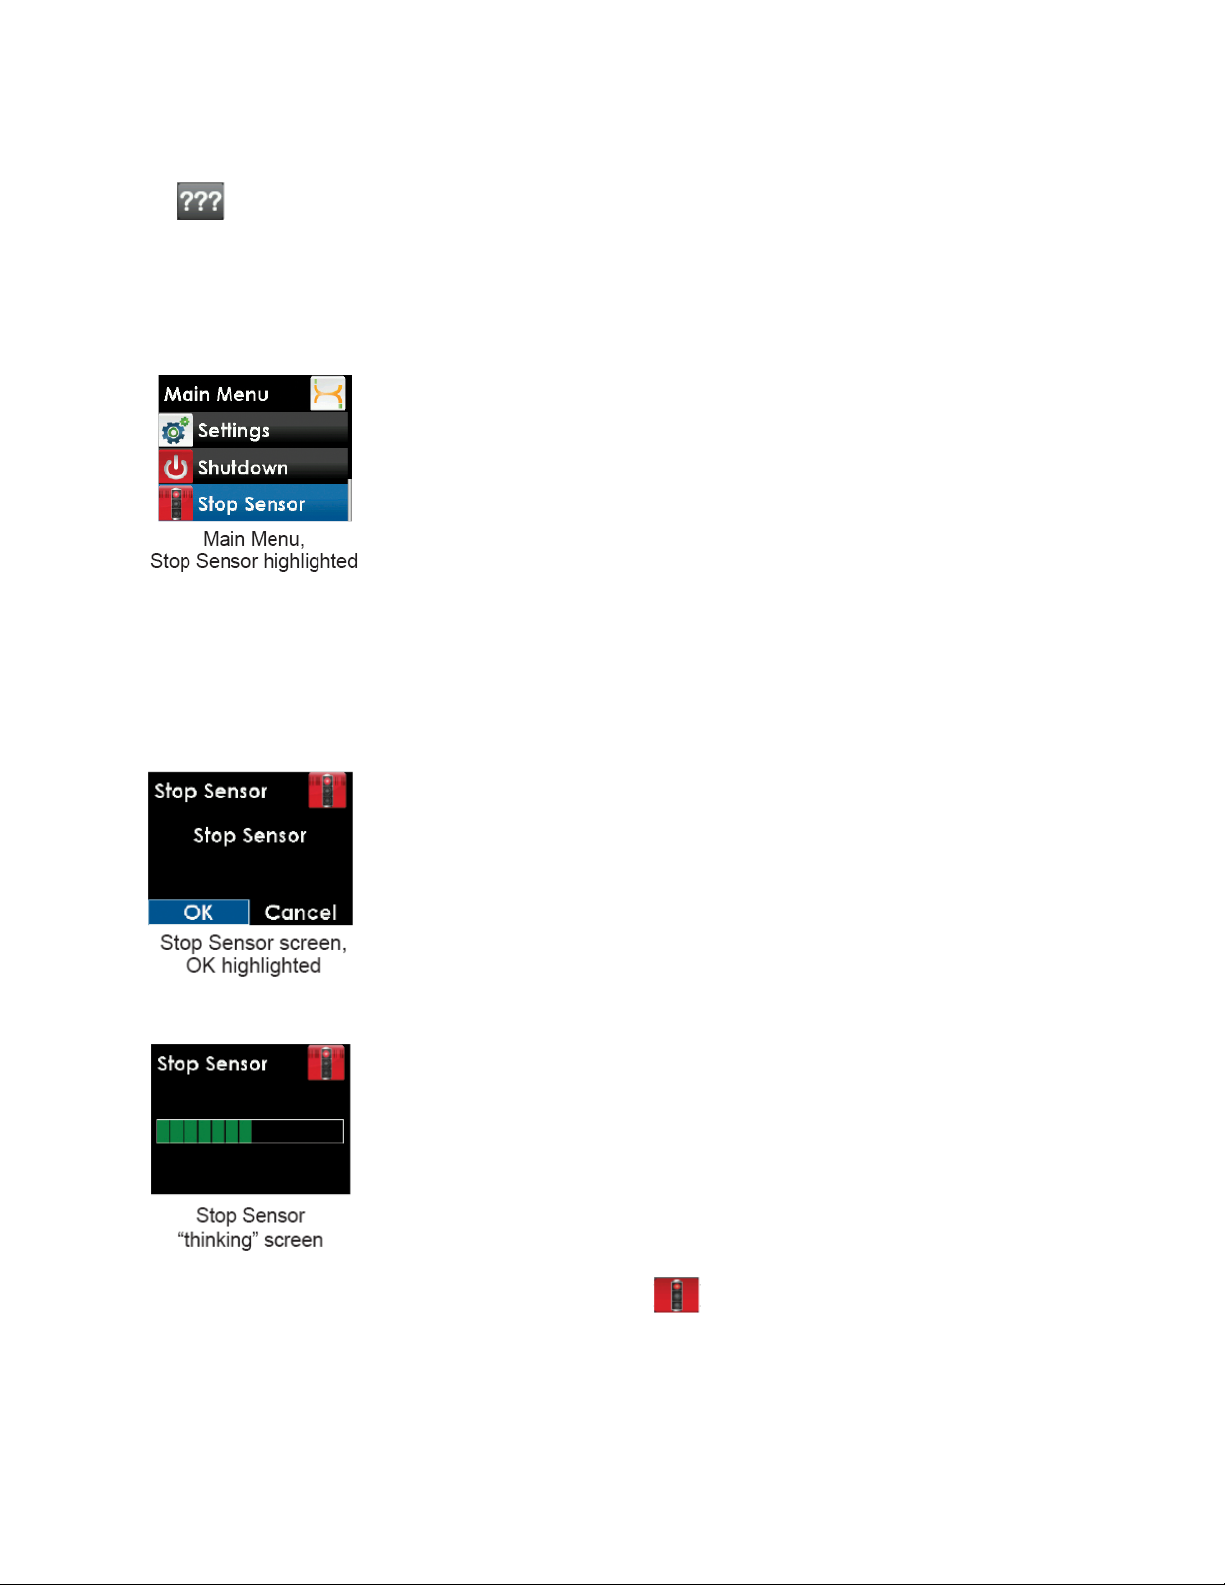
• Calibration issues that cannot be resolved
• symbol that does not resolve
• Sensor adhesion issues
• Lifestyle needs
When you are in an active sensor session, you will see the “Stop Sensor” option but not the “Start
Sensor” option on the Main Menu.
When you are not in an active sensor session, you will see the “Start Sensor” option but not the “Stop
Sensor” option on the Main Menu.
Stop your sensor session if you remove your sensor before the end of the full 7 -day period.
1. To end your sensor session, select “Stop Sensor” from the Main Menu.
2. Press the
3. The Stop Sensor “thinking” screen will show to let you know the sensor session is stopping.
4. Once the session has stopped, a red stoplight symbol ( ) shows in the upper right of the trend
SELECT
button with “OK” highlighted to confirm.
graph.
79
Page 80
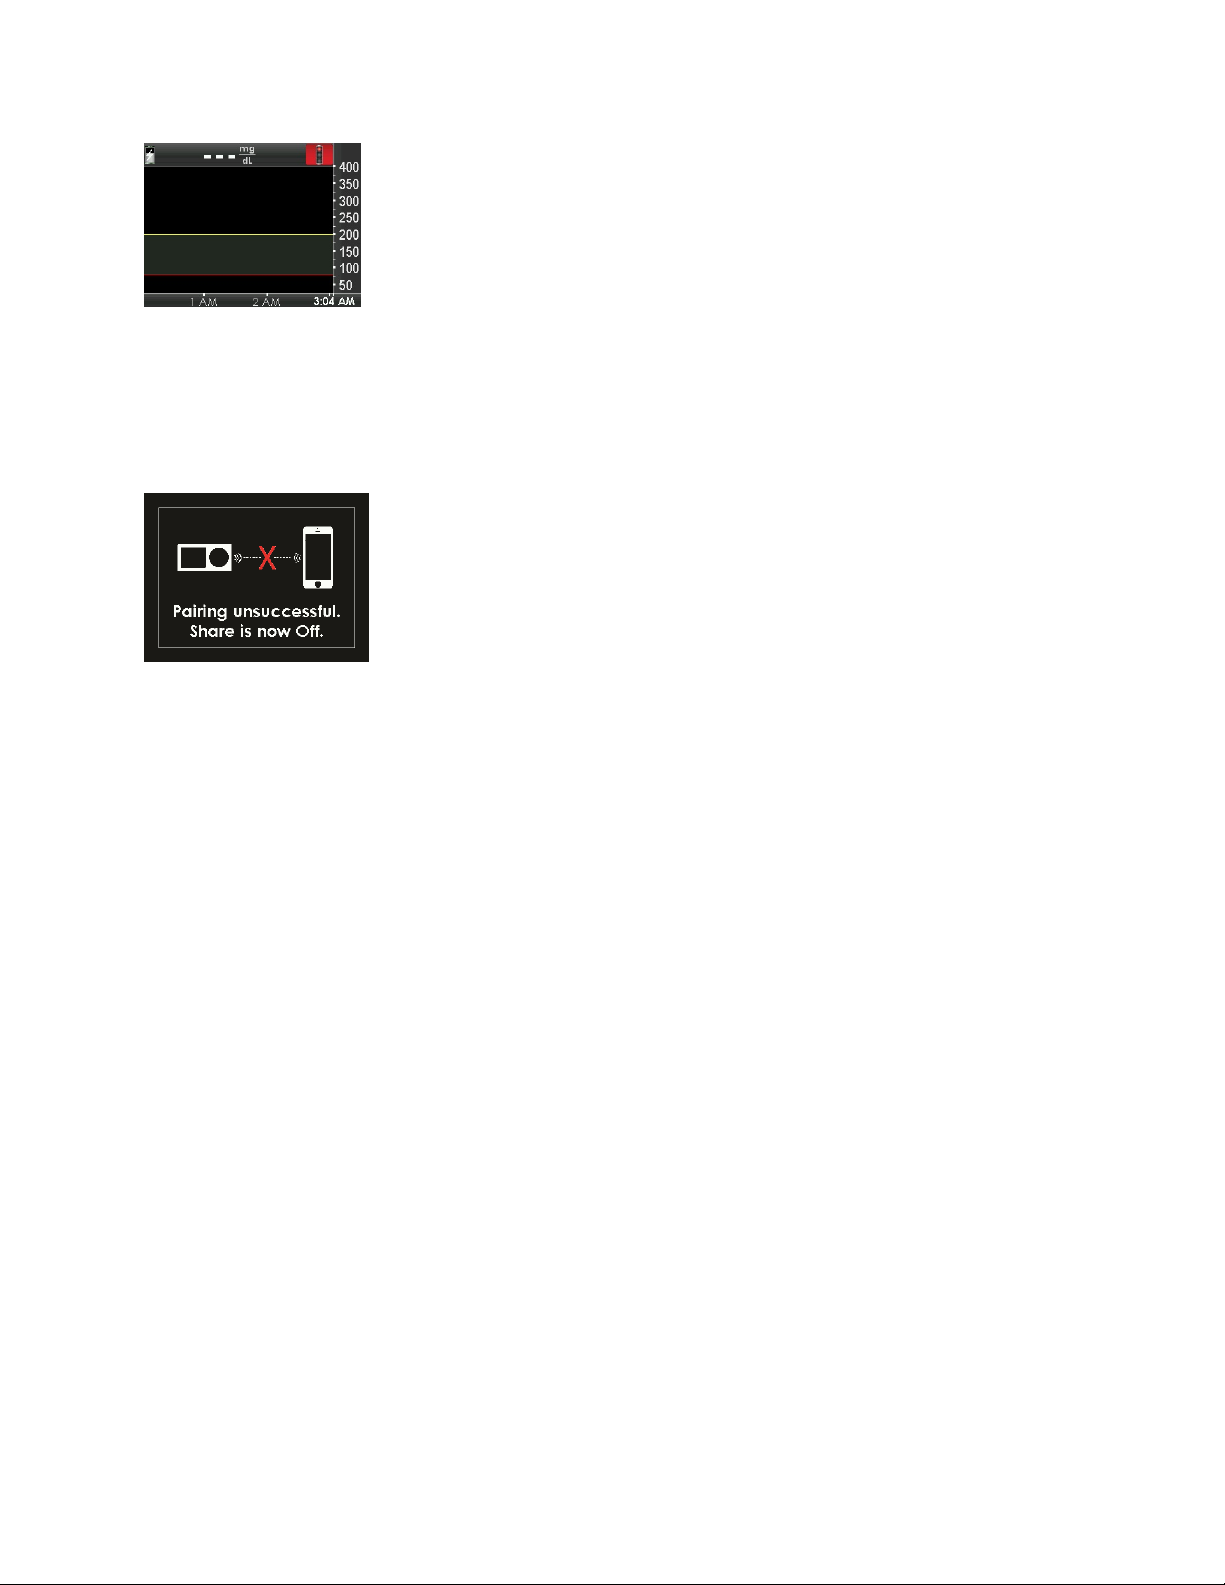
13.7 SHARE PAIRING ERROR TROUBLESHOOTING
This screen means you recently turned Share “On,” and your Receiver is having trouble connecting with
your iPhone or iPod touch. If you press the “Ok” button to clear this screen, you will be taken back to the
Share menu and Share will be turned “Off.” Turn Share “On” to try pairing again. For more information on
how to troubleshoot your Dexcom Share System, refer to the Dexcom Share User Manual.
Share unsuccessful pairing prompt
If you are not using the Share feature, you should leave Share turned “Off”.
13.8 BATTERY AND CHARGER TROUBLESHOOTING
Only use the Dexcom cable and battery charger to charge your receiver.
A full charge can take up to 5 hours and will last about 3 days, depending on how often you turn on your
receiver, use the alerts, and enter events.
If your receiver does not show the battery charging symbol when plugged into the charger, make sure
that both ends of the USB cable are fully inserted into the receiver port and wall charger or computer.
If your battery drains and is not charged for a few weeks it may not turn on. If your receiver does not turn
on, first try to charge it (see Chapter 4, Section 4.1, Charging Your Receiver Battery). If your receiver still
does not turn on you may need to reset the receiver:
1. Connect the receiver to the charger before resetting.
2. Insert the end of a paperclip into the small circular hole on the back of the receiver and push down. The
receiver will vibrate and show the thinking screen.
3. Charge your receiver.
4. You may need to reset the time and date (see Chapter 4, Section 4.1, Charging Your Receiver Battery
and Chapter 5, Section 5.2, The Settings Menu).
13.9 RECEIVER AND TRANSMITTER COMMUNICATION
TROUBLESHOOTING
13.9.1 SYSTEM RECOVERY CHECK
80
Page 81
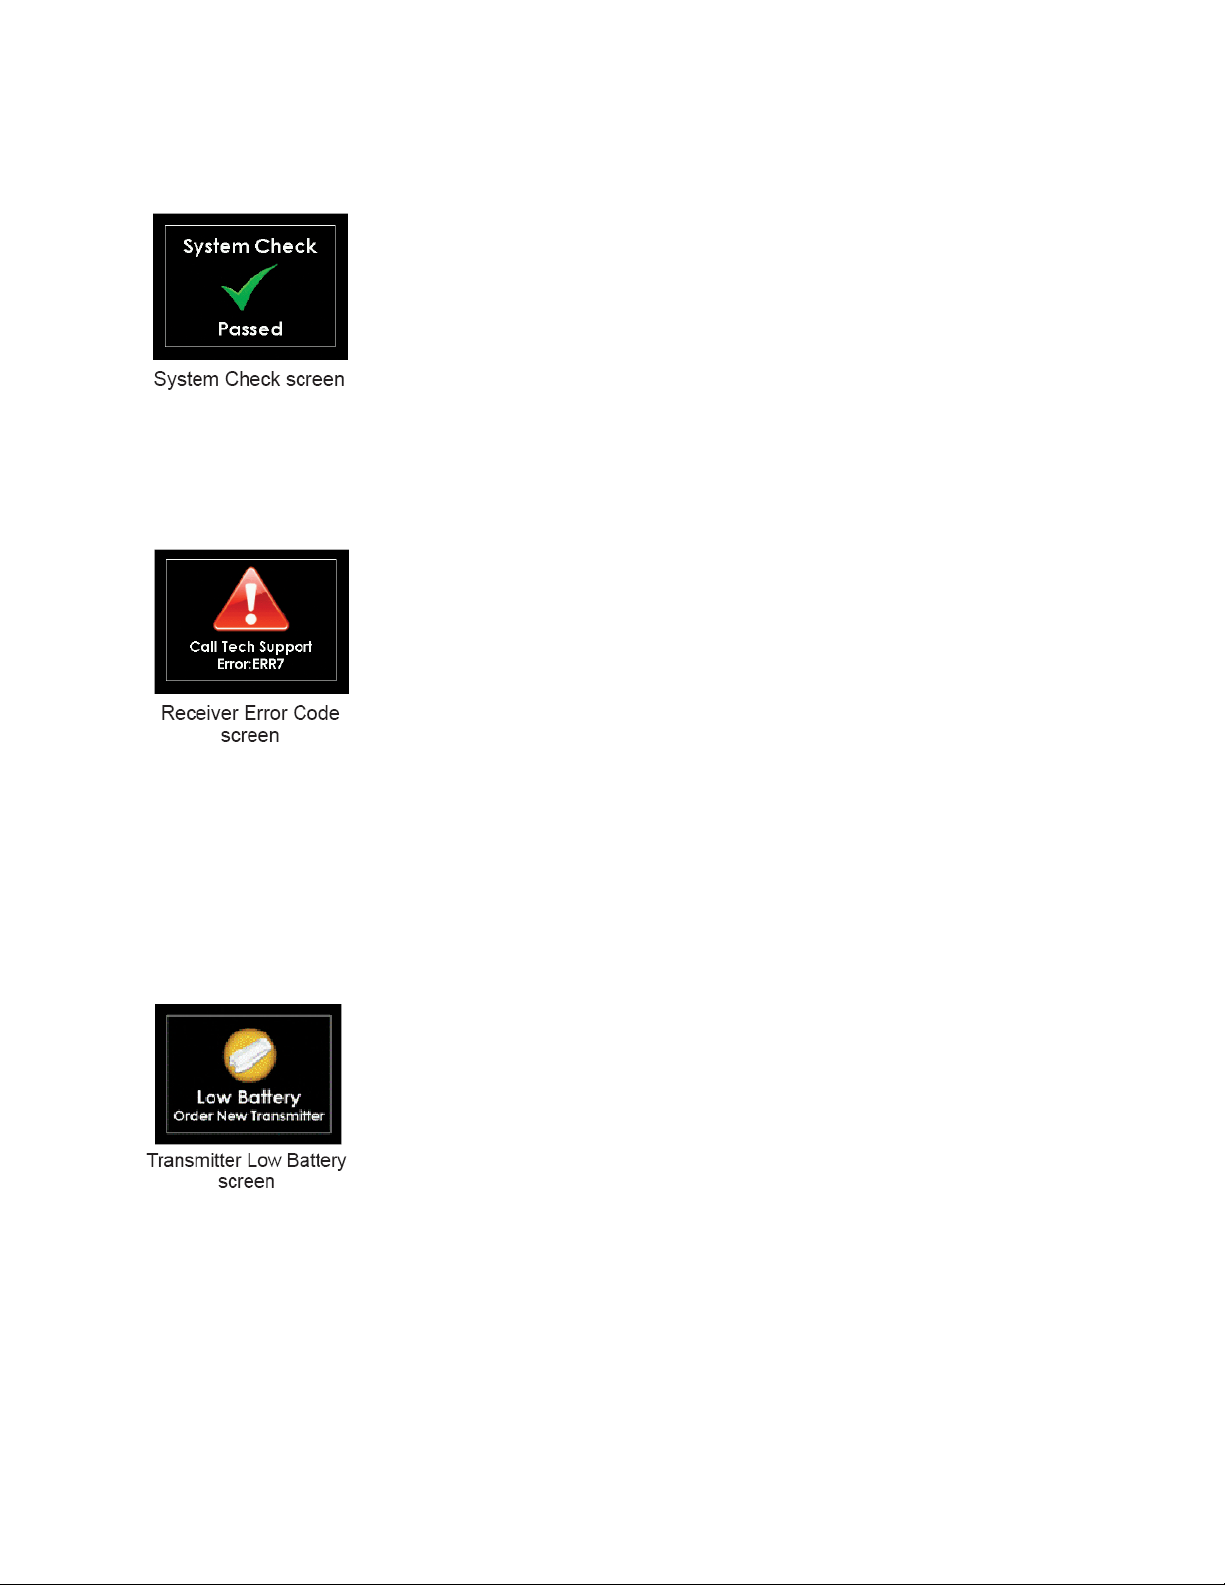
This screen means the system found an error that it was able to fix. Press the
this display, and continue your sensor session.
SELECT
button to clear
13.9.2 RECEIVER ERROR CODE
This screen shows an error code that means the receiver may not be working properly. Write down the
error code and contact Dexcom Technical Support (see Chapter 15, User Assistance). Continue to check
your blood glucose value using your blood glucose meter.
No alert sound or vibration will warn you that you are no longer getting sensor glucose readings.
13.9.3 TRANSMITTER LOW BATTERY
This screen shows when the transmitter nears the end of its battery life (see Chapter 1, Section 1.4,
Transmitter Overview). It will first show when there is about 1 week of battery life left. When the
transmitter battery drains low enough, the transmitter and receiver will stop communicating. Replace your
transmitter as soon as possible after you see this screen. Contact Dexcom Sales Support (see Chapter
15, User Assistance) to order a new transmitter.
13.9.4 TRANSMITTER FAILED
This screen means that the transmitter is not working. If you get this alert during a sensor session, your
sensor session automatically stops. Contact Dexcom Technical Support (see Chapter 15, User
Assistance). Continue to check your blood glucose value using your blood glucose meter.
81
Page 82
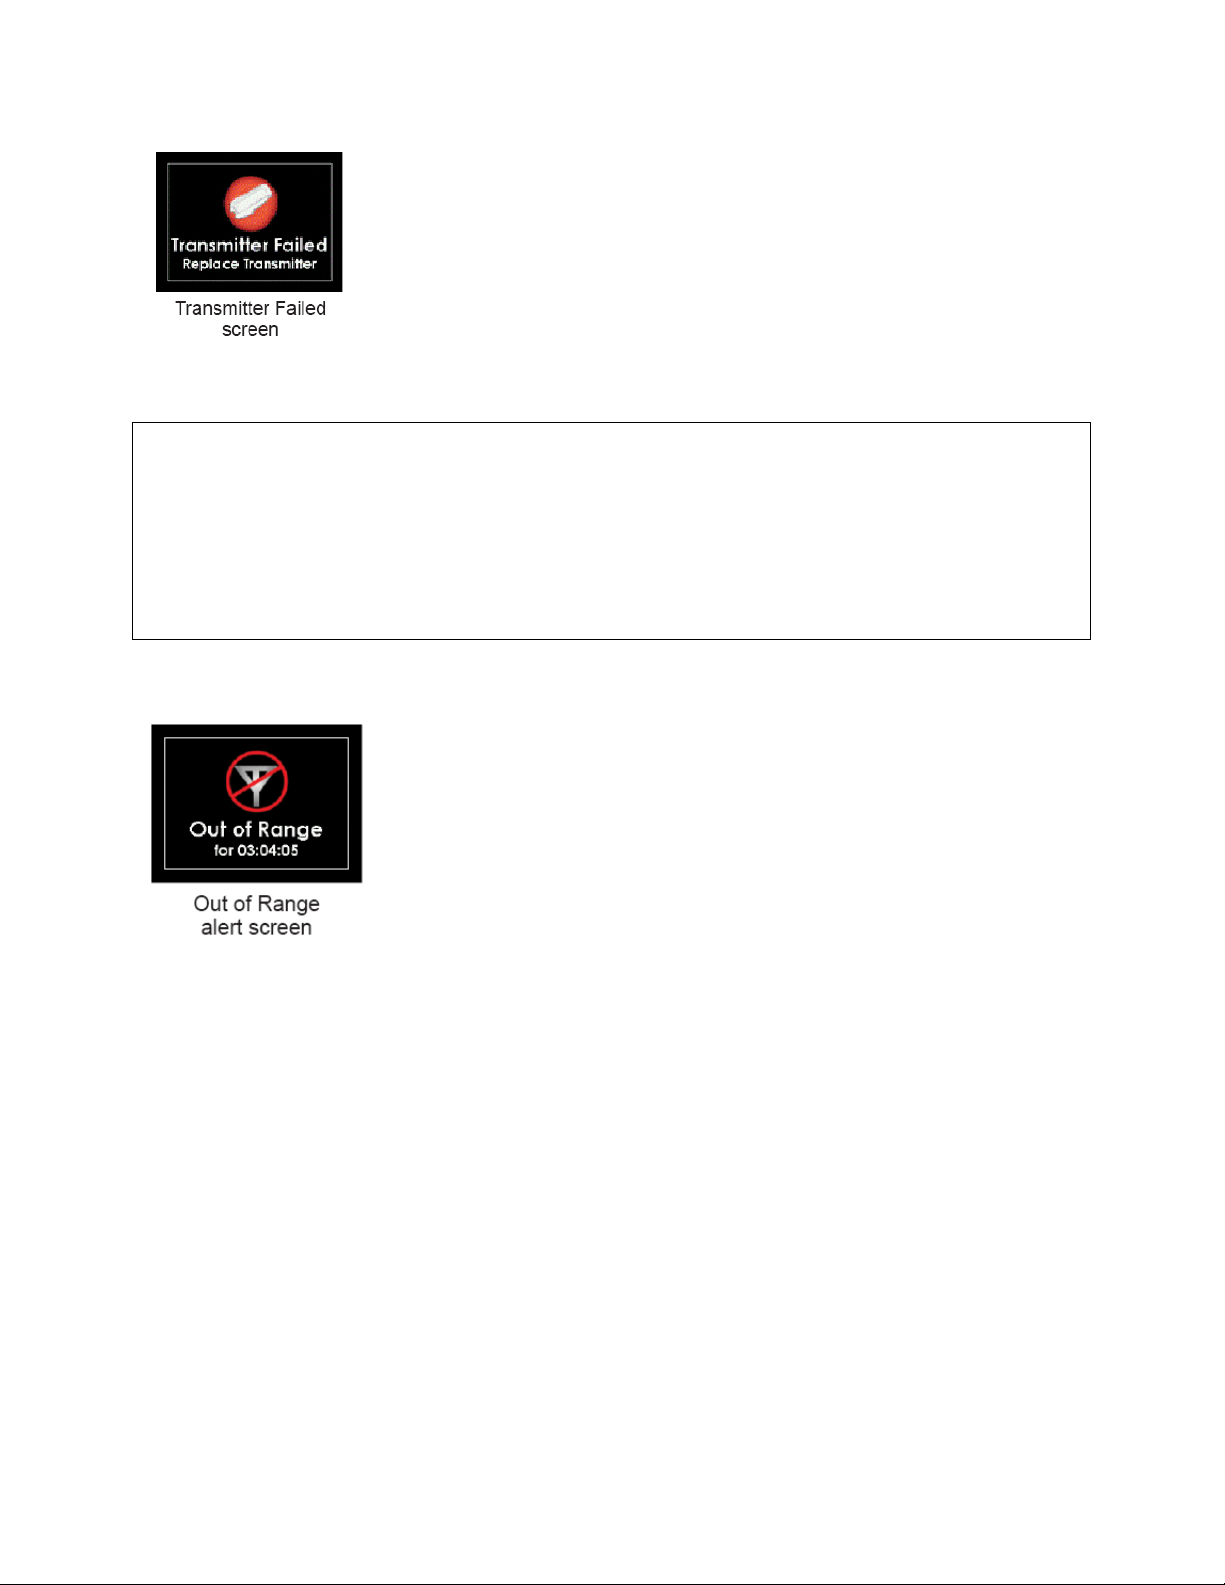
13.10 OUT OF RANGE/NO ANTENNA
PRECAUTION
The transmission range from the transmitter to the receiver is up to 20 feet without
obstruction. Wireless communication does not work well through water so the range is much
less if you are in a pool, bathtub, or on a water bed, etc. Types of obstruction differ and have
not been tested. If your transmitter and receiver are farther than 20 feet apart or are
separated by an obstruction, they might not communicate or the communication distance
may be shorter and you might miss a low or high blood glucose value.
This screen means your receiver and transmitter are not communicating and you are not getting sensor
glucose readings.
• Your receiver and transmitter only communicate when you are in an active sensor session.
• Each time you start a new sensor session, wait 10 minutes for your receiver and transmitter to start
communicating.
• You may sometimes experience loss of communication for 10 minutes at a time. This is normal.
• If you see the out of range symbol in the status area for more than 10 minutes, move your receiver
and transmitter within 20 feet of each other without obstruction. Wait 10 minutes and communication
should be restored.
• You must enter your transmitter ID correctly into your receiver to receive sensor glucose readings (see
Chapter 5, Section 5.2, The Settings Menu). Make sure you have removed your sensor and stopped your
sensor session before checking or changing your transmitter ID. “Transmitter ID” will not appear as an
option on the Settings menu during a sensor session.
If you are still having trouble getting system readings, contact Dexcom Technical Support (see Chapter
15, User Assistance).
13.11 ALERTS ARE NOT WORKING
82
Page 83

1. Make sure you have not turned off the sound and/or vibrations for the alerts. Chapter 9, Section 9.1,
Setting Your Alerts explains how to change these alert options.
2. Check that you have turned on and set the level for your advanced alerts (see Chapter 9, Section 9.2,
Advanced Alerts).
3. Remember, the first alert is vibrate only. See Chapter 18, Appendix I, Receiver Alerts, Alarm and
Prompts sequence tables for how the alerts, alarm and prompts work.
If your receiver gets wet or is dropped, make sure the speakers and vibrations still work. You can
do this with the Try It option in the Profiles menu (see Chapter 9, Section 9.3.1, Alert Profile
Options).
83
Page 84

CHAPTER 14: TECHNICAL INFORMATION
[Section 14.1 will be updated to reflect the labeling changes approved for P120005/S018]
14.1 DEVICE PERFORMANCE CHARACTERISTICS
NOTE:
understand how well the Dexcom G4 PLATINUM System performs.
The Dexcom G4 PLATINUM System (the System) uses a glucose sensor to continuously measure and
monitor your glucose levels. The sensor is “calibrated” using a commercially available blood glucose
meter; and once calibrated the System reports glucose readings up to every 5 minutes. The System was
evaluated in a clinical study in which System readings were compared to blood glucose values to assess
its performance and how well the System readings compare to a laboratory test method that measures
blood glucose values. Additionally, subjects performed self-monitoring blood glucose meter tests at home
to assess the System performance in real use environment.
Although the performance characteristics of the System are presented in the following, there is no
commonly accepted statistical approach for capturing performance of continuous glucose monitors
(CGMs), such as the Dexcom G4 PLATINUM System.
CLINICAL STUDY OVERVIEW
The System performance was evaluated in two separate prospective clinical studies: the
Receiver Software Study (
Differences between the studies include the number of subjects enrolled, the number of Systems worn by
each participant, the SMBG meter used, and the number of clinic days each subject participated in during
the study. An overview of each study is provided below. Both sets of study data are presented in the
tables that follow and are labeled as
The
Type 1 or Type 2 diabetes mellitus, and required insulin or oral medication to manage their diabetes. In
the
the
Both studies included subjects greater than 18 years of age.
We recommend that you review the information in this chapter with your healthcare provider to
Original
Original
Original
Advanced
Study, 83% of subjects had Type 1 diabetes, and 17% of subjects had Type 2 diabetes. In
SW10050
Study enrolled 72 subjects, and the
Study, 86% of subjects had Type 1 diabetes, and 14% of subjects had Type 2 diabetes.
) and the
Original
Advanced
Study or
Advanced
Receiver Software Study (
Advanced
Study from this point forward.
Study enrolled 51 subjects. All subjects had
SW10505
).
84
Page 85
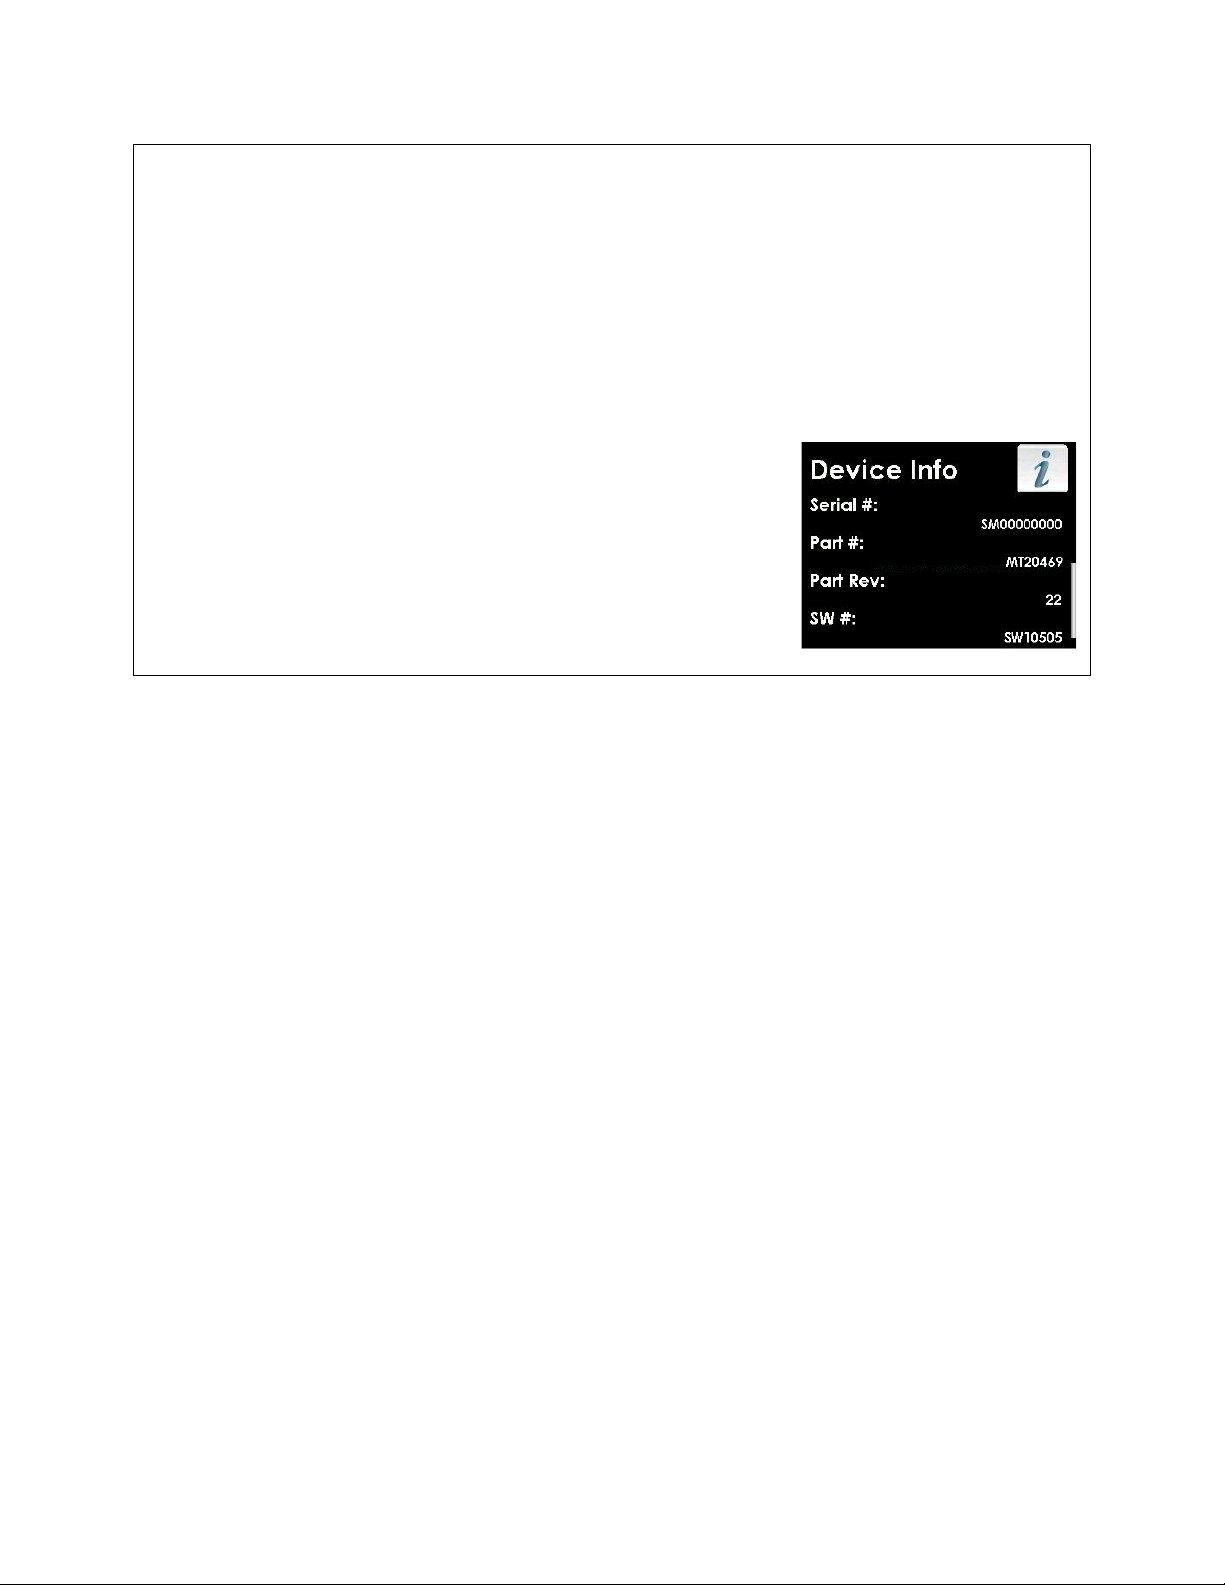
CHECKING YOUR RECEIVER SOFTWARE VERSION
CHECKING YOUR RECEIVER SOFTWARE VERSION
CHECKING YOUR RECEIVER SOFTWARE VERSION
CHECKING YOUR RECEIVER SOFTWARE VERSION
CHECKING YOUR RECEIVER SOFTWARE VERSION
CHECKING YOUR RECEIVER SOFTWARE VERSION
CHECKING YOUR RECEIVER SOFTWARE VERSION
CHECKING YOUR RECEIVER SOFTWARE VERSION
CHECKING YOUR RECEIVER SOFTWARE VERSION
CHECKING YOUR RECEIVER SOFTWARE VERSION
CHECKING YOUR RECEIVER SOFTWARE VERSION
You can check your receiver for information about your CGM system
You can check your receiver for information about your CGM system
You can check your receiver for information about your CGM system
You can check your receiver for information about your CGM system
You can check your receiver for information about your CGM system
You can check your receiver for information about your CGM system
You can check your receiver for information about your CGM system
You can check your receiver for information about your CGM system
You can check your receiver for information about your CGM system
You can check your receiver for information about your CGM system
You can check your receiver for information about your CGM system
at any time.
at any time.
at any time.
at any time.
at any time.
at any time.
at any time.
at any time.
at any time.
at any time.
at any time.
1. From the Settings menu, press the UP or DOWN button to scroll to
1. From the Settings menu, press the UP or DOWN button to scroll to
1. From the Settings menu, press the UP or DOWN button to scroll to
1. From the Settings menu, press the UP or DOWN button to scroll to
1. From the Settings menu, press the UP or DOWN button to scroll to
1. From the Settings menu, press the UP or DOWN button to scroll to
1. From the Settings menu, press the UP or DOWN button to scroll to
1. From the Settings menu, press the UP or DOWN button to scroll to
1. From the Settings menu, press the UP or DOWN button to scroll to
1. From the Settings menu, press the UP or DOWN button to scroll to
1. From the Settings menu, press the UP or DOWN button to scroll to
“Device Info.”
“Device Info.”
“Device Info.”
“Device Info.”
“Device Info.”
“Device Info.”
“Device Info.”
“Device Info.”
“Device Info.”
“Device Info.”
“Device Info.”
2. Press the SELECT button. Information about your sensor session
2. Press the SELECT button. Information about your sensor session
2. Press the SELECT button. Information about your sensor session
2. Press the SELECT button. Information about your sensor session
2. Press the SELECT button. Information about your sensor session
2. Press the SELECT button. Information about your sensor session
2. Press the SELECT button. Information about your sensor session
2. Press the SELECT button. Information about your sensor session
2. Press the SELECT button. Information about your sensor session
2. Press the SELECT button. Information about your sensor session
2. Press the SELECT button. Information about your sensor session
and system will show.
and system will show.
and system will show.
and system will show.
and system will show.
and system will show.
and system will show.
and system will show.
and system will show.
and system will show.
and system will show.
3. Scroll down to see:
3. Scroll down to see:
3. Scroll down to see:
3. Scroll down to see:
3. Scroll down to see:
3. Scroll down to see:
3. Scroll down to see:
3. Scroll down to see:
3. Scroll down to see:
3. Scroll down to see:
3. Scroll down to see:
• Serial Number
• Serial Number
• Serial Number
• Serial Number
• Serial Number
• Serial Number
• Serial Number
• Serial Number
• Serial Number
• Serial Number
• Serial Number
• Part Number
• Part Number
• Part Number
• Part Number
• Part Number
• Part Number
• Part Number
• Part Number
• Part Number
• Part Number
• Part Number
• Part Revision
• Part Revision
• Part Revision
• Part Revision
• Part Revision
• Part Revision
• Part Revision
• Part Revision
• Part Revision
• Part Revision
• Part Revision
• Software Number
• Software Number
• Software Number
• Software Number
• Software Number
• Software Number
• Software Number
• Software Number
• Software Number
• Software Number
• Software Number
• Software Revision
• Software Revision
• Software Revision
• Software Revision
• Software Revision
• Software Revision
• Software Revision
• Software Revision
• Software Revision
• Software Revision
• Software Revision
4. Press the
4. Press the
4. Press the
4. Press the
4. Press the
4. Press the
4. Press the
4. Press the
4. Press the
4. Press the
4. Press the
button to return to the Settings menu.
button to return to the Settings menu.
button to return to the Settings menu.
button to return to the Settings menu.
button to return to the Settings menu.
button to return to the Settings menu.
button to return to the Settings menu.
button to return to the Settings menu.
button to return to the Settings menu.
button to return to the Settings menu.
button to return to the Settings menu.
LEFT
LEFT
LEFT
LEFT
LEFT
LEFT
LEFT
LEFT
LEFT
LEFT
LEFT
Subjects in both studies used the System for seven days. In the
Subjects in both studies used the System for seven days. In the
Subjects in both studies used the System for seven days. In the
Subjects in both studies used the System for seven days. In the
Subjects in both studies used the System for seven days. In the
Subjects in both studies used the System for seven days. In the
Subjects in both studies used the System for seven days. In the
Subjects in both studies used the System for seven days. In the
Subjects in both studies used the System for seven days. In the
Subjects in both studies used the System for seven days. In the
Subjects in both studies used the System for seven days. In the
wore 2 sensors; in the
wore 2 sensors; in the
wore 2 sensors; in the
wore 2 sensors; in the
wore 2 sensors; in the
wore 2 sensors; in the
wore 2 sensors; in the
wore 2 sensors; in the
wore 2 sensors; in the
wore 2 sensors; in the
wore 2 sensors; in the
period, the sensor was calibrated with an average of 2 fingersticks per day (approximately once every 12
period, the sensor was calibrated with an average of 2 fingersticks per day (approximately once every 12
period, the sensor was calibrated with an average of 2 fingersticks per day (approximately once every 12
period, the sensor was calibrated with an average of 2 fingersticks per day (approximately once every 12
period, the sensor was calibrated with an average of 2 fingersticks per day (approximately once every 12
period, the sensor was calibrated with an average of 2 fingersticks per day (approximately once every 12
period, the sensor was calibrated with an average of 2 fingersticks per day (approximately once every 12
period, the sensor was calibrated with an average of 2 fingersticks per day (approximately once every 12
period, the sensor was calibrated with an average of 2 fingersticks per day (approximately once every 12
period, the sensor was calibrated with an average of 2 fingersticks per day (approximately once every 12
period, the sensor was calibrated with an average of 2 fingersticks per day (approximately once every 12
hours). In the
hours). In the
hours). In the
hours). In the
hours). In the
hours). In the
hours). In the
hours). In the
hours). In the
hours). In the
hours). In the
Advanced
Advanced
Advanced
Advanced
Advanced
Advanced
Advanced
Advanced
Advanced
Advanced
Advanced
In the
In the
In the
In the
In the
In the
In the
In the
In the
In the
In the
Original
Original
Original
Original
Original
Original
Original
Original
Original
Original
Original
days: Day 1, Day 4, and Day 7 of the 7-day wear period. In the
days: Day 1, Day 4, and Day 7 of the 7-day wear period. In the
days: Day 1, Day 4, and Day 7 of the 7-day wear period. In the
days: Day 1, Day 4, and Day 7 of the 7-day wear period. In the
days: Day 1, Day 4, and Day 7 of the 7-day wear period. In the
days: Day 1, Day 4, and Day 7 of the 7-day wear period. In the
days: Day 1, Day 4, and Day 7 of the 7-day wear period. In the
days: Day 1, Day 4, and Day 7 of the 7-day wear period. In the
days: Day 1, Day 4, and Day 7 of the 7-day wear period. In the
days: Day 1, Day 4, and Day 7 of the 7-day wear period. In the
days: Day 1, Day 4, and Day 7 of the 7-day wear period. In the
evaluated in one of the three clinic days so there are fewer data samples than in the
evaluated in one of the three clinic days so there are fewer data samples than in the
evaluated in one of the three clinic days so there are fewer data samples than in the
evaluated in one of the three clinic days so there are fewer data samples than in the
evaluated in one of the three clinic days so there are fewer data samples than in the
evaluated in one of the three clinic days so there are fewer data samples than in the
evaluated in one of the three clinic days so there are fewer data samples than in the
evaluated in one of the three clinic days so there are fewer data samples than in the
evaluated in one of the three clinic days so there are fewer data samples than in the
evaluated in one of the three clinic days so there are fewer data samples than in the
evaluated in one of the three clinic days so there are fewer data samples than in the
While using the System in the clinic, subjects had their blood glucose measured every 15 minutes with a
While using the System in the clinic, subjects had their blood glucose measured every 15 minutes with a
While using the System in the clinic, subjects had their blood glucose measured every 15 minutes with a
While using the System in the clinic, subjects had their blood glucose measured every 15 minutes with a
While using the System in the clinic, subjects had their blood glucose measured every 15 minutes with a
While using the System in the clinic, subjects had their blood glucose measured every 15 minutes with a
While using the System in the clinic, subjects had their blood glucose measured every 15 minutes with a
While using the System in the clinic, subjects had their blood glucose measured every 15 minutes with a
While using the System in the clinic, subjects had their blood glucose measured every 15 minutes with a
While using the System in the clinic, subjects had their blood glucose measured every 15 minutes with a
While using the System in the clinic, subjects had their blood glucose measured every 15 minutes with a
reliable laboratory method, the Yellow Springs Instrument 2300 STAT Plus
reliable laboratory method, the Yellow Springs Instrument 2300 STAT Plus
reliable laboratory method, the Yellow Springs Instrument 2300 STAT Plus
reliable laboratory method, the Yellow Springs Instrument 2300 STAT Plus
reliable laboratory method, the Yellow Springs Instrument 2300 STAT Plus
reliable laboratory method, the Yellow Springs Instrument 2300 STAT Plus
reliable laboratory method, the Yellow Springs Instrument 2300 STAT Plus
reliable laboratory method, the Yellow Springs Instrument 2300 STAT Plus
reliable laboratory method, the Yellow Springs Instrument 2300 STAT Plus
reliable laboratory method, the Yellow Springs Instrument 2300 STAT Plus
reliable laboratory method, the Yellow Springs Instrument 2300 STAT Plus
instrument is referred to as the “YSI.” Readings from the System were reported every 5 minutes and
instrument is referred to as the “YSI.” Readings from the System were reported every 5 minutes and
instrument is referred to as the “YSI.” Readings from the System were reported every 5 minutes and
instrument is referred to as the “YSI.” Readings from the System were reported every 5 minutes and
instrument is referred to as the “YSI.” Readings from the System were reported every 5 minutes and
instrument is referred to as the “YSI.” Readings from the System were reported every 5 minutes and
instrument is referred to as the “YSI.” Readings from the System were reported every 5 minutes and
instrument is referred to as the “YSI.” Readings from the System were reported every 5 minutes and
instrument is referred to as the “YSI.” Readings from the System were reported every 5 minutes and
instrument is referred to as the “YSI.” Readings from the System were reported every 5 minutes and
instrument is referred to as the “YSI.” Readings from the System were reported every 5 minutes and
paired with YSI values in order to characterize how well the System readings agreed with laboratory
paired with YSI values in order to characterize how well the System readings agreed with laboratory
paired with YSI values in order to characterize how well the System readings agreed with laboratory
paired with YSI values in order to characterize how well the System readings agreed with laboratory
paired with YSI values in order to characterize how well the System readings agreed with laboratory
paired with YSI values in order to characterize how well the System readings agreed with laboratory
paired with YSI values in order to characterize how well the System readings agreed with laboratory
paired with YSI values in order to characterize how well the System readings agreed with laboratory
paired with YSI values in order to characterize how well the System readings agreed with laboratory
paired with YSI values in order to characterize how well the System readings agreed with laboratory
paired with YSI values in order to characterize how well the System readings agreed with laboratory
standard blood glucose results. The remainder of the study took place at home, and the System
standard blood glucose results. The remainder of the study took place at home, and the System
standard blood glucose results. The remainder of the study took place at home, and the System
standard blood glucose results. The remainder of the study took place at home, and the System
standard blood glucose results. The remainder of the study took place at home, and the System
standard blood glucose results. The remainder of the study took place at home, and the System
standard blood glucose results. The remainder of the study took place at home, and the System
standard blood glucose results. The remainder of the study took place at home, and the System
standard blood glucose results. The remainder of the study took place at home, and the System
standard blood glucose results. The remainder of the study took place at home, and the System
standard blood glucose results. The remainder of the study took place at home, and the System
performance was also paired with the comparative meter results, referred to as the “SMBG.”
performance was also paired with the comparative meter results, referred to as the “SMBG.”
performance was also paired with the comparative meter results, referred to as the “SMBG.”
performance was also paired with the comparative meter results, referred to as the “SMBG.”
performance was also paired with the comparative meter results, referred to as the “SMBG.”
performance was also paired with the comparative meter results, referred to as the “SMBG.”
performance was also paired with the comparative meter results, referred to as the “SMBG.”
performance was also paired with the comparative meter results, referred to as the “SMBG.”
performance was also paired with the comparative meter results, referred to as the “SMBG.”
performance was also paired with the comparative meter results, referred to as the “SMBG.”
performance was also paired with the comparative meter results, referred to as the “SMBG.”
Original
Original
Original
Original
Original
Original
Original
Original
Original
Original
Original
Study, subjects used Bayer's CONTOUR® NEXT USB meter.
Study, subjects used Bayer's CONTOUR® NEXT USB meter.
Study, subjects used Bayer's CONTOUR® NEXT USB meter.
Study, subjects used Bayer's CONTOUR® NEXT USB meter.
Study, subjects used Bayer's CONTOUR® NEXT USB meter.
Study, subjects used Bayer's CONTOUR® NEXT USB meter.
Study, subjects used Bayer's CONTOUR® NEXT USB meter.
Study, subjects used Bayer's CONTOUR® NEXT USB meter.
Study, subjects used Bayer's CONTOUR® NEXT USB meter.
Study, subjects used Bayer's CONTOUR® NEXT USB meter.
Study, subjects used Bayer's CONTOUR® NEXT USB meter.
Study, all subjects were evaluated in a controlled clinic environment on all three clinic
Study, all subjects were evaluated in a controlled clinic environment on all three clinic
Study, all subjects were evaluated in a controlled clinic environment on all three clinic
Study, all subjects were evaluated in a controlled clinic environment on all three clinic
Study, all subjects were evaluated in a controlled clinic environment on all three clinic
Study, all subjects were evaluated in a controlled clinic environment on all three clinic
Study, all subjects were evaluated in a controlled clinic environment on all three clinic
Study, all subjects were evaluated in a controlled clinic environment on all three clinic
Study, all subjects were evaluated in a controlled clinic environment on all three clinic
Study, all subjects were evaluated in a controlled clinic environment on all three clinic
Study, all subjects were evaluated in a controlled clinic environment on all three clinic
Advanced
Advanced
Advanced
Advanced
Advanced
Advanced
Advanced
Advanced
Advanced
Advanced
Advanced
Study, subjects used the LifeScan
Study, subjects used the LifeScan
Study, subjects used the LifeScan
Study, subjects used the LifeScan
Study, subjects used the LifeScan
Study, subjects used the LifeScan
Study, subjects used the LifeScan
Study, subjects used the LifeScan
Study, subjects used the LifeScan
Study, subjects used the LifeScan
Study, subjects used the LifeScan
Study, all subjects wore 1 sensor only. Throughout the 7-day wear
Study, all subjects wore 1 sensor only. Throughout the 7-day wear
Study, all subjects wore 1 sensor only. Throughout the 7-day wear
Study, all subjects wore 1 sensor only. Throughout the 7-day wear
Study, all subjects wore 1 sensor only. Throughout the 7-day wear
Study, all subjects wore 1 sensor only. Throughout the 7-day wear
Study, all subjects wore 1 sensor only. Throughout the 7-day wear
Study, all subjects wore 1 sensor only. Throughout the 7-day wear
Study, all subjects wore 1 sensor only. Throughout the 7-day wear
Study, all subjects wore 1 sensor only. Throughout the 7-day wear
Study, all subjects wore 1 sensor only. Throughout the 7-day wear
®
®
®
®
®
®
®
®
®
®
®
Original
Original
Original
Original
Original
Original
Original
Original
Original
Original
Original
OneTouch® Ultra®2 meter and in the
OneTouch® Ultra®2 meter and in the
OneTouch® Ultra®2 meter and in the
OneTouch® Ultra®2 meter and in the
OneTouch® Ultra®2 meter and in the
OneTouch® Ultra®2 meter and in the
OneTouch® Ultra®2 meter and in the
OneTouch® Ultra®2 meter and in the
OneTouch® Ultra®2 meter and in the
OneTouch® Ultra®2 meter and in the
OneTouch® Ultra®2 meter and in the
Advanced
Advanced
Advanced
Advanced
Advanced
Advanced
Advanced
Advanced
Advanced
Advanced
Advanced
Study, thirty-six subjects each
Study, thirty-six subjects each
Study, thirty-six subjects each
Study, thirty-six subjects each
Study, thirty-six subjects each
Study, thirty-six subjects each
Study, thirty-six subjects each
Study, thirty-six subjects each
Study, thirty-six subjects each
Study, thirty-six subjects each
Study, thirty-six subjects each
Study, subjects were
Study, subjects were
Study, subjects were
Study, subjects were
Study, subjects were
Study, subjects were
Study, subjects were
Study, subjects were
Study, subjects were
Study, subjects were
Study, subjects were
Study.
Study.
Study.
Study.
Study.
Study.
Study.
Study.
Study.
Study.
Original
Original
Original
Original
Original
Original
Original
Original
Original
Original
Original
™
™
™
™
™
™
™
™
™
™
™
Glucose Analyzer. This
Glucose Analyzer. This
Glucose Analyzer. This
Glucose Analyzer. This
Glucose Analyzer. This
Glucose Analyzer. This
Glucose Analyzer. This
Glucose Analyzer. This
Glucose Analyzer. This
Glucose Analyzer. This
Glucose Analyzer. This
Study.
85
85
85
85
85
85
85
85
85
85
85
Page 86
Table 1. System Agreement to YSI within CGM Glucose Ranges
CGM
Glucose
Range 1
(mg/dL)
Overall
40-60
61-80
81-180
181-300
301-350
Number of
2
Study
paired
CGM-YSI
Percent
within
15/15%
YSI
Percent
within
20/20%
YSI
Percent
within
30/30%
YSI
Original 9152 71% 82% 92% 3%
Advanced 2263 86% 93% 98% 1%
Original 512 67% 78% 88% 6%
Advanced 120 89% 94% 98% 0%
Original 781 73% 85% 94% 2%
Advanced 226 91% 96% 99% 0%
Original 3853 67% 78% 91% 3%
Advanced 738 84% 92% 98% 1%
Original 2784 72% 84% 93% 4%
Advanced 798 86% 93% 98% 1%
Original 775 82% 91% 97% 2%
Advanced 229 86% 94% 98% 1%
Percent
Greater than
40/40%
YSI
Original 447 74% 84% 91% 5%
351-400
Advanced 152 80% 92% 97% 0%
1
CGM readings are within 40-400 mg/dL, inclusive.
2
Both sets of study data are presented and are labeled as
Original
(SW10050) or
Advanced
(SW10505).
AGREEMENT RELATIVE TO YSI
Agreement between the System and blood glucose values is characterized using paired System and YSI
values. The System and YSI results were compared by pairing the YSI blood glucose value to a System
glucose reading that occurred immediately after the YSI was collected.
The agreement of the System to blood glucose value was assessed by calculating the percentage of
System readings that were within 15%, 20%, 30% and greater than 40% of the YSI values. For readings
less than or equal to 80 mg/dL the absolute difference in mg/dL between the two glucose results was
calculated. For values greater than 80 mg/dL the absolute percent difference (%) from the YSI values was
calculated. The percentages of total readings within 15 mg/dL or 15%, 20 mg/dL or 20%, 30 mg/dL or
30% or greater than 40 mg/dL or 40% were then calculated in Table 1. TABLE 1 IS CATEGORIZED
WITHIN CGM GLUCOSE RANGES. WHEN YOU SEE A CGM READING ON YOUR RECEIVER, THIS
TABLE SHOWS YOU HOW LIKELY THAT READING MATCHES YOUR BLOOD GLUCOSE LEVEL
(MEASURED BY YSI IN THE STUDY).
Original Study (SW10050)
these, 82% of the System readings fall within ± 20 mg/dL of the YSI blood glucose values ≤ 80 mg/dL and
within ± 20% of YSI blood glucose values > 80 mg/dL.
: The total number of data pairs considered in the analysis was 9152. Of
86
Page 87
Advanced Study (SW10505)
: The total number of data pairs considered in the analysis was 2263. Of
these, 93% of the System readings fall within ± 20 mg/dL of the YSI blood glucose values ≤ 80 mg/dL and
within ± 20% of YSI blood glucose values > 80 mg/dL.
Table 2. Number and Percentage of YSI Values When CGM Readings are “Low” or
“High”
YSI mg/dL
Readings
YSI mg/dL
Readings
CGM
“LOW”
CGM
1
Study
Original
Advanced
1
Study
CGM-YSI pairs > 340 > 320 > 280 > 240 ≤ 240
Total
CGM-YSI pairs < 55 < 60 < 70 < 80 ≥ 80
n 66 84 123 142 13 155
Cumulative Percent 42% 54% 79% 92% 8%
n 11 16 17 18 0 18
Cumulative Percent 61% 89% 94% 100% 0%
Total
n 189 220 238 246 2 248
Original
Cumulative Percent 76% 89% 96% 99% 1%
“HIGH”
n 40 43 45 45 0 45
Advanced
Cumulative Percent 89% 96% 100% 100% 0%
1
Both sets of study data are presented and are labeled as
Original
(SW10050) or
Advanced
(SW10505).
Agreement When CGM Reads “LOW” or “HIGH”
The System reports glucose readings between 40 and 400 mg/dL. When the System determines the glucose
reading is below 40 mg/dL, it displays “LOW” in the Receiver Status Box. When the Dexcom G4 PLATINUM
System determines that the glucose level is above 400 mg/dL, it displays “HIGH” in the Receiver Status
Box. Because the System does not display glucose values below 40 mg/dL or above 400 mg/dL, the
comparisons to the actual blood glucose levels (as determined by the YSI analyzer) when CGM is classified
as “LOW” or “HIGH” are included separately in Table 2. The table includes the numbers and the cumulative
percentages when YSI values were less than certain glucose levels (for “LOW”), and when YSI values were
greater than certain glucose levels (for “HIGH”).
ORIGINAL STUDY (SW10050)
155) of the YSI values were less than 80 mg/dL, and only 79% (123 out of 155) of the YSI values were less
than 70 mg/dL. When the System displayed “HIGH” (248 occasions), 99% (246 out of 248) of the YSI values
were greater than 240 mg/dL, and 96% (238 out of 248) of the YSI values were greater than 280 mg/dL.
: WHEN the System displayed “LOW” (155 occasions), 92% (142 out of
ADVANCED STUDY (SW10505)
: When the System displayed “LOW” (18 occasions), 100% (18 out of 18)
of the YSI values were less than 80 mg/dL, and 94% (17 out of 18) of the YSI values were less than 70
mg/dL. When the System displayed “HIGH” (45 occasions), 100% (45 out of 45) of the YSI values were
greater than 240 mg/dL, and 100% (45 out of 45) of the YSI values were greater than 280 mg/dL.
87
Page 88
Table 3-A. Concurrence of CGM Readings and YSI Values (Original Study)
YSI (mg/dL)
Row percentage of matched pairs in each CGM glucose range
CGM
(mg/dL)
< 40 40-60 61-80 81-120 121-160
< 40 6% 48% 37% 7% 1% 0% 0% 0% 0% 0% 0% 155
40-60 4% 49% 36% 11% 1% 0% 0% 0% 0% 0% 0% 512
61-80 0% 22% 51% 24% 1% 0% 0% 0% 0% 0% 0% 781
81-120 0% 2% 17% 66% 13% 1% 0% 0% 0% 0% 0% 1706
121-160 0% 0% 1% 25% 60% 13% 2% 0% 0% 0% 0% 1492
161-200 0% 0% 0% 2% 28% 53% 16% 2% 0% 0% 0% 1240
201- 250 0% 0% 0% 0% 3% 21% 51% 21% 3% 1% 0% 1181
251- 300 0% 0% 0% 0% 0% 4% 19% 49% 24% 3% 0% 1018
161-200 201-250 251-300 301-350
351-400 > 400
Number of
Paired
CGM-YSI
301- 350 0% 0% 0% 0% 0% 0% 3% 28% 51% 16% 1% 775
351- 400 0% 0% 0% 0% 0% 0% 3% 10% 43% 38% 7% 447
> 400 0% 0% 0% 0% 0% 0% 1% 6% 21% 57% 15% 248
88
Page 89
Table 3-B. Concurrence of CGM Readings and YSI Values (Advanced Study)
YSI (mg/dL)
Row percentage of matched pairs in each CGM glucose range
CGM
(mg/dL)
< 40 40-60 61-80 81-120 121-160
< 40 6% 83% 11% 0% 0% 0% 0% 0% 0% 0% 0% 18
40-60 2% 74% 22% 3% 0% 0% 0% 0% 0% 0% 0% 120
61-80 0% 19% 68% 13% 0% 0% 0% 0% 0% 0% 0% 226
81-120 0% 0% 19% 72% 8% 1% 0% 0% 0% 0% 0% 347
121-160 0% 0% 0% 17% 72% 11% 0% 0% 0% 0% 0% 246
161-200 0% 0% 0% 0% 25% 59% 16% 0% 0% 0% 0% 286
201- 250 0% 0% 0% 0% 0% 16% 70% 13% 1% 0% 0% 376
161-200 201-250 251-300 301-350
351-400 > 400
Number of
Paired
CGM-YSI
251- 300 0% 0% 0% 0% 0% 2% 16% 61% 14% 7% 0% 281
301- 350 0% 0% 0% 0% 0% 0% 2% 28% 59% 10% 1% 229
351- 400 0% 0% 0% 0% 0% 0% 0% 4% 47% 45% 5% 152
> 400 0% 0% 0% 0% 0% 0% 0% 0% 20% 38% 42% 45
Concurrence of System and Laboratory Reference
Tables 3-A and 3-B are categorized by ranges of CGM glucose readings. This table describes, for each
range of CGM glucose readings, what percentage of paired YSI values were in the same glucose range
(shaded) or in glucose ranges above and below the paired CGM readings. For example, based on the
Advanced
levels are within 81 to 120 mg/dL 72% of time.
study, when CGM readings are within 81 to 120 mg/dL, you can expect your blood glucose
89
Page 90

Accuracy Relative to YSI
Accuracy between matched pairs was also estimated by calculating the percent difference between the
System reading and the YSI value. For example, if the YSI value is 100 mg/dL and the System reading is 90
mg/dL, a 10% difference between the System and the YSI is reported. The System and YSI values were
compared by pairing the System reading that fell immediately after the YSI value was collected.
In the example above, the System reading is less than the YSI value, so the percent difference reading is
negative. The mean percent difference is the average of all positive and negative percent differences
between the two devices; it tells you if the System reads higher or lower on average than the YSI within
each glucose range.
Another estimate used to show the accuracy of the System is the absolute percent difference. The absolute
percent difference tells you the percent difference or “distance” between the System and YSI values, but
does not tell you whether the System is reading, on average, higher or lower than the YSI laboratory
standard. The mean absolute percent difference is the average “distance” (regardless if positive or negative)
between System readings and YSI values.
Accuracy measures in differences for both the
2263 paired glucose results, respectively; the data are summarized in Table 4. Table 4 is categorized within
CGM glucose ranges.
Original Study (SW10050)
Difference) than the reference and 13.3% absolute different (Mean Absolute Difference) than the reference
values. The Median Percent Difference shows that half of the time the System reads 1.7% or less than the
YSI blood glucose values and the Median Absolute Percent Difference shows that half of the time the
System reads about 9.8% or less than the YSI blood glucose values.
Advanced Study (SW10505)
Difference) than the reference and 9.0% absolute different (Mean Absolute Difference) than the reference
values. The Median Percent Difference shows that half of the time the System reads 2.4% or less than the
YSI blood glucose values and the Median Absolute Percent Difference shows that half of the time the
System reads about 7.0% or less than the YSI blood glucose values.
: Overall, on average, the System reads 2.9% different (Mean Percent
: Overall, on average, the System reads 2.5% different (Mean Percent
Original
and
Advanced
Studies are based on 9152 and
90
Page 91
Table 4. System Difference to YSI within CGM Glucose Ranges
CGM
Glucose
Ranges1
(mg/dL)
Overall
*40-60
*61-80
81-180
181-300
Receiver
Software
2
Original 9152
Number of
Paired CGM-
YSI
Mean Percent
Difference
2.9%
Median
Percent
Difference
1.7%
Mean
Absolute
Percent
Difference
13.3%
Median
Absolute
Percent
Difference
9.8%
Advanced 2263 2.5% 2.4% 9.0% 7.0%
Original 512
-10.0
Advanced 120 -3.3 -2.1
Original 781
-2.4 -0.4 11.4 8.6
-8.2
13.5 9.7
6.9 4.8
Advanced 226 0.8 1.4 6.7 5.4
Original 3853
4.8%
Advanced 738 3.9% 4.1%
Original 2784
2.1%
3.0%
0.0%
13.8% 9.8%
9.6% 8.2%
11.9% 9.2%
Advanced 798 0.6% 0.4% 8.0% 6.1%
Original 775
3.8%
2.8%
9.8% 7.9%
301-350
Advanced 229 4.1% 3.4% 8.0% 5.8%
Original 447 10.4% 7.7% 12.8% 9.1%
351-400
Advanced 152 7.2% 6.3% 9.2% 7.2%
1
CGM readings are within 40 to 400 mg/dL, inclusive.
2
Both sets of study data are presented and are labeled as
* For CGM ≤ 80 mg/dL, the difference and absolute difference in mg/dL are included instead of percent differences (%).
Original
(SW10050) or
Advanced
(SW10505).
91
Page 92

Low and High Glucose Alerts
The ability of the System to detect high and low glucose levels is assessed by comparing System results to
YSI results at low and high blood glucose levels and determining if the alert may have sounded. The System
and YSI values were compared by pairing the System reading that occurred immediately after the YSI value
was collected. We suggest that you ask your doctor what alert settings would be best for you.
The Low Glucose Alert
Estimates of how well the adjustable Low Glucose Alert performs are presented in Table 5.
Hypoglycemia Alert Rate
The Alert Rate shows how often the alert is right or wrong. The True Alert Rate is the % of time the device
alarmed when the blood glucose level was at or below the alert setting within 15 minutes before or after the
device alarmed. The False Alert Rate is the % of time the device alarmed when the blood glucose level was
above the alert setting within 15 minutes before or after the device alarmed.
For example, if you set the Low Glucose Alert to 70 mg/dL and your alarm sounds, how often can you
expect your blood sugar to actually be low? Based on the
expect your blood sugar to be below 70 mg/dL approximately 79% of the time and not be below 70 mg/dL
approximately 21% of the time within the 15 minute period before or after your alarm sounds. Based on the
ADVANCED
approximately 92% of the time and not be below 70 mg/dL approximately 8% of the time within the 15
minute period before or after your alarm sounds.
Hypoglycemia Detection Rate
The Detection Rate shows how often the device recognizes and alerts you to an episode of hypoglycemia or
how often it misses such an event. The Hypoglycemia Detection Rate is the % of time the blood glucose
level was at or below the alert setting and device alarmed within 15 minutes before or after the blood
glucose was at or below the alert settings. The Hypoglycemia Missed Detection Rate is the % of time the
blood glucose was at or below the alert setting, but the device did not alarm within 15 minutes before or
after the blood glucose was at or below the alert setting.
Study, if your alarm sounds, you can expect your blood sugar to be below 70 mg/dL
ORIGINAL
Study, if your alarm sounds, you can
For example, if you set the Low Glucose alert to 70 mg/dL, how often will your alarm alert you if your blood
glucose goes below 70 mg/dL? Based on the
you can expect your alarm to sound 83% of the time and not to sound approximately 17% of time within
the 15 minute period before or after your blood sugar goes below 70 mg/dL. Based on the
Study, if your blood sugar goes below 70 mg/dL, you can expect your alarm to sound 91% of the time and
not to sound approximately 9% of time within the 15 minute period before or after your blood sugar goes
below 70 mg/dL.
ORIGINAL
Study, if your blood sugar goes below 70 mg/dL,
ADVANCED
92
Page 93
Table 5. Hypoglycemic Alert Evaluation
Hypoglycemic
Alert Level
(mg/dL)
55
60
70
80
90
Receiver
Software1
True
Alert
Rate
False
Alert
Rate
Hypoglycemia
Detection Rate
Hypoglycemia
Missed Detection
Rate
Original 50% 50% 71% 29%
Advanced
Original
71% 29% 68% 32%
64% 36% 75% 25%
Advanced 85% 15% 83% 17%
Original 79% 21% 83% 17%
Advanced 92% 8% 91% 9%
Original 87% 13% 86% 14%
Advanced 95% 5% 90% 10%
Original 90% 10% 89% 11%
Advanced 96% 4% 94% 6%
1
Both sets of study data are presented and are labeled as
Original
(SW10050) or
Advanced
(SW10505).
93
Page 94

The High Glucose Alert
Estimates of how well the adjustable High Glucose Alert performs are presented in Table 6.
Hyperglycemia Alert Rate
The Alert Rate shows how often the alert is right or wrong. The True Alert Rate is the % of time the device
alarmed when the blood glucose level was at or above the alert setting within 15 minutes before or after the
device alarmed. The False Alert Rate is the % of time the device alarmed when the blood glucose level was
below the alert setting within 15 minutes before or after the device alarmed.
For example, if you set the High Glucose alert to 200 mg/dL and your alarm sounds, how often can you
expect your blood sugar to actually be high? Based on the
expect your blood sugar to be at or above 200 mg/dL approximately 92% of the time and not be above 200
mg/dL approximately 8% of the time within the 15 minute period before or after your alarm sounds. Based
on the
ADVANCED
mg/dL approximately 96% of the time and not be above 200 mg/dL approximately 4% of the time within the
15 minute period before or after your alarm sounds.
Hyperglycemia Detection Rate
The Detection Rate shows how often the device recognizes and alerts you to an episode of hyperglycemia
or how often it misses such an event. The Hyperglycemia Detection Rate is the % of time the blood glucose
level was at or above the alert setting and the device alarmed within 15 minutes before or after the blood
glucose was at or above the alert settings. The Hyperglycemia Missed Detection Rate is the % of time the
blood glucose was at or above the alert setting, but the device did not alarm within 15 minutes before or
after the blood glucose was at or above the alert setting.
For example, if you set your High Glucose alert to 200 mg/dL, how often will your alarm alert you if your blood
glucose goes at or above 200 mg/dL? Based on the
mg/dL, you can expect your alarm to sound 97% of the time and not to sound approximately 3% of time
within the 15 minute period before or after your blood sugar goes above 200 mg/dL. Based on the
Study, if your blood sugar goes above 200 mg/dL, you can expect your alarm to sound 98% of the time and
not to sound approximately 2% of time within the 15 minute period before or after your blood sugar goes above
200 mg/dL.
ORIGINAL
Study, if your alarm sounds, you can expect your blood sugar to be at or above 200
ORIGINAL
Study, if your alarm sounds, you can
Study, if your blood sugar goes above 200
ADVANCED
94
Page 95
Table 6. Hyperglycemic Alert Evaluation
Hyperglycemic
Alert Level
(mg/dL)
Study
1
True
Alert
Rate
False
Alert
Rate
Original 95% 5% 98% 2%
120
Advanced 98% 2% 100% 0%
Original 94% 6% 97% 3%
140
Advanced 97% 3% 99% 1%
Original 92% 8% 97% 3%
180
Advanced 97% 3% 99% 1%
Original 92% 8% 97% 3%
200
Advanced 96% 4% 98% 2%
Original 91% 9% 95% 5%
220
Advanced 94% 6% 98% 2%
Original 91% 9% 94% 6%
240
Advanced 93% 7% 95% 5%
Original 82% 18% 86% 14%
300
Advanced 86% 14% 90% 10%
1
Both sets of study data are presented and are labeled as
Hyperglycemia
Detection Rate
Original
(SW10050) or
Hyperglycemia
Missed Detection
Rate
Advanced
(SW10505).
95
Page 96
Table 7. Percentage of System Readings
2-Hour Increments after Calibration
Time from
Calibration
0-2 hours
2-4 hours
4-6 hours
6-8 hours
8-10 hours
Percent
within
15/15%
YSI
Number of
Study2
paired
CGM-YSI
Original 1929 78% 88% 96% 2%
Advanced 469 93% 97% 99% 0%
Original 1516 69% 81% 91% 4%
Advanced 389 90% 97% 99% 0%
Original 1547 69% 79% 91% 5%
Advanced 383 85% 91% 97% 2%
Original 1520 68% 79% 92% 3%
Advanced 380 79% 90% 97% 2%
Original 1555 71% 82% 92% 4%
Advanced 347 83% 92% 98% 0%
Percent
within
20/20%
YSI
1
within YSI Values with Data Stratified in
Percent
within
30/30%
YSI
Percent
greater
than
40/40%
YSI
Original 1068 65% 77% 91% 4%
10-12 hours
Advanced 295 80% 90% 98% 0%
Original 17 65% 76% 82% 12%
12-14 hours
Advanced 0 -- -- -- --
1
CGM readings are within 40 to 400 mg/dL, inclusive.
2
Both sets of study data are presented and are labeled as
Original
(SW10050) or
Advanced
(SW10505).
Calibration Stability
The System must be calibrated every 12 hours. To demonstrate performance of the System over a 12-hour
calibration period, Systems were evaluated to verify that performance remains consistent over the 12-hour
calibration period. Systems were evaluated in 2-hour increments after calibration. Performance was
estimated at each 2-hour interval and stratified by glucose values by calculating the percentage of System
readings within 15 mg/dL or 15%, 20 mg/dL or 20%, 30 mg/dL or 30%, 40 mg/dL or 40% and greater than
40 mg/dL or 40% of the YSI values in Table 7.
96
Page 97
Table 8. Sensor Stability (Accuracy
1
over Time)
Day of
Wear
Study2
Number of
paired CGM-
YSI
Mean Absolute
Percent
Differences
Median
Absolute
Percent
Differences
Percent
within
15/15%
YSI
Percent
within
20/20%
YSI
Percent
within
30/30%
YSI
Percent
greater
than
40/40% YSI
Original 3023 16.7% 13.2% 59% 71% 86% 6%
Day 1
Advanced 680 10.7% 7.9% 77% 84% 96% 2%
Original 3108 11.4% 8.2% 77% 87% 95% 2%
Day 4
Advanced 777 8.0% 6.4% 89% 96% 99% 0%
Original 3021 11.9% 8.9% 76% 87% 95% 2%
Day 7
Advanced 806 8.5% 7.2% 90% 97% 99% 0%
1
CGM readings are within 40 to 400 mg/dL, inclusive.
2
Both sets of study data are presented and are labeled as
Sensor Stability
Original
(SW10050) or
Advanced
(SW10505).
Sensors can be worn for up to 7 days. To verify sensor performance over time, 72 subjects were evaluated
with the
Original
Advanced
System across the 7-day wear period while 50 subjects were evaluated with the
System across the 7-day wear period. Performance was estimated by calculating the percentage
of System readings within 15 mg/dL or 15%, 20 mg/dL or 20%, 30 mg/dL or 30% , 40 mg/dL or 40% and
greater than 40 mg/dL or 40% of the YSI values at the beginning (Day 1), middle (Day 4) and end (Day 7) of
the System lifecycle. The average and median of the absolute percent differences are included in Table 8
showing consistent accuracy and sensor stability over the 7-day life of the sensor.
Precision of System Readings
In the
Original
Study, 36 subjects wore two Systems. This was to look at how similarly two Systems
function on the same subject (sensor precision). Precision was evaluated by comparing the glucose
readings from the two Systems worn on the same subject at the same time. Results showed that System
readings from the two sensors generally agreed with each other within 9% (absolute percent difference) with
a 7% coefficient of variation. Only one System was worn in the
Advanced
Study so precision data was not
collected in this study.
Sensor Life
Sensors may be worn for up to 7 days (168 hours). To estimate how long a sensor will work over 7 days,
108 sensors were evaluated with the
Original
Study to determine how many days/hours of readings each
sensor provided. Ninety-four percent (94%) of the sensors lasted until Day 7 (145-168 hours). There were 6
(6%) sensors that ended early, four of which lasted more than 3 days.
For the
Advanced
Study, 51 sensors were evaluated to determine how many days/hours of readings each
sensor provided. Ninety-eight percent (98%) of the sensors lasted until Day 7 (145-168 hours). There was 1
(2%) sensor that ended early, which lasted until day 5 of the sensor wear.
97
Page 98
Table 9. Number of Readings Provided by Each Sensor Over 7-Days
% of Total Possible
Readings Provided
0-25%
Study1
Original
Total Readings
Provided (Min-
Max)
167-491
% of Systems Providing that
Number of Readings
Advanced 0 0%
Original
26-50%
Advanced
Original
51-75%
Advanced
Original
76-100%
Advanced
1
BOTH SETS OF STUDY DATA ARE PRESENTED AND ARE LABELED AS
ADVANCED
(SW10505).
719-914
856-856 2%
1267-1267
1253-1253 2%
1811-1992
1497-1992 96%
Table 10. System Readings Within Wear Days
Statistic Study1 Day 1 Day 2 Day 3 Day 4 Day 5 Day 6 Day 7
2%
4%
1%
94%
ORIGINAL
All
Days
(SW10050) OR
2
Original 98% 98% 98% 98% 97% 99% 95% 97%
Mean
Advanced 98% 99% 98% 98% 96% 99% 97% 98%
Original 100% 100% 100% 100% 100% 100% 100% 100%
Median
Advanced 99% 100% 100% 100% 100% 100% 100% 100%
Original 5% 3% 9% 8% 10% 3% 11% 8%
STD
Advanced 3% 2% 8% 11% 15% 2% 13% 9%
1
Both sets of study data are presented and are labeled as
2
A total of 108 sensors were included with the
Study.
Number of Readings Provided
Original
Original
Study and 51 sensors were included with the
(SW10050) or
Advanced
(SW10505).
Advanced
The System is capable of providing a reading up to every 5 minutes, or up to 288 readings per day. For a
variety of reasons, the System may not display a glucose reading and readings are “skipped.” Table 9
estimates the number of readings you can expect to receive from the System over the entire 7-day period
after calibration. For the
Original
Study, 94% of Systems provided between 1,811 and 1,992 valid glucose
readings (or more than 75% of the expected number of readings). Adjusted within each system wear-day,
the
Original
System provided an average of 97% of all expected glucose readings (288) as seen in Table
10.
For the
Advanced
Study (SW10505), 96% of Systems provided between 1,497 and 1,992 valid glucose
readings (or more than 75% of the expected number of readings). Adjusted within each system wear-day,
98
Page 99
the
Advanced
10.
System provided an average of 98% of all expected glucose readings (288) as seen in Table
Table 11. CGM System Agreement to SMBG within CGM Glucose Ranges
CGM
Glucose
Ranges1
(mg/dL)
Overall
40-60
61-80
81-180
181-300
Study2
Number of
paired
CGM-SMBG
Percent
within
15/15%
SMBG
Percent
within
20/20%
SMBG
Percent
within
30/30%
SMBG
Original 7508 69% 81% 94% 2%
Advanced 2992 77% 87% 96% 1%
Original 731 75% 84% 92% 4%
Advanced 221 73% 80% 87% 7%
Original 968 78% 86% 95% 1%
Advanced 336 77% 85% 95% 1%
Original 3141 65% 78% 93% 2%
Advanced 1362 74% 85% 96% 1%
Original 1960 68% 81% 94% 3%
Advanced 826 80% 90% 97% 1%
Percent
greater
than
40/40%
SMBG
Original 450 77% 88% 98% 1%
301-350
Advanced 161 83% 93% 99% 0%
Original 258 75% 85% 95% 2%
351-400
Advanced 86 90% 93% 98% 1%
1
CGM readings are within 40 to 400 mg/dL, inclusive.
2
Both sets of study data are presented and are labeled as
Original
Agreement and Accuracy Relative to SMBG
(SW10050) or
Advanced
(SW10505).
During the study, agreement between the System and blood glucose values is also characterized using
paired System and SMBG results. The System and SMBG values were compared by pairing the
comparative SMBG value to a System glucose reading that occurred immediately after the SMBG was
collected. These results characterize the performance subjects expect during real-time use of the System in
their daily diabetes management when comparing the System readings to their home blood glucose meter
results.
Table 11 is categorized within CGM glucose ranges. For readings less than or equal to 80 mg/dL the
absolute difference in mg/dL between the two glucose results was calculated. For values greater than 80
mg/dL the absolute percent difference (%) from the SMBG values was calculated. The percentages of total
readings within 15 mg/dL or 15%, 20 mg/dL or 20%, 30 mg/dL or 30%, 40 mg/dL or 40% or greater than 40
mg/dL or 40% were then calculated. For example, if the CGM reads 100 mg/dL, it is between 81-180 mg/dL
99
Page 100
range and you can expect the CGM readings to be within 20% of the SMBG values 78% of the time for the
Original
System and 85% time for the
Advanced
System.
Table 12. CGM System Difference to SMBG within CGM Glucose Ranges
CGM Glucose Ranges1
(mg/dL)
Study2
Number of Paired
CGM-SMBG
Mean Percent
Difference
Median
Percent
Difference
Mean Absolute
Percent
Difference
Median
Absolute
Percent
Difference
Original 7508 -0.4% -1.4% 14.0% 11.0%
Overall
Advanced 2992
-2.6% -2.7% 11.3% 8.6%
*40-60
*61-80
81-180
181-300
301-350
351-400
Original 731
Advanced 221
-9.3 -8.0 11.7 8.0
-10.3 -6.0 13.0 8.0
Original 968 -1.0 1.0 10.7 8.0
Advanced 336
-4.0 -2.0 10.1 7.0
Original 3141 1.4% 0.0% 14.2% 11.0%
Advanced 1362 -2.6% -3.1% 11.4% 8.9%
Original 1960 -0.7% -2.8% 13.0% 10.3%
Advanced 826 -1.4% -2.0% 9.5% 7.4%
Original 450 -0.7% -2.6% 10.5% 8.6%
Advanced 161 -0.0% 0.0% 8.3% 6.0%
Original 258 5.0% 3.0% 11.9% 8.6%
Advanced 86 3.9% 3.2% 8.1% 6.7%
1
CGM readings are within 40 to 400 mg/dL, inclusive.
2
Both sets of study data are presented and are labeled as
Original
(SW10050) or
Advanced
(SW10505).
* For CGM ≤ 80 mg/dL, the differences in mg/dL are included instead of percent differences (%).
Table 12 is categorized within CGM glucose ranges. Overall, the System in the Original Study reads, on
average, 0.4% lower (Mean Percent Difference) than SMBG values and 14.0% absolute different (Mean
Absolute Percent Difference) than the SMBG values. The Median Percent Difference shows that half of the
time the System reads -1.4% or less than the SMBG values and the Median Absolute Percent Difference
shows that half of the time the System reads about 11.0% or less different than SMBG values.
100
 Loading...