

Dent Instruments EXCN-I-WI-N, EXCN-I-B-S, EXCN-I-WE-S, EXCN-I-B-F, EXCN-I-N-S User manual
...
Operator’s Guide
ELITEpro™ XC
and
ELOG™ 19
Software
ELITEpro XC
™
/ELOG™ 19
May 1, 2019
Find Quality Products Online at: sales@GlobalTestSupply.com
www.GlobalTestSupply.com

DENT Instruments
Operator’s Guide: ELITEpro XC and ELOG™ Software ©2019 DENT Instruments, Inc. All rights reserved.
This manual may not be reproduced or distributed without written permission from DENT Instruments.
Congratulations!
You now own one of the world’s most versatile, accurate, feature-rich, and lowest priced power/energy
loggers, the ELITEpro XC™. The ELITEpro XC logger contains many features, some of which enable you to
measure data across multiple platforms, view and graph real-time data, and retrieve data remotely.
In addition, this manual describes the features and functionality of the accompanying ELOG™ Software,
which is designed to be user-friendly, intuitive, and an easy-to-use component of your energy measuring
projects.
Thank You for your business!
Trademarks
ELITEpro XC™, ELOG™, and PhaseChek™ are trademarks of DENT Instruments, Inc.
Windows®, Windows® 7, Windows® 8, Windows® 10, and Notepad® are registered trademarks of
Microsoft Corporation.
Bluetooth® wireless technology is a registered trademark of the Bluetooth SIG. If your unit is equipped
with Bluetooth wireless technology, look for the following trademark symbol:
ELITEpro
Find Quality Products Online at: sales@GlobalTestSupply.com
www.GlobalTestSupply.com
ii

DENT Instruments
TABLE OF CONTENTS
Congratulations! ................................................................................................................. ii
Trademarks ......................................................................................................................... ii
Table of Contents .............................................................................................................. iii
Introduction ....................................................................................................................... 7
ELITEpro XC SAFETY SUMMARY and SPECIFICATIONS ..................................................................... 8
ELITEpro XC RÉSUMÉ DE SÉCURITÉ ET SPÉCIFICATIONS................................................................ 12
ELITEpro XC CONNECTIONS ........................................................................................................... 15
Quick Start to Using the ELITEpro ..................................................................................... 16
Install the ELOG Software on the Computer.................................................................................. 16
Mount the ELITEpro XC .................................................................................................................. 17
ELITEpro XC Connections ......................................................................................................... 18
Complete the Wiring Connections ................................................................................................. 19
CT Connections ........................................................................................................................ 19
Connecting Split-Core Style Millivolt CTs to a Load .......................................................... 20
Connecting RōCoil CTs to a Load ...................................................................................... 22
Voltage Connections ............................................................................................................... 23
Analog Channel Connections ................................................................................................... 23
Current Loop Connection .................................................................................................. 24
Voltage Connection........................................................................................................... 25
Power In/Out Connection ....................................................................................................... 27
Digital Channel Connections ................................................................................................... 27
Connecting the USB Cable ....................................................................................................... 29
Other Communication Connections ........................................................................................ 30
Communicating with the ELITEpro XC ................................................................
Terminating the ELITEpro XC to Computer Connection .......................................................... 33
........................... 31
In depth Use of the ELITEpro XC and ELOG ........................................................................ 34
Creating and Using the Logger Setup Tables ................................................................................. 34
Create a New Setup Table ....................................................................................................... 34
Open an Existing Setup Table on Your PC ............................................................................... 35
Retrieve an Existing Setup Table from the ELITEpro XC .......................................................... 36
Configure the Setup Table ....................................................................................................... 37
Data Logging Controls ............................................................................................................. 38
Start Options ..................................................................................................................... 38
Stop Options ..................................................................................................................... 38
Memory Capacity .................................................................................................................... 38
Quick Setups ............................................................................................................................ 39
Physical Power Channels ......................................................................................................... 41
ELITEpro
Find Quality Products Online at: sales@GlobalTestSupply.com
www.GlobalTestSupply.com
iii

DENT Instruments
Table of Contents
Calculated Power Channels ..................................................................................................... 45
Combining Channels ......................................................................................................... 45
Analog Output Channels (ELITEpro XC Only) ........................................................................... 46
Send a Setup Table to the Logger ............................................................................................ 47
Save a Setup Table on the Computer ...................................................................................... 48
LED Diagnostics .............................................................................................................................. 48
PhaseChek™ LEDs .................................................................................................................... 48
COMM—Communications LED ............................................................................................... 49
Power Measurement—Connecting Sensors & Configuring Channels ........................................... 50
Wiring Label Conventions ........................................................................................................ 51
Current Transformer (CT) Selection ........................................................................................ 51
CT Selection Examples ............................................................................................................. 53
Connecting CTs and Configuring Channels .............................................................................. 53
ELOG Quick Setup Wiring Diagrams ........................................................................................ 55
Using the ELOG Software ............................................................................................................... 59
ELOG Speed Buttons ................................................................................................................ 59
File Menu ................................................................................................................................. 61
Edit Menu ................................................................................................................................ 63
View Menu .............................................................................................................................. 63
Logger Menu ........................................................................................................................... 64
Communication Sub-Menu ............................................................................................... 64
Retrieve Data From Logger ............................................................................................... 69
Display Real-Time Values Sub-Menu ................................................................................ 71
Retrieve Logger Setup Table ................................................................
L
ogger Clock Sub-Menu .................................................................................................... 77
Edit Logger Description Line ............................................................................................. 78
Logging ON/OFF ................................................................................................................ 78
Clear Logger Sub-Menu..................................................................................................... 79
Tools Menu .............................................................................................................................. 80
PC Setup ............................................................................................................................ 80
Update ELITEpro XC Firmware .......................................................................................... 81
Restore Hidden Messages................................................................................................. 81
Data Menu ............................................................................................................................... 82
Create New Graph ............................................................................................................ 82
Graph Options ................................................................................................................... 85
Retrieve Data From Logger ............................................................................................... 86
Open Data File .................................................................................................................. 86
Export Data File ................................................................................................................. 86
Import CSV File .................................................................................................................. 87
Data File Statistics ............................................................................................................. 88
............................. 77
ELITEpro
Find Quality Products Online at: sales@GlobalTestSupply.com
www.GlobalTestSupply.com
iv

v
DENT Instruments
Table of Contents
Analyze a Selected Data Range ......................................................................................... 90
Extract a Range of Data ..................................................................................................... 91
Check Data for Errors ........................................................................................................ 92
Fill Missing Records with Zeros ......................................................................................... 92
Fill missing Records with Blanks ....................................................................................... 92
Appendices ...................................................................................................................... 93
Appendix A—Installing Firmware Updates .................................................................................... 93
Firmware Updates ................................................................................................................... 93
Downloading and Installing Firmware .............................................................................. 93
Appendix B—Unusual Metering Systems ...................................................................................... 94
3-Phase Delta with a “Wild” (Red) Leg .................................................................................... 94
2–½ Element Meters ............................................................................................................... 95
Using The 2-Watt Element (2 Ct) Method On A 3-Wire Delta Service .................................... 96
Using The 3-Watt Element (3 Ct) Method On A 3-Wire Delta Service .................................... 97
Appendix C—Troubleshooting ELITEpro XC Driver Installation ..................................................... 99
Appendix D—Calculated Power Channel Formulas ..................................................................... 102
Wye Configuration L1-N, L2-N, L3-N ..................................................................................... 102
DELTA Configuration: L1-L2 and L3-L2 .................................................................................. 103
Appendix E—Communication Options on the ELITEpro XC ......................................................... 104
USB (Standard) ...................................................................................................................... 104
Ethernet LAN (Standard) ....................................................................................................... 105
Wi-Fi and Wireless Access Point-to-Point Connection (Optional) ........................................ 108
ELITEpro XC as its own Access Point ............................................................................... 109
ELITEpro XC Connected to a Wireless Network .............................................................. 110
Accessing the ELITEpro ................................................................................................... 113
T
roubleshooting Wi-Fi Connections ............................................................................... 115
Bluetooth (Optional) .............................................................................................................. 116
Appendix F—Meter Installation Final Checklist ........................................................................... 119
Appendix G – ELITEpro XC Technical Specifications .................................................................... 122
Appendix H – DENT Instruments Warranty Statement ............................................................... 124
Index ............................................................................................................................. 126
ELITEpro
Find Quality Products Online at: sales@GlobalTestSupply.com
www.GlobalTestSupply.com

7
DENT Instruments
INTRODUCTION
The ELITEpro XC is a powerful and versatile tool for pinpointing electric usage and quantifying energy
usage. It is capable of measuring, storing, and analyzing consumption data including Volts, Amps, Watts,
Volt-Amps (VA), Volt-Amps reactive (VAR), Kilowatts (kW), Kilowatt Hours (kWh), KVAh, kVARh, and
Power Factor (PF) of an electrical load or an entire building. Analog input channels are especially helpful
when used in conjunction with power measurements to correlate the consumption of electricity with
environmental, HVAC plant performance or other process conditions. The ELITEpro XC also offers some
power quality features such as the ability to view in real-time voltage, current, and power waveforms
and calculate harmonics to the 63
The ELITEpro XC is line-powered from the service being measured, eliminating the need for external
power or space-consuming batteries at the job site. The measurements are stored in on-board,
non-volatile memory in a time series format at an interval selected by the user. The ELITEpro XC can be
mounted anywhere with its magnetic mounting feet and is small enough to be secured inside the
electrical panel.
The Windows-based ELOG software package is used to set up the meter, display metered values, and
retrieve and analyze the collected data. ELOG graphically displays recorded data, performs analysis and
facilitates automatic remote data collection. Data is also easily exported to popular spreadsheet and
database programs for additional analysis.
rd
order.
The ELITEpro XC requires a computer and ELOG™ software for setup, data retrieval, and data analysis.
Download and test the software prior to the field installation of the logger.
If your installation is using ELOG with legacy devices, contact DENT Instruments for a prior version of this
manual.
ELITEpro
Find Quality Products Online at: sales@GlobalTestSupply.com
www.GlobalTestSupply.com

8
DENT Instruments
Introduction
E186827
The ELITEpro XC is an Over-Voltage Category III device. Use approved rubber gloves with mechanical
protection and goggles when operating the device.
CAUTION: This LOGGER may contain life-threatening voltages. QUALIFIED PERSONNEL MUST disconnect all high
voltage wiring before using or servicing the LOGGER.
impair its means of protection.
SYMBOLS ON EQUIPMENT
voltages monitored.
personnel only.
of 600V. The ELITEpro XC is a 600 volt Over-Voltage Category III device.
ELITEpro XC SAFETY SUMMARY and SPECIFICATIONS
This general safety information is to be used by both
the Logger operator and servicing personnel. DENT
Instruments, Inc. assumes no liability for user’s
failure to comply with these safety guidelines.
4RH8
Conforms to UL Std 61010-1
Certified to CSA Std C22.2 No.
61010-1
Warning: Use of this device in a manner for which it is not intended may
Denotes caution. See manual for a description of the meanings.
When connecting the ELITEpro XC to an AC load, follow these steps in
sequence to prevent a shock hazard.
1. If possible, de-energize the circuit to be monitored.
2. Connect the CTs to the phases being monitored.
3. Connect the voltage leads to the different phases. Use proper safety
equipment (gloves, mask, and protective clothing) as required for the
Risk of electric shock. Life-threatening voltages may be present. Qualified
DO NOT EXCEED 600V Phase to Phase. This logger is equipped to monitor
loads up to 600V. Exceeding this voltage will cause damage to the logger and
danger to the user. Always use a Potential Transformer (PT) for loads in excess
Dispose of properly.
ELITEpro
Find Quality Products Online at: sales@GlobalTestSupply.com
www.GlobalTestSupply.com

9
Introduction
DENT Instruments
OUT: 6 VDC, 200 mA maximum
The use of any other CT will invalidate the UL Listing of the ELITEpro XC.
shock hazard to the user. Wiring must meet 600V AC CAT III rating.
is specific to DC systems. Values reported for voltage, current, KW, KWH will be
IN: 6-10 VDC, 500 mA
SENSOR LIMITATIONS
USB port
USE ONLY SHUNTED CURRENT TRANSFORMERS (CTs).
Do not use other CTs. Only use shunted CTs with a 333mV maximum output only.
Serious shock hazard and logger damage can occur if unshunted CTs are used.
The UL listing covers the use of the following DENT Instruments CTs that are UL
Recognized and have been evaluated to IEC 61010-1:
CT-RGT12-XXXX (solid core), CT-SRS-XXX (split core), CT-HSC-020-X (20A Mini),
CT-HSC-050-X (50A Mini), CT-HMC-0100-X (100A Midi), CT-HMC-0200-X (200A
Midi), CT-RXX-1310-U (RōCoil), CTRXX-A4-U (RōCoil), CT-CON-1000-X, CT-CON0150EZ-X and the CT-SRL-XXX or CT’s that are UL listed to UL2808.
Pulse: Use only "dry contact" non-energized pulse inputs (ELITEpro SP only).
Use of energized pulse initiators can cause damage to the logger and a potential
DC VOLTAGES
The meter is designed to measure AC voltages for installations up to 600
VAC. The meter is also capable of measuring DC voltages up to 600 VDC with the
following caveats.
1) The internal fuse installed in meters with serial numbers before XC1703xxx are
not a suitable disconnect for voltages above 80 VDC. Customers using the meter
for high voltage DC systems must install a UL listed inline 600 volt DC fuse with a
ELITEpro
Find Quality Products Online at: sales@GlobalTestSupply.com
rating of 1 amp or less. These fuses are commonly available in the solar power
market.
2) UL testing of the meter was conducted on AC systems only. DC results are
comparable but not tested.
3) DENT Instruments ELOG software does not currently have a configuration that
www.GlobalTestSupply.com

Introduction
DENT Instruments
correct however it should be noted that the meter will also report values that
CAT III 80-600 VAC 125mA 50/60 Hz
pertain to AC systems (such as VARs and Power Factor) that should be ignored.
The equipment is protected throughout by double insulation (IEC 536 Class II).
FCC COMPLIANCE
This device has been tested and found to comply with the limits for a Class A digital device, pursuant to
part 15 of the FCC Rules. These limits are designed to provide reasonable protection against harmful
interference when the equipment is operated in a commercial environment. This equipment generates,
uses, and can radiate radio frequency energy and, if not installed and used in accordance with the
instruction manual, may cause harmful interference to radio communications. Operation of this
equipment in a residential area is likely to cause harmful interference in which case the user will be
required to correct the interference at user’s own expense.
Operation is subject to the following two conditions: (1) This device may not cause harmful interference,
and (2) this device must accept any interference received, including interference that may cause
undesired operation.
ELITEpro
Find Quality Products Online at: sales@GlobalTestSupply.com
www.GlobalTestSupply.com
10

Introduction
DENT Instruments
MAINTENANCE
There is no required maintenance with the ELITEpro XC. Abide by the following items:
Cleaning: No cleaning agents, including water, shall be used on the ELITEpro XC.
Battery Life: The lithium battery is only used to maintain the date and clock settings during power
failure and has a life expectancy of greater than 10 years. Contact DENT Instruments for service.
No accessories are approved for use with the ELITEpro XC other than those specified in the DENT
Instruments product literature and price sheets.
If the logger appears damaged or defective, first disconnect all power and sensors. Call or email
technical support for assistance.
ELITEpro
Find Quality Products Online at: sales@GlobalTestSupply.com
www.GlobalTestSupply.com
11

Introduction
DENT Instruments
ELITEpro XC Top End View
Power In/Out
Terminal Block for
Analog
Connections
Logging On/Comm LED
USB Connection
PhaseChek
LEDs
Magnetic Mounting Feet
Ethernet connection
Optional Wi
5
CT Connections
ELITEpro XC CONNECTIONS
Input
™
Voltage Lead
Connections
-Fi—External
dbi antenna
Find Quality Products Online at: sales@GlobalTestSupply.com
ELITEpro
www.GlobalTestSupply.com
15

DENT Instruments
QUICK START TO USING THE ELITEPRO
IMPORTANT: DO NOT CONNECT THE ELITEpro XC TO YOUR COMPUTER UNTIL YOU HAVE INSTALLED ELOG
Install the ELOG Software on the Computer
Complete this step prior to installation and ascertain that communication between the ELITEpro XC and
PC is established before going into the field.
NOTE: The new path for Data files in ELOG is: C:\Users\UserName\Documents\DENT\ELOG\Data
ELOG is compatible with Windows® 7, Windows® 8, or Windows® 10.
1) Insert the ELOG USB memory stick into the USB port. Browse to the memory stick and locate the
ELOGInstaller.exe file. Start the installer by double-clicking ELOGInstaller.exe.
2) Follow the directions on the screen to install the software.
NOTE: When ELOG is installed, another program, AutoPoll, is also installed. AutoPoll may be used for
unattended and automatic data retrieval from a number of remote loggers where the computer calls the
loggers. See Appendix D—AUTOPOLL: Unattended Calling from the PC to the Logger.
3) Install the ELITEpro XC Driver on your computer.
a) Connect the USB cable to a USB port on your computer, inserting the other end in the USB port
on the ELITEpro XC
NOTE: If a USB cable is used inside an electrical panel it must be rated to the appropriate voltage or
wrapped in an appropriately rated insulating sleeve. The DENT-supplied cable does not meet this
requirement without an insulating sleeve.
b) Perform the setup steps onscreen. You must allow ELOG to install the USB driver for the
ELITEpro XC to work correctly.
c) If the driver installation fails, see Appendix: Troubleshooting ELITEpro XC Driver Installation.
ELITEpro
Find Quality Products Online at: sales@GlobalTestSupply.com
www.GlobalTestSupply.com
16

DENT Instruments
Quick Start to Using the ELITEpro
Mount the ELITEpro XC
The ELITEpro XC must be installed in an approved electrical panel or enclosure, following proper
installation practices according to the local electrical codes.
WARNING! Remove the LOGGER from all sources of voltage before mounting.
AVERTISSEMENT! ENLEVEZ L'ENREGISTREUR DE TOUTES LES SOURCES DE TENSION AVANT DE
MONTER.
1) Mount the ELITEpro XC using the black tab on the end of the case. Use a screw to securely mount
the ELITEpro XC near a dedicated circuit disconnect breaker.
NOTE: Allow adequate space for accessing all ports and connectors. The mounting tab is intended for
short term metering (less than 6 months) and must be subject to monthly monitoring by qualified
personnel to verify the ELITEpro XC or its wiring have not shifted.
To remove the logger, remove the screw and roll the magnets off the cabinet to which it is mounted. In
order to prevent injury upon removal, it is recommended practice to roll the device off, due to the
strength of the magnets.
NOTE: For temporary, spot load monitoring, the four magnets on the back of the ELITEpro XC case can
be utilized to hold the logger on unpainted metal. The maximum combined weight of the logger and any
attachments the magnets can support with a 4 times safety margin is 18oz (500 gm). The logger must be
attended by the electrician when it is temporarily mounted by the four magnets.
ELITEpro
Find Quality Products Online at: sales@GlobalTestSupply.com
www.GlobalTestSupply.com
17

DENT Instruments
Quick Start to Using the ELITEpro
It is often easier to connect the CTs and voltage
simply plug the voltage leads and CT connectors into the ELITEpro XC before mounting.
“Roll” the device, as seen below.
2) Mark the dedicated circuit as the disconnect for the ELITEpro XC.
ELITEPRO XC CONNECTIONS
The ELITEpro XC has the following connections:
Four current transformers (CTs).
Four voltage wire leads for connecting to voltage sources (L1, L2, L3, and Neutral).
Four analog input channels can be individually used to record process or environmental correlation
studies with power.
Power In/Out for connecting a DENT-provided external power supply or for powering external
devices. Maintain polarity as marked on the case:
In: 6-10 Vdc, maximum input of 500 mA
Out: 6 Vdc output, up to 200 mA for powering other external devices
USB connector for downloads, setup, and communication with a computer. The ELITEpro XC is also
powered from the USB connection. If a USB cable is to be used inside an electrical panel, it must be
rated to the appropriate voltage or wrapped in an appropriately rated insulating sleeve. The DENTsupplied cable does not meet this requirement without an insulating sleeve.
Ethernet port for connecting the device to a network.
An external coaxial connector for a Wi-Fi antenna may also be present.
leads to the load to be monitored first then
ELITEpro
Find Quality Products Online at: sales@GlobalTestSupply.com
www.GlobalTestSupply.com
18

DENT Instruments
Quick Start to Using the ELITEpro
Complete the Wiring Connections
The following connections must be completed to install the ELITEpro XC. ALL WORK SHOULD BE
PERFORMED BY A QUALIFIED ELECTRICIAN USING PROPER SAFETY EQUIPMENT.
CAUTION: The ELITEpro XC should only be wired by qualified personnel. Hazardous voltages exist.
ATTENTION: LE ELITEpro XC ne doit être branché QUE par un personnel qualifié. TENSIONS
DANGEREUSES sont présentEs.
CT CONNECTIONS
NOTE: Use only inherently safe 333mV output CTs supplied by DENT. Never use current output CTs. The
UL listing covers the use of the following DENT Instruments CTs that are UL Recognized and have been
evaluated to IEC 61010-1:
CT-
HSC-020-X (20A Mini), CT-HSC-050-X (50A Mini), CT-HMC-0100-X (100A Midi), CT-HMC-0200-X (200A
Midi), and CTs that are UL listed to UL2808. The use of any other CT will invalidate the UL Listing of the
ELITEpro XC.
1) C
onnect the CTs to the channel(s) on the ELITEpro XC labeled CH 1, CH 2, CH 3 and CH 4. The CT
leads need to be connected to the terminal block using a small screwdriver. For RōCoils, also
connect the shield (bare) wires to the right-most ground terminal marked “S” (shield).
2) Place the CTs on the phase wires of the load to be monitored and corresponding to the phase of the
voltage loads. The CTs must be placed as follows for each channel:
Left connector pin is the positive or high-side wire
Right pin is the negative or low-side
When using DENT Instruments current transformers, connect them as follows:
Split-core CTs (removable leg)—the white CT wire is (+) and the black wire is (-).
Clamp-on CTs (clothes-pin type)—the red wire is positive (+) and the black wire is negative (-).
RōCoil CTs (flexible, Rogowski-style)—the white CT wire is (+) and the brown wire is (-).
If you are using RōCoil CTs, be sure to connect the bare wire to the “S” (shield) screw terminal. This
reduces interference and improves the accuracy of the CT.
ELITEpro
Find Quality Products Online at: sales@GlobalTestSupply.com
www.GlobalTestSupply.com
19

DENT Instruments
Quick Start to Using the ELITEpro
Connecting Split-Core Style Millivolt CTs to a Load
1) Open the CT by holding on to the removable leg and pulling it apart.
2) Connect CT around the load conductor to be measured. Make sure the maximum current of the
conductor does not exceed the maximum CT rating listed on the CT data sheet.
3) Carefully re-connect the removable leg while ensuring the CT core alignment matches. The
conductor should be in the inside of the CT window.
Repeat Steps 1-3 if you are using more than one CT.
ELITEpro
Find Quality Products Online at: sales@GlobalTestSupply.com
www.GlobalTestSupply.com
20

DENT Instruments
Quick Start to Using the ELITEpro
Correct orientation of a CT is required to ensure proper measurement. If an arrow is shown on
the CT label, it shou
the CT.
“
See
Physical Power Channels.
connections
connections
4) Connect the white wire on the CT to the positive terminal on the measuring device.
5) Connect the black wire on the CT to the negative terminal on the measuring device.
Current
Transformer
Voltage lead
CT 1 must be placed on the phase listed as V High for Channel 1 in the ELOG setup table. CT2, CT3 and
CT4 must also correspond to the appropriate phase as shown in Channels 2, 3, and 4 in the ELOG setup
table.
ld be pointed toward the load. Otherwise, use the instructions printed on
If the CT was accidently installed backwards and access to reverse it is not possible, the
CT Flipper” function can be accessed by clicking the CT “Type” in the “Logger Setup Table.”
Find Quality Products Online at: sales@GlobalTestSupply.com
ELITEpro
www.GlobalTestSupply.com
21

DENT Instruments
Quick Start to Using the ELITEpro
Shield Wires from DENT RōCoil
CTs connected to ELITEpro XC
Negative
Positive
Shield
Connecting RōCoil CTs to a Load
1) Open the CT by squeezing the connector latch and pulling it apart.
2) Connect the CT around the load conductor to be measured. Orient the CT so that the arrow on the
CT case points towards the load. Make sure the maximum current of the conductor does not exceed
5,000 amps.
3) Push the connector back together with the conductor within the loop of the CT.
Repeat the above three steps if you are using more than one RōCoil CT.
4) Connect the CTs brown wire to the negative terminal on the
connector. See photo below.
5) Connect the CTs white wire to the positive terminal on the
connector.
6) Twist together the bare shield wires from the RōCoils and
connect to the “S” shield terminal that is part of the CH 4
connector. This reduces interference and improves accuracy
of the CT.
Connecting RōCoil CTs to an ELITEpro XC
ELITEpro
Find Quality Products Online at: sales@GlobalTestSupply.com
www.GlobalTestSupply.com
22

DENT Instruments
Quick Start to Using the ELITEpro
The ELITEpro XC is rated for 600V Over-Voltage Category III. Cat III is for measurements
performed in the building. Examples are measurements on distribution boards, circuit
breakers, wiring including cables, bus bars, junction boxes, switches, and socket outlets in a
fixed installation, and equipment for industrial use. Other equipment could include stationary
motors with a permanent connection to the fixed installation.
CAUTION: Ensure that the sensor current/voltage is within range and the channel is correctly
elevated signals may damage the ELITEpro XC and this will void your warranty.
VOLTAGE CONNECTIONS
1) Before connecting voltage leads L1, L2, L3, & N to the meter, first connect them to dedicated circuit
breakers using either Croc-clips or lead adapters from DENT.
a) Refer to the wiring diagrams in Section 2 for wiring connection specifics. Follow local electrical
codes during this installation.
b) IMPORTANT: Verify the breaker is marked as the disconnect breaker for the ELITEpro XC.
2) Connect lead adapters to the banana sockets at the end of the voltage leads.
3) Connect the voltage leads (L1, L2, L3, and N, as necessary) to the ELITEpro XC.
-
ANALOG CHANNEL CONNECTIONS
Analog inputs are especially helpful when used in conjunction with power measurements to correlate
the consumption of electricity with environmental, HVAC plant performance or other process
conditions. Typical uses might include logging ambient temperature, building temperatures, solar
insolation, tank pressures, duct flows, etc.
The ELITE XC has four analog input channels that can be configured for voltage or current input used in
any combination among channels. The limiting specifications for analog input are shown in the
Appendix.
The following sensor types are supported and selected through the ELOG software interface.
0/4–20 mA externally powered current loop
0–30* VDC single ended, non-isolated
NOTE: The ELITEpro XC can measure input voltages up to 30.0 volts. However, the polarity protection
circuitry can only withstand 15 volts of reverse-applied polarity without permanent damage to the
meter. The maximum allowable current flowing into the analog input terminal is 23 mA.
configured using ELOG software before connecting external sensors. Sustained exposure to
Find Quality Products Online at: sales@GlobalTestSupply.com
ELITEpro
www.GlobalTestSupply.com
23

DENT Instruments
Quick Start to Using the ELITEpro
CAUTION: Observe the correct signal polarity when connecting voltage sensors to the ELITEpro XC
above 10 volts. Damaging currents may flow from the connected sensor in the event of reverse
polarity or misconfiguration and this will void your warranty.
Channel types (voltage or current) should be configured using the ELOG software prior to connecting
external sensors. This sequence will prevent the unexpected/unpredictable combinations of voltage
transducers connected to low impedance loads (499 ohm) or current transducers with an open circuit.
The first set of Sensor and Output fields on the screen represent the Physical Range. This is where the
user enters the low and high process values from the sensor. This data can typically be found on the
data plate or data sheet of the sensor (typical sensor image below). The second set of Sensor and
Output fields represent the Electrical Output. This is where the user enters the minimum and maximum
electrical output values of the sensor, also listed on the data plate or data sheet.
Example Sensor Data Plates
Current Loop Connection
Sensors using current loops are widely used in industry to communicate analog signals in the presence
of electromagnetic interference. Both 2- and 3-wire current loops (often referred to as loop powered or
separately excited, respectively) are commonly used in industry. Both types of current sensors are
illustrated in this section. Internally, the ELITEpro XC uses 0.1% precision 499 ohm resistors to measure
the voltage drop impressed by the external current source. Current loop sensors will typically be
powered from a 24-volt DC supply. The ELITEpro XC has four measurement channels. The negative
terminals of each channel are common to each other and connected to the reference plane for power
measurements. For this reason, it is imperative that the ELITEpro XC be connected as the last
component in the current loop, rather than the first, if multiple channels are used. Best practices are to
use a single power supply for all sensors to reduce the occurrence of ground loop current between
supplies.
ELITEpro
Find Quality Products Online at: sales@GlobalTestSupply.com
24
www.GlobalTestSupply.com

DENT Instruments
Quick Start to Using the ELITEpro
L1
L2
G
+
-
Sensor
Pow er Sup pl y
2-Wire Current Loop Configuration
Voltage Connection
Voltage output sensors and 3-wire current loops will typically use one voltage for powering the sensor
and a second voltage (or current) for sending an output signal. Sometimes the power supply ground and
signal reference conductor is shared between two circuits resulting in a three wire device. This economy
usually comes at the installer’s expense of having to form a junction at the power supply, sensor, or
meter. Sensors having four terminals are also popular and are simply connected to the meter by
observing the indicated polarity between sensor and meter.
ELITEpro
Find Quality Products Online at: sales@GlobalTestSupply.com
www.GlobalTestSupply.com
25

DENT Instruments
Quick Start to Using the ELITEpro
L1
L2
G
+
-
Senso r
Power Supply
Separately Excited Current or Voltage Loop Configuration
ELITEpro
Find Quality Products Online at: sales@GlobalTestSupply.com
www.GlobalTestSupply.com
26

DENT Instruments
Quick Start to Using the ELITEpro
POWER IN/OUT CONNECTION
The Power In/Out connection can be used with the ELITEpro XC to measure loads where the line voltage
is less than 80 VAC and the internal power supply will not operate (a small battery bank, for example) or
where AC line voltages are not available and you want to use current transformers to record amps only.
It can also be used as a 6V output to power any outside devices.
To power the ELITEpro XC using an external supply, contact DENT Instruments for an
appropriately-rated power supply.
The ELITEpro XC can also supply 6V DC at up to 200mA to an external device when the ELITEpro XC
voltage leads are connected to mains power between 80 and 600 VAC.
DIGITAL CHANNEL CONNECTIONS
Digital channel connections are part of the ELITEpro SP, a legacy product produced before ELITEpro XC.
Users of ELOG connected to legacy products will see digital channels instead of analog channels on the
screen. The Digital channels provide users with a way to export kWh, kVAh, and kVARh pulses to
external devices. The ports are grounded when closed, and floating when open. For example, if the
setup table Digital 1 is configured to output KWh pulses with a Scale of 1.0, Digital channel 1 will output
a pulse for each kilowatt-hour of energy measured by the meter on Power Channel 1.
In Digital 2 the Scale is set to .001 (kWh), so a pulse would be generated for each Watt-hour of energy
measured on Power Channel 2. See below.
For example, in the Digital Channels setup below: A desk lamp with a 100W bulb will use 0.1 kWh every
hour; the meter produces a pulse once every 10 hours on Power Channel 1 and 100 pulses every hour
on Power Channel 2. In contrast, a 1,000W heater will use 1 kWh every hour; the meter produces a
single pulse once an hour on Power Channel 1 and 1,000 pulses every hour on Power Channel 2.
Digital 1/2: Turns the channels on/off by choosing an option from the drop-down list.
ELITEpro
Find Quality Products Online at: sales@GlobalTestSupply.com
www.GlobalTestSupply.com
27

DENT Instruments
Quick Start to Using the ELITEpro
1) Connect the wires of your pulse input measuring device to the +/- pulse output connection points on
the ELITEpro SP.
2) Using an existing setup table (or follow the steps in Section 2 of this manual to create a new one),
turn on the Digital 1 and/or Digital 2 channels.
3) Enter a descriptive name in the Name field to identify your logger (optional).
4) Choose which Power Channel (CT) will be used to generate pulses from the drop-down list.
NOTE: The Power Channel drop-down list displays any enabled channel, allowing users to choose which
one(s) to use as a source for the pulses.
For example, if the setup table is only configured to measure one power channel, no other options will
be available in the Power Channel drop-down list. If the setup table is configured to measure two power
channels, you may choose either “1” or “2” from the drop-down list.
Users may wish to output different pulse variables on each channel. The Power Channels for Digital 1
and Digital 2 may both be set to “1,” or set to “1” and “2” in order to output pulses of two Physical
Power Channels, or both may be set to “2.” This enables users to output pulses with different data in the
Value and Scale described in the following sections.
5) Select a parameter (kWh, kVARh, or kVAh) to be used as the source for pulses from the Value
drop-down list.
The ELITEpro SP is capable of outputting pulses for KWh, KVAh, or KVARh. Only one may be outputted at
a time if a single digital output channel is turned on, but users have the option of outputting two
different values concurrently from the same Power Channel if both Digital 1 and Digital 2 are in use.
6) Enter a scale in the Scale field to assign a significance to the pulses.
For example, if 22 is entered in the Scale field and kWh is selected for the Value, then each pulse
generated by the meter is equal to 22 kWh on the selected Power Channel.
7) Click SEND SETUP TABLE to Logger.
NOTE: The maximum output rate is five (5) pulses per second, or 5Hz, with a maximum current of 75mA
and 30V DC.
NOTE: When logging is turned on or a new setup table is sent, pulse outputs start at the integration
period relative to the hour that logging starts. For example, if you have a 5-minute integration period
and you turn logging on at 1:05:01 PM (5 minutes and 1 second after the hour), logging AND pulse
output accumulation will NOT start until 1:10:00 PM.
ELITEpro
Find Quality Products Online at: sales@GlobalTestSupply.com
www.GlobalTestSupply.com
28

DENT Instruments
Quick Start to Using the ELITEpro
USB Port
Power In/Out
CONNECTING THE USB CABLE
1) Connect the USB cable to an available USB port on the computer and insert the other end in the USB
port of the ELITEpro XC.
If a USB cable is used inside an electrical panel, it must be rated to the appropriate voltage or wrapped
in an appropriately-rated insulating sleeve. The DENT-supplied cable does not meet this requirement
without an insulating sleeve.
2) Turn on the breaker to begin metering.
ELITEpro
Power End Panel Connections
29
Find Quality Products Online at: sales@GlobalTestSupply.com
www.GlobalTestSupply.com

DENT Instruments
Quick Start to Using the ELITEpro
OTHER COMMUNICATION CONNECTIONS
The RJ-45 Connector is for Ethernet Network connections.
NOTE: The Ethernet connector accommodates high speed downloads, setup, and
communication with a computer. If an Ethernet cable is to be used inside an electrical panel, it
must be rated to the appropriate voltage or wrapped in an appropriately-rated insulating sleeve.
The Coaxial connector, if present, is for an optional external Wi-Fi antenna.
NOTE: If an antenna is used inside an electrical panel, it must be at least 2" away from any live
wiring or bus bars.
NOTE: An internal Bluetooth module is an optional communication interface.
External Antenna—
for Wi-Fi (optional)
Ethernet port
Communication Connections
ELITEpro
Find Quality Products Online at: sales@GlobalTestSupply.com
www.GlobalTestSupply.com
30

DENT Instruments
Quick Start to Using the ELITEpro
Communicating with the ELITEpro XC
1) Plug the USB cable into the logger and the PC. ELOG should auto-launch and connect to the ELITEpro
XC automatically. If not, double-click the ELOG icon on the PC desktop.
The ELOG window
opens, displaying the
menus and a row of
speed buttons to
quickly access frequently used ELOG functions.
The ELITEpro XC and ELOG software should connect automatically. If not, proceed with Step 2
below. If the automatic connection is made, proceed with Step 6 below.
2) Select Tools > PC Setup to open the ELOG PC Setup dialog box.
3) In the middle section of the dialog box labeled Direct Connect, select the Port from the menu that
corresponds to the computer’s COM port where the USB cable is connected.
Port Preferences: This option is used to hide COM Ports from ELOG, to change the order of COM
Ports as they appear in the drop-down control, and the order they are searched when ELOG can't
connect to a logger on the desired port.
ELITEpro
Find Quality Products Online at: sales@GlobalTestSupply.com
www.GlobalTestSupply.com
31

DENT Instruments
Quick Start to Using the ELITEpro
Ports that are unchecked will be hidden from ELOG. Ports are listed and searched in the order
shown. The order can be changed by selecting a port and moving it up or down.
Every time ELOG connects to a logger, its port is moved to the top of this list.
4) Check the Use Legacy Logger interface checkbox to enable legacy menu items for customers using
legacy products (ELITEpros). The default is unchecked, and the ELOG only displays features and
menu items relevant to the current software release.
5) Click Save Changes.
For more information on the other ELOG PC Setup options see the Tools Menu content in Section II.
6) Select Logger > Communication > Direct Connect to connect the computer to the ELITEpro XC.
The Logger Connection information displays along the bottom of the window, providing a status
message as the computer connects to the ELITEpro XC. Simultaneously, the logger’s COMM LED will
begin to flash.
ELOG fills the information fields of the Logger Connection
Logger serial number/firmware
version number
7) Create and send a setup table to the logger. See Creating and Using the Logger Setup Tables for a
complete description.
window when the computer establishes communication
with the ELITEpro XC. For more information on using ELOG,
see Using the ELOG Software.
8) Use Logger > Display Real-Time Values to verify installation.
Find Quality Products Online at: sales@GlobalTestSupply.com
ELITEpro
www.GlobalTestSupply.com
32

DENT Instruments
Quick Start to Using the ELITEpro
TERMINATING THE ELITEPRO XC TO COMPUTER CONNECTION
Select Logger > Communication > Terminate Connection to end the connection between the computer
and the ELITEpro XC.
-or-
Use the Disconnect speed button to quickly terminate the connection.
ELITEpro
Find Quality Products Online at: sales@GlobalTestSupply.com
www.GlobalTestSupply.com
33

DENT Instruments
IN DEPTH USE OF THE ELITEPRO XC AND ELOG
Creating and Using the Logger Setup Tables
The ELITEpro XC is a flexible meter that can monitor a wide variety of parameters over a wide range of
currents, voltages and service types. This requires that you determine what is recorded and at what
intervals. The ELITEpro XC requires that it be configured for use by first creating a “Setup Table” file and
then loading the file into the meter.
Setup Tables are created using the ELOG software and saved to the computer with a .sut file extension
appended to the name. A .sut file may be:
Loaded into the ELITEpro XC immediately or at a later time but prior to beginning a monitoring
session
Sent to any number of loggers
Retrieved from an ELITEpro XC, modified and saved, and resent to the logger
CREATE A NEW SETUP TABLE
A new setup table can be created for any of the devices compatible with the current version of ELOG.
This includes a variety of DENT Instruments legacy products in addition to the ELITEpro XC.
If the logger is not connected and communicating with the computer, setup tables can still be created
and saved to the computer.
1) Select File > New > Setup Table File and click OK.
If your computer is currently communicating to an ELITEpro XC, the ELOG software assumes the new
setup file is for the connected device. Selecting New displays a setup table with the default parameters.
If no ELITEpro XC or other logger is communicating with the computer, the Select A Setup Table Type
dialog box displays.
2) Select ELITEpro XC from the drop-down menu.
ELITEpro
Find Quality Products Online at: sales@GlobalTestSupply.com
www.GlobalTestSupply.com
34

DENT Instruments
In Depth Use of the ELITEpro XC and ELOG
3) Click OK.
OPEN AN EXISTING SETUP TABLE ON YOUR PC
Existing setup tables on the computer can be opened, modified, and saved.
1) Select File > Open to display the Open dialog box.
2) Select Setup Table File and click OK.
3) The Open dialog box displays. Select the desired setup table file or navigate to a folder containing
additional files. The default folder is set to C:\Users\User Name\Documents\DENT\ELOG\Setups.
4) Select the file name and click Open.
-orDouble-click the file name to open.
The setup table file can be reviewed, edited, and saved to disk or sent to the logger. For instructions on
sending the file to the logger see Send a Setup Table to the Logger.
ELITEpro
Find Quality Products Online at: sales@GlobalTestSupply.com
www.GlobalTestSupply.com
35

DENT Instruments
In Depth Use of the ELITEpro XC and ELOG
RETRIEVE AN EXISTING SETUP TABLE FROM THE ELITEPRO XC
Existing setup tables on the ELITEpro XC can be retrieved once the computer and the logger are
connected and communicating.
Select Logger > Retrieve Logger Setup Table.
The setup table stored in the logger is retrieved and displayed, with the name of the file above the ELOG
menu bar. The file can be modified and saved to disk or resent to the logger.
NOTE: Sections of this window are used in the following text to highlight only those areas under
discussion.
ELITEpro
Find Quality Products Online at: sales@GlobalTestSupply.com
36
www.GlobalTestSupply.com

DENT Instruments
In Depth Use of the ELITEpro XC and ELOG
CONFIGURE THE SETUP TABLE
The setup table consists of several sections where the attributes of the ELITEpro XC are defined.
Logger Type Setup Table Name
ELITEpro XC is the default
entry. This field cannot
be edited once you are in
the Setup Table window.
Logger type is chosen
from the Select A Setup
Table Type window.
Enter a name for the
setup table. 20-character
limit. This is helpful for
identifying different
setup tables. NOTE: The
setup table name need
not be the same as the
.sut file name.
Data Interval Line Frequency
The default integration
period is fifteen minutes.
The choices are 1, 3, 15,
30 seconds; 1, 2, 5, 10,
15, 20 and 30 minutes; 1
and 12 hours; 1 day. This
tells the logger at what
time intervals data is to
be stored in the memory.
For example, if the
integration period is set
for 30 minutes and
average watts is being
monitored, then every 30
minutes the logger
records the average
power use (watts) for
that channel over the
preceding 30-minute
interval, based on
approximately 14,400
measurements of the
monitored power draw. If
Maximum (and/or
Minimum) values are
being recorded the
highest (and/or lowest)
of those 14,400 readings
are also saved.
Auto, 60 Hz, or 50Hz.
Default is 60 Hz.
ELITEpro
Find Quality Products Online at: sales@GlobalTestSupply.com
37
www.GlobalTestSupply.com

DENT Instruments
In Depth Use of the ELITEpro XC and ELOG
DATA LOGGING CONTROLS
The Data Logging section controls when the logger starts and stops collecting data. The default values
are Start Immediately and Stop Never (Ring Memory). Additional data logging options are defined
below.
Start Options
Immediately Logging starts as soon as the setup table is sent to the logger.
Date (mm/dd/yy)
Time (hh:mm:ss)
Peak Demand Window
Time should be set in a 24-hour format, e.g., 2:30PM should be entered as
The default is 15 Minutes. Choices are Off, 1, 2, 3, 4, 5, 6, 10, 12, 15, 20, 30, and
Logging starts at the designated date and time.
14:30.
60 minutes.
Stop Options
Never (Ring Memory) Logging is continuous, meaning when memory fills, the oldest records are
replaced with the newest records, allowing for long term metering projects.
When Memory Is Full Logging stops when the memory is full.
Date (mm/dd/yy)
Time (hh:mm:ss)
Time should be set in a 24-hour format, e.g., 2:30 pm should be entered as
Logging stops at the designated date and time.
14:30.
MEMORY CAPACITY
ELOG provides a convenient feature that calculates
the approximate length of time required to fill the
memory for any setup table. The feature is dynamic
so that any time any parameter in a setup table
affecting the memory duration is changed, the Memory Capacity field is updated, providing the (new)
length of time the logger’s memory will last. The ELITEpro XC has 16 MB internal non-volatile memory.
ELITEpro
Find Quality Products Online at: sales@GlobalTestSupply.com
www.GlobalTestSupply.com
38

DENT Instruments
In Depth Use of the ELITEpro XC and ELOG
The Millivolt default is 100 amps. Enter the value printed on the CT if it is not 100. If RōCoil
(Rogowski) is selected, the CT Amps are set to 5,000 and the CT Phas
may not be changed. All DENT RōCoils, regardless of size, use the same settings.
Power Channel Setup Help: The Power Channel Assistant can be opened to guide a new user
through the Setup Table step
well as a key to recording flag abbreviations. The Power Channel Assistant can be accessed by
starting a new Setup Table and going to Help > Power Channel Setup Help.
QUICK SETUPS
The Quick Setups section of the window provides four buttons to quickly configure the ELITEpro XC.
1) Click the Quick Setup
button that represents
your monitoring scenario.
Each button opens the CT
Selection dialog window.
See ELOG Quick Setup Wiring
Diagrams within this section for more detail.
The View Typical Setup button
is only visible after a Quick
Setup selection is made.
2) Select View All to choose a CT from the CT selection list.
-orSelect Millivolt and enter the CT Amps, the primary current rating of the current transformer, and
the CT Phase Shift.
-orSelect RōCoil.
e Shift is set to 0.0 and
-by-step. It includes helpful explanations of each parameter as
Find Quality Products Online at: sales@GlobalTestSupply.com
ELITEpro
www.GlobalTestSupply.com
39

DENT Instruments
In Depth Use of the ELITEpro XC and ELOG
Current Transformers Recommended CT Phase Shift Values
Clamp On CT-CON-0150EZ
CT-CON-1000
Split Core Small CT-SCS-0050
CT-SCS-0100
Split Core
Medium
Split Core Large CT-SCL-0600
Hinged Mini CT-HSC-020
Hinged Midi CT-HMC-0100
Revenue Grade
Toroidal Solid
Core
CT-SCM-0100
CT-SCM-0200
CT-SCM-0400
CT-SCM-0600
CT-SCL-1000
CT-HSC-050
CT-HMC-0200
CT-RGT12-0005
CT-RGT12-0020
CT-RGT12-0050
CT-RGT12-0100
1.10°
0.20°
2.20°
2.20°
1.75°
1.50°
1.30°
1.30°
0.00°
0.00°
0.75°
0.75°
0.12°
0.30°
0.00°
0.00°
0.00°
0.00°
Revenue Grade
Split Core
CT-SRS-005
CT-SRS-050
CT-SRL-100
CT-SRL-200
CT-SRL-400
-0.10°
-0.23°
0.06°
0.06°
-0.06°
Recommended CT Phase Shift Values
3) Click OK.
4) Check the Enable THD checkbox if you want total harmonic distortion to appear as a percentage in
the Data File Summary report. Selecting this option automatically populates any required value field
necessary to determine distortion.
ELITEpro
Find Quality Products Online at: sales@GlobalTestSupply.com
www.GlobalTestSupply.com
40

DENT Instruments
In Depth Use of the ELITEpro XC and ELOG
Once the Quick Setup is completed, the View Typical Setup button appears in the Quick Setup area of
the screen. Clicking this button displays a wiring diagram showing how to connect the CTs and the
voltage leads of the ELITEpro XC corresponding to the selected setup. The diagram can be printed and
carried into the field for easy reference during installation. Refer to ELOG Quick Setup Wiring Diagrams
for detailed information of each Quick Setup option.
Additionally, depending on the setup, Calculated Power Channels with configuration options display in
the lower section of the Setup Table screen.
HYSICAL POWER CHANNELS
P
The ELITEpro XC has four configurable hardware channels corresponding to the current.
1) Click on the maximize button in the upper right-hand corner of the Setup Table window to display as
much of the full screen as possible.
2) Click on the down arrow next to each channel you want to configure.
CT 1 must be placed on the phase listed as V High for Channel 1 in the ELOG setup table. CT2, CT3
and CT4 must also correspond to the appropriate phase as shown in Channels 2, 3, and 4 in the
ELOG setup table.
3) Select Power to turn on any channel. These channels refer to the current transformer inputs from
the ELITEpro XC. Selecting Power displays the options for configuring the channel.
4) Enter a name for the channel, then select the Voltage References, Current Transformers, and any
Recorded Values.
NOTE: The PT Ratio is used when monitoring voltages greater than 600 VAC (maximum rating of the
ELITEpro XC). Use an instrument grade transformer with low phase shift and high accuracy since errors
in the transformer will translate directly into errors in the recorded data. The PT Ratio value put into the
Setup Table in the logger should be the transformer primary:secondary ratio. This feature is useful when
monitoring high voltage loads such as found at a substation or on transmission lines.
For example, a potential transformer is used to monitor a 4160 VAC load. The transformer steps the
voltage down from 4160 to 120 VAC. The PT equals the transformer ratio or 4160/120 = 34.667. Thus,
34.667 would be used for the PT value in the channel Setup Table.
ELITEpro
Find Quality Products Online at: sales@GlobalTestSupply.com
www.GlobalTestSupply.com
41

DENT Instruments
In Depth Use of the ELITEpro XC and ELOG
CT Flipper: Quickly change the order of voltage references for a particular channel by clicking
the CT Flipper button. The CT Flipper can be found by clicking on the CT Type dropdown in the
Setup Table and clicking the CT Flipper button. A
been flipped.
The drop-down list in the Type field of the Current Transformers section contains a View All option that
opens the Select a CT from the list window displaying images of CTs with their recommended amps and
phase shift. Selecting a CT from that window automatically populates the Amps and Phase Shift fields
with the CT’s recommended values.
Double-click on any image.
-orSelect an image and click OK.
CAUTION: IF A PT (POTENTIAL
TRANSFORMER) IS NOT USED ON SERVICE
VOLTAGES GREATER THAN 600V, THE
ELITEPRO XC MAY OVERHEAT (OR
WORSE) CAUSING IRREPARABLE DAMAGE
AND EXTREME DANGER TO THE USER.
The Recorded Values of a power channel tell the logger what parameters you wish to record and can be
configured by selecting any combination of Volts, Amps, power (kW), volt-amps (kVA), power factor
(PF), and volt-amps-reactive (kVAR) as desired for each channel you turned on.
Find Quality Products Online at: sales@GlobalTestSupply.com
ELITEpro
www.GlobalTestSupply.com
pop-up window alerts you when the CT has
42

DENT Instruments
In Depth Use of the ELITEpro XC and ELOG
Copy Button: Clicking the “C” (copy) button at the end of the Recorded Values Row can be used
to quickly copy a
For a description of the Recorded Values and their formulas for the Calculated Power Channels, see
Calculated Power Channels.
set of recording flags from one channel to another.
The following options are available for configuring Physical Power Channels.
Physical Power Channel Options
Name
V High High-side voltage. This is the “high” reference
V Low Low-side voltage; reference for AC voltage. Choices are: L1, L2, L3, Neutral.
PT Ratio Potential Transformer turns ratio. This is used
Type This is the type of CT connected to the
Amps Depends on the type of CT selected. Displays
Phase Shift Compensate for CT Phase Shift with this setting.
Volts
Amps
KW
KVA
PF
KVAR
Name the channel so it describes the location or
item being monitored, such as "Water Heater"
or "Pump L1 Phase.” A maximum of 20
characters is allowed.
voltage that will be measured with respect to
the reference “low” voltage, V Low.
when a step-down transformer is needed to
measure AC voltages greater than 600V. The
default is 1.000.
ELITEpro XC
the value entered in the CT Size screen.
Default setting is 1.1 degrees.
To record any or all of these values use the
menu to select an option.
Optional
Choices are: L1, L2, L3, Neutral.
Choices are: MilliVolt or RōCoil.
Choices are: Average, Minimum, or
Maximum. In addition, the integrated
hourly value in an option where
appropriate.
ELITEpro
Find Quality Products Online at: sales@GlobalTestSupply.com
www.GlobalTestSupply.com
43

DENT Instruments
In Depth Use of the ELITEpro XC and ELOG
See Power Measurement—Connecting CTs and Configuring Channels for information on how to
properly configure the Setup Table for single-phase 2-wire, single-phase 3-wire, 3-phase 3-wire, and
3-phase 4-wire services.
ELITEpro
Find Quality Products Online at: sales@GlobalTestSupply.com
www.GlobalTestSupply.com
44

DENT Instruments
In Depth Use of the ELITEpro XC and ELOG
CALCULATED POWER CHANNELS
Channels 5 and 6 are the Calculated Power Channels. They combine the data from two or more power
channels (also called "hardware” or “physical channels") and are used primarily for calculating total
system volts, amps, kW, kVA, power factor, and kVAR in polyphase or multiple single-phase systems.
The Calculated Power Channels are frequently used to:
Record total system power parameters on three phase loads.
Optimize the logger’s memory by collecting and combining data from two or more channels instead
of collecting data from two (or more) separate channels.
For a description of the formulas used to compute channels 5 & 6 based on the CT input channels 1–4,
see Appendix D—Calculated Power Channel Formulas.
Combining Channels
To combine channels and maximize memory use:
1) Depending on your setup table configuration, ensure that the Physical Power Channels you wish to
combine are set to Power.
It is recommended that the Recorded Values flags of Volts, Amps, kW, kVA, PF, and kVAR for the
individual channels be left on. However, if maximum use of the memory is required, they can be
turned off.
Default recording flags may have the Average checkbox selected in each drop-down menu for the
Recorded Values.
2) Under Calculated Power Channels, turn on the channel by selecting Power Sum from the Channel 5
menu. Perform the same function for Channel 6, if desired.
3) Enter a name for the Calculated Power Channels (optional).
4) Select the Physical Power Channels to be added together in the Combine Channels box.
5) Set each recording flag for Volts, Amps, kW, kVA, PF, and kVAR as desired.
6) Click Send Setup Table to Logger to send the setup table to the logger and make it the active table.
ELITEpro
Find Quality Products Online at: sales@GlobalTestSupply.com
www.GlobalTestSupply.com
45

DENT Instruments
In Depth Use of the ELITEpro XC and ELOG
The following graphic is an example of a Setup Table for a 3-phase 4-wire connected load using a
Calculated Power Channel with Combine Channels 1, 2, and 3 selected to optimize memory usage on
the ELITEpro XC.
NOTE: The Recorded values listed to the right of the Current Transformers section on the Setup Table
are not shown in this graphic.
ANALOG OUTPUT CHANNELS (ELITEPRO XC ONLY)
NOTE: Turn the analog channels on/off by choosing an option from the drop-down list.
1) Select Current/Voltage/Off from the drop-down menu for the channel type. Additional fields display
on the Setup Table screen when an analog channel current or voltage is selected.
2) Enter a descriptive name in the Name field to identify your measurement. This name appears in the
retrieved logger data header.
3) Enter the raw sensor output minimum/maximum values. This data is typically found on the data
plate or data sheet of the sensor. Typical values for voltage devices are 0-5, 1-5, 0-10, 0-15, 0-30 for
voltage devices and 0–20, 4-20 for current loop devices.
ELITEpro
Find Quality Products Online at: sales@GlobalTestSupply.com
www.GlobalTestSupply.com
46

DENT Instruments
In Depth Use of the ELITEpro XC and ELOG
To troubleshoot or calibrate a current or voltage sensor, it is convenient to set the physical
range fields to be equal to the electrical output values. The Real Time Values readings
be compared directly with voltage or current measurements taken from a DVM. Offset or gain
errors can be corrected by adjusting the minimum value or span (max-min).
4) Enter the corresponding engineering value to the sensor range (i.e., psig), the units, and the
average, minimum, and/or maximum record.
5) Click Send Setup Table to Logger to load the configuration into the data logger.
Best practices are to confirm the operation of all sensors. Use Logger > Display Real Time Values > Show
as Text or click the Display Real Time Text Values speed button before commissioning the logger for
prolonged data logging projects.
can then
SEND A SETUP TABLE TO THE LOGGER
When you’ve finished selecting the configuration options, the setup table needs to be sent to the
ELITEpro XC.
1) After connecting to the logger, click on one of the SEND
SETUP TABLE to Logger command buttons on the Setup
Table screen. Separate buttons are available at the top
and lower left of the Setup Table screen. Sending a new
setup table to the logger deletes any data still stored in the logger. ELOG displays the following
dialog box to ensure desired data is not lost:
2) Click Send SUT and Delete Data. This loads the new setup table into the meter and clears the data in
the logger. The Logging is now ON dialog box briefly displays.
-orClick Download Data then Send SUT. The Select A Directory and A Name… dialog box displays.
Enter the name and location for the data file. After the data is downloaded to the PC and saved,
ELOG automatically sends the new setup table to the meter and starts logging.
-orClick Cancel.
Find Quality Products Online at: sales@GlobalTestSupply.com
ELITEpro
www.GlobalTestSupply.com
47

DENT Instruments
In Depth Use of the ELITEpro XC and ELOG
ELOG automatically initiates logging when a setup table is downloaded to the logger unless the Data
Logging delayed start time is being used.
3) Select Logger > Display Real-Time Values > Show As Text to view the real-time values measured by
the logger.
SAVE A SETUP TABLE ON THE COMPUTER
When you’ve finished selecting the configuration options, the setup table can also be saved for
downloading to the ELITEpro XC at a later time.
Select File > Save to save the setup file to the hard drive or Save As to save to the hard drive using a
different file name or folder location.
Monitoring can begin once the ELOG software is configured and the ELITEpro XC is connected. The
following sections of this chapter provide assistance in making sure the logger is performing correctly.
LED Diagnostics
PHASECHEK™ LEDS
PhaseChek is a unique feature of DENT meters that simplifies installation by ensuring proper CT-tovoltage phase installation and avoiding faulty data collection.
The ELITEpro XC has four tri-color PhaseChek LEDs, one green/red/blue LED for each CT input. These
LEDs provide the following information:
All LEDs are green—the system power factor is greater than 0.55 and the CTs are properly placed on
the corresponding voltage phases and the CT is oriented properly (arrow toward the load).
ELITEpro
Find Quality Products Online at: sales@GlobalTestSupply.com
www.GlobalTestSupply.com
48

DENT Instruments
In Depth Use of the ELITEpro XC and ELOG
If the total system power factor is less than 0.55, the LEDs will be red even if connected
properly. This situation is rare but could occur if, for example, the load
lightly loaded electric motor. It is common for an individual phase power factor to be less than
0.55 and the corresponding LED will be red.
If the Physical Power Channel (CT) is turned off in the setup table, the corresponding
PhaseChek LED will be dark.
LED is red—there is a CT voltage phase placement error (or the Power Factor is less than 0.55)
LED is blue—the CT is on backwards (-kW) with the arrow pointed away from the load
LED flashes red and blue—CT is on backwards and on the wrong voltage phase
to be monitored is a
COMM—COMMUNICATIONS LED
The ELITEpro XC COMM LED flashes different colors (green, blue, red) to indicate that the logger is
connected, logging information, and communicating with the computer. Green will flash approximately
once per second when the ELITEpro XC is logging and communicating with the computer.
Find Quality Products Online at: sales@GlobalTestSupply.com
ELITEpro
www.GlobalTestSupply.com
49

DENT Instruments
In Depth Use of the ELITEpro XC and ELOG
Power Measurement—Connecting Sensors & Configuring Channels
The ELITEpro XC can monitor AC power loads ranging from 1-phase, 2-wire to 3-phase, 4-wire systems
and up to 600 VAC at 50 or 60Hz.
Read all warning symbols described in the Safety section AT THE BEGINNING OF THIS MANUAL.
Use the proper Current Transformers (CTs) for the load being monitored. For a complete discussion on
this, see the section Current Transformer (CT) Selection below.
CAUTION: DO NOT USE UNSHUNTED CTs. ONLY USE SHUNTED CTS FROM DENT INSTRUMENTS
WITH 333 mVAC OUTPUT. ALL DIAGRAMS IN THIS SECTION SHOW THE CT PHASING ARROW
POINTING TOWARD THE LOAD.
Always orient the arrow on the CT towards the load or as otherwise indicated on the CT. All diagrams in
this section will show the CT phasing arrow oriented towards the load. If the CT was accidently
installed backwards and access to reverse it is not possible, the “CT Flipper” function can be accessed
by clicking the CT “Type” in the “Logger Setup Table.” See Physical Power Channels
.
WARNING: Use of this device in a manner for which it is not intended may impair its means of
protection. Do not exceed 600 VAC voltage inputs!
When connecting the ELITEpro XC to an AC load, follow these steps in sequence to prevent a shock
3. Connect the voltage leads to the different phases. Use proper safety equipment (gloves,
mask, and protective clothing) as required for the voltages monitored.
hazard.
1. If possible, de-energize the circuit to be monitored.
2. Connect the CTs to the phases being monitored.
ELITEpro
Find Quality Products Online at: sales@GlobalTestSupply.com
www.GlobalTestSupply.com
50

DENT Instruments
In Depth Use of the ELITEpro XC and ELOG
U.S. color conventions are used in the document’s diagrams. ELITEpro XC meters supplied for
international markets are provided with 5 colors of voltage leads: red, black, blue, white, and
yellow. The voltage lead sockets on the meter are all black in color
N.
The UL listing covers the use of the following DENT Instruments CTs that are UL Recognized and
have been evaluated to IEC 61010
CT-HSC-020-X (20A Mini), CT-HSC-050-X (50A Mini), CT-HMC-0100-X (100A Midi), and the CTHMC-0200-X (200A Midi), and CTs that are UL listed to UL2808.
WIRING LABEL CONVENTIONS
When connecting the voltage wires to the AC line, the following wire colors should be used for the
different phases:
Voltage
Phase
L1 phase Black Follow local code
L2 Phase Red Follow local code
L3 Phase Blue Follow local code
Neutral White Follow local code
United States
(Voltage Phase Color)
ELITEpro XC Voltage Phase Wire Colors
CURRENT TRANSFORMER (CT) SELECTION
International
(Voltage Phase Color and Wire Label)
and labeled L1, L2, L3, and
-1:
Though all other CTs provided by DENT Instruments have been tested and certified to the same IEC
61010-1 standard by other Nationally Recognized Testing Laboratories (NRTLs), the use of any other CT
will invalidate the UL Listing of the ELITEpro XC. This is simply a decision made by UL, and in the opinion
of DENT Instruments, all CTs provided are equally safe to use.
Proper CT selection is critical for accurate results. Use CTs with the smallest diameter to fit around the
wire(s), and whose rated amperage is not less than 100% of the largest load expected.
Generally, best CT accuracy will result when the load operates as close to the full rating of the CT as
possible. Do not use CTs whose maximum current rating greatly exceeds the maximum current of the
load of the item being monitored.
The following table contains a list of some of the DENT Instruments CTs.
Find Quality Products Online at: sales@GlobalTestSupply.com
ELITEpro
www.GlobalTestSupply.com
51

DENT Instruments
In Depth Use of the ELITEpro XC and ELOG
You can extend the leads for a
loss of accuracy, provided that the new wire is of the same gage or
than the CT lead wire.
Small
Mini
Split
Midi
Core
20A 50A 100A 100A 600A 150A 5A 5,000A
50A 100A 200A 200A 1000A 50A
400A 100A
600A 200A
400A
Medium
Split
Core
Large
Split
Core
Clamp-
On
Revenue
Grade
Split
Core
RōCoil
(Rogowski)
Current Ratings of CTs Available from DENT Instruments
These are internally shunted CTs (333.3 mV output) which make them safe to handle even when
connected to an energized wire. They are also case-insulated for 600V phase-to-phase service. Do not
use on services with higher voltages.
The following table is a list of the UL recognized (61010-1) CTs that maintain the UL listing.
Mini Midi Revenue Grade
RōCoil
(Rogowski)
CT-HSC-020-U CT-HMC-0100-U CT-SRS-005 CT-RXX-1310-U
CT-HSC-050-U CT-HMC-0200-U CT-SRS-050 CT-RXX-A4-U
CT-SRL-100
CT-SRL-200
CT-SRL-400
UL Recognized CTs
RōCoil up to 100 feet and a split core up to 1000 feet without a
larger
CAUTION: DO NOT USE UNSHUNTED CTs. ONLY USE SHUNTED CTS WITH 333 mVAC OUTPUT. ALL
DIAGRAMS IN THIS SECTION SHOW THE CT PHASING ARROW POINTING TOWARD THE LOAD.
ELITEpro
Find Quality Products Online at: sales@GlobalTestSupply.com
www.GlobalTestSupply.com
52

DENT Instruments
In Depth Use of the ELITEpro XC and ELOG
If a utility already has a meter with a 5A secondary CT(s) connected to a load being monitored,
you may connect a 5A split core CT around the
calculate the CT value to be used in the Logger setup table, multiply t
ELITE
40,000 for the value of the CT in the logger Setup Table.
Correct polarity is required to ensure proper orientation of the CT. A CT with the lead wires
switched on the connector is the same as
CT SELECTION EXAMPLES
The following table provides three example scenarios for selecting the proper CT.
Example Scenario Description Correct CT
1
2
3
A single-phase motor with a 20 amp breaker (rated as 10
amps running load) with #12 wire.
Four lighting circuits, #12 wires with 20 amp breakers. When
all lights are on, the amperage measures 45 amps.
A single heating circuit, with a 2/0 conductor and a 60 amp
breaker.
Use a 20 or 50 amp split core or 150
amp clamp-on
Use a 50 amp CT
Use a 100 amp CT
Example Scenarios for CT Selection
output (secondary) of the utility’s CT. To
he utility CT ratio by the
pro XC CT size (e.g. if the utility CT is 4000:5 and the DENT CT is 50A use (4000/5) x 50 =
CONNECTING CTS AND CONFIGURING CHANNELS
This section describes how to connect the CTs and the voltage leads to different service types, and how
to configure the ELITEpro XC channel(s) for monitoring.
1) Connect each CT lead to the channel pins of the black connector termination block.
For each channel, the left connector pin is the positive, or high-side, wire and the right pin is the
negative, or low-side. Connect DENT Instruments-supplied current transformers as follows:
Split-core CTs (removable leg) and hinged CTs—The white CT wire is (+) and the black wire is (-)
Clamp-on CTs (clothes pin type)—The red lead is the (+) wire and the black lead is the (-)wire
RōCoils— The white lead is the (+) wire and the brown lead is the (-) wire (bare wire is shield)
putting the CT on the monitored wire backwards.
ELITEpro
53
Find Quality Products Online at: sales@GlobalTestSupply.com
www.GlobalTestSupply.com

DENT Instruments
In Depth Use of the ELITEpro XC and ELOG
ELITEpro XC End View of CT and Voltage Lead Connections
CT Connections
Voltage Lead
Connections
2) Apply the CTs to the phases being monitored observing proper CT orientation.
3) If there is an arrow on the CT label, the label should point towards the load. Otherwise, use the
instructions printed on the CT, for example: “This Side Toward Load.”
4) Connect the voltage leads to the different phases. Connect the Neutral wire first, then the remaining
voltage sense (phase) wires.
ELITEpro
Find Quality Products Online at: sales@GlobalTestSupply.com
www.GlobalTestSupply.com
54

DENT Instruments
In Depth Use of the ELITEpro XC and ELOG
ELOG QUICK SETUP WIRING DIAGRAMS
When a Quick Setup is selected, the View Typical Setup button appears in the Quick Setup area of the
screen. Clicking this button displays a wiring diagram that corresponds to the selected setup, showing
how to connect the CTs and the voltage leads of the ELITEpro XC. The diagram can be printed and
carried into the field for easy reference during installation.
The following pages show the diagrams available for each Quick Setup.
Typical Single Phase, 2-Wire Setup Diagram
ELITEpro
Find Quality Products Online at: sales@GlobalTestSupply.com
www.GlobalTestSupply.com
55

DENT Instruments
In Depth Use of the ELITEpro XC and ELOG
Typical Single Phase, 3-Wire Setup Diagram
ELITEpro
Find Quality Products Online at: sales@GlobalTestSupply.com
www.GlobalTestSupply.com
56

DENT Instruments
In Depth Use of the ELITEpro XC and ELOG
Typical 3 Phase, 3-Wire Delta Setup Diagram
ELITEpro
Find Quality Products Online at: sales@GlobalTestSupply.com
www.GlobalTestSupply.com
57

DENT Instruments
In Depth Use of the ELITEpro XC and ELOG
Typical 3 Phase, 4-Wire Wye Setup Diagram
ELITEpro
Find Quality Products Online at: sales@GlobalTestSupply.com
www.GlobalTestSupply.com
58

DENT Instruments
In Depth Use of the ELITEpro XC and ELOG
Menus
Speed Button
Toolbar
Connection
Window
Status
Using the ELOG Software
When ELOG starts, the window is empty until a task is requested, whether that be opening an existing
Setup Table, creating a new one, or importing a data file. The following window displays with the ELOG
menus and buttons for accessing frequently used ELOG features.
ELOG SPEED BUTTONS
The ELOG speed buttons enable users to quickly navigate between commonly used functions. For
example, to connect between the computer and the ELITEpro XC over a serial or Bluetooth connection,
use the button instead of the menu commands Logger > Communication > Connect Via... The button
toolbar can be toggled on and off by selecting the View > Toolbar option. A description of each button
follows.
New Create a new Setup Table, Logger List, Data File (download), or Graph
Open Open an existing Setup Table, Logger List, Data File, or Graph
Save Use to save changes to modified items in ELOG
Cut Performs the standard cut data function
Copy Performs the standard copy data function
ELITEpro
Find Quality Products Online at: sales@GlobalTestSupply.com
www.GlobalTestSupply.com
59

DENT Instruments
In Depth Use of the ELITEpro XC and ELOG
Paste Performs the standard paste data function
Print Print the active window
Direct Connection
Network
Connection
Choose from last
used Logger List
Disconnect Quickly disconnect from a direct connection
Cancel COMM OP Cancel the current communication operation
Display Real Time
Text Values
Retrieve Logger
Data
Setup PC Quickly access computer setup configurations
Use for connecting the logger to the computer when using a USB cable or
Bluetooth
Use for Wi-Fi, Access Point-to-Point mode, or Ethernet connection
Use to connect to a logger on a Logger List
Selecting this option displays the Instantaneous Channel Values screen
Select this option to quickly retrieve logged data from the connected logger
Create Graph
UnZoom Graph Use to zoom out of an expanded graph
Help Topics Opens the ELITEpro XC Manual
Create a graph from an open data file, available under the Data dropdown
menu
ELITEpro
Find Quality Products Online at: sales@GlobalTestSupply.com
www.GlobalTestSupply.com
60

DENT Instruments
In Depth Use of the ELITEpro XC and ELOG
FILE MENU
The File menu has options similar to that of other software products, such as a Print Setup and a list of
recently accessed files. Descriptions of other options are below:
File > New creates a new file. There are four file types that are available for ELITEpro XC loggers.
ELOG Data File—contains data retrieved from a logger. If the computer is already connected to a
logger, enter the file name for the data about to be retrieved from the logger. If the computer is not
connected to a logger, ELOG requests the logger be connected from which the new data file will be
extracted.
Graph File—contains graphs created from logger data. Selecting Graph File opens a folder window
where you may choose from already existing data files. Choose the one you wish to use to create a
graph.
Logger List File—displays groups of loggers used with AutoPoll, an automatic data collection
application that is bundled with ELOG. Once chosen, you will be shown the folder where the Logger
Lists reside and be allowed to select one for review or editing. (Logger Lists are used by AutoPoll for
unattended data retrieval by the computer.)
ELITEpro
Find Quality Products Online at: sales@GlobalTestSupply.com
www.GlobalTestSupply.com
61

DENT Instruments
In Depth Use of the ELITEpro XC and ELOG
Setup Table File—If you are not already connected to a
logger, ELOG prompts you to select the logger type for
which you want to create a new Setup Table. If you are
already connected to a logger, ELOG assumes that the
Setup Table you are about to create is for the logger type
to which you are connected.
File > Open accesses an existing file, prompting you to select
the file type. It operates the same whether or not you are connected to a logger.
The File > Save and File > Save As functions allow for the saving of an open file of any type. Save As
allows for saving to a new location or new name.
The File > Export Data File allows you to export a data file to a .csv file for use in another application.
The File > Import CSV File allows you to import a .csv file into ELOG.
ELITEpro
Find Quality Products Online at: sales@GlobalTestSupply.com
www.GlobalTestSupply.com
62

DENT Instruments
In Depth Use of the ELITEpro XC and ELOG
EDIT MENU
The ELOG Edit Menu has the standard Windows Cut, Copy, and Paste options.
VIEW MENU
The View menu is used to display ELOG features in the ELOG window. Each display may be turned on or
off in the window by clicking on the corresponding menu option.
The Connection Window appears at the bottom of the screen during connection to a logger and
provides information about the logger, communication port, baud rates, etc. Refer to Communicate with
the ELITEpro XC in Section 1 for more information.
The Toolbar option enables/disables the row of ELOG “Speed” buttons under the main menu.
The Status Bar option enables/disables information at the bottom of the ELOG window.
ELITEpro
Find Quality Products Online at: sales@GlobalTestSupply.com
www.GlobalTestSupply.com
63
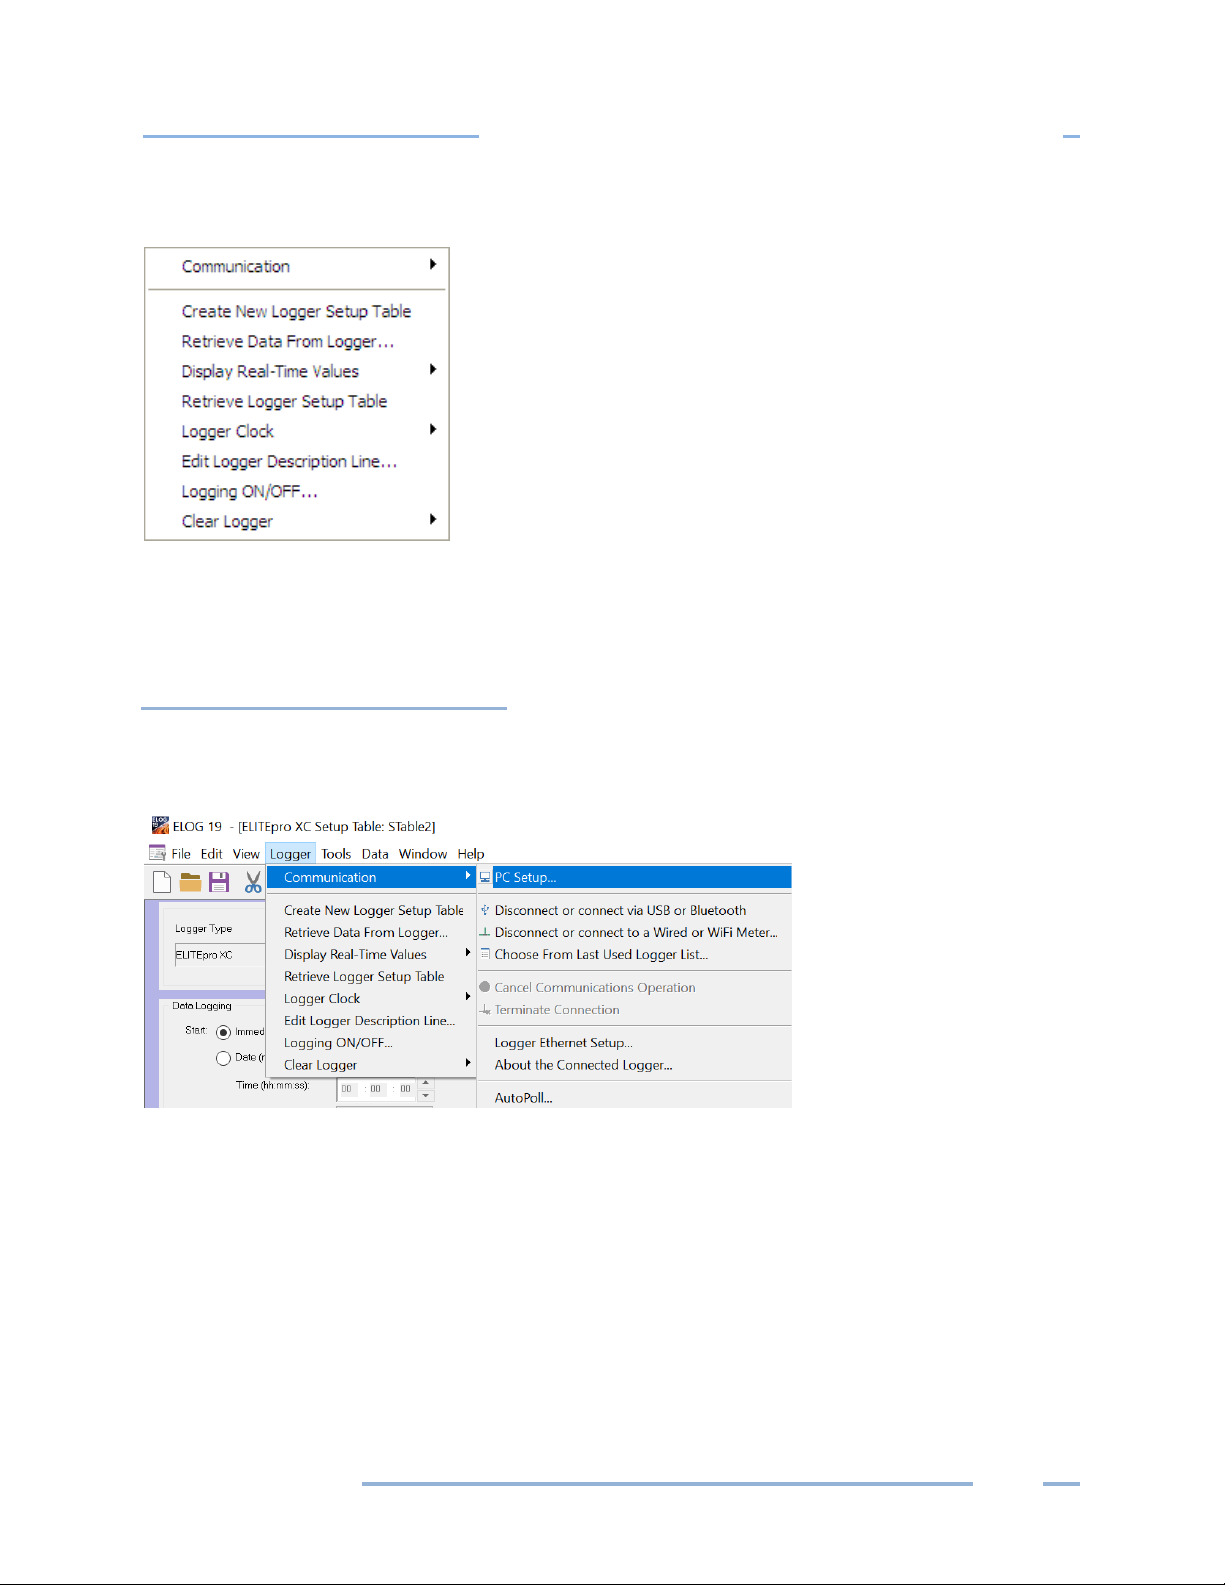
DENT Instruments
In Depth Use of the ELITEpro XC and ELOG
LOGGER MENU
The Logger menu is used to configure the ELITEpro XC, view channel data in real time, download logger
data, and set communication parameters. Graphing and analysis functions are found under the Data
menu.
Communication Sub-Menu
Use the options on the Communication sub-menu to establish a connection between the computer and
the ELITEpro XC.
ELITEpro
Find Quality Products Online at: sales@GlobalTestSupply.com
www.GlobalTestSupply.com
64
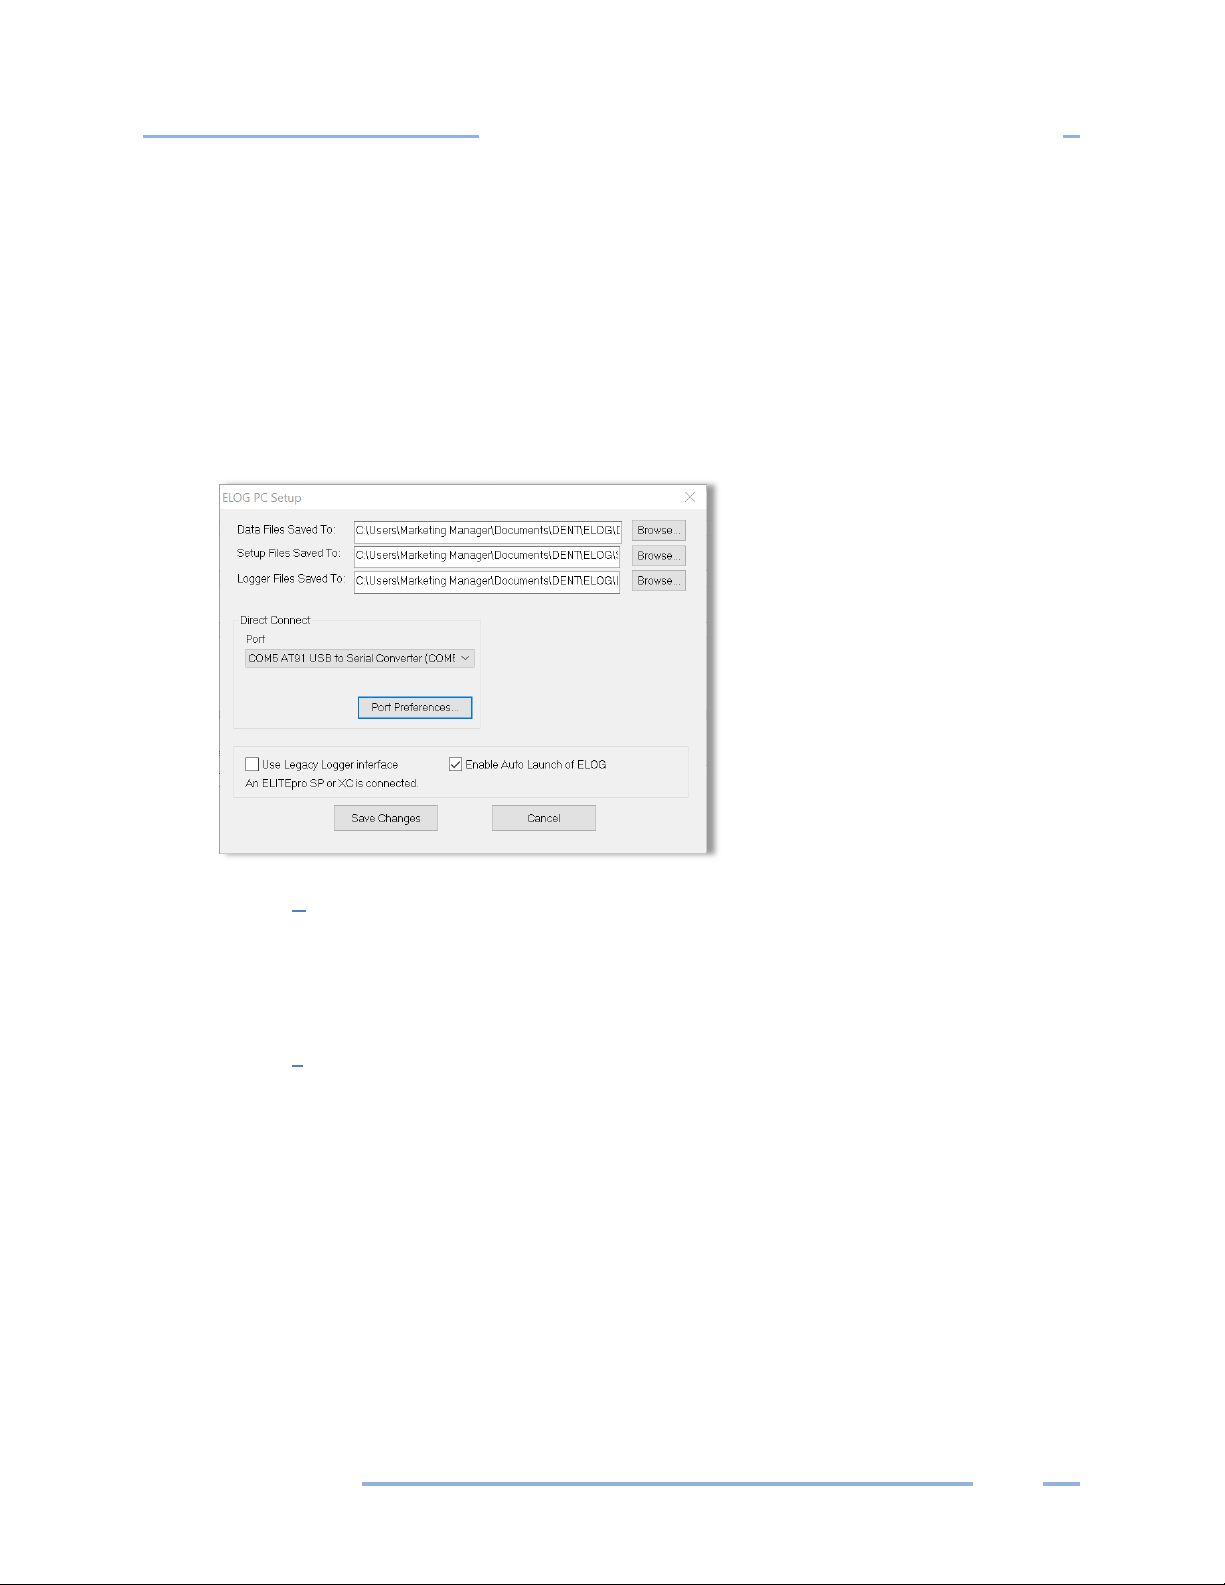
DENT Instruments
In Depth Use of the ELITEpro XC and ELOG
The options on the Communication sub-menu determine how communication with the ELITEpro XC is
established and where logger information is saved.
PC Setup
Use this option to set the default location for data, setup tables, and logger files. You can also
set the default PC communication ports here. To enable legacy menu items for customers using
legacy logger products, select the Use Legacy Logger interface checkbox and then choose Save
Changes. The ELOG software will only display features and menus relevant to legacy products
unless you connect to a new product. See Tools Menu, PC Setup for further information.
Connect via USB or Bluetooth
This option is used to connect ELOG to a logger via a direct USB cable connection to the PC or
with Bluetooth wireless technology. A connect message appears on the screen in the Connection
window. See Appendix E—Communication Options.
Connect via Ethernet or Wi-Fi…
This option is used to connect ELOG to a logger over a network via an Ethernet, Wi-Fi, or Access
Point-to-Point Mode connection. See Appendix E—Communication Options.
ELITEpro
Find Quality Products Online at: sales@GlobalTestSupply.com
www.GlobalTestSupply.com
65

DENT Instruments
In Depth Use of the ELITEpro XC and ELOG
Choose From Last Used Logger List…
Use this option to connect to a logger contained in a recently used logger list.
Cancel Communications Operation
During any communication operation between the computer and the logger (connecting,
retrieving data, viewing real time values), this option may be used to cancel the current
communication command.
Terminate Connection
Use this option to end the connection between the PC and the logger.
Logger Ethernet Setup…
Enter the IP Address, Local Port Number and, if needed, the Subnet Mask and Gateway Address
to connect the logger to a network via an Ethernet cable. This is the same IP address and Port
Number you enter in the Network Connect dialog box to connect via Ethernet with ELOG. Select
Update Logger to send the new Ethernet Setup to the logger or Cancel to close the window
without updating the logger. See Appendix F—Detailed Connection Options.
ELITEpro
Find Quality Products Online at: sales@GlobalTestSupply.com
www.GlobalTestSupply.com
66

DENT Instruments
In Depth Use of the ELITEpro XC and ELOG
Logger WiFi Setup
Use this option to set up your Wi-Fi network. Click Help to find information on how this setup is
used. Select Update Logger to send the new Wi-Fi Setup to the logger or Cancel to close the
window without updating the logger. Appendix E—Communication Options.
Logger Web/Mobile App Login Password
Use this option to create a password for accessing your Wi-Fi from the web or a mobile device.
Appendix E—Communication Options.
ELITEpro
Find Quality Products Online at: sales@GlobalTestSupply.com
www.GlobalTestSupply.com
67

DENT Instruments
In Depth Use of the ELITEpro XC and ELOG
About The Connected Logger…
This option displays a text window containing information about the currently connected
logger’s properties, such as logger type, firmware version, description, etc., and information
about built-in communication options, if any. Click Refresh to retrieve new information (for
example, if the number of records used is changing) or OK to close the window.
AutoPoll
AutoPoll is a standalone Windows program (supplied with ELOG) that may be used for
unattended and automatic data retrieval from a number of remote loggers where the PC
connects to the loggers. A complete description of AutoPoll can be found in a separate
document: AUTOPOLL: Unattended Data Collection.
ELITEpro
Find Quality Products Online at: sales@GlobalTestSupply.com
68
www.GlobalTestSupply.com

DENT Instruments
In Depth Use of the ELITEpro XC and ELOG
Retrieve Data From Logger
Retrieves data from the logger and saves it as an .elog file on the hard disk. The Select A Directory And A
Name… dialog box displays prompting you for a file name. The default name is the logger serial number
plus two digits that correspond to the number of times that data has been retrieved from the logger,
however, at this point you may name the data file whatever you wish.
There are two checkboxes in the lower left of the dialog box to select if you want to add (append) the
data to an existing file and/or create an ASCII file of the data.
When a logger’s memory is downloaded, the data may be added or “appended” to an already existing
file from the same logger. Check the Append New Data To Existing Data File box. The name of the
dialog box changes to Select a Data File to Append Data To. Select the file to which you wish to add the
data.
ELITEpro
Find Quality Products Online at: sales@GlobalTestSupply.com
www.GlobalTestSupply.com
69

DENT Instruments
In Depth Use of the ELITEpro XC and ELOG
The selected file must have used the same Setup Table of the earlier downloaded data. Selecting a file
with different Setup Table parameters than those in the logger causes the following warning to display:
When the data is retrieved, a second comma separated value format (.csv) file can be created at the
same time as the .elog data file is being downloaded. A .csv file is also called a “flat file,” or “ASCII file”
and can be opened in other applications such as Excel.
The data is saved to the folder specified in Tools > PC Setup > Data Files Saved To: unless changed in the
Select a Directory and A Name… window. The default data folder is
C:\Users\UserName\Documents\DENT\ELOG\Data.
To view a data file, use Data > Open Data File and then select the desired file.
Even if not downloaded as a .csv file, the original binary .elog data files may at any time be exported to a
comma delimited ASCII file with a .csv extension. See the Export Data File section for more information.
ELITEpro
Find Quality Products Online at: sales@GlobalTestSupply.com
www.GlobalTestSupply.com
70

DENT Instruments
In Depth Use of the ELITEpro XC and ELOG
Display Real-Time Values Sub-Menu
The Display Real Time Values option shows instantaneous readings for channels in use in either a textual
or graphical format. Real-Time Values are an excellent way to verify the correct installation of a meter.
Real-Time Values may be displayed in either a textual or graphical format.
Show As Text
When this option is selected, a screen similar to the one on the following page displays. All channels
that are turned on (even if not being recorded) are displayed simultaneously. If a parameter is being
recorded by the logger, it will be shaded in green as shown in the Real-Time Channel Values window
(see next page). For a Power Channel, all six power parameters (V, A, kW, kVA, PF, and kVAR) are
displayed even if only one of the parameters is recorded.
This feature is useful for verifying correct installation of the logger. This screen provides information
about:
The real-time data (which can be paused for cross-channel comparisons)
The Line Frequency as measured between L1 and L2
How much memory has been used and how many days the memory has remaining before filling
The logger clock’s current date and time
Whether or not the data logging is turned on
Type of memory: Linear (Stop When Full) or Ring (Continuous)
ELITEpro
Find Quality Products Online at: sales@GlobalTestSupply.com
www.GlobalTestSupply.com
71

DENT Instruments
In Depth Use of the ELITEpro XC and ELOG
Click Exit to close the window.
Show As Graphs
This menu selection displays the data as a graph instead of the text format described previously.
Select Logger > Display Real-Time Values > Show as Graphs to display the following dialog box.
1) Select any or all physical power channels currently turned on in the logger in the Hardware
Channels To Display section.
-orSelect one or both calculated power channels currently turned on in the logger in the Summing
Channels To Display section.
Selecting a power channel activates the Parameters To Display option. You can only select one variable
at a time to graph. This is not like a text display option where parameters are viewed simultaneously.
This is due to differences in scaling and to reduce clutter on the graph. For example, you could display
kW from four channels simultaneously but not a kW and a KVAR even if it is from the same channel.
ELITEpro
Find Quality Products Online at: sales@GlobalTestSupply.com
www.GlobalTestSupply.com
72

DENT Instruments
In Depth Use of the ELITEpro XC and ELOG
2) Select a parameter to chart.
3) Select OK to view the graph.
The graph begins on the left edge and moves to the right. When it reaches the right edge, the entire
graph scrolls to the left with each new reading. This always displays the most current data values
and the older points slide off the left edge.
Use Set X and Y Axis to set the scaling and the line type (e.g., linear or logarithmic). You can also set
the amount of time data is graphed. This can vary from 1 second to more than 18 hours (65,000
seconds). Note that the X-axis scaling is only approximate.
ELITEpro
Find Quality Products Online at: sales@GlobalTestSupply.com
www.GlobalTestSupply.com
73

DENT Instruments
In Depth Use of the ELITEpro XC and ELOG
Use Export Graph to save the graph in a graphical or textual format. Graphs can be saved in an .emf,
.wmf, .bmp, .jpg (default), or .png format. You can select where the graph goes (clipboard, file, or
printer) and what measurements (pixels, millimeters, inches, points) are used to save the graph.
Waveform Capture
Select Logger > Display Real-Time Values > Waveform Capture to view the actual current, voltage
and power waveform. The first capture is, by default, channel 1, but you can select different
channels (logging off or on) to view and copy the waveform to the clipboard for pasting into other
programs or for printing.
Harmonics
ELITEpro
Find Quality Products Online at: sales@GlobalTestSupply.com
www.GlobalTestSupply.com
74

DENT Instruments
In Depth Use of the ELITEpro XC and ELOG
The individual harmonic values and THD can be shown as a percentage of the fundamental
(IEEE Standard 1035
Select Logger > Display Real-Time Values > Harmonics to see the actual harmonic content in the
current, voltage, and power waveforms. A typical display is shown here:
The selections on the lower left side of the window select the displayed Channel. Only one channel
may be viewed at a time. The voltage and current harmonics are presented graphically in the upper
part of the window. The ordinate (y-axis) is scaled in percent of the fundamental. The abscissa (xaxis) is the harmonic. Both even and odd harmonics plus DC are shown.
The actual value of the voltage and current for each harmonic may be found in the Harmonic Values
section. By clicking on the arrow buttons, higher and lower order harmonics may be selected.
Though only the first 31 harmonics are displayed in the graph, the Harmonic Values function can be
used to view the values up to the 63 harmonics. The Waveform Values section provides summary
statistics for the overall voltage and current waveforms. This includes the RMS value, THD, Peak
values, Crest Factor, Line Frequency, and K-Factor.
-1989) or as a percentage of the total RMS value (CSA and IEC standard).
The image in the upper section of the Harmonic Analysis window is a single waveform snapshot. The
first image is, by default, Channel 1, but you can select different channels and update the image,
copy the image to the clipboard for pasting into other programs, or print the image.
You can also record the harmonic values to your PC and then view a log of the harmonics in a
spreadsheet. When you click Record to PC the Harmonic Logging Parameters dialog box displays.
ELITEpro
Find Quality Products Online at: sales@GlobalTestSupply.com
www.GlobalTestSupply.com
75

DENT Instruments
In Depth Use of the ELITEpro XC and ELOG
1) Select the Waveform Summary Data check box to create a “single column” of data in a spreadsheet
stored on the PC. The data is the average harmonic content for each harmonic of the first 31
harmonics over the period of time the harmonic data is collected.
Selecting Raw Harmonic Data creates a spreadsheet with the information above and a “row” of
the 31 harmonics for each update of the logger. Since the logger updates faster than one time
per second, selecting this option will create a LOT of data quickly!
2) Click OK and the recording begins.
The Record to PC button now reads Stop Recording on the Harmonics Analysis screen. Click that
button to stop recording harmonic values to the PC.
3) Click View PC Log to open a file of recorded harmonic values in a spreadsheet on your computer.
Realtime Peak Demand
When a logger is connected with Power 5 and/or Power 6 Channels on, select Logger > Display RealTime Values > Realtime Peak Demand to request a report showing peak demand and totalizer
values directly from the logger instead of from a data file.
ELITEpro
Find Quality Products Online at: sales@GlobalTestSupply.com
www.GlobalTestSupply.com
76

DENT Instruments
In Depth Use of the ELITEpro XC and ELOG
Retrieve Logger Setup Table
This function instantly retrieves the Setup Table in the logger so it can be viewed, edited, resent to the
logger, or saved to the hard drive.
Logger Clock Sub-Menu
This function is used to set the logger’s internal clock time and date. You may change the clock manually
or synchronize it to the computer's clock. Note that the logger clock is actually set to UTC (also known as
Greenwich Mean Time). When reading the logger clock or viewing data files, ELOG reads the Windows
settings and converts the UTC time stamps in the logger to the local time zone of PC. If two PCs in
different time zones retrieve a data file from the logger, or read the logger clock, they will see different
times.
Set the logger’s internal clock and date using the following menu option: Logger > Logger Clock. You
may change the clock manually or synchronize it to the computer's clock.
Manually Set Logger Time
Use this option to manually set the date and internal clock. The date format defaults to what is used
by the time settings on your PC (mm/dd/yy or dd/mm/yy) and the clock uses a 24-hour format.
Synchronize Time To Match PC
ELITEpro
Find Quality Products Online at: sales@GlobalTestSupply.com
www.GlobalTestSupply.com
77

DENT Instruments
In Depth Use of the ELITEpro XC and ELOG
Use this option to read the computer clock and automatically update the logger.
Edit Logger Description Line
This option allows you to change the user-defined, one-line description stored in the logger. The
Description Line can help identify the specific logger after the logger is retrieved from the field.
Logging ON/OFF
This option starts or stops data collection.
ELITEpro
78
Find Quality Products Online at: sales@GlobalTestSupply.com
www.GlobalTestSupply.com

DENT Instruments
In Depth Use of the ELITEpro XC and ELOG
Clear Logger Sub-Menu
There are three options for clearing data stored in the Logger: Clear all logger data, Clear only peak
demand values (kW, kVA, & kVAR), or Clear only KWh, KVARh, KVAh, etc., totals. After the data is
deleted, it cannot be retrieved.
Do not select any options until you are sure that all information should be deleted from the logger.
Clear ALL Logger Data
Clears all data in the logger memory, including Peak Demand and Totals. Once deleted, it cannot
be retrieved.
Clear ONLY Peak KW, KVAR, and KVA Demand…
Clears only the peak demand values, kW, kVA, & kVAR. Once deleted, it cannot be retrieved.
Clear ONLY KWh, KVARh, KVAh, etc. Totals…
Clears only cumulative totals. Once deleted, it cannot be retrieved.
ELITEpro
Find Quality Products Online at: sales@GlobalTestSupply.com
www.GlobalTestSupply.com
79
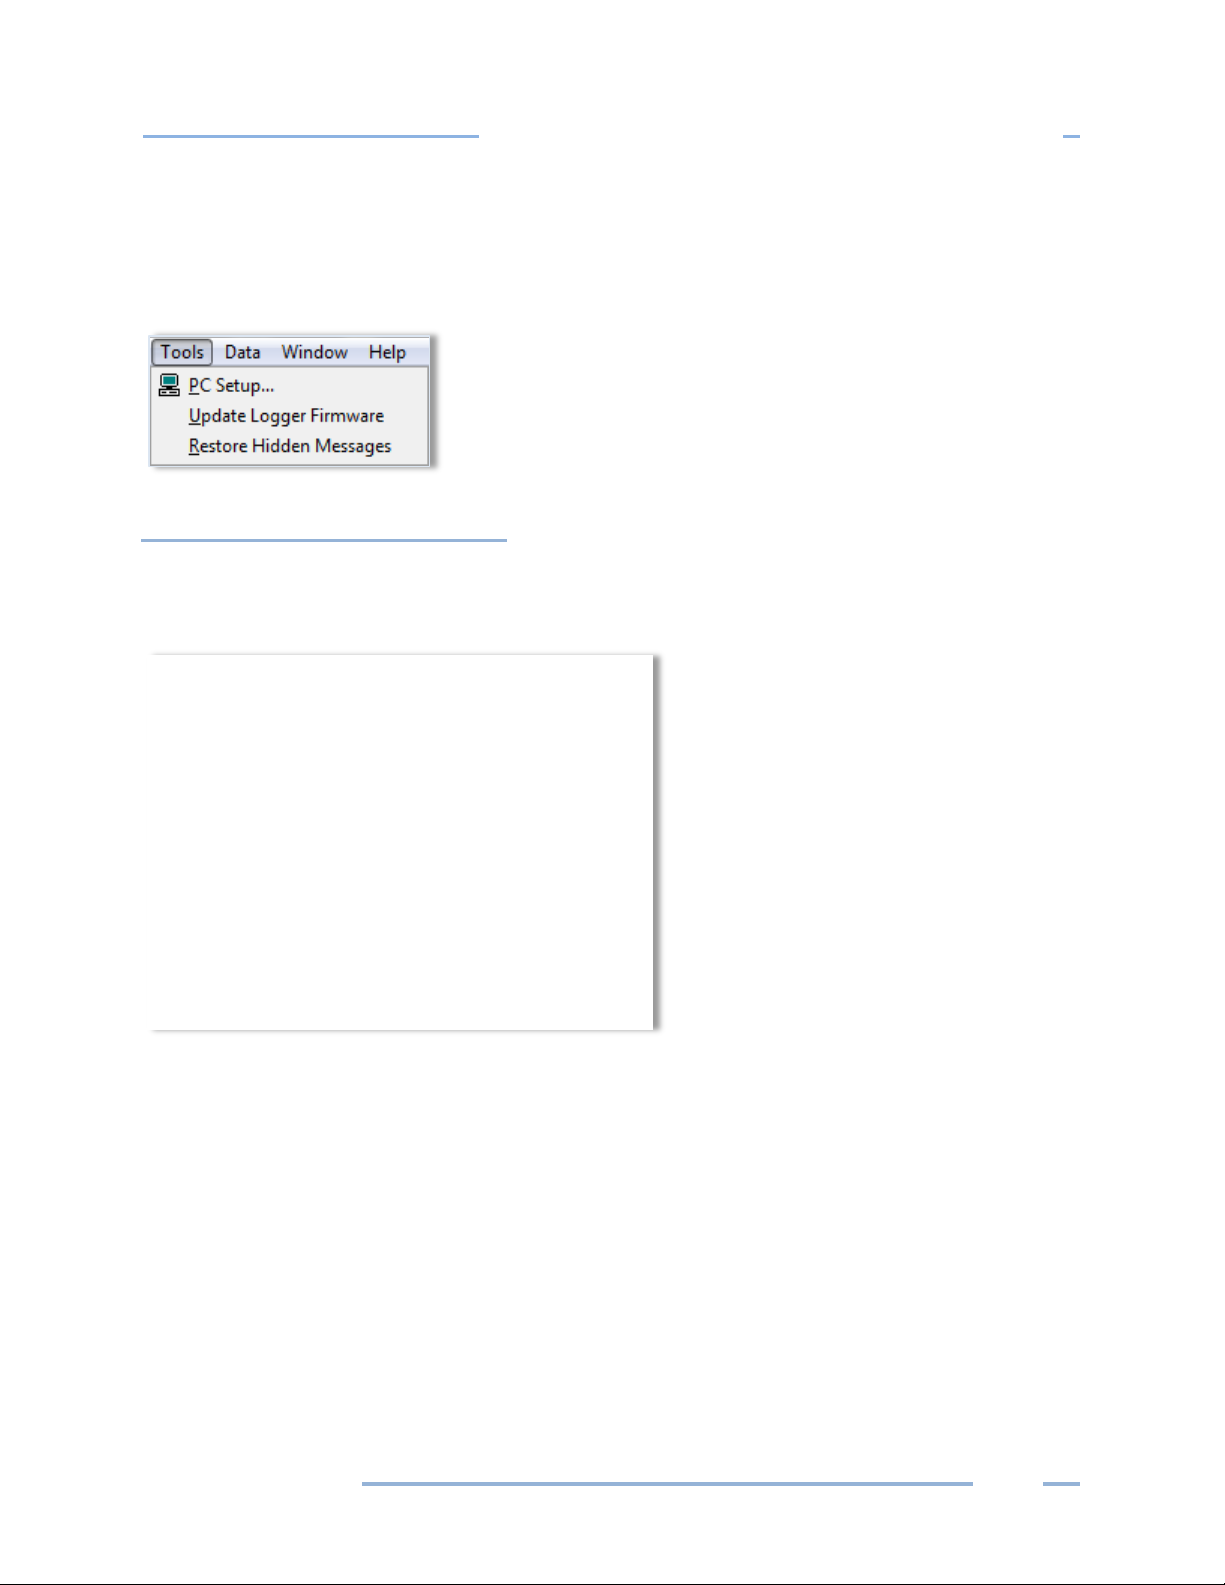
DENT Instruments
In Depth Use of the ELITEpro XC and ELOG
TOOLS MENU
The Tools Menu accesses the same PC Setup option available on the Communication sub-menu and also
includes options to install logger firmware or restore hidden messages.
PC Setup
Selecting Tools > PC Setup allows you to configure the computer connected to the ELITEpro XC. It is also
where you set the default file storage folders.
The Data Files Saved To: field displays the folder selected for storage. Click Browse to set the default
folder in which data files are saved. Data files are sent to the specified folder when retrieving data files
using the Logger > Retrieve Data option.
The Setup Files Saved To: sets the default folder in which Setup Tables are saved. ELOG will look in this
folder first when opening a Setup Table file.
The Logger Files Saved To: sets the default folder in which logger files are saved. ELOG looks in this
folder first for the Logger Lists to call when using the AutoPoll automatic data collection application.
ELITEpro
Find Quality Products Online at: sales@GlobalTestSupply.com
www.GlobalTestSupply.com
80

DENT Instruments
In Depth Use of the ELITEpro XC and ELOG
The Direct Connect section displays the selected USB port and selects the computer’s USB port to which
the ELITEpro XC is connected.
ELOG is equipped with a feature called Friendly Ports™. ELOG displays available Windows COM ports
with easy-to-understand device descriptions enabling you to find the appropriate port quickly and easily.
The Port Preferences option is used to hide COM Ports from ELOG, to change the order of COM Ports as
they appear in the dropdown control, and how they are searched when ELOG can't connect to a logger
on the desired port.
Ports that are unchecked will be hidden from ELOG. Ports are listed and searched in the order shown.
The order can be changed by selecting a port and moving it up or down.
Every time ELOG connects to a logger, its port is moved to the top of this list.
The Use Legacy Logger interface checkbox defaults to unchecked, and the ELOG software will only
display features and menu items relevant to the current software and hardware release. Select the
checkbox and click Save Changes to enable legacy menu items for customers using older legacy products
(ELITEpro or DATApro).
The Enable Auto Launch of ELOG checkbox defaults to enable the Auto Launcher, which launches ELOG
(if not already open) when an ELITEpro SP or ELITEpro XC is connected to a USB port. When not checked,
it disables the feature and hides the Auto Launcher icon in the system tray. Connecting a compatible
logger to a USB port while ELOG is already running will still result in ELOG connecting to it automatically
(if not already connected to another logger).
Update ELITEpro XC Firmware
If you receive a message when attempting to communicate between the ELOG software and the logger
stating, “The connected logger has firmware that is older than this version of ELOG supports, and may
not operate properly with this version of ELOG” refer to Appendix A to update the ELITEpro XC
firmware.
Restore Hidden Messages
Use this option to restore the alert messages that have been turned off.
ELITEpro
Find Quality Products Online at: sales@GlobalTestSupply.com
www.GlobalTestSupply.com
81

DENT Instruments
In Depth Use of the ELITEpro XC and ELOG
DATA MENU
Data retrieved from an ELITEpro XC can be opened, graphed, exported, or analyzed.
NOTE: These are the only options
available on the Data menu when first
accessed. The other options appear
after a data file is open.
Create New Graph
1) When a data file is open, Data > Create New Graph displays the Select Data Types and Ranges
dialog box.
NOTE: Use Data > Open Data File to create a graph from an existing file.
2) Left-click the parameters contained in the data file you want to graph. Hold down the Control (Ctrl)
key to select multiple parameters, or the Shift key to select a continuous group of parameters.
ELITEpro
Find Quality Products Online at: sales@GlobalTestSupply.com
www.GlobalTestSupply.com
82

DENT Instruments
In Depth Use of the ELITEpro XC and ELOG
3) Use Record Range to define a Starting and Ending range, or select the All Records checkbox to
display all records available. Options default to All Records, but unchecking the box enables you to
set a smaller range.
4) Click Next to go to the Set Graph Parameters dialog window to select the type of graph to create.
5) In the Axes section, select the Graph Type in the drop-down menu. You may also choose to select
the Use Multiple Y Axes checkbox if you have chosen more than one parameter to graph and they
have very different ranges (e.g., kW and Power Factor). The option to assign the Y axes is displayed
after clicking Next.
6) In the Under Options section, select the checkboxes for the functions you want to use:
Show graph data cursor—the data cursor appears when the graph is created (you can also toggle
the data cursor on and off with the right mouse button).
Show graph data points—displays the Data Point information above the graph display.
Show analysis values—shows summary statistics (minimum, maximum, average) on the graph.
Use the radio buttons to select one of the following:
a) Use default graph attributes—uses the default color, font and other graph attributes.
b) Use current graph attributes—uses the attributes selected for the last graph.
7) Click Next.
If the Use multiple Y axes checkbox was selected the Select Y-Axis Assignments window displays in
order for you to assign parameters to the Y axes.
ELITEpro
Find Quality Products Online at: sales@GlobalTestSupply.com
www.GlobalTestSupply.com
83

DENT Instruments
In Depth Use of the ELITEpro XC and ELOG
The graph you defined appears similar to the following example. The parameter names to the right
are color-coded to match the visual representations on the graph.
The graph values intersected by the Data Cursor are shown in the upper left-hand corner of the
screen.
Once created, the graph may be edited in a number of ways. In general, any editable feature may be
changed by double-clicking on the graph and making changes in the dialog box that appears. For
example:
Double-clicking anywhere in the graph area produces a dialog box that gives you various options to
customize your graph by changing the graph type, colors, fonts and other options.
Graphs, as well as other file types (Data, Setup Tables, Logger Lists), may be printed using the
File > Print… command (or Ctrl + P).
Double-clicking the graph also provides an Export option that enables you to export the graph.
Choose an option in the Export section to choose a graph type. Choose a location to export the
graph in the Export Destination area. Set the size of the exported graph in the Export Size fields.
Double-clicking the graph also provides a Maximize feature that enables you to increase the visual
representation of the graph.
ELITEpro
Find Quality Products Online at: sales@GlobalTestSupply.com
www.GlobalTestSupply.com
84

DENT Instruments
In Depth Use of the ELITEpro XC and ELOG
Graph Options
The Graph Options dialog box allows you to set several defaults when a new graph is created.
Select the Show graph data cursor check box to turn on the data cursor. The data cursor is a vertical
line that appears on a graph and is used to help visually line up multiple graphs. It can also be turned
on and off at any time while viewing a graph by right-clicking the mouse button.
If there is more than one variable plotted, all values are shown on the screen. The values are not
labeled but are shown in the same order that the variables appear in on the graph.
The data cursor may be moved by using the left-right arrow keys or by using the mouse to left click
on the cursor and drag it to the desired location.
NOTE: You will not see the cursor move when using the mouse until releasing the left mouse button.
Select the Show graph data points checkbox to display the specific point at which the data was
collected on the graph. It directly correlates to the Data Interval timeframe that was selected in the
Setup Table File, e.g. 15 seconds, 5 minutes, 1 hour, etc.
Select the Show analysis values checkbox to display the average, maximum, and minimum value for
each parameter plotted on a graph. The values appear to the right of the graph where the graph
labels are also shown. If desired, by unchecking the Show analysis values box, the values will not be
shown (or printed) on the graph.
ELITEpro
Find Quality Products Online at: sales@GlobalTestSupply.com
www.GlobalTestSupply.com
85

DENT Instruments
In Depth Use of the ELITEpro XC and ELOG
At the creation of a graph, you have the option of using the default graph attributes or the changes
that were last made. Select the Use default graph attributes or the Use last-saved attributes to
determine the attributes. The graph attributes include font sizes, background colors, graph colors
and numerous others and can be changed on the graph itself by right-clicking. Every time a graph is
made, and there is a change to any of the attributes, the changes are remembered by ELOG. Once a
graph is made you cannot change the graph attributes using this window. You must change them
from the graph itself.
Use the Graph Annotation field to tile the graph. If you make a lot of graphs and want to have the
same annotation on the graph, you may use this feature to add a description to the graph. Common
uses are the name of the consulting company performing the metering and analysis or the name of
the client.
Retrieve Data From Logger
This function is identical to the Retrieve Data… command in the Logger menu. It is used to download
the data from the logger to the computer prior to viewing, graphing, or exporting.
Open Data File
Data files stored on the logger can be viewed (but not edited) by selecting this menu item.
To view a data file, it must first be downloaded from the logger by using this option or the Logger >
Retrieve Data from Logger... command.
The data is always shown in the same way. The left-most column is the record number and begins with 1
and continues through all of the data records in the file. The second column is the date of the record
and the third column is the time of the record.
The fourth and remaining columns are the data recorded by the logger for each parameter. If minimum
or maximum values were recorded then the time, to the second, that the maximum or minimum
occurred is also recorded.
Export Data File
This exports the raw, binary .elog file to a .csv format (Comma Separated Value) file, which can be
brought into a spreadsheet program.
To view the data from a spreadsheet program follow these steps:
1) Retrieve the data from the logger using Logger > Retrieve Data from Logger or Data > Open Data
File.
2) Select File > Export Data to Excel Format (CSV). The Select a File for Export dialog box displays.
ELITEpro
Find Quality Products Online at: sales@GlobalTestSupply.com
www.GlobalTestSupply.com
86

DENT Instruments
In Depth Use of the ELITEpro XC and ELOG
3) Select a file and click Open. The ELOG File Export dialog box displays when the file data completes
exporting to a .csv file format.
4) Start a spreadsheet program such as Excel™.
5) Use the File > Open command in the spreadsheet and select All Files in the Files of type drop-down
list.
6) Open the .csv data file from the folder you specified, for example:
C:\Users\UserName\Documents\DENT\ELOG\Data
Import CSV File
This feature imports a previously saved .csv file into ELOG for use. Select the file you wish to import, and
then choose Open.
ELITEpro
Find Quality Products Online at: sales@GlobalTestSupply.com
www.GlobalTestSupply.com
87

DENT Instruments
In Depth Use of the ELITEpro XC and ELOG
Data File Statistics
Data File Statistics is a useful feature for viewing a lot of information about the data file and peak
demand on the channels. This is where the kWh, kVARh, and kVAh totalizer values are found. An
example Summary is shown on the next page.
The sub-menu has two functions:
Data File Summary
Provides the start and end times of the data, file name in the computer, and summary statistics for
each channel and parameter that was recorded by the logger. The Data File Summary is opened in
Microsoft Notepad™ and can be edited, saved, printed and/or moved into another report.
ELITEpro
Find Quality Products Online at: sales@GlobalTestSupply.com
www.GlobalTestSupply.com
88
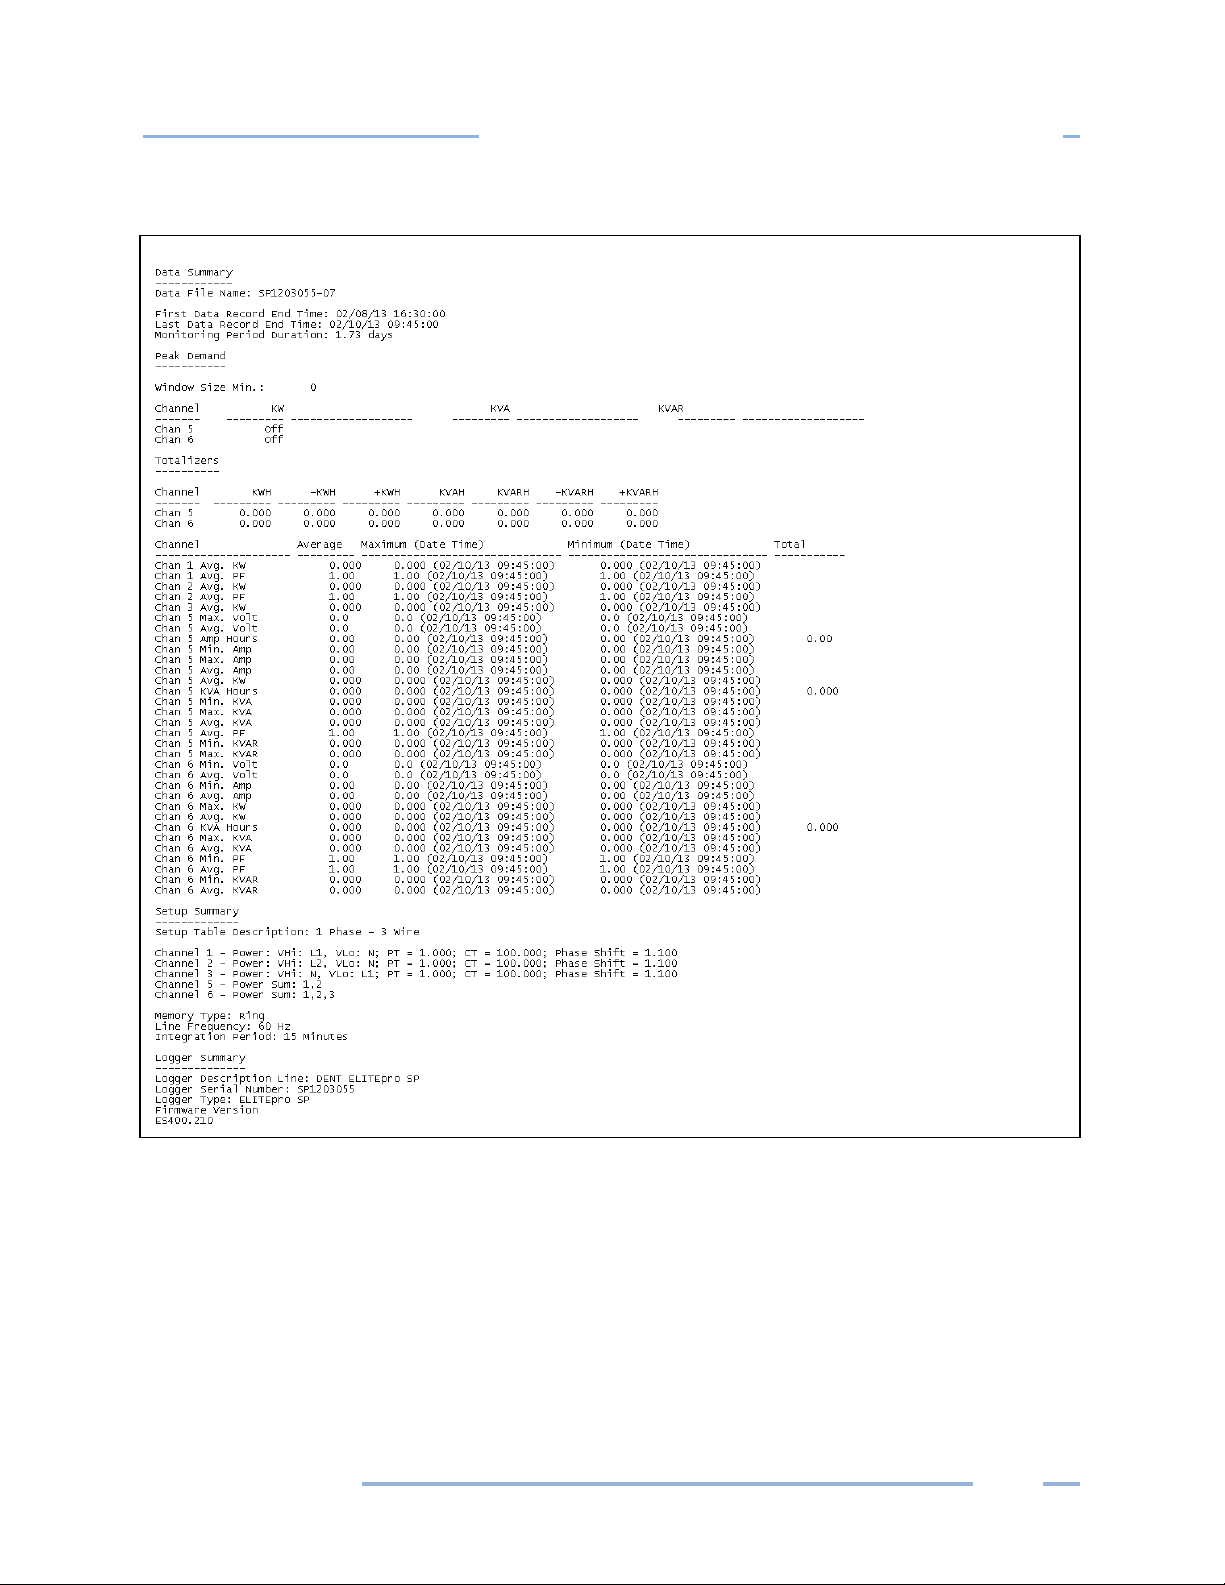
DENT Instruments
In Depth Use of the ELITEpro XC and ELOG
Example of a Data Summary
Peak Demand
Provides a report of peak demand information on the channels used for collecting the data. The
Peak Demand report is opened in Microsoft Notepad™ and can be edited, saved, printed and/or
moved into another report.
ELITEpro
Find Quality Products Online at: sales@GlobalTestSupply.com
www.GlobalTestSupply.com
89

DENT Instruments
In Depth Use of the ELITEpro XC and ELOG
Calculations for peak demand are only available when Channels 5 and 6 are on.
The analysis features
several ways using standard Windows
Analyze a Selected Data Range
ELOG has a number of analysis features. With a data file open:
only work on one variable at a time. A variable may be selected in
™ methods.
1) To select an entire column of data, place the mouse pointer over the column header (e.g., Chan 1
Avg. Amp) and click the left button. The entire column is selected.
2) To select a portion of a column, place the mouse pointer over the first record to be included then
push the left button down and hold it while dragging the mouse down the screen. When located
over the last record to be included, release the mouse button.
3) After selecting a data range, click Data > Analyze a Selected Data Range and choose the desired
Analysis Functions.
A Sample Data File window displays.
In this example, Maximum Value was chosen. Note that when maximum and minimum are selected,
the date and time of the five (5) greatest maxima (or minima) are also shown along with the value.
4) Click OK to close the window.
-or-
Click File to open Windows Notepad™. The maximum value and time of occurrence is shown with
the date range for the data selected for analysis. As with the Data File Summary, the data contained
in the Notepad file may be edited, saved, printed or moved into another program for report
generation.
ELITEpro
Find Quality Products Online at: sales@GlobalTestSupply.com
www.GlobalTestSupply.com
90

DENT Instruments
In Depth Use of the ELITEpro XC and ELOG
All analysis features in the Analyze a Selected Data Range and Extract drop-down menus can be
quickly accessing using the right mouse button.
Each time an analysis function is used and File is
selected, Notepad is opened and the result of
the analysis function is added to the existing
Notepad file.
For the first five analysis functions, Average is
the arithmetic average of all the values in the
selected column within the date range of data
selected. Load Factor is the ratio of the peak
(maximum) value divided by the average value.
Maximum and Minimum are the largest and
smallest values together with the day and time
of the occurrence. Total is the algebraic sum of
all the values (useful for summing kWh within a
specified period of time).
5) Select Graph to create a quick line graph for any selected variable and range.
-or-
Select Daily Profile Graph to create a composite average daily profile list of the average data values
computed by ELOG.
Extract a Range of Data
Users may choose options from this sub-menu to display data from a specified range if all data points
collected aren’t needed for analysis.
Extract By Date
This option provides the beginning and end date and times of the data file. Choose new endpoints to
trim off unwanted data at the beginning or end of the file Click Ok to display the selected range.
Extract By Record Number
This option provides a File Record Range with the option of choosing a set of records based on the
record number (first column in the data file). Click Ok to create the selected range.
ELITEpro
Find Quality Products Online at: sales@GlobalTestSupply.com
www.GlobalTestSupply.com
91

DENT Instruments
In Depth Use of the ELITEpro XC and ELOG
Check Data for Errors
Use this command to check the data shown for gaps or overlaps in the time sequence, or timestamp
errors.
Fill Missing Records with Zeros
"Fill Missing Records with Zeros" detects gaps in the time sequence of the data shown and fills the
missing records with 0 values. This feature is useful when data logging has paused (such as during a
power outage) and there are gaps in the time stamp records.
Fill missing Records with Blanks
“Fill Missing Records with Blanks” detects gaps in the time sequence of the data shown and fills the
missing records with empty records (blank rows). This feature can be helpful to accurately represent
power outages in a graph or if you wish to obtain an average value without skewing the result by adding
zeros.
ELITEpro
Find Quality Products Online at: sales@GlobalTestSupply.com
www.GlobalTestSupply.com
92

DENT Instruments
Appendix
APPENDICES
Appendix A—Installing Firmware Updates
Firmware is software that is used as the control program for the microprocessor in your ELITEpro XC.
Firmware updates provide new features and bug fixes for the ELITEpro XC. Contact DENT Instruments
for more information.
FIRMWARE UPDATES
You can check the firmware version of your ELITEpro XC from the Tools menu. Select Tools > Update
Logger Firmware. The Firmware Update dialog box displays. No update is required if your firmware File
version and Logger Version are the same.
Downloading and Installing Firmware
To install firmware/updates:
1) Select Tools > Update Logger Firmware. The following dialog box displays:
2) If necessary, click the Browse button to locate the firmware update file.
3) Click Update.
4) The Update Progress bar displays the progress of the firmware update.
ELITEpro
Find Quality Products Online at: sales@GlobalTestSupply.com
www.GlobalTestSupply.com
93

DENT Instruments
Appendix
3 Phase DELTA with a “Wild” (Red) Leg
Configure the Setup Table as follows:
Appendix B—Unusual Metering Systems
3-PHASE DELTA WITH A “WILD” (RED) LEG
ELITEpro
Find Quality Products Online at: sales@GlobalTestSupply.com
www.GlobalTestSupply.com
94

DENT Instruments
Appendix
2-½ Element Meters
Configure the Setup Table as follows:
2–½ ELEMENT METERS
*The CT on channel three of the ELITEpro XC is placed on the L2 phase and is backwards. Note that the
Ch3 CT is jumpered in parallel into Ch4 of the logger, and the red L2 wire is used to power the ELITEpro
XC.
ELITEpro
Find Quality Products Online at: sales@GlobalTestSupply.com
www.GlobalTestSupply.com
95

DENT Instruments
Appendix
**Since the 2 ½ Element method is often used on high voltage metering, a PT ratio other than one is
typical and should be set to whatever the actual PT ratio is.
***Set the CT value that is true for the CT connected to the ELITEpro XC. Again, because the 2 ½
element method is most often used in high voltage applications, there will be high voltage CTs present.
Use a revenue-grade CT, such as the CT-SRS-0005-U from DENT Instruments, on the existing high voltage
CT secondary. The CT value used in the Setup Table should be the primary rating of the high voltage CT
(assuming the secondary output is 5A).
† The L2 to Neutral connection is required to power the ELITEpro XC.
USING THE 2-WATT ELEMENT (2 CT) METHOD ON A 3-WIRE DELTA SERVICE
Blondel’s Theorem states that the number of watt elements (CTs) needed to monitor a system is one
less than the number of wires in the system. This means that a 3-Wire Delta service, even though three
phase, requires only two CTs to meter it as there are only three current carrying conductors. The
ELITEpro XC uses the 3 CT method for monitoring Delta services as a default because the data is easier
to interpret. However, if it is required to use only 2 CTs on a Delta such as when it is desirable to use one
ELITEpro XC to monitor two Delta connect loads simultaneously (such as two motors), connect the
meter as shown below.
2 CT, 3-Wire Delta
ELITEpro
Find Quality Products Online at: sales@GlobalTestSupply.com
www.GlobalTestSupply.com
96

DENT Instruments
Appendix
Configure the Setup Table as follows:
USING THE 3-WATT ELEMENT (3 CT) METHOD ON A 3-WIRE DELTA SERVICE
Using the two-watt element method on 3-phase 3-wire Delta services is a perfectly valid measurement
technique. The 2-element method also uses less logger memory and hardware channels and allows
measuring two Delta (3-wire) loads simultaneously. However, we recommend using the 3-watt element
method because the 3-element method is more intuitive. By placing a CT on each phase wire, it is easier
to understand what is happening in each phase without referring to phasor diagrams.
In 2-element measurements, System VA is calculated from Watts and VARs using the power triangle. In
3-element measurements, System VA is calculated as the sum of the VAs from the individual phases.
Both methods are completely valid.
The major difference is how harmonics are treated. When harmonics exist, they are usually only (or
mostly) present in the current and not in the voltage. Because watts and VARs are calculated as the
instantaneous product of volts and amps, and because an existing third or fifth harmonic current does
not have a corresponding voltage harmonic, then the harmonics’ products are zero. Therefore, the
instantaneous product of volts and amps used to obtain watts and VARs does not include any harmonic
component. Thus, the 2-element method does not include any harmonic content in the calculation of
System VA. In 3-element systems, because System VA is calculated as the sum of the phase VAs, which
in turn are the product of the RMS volts multiplied by the RMS amps, then harmonics are included (in
the RMS amps).
There are two methods to calculate Power Factor. One is Apparent Power Factor PF=W/VA where VA=
Volts X Amps and VA would contain harmonic content. The other is Displacement Power Factor that
uses the Power triangle PF=W/SQRT (W
ELITEpro XC displays and records displacement Power Factor.
ELITEpro
Find Quality Products Online at: sales@GlobalTestSupply.com
www.GlobalTestSupply.com
2
+ VAR2) which does not contain harmonic content. The
97

DENT Instruments
Appendix
If there are no harmonics present, the displacement power factor and harmonic power factor are
identical. If harmonics are present, the harmonic power factor (3 element) will always be smaller than
the displacement 100 power factor (2-element). Similarly, the 3-element VA will always be larger than
the 2-element VA. When comparing the ELITEpro XC three-phase measurements with other meters,
make sure that the same method of calculating VA and Power Factor is used.
Connecting the ELITEpro XC to a 3-phase 3-wire Delta load using the 3 element method:
It is very similar to the 3-phase, 4-wire WYE connection. Use a CT on each phase and connect the three
ELITEpro XC voltage wires to each phase. The neutral wire should then be connected to earth ground.
The Setup table should look just like that of the 4-wire WYE setup. See ELOG Quick Setup Wiring
Diagrams in Section II.
ELITEpro
Find Quality Products Online at: sales@GlobalTestSupply.com
www.GlobalTestSupply.com
98

DENT Instruments
Appendix
Windows 10 Search Box
Windows 10 Start Button
Appendix C—Troubleshooting ELITEpro XC Driver Installation
If you have connected the ELITEpro XC to a computer via the USB cable and the driver fails to install,
follow these steps to correct the problem.
1) Go to the Device Manager by typing “device manager” into the search box in the Windows Taskbar.
Or, right-click on the Windows Start Button and select Device Manager from the list.
2) Once in the Device Manager, look for Ports (COM & LPT) in the list. Click the arrow (>) next to Ports
and find either ELITEproSP or AT91 USB to Serial Converter.
ELITEpro
Find Quality Products Online at: sales@GlobalTestSupply.com
www.GlobalTestSupply.com
99

DENT Instruments
Appendix
3) Right-click the ELITEpro XC and select Update Driver…
4) Select Browse my computer for driver software.
ELITEpro
Find Quality Products Online at: sales@GlobalTestSupply.com
www.GlobalTestSupply.com
100

DENT Instruments
Appendix
5) In the next window, select Search for driver software in this location: and Include Subfolders in the
search. Click Browse and locate the ELITEpro XC driver folder in the ELOG directory.
6) Click Next and the ELITEpro XC driver will install. In the event that you receive a warning dialog box
from Microsoft, click Continue to proceed.
7) Unplug the ELITEpro XC and plug it back in. ELOG should launch and automatically connect to the
ELITEpro XC.
ELITEpro
Find Quality Products Online at: sales@GlobalTestSupply.com
www.GlobalTestSupply.com
101

DENT Instruments
Appendix
Appendix D—Calculated Power Channel Formulas
The following information details the formulas used to calculate the parameters available in the Power
Sum Channels 5 and 6.
WYE CONFIGURATION L1-N, L2-N, L3-N
Measurement Formula Notes/Description
Amps (System)
Volts (System)
kW (System)
kWh (System)
VAR (System)
VARh (System)
VA (System)
1 + 2 + 3
3
ℎ ℎ
3
1 + 2 + 3
1 + 2 + 3
#
1 + 2 + 3
1 + 2 + 3
#
1 + 2 + 3
ℎ
ℎ
Average of L1, L2, and L3 amp values.
For a Phase to Neutral with WYE
configured meter.
Average of the three phase-to-neutral
voltages.
Sum of L1, L2, and L3 phase watt
values.
Calculated per waveform sample with
a running total of each waveform kWh
for the integration period.
See kWh (System) WYE notes.
VAh (System)
Apparent PF System
Displacement PF System
1 + 2 + 3
#
(
�
2
)
+ ( )
ℎ
2
See kWh (System) WYE notes.
Measurement calculation information
is provided for reference only.
ELITEpro
Find Quality Products Online at: sales@GlobalTestSupply.com
www.GlobalTestSupply.com
102

DENT Instruments
Appendix
DELTA CONFIGURATION: L1-L2 AND L3-L2
The following formulas apply when using the 2 CT method. When using the 3 CT method on a Delta
service the channel 5 and 6 Power Sum equations are the same as for the WYE configuration shown
above.
Measurement Formula Notes/Description
Amps (System)
System Volts (Phase to
Phase with DELTA
configured meter)
kW (System)
kWh (System)
kVAR (System)
kVARh (System)
kVA (System)
(
1 − 2)+ (3 − 2)
1 + 3
1 + 3
#
1 + 3
1 + 3
#
(
�
1 + 3
)
2
2
ℎ
ℎ
2
+ ( )2
Average of L1 and L3 amp values.
Average of L1- L2 and L3 – L2 phase
Sum of kW L1 and kW L3 phase watt
to phase voltages
values.
See kWh (System) WYE notes.
See kWh (System) WYE notes.
kVAh (System)
Apparent PF System
Displacement PF System
(
�
�
# ℎ
(
2
)
+ ( )
2
)
+ ( )
2
Same as Displacement PF System
below. Cannot calculate APF for
2
delta loads.
ELITEpro
Find Quality Products Online at: sales@GlobalTestSupply.com
www.GlobalTestSupply.com
103

DENT Instruments
Appendix
USB Port
Appendix E—Communication Options on the ELITEpro XC
In this section the available communication options and their setup steps are described in further detail,
including USB, Ethernet (LAN), Wi-Fi, and Bluetooth.
Feature USB Ethernet Bluetooth Wi-Fi
16 MB
Approximate
Download Time
Range Length of USB
Access With… PC + ELOG PC + ELOG or
4 Min 12 Min 22 Min 40 Min
cable
Length of
network cable
Mobile App or
Web browser
10-100ft 40-100ft
Bluetoothenabled PC +
ELOG
PC + ELOG or
Mobile App or
Web browser
USB (STANDARD)
A USB connection is the standard (and fastest) connection option for the ELITEpro XC, used locally for
transferring data when a laptop is available in the field.
1) Connect the USB cable to a USB port on your computer, inserting the other end in the USB port on
the ELITEpro XC. If a USB cable is used inside an electrical panel, it must be rated to the appropriate
voltage or wrapped in an appropriately rated insulating sleeve. The DENT-supplied cable does not
meet this requirement without an insulating sleeve.
2) ELOG should launch automatically and connect to the logger. If it does not, click on the icon on the
computer desktop.
ELITEpro
Find Quality Products Online at: sales@GlobalTestSupply.com
www.GlobalTestSupply.com
104
 Loading...