


Operating manual
Multifunction Data Logger
HD31
www.deltaohm.com
English
Keep for future reference.
Companies / Brands of GHM

HD31 - 2 - V1.6
TABLE OF CONTENTS
1 INTRODUCTION.................................................................................................... 5
2 DESCRIPTION....................................................................................................... 6
2.1 DISPLAY DESCRIPTION .......................................................................................... 7
2.2 KEY TO THE SYMBOLS IN THE STATUS BAR .................................................................... 8
2.3 OVERVIEW OF THE FUNCTIONS IN THE COMMAND BAR ...................................................... 9
2.4 HELP FUNCTION ............................................................................................... 11
3 MEASUREMENT MODE......................................................................................... 12
3.1 SELECTING A MEASUREMENT LINE............................................................................ 13
3.2 SELECTING THE MEASUREMENT UNIT ........................................................................ 13
3.3 CHANGING THE QUANTITY VIEWED IN THE DISPLAY LINE .................................................. 14
3.4 DERIVED QUANTITIES AND NUMBER OF MEASUREMENT LINES DISPLAYED.............................. 14
3.5 DISPLAYING THE DIFFERENCE BETWEEN TWO HOMOGENEOUS QUANTITIES ............................. 17
3.6 DISPLAYING THE RELATIVE MEASUREMENT (REL) ........................................................ 18
3.7 HOLDING THE MEASUREMENT ON THE DISPLAY (HOLD).................................................. 18
3.8 MEASUREMENT GRAPH......................................................................................... 19
4 THE PROBES ....................................................................................................... 22
4.1 PRT TEMPERATURE PROBES .................................................................................. 22
4.1.1 SETTING THE INSTRUMENT TO READ A PRT PROBE WITHOUT SICRAM MODULE .......... 24
4.2 THERMOCOUPLE TEMPERATURE PROBES ..................................................................... 25
4.3 RELATIVE HUMIDITY AND TEMPERATURE COMBINED PROBES ............................................. 26
4.3.1 DISCOMFORT INDEX AND NET INDEX ........................................................... 26
4.4 PRESSURE PROBES ............................................................................................. 28
4.4.1 ZEROING DIFFERENTIAL PRESSURE PROBES ..................................................... 28
4.4.2 PEAK VALUE RESET ................................................................................. 29
4.5 AIR SPEED PROBES............................................................................................. 30
4.5.1 FLOW-RATE MEASUREMENT ....................................................................... 30
4.5.2 NOTES ON FLOW MEASUREMENTS ................................................................ 30
4.5.3 HOT-WIRE AIR SPEED PROBES AP471S... ..................................................... 31
4.5.4 AIR SPEED VANE PROBES AP472S... ........................................................... 34
4.5.5 AP473S... MODULES FOR PITOT TUBES ........................................................ 36
4.5.6 ZEROING AIR SPEED PROBES ..................................................................... 38
4.6 VP472 MODULE FOR THE CONNECTION OF PYRANOMETERS AND ALBEDOMETERS ..................... 40
4.7 PHOTOMETRIC AND RADIOMETRIC PROBES WITH SICRAM MODULE .................................... 41
4.7.1 INTEGRATION ....................................................................................... 42
4.8 CO
2
PROBES .................................................................................................... 46
4.9 VP473 AND IP472 MODULES FOR MEASURING DIRECT VOLTAGE AND CURRENT ...................... 47

HD31 - 3 - V1.6
5 RECORD FUNCTION ............................................................................................ 48
5.1 SELECTING A QUANTITY FOR THE RECORD FUNCTION ................................................... 48
5.2 SAMPLE ACQUIS ITION .......................................................................................... 49
5.3 DISPLAYING M IN IMUM, AVERAGE AND MAXIMUM VALUES ................................................. 50
5.4 RESETTING AND DISABLING THE RECORD FUNCTION .................................................... 50
5.5 RECORD FUNCTION BEHAVIOR AT LOGGING STARTUP................................................... 51
5.6 RECORD FUNCTION AND RELATIVE MEASUREMENT ...................................................... 51
6 SETTING DATE AND TIME ................................................................................... 52
7 LOGGING ............................................................................................................ 53
7.1 SETTING THE AUTOMATIC LOGGING INTERVAL OR THE MANUAL LOGGING............................... 53
7.2 SELECTING THE MEASUREMENT LINES FOR LOGGING ...................................................... 54
7.3 MANUALLY START/STOP AUTOMATIC LOGGING ............................................................. 55
7.4 PROGRAMMING AUTOMATIC LOGGING START/STOP TIME.................................................. 55
7.5 AUTO-OFF DURING AUTOMATIC LOGGING ................................................................... 57
7.6 MANUAL LOGGING.............................................................................................. 58
7.7 PDF REPORT ................................................................................................... 59
7.8 DISPLAYING LOGGING SESSIONS IN THE SD MEMORY CARD ............................................. 61
7.9 STORED DATA GRAPH .......................................................................................... 63
7.10 DELETING LOGGING SESSIONS IN THE SD MEMORY CARD ................................................ 64
7.11 DISPLAYING THE AMOUNT OF FREE MEMORY AVAILABLE IN THE SD MEMORY CARD.................... 65
7.12 LOGGING AND RECORD AND INTEGRAL FUNCTIONS................................................... 66
8 PROTECTED MODE .............................................................................................. 67
8.1 PASSWORD CHANGE FOR THE PROTECTED MODE ........................................................... 67
8.2 ENABLING/DISABLING THE PROTECTED MODE .............................................................. 68
9 MEASUREMENT SETTINGS .................................................................................. 70
9.1 TYPE OF CALIBRATION TO BE USED FOR PROBES ........................................................... 70
9.2 TEMPERATURE COMPENSATION ............................................................................... 72
9.3 BAROMETRIC PRESSURE COMPENSATION .................................................................... 74
9.4 SELECTING THE DUCT FOR FLOW RATE MEASUREMENTS ................................................... 76
9.5 PITOT OR DARCY TUBE COEFFICIENT ........................................................................ 78
9.6 AIR SPEED MEASUREMENT AVERAGE ......................................................................... 80
10 PRINTING MEASUREMENTS ................................................................................ 82
10.1 SETTING THE BAUD RATE OF THE INSTRUMENT ............................................................ 82
10.2 SENDING MEASUREMENTS FOR PRINTING ................................................................... 83
10.3 RECEIVING MEASUREMENTS INTO PC........................................................................ 83
11 INFORMATION ON INSTRUMENT AND PROBES ................................................... 84
12 USE OF THE BATTERY ......................................................................................... 85
12.1 AUTOMATIC SWITCH-OFF FUNCTION ......................................................................... 85
12.2 DISP LAY BR IGHTNESS ......................................................................................... 86

HD31 - 4 - V1.6
12.3 PROLONGING BATTERY LIFE .................................................................................... 88
12.4 REPLACING THE BATTERY ....................................................................................... 88
12.5 IMPORTANT WARNINGS ......................................................................................... 89
13 CALIBRATION ..................................................................................................... 90
13.1 CALIBRATION OF TEMPERATURE-ONLY PROBES WITH PRT SENSOR...................................... 90
13.1.1 NEW TUNING OPTION FOR PRT SENSORS.................................................... 91
13.1.2 PARAMETERS OPTION FOR PRT SENSORS.................................................... 92
13.2 CALIBRATION OF THERMOCOUPLE TEMPERATURE PROBES.................................................. 93
13.3 CALIBRATION OF COMBINED RELATIVE HUMIDITY AND TEMPERATURE PROBES ............................. 94
13.3.1 CALIBRATION OF THE TEMPERATURE SENSOR OF RH/T COMBINED PROBES ................ 94
13.3.2 CALIBRATION OF THE RELATIVE HUMIDITY SENSOR ............................................ 95
13.4 CALIBRATION OF PP472 MODULE (BAROMETRIC PRESSURE) ............................................. 99
13.5 CALIBRATING THE CO
2
PROBE .................................................................................100
13.5.1 ZERO/FRESH AIR OPTION FOR CO
2
PROBES................................................100
13.5.2 LINEAR GAINS OPTION FOR CO
2
PROBES ...................................................101
13.6 CALIBRATION OF VP473 MODULES (VOLTAGE) AND IP472 (CURRENT) .................................103
13.6.1 DEFINITION OF LINEAR CORRESPONDENCE.....................................................104
13.6.2 MEASUREMENT UNIT OF THE ASSOCIATED QUANTITY .........................................105
13.6.3 DISPLAYING THE ASSOCIATED QUANTITY.......................................................106
14 COMMUNICATING WITH A PC ........................................................................... 108
14.1 STORED DATA TRANSFER TO PC.............................................................................110
14.2 SERIAL COMMANDS ...........................................................................................111
15 FIRMWARE UPDATE .......................................................................................... 116
16 RESET OF THE INSTRUMENT............................................................................. 117
17 USAGE INSTRUCTIONS AND WARNINGS .......................................................... 118
18 INSTRUMENT STORAGE .................................................................................... 119
19 SAFETY INSTRUCTIONS.................................................................................... 119
20 TECHNICAL FEATURES...................................................................................... 120
20.1 TECHNICAL FEATURES OF PROBES AND SICRAM MODULES IN LINE WITH THE INSTRUMENT........121
20.1.1 TEMPERATURE WITH PLATINUM SENSORS (PRT)..............................................121
20.1.2 TEMPERATURE WITH THERMOCOUPLE SENSORS................................................122
20.1.3 RELATIVE HUMIDITY AND TEMPERATURE ........................................................126
20.1.4 PRESSURE ..........................................................................................127
20.1.5 AIR SPEED..........................................................................................129
20.1.6 PHOTOMETRY AND RADIOMETRY .................................................................131
20.1.7 CO
2
(CARBON DIOXIDE) .........................................................................138
21 ORDER CODES .................................................................................................. 139
APPENDIX .............................................................................................................. 148

HD31 - 5 - V1.6
1 INTRODUCTION
HD31 is a portable multifunction and data logger instrument. It has a large (43 x 58 mm) color
graphic LCD display.
It is equipped with 3 independent inputs. Each input can be connected to individual and combined SICRAM probes (intelligent and interchangeable probes capable to store calibration data
into memory) for the measurement of several physical qualities:
• Temperature
• Relative humidity
• Barometric and differential pressure
• Air speed
• Illuminance (lux) and Irradiance
• Carbon dioxide (CO
2
)
• Direct voltage and current
The type of probes connected to the different inputs is automatically recognized by the instrument. The probes are supplied factory- calibrated and are interchangeable.
By connecting a combined relative-humidity and temperature probe, the instrument calculates
the derived humidity quantities: dew-point temperature, wet-bulb temperature, absolute humidity, mixing ratio, partial vapor pressure, saturated steam pressure, enthalpy. The DI (Discomfort Index) and the NET (Net Effective Temperature) indexes are calculated as well.
The instrument’s inputs can also be connected to non SICRAM probes, by using the relevant
interface modules between instrument and probe.
The display can show up to 36 quantities, three of which can be displayed simultaneously in numeric format. A real-time measured quantity graph is shown in the display.
The measuring unit can be selected according to the measured physical quantity.
Data logging function with data storage in CSV format directly into the SD-type Memory Card, for
a long logging time (for example, with a 4 GB SD-type card, the logging lasts several months
even when recording several quantities with the minimum logging interval of 1 second). Userconfigurable storage interval. Manual or programmed logging start/stop. Logging date/time storage of each sample (automatically creates measurement reports in PDF format in the memory
card). Manual RECORD function (acquires the current measurement by simply pressing a button)
or automatic RECORD function (acquires the current measurement once per second) for the calculation of minimum, mean and maximum values of the measured quantities.
HOLD function (holds current measurements on the display), REL function (difference with regard to a stored value) and DIFF function (difference between two homogeneous measurements, e.g., between the measurements of two temperature probes).
Functions reserved through user password. USB port with mini-USB connector for PC connection, for configuration and download of the acquired data. DeltaLog9 application software
supplied with the instrument.
It is provided with MSD (Mass Storage Device) mode, in which the instrument is seen by the PC
as a SD card reader, thus allowing direct access to the memory card for displaying, copying or
deleting the logging files.
Serial output for the print of the displayed measurements on a RS232C input printer. The Baud
Rate can be set from 1200 to 115200.
Lithium ion rechargeable battery. Automatic switch-off (may be disabled) after user-configurable
downtime (2, 5, 10, 15, 20 or 30 minutes) for preserving the battery life. External power supply
through USB input (with mini-USB connector) by connecting a 5 Vdc power supply unit or a PC
USB port (500 mA at least). With an external power supply unit connected, the battery is recharged and the automatic switch-off is automatically disabled.

HD31 - 6 - V1.6
2 DESCRIPTION
Fig. 2.1: instrument description

HD31 - 7 - V1.6
1. Input B, 8-pole DIN45326 connector.
2. Input A, 8-pole DIN45326 connector.
3. F2 function key: activates the central command in the command bar.
4. F1 function key: activates the left command in the command bar.
5. SELECT key: scrolls cyclically forward the main commands in the command bar.
6. S key: in "Measure" mode, scrolls cyclically upwards the measurements on the display;
in the menu, it scrolls through the available options.
7. T key: in "Measure" mode, scrolls cyclically downwards the measurements on the dis-
play; in the menu, it scrolls through the available options.
8. SD card housing. To introduce the card, push it into the slot until it clicks into place,
which ensures the correct insertion. To remove the card, push it until you hear the release click.
CAUTION: to avoid data loss, do not remove the card if logging is active. Stop
logging before removing the card.
9. RS232C serial output with RJ12 (6P6C) connector for connecting the printer.
10. USB port with mini-USB for connecting a PC or external power supply device.
11. HOLD key: holds the measurement to the current value.
12. ON/OFF key: turns the instrument on/off.
13. ESC key: in "Measure" mode, scrolls cyclically backward the main commands in the
command bar; in the menu, it allows returning to the higher menu level; cancels the current operation without modifying the instrument parameters.
14. F3 function key: activates the right command in the command bar.
15. Color graphic LCD display.
16. Input C, 8-pole DIN45326 connector.
2.1 DISPLA Y DESCRIPTION
Fig. 2.1.1: dis
play description
17. Status bar: shows information about logging state, battery charge level, presence of SD
card, USB connection state, etc.
18. Display of the first measurement.
19. Date and time. During execution of the commands the line shows information messages.
20. Command bar (indications vary according to the function enabled).
21. Display of the third measurement.
22. Display of the second measurement.

HD31 - 8 - V1.6
2.2 KEY TO THE SYMBOLS IN THE STATUS BAR
Instrument connected to a USB port on your PC
Instrument connected to a USB port on your PC and communicating
Instrument connected to the external power supply unit
Instrument in MSD mode (Mass Storage Device): connected to the PC, it works as
an SD card reader
SD card inserted in the instrument
Logging session enabled. The logging interval, in the case of automatic recording,
or the MANL indication, in the case of manual recording, is shown under the symbol; the interval background turns light blue during acquisition time.
Auto-off between two logging instants activated
Start and stop logging instants programmed by the user
Only the logging start time is programmed
Only the logging stop time is programmed
"Monitor" function active (enabled by DeltaLog9 software)
The reduced level of brightness for the display is set
Reduced brightness level temporarily suspended following the push of a key (the
level will return to its “reduced” state after a few moments of inactivity)
Auto-off function activated
(*)
Auto-off function disabled or temporarily suspended (for example, following the
activation of the logging)
(*)
Power supply activated for hot-wire air speed probes or CO
2
probes
Battery charge between 67% and 100%
(**)
Battery charge between 34% and 66%
(**)
Battery charge between 4% and 33%
(**)
Battery charge less than 4%
(**)
(*)
The symbol is off if the instrument is connected to the external power supply unit or to the USB port
of the PC.
(**)
The symbol flashes when the battery is charging.

HD31 - 9 - V1.6
2.3 OVERVIEW OF THE FUNCTIONS IN THE COMMAND BAR
F1, F2 and F3 keys allow selecting the functions indicated in the display command bar. Press
the SELECT key to scroll cyclically through the main functions available in the command bar (or
alternatively the ESC key to scroll the functions in the opposite direction).
Some features include sub-functions (displayed in the command bar when you select the main
function by pressing the corresponding function key) or opening a menu. The scheme in Fig.
2.3.1 illustrates the functions listed using the SELECT key and the corresponding sub-functions.
Fig. 2.3.1: functions in the command bar
Th
e commands shown in the scheme are briefly outlined below. For a detailed description,
please refer to the sections in the manual for the respective functions.
1. LOG (logging): logging on and off. If logging is not enabled, the following sub-functions
appear:
RUN: manual start of the logging.
PROG (program): setting the programmed start and stop of the logging.
SEL (select): selects the measurement line indicated by the cursor on the display for
logging. If the measurement line has been already selected, the selection is canceled.
If logging is enabled, the following sub-functions appear instead of RUN and SEL:
STOP: manual stop of the logging.
MANL (manual): manual acquisition of a sample (function enabled only if the setting
of the logging interval is MANUAL).
2. MENU: opens the configuration menu of the instrument.
3. USB: activation and deactivation of the MSD (Mass Storage Device) to read the SD card
from the PC (see paragraph 14.1 at page 110).
4. IN
(input): selection of the quantities to be displayed. The following sub-functions are
shown:
<<<: scrolls backward the available quantities in the display line indicated by the cursor.
DIFF: displays the difference between the quantity currently indicated by the cursor
and an equivalent quantity, if available. If there are several equivalent quantities,
press repeatedly F2 until the desired quantity is selected.
>>>: scrolls forward the quantities available in the display line indicated by the cursor.
5. UNIT: selects the measurement unit. The following sub-functions are shown:
<<<: scrolls backwards the measurement units available for the quantity shown in the
display line indicated by the cursor.
>>>: scrolls forward the measurement unit available for the quantity shown in the dis-
play line indicated by the cursor.
6. REL: displays the relative measurement, that is the difference between the current value
and the one stored when the key was pressed, in the display line indicated by the cursor.
Conf iguration Menu
Hot
-
wire power supply
Connection mode
Relative measure
Print of measures
Offset correction
Reset of peak value

HD31 - 10 - V1.6
7. REC (record): calculation of minimum, average and maximum values. The following sub-
functions appear:
AUTO: starts the automatic update, once per second, of the minimum, average and
maximum values.
MANL (manual): updates the minimum, average and maximum values taking into ac-
count the measurement at the time when the command is selected.
SEL (select): selects the measurement line indicated by the cursor on the display for the
REC function. If the measurement line is already selected, the selection is cancelled.
If an integral measurement is selected, (with illuminance or irradiance measurements),
REC function is replaced by ITG function.
ITG (integral): calculation of the integral. The following sub-functions appear:
RUN: starts the calculation of the integral.
SEL (select): selects the measurement line indicated by the cursor on the display for the
ITG function. If the measurement line is already selected, the selection is cancelled.
8. VIEW: views the minimum, average and maximum values (calculated with the REC func-
tion) of the selected quantity. The following sub-functions appear:
MIN: displays the quantity minimum value in the display line indicated by the cursor.
Press the function key again to return to the current measurement value.
AVRG (average): displays the quantity average value in the display line indicated by
the cursor. Press the function key again to return to the current measurement value.
MAX: displays the quantity maximum value in the display line indicated by the cursor.
Press the function key again to return to the current measurement value.
If an integral measurement is selected (with illuminance or irradiance measurements), the
VIEW function is replaced by the V/T function.
V/T (Value/Time): setting integration limits. The following sub-functions appear:
VAL (value): sets the threshold for the stoping of the integral calculation.
TIME: sets the integration time limit.
CLR (clear): sets to zero the integration time and threshold limit.
9. DEL: deletes minimum, average and maximum values (or the integral calculation, with ITG
function). The following sub-functions appear:
CANC (cancel): disables the REC function (or ITG) and deletes the minimum, average
and maximum values (or the integral calculation, in the case of ITG function).
CLR (clear): resets the minimum, average and maximum value calculation (or the in-
tegral calculation, in the case of ITG function).
10. PRINT: sends the three measurements displayed when the key is pressed to the printer
connected with the RS232C output. Also the information about the connected probes (type
of probe, serial number, type of calibration used) are printed.
11. PL
OT: displays the real-time graphics of the measurement indicated by the cursor on the
display. The following sub-functions appear:
X: displays the vertical cursors.
ΔX: sets the scale of abscissae.
Y: displays the horizontal cursors and the zoom functions of the axis of ordinates.
12. HOTW (hot-wire): supplies or removes power to the hot-wire air speed probe.
13. ZERO: corrects the offset of the probes provided with this function.
14. PEAK: resets the peak value of the pressure probes.
Note: some functions may appear disabled (grayed out) according to the selected quantity and
the instrument state.

HD31 - 11 - V1.6
2.4 HELP FUNCTION
The instrument is provided with a quick HELP function that briefly describes the meaning of the
symbol appearing in the display status bar and the function of the commands available through
the SELECT key.
To access the HELP function:
1. Press the SELECT key to display
the MENU command in the command bar.
2. Select the MENU command by
pressing the F2 key.
3. If necessary, select the HELP item using S and T keys, then
press F3 key (OK command) to confirm.
4. The HELP of the commands available with the SELECT key ap-
pears. To cycle through the list of commands, select repeatedly “<<<” (F1 key) or “>>>” (F3 key)
5. To display the help of the symbols appearing in the display
status bar, select the ICON command by pressing F2 key.
6. To cyclically scroll the symbols’ list, repeatedly select “<<<”
(F1 key) or “>>>” (F3 key). To return to the Help of the
commands, select the FKEY command by pressing the F2 key.
7. Press ESC key twice to exit the menu and return to the mea-
surement mode.

HD31 - 12 - V1.6
3 MEASUREMENT MODE
Switching on and off the instrument is obtained by pressing the ON/OFF key.
Fig. 3.1: ON/OFF key
At
startup, the instrument checks for the probes connected to inputs and, after a few seconds,
goes to the standard measurement mode, displaying the measured quantities. The instrument
displays three measurement lines at the same time.
The quantities appearing on the display are identified by the letter (A, B or C) corresponding to
the input channel connected to the probe measuring the quantity, followed by a sequential
number helping to differentiate the various quantities measured by the same probe (combined
probes) or any derived quantities.
When the instrument is first switched on, it lists the available quantities depending on the
number and type of the connected probes, choosing among A1, B1, C1, A2, B2, C2, A3, B3,
C3.... For instance, if input A is connected to a humidity/temperature combined probe, and in-
put B to a Pt100 probe, the automatic configuration will organize the display as follows:
• First line (A1): relative humidity in %RH;
• Second line (B1): temperature of the Pt100 single probe;
• Third line (A2): temperature of the combined probe.
By default, derived quantities are not displayed; see paragraph 3.4. for their display.
I
f there are more than three quantities, use S and T keys to cyclically scroll upward or downward the list of the available quantities. During the scrolling operation, a small sequential
number appears over the quantity identifier, marking the position of the measurement in the
list.
Fig. 3.2: measurements display
W
ith the next switch-on, the instrument displays the list of the quantities as it appears at
switch-off.
Measurement unit
of the quantity
Measurement position
in the displayed list
(during scrolling only)
Quantity
identifier
Measured value

HD31 - 13 - V1.6
Note: the recognition of the probes occurs when the instrument is on; if a probe is connected
when the instrument is on, the instrument has to be turned off and on to display the new
probe measures.
3.1 SELECTING A MEASUREMENT LINE
Some functions of the instrument have effect on the selected measurement line, indicated by a
check mark next to the quantity identifier. Use the S and T keys to select a measurement
line. The currently selected measurement line is highlighted with the first press of the S or T
key: repeatedly press the S or T key until the desired measurement line is highlighted and
wait some seconds for the checkmark to appear.
Fig. 3.1.1: selecting a measurement line
3.2 SELECTING THE MEASUREMENT UNIT
Several measurement units are available for some quantities (temperature, pressure, air
speed, ...). To change the measurement unit of a quantity in a measurement line:
1. Select the desired measurement line using S and T keys.
2. Press SELECT until the UNIT
command in the command bar is
selected, then select the command
by pressing F2.
Note: if the quantity has no measurement unit available for selection
or RECORD and/or LOG functions
are enabled, the command is disabled.
3. Select “<<<” (F1 key) or “>>>” (F3 key) to cyclically scroll
the available measurement units.
4. Press ESC to exit the UNIT command.
If several quantities of the same type (e.g. several temperatures) are shown in different measurement lines, you can set different measurement units for each measurement line.
The measurement unit change affects the display and the immediate print of the measurements (PRINT command). The data already stored in the SD card maintain the meas-
urement units selected at storage.
Check mark
Check mark

HD31 - 14 - V1.6
3.3 CHANGING THE QUANTITY VIEWED IN THE DISPLAY LINE
A quantity can be displayed in any measurement line of the display:
1. Select the desired line with S and T keys.
2. Press the SELECT key to display
the IN command in the command
bar, then select the command by
pressing F1 key.
3. Select “<<<” (F1) or “>>>” (F3) to cyclically scroll the
available quantities.
If you don’t want quantities to be displayed in the line, select
"––".
4. Press ESC to exit the IN command.
The same quantity can be displayed in several lines, e.g., for the simultaneous display of minimum and maximum values, or the current value and the average value, etc. (note: to display the
minimum, average and maximum values of a quantity you need to activate the RECORD function,
see chapter 5).
3.4 DERIVED QUANTITIES AND NUMBER OF MEASUREMENT LINES DISPLAYED
The number of measurement lines displayed can be configured. Up to 36 measurement lines can
be displayed. The number of measurement lines displayed at the same time is always 3, further
measurement lines can be seen by scrolling the list upward or downward using S and T keys.
By default, the instrument displays only the quantities measured by the probes and the main
derived quantities. For instance, connecting a combined relative humidity and temperature
probe displays only the temperature, the relative humidity and the dew point temperature, but
not the other derived quantities: absolute humidity, mixing ratio, etc. To enable any other derived quantities as well, or to disable some of the visible quantities, proceed as follows:
1. Press SELECT to display the MENU
command in the command bar, then
select the command by pressing F2.

HD31 - 15 - V1.6
2. Select the SETUP item using S and T, then press F3 (OK
command) to confirm.
3. Select the CHANNELS item using S and T, then press F3
(OK command) to confirm.
4. Select the A, B or C input of the instrument, using S and T,
then press F3 (OK command) to confirm.
5. The list of the available measured and calculated quantities,
relevant to the selected input is displayed. The checkmark
next to a quantity indicates that the quantity measurement is
enabled (appears in the display). Using S and T, select the
quantity to be enabled or disabled, then press F1 (SEL com-
mand) to toggle between the enabled and disabled states of
the quantity.
6. Press F3 (OK command) to confirm.
Note: the enabled state of several quantities can be changed by selecting them one at a
time, before confirming; the changed quantities are displayed in yellow to highlight
changes.
The instrument allows the setting of the quantity enable state to be saved, so as to be able to restore it afterwards and cancel any changes carried out thereafter.

HD31 - 16 - V1.6
Select the BKUP command (F2 key) to save or restore the saved
setting.
Select the SAVE command (F1) to save the setting. Select the
LOAD command (F2) to restore the previously saved setting. Select the BASIC command (F3) to return to the default setting.
Press F3 (OK command) to confirm the restore operation.
Press ESC to return to the previous menu.
Number of displayed measurement lines:
The number of the displayed measurement lines is automatically updated when quantities are
enabled or disabled. If you want a different measurement number to be displayed, e.g. to
show simultaneously both the current value of a quantity and the relevant statistical information (Min, Max, Avg), the number of displayed measurement lines can be set manually:
1. Select the CHANNELS NUM. item in the CHANNELS menu,
using S and T, then press F3 (OK command) to confirm.
2. Set the number of measurement lines to be displayed using
S and T (select the RESET command with F2 key to set the
default number), then press F3 (OK command) to confirm.
Note: the current setting is shown in white, while the other
available settings appear in yellow to show that they are not
the current setting.
3. The instrument returns to CHANNELS NUM item, repeatedly press ESC to exit the menu.

HD31 - 17 - V1.6
3.5 DISPLAYING THE DIFFERENCE BETWEEN TWO HOMOGENEOUS QUANTITIES
A measurement line can display the difference between the values of two homogeneous quantities, e.g. the difference between the values measured by two Pt100 probes, by two thermocouple probes, by two equal pressure probes etc.
The difference between the measurements of two different probes cannot be calculated, even
if they refer to the same physical quantity, e.g. between the measurement of a Pt100 probe
and a thermocouple probe, or between the measurement of two pressure probes having a different full scale value.
To display the difference between the values of two homogeneous quantities:
1. Select the first of the two quantities (e.g. A2, if you want A2-B1 to be displayed) using S
and T keys.
2. Press SELECT to display the IN
command in the command bar,
then select the command by pressing F1.
3. Select the DIFF command by pressing F2.
Note: if a quantity consistent with the one selected is not
available, the command is disabled.
4. The selected measurement line shows the difference between
the value of the quantity originally included in the line (e.g. A2)
and the value of another available homogeneous quantity.
If several homogeneous quantities are available, repeatedly
select the DIFF command (F2 key) to display the desired dif-
ference.
To disable the difference display, repeatedly select the DIFF
command (F2 key) to display again the value of the quantity
originally present in the line.
5. Press ESC to exit the IN command.

HD31 - 18 - V1.6
3.6 DISPLAYING THE RELATIVE MEASUREMENT (REL)
The instrument allows the relative measurement of the quantities to be displayed, i.e. the difference between the current measurement value and a reference value, consisting in the measurement value at the moment of the REL function activation.
To activate the relative measure:
1. Select the quantity you want the relative measure to be enabled, using S and T.
2. Press SELECT to display the REL
command in the command bar,
then select the command by pressing F3.
3. The selected measurement line shows the difference between
the quantity current value and the reference value, consisting in
the measurement value at the moment of the REL command
activation. The reference value is displayed in the upper part of
the measurement line (followed by the symbol REL).
Select again the REL command (F3 key) to disable the display of the relative measure and return to the current measurement value.
3.7 HOLDING THE MEASUREMENT ON THE DISPLAY (HOLD)
The HOLD function holds the current measurement values on the display. The function affects all
the measurement lines. When the HOLD function is active, the measurement values on the display are not updated, but remains set to the value present at the moment of the function activation.
Press HOLD to activate the function. The function activation is highlighted by the orange bars
over and under the measurement area on the display, and by the word HOLD flashing in the
top bar. The clock in the bottom bar remains stopped to the moment the key was pressed.
Fig. 3.7.1: HOLD function activation
Pr
ess again HOLD to disable the HOLD function and return to the current measurement val-
ues.
Orange bars
Reference value

HD31 - 19 - V1.6
3.8 MEASUREMENT GRAPH
The graph of a quantity measured by the instrument can be shown in the display. Zoom functions and vertical and horizontal cursors are available during the graphical representation, allowing the graph to be analyzed in detail.
Select the quantity you want the graph to be displayed using S and T. Press SELECT to display
the PLOT command in the command bar, then press F3.
Fig. 3.8.1: PLOT c
ommand
If the graph of another quantity was previously started, a message appears asking to confirm the
change: select YES (F3 key) to continue (or press F1 to select NO and exit). The quantity
graph appears on the display.
Fig. 3.8.2: graph display
T
he minimum and maximum values of the ordinate axis (y-axis) are shown at the left of the
graph. Over the graph, in the middle, there is the ordinate scale: ΔY is the difference between
two horizontal lines of the graph grid. Under the graph, in the middle, there is the abscissa
scale: ΔX is the difference between two vertical lines of the graph grid.
Horizontal cursors and ordinate axis scale:
By selecting the Y command (F3 keys), the horizontal cursors and the zoom commands of the
ordinate axis are displayed.
The CUR command (F2 key) activates alternatively the lower or the upper cursor. The active
cursor is light blue, while the non-active cursor is white. You can move the active cursor using S
and T. The positions of the two cursors appear in the command bar.

HD31 - 20 - V1.6
Fig. 3.8.3: horizontal cursors
Th
e ZOOM command (F3 key) enlarges the graph area included between the two horizontal
cursors: the minimum and maximum values of the ordinate axis are equal to the values indicated by the lower and the upper cursor respectively. The indication AUTO (automatic ordinate
scale) is replaced by the indication ZOOM over the graph, on the right.
The AUTO command (F1 key) allows zooms to be disabled and to return to the automatic ordinate scale.
Fig. 3.8.4: AUTO c
ommand
Vertical cursors and x-axis scale:
Selecting X command (F1 key) displays the vertical cursors of the abscissa axis (x-axis).
The CUR command (F2 key) activates alternatively the lower or the upper cursor. The active
cursor appears light blue, while the non-active cursor is white. The active cursor can be moved
using <<< (F1 key) and >>> (F3 key) commands. The time distance between cursors (Δx) and
the difference of the two measurements in correspondence with the cursors (Δy) appear over the
command bar.
Fig. 3.8.5: vertical cursors
P
ress ESC to return to the previous command level.
The time interval between two vertical lines of the graph grid is set by default to 1 minute. Select
ΔX command (F2 key) to change the interval.
Upper cursor
Lower cursor
Lower cursor
p
osition Upper cursor position
Right cursor
Left cursor
Difference of measures in correspondence with the cursors
Time distance between cursors

HD31 - 21 - V1.6
Fig. 3.8.6: command ΔX
T
he available intervals can be cyclically set to: 1 min, 5 min, 10 min, 30 min, 1 hour, 2 hours,
4 hours through the NEXT command (F3 key).
Fig. 3.8.7: x-axis scale setting
T
he time interval returns to the default value (1 min) by selecting the BACK command (F1
key).
The sequential number of the selected interval appears under the graph on the right (e.g. 2/7
indicates the second interval of the seven available, that is 5 min).
If the interval returns to 1 minute (with the BACK command, or by setting the value from 4
hours to 1 minute with the NEXT command), the graph is reinitialized.

HD31 - 22 - V1.6
4 THE PROBES
The probes of the instrument are equipped with an “intelligent” module acting as interface between the probe and the instrument. Inside the module there is a microprocessor circuit with
permanent memory performing different functions:
• allows the instrument to recognize the type of connected probe: Pt100, thermocouple, hu-
midity probe, pressure probe, anemometric probe, photo/radiometric probe, ...;
• stores into memory the probe calibration data: in this way the probe can be indifferently
connected to the three inputs of the instrument or to another instrument with no need to
be recalibrated;
• recognizes the instrument with which it was calibrated (user-calibration);
• maintains the factory-calibration data and those concerning the last calibration made by
the user, with the possibility of choosing one of the two calibrations for each of the probes
connected to the instrument;
• stores into memory a serial number allowing the unique identification of the probe, a useful
feature in case several probes of the same type are simultaneously used.
The recognition of SICRAM probes takes place when the instrument is started or after a reset.
SICRAM probes are supplied factory-calibrated and don’t normally require further interventions
from the user. Nevertheless, a new calibration can be carried out if needed. See chapter 13 for
u
ser-calibration of the probes.
4.1 PRT TEMPERATURE PROBES
Pt100 probes with SICRAM module can be connected. The probes have a 4 wire connection and
the excitation current is chosen in such a way as to minimize the sensor’s self-heating effect.
If your instrument needs to be connected to sensors that are not equipped with SICRAM module, one of the following two accessories will have to be placed between sensor and instrument:
• TP471: “intelligent” module with microprocessor and permanent memory, designed for
4-wire Pt100 Platinum sensors (PRT).
• TP47: connector without microprocessor and memory, designed for 4-wire Pt100 and 2-
wire Pt1000 Platinum sensors (PRT).
TP471 and TP47 are provided with fairlead and cable grommet for 5 mm max diameter cables.
Proceed as follows:
1. Unscrew the fairlead and pull the cable grommet out, remove the identification label, un-
screw the ring nut on the opposite side of the module/connector.
Fig. 4.1.1: opening the module/connector
2. P
ass the sensor cable through the fairlead and cable grommet.
3. Open the two module/connector shells and connect the PRT sensor to the printed circuit as
shown in the figures below. Take care that the welding is clean and skillfully made.

HD31 - 23 - V1.6
Fig. 4.1.2: connecting 4-wire Pt100 sensor to TP471 module
Fig. 4.1.3: connecting 4-wire Pt100 sensor to TP47 connector
Fig. 4.1.4: connecting 2-wire Pt1000 sensor to TP47 connector
4. C
lose the two shells, insert the gasket in the module/connector, screw the fairlead and the
ring. Make sure that the cable is not twisted when screwing the fairlead.
Fig. 4.1.5: PRT sensor connected to the module/connector
S
ee paragraph 13.1 at page 90 for PRT probe calibration.

HD31 - 24 - V1.6
4.1.1 SETTING THE INSTRUMENT TO READ A PRT PROBE WITHOUT SICRAM MODULE
If a PRT probe without SICRAM module is connected, the type of connected probe must be set
in the instrument:
1. Turn the instrument off and connect the probe.
2. Turn the instrument on.
3. Press SELECT to display the MENU
command in the command bar, then
select the command by pressing F2.
4. Select the SETUP item using S and T, then press F3 (OK
command) to confirm.
5. Select the CHANNELS item using S and T, then press F3
(OK command) to confirm.
6. Using S and T, select the input (A, B or C) of the instru-
ment to which the probe is connected, then press F3 (OK
command) to confirm.

HD31 - 25 - V1.6
7. Using S and T, select the probe type: "SICRAM" (default),
“DIRECT Pt100” or “DIRECT Pt1000”.
Note: the current setting appears in white color, while the
other available settings are in yellow color to highlight that
they are not the current setting.
8. Press F3 (OK command) to confirm.
9. Turn the instrument off and then back on.
Note: the probe type setting is maintained if the instrument is switched off with the probe
connected; the setting returns to the default value (“SICRAM”) instead if the instrument is
switched off when the probe is disconnected.
4.2 THERMOCOUPLE TEMPERATURE PROBES
K, J, T, E, R, S, B and N-type thermocouple temperature probes can be connected. A SICRAM
module has to be placed between the probe and the instrument choosing from the modules below:
• TP471D0: 1-input module without cold junction compensation.
• TP471D: 1-input module with internal sensor for cold junction compensation.
• TP471D1: 2-input module with internal sensor for cold junction compensation.
If TP471D0 module is used, without cold junction compensation, the cold junction will have to
be kept at a temperature of 0 °C using a melting ice bath.
TC
Fig. 4.2.1: cold junction at 0 °C
If TP
471D and TP471D1 modules are used, the cold junction temperature is measured by the
internal sensor and is used by the instrument to compensate the thermocouple measurement.
The instrument displays also the cold junction temperature (as second quantity, e.g. A2, for
the 1-input module, and as third quantity, e.g. A3, for the 2-input module).
See paragraph 13.2 at page 93 to set the type of thermocouple connected to the modules.
Copper
Melting ice bath

HD31 - 26 - V1.6
4.3 RELATIVE HUMIDITY AND TEMPERATURE COMBINED PROBES
The relative humidity and temperature combined probes use a capacitive sensor for the measurement of relative humidity and a Pt100 sensor for the measurement of temperature. By connecting a relative humidity and temperature
combined probe, the instrument can display, be-
sides the two primary quantities, the following derived humidity quantities as well:
• Saturated vapor pressure (Svp) in hPa
• Partial vapor pressure (Pvp) in hPa
• Mixing ratio in g/kg (vapor grams in 1 kg of dry air)
• Enthalpy in J/g
• Absolute humidity in g/m3 (vapor grams in 1 cubic meter of dry air)
• Dew point Temperature (Td)
• Wet bulb Temperature (Tw)
• Discomfort index (DiscIdx)
• NET index (NetIdx)
Note: the calculation of the derived quantities is made taking into consideration a ba-
rometric pressure fixed value equal to 1013.25 hPa.
For measuring, place the probe avoiding areas where fast temperature variations may occur
creating condensation. The measurement in no condition of fast temperature variations is almost immediate. On the contrary, if fast temperature variations occur, you have to wait the
sensors and the probe body to reach thermal balance in order to obtain accurate measurements.
See paragraph 13.3 at page 94 for the calibration of relative humidity and temperature combi
ned probes.
4.3.1 DISCOMFORT INDEX AND NET INDEX
Environmental conditions affect our physiological well-being status: particular values of temperature, humidity and air speed are perceived as unpleasant or even intolerable. While it is
easy to quantify the relationship between well-being status and the measure of each variable
taken separately, it is even more complex to provide an indication about their combined effect.
For this reason, different evaluation systems have been introduced leading to the formulation
of climate qualitative indices (Comfort Indices).
The two indices provided by the instrument are the Discomfort Index and the NET index
(Net Effective Temperature). The first one depends only on temperature and relative humidity,
while the second one takes into consideration air speed as well. If an anemometric probe is
connected to the instrument, the speed measurement detected is used for the calculation of
the Net Index; if there is no probe connected, air speed is set equal to zero and its contribution is not taken into account.
Discomfort index:
3.46)3.1499.0(
100
81.0 +−••+•= T
H
TDI
with T = temperature in °C
H = relative humidity in %
On the basis of the value provided by the discomfort index, climate conditions are defined from
comfortable to unsustainable:
Comfortable
Slightly
uncomfortable
Uncomfortable
Very
uncomfortable
Unsustainable
68 70 75 80 86

HD31 - 27 - V1.6
NET index:
T
H
v
H
T
NI •
⎟
⎠
⎞
⎜
⎝
⎛
−•−
•+
+•−
−
−=
100
129.0
4.176.1
1
0014.068.0
37
37
75.0
With T = temperature in °C
H = relative humidity in %
v = air speed in m/s
NET index provides the so called “apparent temperature”: with optimum weather conditions, the
index value is close to the environmental T temperature. As weather conditions deteriorate, humidity and air speed influence become more and more evident and the index provides a temperature value that reflects human typical sensations, deviating even significantly from the ambient temperature value:
• in hot climate, the NET index rises as temperature and/or humidity level increases, but it
decreases with increasing wind force;
• in cold climate, the NET index decreases with temperature and with increasing humidity
and wind level.

HD31 - 28 - V1.6
4.4 PRESSURE PROBES
The following SICRAM modules can be connected to the instrument:
• PP471: module for connection to absolute, relative and differential pressure probes of the
TP704 and TP705 series. Connecting the module to the instrument displays both the instant
value and the peak value of pressure. The peak value is characterized by the word "peak"
alternating with the measurement unit.
• PP472: module for the detection of the barometric pressure in the range 600...1100 hPa.
• PP473S...: series of modules for the measurement of the differential pressure. Available
full scale values: 2.5 / 10 / 20 / 50 / 100 / 200 / 500 / 1000 / 2000 mbar.
Pressure can be displayed in the following measurement units: Pa, hPa, kPa, mbar, bar, atm,
mmHg, mmH
2
O, kgf/cm2, PSI, inHg, inH2O. See paragraph 3.2 at page 13 for the measure-
ment unit selection.
Some measurement units require the value to be displayed with a multiplication factor. If the
displayed value is followed by the indication “E+3”, it means that the value must be multiplied
by 1000; if on the contrary it is followed by the indication “E-3”, it means that the value must
be divided by 1000.
The differential probes may be set to zero (see next paragraph). See paragraph 13.4 at page
99 for the calibration of PP472 module for the barometric pressure measurement.
4.4.1 ZEROING DIFFERENTIAL PRESSURE PROBES
There can be a small difference between the two inputs of the differential probes, that’s why
the instrument, with equal pressure applied to the two probe inputs, doesn’t indicate zero value. A zeroing command for the differential value is available:
1. Leave the two inputs of the differential probe open, so as they may detect the same pressure.
2. Press SELECT to display the ZERO command in the command bar, then select the com-
mand by pressing F2.
Fig. 4.4.1: ZERO c
ommand
3. Select inputs A, B or C the probe is connected to by pressing F1, F2 or F3 respectively.
Fig. 4.4.2: selecting the differential probe for zeroing

HD31 - 29 - V1.6
4. The instant value is automatically zeroed.
4.4.2 PEAK VALUE RESET
The peak value detected by the probe connected to PP471 module can be reinitialized and set
equal to the instant value:
1. Press SELECT to display the PEAK command in the command bar, then select the com-
mand by pressing F2.
Fig. 4.4.3: PEAK c
ommand
2. Select inputs A, B or C the probe is connected to by pressing F1, F2 or F3 respectively.
Fig. 4.4.4: selecting the probe for peak value reset
3. T
he peak value is reset to the instant value.
Peak value reset during logging:
If the logging interval is lower than 60 seconds, the peak value is not zeroed: the acquired
value is therefore the highest peak since acquisition startup.
For logging intervals equal to or higher than 60 seconds, the peak value is on the contrary reinitialized after each acquisition: the stored peak value is therefore the one related to the single interval between two subsequent acquisitions.
Two different operation modes have been chosen for this reason: when the logging interval is
short, the set of the instant measures represents closely enough the pressure trend over time.
In the case of long intervals, the mere knowledge of the pressure value of each interval and of
the absolute peak value doesn’t provide sufficiently precise information: knowing each peak
value between two subsequent samplings provides additional information on the pressure time
trend.

HD31 - 30 - V1.6
4.5 AIR SPEED PROBES
The following probes/modules can be connected to the instrument:
• AP471S...: hot-wire air speed SICRAM probes.
• AP472S...: vane air speed SICRAM probes.
• AP473S...: SICRAM modules for Pitot tubes.
Some probes measure air temperature as well.
The selection of the type of probe to be used depends on the range of air speed and temperature to be measured: see the specifications of air speed probes at page 129.
Ai
r speed can be displayed in the following measurement units: m/s, km/h, ft/min, mph, knot.
See paragraph 3.2 at page 13 for the measurement unit selection.
TAB. 4.5.1: conversion table of air speed measurement units
m/s ft/min km/h mph knot
1 m/s 1 196.87 3.60 2.24 1.944
1 ft/min 0.00508 1 0.01829 0.01138 9.874·10-3
1 km/h 0.2778 54.69 1 0.6222 0.5399
1 mph 0.4464 87.89 1.6071 1 0.8689
1 knot 0.5144 101.27 1.852 1.151 1
4.5.1 FLOW-RATE MEASUREMENT
If an air speed probe is connected, the instrument can calculate the air flow rate of an air duct
or air vent orthogonal to the flow. For the calculation of the air flow rate, you need to configure
the value of the duct or air vent section as described in paragraph 9.4 at page 76.
T
he air flow rate can be displayed in the following measurement units: l/s, m
3
/s, m3/min, ft3/s,
ft
3
/min. See paragraph 3.2 for the measurement unit selection.
Note: in air flow measurements, use only one anemometric probe at a time, since only
one section is available for setting. There are no limitations instead to the simultaneous use of
several anemometric probes for air speed measures.
4.5.2 NOTES ON FLOW MEASUREMENTS
If the surface area of the considered measurement is large or there is air turbulence, e.g. in
front of a grid or a diffuser, air speed and air flow may vary both geographically (from one
point to another) and over time (in the same point but in subsequent moments). To obtain
most significant values, it is therefore advisable to average the acquired instant measurements. The instrument provides two methods for the calculation of the measured average
flow:
1) Use of the RECORD function: the function allows averaging of the acquired instant values starting from the moment of the function activation. Additionally, the function provides the minimum and maximum acquired values. See chapter 5 for the RECORD functio
n use.
2) Use of moving average: the function allows displaying the average of the last n in-
stant measurements - instead of the instant measurement – where n can be set from 1
to 100. See paragraph 9.5 at page 78 for the setting of the parameter n (FL
OW AVG.
TIME).
The presence of vent grills or diffusers with tilting flaps produces errors in the flow measurement
due to the generated turbulence, since part of the flow is slowed down by the obstacle repre-

HD31 - 31 - V1.6
sented by the flap, while the remaining flow proceeds at maximum speed. In this case, a channel having a length of about the double of the grill diagonal should be placed temporarily in front
of the grill and measurements should be taken at the channel’s end. The section to be considered for flow calculations will be that of the temporary channel placed between grill and probe.
D
L = 2 x D
Fig. 4.5.1: flow measurement in the presence of vent grills or diffusers
4.5.3 HOT-WIRE AIR SPEED PROBES AP471S...
AP471 S1 and AP471 S3 probes measure incident air flows up to 40 m/s; AP471 S2 and
AP471 S4 probes, equipped with omnidirectional sensor, measure air speed up to 5 m/s in any
direction of the air flow incident on the probe. Air speed measurement temperature is compensated in the range 0…+80 °C.
AP471 S4 probe is provided with supporting base and sensor protection.
AP471S1
AP471S2
AP471S3
Temporary channel
Probe
Duct section
Ventilation grill
DUCT
Flexible

HD31 - 32 - V1.6
AP471S4
Fig. 4.5.2: AP471S...series probes
AP
471 S1, AP471 S2 and AP471 S3 probes are provided with a cylindrical shield sliding longitudinally along a guide rail. The shield has two end of stroke positions which lock it in measurement condition (lowest level) or at rest condition (highest level).
Fig. 4.5.3: description of AP471S1- AP471S2- AP471S3 probes
T
o reduce the amount of space when it is not used, the AP471 S4 probe is equipped with a
protection cylinder to be screwed onto the probe’s head (see fig. 4.5.2).
The probes of AP471 S… series are factory-calibrated and don’t require user-calibrations.
Before the measurement, set to zero the probe as indicated in paragraph 4.5.6 at page 38.
T
o perform the measurement, extend the telescopic rod for the necessary length ensuring that
the cable may slide freely and without efforts. Uncover the sensor and insert the probe in the
Flow direction line
Air speed sensor
Compensation sensor
Ambient temperature sensor
Cylindrical shield

HD31 - 33 - V1.6
air flow to be measured, keeping the arrow on top of the probe parallel to the flow, as indicated in the figures below. The probe must be kept orthogonal to the flow and not inclined.
OK NO
Fig. 4.5.4: positioning hot wire probes
P
robe power supply:
To reduce battery drain, the hot-wire probe is not powered at instrument startup: OFF appears
in place of air speed and flow measurements. To power the probe:
1. Press SELECT to display the HOTW command in the command bar, then select the com-
mand by pressing F1.
Fig. 4.5.5: HOTW command
2. OFF
indication on the display is replaced by the measurement.
Select again the HOTW command to switch off the probe.
Flow direction indicator
Probe top

HD31 - 34 - V1.6
AP471 S… probe speed sensor is heated and fire or explosion might occur, if
vapors or gases are present. Do not use the probe in the presence of flammable gases. Make sure there are no gas or explosive vapor leaks in the environment.
Care and maintenance of hot-wire probes:
The probe is a very sensitive device and should be handled with extreme care. Even a simple
shock, particularly with omnidirectional probes whose sensor is uncovered, can make the
probe unusable. Once the measure is finished, the sensor placed on the probe’s head should
be protected with the metal shield or with the threaded cylinder supplied. During use, the omnidirectional probe AP471 S4 should be protected with the special metallic grid provided. For
transportation, the sensor should be closed inside the protection cylinder by screwing it at the
probe’s end.
Do not touch with your fingers.
Use only alcohol to clean the probe.
4.5.4 AIR SPEED VANE PROBES AP472S...
AP472 S1 and AP472 S2 vane probes measure the speed and flow rate of an incident air flow.
AP472 S1 probe measures also the temperature through a type K thermocouple. They are
equipped, upon request, with an extensible telescopic rod (AST.1) which facilitates measure-
ments in hard-to-reach areas (e.g. air-vents).
The bigger diameters are suitable for flow measurements in the presence of low-to-medium air
speed turbulence (e.g. duct outlets). Lower diameters are suitable for applications where the
probe surface must be much smaller than the transversal section of the duct, inside which the
measurement is performed, e.g. aeration channels.
AP472 S1 AP472 S2
Fig. 4.5.6: probes of AP472S...series

HD31 - 35 - V1.6
The AP472 S… series probes are factory calibrated and don’t require user calibration.
ATTENTION: vane probes can be connected only to the C input of the instrument. If the
probe is connected to A or B inputs, the indication “Slot C” appears to indicate that the
probe should be moved to the C input .
To perform the measurement, extend the telescopic rod for the necessary length making sure
that the cable slides freely and without efforts. Insert the probe in the air flow to be measured,
keeping the propeller axis parallel to the flow, as indicated in the figures below. The probe
should be kept orthogonal to the flow and not inclined. The probe is correctly positioned in the
air flow when the maximum value is detected.
OK NO
Fig. 4.5.7: positioning vane probes

HD31 - 36 - V1.6
The probes AP472 S1 and AP472 S2 , plus auction telescoping AST.1 with swivel head, can use
a ∅ 16 mm rigid extension rod. To unscrew the handle (3) hold the probe body at the point
(1). Screw the rod top AP471S1.23.6 (4) on the screw (2). Other extension rods
AP471S1.23.6 can be added. The last element can be the handle (3) or the extension rod
AP471S1.23.7 (5).
Fig. 4.5.8: adding extensions to vane probes
Ca
re and maintenance of vane probes:
Probe performances, especially at the lowest speed, depend widely on the very low friction
with which the propeller rotates around its own axle. So as not to jeopardize this feature, it is
recommended not to force, lock or rotate the propeller with your fingers and not to introduce it
in air flows which could soil it, as far as possible.
4.5.5 AP473S... MODULES FOR PITOT TUBES
Pitot tube is a simple method for measuring air speed in difficult to access areas (e.g. aeration
ducts) and in the presence of high air speed and temperature. Since there is no air passage
through the Pitot tube, it is particularly indicated for measurements in harsh environments.
Fig. 4.5.9: Pitot tube measuring principle
Hole for total pressure
measurement
Hole for static
pressure
measurement
Static pressure
Speed pressure
Total pressure

HD31 - 37 - V1.6
The pressure inside the duct is the result of three different pressures:
1) barometric pressure (barometric B);
2) static pressure Ps;
3) dynamic pressure Pv due to non-null air speed inside the duct.
The formula below provides air speed in relation to the three pressures and of air temperature.
⎥
⎦
⎤
⎢
⎣
⎡
•
+
••••= Pv
Ps100.000
100.000
289
T
B
1000
1,291Cv
K[T]
Pa[Ps] [Pv]
mbar [B]
m/s[v]
°=
==
=
=
Pitot tube provides the difference between the pressure existing at the front inlet of the duct
and the pressure detected at the lateral air escapes that is the dynamic Pv:
(Ps+Pv) – Ps = Pv
Static pressure Ps represents the pressure difference between the inside of the duct in static
conditions and the barometric pressure. If Ps is lower than 2500 Pa (=25 mbar), the term
[100.000/(100.000+Ps)] can be disregarded, since the error committed is of about 1%.
B represents the barometric pressure existing at the moment of the measurement: the value
can be given by a barometric pressure probe connected to the instrument or it can be set manually (see paragraph 9.3 at page 74).
T
is the temperature detected by the thermocouple K present in some models of Pitot tubes. If
the Pitot tube is provided with a thermocouple K, an external thermocouple K with Mignon
connector can be added to the Pitot tube. In alternative, the temperature value can be added
manually. See paragraph 9.2 at page 72 for the setting of temperature compensation.
C is
the tube constant. See paragraph 9.5 at page 78 for the parameter setting.
In
order to connect a Pitot tube to the instrument, a SICRAM AP473 S….module must be
placed between the tube and the instrument. Any of the Pitot tubes can be connected to each
of the available modules, with the relevant thermocouple, if any. In standard temperature and
barometric pressure conditions, AP473 S1 model has a full scale of 40 m/s, AP473 S2 of
55 m/s, AP473 S3 model of 90 m/s and AP473 S4 model of 130 m/s.
AP473 S...modules are provided with two pressure inputs to be connected to the Pitot tube
outputs, and with a thermocouple K input.
By connecting a AP473 S... module, the instrument displays: air speed, the air temperature
detected by the thermocouple, flow rate and the Pv differential pressure.
In order to perform the measurement, insert the AP473 S... module connector into one of the
instrument inputs; connect the outputs of the Pitot tube (pressure and thermocouple) to the
module. The outputs of the Pitot tube must be connected to the module respecting the correct
polarity. The output oriented downwards of the Pitot tube, indicated in the figure below by the
plus sign (+), must be connected to the positive input of the module; the lateral output of the
Pitot tube, indicated in the figure below by the minus sign (-) must be connected to the
negative input of the module.
Insert the Pitot tube into the air flow to be measured, keeping the small rod at the base of the
tube parallel to the flow as indicated in the figure below.

HD31 - 38 - V1.6
Fig. 4.5.10: positioning the Pitot tube
Th
e error committed in the event of a misalignment is shown in the graph below:
+0.6
+0.4
+0.2
0.0
-0.2
-0.4
-0.6
-0.8
-1.0
-1.2
0 5° 10° 15°5°10°15°
P
v % E
RRO
R
A
NGLE
Fig. 4.5.11: misalignment error of the Pitot tube
T
he rotation angle around its own vertical axis with respect to the flow direction (yaw) is
shown in the abscissa (x-axis), while the % error on the measurement of the Pv differential
pressure is displayed in the y-axis (ordinate). As can be seen, a difference greater than 10°
leads to an error in the measurement of the differential pressure of less than 0.5%.
4.5.6 ZEROING AIR SPEED PROBES
With hot-wire and Pitot probes, the probe zero should be corrected before performing a measurement, i.e., ensure that - under wind-free conditions – the speed and flow rate values provided by the probe are equal to zero, at a temperature close to that of the air flow to be
measured.
1. As to AP471 S1, AP471 S2 and AP471 S3 probes, slide the cylindrical shield upwards until the
window of the air speed sensor on top of the probe is completely closed. As to the AP471 S4
probe, close the probe head with the protection cylinder. As to Pitot probes, leave the two
inputs of AP473S...module open, so as they detect the same pressure.

HD31 - 39 - V1.6
2. Press SELECT to display the ZERO
command in the command bar,
then select the command by pressing F2.
3. Select A, B or C input the probe is connected to by pressing
F1, F2 or F3 key respectively.
4. The instant value is automatically zeroed.

HD31 - 40 - V1.6
4.6 VP472 MODULE FOR THE CONNECTION OF PYRANOMETERS AND ALBEDOMETERS
SICRAM VP472 module allows pyranometers and albedometers to be connected to the instrument.
When connecting a pyranometer to the module, the instrument displays:
• the mV signal generated by the thermopile;
• the global radiation in W/m
2
.
When connecting an albedometer to the module, the instrument displays:
• the mV signal generated by the thermopile detecting incident light;
• the mV signal generated by the thermopile detecting reflected light;
• the net radiation, in W/m
2
, defined as the difference between the incident global radia-
tion and the diffuse global radiation.
• The albedo, defined as the relation between the reflected global radiation and the inci-
dent global radiation.
VP472 module is equipped with a 6-pole terminal block with screw connectors. Connect the pyranometer or the albedometer respecting the correct polarity of signals. The figures below
show the connection of the pyranometer (LP PYRA 02, LP PYRA 03, etc.) and of LP PYRA 05
and LP PYRA 06 albedometers. In case a single-output pyranometer is attached, connect only
input 1 of the module (incident radiation) and make a bridge between inputs 2. Connect the
cable shield to the ground terminal indicated by the “ground” symbol.
Fig. 4.6.1: connecting a pyranometer
Fig. 4.6.2: connecting LP PYRA 05 a
lbedometer
Red (+)
Blue (-)
Black
(shield)
Upper terminal block
Lower terminal block
Red (+)
Blue (-)
Black
(shield)
Pyranometer
Black (shield)
Yellow (- Reflected rad.)
Green (+Reflected rad)
LP PYRA 05
Lower
terminal
White (housing)
Blue (- Incident rad.)
Red (+Incident rad.)
Upper terminal block

HD31 - 41 - V1.6
Fig. 4.6.3: connecting LP PYRA 06 albedometer
I
n order to calculate the global radiation in W/m
2
with respect to the output voltage signal of the
pyranometer, the pyranometer sensitivity must be set in the instrument, supplied with the pyranometer itself. The sensitivity must be set in nV/(Wm
-2
) and range between 5000 and
30000 nV/(Wm
-2
). The default value is 10000 nV/(Wm-2). To set the sensitivity:
1. Press SELECT to display the MENU command in the command bar, then select MENU by
pressing the F2 key.
2. Select the CALIBRATION item using S and T, then press F3 (OK command) to confirm.
Note: CALIBRATION item is not shown if the instrument is in protected mode. See paragraph 8.2 to change the protection status.
3. Th
e list of the connected probes is displayed. Each probe is identified by its own serial number and by the type of measurement. Select VP472 module using S and T, then press F3
(OK command) to confirm.
4. Set the first digit of the pyranometer sensitivity which measures the incident radiation using S and T, then select the command "-->" (F2 key) to proceed to the next digit (the currently selected digit flashes). To return to the previous digit, select "<--" (F1 key). After
setting all the digits, press OK (F3 key) to confirm the value.
5. Set the first digit of the pyranometer sensitivity which measures the reflected radiation using S and T, then select the command "-->" (F2 key) to proceed to the next digit (the currently selected digit flashes). To return to the previous digit, select "<--" (F1 key). After
setting all the digits, press OK (F3 key) to confirm the value.
Note: the second sensitivity is necessary only if an albedometer is connected; if this isn't
the case, leave the default value.
6. Press ESC twice to return to the measurement mode.
4.7 PHOTOMETRIC AND RADIOMETRIC PROBES WITH SICRAM MODULE
The photometric and radiometric probes of LP471... series can be connected to the instrument.
The measurement unit is chosen by the instrument depending on the probe connected. If several measurement units are provided for the same probe, see paragraph 3.2 at page 13 for the
sel
ection of the desired unit.
All the probes are factory-calibrated and do not require user calibrations.
Lower
terminal
Upper terminal block
LP PYRA 06
Red (+)
Blue (-)
Black (shield)
Green (+)
Brown (-)

HD31 - 42 - V1.6
4.7.1 INTEGRATION
Besides the instant measurement, the instrument calculates and displays the time integral of
the acquired measurements (except for the LP 471 LUM2 probe):
where u(t) is the instant value of the input variable at time t. The sampling interval is fixed
and equal to 1 second.
The integral calculation is started manually. The operation can be stopped manually or automatically when the user-settable threshold values are reached. The maximum integration time
is 100 hours.
Integral measurements are featured by the indication INTEGRAL over the measurement unit.
If INTEGRAL-type measurements are not specifically selected for integral calculation, this is
enabled for all the available integral measurements. Integral calculation can be started only for
some INTEGRAL-type measurements, by specifically selecting them.
Selecting an INTEGRAL-type measurement for integral calculation:
1. Select the integral calculation to be enabled using S and T. Integral measurements are
featured by the indication INTEGRAL over the measurement unit.
2. Press SELECT to display the ITG
command in the command bar,
then select the command by pressing F1.
3. Select the SEL command by pressing F3.
4. The indication INTEGRAL over the measurement unit is replaced
by the integration countdown, to indicate that the measurement
line is selected for calculating the integral.
To deselect the measurement line for calculating the integral, select again the SEL command (F3
key): the integration countdown is replaced by the indication INTEGRAL.
Similarly select all the INTEGRAL-type measurement of which you want the integral calculation to
be performed.
Integration time

HD31 - 43 - V1.6
Starting the integral calculation:
To start the integral calculation, select the RUN command by
pressing F1.
The RUN command starts the integral of all the INTEGRAL-type measurements selected for
calculation. If integral measurements have not been specifically selected, the integral of all the
INTEGRAL-type measurements is started.
Note: RUN command is available only if an INTEGRAL-type measurement is selected on the display (indicated by a check-mark) and if one of the measurements chosen for calculation is selected on the display, in case only some measurements were specifically selected for calculation.
Manual stop of integral calculation:
After startup, the RUN command is replaced by the STOP command. To manually stop calculating the integral, select the STOP command by pressing F1. The obtained integration value is
maintained on the display.
Setting the integration time and the limit value:
If a time limit or a threshold limit is set for integration, the calculation is automatically stopped
after the set time limit is reached or if the integral value reaches the set threshold value (if
both conditions have been set, the calculation is stopped when at least one of the two conditions occurs).
The integration time limit is common to all integral measurements, while the threshold
limit can be different for each integral measurement.
After reaching the set limit, the value of the integral is displayed in orange color, to highlight
that the calculation was automatically stopped.
To set the integration time limit or the threshold limit:
1. Select the integral measurement you want the integration time limit to be applied.
2. Select the V/T command by pressing F2.
Note: the V/T command is disabled if the measurement is
not selected for the calculation of the integral; in this case
select it for calculation as previously indicated.
3. Select TIME (F2 key) to set the integration time limit, or
VAL (F1 key) to set the threshold limit of the integral.

HD31 - 44 - V1.6
4. Set the first digit using S and T, then select the command "-
->" (F2 key) to move to the next digits (the currently selected digit flashes). To return to a previous digit, select the
command "<--" (F1 key). After setting all the digits, press
OK (F3 key) to confirm the value.
The integration time limit must be set in:
"hours:minutes:seconds".
5. The set value appears at the left of the integration time counter. If both the time and the threshold limits were set, the
two values alternate on the display.
To set time and threshold limits to zero, select the CLR command
(clear) by pressing F3.
Reset and deactivation of the integral calculation:
If the integral calculation is restarted after a stop, the calculation restarts from the value reached at the moment of the stop.
To zero the integral measurement, select the DEL command by
pressing F3.
Then select the CLR command by pressing F3.
To disable the integral calculation, select instead the CANC command by pressing F1.
Integration limits

HD31 - 45 - V1.6
Integration and logging:
The integral values appearing on the display can be stored in the SD card through the LOGGING function (see chapter 7 at page 53) similarly to the current values of quantities. The data
logger allows various behaviors of the ITG (INTEGRAL) function to be set when logging is
started:
• Automatic reinitialization and reactivation, if in stop condition, of the function when
logging is started.
• Automatic activation, if in stop condition, without reinitialization (the function contin-
ues from the reached value) of the function when logging is started.
• The function is neither automatically reinitialized nor enabled automatically, if in stop con-
dition, when logging is started (the row will turn to orange to highlight the stop status).
See paragraph 7.12 at page 66 to set the ITG function behavior when logging is started.
T
he value of the integral is stored into memory (if selected for logging) only if the instrument
is set not to turn off between two subsequent samplings, because calculating the integral each
second requires the instrument to stay always on. If the instrument is set to turn off between
two subsequent acquisitions, only the instant value of the signal supplied by the probe will be
stored.
Integration and REC and REL functions:
REC (RECORD) and REL (relative measurement) functions are not available for integral measurements.

HD31 - 46 - V1.6
4.8 CO
2
PROBES
HD31.B3 and HD31.B3-10 CO2 probes use a double wavelength infrared sensor with NDIR
technology (Non-Dispersive Infrared Technology). The use of a double filter and of a particular
measuring technique ensures accurate and stable measurement for a long time.
A protective membrane, through which the air to be analyzed is diffused, protects against dust
and atmospheric agents.
During the measurement, it is recommended to stay not too close to the sensor, to avoid altering the CO
2
values to be acquired.
See paragraph 13.5 at page 100 for CO
2
probe calibration.
For a better measurement accuracy, it is recommended to use the barometric pressure compensation as described at paragraph 9.3 at page 74.
Fig. 4.8.1: CO
2
probe
Note: when the HD31.B3 probe is inserted, the connector of the instrument immediately next
to the probe cannot be used because of the size of the probe; therefore, only an additional
sensor can be connected.

HD31 - 47 - V1.6
4.9 VP473 AND IP472 MODULES FOR MEASURING DIRECT VOLTAGE AND CURRENT
VP473 SICRAM module measures the direct voltage applied at the input in the range -20 Vdc to
+20 Vdc. The module input impedance is 1 MΩ.
If connected to a voltage output transmitter, it can acquire its signal.
Fig. 4.9.1: VP473 module connected to voltage output transmitter
IP47
2 SICRAM module measures the direct current applied at the input in the range
0…24 mA. The module input impedance is 25 Ω.
Typical application is the acquisition of the output signal of an active or passive current transmitter, as shown in the figures below:
Fig. 4.9.2: IP472 module connected to transmitter with active current output
Fig. 4.9.3: IP472 module connected to transmitter with passive current output
+V
in
-Vin
Voltage output
transmitter
Shield
+Iin
-Iin
Transmitter with
active current output
Shield
(op
tional
)
+Iin
-Iin
Transmitter with
passive current output
Shield
(op
tional
)
Power suppl
y

HD31 - 48 - V1.6
5 RECORD FUNCTION
RECORD function stores the minimum, average and maximum values of the displayed quantities.
The upgrade of the minimum, average and maximum values takes place after each sample acquired using the RECORD function. The sample acquisition can be automatic (once per second) or manual (at the touch of a button).
Attention: data acquired using the RECORD function for the calculation of minimum,
average and maximum values are not saved in the SD card and cannot be transmitted
to a PC. Only the time trend of the minimum, average and maximum values can be recorded in the SD card through the LOGGING function (see chapter 7 at page 53).
I
f quantities are not explicitly selected for the RECORD function, the function activation takes
place for all the quantities displayed (except for INTEGRAL-type measurements). The RECORD
function can be started only for some quantities, by explicitly selecting them.
5.1 SELECTING A QUANTITY FOR THE RECORD FUNCTION
1. Select the quantity you want the RECORD function to be enabled for, using S and T.
2. Press SELECT to display the REC
command in the command bar,
then select the command by pressing F1.
3. Select the SEL command by pressing F3.
4. The indication "0 rcd" appears on the upper part of the meas-
urement line, to indicate that the quantity has been selected for
the RECORD function.
To deselect the quantity for the RECORD function, select again the SEL command (F3 key):
the indication "0 rcd" disappears.
Select in the same way all the quantities you want the RECORD function to be enabled for.
Acquired sample
countdown

HD31 - 49 - V1.6
5.2 SAMPLE ACQUISITION
1. Press SELECT to display the REC
command in the command bar,
then select the command by pressing F1.
2. Select the AUTO command by pressing F1 to start automatic
once-per-second sample acquisition.
Select the MANL command by pressing F2 to manually acquire a sample.
3. The number of acquired samples appears in the upper part of
the measurement line.
AUTO and MANL commands start the acquisition of all the quantities selected for the RECORD
function. If quantities have not been explicitly selected, the acquisition of all the quantities is
started (except for the INTEGRAL-type ones).
Note: in case only some quantities were explicitly selected for the RECORD function, AUTO and
MANL commands are available only if one of the quantities chosen for the function is selected
on the display (indicated by a checkmark).
Select again the AUTO command (F1 key) to stop the automatic acquisition of the samples.
Press ESC to exit the REC menu.
Number of acquisitions

HD31 - 50 - V1.6
5.3 DISPLAYING MINIMUM, AVERAGE AND MAXIMUM VALUES
To display the minimum, average and maximum values acquired with the RECORD function :
1. Select the desired measurement line using S and T.
2. Press SELECT to display the VIEW
command in the command bar, then
select the command by pressing F2.
Note: the VIEW command is disabled if there are no samples acquired with the RECORD function for
the selected quantity.
3. Select the command:
• MIN (F1 key) to display the minimum of the acquired values.
• AVRG (F2 key) to display the average of the acquired values.
• MAX (F3 key) to display the maximum of the acquired values
4. The indication of the performed selection is shown in the upper
part of the measurement line, next to the number of the acquired
samples.
Minimum, average and maximum values can be displayed also when the RECORD function is
active: values are updated after each acquisition.
To disable the display of the statistical value and return to the current value, press again the
button corresponding to the displayed statistics (e.g., select again MAX with the F3 key if the
maximum value is displayed).
Press ESC to exit the VIEW menu.
Note: by displaying the same quantity in several measurement lines, both the quantity current
value and the statistic information can be shown.
5.4 RESETTING AND DISABLING THE RECORD FUNCTION
The acquired values are added to the ones saved in memory.
Delete the already acquired values by selecting the DEL command (F3 key) to start a new calculation session of the minimum, average and maximum values.
Then select the CLR command by pressing the F3 key: the
counter of the acquired samples is zeroed.
To disable the RECORD function, select instead the CANC command by pressing the F1 key.
Press ESC to return to the previous menu level.
Type of statistics

HD31 - 51 - V1.6
5.5 RECORD FUNCTION BEHAVIOR AT LOGGING STARTUP
Minimum, average and maximum values calculated with the RECORD function, which appear
on the display, can be recorded onto the SD card thanks to the LOGGING function (see chapter
7 at page 53) exactly like the current values of the quantities. The data logger allows various
beh
aviors of the RECORD function to be set at logging startup:
• Automatic reinizialization and activation, if in stop condition, of the function when log-
ging is started.
• Automatic activation, if in stop condition, without reinitialization (the function contin-
ues from the reached value) of the function when logging is started.
• The function is neither automatically reinitialized nor automatically enabled, if in stop
condition, when logging is started (the row will turn orange to highlight the stop status).
See paragraph 7.12 at page 66 to set the RECORD function behavior at logging startup.
Th
e minimum, average or maximum values are stored (if selected for logging) only if the instrument is set to not turn off between two subsequent samplings, because calculating the
minimum, average or maximum values each second requires the instrument to stay always on.
If the instrument is set to turn off between two subsequent acquisitions, only the instant value
of the signal supplied by the probe will be stored.
5.6 RECORD FUNCTION AND RELATIVE MEASUREMENT
If the RECORD function is used with relative measurements, pay attention that the meaning of
the RECORD function is different depending on whether the function is enabled before or after
the REL function.
If the REL function is enabled first and secondly the RECORD function, the values acquired by
the RECORD function are the relative values of the quantity, and minimum, average or maximum values viewed on the display refer to the relative measurement. If the REL function is
disabled, the RECORD function is automatically disabled too, because new relative quantity
values are no more available.
If the RECORD function is enabled first (starting therefore to acquire the quantity actual values) and secondly the REL function, the RECORD function is not reinitialized, but continues to
acquire the quantity actual values (and not the relative measurement displayed). The value
appearing on the display is the difference between current value (if the “rdc” indication appears next to the number of acquisitions of the RECORD function) or the value calculated by
the RECORD function (if the MIN, AVG or MAX indication appears next to the number of acquisitions of the RECORD function) and the reference value (actual value of the quantity at the
moment in which the REL function was enabled). If the REL function is successively disabled,
the RECORD function remains active and continues to acquire the quantity actual values.
The activation order of the functions appears on the display: the firstly enabled function is indicated in the upper part at the center of the measurement line, the secondly enabled function
is indicated in the upper part at the right of the measurement line.
Fig. 5.6.1: activation order of RECORD and REL f
unctions
RECORD function
enabled before
REL function
RECORD function
enabled after
REL function

HD31 - 52 - V1.6
6 SETTING DATE AND TIME
The logging function stores the date and the time of the acquisition of each sample. Before using the function, make sure that the correct date and time are set in the instrument. If necessary, adjust the instrument clock as follows:
1. Press SELECT to display the MENU
command in the command bar,
then select the command by pressing the F2 key.
2. Select the SETUP item using S and T, then press the F3 key
(OK command) to confirm.
3. Select the TIME & DATE item using S and T, then press the
F3 key (OK command) to confirm.
4. Select the different the date and time fields with “<<<” (F1
key) or “>>>” (F2 key) commands, the selected field flashes. Use S and T to change the value.
5. Press F3 (OK command) to confirm: a message appears asking to confirm the operation,
select YES (F3 key) to continue, or NO (F1 key) to cancel.
6. Press ESC to exit.

HD31 - 53 - V1.6
7 LOGGING
The LOGGING function allows the measurement detected by the instrument to be saved in the
SD memory card. The data, stored in CSV format, can be subsequently transferred to a PC.
Logging can be automatic (the logging interval can be configured to 1, 5, 10, 15, 30 seconds /
1, 2, 5, 10, 15, 20, 30 minutes / 1 hour) or manual (at the touch of a button). Start and stop
of automatic logging can be manual (at the touch of a button) or programmed (by setting the initial and final instant).
Either all the measurement lines or only those selected by the user can be logged. The logging
function requires a SD memory card to be inserted into the instrument; the function is disabled
if no SD memory card is inserted.
7.1 SETTING THE AUTOMATIC LOGGING INTERVAL OR THE MANUAL LOGGING
1. Press SELECT to display the MENU
command in the command bar,
then select the command by pressing the F2 key.
2. Select the LOG SETTINGS item using S and T, then press
the F3 key (OK command) to confirm.
Note: the item is disabled if the logging is in progress.
3. Select the PERIOD item using S and T, then press the F3
key (OK command) to confirm.

HD31 - 54 - V1.6
4. Using S and T, select the interval for the automatic logging
or the "MANUAL” item to set the manual logging.
Note: the current setting appears in white, while the other
available settings are shown in yellow to highlight that they
are not the current setting.
By selecting an interval exceeding or equal to 60 seconds
(120 seconds if the CO
2
probe is connected), the indication
"SLEEP AVAILABLE" appears under the interval value, to remind that the Auto-off of the instrument can be enabled between two logging instants (see paragraph 7.5).
5. Select OK (F3 key) to confirm, or ESC to exit without changing the value.
6. The instrument returns to the PERIOD menu item, press ESC twice to exit the menu and re-
turn to the measurement mode.
7.2 SELECTING THE MEASUREMENT LINES FOR LOGGING
If measurement lines are not explicitly selected for logging, the logging activation generates
the storage of all the measurement listed on the display (all the measurement lines which can
be scrolled with the S and T keys, and not only the three measurements displayed at that
moment). Logging can be performed only for some measurement lines, by explicitly selecting
them.
Attention: you can log a maximum 16 measurement lines; if more than 16 lines can
be displayed, only the logging of the first 16 lines of the list will be performed.
To select a measurement line for the logging:
1. In measurement mode, select the desired measurement line using S and T.
2. Press SELECT to display the LOG
command in the command bar,
then select the command by pressing the F1 key.
3. Select the SEL command by pressing the F2 key.
Note: the SEL command is disabled if logging is in progress.
5. The L symbol is displayed in the upper part of the measurement
line, to indicate that the line is selected for logging.
To deselect the measurement line for logging, select again the SEL command (F2 key): the L
symbol disappears.
Select in the same way all the measurement lines you want the logging to be performed.
Press ESC to exit the LOG menu.
Symbol "L"

HD31 - 55 - V1.6
7.3 MANUALLY START/STOP AUTOMATIC LOGGING
1. Press SELECT to display the LOG
command in the command bar,
then select the command by pressing the F1 key.
2. To start logging, select the RUN command by pressing the
F1 key.
Note: the RUN command is replaced by the STOP command if
logging is in progress.
Note: the RUN command will not go into effect if the instrument is waiting for a programmed startup.
3. The logging of the measurement lines selected for logging, or
the logging of all the measurement lines if no line was explicitly selected for logging, is started. The LOG indication, the
set logging interval and the logging duration appear in the
display status bar.
4. To stop logging, select again the LOG command (F1 key),
then select the STOP command (F1 key).
5. After the stop command, the logging stop message appears: wait for the completion of the
operation.
7.4 PROGRAMMING AUTOMATIC LOGGING START/STOP TIME
1. Press SELECT to display the LOG
command in the command bar,
then select the command by pressing the F1 key.
2. Select the PROG command by pressing the F3 key to program the logging start/stop time.

HD31 - 56 - V1.6
3. Using S and T, select START to set the start time, or STOP
command to set the stop time. If a programmed time has not
been entered, the fields appear empty, otherwise the entered
time is shown. Select OK by pressing the F3 key to continue.
4. Select the different date/time fields using “<<<” (F1 key) or
“>>>” (F2 key) commands, the selected field flashes. Use S
and T to change the value.
5. Press F3 (OK command) to confirm.
6. Press ESC to return to measuring mode. The programmed
logging symbol appears in the display status bar.
At the set start date/time, the logging of the measurement lines
explicitly selected for logging, or the logging of all the measurement lines if no line was explicitly selected for logging is
started. The LOG indication, the set logging interval and the
logging duration are shown in the display status bar.
Logging will automatically stop at the set stop date/time. If you want logging to be stopped in
advance, date/time programming must be deleted and stop logging manually as explained below:
1. Press SELECT to display the LOG command in the command bar, then select the command
by pressing the F1 key.
2. Select the PROG command by pressing the F2 key.
3. Select the CLR command by pressing the F1 key. A message
is displayed asking to confirm the operation, select YES (F3
key) to continue: logging programming is deleted.
4. Press ESC to return to the previous command level.
Programmed logging

HD31 - 57 - V1.6
5. Select the STOP command by pressing the F1 key.
Note: if you try to stop logging manually without first deleting
the programming function, the instrument displays an error
message ("Log: Event conflict").
Only the logging start time can be set, in this case it will have to be stopped manually, or only
the logging stop time, in this case it will have to be started manually.
After programming the logging function, the instrument can be switched off: it will be switched
on automatically at the date/time set for the logging startup.
7.5 AUTO-OFF DURING AUTOMATIC LOGGING
If the logging interval is lower than 60 seconds (120 seconds if the CO2 probe is connected),
the instrument will remain switched on during logging. If the logging interval exceeds or is
equal to 60 seconds (120 seconds if the CO
2
probe is connected), the instrument can be set to
switch off between to subsequent loggings, to save battery life. If Auto-off is enabled, the instrument will automatically switch on at sampling and switch off immediately after. To enable
and disable Auto-off:
1. Press SELECT to display the MENU
command in the command bar, then
select the command by pressing the
F2 key.
2. Select the LOG SETTINGS item using S andT, then press
the F3 key (OK command) to confirm.
Note: the item is disabled if logging is in progress.
3. Select the SLEEP item using S and T, then press the F3 key
(OK command) to confirm.

HD31 - 58 - V1.6
4. Using S and T, select "ENABLED" to enable the Auto-off or
"DISABLED" to disable it.
Note: the current setting is shown in white, while the other
available setting appears in yellow color to highlight that it is
not the current setting.
5. Select OK (F3 key) to confirm, or ESC to exit without changing the value.
6. The instrument returns to the SLEEP menu item, press ESC twice to exit the menu and re-
turn to the measuring mode .
7.6 MANUAL LOGGING
To perform manual logging, it is first necessary to set "MANUAL" as logging interval (see paragraph 7.1). To perform manual logging:
1. P
ress SELECT to display the LOG
command in the command bar,
then select the command by pressing the F1 key.
2. Start a logging session by selecting the RUN command (F1
key).
Note: the RUN command does not acquire a sample, but is
used to indicate that the samples acquired manually after the
command, up to the STOP command, form a logging session.
Note: the RUN command is replaced by the STOP command if
logging is in progress.
Note: the RUN command will not go into effect if the instrument is waiting for a programmed startup of a logging session.
3. The LOG indication, the MANL indication and the logging session duration appear in the display status bar.
To manually acquire a sample (consisting of the measurement
lines explicitly selected for logging or all the measurement
lines, if no line was explicitly selected for logging), select the
MANL command (F3 key).
4. To end the logging session, select the STOP command (F1
key).
After the stop command, the logging stop message appears:
wait for the completion of the operation.

HD31 - 59 - V1.6
7.7 PDF REPORT
At the end of each logging session, the instrument can also automatically create into the SD
memory card a PDF report containing the acquired data in table format and, optionally, a
graph. To set the PDF report creation mode:
1. Press SELECT to display the
MENU command in the command
bar, then select the command by
pressing the F2 key.
2. Select the LOG SETTINGS item using S and T, then press
the F3 key (OK command) to confirm.
Note: the item is disabled if logging is in progress.
3. Select the PDF FILE SIZE item using S and T, then press
the F3 key (OK command) to confirm.
4. Using S and T, select:
• DISABLED, to disable the automatic creation of the PDF
report at the end of the logging session.
• FULL, to enable the automatic creation of the PDF report,
with data in graphic and table form, at the end of the
logging session.
• NO GRAPH, to enable the automatic creation of the PDF
report, with data in table form only, at the end of the
logging session.
Note: the current setting appears in white color, while the
other available settings are in yellow color to highlight that
they are not the current setting.
5. Select OK (F3 key) to confirm, or ESC to exit without changing the value.
6. The instrument returns to the PDF FILE SIZE menu item, press ESC twice to exit the menu
and return to the measurement mode.

HD31 - 60 - V1.6
Encryption Key for PDF report:
The instrument allows setting an encryption key to generate an alphanumeric control string
inserted at the end of the report file and calculated according to the data in the report and the
encryption key set. The control string is used to detect any report data tampering. The verification of the report integrity is done with the help of DeltaLog9 application software.
To enter the encryption key for the report:
1. Press SELECT to display the
MENU command in the command
bar, then select it by pressing the
F2 key.
2. Select the LOCKED CONFIG item using S and T, then press
the F3 key (OK command) to confirm.
3. Select the REPORT PSWD item using S and T, then press
the F3 key (OK command) to confirm.
Note: the REPORT PSWD item is not shown if the instrument
is in protected mode (LOCKED). See paragraph 8.2 to change
t
he protection status.
4. Set the first digit using the password with S and T, then select the "-->" command (F2 key) to move to the next digits
(the currently selected digit flashes). To return to a previous
digit, select the "<--" command (F1 key). After setting all the
digits, press OK (F3 key) to confirm the new password.
5. The instrument returns to the REPORT PSWD item, press ESC twice to exit the menu.

HD31 - 61 - V1.6
7.8 DISPLAYING LOGGING SESSIONS IN THE SD MEMORY CARD
To display the logging sessions included in the SD memory card:
1. Press SELECT to display the
MENU command in the command
bar, then select the command by
pressing the F2 key.
2. Select the LOG SETTINGS item using S and T, then press
the F3 key (OK command) to confirm.
Note: the item is disabled if logging is in progress.
3. Select the FILE MANAGER item using S and T, then press
the F3 key (OK command) to confirm.
4. If the automatic RECORD function or the ITG (INTEGRAL) function are enabled, a message
appears reminding that displaying the information in the SD memory card requires the
measuring process to stop. Select YES (F3 key) to continue (or Press F1 to select NO and
exit).
5. Wait a few seconds for the instrument to read the content of
the SD memory card, then select the SELECT LOG item using S and T. Press F3 (OK command) to confirm.

HD31 - 62 - V1.6
6. The list of the stored logging sessions is displayed, starting
from the most recent one. Scroll the sessions using S and T.
The sequential number of the session is shown next to the
session date. The size of the CSV and PDF files is indicated
for each session (a dash appears in place of the size if the
PDF file is not displayed because the PDF report automatic
creation option was disabled).
7. To access the data recorded in the selected logging session,
select the VIEW command by pressing the F3 key. The stored
data appear on the display. The green line under the measurement area shows the date and the time of the displayed
sample. The orange line over the measurement area shows:
o the logging interval and the logging duration up to the
displayed sample, in the case of automatic logging;
o the MANL indication and the sequential number of the dis-
played sample, in the case of manual logging.
8. Select the <<< (F1 key) or >>> commands (F3 key) to scroll the stored data backward and
forward in time respectively. To display the graphic trend of the values of one of the stored
quantities, select the measurement line using S and T, then select the PLOT command by
pressing the F2 key (see next paragraph for the details regarding the graph).
9. Repeatedly press ESC to exit the stored data display mode.

HD31 - 63 - V1.6
7.9 STORED DATA GRAPH
The functions already described at paragraph 3.8 concerning the graph of the real time measurements are made available by displaying, through the PLOT command, the stored data
graph. The only difference concerns the management of the x-axis zoom: x-axis zoom cannot
be performed using real time data (only the x-axis scale can be changed, causing the graph to
be reinitialized, since data are not stored); on the contrary, with the stored data a time interval can be selected using the two vertical cursors and the graph area comprised between the
two cursors can be enlarged by pressing SELECT.
Fig. 7.9.1: stored data horizontal zoom
If
the data were stored with an automatic logging, the number displayed on the right under
the graph indicates the time corresponding to a pixel on the display (e.g. 27s/p indicates 27
seconds per pixel). The number depends on the logging interval and on the zoom applied. The
number is not indicated if the data were stored with a manual logging (in this case, also the
value of ΔX is not indicated).
Select the FULL command (F2 key) to cancel the zoom and return to the full x-axis.
Fig. 7.9.2: FULL command
Not
e: by displaying the stored data, the FULL command replaces the ΔX command (x-axis
choice) available when real time data are displayed.

HD31 - 64 - V1.6
7.10 DELETING LOGGING SESSIONS IN THE SD MEMORY CARD
The single logging sessions, all the sessions recorded on a determined date or all the sessions
stored in the SD memory card can be cancelled.
Attention: the deleted files cannot be recovered!
In order to cancel the single logging sessions or all the sessions recorded on a determined
date, access the sessions following the procedure at paragraph 7.8 (Displaying logging sessi
ons in the SD"), then select the CANC command by pressing the F1 key.
Fig. 7.10.1: deleting stored logging sessions
Se
lect the FILE command by pressing the F1 key to delete the selected session. Select the
DATE command by pressing the F2 key to delete all the sessions recorded on the same date
of the selected session.
Fig. 7.10.2: deleting single sessions or date-recorded sessions
To
erase all the sessions stored in the SD memory card, enter MENU >> LOG SETTINGS >>
FILE MANAGER, select the ERASE ALL item using S and T, then press the F3 key (OK com-
mand) to confirm.
Fig. 7.10.3: deleting all the stored logging sessions

HD31 - 65 - V1.6
Before each erasing operation a message appears asking for confirmation of data cancellation,
select YES (F3 key) to confirm or select NO (F1 key) to exit without erasing data.
7.11 DISPLAYING THE AMOUNT OF FREE MEMORY AVAILABLE IN THE SD MEMORY CARD
Before starting new logging sessions make sure that there is enough free memory available in
your SD memory card. To display the amount of free memory available in your SD memory
card, enter MENU >> LOG SETTINGS >> FILE MANAGER, select the SD CARD MEMORY item
using S and T, then press the F3 key (OK command) to confirm.
Fig. 7.11.1: selecting the SD CARD MEMORY menu item
Th
e display shows: the SD card memory total capacity, the amount of free memory (AVAILABLE), the number of folders divided by logging start date and time, the number of CSV and
PDF files stored in the card.
Fig. 7.11.2: displaying the amount of free memory
P
ress ESC to exit the screen.

HD31 - 66 - V1.6
7.12 LOGGING AND RECORD AND INTEGRAL FUNCTIONS
The minimum, average and maximum values calculated with the RECORD function and the integral calculated with the ITG (INTEGRAL) function displayed can be stored into the SD memory card exactly like the current values of the quantities. The data logger allows setting various
behaviors of the RECORD and ITG functions at logging startup.
1. Press SELECT to display the
MENU command in the command
bar, then select the command by
pressing the F2 key.
2. Select the LOG SETTINGS item using S and T, then press
the F3 key (OK command) to confirm.
3. Select the RCD/ITG ENGAGE item using S and T, then press
the F3 key (OK command) to confirm.
4. Using S and T, select one of the three available options:
• CLEARED: the RECORD and INTEGRAL functions to be
stored are automatically reinitialized and reactivated, if in
stop mode, at logging startup.
• ENABLED: the RECORD and INTEGRAL functions to be
stored are automatically activated, if in stop mode, but
not reinitialized (the function continues from the reached
value) at logging startup.
• DISABLED: the RECORD and INTEGRAL functions to be
stored are neither automatically reinitialized nor reactivated, if in stop mode, at logging startup.
5. Select OK (F3 key) to confirm, or ESC to exit without changing the value.
6. The instrument returns to the RCD/ITG ENGAGE menu item, press ESC twice to exit the
menu and return to the measurement mode.

HD31 - 67 - V1.6
8 PROTECTED MODE
The calibration of the connected probes can be protected against unwanted alterations by entering a security password. The password (8 digits) is factory-set to the value 11111111
(eight times 1) and can be changed.
Attention: if the password is changed, be sure to keep it in a safe place. In case of loss
of the password, you should contact an authorized Technical Assistance Service.
Note: the password setup is not available if the instrument is in logging; in that case, stop the
logging in progress to proceed with configuration.
8.1 PASSWORD CHANGE FOR THE PROTECTED MODE
For security reasons, the preset default password should be changed. To change the password,
proceed as follows:
1. Press SELECT to display the MENU
command in the command bar,
then select the command by pressing the F2 key.
2. Select the LOCKED CONFIG item by using S and T, then
press the F3 key (OK command) to confirm.
3. Select the PSWD CHANGE item by using S and T, then
press the F3 key (OK command) to confirm.
Note: PSWD CHANGE item is not displayed if the instrument
is in secure mode. See paragraph 8.2 to change the protectio
n status.

HD31 - 68 - V1.6
4. Set the first digit of the password by using S and T, then se-
lect the "-->" command (F2 key) to move to the next digits
(the digit currently selected flashes). To return to the previous digit, select the "<--" command (F1 key). After setting
all the digits, press OK (F3 key) to confirm the new pass-
word.
5. The instrument returns to the PSWD CHANGE item, press ESC twice to exit the menu.
8.2 ENABLING/DISABLING THE PROTECTED MO DE
In order to check the calibration protection status, simply enter MENU and check for the presence of the CALIBRATION item: if the function is locked, the item doesn’t appear. You need to
enter the password to change the protection status; proceed as follows:
1. Press SELECT to display the MENU
command in the command bar,
then select the command by pressing il F2 key.
2. Select the LOCKED CONFIG item using S and T, then press
the F3 key (OK command) to confirm.
3. The current protection status (Access Functions) appears at
the end of the menu item list. The word LOCKED indicates
the protected status; the word UNLOCKED indicates the unprotected status. To change the status, select the ACCESS
PSWD item, using S and T if necessary, then press the F3
key (OK command) to confirm.
Protection status

HD31 - 69 - V1.6
4. Set the first digit of the password using S and T, then select
the "-->" command (F2 key) to move to the next digits (the
currently selected digit flashes). To return to the previous digit, select the "<--" command (F1 key). After setting all the
digits, press OK (F3 key) to confirm the new password.
5. The instrument returns to the ACCESS PSWD item. The indication of the protected status
appearing at the end of the menu item list is updated to the new status. Press ESC twice to
exit the menu.

HD31 - 70 - V1.6
9 MEASUREMENT SETTINGS
The following paragraphs show the procedures for setting the following parameters:
• Type of calibration to be used for the probes connected (paragraph 9.1)
• Temp
erature compensation (paragraph 9.2)
• Ba
rometric pressure compensation (paragraph 9.3)
• Du
ct section for flow rate measurements (paragraph 9.4)
• C
oefficient of the Pitot or Darcy tube (paragraph 9.5)
• A
verage air speed measurements (paragraph 9.6)
Not
e: the parameter configuration is not available if the instrument is in logging; in this case,
stop the logging in progress to proceed with the configuration.
9.1 TYPE OF CALIBRATION TO BE USED FOR PROBES
Setting the type of calibration allows choosing whether to use the factory calibration or the user calibration for the various probes connected to the instrument. The return to the factory calibration after a user calibration may be useful, for instance, in the case the user has performed inadvertently an incorrect calibration.
To select the type of calibration:
1. Press SELECT to display the MENU
command in the command bar,
then select the command by pressing il F2 key.
2. Select the LOCKED CONFIG item using S and T, then press
the F3 key (OK command) to confirm.
3. Select the PROBE CAL. TYPE item using S and T, then
press the F3 key (OK command) to confirm.

HD31 - 71 - V1.6
4. Select the probe connected to A, B or C input
using the PROBE command (F1 key).
5. Use S keys T to change the setting of the type of calibration for the selected probe. The
available settings are:
• FACTORY: factory calibration is used, even if an user calibration is available.
• USER: user calibration is used, if available, even if it has been performed with an in-
strument different from the one the probe is connected to. If the user calibration is not
available, factory calibration is used.
• AUTO: user calibration is used, if available, only if it has been performed with the in-
strument the probe is connected to.
Note: if a user calibration is not available for the selected probe, the default setting is AUTO
and cannot be changed.
Note: the type of calibration cannot be changed if the instrument is in secure mode. See paragraph 8.2 to change the protection status.
Not
e: the current setting appears in white, while the other available settings are shown in
yellow to highlight that they are not the current setting.
6. Press F3 (OK command) to confirm the setting for the selected probe. A message appears
asking to confirm the change of calibration type: select YES (F3 key) to continue (or press F1
to select NO and exit).
7. Repeatedly press ESC to exit the menu.
Serial number of
selected probe
Selected
input

HD31 - 72 - V1.6
9.2 TEMPERATURE COMPENSATION
Some types of measurements, for example the air speed measurement with Pitot tube, require
compensation of the temperature of the medium in which the probe is inserted. The instrument allows choosing whether to compensate the temperature measured by the probe connected to input A, B or C, or whether to use the temperature set manually.
1. Press SELECT to display the MENU
command in the command bar,
then select the command by pressing il F2 key.
2. Select the SETUP item using S and T, then press the F3 key
(OK command) to confirm.
3. Select the OPTIONS item, using if necessaryS and T, then
press the F3 key (OK command) to confirm.
4. Select the COMPENS. TEMP. item, using if necessary S and
T, then press the F3 key (OK command) to confirm.

HD31 - 73 - V1.6
5. For the automatic temperature compensation, select, using S
and T, the probe providing the temperature measurement
(PROBE A, PROBE B or PROBE C), then press the F3 key (OK
command) to confirm.
Note: the current setting appears in white color, while the
other available settings are yellow to highlight that they are
not the current setting.
For manual temperature compensation, select, using S and
T, the MANUAL ENTRY item, then press the F3 key (OK
command) to confirm.
6. For manual compensation, confirming the MANUAL ENTRY op-
tion displays the current setting of the temperature value.
Select the UNIT command by pressing the F1 key to change
the measurement unit (°C, °F or K).
7. To set the temperature value, select the EDIT command by pressing the F3 key.
8. Set the first digit using S and T, then select the "-->" com-
mand (F2 key) to move to the next digits (the currently selected digit flashes). To return to a previous digit, select the
"<--" command (F1 key). After setting all the digits, press
OK (F3 key) to confirm the value.
The value must be set to two decimal digits after the comma
and must be in the range between -30 °C and +120 °C (or
the values equivalent in other units of measurement).
Note: the value set in °F is converted internally in °C, therefore it is possible to verify a deviation of ± 0.1 °F between
the value set by the user and the actual stored value, due to
the rounding of the conversion result.
9. Repeatedly press the ESC button to exit the menu.

HD31 - 74 - V1.6
9.3 BAROMETRIC PRESSURE COMPENSATION
Some types of measurements, for example air speed measurement with Pitot tube and CO
2
measurement, require the barometric pressure compensation. The instrument allows selecting
whether to use for compensation the barometric pressure measured by the probe connected to
input A, B or C, or whether to use the pressure set manually.
1. Press SELECT to display the MENU
command in the command bar,
then select the command by pressing the F2 key.
2. Select the SETUP item using S and T, then press the F3 key
(OK command) to confirm.
3. Select the OPTIONS item, using if necessary S and T, then
press the F3 key (OK command) to confirm.
4. Select the PRESSURE COMP. item using S and T, then
press the F3 key (OK command) to confirm.

HD31 - 75 - V1.6
5. For the automatic barometric pressure compensation, select,
using S and T, the probe providing the pressure measurement (PROBE A, PROBE B or PROBE C), then press the F3
key (OK command) to confirm.
Note: the current setting appears in white color, while the
other available settings are yellow to highlight that they are
not the current setting.
For the manual barometric pressure compensation, select,
using S and T, the MANUAL ENTRY item, then press the
F3 key (OK command) to confirm.
6. For manual compensation, after confirming the MANUAL ENTRY
option, the barometric pressure value current setting is displayed. Select the EDIT command by pressing the F3 key to
change the pressure value.
7. Set the first digit using S and T, then select the "-->" com-
mand (F2 key) to move to the next digits (the currently selected digit flashes). To return to a previous digit, select the
"<--" command (F1 key). After setting all the digits, press
OK (F3 key) to confirm the value.
The set value must be in the range between 80000 Pa
(800 mbar) and 110000 Pa (1100 mbar).
8. Repeatedly press ESC to exit the menu.

HD31 - 76 - V1.6
9.4 SELECTING THE DUCT FOR FLOW RATE MEASUREMENTS
The flow rate measurement performed with the air speed probes requires to know the section
of the duct or of the inlet perpendicular to the flow.
Fig. 9.4.1: air duct section
The
instrument allows the section to be set for flow rate calculation:
1. Press SELECT to display the MENU
command in the command bar,
then select the command by pressing the F2 key.
2. Select the SETUP item using S and T, then press the F3 key
(OK command) to confirm.
3. Select the OPTIONS item, using if necessary S and T, then
press the F3 key (OK command) to confirm.

HD31 - 77 - V1.6
4. Select the AIR FLOW AREA item using S and T, then press
the F3 key (OK command) to confirm.
5. The section current setting appears. Select the UNIT com-
mand by pressing the F1 key to change the measurement
unit (cm
2
or in2).
6. To set the section value, select the EDIT command by pressing the F3 key.
7. Set the first digit using S and T, then select the "-->" com-
mand (F2 key) to move to the next digits (the currently selected digit flashes). To return to a previous digit, select the
"<--" command (F1 key). After setting all the digits, press
OK (F3 key) to confirm the value.
If cm
2
is used as measurement unit, the set value must be
integer and range from 10 to 100000 cm
2
. If in2 is used as
measurement unit, the set value must have a decimal digit
after the comma and range from 1.5 to 15500.0 in
2
.
Note: the value set to in
2
is internally converted into cm2,
therefore a deviation of ± 0.1 in
2
between the value set by
the user and the value actually stored may occur, due to the
rounding up of the conversion result.
8. Repeatedly press ESC to exit the menu.

HD31 - 78 - V1.6
9.5 PITOT OR DARCY TUBE COE FFICIENT
In air speed measurements with Pitot or Darcy tube, the instrument allows setting the coefficient of the tube used.
1. Press SELECT to display the MENU
command in the command bar,
then select the command by pressing the F2 key.
2. Select the SETUP item using S and T, then press the F3 key
(OK command) to confirm.
3. Select the OPTIONS item, using if necessary S and T, then
press the F3 key (OK command) to confirm.
4. Select the PITOT TUBE K item using S and T, then press
the F3 key (OK command) to confirm.

HD31 - 79 - V1.6
5. The coefficient current setting is displayed. Select the EDIT
command by pressing the F3 key to change the coefficient
value.
6. Set the first digit using S and T, then select the "-->" com-
mand (F2 key) to move to the next digits (the currently selected digit flashes). To return to a previous digit, select the
"<--" command (F1 key). After setting all the digits, press
OK (F3 key) to confirm the value.
The coefficient value must be set in % and must range from
60% (= coefficient 0.60) to 120% (= coefficient 1.20). If the
tube coefficient is not known, enter 100% (= coefficient 1.00)
for Pitot tubes and 84% (= coefficient 0.84) for Darcy tubes.
7. Repeatedly press ESC to exit the menu.

HD31 - 80 - V1.6
9.6 AIR SPEED MEASUREMENT AVERAGE
In air speed measurements the detected value can appear to be quite unstable due to air turbulences. In order to limit measurement instability, the use of the average of the last n instant
measurements (moving average) instead of the instant measurement is preferable.
For instance, the graph below represents the time trend of the air speed instant measurements
acquired by the instrument (curve 1) and the moving average displayed by the instrument in
the case of n=3 (curve 2).
seconds
Speed (m/s)
Fig. 9.5.1: average effect in air speed measurements
T
o set the number of instant measurement to be considered in the moving average calcula-
tion:
1. Press SELECT to display the MENU
command in the command bar,
then select the command by pressing the F2 key.
2. Select the SETUP item using S and T, then press the F3 key
(OK command) to confirm.

HD31 - 81 - V1.6
3. Select the OPTIONS item, using if necessary S and T, then
press the F3 key (OK command) to confirm.
4. Select the FLOW AVG. TIME item using S and T, then
press the F3 key (OK command) to confirm.
5. The current setting is displayed. Select the EDIT command
by pressing the F3 key to change the value.
6. Set the first digit using S and T, then select the "-->" com-
mand (F2 key) to move to the next digits (the currently selected digit flashes). To return to a previous digit, select the
"<--" command (F1 key). After setting all the digits, press
OK (F3 key) to confirm the value.
The set value must be between 1 and 100.
7. Repeatedly press ESC to exit the menu.

HD31 - 82 - V1.6
10 PRINTING MEASUREMENTS
The instrument has one RS232C serial output which allows sending to a serial printer or to a
PC, by simply pressing a button, the measurement values of the three quantities displayed
when pressing the button.
Connect the RS232C serial output of the instrument to a printer or a PC through the CP31RS
cable. The communication parameters are:
• Data bits = 8
• Parity = None
• Stop bits = 1
• Flow control = Xon / Xoff
The Baud Rate of the instrument can be configured from 1200 to 115200.
10.1 SETTING THE BAUD RATE OF THE INSTRUMENT
For correct printing, the same Baud Rate must be configured in the instrument and in the serial
printer or in the PC. To set the Baud Rate in the instrument:
1. Press SELECT to display the MENU
command in the command bar,
then select the command by pressing the F2 key.
2. Select the SETUP item using S and T, then press the F3
key (OK command) to confirm.
3. Select the SERIAL RATE item using S and T, then press
the F3 key (OK command) to confirm.

HD31 - 83 - V1.6
4. Select the Baud Rate using S and T, then press the F3 key
(OK command) to confirm.
Note: the current setting appears in white color, while the
other available settings are yellow to highlight that they are
not the current setting.
5. The instrument returns to the SERIAL RATE item, Press ESC twice to exit the menu.
10.2 SENDING MEASUREMENTS FOR PRINTING
1. Press SELECT to display the PRINT
command in the command bar.
2. Select the PRINT command by pressing the F1 key, the information regarding the connected probes (type of probe, serial number and type of calibration) and the three measurements currently displayed are sent to the printer or to the PC.
10.3 RECEIVING MEASUREMENTS INTO PC
You need to activate a serial communication program in your PC, such as Hyperterminal, if you
want to receive the measurements sent by the instrument with the PRINT function into your PC.
The RS232C serial output of the instrument must be connected to a RS232C serial port of your PC
or, if your PC doesn’t have serial ports, to a USB port through a RS232C/USB converter (e.g.
C205M adapter cable). If a RS232C/USB converter is used, install into your PC the related USB
drivers.
The number of the COM port the instrument is connected to must be set in the communication
program and the communication parameters indicated at the beginning of the chapter must be
configured (8N1, Xon/Xoff, Baud Rate equal to the one set in the instrument).
If the serial communication program has the autosave function of the received characters (e.g.
the "Transfer >> Capture Text " command in Hyperterminal), the function for saving the received measurements into a file of your PC can be enabled.

HD31 - 84 - V1.6
11 INFORMATION ON INSTRUMENT AND PROBES
The instrument hardware and firmware revision can be displayed, along with the serial number
and the calibration date of the instrument and of the connected probes.
To access information, enter "MENU >> INFO", then select the "DEVICE HW/FW" item for in-
formation concerning the instrument, or the "PROBES SN/CAL" item for information concerning
the connected probes.
The information concerning the instrument is divided into two screens: the first screen shows
model, serial number, hardware and firmware revision; the second screen shows the dates of
the hardware ohmmetric and voltmetric calibration. Press F1 key to toggle from one screen to
the other (the indication corresponding to the key changes from CALIB to HW/FW according
to the displayed screen).
Fig. 11.1: information concerning the instrument
Th
e information concerning the connected probes is divided into three screens, corresponding to
A, B and C inputs. Select the PROBE command by pressing the F1 key to toggle from one
screen to the other.
Fig. 11.2: information concerning the connected probes

HD31 - 85 - V1.6
12 USE OF THE BATTERY
The instrument is provided with one 3.7 V–2250 mA/h lithium-ion rechargeable battery,
placed in the battery compartment.
The battery symbol on the display continuously provides information about the battery charge
status. As the battery runs out, the symbol "empties".
Battery level
67...100%
Battery level
34...66%
Battery level
4...33%
Battery level
< 4%
Fig. 12.1: battery charge levels
If the battery charge is insufficient to ensure a correct measurement, the instrument turns off.
The data stored in the SD memory card are retained even with a discharged battery.
Battery starts recharging when the instrument’s USB port is connected to a PC USB port (at
least 500 mA) or to the external stabilized power supply unit SWD05. The battery symbol
flashes when the battery is recharging.
The battery charge is complete when the symbol stops flashing. A complete recharging operation requires about 7 hours starting from a completely discharged battery.
If you plan to have the instrument powered uniquely by battery, make sure that the charge
level is sufficient to complete measurements.
The battery autonomy depends on the number and the type of the connected probes. For instance, with three Pt100 probes connected the autonomy is about 18 hours of continuous operation, starting from a completely charged battery.
12.1 AUTOMATIC SWITCH-OFF FUNCTION
In order to save the battery charge, the auto-switchoff function can be enabled. It allows the instrument to automatically switchoff after a certain number of minutes since the last key pressure.
The auto-off time can be configured to 2, 5, 10, 15, 20 or 30 minutes.
To set the auto-off:
1. Press SELECT to display the MENU
command in the command bar,
then select the command by pressing the F2 key.
2. Select the SETUP item using S and T, then press the F3 key
(OK command) to confirm.

HD31 - 86 - V1.6
3. Select the AUTO SWITCHOFF item using S and T, then
press the F3 key (OK command) to confirm.
4. Set the number of minutes using S and T, then press the F3
key (OK command) to confirm.
Note: the current setting appears in white, while the other
settings appear in yellow to highlight that they are not the
current setting.
Note: during the setting, the battery symbol in the status bar
of the display is replaced by the battery charge percent level.
If you want the auto-switchoff function to be disabled, select
the DISABLED option.
5. The instrument returns to the AUTO SWITCHOFF menu item, press ESC twice to exit the
menu and return to the measurement mode.
The auto-switchoff is automatically disabled if the external power supply or the PC is connected.
See paragraph 7.5 at page 57 to enable or disable the auto-switchoff during logging.
If the auto-switchoff is enabled but functions requiring the instrument to remain switched on
are
active (e.g. the RECORD function, the INTEGRAL function, the LOGGING function with interval lower
than 60 s, etc.), the instrument doesn’t switch off automatically but the display brightness is reduced.
The auto-switchoff is automatically disabled when the calibration menu is entered.
12.2 DISPLAY BRIGHTNESS
To save more battery life, besides the auto-switchoff function, the instrument can additionally
automatically reduce the display brightness a few instants after the last key pressure.
To set the brightness level:

HD31 - 87 - V1.6
1. Press SELECT to display the MENU
command in the command bar,
then select the command by pressing the F2 key.
2. Select the SETUP item using S and T, then press the F3 key
(OK command) to confirm.
3. Select the BRIGHTNESS item using S and T, then press the
F3 key (OK command) to confirm.
4. Set the brightness level using S and T, then press the F3
key (OK command) to confirm. The available settings are:
• AUTO: the brightness level is always set to maximum until
the battery charge exceeds 4%. If the battery charge is
lower than 4%, the brightness level is automatically reduced.
• 30%: the brightness level is reduced to 30% a few in-
stants after the last key pressure. Brightness rises automatically to the maximum level when a key is
pressed, then decreases again if no keys are pressed.
Note: the current setting appears in white color, while the
other available setting appears in yellow to highlight that it is
not the current setting.
5. Repeatedly press ESC to exit the menu.

HD31 - 88 - V1.6
12.3 PROLONGING BATTERY LIFE
The battery can be charged and discharged hundreds of times, but its capacity diminishes with
use. The battery life can be prolonged with a few practical measures:
• When first using the device, make a complete charge of the battery.
• From time to time, make a complete cycle of discharging and recharging.
• Do not leave the battery discharged for a long period.
• Do not discharge the battery below the minimum threshold: recharge the battery when
the battery symbol on the display reaches the minimum level.
• Do not expose the battery to extreme temperatures.
12.4 REPLACING THE BATTERY
When the battery capacity is heavily reduced, it is necessary to replace it. To replace the battery proceed as follows:
1. Disconnect the external power supply unit or the PC, if connected.
2. Remove the protective rubber shell, if any.
3. Untighten the 4 screws securing the battery compartment cover on the back of the instrument.
4. Remove the battery.
5. Remove the connector paying attention not to tear the wires away.
6. Attach the connector to the new battery: the connector has a reference which prevents an
erroneous insertion.
7. Place the battery in its housing.
8. Close the battery compartment with the 4 fixing screws.
Fig. 12.2: battery compartment
F
or replacement, use a 3.7 V rechargeable lithium-ion battery, capacity 2250 mA/h, dimen-
sions 22 x 18.5 x 67.5 mm, with 3-pole JST connector (code HD35-BAT1).
Battery
compartment
cover
Battery

HD31 - 89 - V1.6
12.5 IMPORTANT WARN INGS
Do not short-circuit the battery: it may explode with serious damage to persons.
Additionally, to avoid any risk of explosion:
• Do not expose the battery to high temperature.
• Do not use charging devices different from those indicated.
• Do not overcharge the battery allowing it to charge for a long time after reaching the full
charge status.
Battery Disposal:
• Dispose of dead batteries in the dedicated bins or deliver them to authorized collection
centers. Follow the relevant regulation.
• Do not dispose as household waste.
• Do not throw batteries into fire.
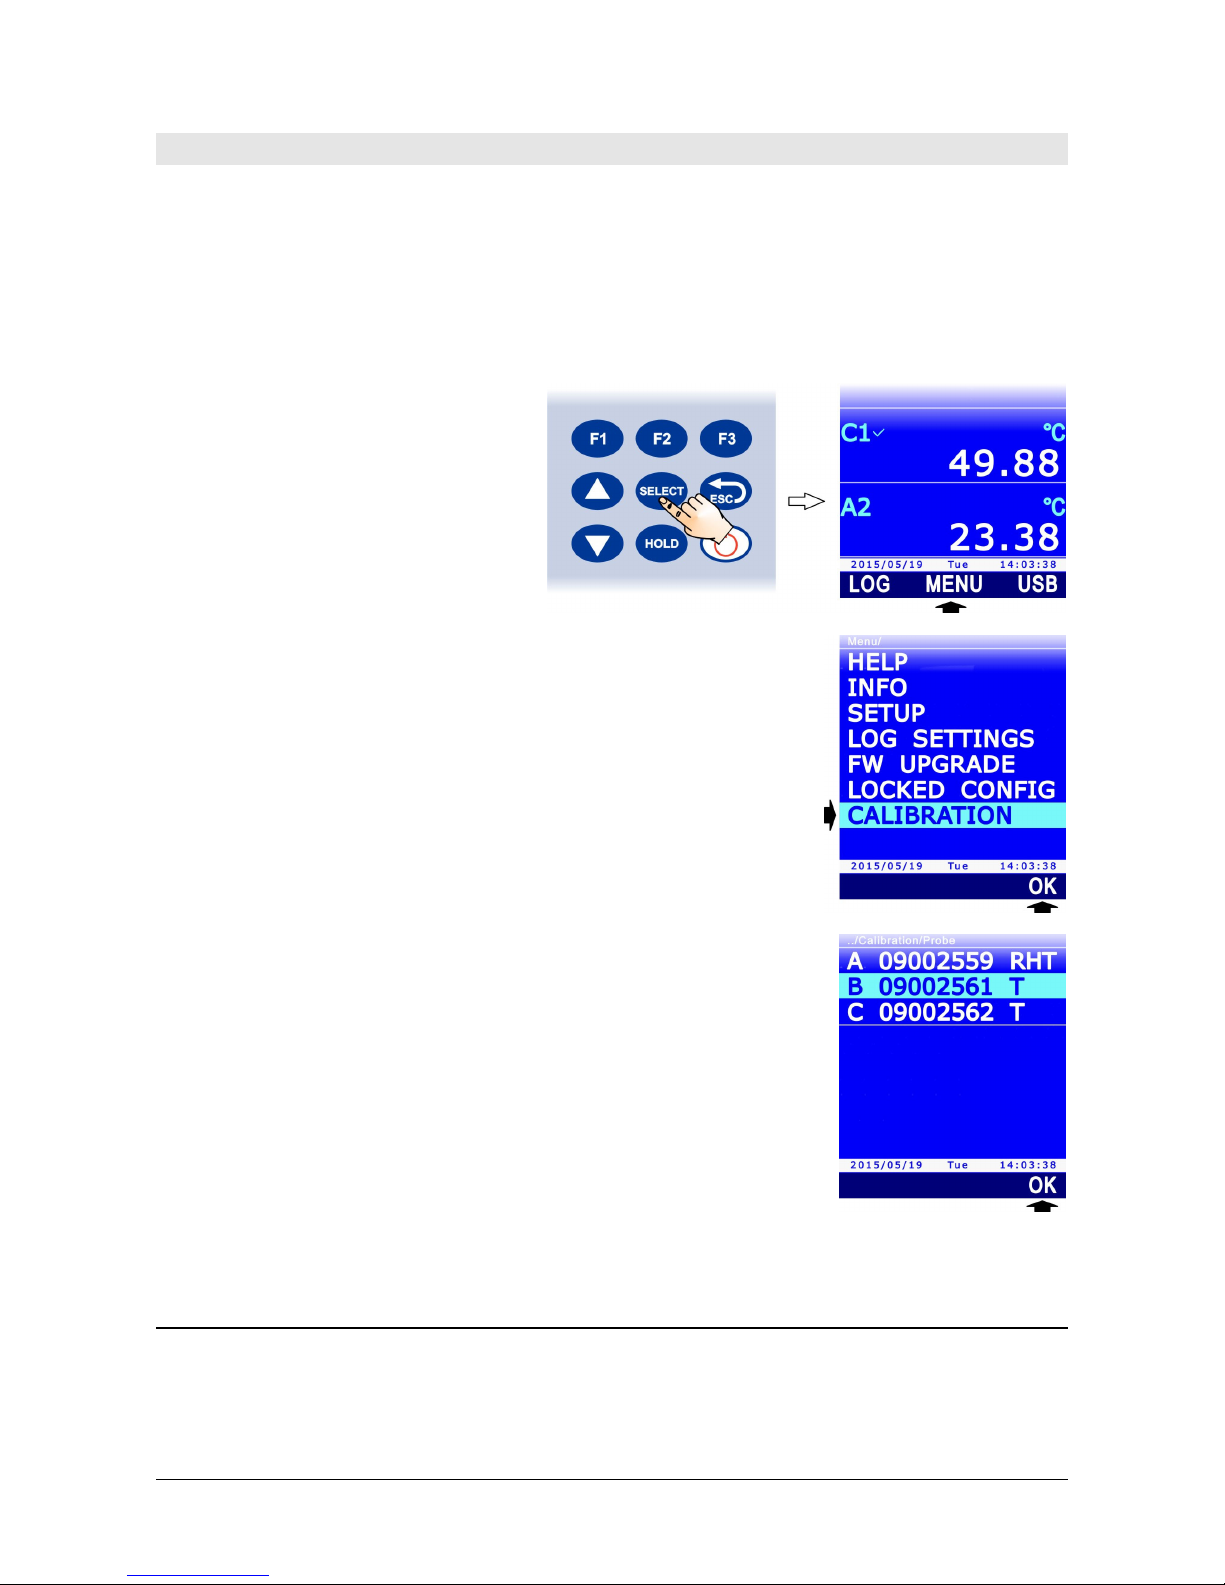
HD31 - 90 - V1.6
13 CALIBRATION
The probes are supplied factory-calibrated and usually don’t require additional user intervention. Nevertheless a new calibration can be performed.
Note: it is essential to know and respect the physical phenomena measurements are based on
in order to achieve correct calibration: it is recommended to perform new calibrations only if
you have the adequate technical expertise and to carefully follow the procedures described in
this manual.
To access probe calibration:
1. Press SELECT to display the MENU
command in the command bar,
then select the command by pressing the F2 key.
2. Select the CALIBRATION item using S and T, then press
the F3 key (OK command) to confirm.
Note: the CALIBRATION item is not displayed if the instrument is in protected mode. See paragraph 8.2 to change the
pr
otection status.
3. The list of the connected probes is displayed. Each probe is
identified by its own serial number and by the type of measurement. Select the probe to be calibrated using S and T,
then press the F3 key (OK command) to confirm.
4. The displayed screen depends on the type of probe selected. According to the type of probe,
continue as indicated in the paragraphs below.
13.1 CALIBRATION OF TEMPERATURE-ONLY PROBES WITH PRT SENSOR
Selecting a Pt100 or Pt1000 temperature-only probe for calibration displays four possibilities:
• NEW TUNING: calibrates the probe in one, two or three points. The possible calibration
points are 0 °C, one point ranging from 95 °C to 105 °C and one point ranging from
150 °C to 400 °C. The probe can be calibrated either in one point or in two points: for
the non-calibrated points, the instrument will use the values stored in the previous user-

HD31 - 91 - V1.6
calibration or, failing this, the factory values.
• STANDARD PT100: sets the user-calibration with the nominal values of the Pt100 sen-
sor. An option to be used if the probe is not calibrated and it is not possible to perform a
new calibration.
• FACTORY: sets the user-calibration equal to the factory calibration. It is useful if incor-
rect user-calibration data were entered and if you are temporarily unable to perform a
new calibration.
• PARAMETERS: displays and/or changes the coefficients of the Callendar Van Dusen eq-
uation used by the instrument to obtain the temperature depending on the resistance of
the PRT sensor (see appendix for details).
Fig. 13.1.1: PRT probe calibration types
Select the desired type of calibration using S and T, then press the F3 key (OK command) to
confirm.
If a message is displayed reminding that the operation will change the probe calibration data,
select YES (F3 key) to continue (or Press F1 to select NO and exit).
13.1.1 NEW TUNING OPTION FOR PRT SENSORS
1. The instrument suggests that the first calibration point is set to 0 °C (SETPOINT line). If you
don’t want the point to be calibrated, press F1 (SKIP
command) to move to the next point,
otherwise place the probe in a bath at 0 °C. The display shows the temperature value
measured by the probe (MEASURE line). When the reading is stable, press F3 (OK com-
mand) to confirm: the instrument displays a countdown (ACQUIRING) of a few seconds,
then moves to the next calibration point.
Fig. 13.1.2: PRT calibration at 0 °C
2. Th
e instrument suggests that the second calibration point is set to 100 °C (SETPOINT line).
If you don’t want the point to be calibrated, press F1 (SKIP command) to move to the next
point, otherwise place the probe in a bath ranging from 95 °C to 105 °C. The display shows
the temperature value measured by the probe (MEASURE line). The calibration point can be
adjusted using S and T. When the reading is stable, press F3 (OK command) to confirm:
Reference value
Measured value

HD31 - 92 - V1.6
the instrument displays a countdown (ACQUIRING) of a few seconds, then moves to the
next calibration point.
3. The instrument suggests that the third calibration point is set to 200 °C (SETPOINT line). If
you don’t want the point to be calibrated, press F1 (SKIP command) to terminate the cali-
bration, otherwise place the probe in a bath ranging between 150 °C and 400 °C. The display shows the temperature value measured by the probe (MEASURE line). The calibration
point can be adjusted using S and T. When the reading is stable, press F3 (OK command)
to confirm: the instrument displays a countdown (ACQUIRING) of a few seconds and at the
end, a message reminding that the operation will change the probe calibration data, select
YES (F3 key) to continue (or press F1 to select NO and exit).
Calibration can be exited at any moment by pressing ESC.
Note: the boxes near the SETPOINT number represent the three available calibration points; a
box becomes full when the corresponding point is calibrated.
13.1.2 PARAMETERS OPTION FOR PRT SENSORS
The instrument displays the parameters (R0, α, δ and β) used for calculating temperature depending on the measured resistance of the PRT sensor (see appendix for details).
1. Select the parameter you want to be changed using S and T, then press the F1 key (command EDIT) to confirm.
Fig. 13.1.3: parameters for temperature calculation equation
2. S
et the first digit using S and T, then select the "-->" command (F2 key) to move to the
next digits (the currently selected digit flashes). To return to a previous digit, select the
"<--" command (F1 key). After setting all the digits, press OK (F3 key) to confirm the val-
ue.
Fig. 13.1.4: setting a parameter of the equation

HD31 - 93 - V1.6
R0 parameter is expressed in thousands: enter 100000 to indicate 100.000 Ω.
α parameter is expressed without zeroes on the left: enter 385055 to indicate 0.00385055.
δ parameter is expressed without decimal point: enter 1499785 to indicate 1.499785.
β parameter is expressed without the zero on the left: enter 10863 to indicate 0.10863.
3. To definitively save the changed values in the instrument, select the SAVE command by
pressing the F3 key: a message appears reminding that the operation will change the probe
calibration data, select YES (F3 key) to continue (or press F1 to select NO and exit).
Calibration can be exited at any moment by pressing ESC.
13.2 CALIBRATION OF THERMOCOUPLE TEMPERATURE PROBES
Thermocouple temperature probes do not provide for user calibration to be performed. By selecting a thermocouple temperature probe for calibration, you can only set the type of thermocouple connected to the instrument input.
Select the type of thermocouple using S and T, then press the F3 key (OK command) to con-
firm.
Fig. 13.2.1: selecting the type of thermocouple
If
the type of thermocouple is changed, a message appears reminding that the operation will
change the probe data, select YES (F3 key) to continue (or press F1 to select NO and exit).
You can exit the setting at any time by pressing ESC.

HD31 - 94 - V1.6
13.3 CALIBRATION OF COMBINED RELATIVE HUMIDITY AND TEMPERATURE PROBES
When selecting a combined probe for calibration, you will be asked which of the two sensors
you want to calibrate. Select the sensor using S and T, then press the F3 key (OK command)
to confirm.
Fig. 13.3.1: selecting the sensor to be calibrated
13.3.1 CALIBRATION OF THE TEMPERATURE SENSOR OF RH/T COMBINED PROBES
If the combined RH/T probe has a Pt100 sensor, two options are displayed:
Fig. 13.3.2: types of calibration for the temperature sensor
• NEW TUNING: calibrates the probe at any point within the operating range of the
probe.
• STANDARD PT100: sets the user calibration with the nominal values of the Pt100sensor.
Select this option if the probe is not calibrated and it is not possible to perform a new calibration.
Select the type of desired calibration using S and T, then press the F3 key (OK command) to
confirm.
By selecting the NEW TUNING option, the display shows the temperature value measured by
the probe. Place the probe to be calibrated, together with a reference thermometer, in a constant temperature environment (respecting the operating range of the RH probe) and
wait for the measurement to become stable; using S and T, adjust the reading of the instrument to coincide with the reading of the reference thermometer, then press the F3 key (OK
command) to confirm: a message appears reminding that the operation will change the probe
calibration data, select YES (F3 key) to continue (or Press F1 to select NO and exit).

HD31 - 95 - V1.6
Fig. 13.3.3: calibration of the Pt100 sensor to the reference value
13.3.2 CALIBRATION OF THE RELATIVE HUMIDITY SENSOR
Before starting the calibration operation, better verify, using saturated solutions (75.4%RH and
33%RH), if a new calibration is needed: proceed with calibration only if an error of a few humidity points in one of the two calibration points
is discovered.
When selecting the calibration of the relative humidity sensor, four options are displayed:
Fig. 13.3.4: types of RH sensor calibration
• FULL TUNING: calibrates the probe in one, two or three points. The possible calibration
points are 75%RH, 33%RH and 11%RH. The probe can also be calibrated in one or in
two points only: as for the non-calibrated points, the instrument will use the values
stored in the previous user calibration or, failing this, the factory values. As for one-point
calibration it is recommended to use the next options.
• 75% TUNE-UP: calibrates the probe at 75%RH.
• 33% TUNE-UP: calibrates the probe at 33%RH.
• 11% TUNE-UP: calibrates the probe at 11%RH.
Select the desired type of calibration using S and T, then press the F3 key (OK command) to
confirm.
Pre-calibration operations:
Check that the elements below are all present inside the chamber with saturated saline solutions:
• solid state salt,
• liquid solution or wet salt, especially for the 75%RH solution.
The instrument and the saturated solutions to be used for this operation must be placed in a
stable temperature environment for the entire calibration period. Wait for at least a couple of

HD31 - 96 - V1.6
hours at stable temperature so as the instrument and the saturated solutions may reach thermal
balance with the environment before starting the calibration procedure. To obtain a good calibration, it is essential that the probe and the solution have the same temperature. You should keep
in mind that the plastic material is a poor heat conductor.
The calibration must be performed in a temperature range from 15 to 30°C.
Full calibration procedure (FULL TUNING option):
1. Unscrew the protection cover of the probe and, if necessary, tighten the M12×1 thread ring
nut (the thread ring nut is necessary only for ∅ 14 mm probes).
Avoid any contact of the sensitive element with hands or any other object or liquids. If mois-
ture is inside the measurement chamber, dry it with clean absorbent paper.
2. Unscrew the closure cap of the 75%RH saturated solution. Tighten the thread ring nut with
the probe to the saturated solution container and wait for at least 30 minutes.
3. In the instrument, select the calibration option FULL TUNING and press F3 (OK command)
to confirm.
4. The instrument suggests that the first calibration point is set to 75%RH (SETPOINT line)
and displays the temperature and the relative humidity measured by the probe (MEASURE
line).
Fig. 13.3.5: calibration at 75%RH
5. Usi
ng S and T, set the calibration point (SETPOINT line) to the saturated solution value at
the measured temperature (see the table below).
TAB. 13.3.1: saturated solution at 75%RH
Temperature (°C) Solution 75%RH
15 75.6
20 75.4
25 75.2
30 75.0
6. When the reading is stable, press F3 (OK command) to confirm. The instrument displays a
countdown (ACQUIRING) of a few seconds; at the end, a message is shown reminding that
the operation will change the calibration data of the probe, select YES (F3 key) to continue
(or press F1 to select NO and exit), the instrument moves to the next calibration point.
Calibration point
Measured RH
Measured Temperature

HD31 - 97 - V1.6
Fig. 13.3.6: calibration point confirmation
Dur
ing the countdown you can exit the procedure without calibrating the point by pressing
ESC.
In alternative to the F3 key (OK command) calibration can be confirmed by pressing the F1
key (SET command). Pressing the SET command keeps the instrument in the current
screen, instead of moving immediately to the next point. This allows confirmation of the
performed correction before continuing. After pressing the SET command, you need to select the OK command (F3 key) to move to the next point, or press ESC to exit calibration.
7. Remove the probe (with thread ring, if any) from the saturated solution container and close
the container.
8. Unscrew the closing cap of the 33%RH saturated solution. Tighten the thread ring nut with
probe to the saturated solution container and wait at least 30 minutes.
9. The instrument suggests that the second calibration point is set to 33%RH. Using S and T,
set the calibration point to the saturated solution value at the measured temperature (see
the table below).
TAB. 13.3.2: saturated solution at 33%RH
Temperature (°C) Solution 33%RH
15 33.3
20 33.0
25 32.7
30 32.4
Note: press ESC if you want to exit the procedure without calibrating the point.
10. When the reading is stable, press F3 (OK command) to confirm. The instrument displays a
countdown (ACQUIRING) of a few seconds; at the end, a message is shown reminding that
the operation will change the calibration data of the probe, select YES (F3 key) to continue (or press F1 to select NO and exit), the instrument moves to the next calibration
point.
11. Remove the probe (with thread ring nut, if any) from the saturated solution container and
close the container.
12. Unscrew the closing cap of the 11%RH saturated solution. Tighten the thread ring nut with
probe to the saturated solution container and wait at least 30 minutes.
13. The instrument suggests that the third calibration point is set to 11%RH. Using S and T,
set the calibration point at 11.3 %RH (solution value between 15 and 30 °C).
Note: press ESC if you want to exit the procedure without calibrating the point.
14. When the reading is stable, press F3 (OK command) to confirm. The instrument displays a
countdown (ACQUIRING) of a few seconds; at the end, a message is shown reminding that
the operation will change the calibration data of the probe, select YES (F3 key) to con-
tinue (or press F1 to select NO and exit), the instrument exits calibration.

HD31 - 98 - V1.6
15. Remove the probe (with thread ring nut, if any) from the saturated solution container and
close the container.
16. Unscrew the M12X1 thread ring nut, if any, from the probe and reposition the sensor protec-
tion cover.
Single-point calibration procedure (75%, 33%, 11% TUNE-UP options):
By selecting 75% TUNE-UP, 33% TUNE-UP and 11% TUNE-UP options the calibration of the relative humidity sensor is performed only in the selected point. The procedure is entirely similar to
the information given about complete calibration, with the difference that the instrument exits
calibration after confirming the point, instead of moving to the next point:
1. Unscrew the protection cover of the probe and, if necessary, tighten the M12×1 thread ring
nut (the thread ring nut is necessary only for ∅ 14 mm probes).
Avoid any contact of the sensitive element with hands or any other object or liquids. If mois-
ture is inside the measurement chamber, dry it with clean absorbent paper.
2. Unscrew the closure cap of the saturated solution. Tighten the thread ring nut with probe to
the saturated solution container and wait for at least 30 minutes.
3. In the instrument, select 75% TUNE-UP, 33% TUNE-UP or 11% TUNE-UP calibration op-
tions according to the point to be calibrated, then press the F3 key (OK command) to confirm.
4. The instrument suggests the calibration point (SETPOINT line) and displays the temperature
and the relative humidity measured by the probe (MEASURE line).
5. Using S and T, set the calibration point (SETPOINT line) to the value of the saturated solution at the measured temperature (see the tables shown in the complete calibration procedure).
6. When the reading is stable, press F3 (OK command) to confirm. The instrument displays a
countdown (ACQUIRING) of a few seconds; at the end, a message is shown reminding that
the operation will change the calibration data of the probe, select YES (F3 key) to continue
(or press F1 to select NO and exit).
During the countdown you can exit the procedure without calibrating the point by pressing
ESC.
In alternative to the F3 key (OK command) calibration can be confirmed by pressing the F1
key (SET command). Pressing the SET command keeps the instrument in the current
screen, instead of moving immediately to the next point. This allows confirmation of the
performed correction before continuing. After pressing the SET command, you need to select the OK command (F3 key) or press ESC to exit calibration.
7. Remove the probe (with thread ring nut, if any) from the saturated solution container and
close the container.
8. Unscrew the M12X1 thread ring nut, if any, from the probe and reposition the sensor protecting cover.

HD31 - 99 - V1.6
13.4 CALIBRATION OF PP472 MODULE (BAROMETRIC PRESSURE)
The calibration of PP472 module for measuring the barometric pressure is performed in two
points: 800.0 mbar and 1013.0 mbar. In order to calibrate you will need a precision pressure
generator.
After selecting PP472 module for calibration, proceed as follows:
1. Deliver 800.0 mbar pressure at the module inlet.
2. The instrument displays the first calibration point at 800.0 mbar (SETPOINT line) and the
pressure value measured by the module (MEASURE line).
Fig. 13.4.1: barometric pressure calibration
3. Th
e calibration point can be adjusted (SETPOINT line) using S and T to fit the effectively
applied pressure value.
4. When the reading is stable, press F3 (OK command) to confirm: the instrument displays a
countdown (ACQUIRING) of a few seconds and then moves to the next calibration point.
In alternative to the F3 key (OK command) calibration can be confirmed by pressing the F1
key (SET command). Pressing the SET command keeps the instrument in the current screen,
instead of moving immediately to the next point. This allows confirmation of the performed
correction to be received before continuing. After pressing the SET command, you need to select the OK command (F3 key) to move to the next point or press ESC to exit calibration.
5. Deliver 1013.0 mbar pressure at the module inlet.
6. The instrument displays the second calibration point at 1013.0 mbar. If necessary, adjust
the calibration point using S and T.
Note: press ESC if you want to exit the procedure without calibrating the point.
7. When the reading is stable, press F3 (OK command) to confirm. The instrument displays a
countdown (ACQUIRING) of a few seconds; at the end, a message is shown reminding that
the operation will change the calibration data of the probe, select YES (F3 key) to continue
(or press F1 to select NO and exit).
Note: the boxes next to the SETPOINT number represent the available calibration points; a box
becomes full when the corresponding point is calibrated.
Reference value
Measured value

HD31 - 100 - V1.6
13.5 CALIBRATING THE CO
2
PROBE
Three options are shown by selecting a CO2 probe for calibration:
• ZERO/FRESH AIR: calibrates the probe in one single point (any value included in the
measuring range).
• LINEAR GAINS: calibrates the probe in two, three or four points.
• FACTORY: sets user calibration equal to factory calibration. This is useful if wrong user
calibration data have been entered and you are temporarily unable to perform a new calibration.
Fig. 13.5.1: calibrations for CO
2
probes
Note: the value used for the barometric pressure compensation is shown at the bottom of the
display; if necessary, change the setting as indicated at paragraph 9.3 at page 74.
Se
lect the desired type of calibration using S and T, then press the F3 key (OK command) to
confirm.
If a message appears reminding that the operation will change the probe calibration data, select YES (F3 key) to continue (or press F1 to select NO and exit).
13.5.1 ZERO/FRESH AIR OPTION FOR CO
2
PROBES
By selecting the ZERO/FRESH AIR calibration option, the instrument displays the calibration
point (SETPOINT line) and the CO
2
value measured by the probe (MEASURE line). The calibra-
tion point can be adjusted using S and T.
Fig. 13.5.2: ZERO/FRESH AIR calibration for CO
2
probes
Calibration can be performed:
• Positioning the probe in environment with known CO
2
concentration value, e.g. in clean
air.
Reference value
Measured value
 Loading...