

Page 1

XMap 6 User Guide
Updated for XMap 6.2
This user guide is a printable version of the XMap Help system. When you are using
XMap, use the Help system to take advantage of links to related Help topics and
tutorials.
Note: Some conten
t from the Help system is not available in the print version.
Page 2

Table of Contents
Getting Started.............................................................................................. 1
Welcome to XMap 6..................................................................................... 1
What's New in XMap 6 ................................................................................. 2
Frequently Asked Questions.......................................................................... 3
Helpful Tips...............................................................................................10
Migrating Data to the New DeLorme Docs Locations........................................13
Basic Functions..........................................................................................17
About the Interface ....................................................................................24
Map Legend .................................................................................................29
Map Legend...............................................................................................29
Using the Toolbar..........................................................................................33
Showing/Hiding Toolbar Options...................................................................33
Reordering the Toolbar Options....................................................................33
To Use the GIS Tools ..................................................................................33
To Create New Projects...............................................................................34
To Open a Project.......................................................................................34
To Migrate a Project....................................................................................35
To Save a Project.......................................................................................35
To Use the Map Navigation Tool....................................................................35
To Print.....................................................................................................35
To Print the Map Screen..............................................................................35
To Share Maps...........................................................................................36
To Share Online With Eartha Community Atlas................................................36
To Send Maps to Your Portable Media Player ..................................................36
To Create a Route ......................................................................................36
To Start/Stop Your GPS Connection ..............................................................37
To Exchange Files with a Handheld Device.....................................................37
To Use GPS NavMode..................................................................................38
To Grab and Pan the Map ............................................................................38
To Create a Profile......................................................................................38
To Measure Distance...................................................................................39
To Get Information About a Location.............................................................39
To Choose Options .....................................................................................40
To Add Images and Data to a GPS Location....................................................40
Customizing the Map and Tab Display ..............................................................41
Display Options Overview............................................................................41
Customizing the Interface............................................................................41
Displaying Basic Map Features......................................................................41
Customizing the Map Feature Preferences......................................................44
Changing the Map Colors.............................................................................45
Changing the Map Magnification Level...........................................................45
ii
Page 3

Table of Contents
Changing How POIs Display on the Map.........................................................46
Setting Units of Measure Preferences ............................................................47
Resizing the Map and Tab Areas...................................................................49
Viewing Two Maps at the Same Time ............................................................51
Showing or Hiding Tabs...............................................................................52
Importing/Exporting Tab Manager Preferences ...............................................53
Reordering the Tabs ...................................................................................53
Using Keyboard Shortcuts ..............................................................................55
Selecting a Keyboard Shortcut Scheme .........................................................55
Creating a New Custom Scheme...................................................................55
Assigning Keyboard Shortcuts in a Custom Scheme.........................................55
Customizing a DeLorme Scheme...................................................................57
Renaming a Custom Scheme........................................................................57
Deleting a Custom Scheme..........................................................................58
Importing a Custom Scheme........................................................................58
Exporting a Custom Scheme........................................................................59
Searching For Commands............................................................................59
Viewing All of the Shortcut Keys for a Scheme................................................59
Using Projects ..............................................................................................61
Map Data Overview ....................................................................................61
Migrating Data to the New DeLorme Docs Locations........................................61
Managing Data...........................................................................................64
Managing Projects......................................................................................67
Using Transfer Files....................................................................................70
Changing the Properties of Your Data............................................................73
Working With GIS .........................................................................................83
GIS Overview ............................................................................................83
Handling Disconnected or Deleted Layers.......................................................84
GIS Options...............................................................................................85
Using Database Manager.............................................................................86
Using Layers in a Subscription......................................................................99
Using ArcSDE Databases ...........................................................................101
Redlining.................................................................................................104
Stationing ...............................................................................................106
Bulk Importing and Exporting.....................................................................107
Managing Layers in Your Workspace ...........................................................115
Classifying, Symbolizing, and Labeling a Layer .............................................143
Using XMap Web......................................................................................159
Attributes-Datasheet View.........................................................................165
Attributes-Design View..............................................................................171
Query.....................................................................................................183
Layering .................................................................................................189
iii
Page 4

XMap User Guide
Checking Layers Out
and In.......................................................................190
Printing .....................................................................................................193
Printing a Map .........................................................................................193
Printing a Route and Directions ..................................................................194
Printing a Profile.......................................................................................195
Adding Text or Graphics to Your Map...........................................................196
Aligning Text and Graphic Items on Your Map...............................................199
Snapping Text and Graphic Items on Your Map.............................................200
Layering Multiple Text and Graphic Items on a Printed Map............................200
Changing the Background Color of a Printed Map..........................................201
Manually Assembling a Multi-page Map........................................................201
Finding a Location on the Map.......................................................................206
Find Overview..........................................................................................206
Performing a Basic Search.........................................................................206
Performing an Advanced Search.................................................................207
Performing a POI Search ...........................................................................211
Finding Points Near Your Current Location....................................................212
Finding a Symbol by its Name....................................................................213
Tips on Viewing Search Results ..................................................................214
Keywords for Category Searches ................................................................215
MapTags: Converting, Moving, Hiding, and Deleting ......................................218
Using Address Book Contacts........................................................................220
Searching for Address Book Contacts ..........................................................220
Importing Existing Address Book Information...............................................220
Manually Entering Address Book Information................................................221
Centering the Map on an Address Book Contact............................................221
Editing a Contact In Your Address Book.......................................................222
Manually Moving a Contact on the Map........................................................222
Relocating Address Book Contacts ..............................................................223
Showing/Hiding Address Book Contacts on the Map.......................................223
Deleting a Contact In Your Address Book.....................................................224
Deleting Your Entire Address Book..............................................................224
Exporting Your Address Book .....................................................................225
Searching for Phone Book Listings.................................................................226
Using Phone Data.....................................................................................226
Searching for a Phone Book Listing .............................................................227
Finding Phone Book Listings for a Specific Road............................................231
Using the Draw Tools...................................................................................233
Draw Overview ........................................................................................233
Viewing Hidden Draw Tools........................................................................238
Geocaching Features.................................................................................238
Draw File Management..............................................................................239
iv
Page 5

Table of Contents
Using Draw Objects
..................................................................................252
Routable Roads, Trails, Tracks, Lines, Arcs , and Splines................................259
Circles, Rectangles, and Polygons...............................................................265
Waypoints, Symbols, MapNotes, Text Labels, and Images..............................267
Custom Symbols......................................................................................272
Using XData...............................................................................................284
XData Overview.......................................................................................284
Importing Data ........................................................................................284
Managing Datasets...................................................................................286
Viewing Dataset Records...........................................................................287
Creating a Route with XData Records..........................................................288
Geocoding or Moving a Record's Location.....................................................289
Exporting Data.........................................................................................289
Printing XData Dataset Records..................................................................291
Registering Images .....................................................................................293
ImageReg Overview .................................................................................293
Creating Data for a Registered Image..........................................................293
Opening and Closing Existing WorkFiles.......................................................293
Registering an Image................................................................................294
Modifying Existing WorkFiles......................................................................296
Deleting an Existing WorkFile.....................................................................297
Hints for Placing Points..............................................................................297
Profiling Linear Objects................................................................................299
Creating a Profile .....................................................................................299
Viewing the Profile Elevation Graphs ...........................................................300
Statistical Data ........................................................................................302
Manually Setting Minimum and Maximum Elevation.......................................305
Clearing a Profile......................................................................................306
User Profile Data......................................................................................306
Viewing Your Map in 3-D..............................................................................308
Viewing a 3-D Map ...................................................................................308
Flying Over a 3-D Map ..............................................................................309
Setting Your 3-D Map Preferences...............................................................310
Routing .....................................................................................................312
Creating a Route......................................................................................312
Adding and Inserting Stops and Vias...........................................................314
Changing the Routing Method ....................................................................316
Changing the Properties of a Stop Along Your Route......................................317
Viewing Route Directions...........................................................................317
Avoiding a Specified Area When Routing......................................................318
Saving Route Directions as Text .................................................................319
Setting Your Routing Preferences................................................................319
v
Page 6

XMap User Guide
Editing a Route ........................................................................................320
Editing Roads ..........................................................................................321
Labeling a Route Point with a MapNote........................................................322
Moving Route MapNotes............................................................................323
Displaying and Centering Routes on the Map................................................323
Saving a Route ........................................................................................324
Deleting a Route ......................................................................................324
Importing Routes .....................................................................................324
Setting Your End of Day and Fuel Break Preferences......................................325
Estimating the Fuel Cost of Your Route........................................................326
Converting a Route to a GPS Log................................................................326
Using GPS..................................................................................................328
GPS Overview..........................................................................................328
Initializing GPS ........................................................................................329
Using NavMode or GPS Tab View ................................................................332
Tracking a Route with GPS.........................................................................333
Getting Back on Track When Off Course ......................................................334
Panning the Map Automatically While GPS Tracking.......................................335
Playing Back a Log File..............................................................................335
Previewing a GPS Log File..........................................................................336
Viewing File Details for a GPS Log...............................................................337
Monitoring Your GPS Status.......................................................................337
Monitoring GPS Satellite Information...........................................................339
Viewing Sun and Moon Information.............................................................340
Averaging ...............................................................................................341
About GPS...............................................................................................341
Using Voice Navigation and Speech Recognition...............................................343
Voice Overview ........................................................................................343
Voice Options Overview.............................................................................344
Activating and Monitoring Speech Recognition ..............................................344
Training the Speech Recognition Engine.......................................................345
Voice Commands......................................................................................346
Speech Recognition Tips............................................................................349
Changing Voice Output..............................................................................350
Voice Preferences.....................................................................................351
Voice Prompts..........................................................................................352
Using Handheld Devices...............................................................................354
Handheld Export ......................................................................................354
Exchanging Information with an Earthmate PN-Series GPS.............................358
Exchanging Information with a Third-party GPS Device..................................377
Exchanging Information with a Palm OS Device............................................383
Exchanging Information with a Pocket PC Device ..........................................388
vi
Page 7

Table of Contents
Using UMPC and Smal
l-screen Devices...........................................................394
Using UMPC and Small-screen Devices ........................................................394
Using NetLink.............................................................................................395
NetLink Overview.....................................................................................395
Using GeoTagger ........................................................................................397
Getting Started with GeoTagger .................................................................397
Tagging an Image ....................................................................................397
Tagging Data...........................................................................................398
Calculate the Timestamp Offset..................................................................399
Sharing Online............................................................................................401
Using Eartha Community Atlas...................................................................401
Using MapShare.......................................................................................401
Using the XMap API Command Window..........................................................402
XMap API Command Window .....................................................................402
API Commands and Parameters..................................................................403
Legal Information........................................................................................406
DeLorme XMap GIS Single-User License Agreement ......................................406
Important Notices ....................................................................................410
Apache License, Version 2.0.......................................................................416
Index........................................................................................................421
vii
Page 8

Page 9

Getting Started
Welcome to XMap 6
Tips
• Double-click a book in the Table of Contents to view all of its associated
topics. Click a topic to read its contents.
• Additional information is available in the Technical Support section of our
website. Visit www.delorme.com to view tutorials, search the forums, and
more.
The following features and more are available in XMap.
• Import or create GIS layers, link attribute data, classify and adjust how the
data displays, build queries, and more.
• Add data and manage projects.
• Use the split-screen to simultaneously view two types of data for the same
location.
• Print high quality, detailed, single-p age maps or mural maps as large as 3 x 3
pages.
• Print route directions and profiles.
• Search for locations on the map.
• Search for residential or business phone listings (Phone Data required).
• Get information about map features.
• Register images to the base map.
• Add annotation or redline edits to the map.
• View profile elevation graphs for a selected linear object on the map.
• View and fly over your map in 3-D.
• Create a route by adding start and finish points on your map. Customize your
route by adding stops and vias.
• Connect your GPS device to the program and track your progress on a
portable computer as you travel. View your next turn as well as the turn after
that—very helpful when you need to make a turn directly after another turn.
You can even use the automatic back-on-track feature to recalculate your
route when detours veer you off course.
• Issue voice commands and receive spoken directions.
• Export a map to a handheld device.
• Create custom keyboard shortcuts or select a DeLorme shortcut scheme, such
as 3-D Navigation, to navigate the program more easily than ever.
• Use the toolbar to share maps, open/create/save projects, start/stop GPS,
edit your preferences, and more.
• Combine digital photos and data with GPS locations using GeoTagger.
1
Page 10

XMap User Guide
What's New in XMap 6
What's New in XMap 6.2
• Updated and enhanced ArcSDE 9.3 support improves the ability to import and
deploy GIS databases to the field—synchronize large GIS layers for the field
in record time!
• Shapefile support for XMap 6 Professional—import shapefiles into the GIS tab
and apply symbolization
Note This is already available in XMap GIS Enterprise and XMap GIS Editor
• Faster data cutting for Earthmate GPS PN-Series GPS devices
What's New in XMap 6.1
• GIS Options Dialog Box – customize your GIS default layer and query settings
• NetLink Map Library offers data download subscriptions
• Export XMap GIS files to Drawing Exchange (AutoCAD .dxf) format
• Enhanced MrSID import now includes aux.xml support
• Simplified XMap data export (draw layers, GIS layers, user raster data) for
the recently released Earthmate GPS PN-40 handheld
• Access downloadable feature enhancements and bug fixes (No re-installation
required)
What's New in XMap 6
• Works with the Windows Vista™ operating system
• DeLorme Docs folder is in a new location—for more information, see Migrating
Data to the New DeLorme Docs Location
• Improved multi-user permissions
• ArcSDE 9.2 support
• GIS layer append and replace features during import
• Improved GIS database synchronization (Enterprise only)
• GIS stationing support for field line assets with user-defined distance
measures (Editor and Enterprise only)
• Create map packages with draw and GIS data for use on Earthmate PN-Series
GPS devices; independently layer them over other datasets
• Download NOAA charts from NetLink for display in XMap and on Earthmate
PN-Series GPS devices
• API access to routing, GPS navigation, and map controls
• GPS NavMode—a new hands free full-screen view that you can view in 2-D or
3-D
• Improved terrain profiling for multi-channel data—show travel speed,
temperature, and other variables against the terrain
• GeoTagger, a new toolbar feature, provides updated image and data-tagging
features allows you to combine digital photos or data with GPS locations in a
completely new way
• New route references for Walking/Jogging, Cycilng, Off-Roading, Driving
2
Page 11

Getting Started
• Support for opening DeLorme Topo USA and Street Atlas projects; easily
migrate your old projects to XMap
Frequently Asked Questions
These questions are asked most frequently by our customers.
• Why doesn't map data display in all projects?
The procedure for adding data to XMap varies; it depends on if you want to
add the data to the current project or if you want to add it to all projects. If
you added the data to only the current project and you want to view it in all
projects, you must add the data as base data in the application.
Use the steps below to add a map dataset as base data.
1. Click the Map Data tab.
2. Click Data and then click Base Data.
The Base Data Locations dialog box opens listing each of the data
sources on your system.
3. Click Add, select the hard drive location where you saved your data
from the Browse for Folder dialog box, and click OK.
The OK button is enabled when you select a folder containing a file
that contains the properties of the map data being added.
4. Click Done.
• What map data is included with XMap?
XMap includes a worldwide reference base map dataset that includes major
roads, cities, boundaries, and geographic features, which is visible between
data zoom levels 1 and 6. For more detailed map features or aerial imagery,
you can purchase a variety of base map datasets from DeLorme or integrate
your own data using XMap's import and data adding tools. Note that most of
the maps used by DeLorme to convey the capabilities of the software are
created using an optional DeLorme base map dataset and/or data or imagery
from third-party sources.
• How do I add non-DeLorme imagery to my map?
Use the Map Data tab to add imagery in MrSID and GeoTIFF format to your
map.
1. Click the Map Data tab.
2. Click Data and then click Add.
The Add Data to Maps dialog box opens.
3. Browse to the file you want to add, select it, an d then click Add.
The imagery is added to the current project.
Note Imagery will not display unless projection information is specified in the
file.
• How do I import files from an earlier version of XMap into this version?
Use the Map Data tab to import projects, routes, draw files, and XData from
many other DeLorme mapping programs. For information about migrating
data to XMap 6, see Migrating Data to the New DeLorme Docs Location.
3
Page 12

XMap User Guide
To Open A Project
1. Click the Map Data tab.
2. Click File and then click Open.
3. Select the project you want to view and then click Open.
4. Click OK.
To Open a Route
5. Click the Map Data tab.
6. Click Data and then click Add.
The Add Data to Maps dialog box opens.
7. Browse to the file you want, select it, and then click Add.
The route is added to the current project.
To Open a Draw File
8. Click the Map Data tab.
9. Click Data and then click Add.
The Add Data to Maps dialog box opens.
10. Browse to the file you want, select it, and then click Add.
The draw file is added to the current project.
To Open an XData File
11. Click the Map Data tab.
12. Click Data and then click Add.
The Add Data to Maps dialog box opens.
13. Browse to the file you want, select it, and then click Add.
The XData file is added to the current project.
• What is my server name?
XMap uses Microsoft SQL Server as its DeLorme OpenSpace database engine.
Your server name varies, depending on if you are connecting to or creating a
DeLorme database in Microsoft MSDE SQL Server 2000, Microsoft SQL Server
2005 Express, or a Microsoft Enterprise SQL Server at your company.
• To establish a local connection to MSDE 2000, use
localhost\DELORMEMAPPING or (local)\DELORMEMAPPING for the
server name.
To establish a connection to MSDE 2000 on another computer in your
network, use <computer name>\DELORMEMAPPING.
• To establish a local connection to SQL Server 2005 Express, use
localhost\XMAP5 or (local)\XMAP6 for the server name.
To establish a connection to SQL Server 2005 Express on another
computer in your network, use <computer name>\XMAP6.
• To establish a connection to a Microsoft Enterprise Microsoft SQL
Server, use <Server Name> for the server name. You will need to
ensure that you have the proper server and database permissions and
you are connected to the network. Contact your IT department if you
experience problems.
4
Page 13
Getting Started
Note MSDE 2000 installs to your computer with XMap 4.5 and SQL Server
2005 Express installs to your computer with XMap 5 and above if MSDE 2000
is not already present.
• Why doesn't my Workspace display any layers?
If there are no layers in your Workspace, you may have accidentally removed
them. To retrieve the layers, click the GIS tab, click the Workspace subtab
(if it is not currently selected), click the Layers button, and then click
Manage. Select the Source Database you want to pull layers from, highlight
the Layers in the Database, and then click the move or move all button to
move the layers into your workspace.
If the database where your layers are present is not listed in the Source
Database drop-down list, you can connect to it by selecting the Other…
option. If you have not yet created a database, you can do so using Database
Manager or by selecting the New… option in the Target Database dropdown list in the Create Layer and Import Wizard dialogs.
• Where do I find the map settings and other Options settings?
Click the Options button
on the toolbar to modify GPS, voice,
GIS, map feature, display, handheld, and keyboard shortcut, and 3-D
preferences. For more information, see To Open the Options Dialog Box.
• Upgraders only: What happens to my projects when I upgrade?
In previous versions of XMap, your projects, draw files, route files, log files,
XData files, and other DeLorme files were stored by default in the DeLorme
Docs folder on the root of your computer's C drive unless you specified a
different directory during installation.
In XMap 6, the DeLorme Docs folder for all files except NetLink downloads is
located in the My Documents (Windows XP) or Documents (Windows Vista)
folder under your user name. For NetLink downloads, the Downloads folder is
located in the DeLorme Docs folder under Shared Documents (Windows XP)
or Public Documents (Windows Vista).
For information about migrating data to XMap 6, see Migrating Data to the
New DeLorme Docs Location.
• Upgraders only: Why doesn't XMap overwrite the older version?
XMap 5 and later versions do not overwrite older versions of XMap, such as
XMap 4.5 or earlier. This allows you to view both versions on the same
computer.
• Upgraders only: Should I uninstall my previous version bef ore installing the
new version?
You are not required to uninstall XMap 4.5 or earlier versions before installing
XMap 6. You do not have to uninstall XMap 6 to upgrade to a later version of
XMap6, such as XMap 6.1.
5
Page 14
XMap User Guide
• Can I see imagery and data from Topo USA or Street Atlas USA within XMap?
Yes. The location of the Downloads folder changed in XMap 6. If you stored
your data in the DeLorme Docs Downloads folder, it will auto matically migrate
to the new location. If you stored it in a different location, you can use the
Map Data tab to browse to the location and add it.
For information about migrating data to XMap 6, see Migrating Data to the
New DeLorme Docs Location.
• How do I get data updates or fix the roads on my map?
If you find there is a local road that is missing, you can add it to the current
draw layer using the Routable Roads Draw tool. For more informat ion, see
Drawing Routable Roads or Trails on the Map.
To report a correction to us:
1. Click the NetLink tab.
2. Click the Support subtab.
3. Click the Submit Correction link.
4. Use the Customer Revisions Wizard to submit the change.
• How do I activate my Earthmate PN-Series GPS device to exchange
information with XMap?
Use the following steps to activate your device before you exchange maps.
1. With XMap open, connect your device to your computer and power it
on.
2. PN-40 only: The Connect to Computer screen appears on the device
and Data Exchange is highlighted.
Press ENTER on the device.
3. In XMap, click the Exchange button
on the toolbar to open the
Earthmate PN-Series Exchange Dialog box.
The device is activated when it appears in the drop-down list in the top
right corner of the dialog box.
For more information, see Activating an Earthmate PN-Series GPS.
• How do I initialize my GPS receiver?
Each time you use your GPS receiver, you initialize it, which means you set
your starting position on the map by obtaining the initial coordinates of your
location. This can be done automatically or manually.
For more information, see Initializing GPS.
• What is the difference between NavMode and the GPS tab view when using
GPS?
The default GPS view is NavMode—a hands free full-screen view that you can
display in 2-D or 3-D. By default, the Control Panel is hidden and the tabs are
minimized; however, you can customize your interface. For more information,
see the NavMode tutorial in the application’s Help.
6
Page 15
Getting Started
The GPS tab view option allows you to use the GPS tab to control navigating
and tracking. By default, the tabs and Control Panel are visib le, but you can
opt to hide them. It is available only in 2-D mode.
To turn NavMode on or off, click the NavMode button
When the button appears indented,
Note The button is greyed out
NavMode is on.
unless you have a GPS device plugged in
on the toolbar.
or are playing back a GPS log file
You can also change your GPS view in the Options dialog box:
1. Click the Options button
GPS tab. You can also click the Options button
on the toolbar and click the
on the GPS tab.
2. Clear the Use NavMode check box to turn it off, or select the check
box to turn it on.
3. Click OK.
• What's the difference between a stop and a via?
When routing, you have the option of adding or inserting stops or vias in the
route. A stop is a location in the middle of a route where you want to stop and
then proceed from. A via is a road on the map that you want to specifically
use when routing.
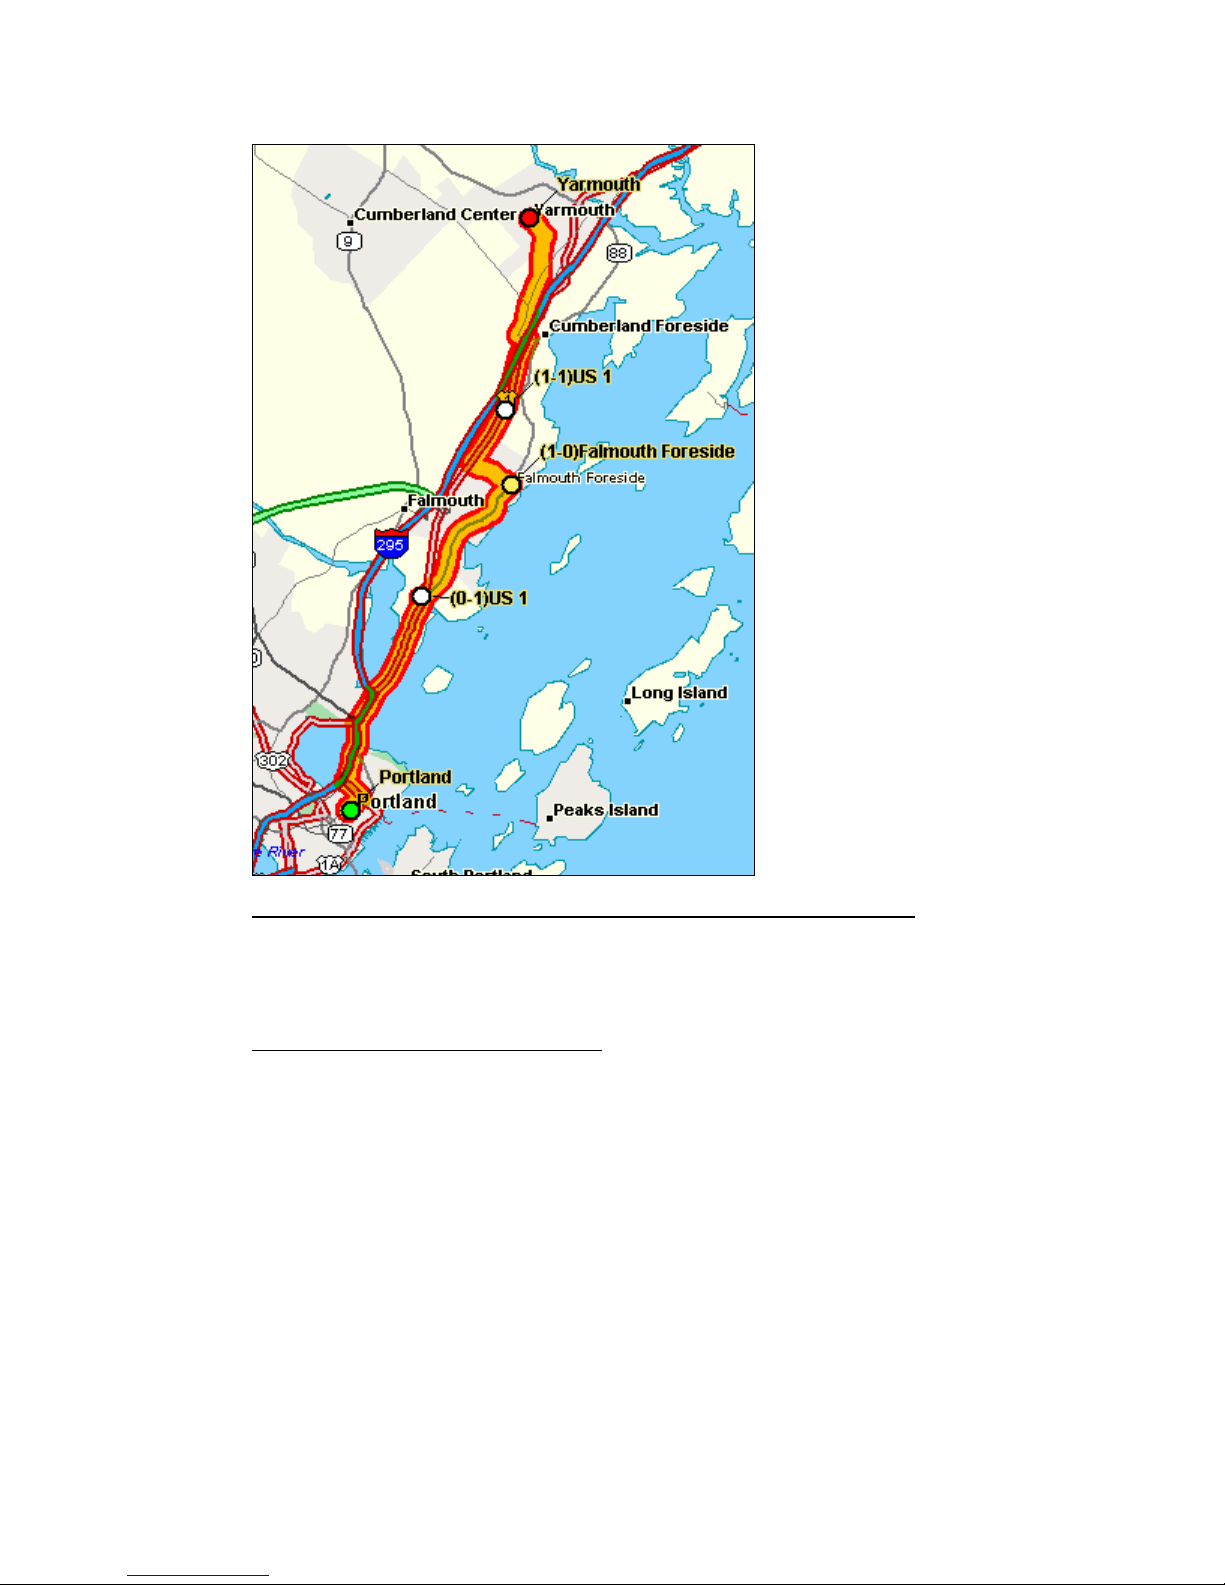
For example, if you create a route between Portland, Maine, and Yarmouth,
Maine, without any stops or vias, the route directions will tell you to take I-
295. However, if you want to take US Route 1 instead, you can place vias in
the route on US Route 1 to force the route to go by way of US Route 1. If you
plan on stopping in Falmouth Foreside for lunch, you w ill want your route
directions to reflect that stop. When you add a stop, the route can be
recalculated to include the stop in the middle of your route.
The map below shows the area between Portland, Maine, and Yarmouth,
Maine, with two vias and one stop.
7
Page 16
XMap User Guide
• What's the difference between adding and inserting a stop or via?
The Insert Stop/Via function arranges stops/vias geographically in the route.
The Add Stop/Via function adds stops/vias in the order you add them to the
route.
• Why did my route fail to calculate?
Your route will fail to calculate if you create a route:
• With a route start, stop, via, or finish point in an area that you have
designated as a Route Avoid.
• That includes route points outsid e the United States, Mexico, or
Canada.
• On an island without roads. In this case, XMap will look for the nearest
road to that island to place the route point. If the nearest road is not
routable (for example, it is the only road on the island and/ or the
island does not have ferry access), you will get an error message
saying "Route failed to calculate."
8
Page 17
Getting Started
• Why do X marks display on the map when I calculate a route?
• When you place a route point in a location that isn't on a street, XMap
finds the closest street to that location, marks the space between the
point you clicked and the street with X marks, and starts the route at
the street.
• If you perform a Find for an address that is on a walkway and place a
route point on it, XMap finds the closest street to that location, marks
the space between the point you clicked and the street with X marks,
and starts the route at the street.
• Why are the tab area and control panel so narrow?
XMap was designed to accommodate resolutions of 1024 x 768 or higher. If
you are using a very high resolution (such as 1920 x 1200), the tab area and
control panel in XMap may appear to be very narrow. You can modify the size
of the map and tab area or use the Windows Control Panel to adjust your
display settings.
• What's the best way to measure the distance of a road or trail?
The best way to determine the distance of a particular road or trail, is to
create a route. You can create a route using right-click functionality, the
toolbar, or the Route tab. For more information, see Creating a Route.
The best way to determine the distance of a particular road or trail, is to
create a route. You can create a route using right-click functionality, the
toolbar, or the Route tab. For more information, see Creating a Route.
The best way to determine the distance of a particular road or trail is to
create a route. You can create a route using right-click functionality, the
toolbar, or the Route tab. For more information, see Creating a Route.
• What's the best way to measure a large area on the map?
The best way to measure a large area on the map is with the area tools in the
Draw tab, such as the polygon tool. When you draw an area object on the
map, the area displays next to the object on the map. If you click off of the
object, you can view the area again by clicking the Select tool in the Draw tab
and then clicking the area object on the map. For more information about
drawing area objects, see Drawing a Circle, Rectangle, or Polygon on the Map.
• What's the best way to measure a short distance on the map?
The best way to measure a short distance that is not made up of a road/trail
on the map is to use the Measure tool
on the toolbar. The measure tool
allows you to measure linear distance and area on the map based on the units
chosen in the Display tab of the Options dialog box. For instructions on how to
use the measure tool, see Measuring Distance and Area.
• Why won't 3-D billboards display?
If you receive a message saying that 3-D billboards cannot be displayed,
ensure that you have a 32 MB video card with the latest drivers and that it
supports DirectX and transparencies. For more information, see the DeLorme
Forums.
9
Page 18
XMap User Guide
Helpful Tips
These tips may help you use the features in your DeLorme mapping program. The
Did You Know? pop-up tutorials provide hints while you are working in the
application.
Tips
• To disable a specific pop-up tutorial, select the Don't Show Again check box
before you close it.
• To disable all pop-up tutorials, click the Help button
click Shut Off All Pop-up Tutorials.
• To enable all pop-tutorials after you have shut off one or more, click the Help
button on the toolbar and click Reset All Pop-up Tutorials.
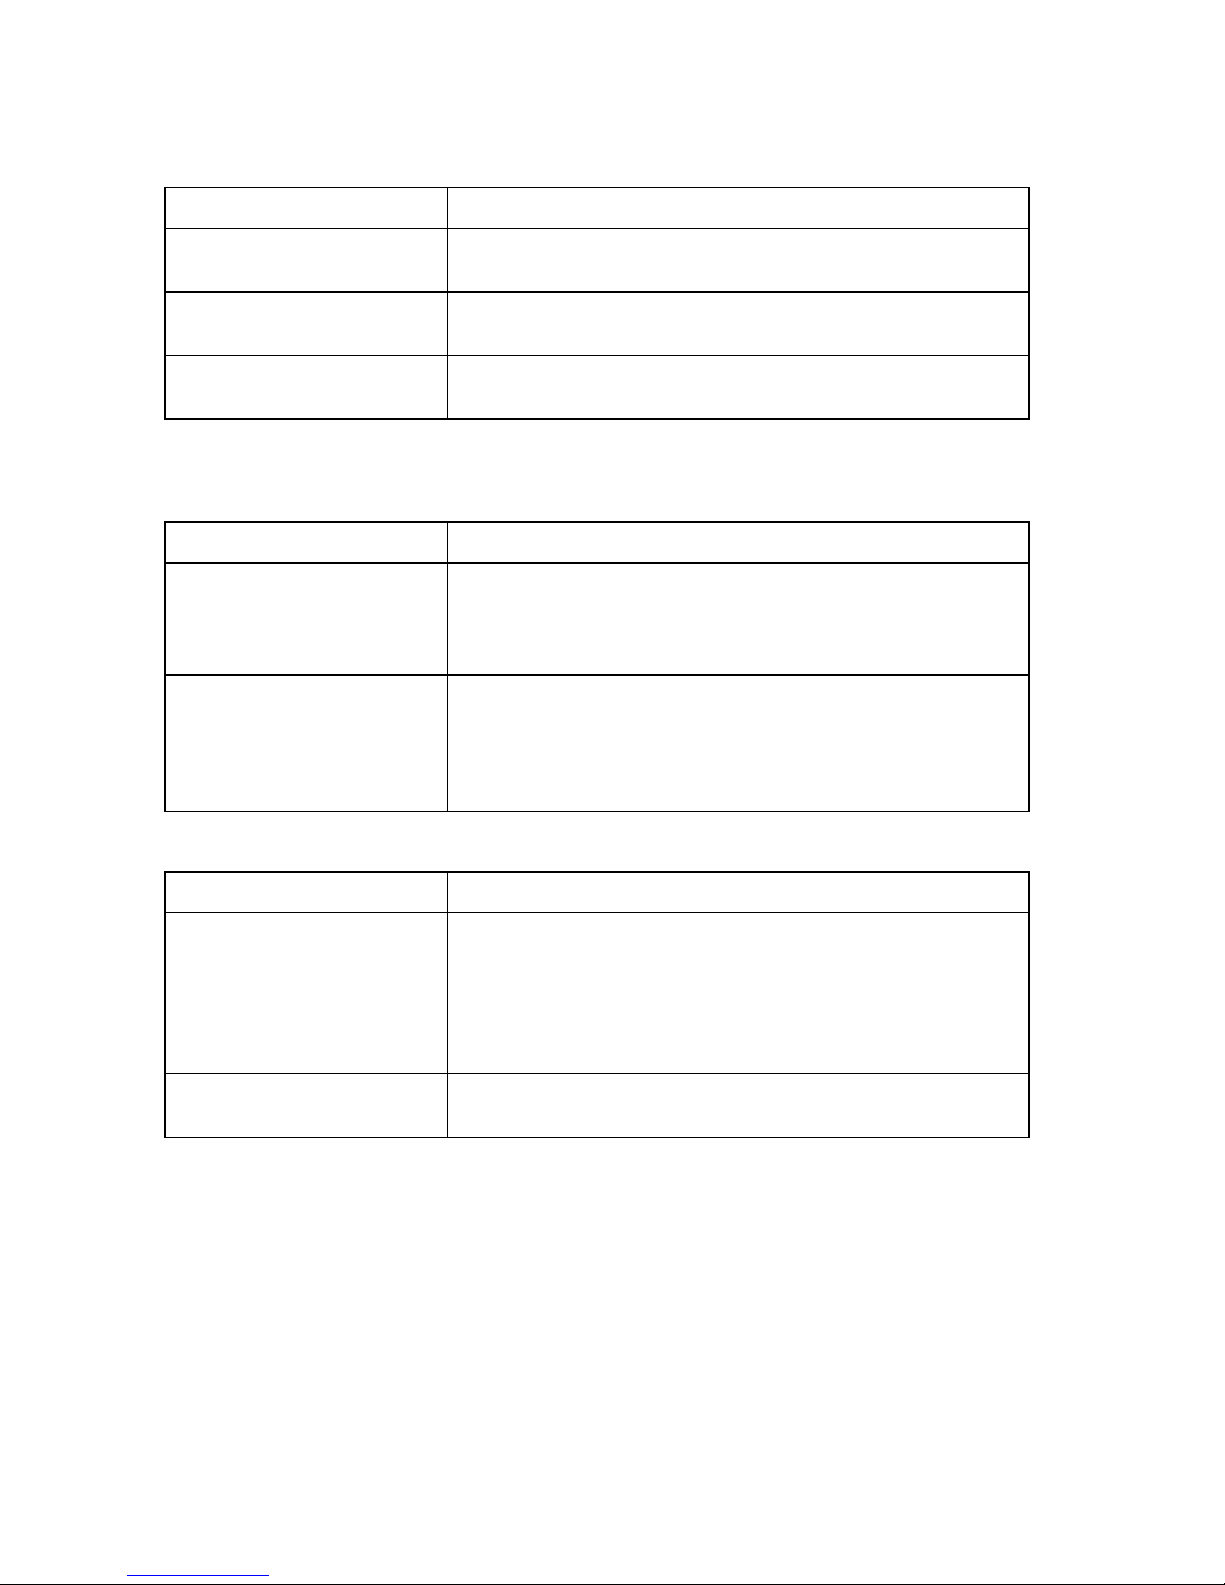
on the toolbar and
Control Panel
If you want to... Use this tip...
Zoom the map out/in
quickly
Pan the map quickly Position your cursor on the edge of the map; it
Update the coordinate
format that displays in
the Control Panel
View the last map center Press the middle button in the Compass Rose in the
Drag the map cursor in an up-left direction to zoom
the map out or drag it in a down-right direction to
zoom the map in.
becomes a white hand that you can use to drag the
map to the new location.
Update your measurement preferences at any time
using the Display tab in the Options dialog box.
Control Panel to center the map on the previous map
view. This button performs an undo function for the
last pan or zoom (up to 256 times).
Draw
If you want to... Use this tip...
Create a route using a
road or trail you have
added to the map with
the Draw tab
10
When drawing a routable road/trail, click each existing
road it crosses to ensure that you can route on the
new road/trail. When you open a track you've
imported from your GPS device, join the imported line
with existing lines by right-clicking each intersection
and selecting Manage Draw/Join.
Page 19
Find
If you want to... Use this tip...
Getting Started
Modify a Find search
result
Find a custom point of
interest (such as a
Chinese restaurant)
when performing a GPS
radar search in Find
Right-click a result item in the Find tab to add it as a
MapNote, insert it as a stop in your route, copy the
information to your clipboard, and so on.
You can use the Custom option to find other
categories besides those listed, or to find multiple
categories at once.
GPS
If you want to... Use this tip...
View a GPS log on the
map
Use the Draw tab to import a GPS log file and view it
as a line object on the map.
Handheld Export
If you want to... Use this tip...
Modify the export area
in Handheld Export
When you click Preview, the default export area for
the location you selected displays on the map as
shaded rectangles. Click Select to confirm the area.
To edit the area, click the Select/Edit tool and then
click the map to add or remove rectangles to/from the
export area.
Info/NetLink
If you want to... Use this tip...
Quickly view information
for a location on the
map.
Hover your cursor over objects on the map to see
information (such as road names, city/town, details
about draw objects, etc.) in the status line that
appears at the bottom of the map, just above the tab
area.
Map Data
If you want to... Use this tip...
Learn how to add route
and/or draw layers to
your project
Add existing route and/or draw files to your project by
clicking the Add button and selecting the Draw File
or Route File option.
11
Page 20
XMap User Guide
Measurement Tool
If you want to... Use this tip...
Measure the
area/perimeter of a
location on the map
Use the measure tool to draw a polygon on the map
and determine its area and perimeter. Just click pointby-point to draw the polygon on the map and then
double-click to close the polygon. The area and
perimeter display in the center of the polygon.
Phone
If you want to... Use this tip...
Get all of the phone
listings for a particular
road.
Note The Phone tab in XMap requires DeLorme Phone Data (available separately
from DeLorme). For information on purchasing DeLorme Phone Data, click NetLink,
visit www.delorme.com, or call DeLorme Direct Sales at 800-561-5105.
You can right-click the map on a road to view phone
listings for that road.
Print
If you want to... Use this tip...
Stop a page in a multipage map from printing
If you do not want to print all the pages in a multipage map, on the Layout graphic, click each page you
do not want to print.
Route
If you want to... Use this tip...
Reorder inserted stops Reorder your inserted route stops using the Advanced
features in the Route tab.
Create a route quickly For quick route creation, right-click the map and
select one of the Create Route options or use the
Route buttons on the toolbar.
Reorder the columns in
the Route Directions list
Determine the difference
between adding and
inserting stops and vias
View information about
your second turn
Click the Directions list column headers to change
the column order.
Added stops/vias are placed in the order you add
them to the route. Inserted stops/vias are placed in
the order you would approach them between the Start
and Finish points of the route.
Click the Show Turns button when GPS tracking to
view information about the following turn.
12
Page 21
Tab Area
If you want to... Use this tip...
Getting Started
Adjust the size of the
tab area
Show, hide, or reorder
tabs
Import or export a tab
configuration file
Adjust the size of the tab area by dragging the top or
right side of the tab area.
Use the Tab Manager option in the Help menu to
show, hide, or reorder tabs.
Use the Tab Manager option in the Help menu to
import or export a tab configuration file
Voice
If you want to... Use this tip...
Create new speech
recognition profiles
Learn how to make the
microphone more
sensitive to your
commands in noisy
environments
You can create a new speech recognition profile for
each of your working environments (noisy, quiet) and
users (your spouse or child) by clicking the Speech
settings in the Windows Control Panel.
If there is background noise while you are speaking, it
may be helpful to precede all of your voice commands
with a special phrase (like Simon Says). See the Voice
Settings tab of the Options dialog box.
XData
If you want to... Use this tip...
Geoplace XData records
that do not have
complete address
information or were not
correctly located during
the import process
Add a blank record to
your XData database
You can drag a record from the Query list and place it
at the correct geo-location on the map.
To add a blank record to an XData database, you
must select All Records as the Table Display type.
Migrating Data to the New DeLorme Docs Locations
In previous versions of XMap, and in other DeLorme products, your projects, draw
files, route files, log files, XData files, imagery, and other DeLorme files were stored
by default in the DeLorme Docs folder on the root of your computer's C drive unless
you specified a different directory during installation.
In XMap 6:
• The DeLorme Docs folder for all files except NetLink downloads is located in
the My Documents (Windows XP) or Documents (Windows Vista) folder under
your user name.
13
Page 22

XMap User Guide
• The DeLorme Docs folder for NetLink downloads is located in the DeLorme
Docs folder under Shared Documents (Windows XP) or Public Documents
(Windows Vista). This allows all users on the computer to access NetLink
downloads.
What is Migration?
The migration process does not move your files—it copies them to the new locations.
When you are sure your files are working correctly in the new locations, you can
delete them from the old locations as long as you are not using them for another
DeLorme program. For example, if you have an imagery file you use in a previous
version of XMap or in Topo USA or XMap, keep both files. Eventually, all DeLorme
programs will be moved to the new file system.
Because all new information you add to a project will be saved to the new file
location—even if you open it from the old location, we strongly recommend that you
migrate your files. If you do not, you could have project data in two DeLorme Docs
locations; your project will work correctly, but your data will not all be in the same
location.
Initial Migration
The initial migration process, which occurs when you open XM ap 6 the first time,
copies the data in the existing NetLink Downloads, Symbols, and GPSLogs folders to
their new locations as indicated above.
Note The automatic migration process copies files from only one existing DeLorme
Docs location. If you have more than one DeLorme Docs location on your computer,
only one location will be recognized
New Users
When you installed XMap 6 on your computer, you were asked if you had previously
installed a DeLorme program. If you had not, you clicked New User and the
application opened. The migration process does not apply to you if you have never
installed a DeLorme program on your computer.
Existing Users
When you open XMap 6 for the first time after installation, your computer is scanned
for an existing DeLorme Docs directory. If a DeLorme Docs directory is found, any
data in the existing NetLink Downloads, Symbols, and GPSLogs folders was copied to
their new locations as indicated above.
If an existing DeLorme Docs folder is not automatically detected on your computer,
you were asked if you had previously installed a DeLorme program. If you had, you
clicked Existing User which opened a dialog box for browsing to the existing DeLorme
Docs location and choosing one of the following migration options:
• Migrate–The data in the NetLink Downloads, Symbols, and GPSLogs fo lders
was migrated to their new DeLorme Docs locations.
• Don't Migrate–The migration was cancelled and any data in the NetLink
Downloads, Symbols, and GPSLogs folders was not migrated. You will not be
prompted to migrate again.
• Try Again Later–Cancels the migration, but you are prompted to migrate the
next time you open XMap. You will be prompted each time you open the
program until you select Migrate or Don't Migrate.
14
Page 23

Getting Started
Project Migration
When you migrate a project, all associated files (routes, draw layers, XData sets, and
connections to GIS layers in a database) are moved with it. When you open a project
from any location other than the new DeLorme Docs location, you are prompted to
migrate it. You can also directly migrate projects.
To Migrate a Project When You Open It
Use the following steps to migrate a project when you open it.
1. Open a project.
2. When the Migrate Project dialog box opens, click Migrate.
The Migration Completed dialog box opens. Go to step 4.
OR
If a file with the same name already exists in the new DeLorme Docs location,
the Confirm Link to Existing File dialog box opens. Go to step 3.
3. Click Link to replace the project link to the existing file in the new location
and then go to step 4.
OR
Click Link All to replace any project links to existing files in the new location
and then go to step 4.
OR
Click Save Copy to maintain the project link to the current file and save it
with a different name.
OR
Click Cancel to stop the migration process and roll back any file migration
that has occurred up to this point.
4. In the Migration Completed dialog box, click OK to open the migrated project.
Note If there is a problem with the migration, a message will notify you of
any corrective action you need to take.
To Directly Migrate a Project
Use the following steps to migrate a project at any time.
1. Click the arrow next to the Open button
Migrate Project.
OR
Click the Map Data tab, click File, and then click Migrate Project.
The Migrate Project dialog box opens.
2. Browse to the project you want to migrate, click the project, and then click
Migrate.
3. The Migration Completed dialog box opens. Go to step 5.
OR
If a file with the same name already exists in the new DeLorme Docs location,
the Confirm Link to Existing File dialog box opens. Go to step 4.
4. Click Link to replace the project link to the existing file in the new location
and then go to step 5.
OR
Click Link All to replace any project links to existing files in the new location
and then go to step 5.
OR
on the toolbar and then click
15
Page 24

XMap User Guide
Click Save Copy to maintain the project link to the current file and save it
with a different name.
OR
Click Cancel to stop the migration process and roll back any file migration
that has occurred up to this point.
5. In the Migration Completed dialog box, click Open to open the migrated
project or Close to close the dialog box and return to your last active project.
Note If there is a problem with the migration, a message will notify you of
any corrective action you need to take.
16
Page 25

Getting Started
Basic Functions
Zooming In and Out
You can use the drag and zoom feature, zoom tools, or the data zoom level (Data
zoom level is the relationship between what you see in a map view and how it exists
in reality. It is the amount of geographic data displayed on a computer monitor. The
data zoom level is similar to the traditional fractional relationship expressed on paper
maps. For example, 1:24,000, 1:100,000, 1:500,000, and so on.) to quickly change
the zoom level of the map view.
Notes
• Increasing the data zoom level number shows a smaller geographic area at
greater detail.
• Decreasing the data zoom level number shows a larger geographic area at
lesser detail.
• If you view both the right (primary) and left (secondary) maps at different
data zoom levels, a box (or lines, depending on the current data zoom level)
displays on the map that is zoomed out the furthest. The box/lines indicate
the area that is in view on the other map. You can disable this feature by
clearing the Show Ref check box at the top of the secondary map window.
• If you view the right and left maps at the same data zoom level but they are
not equally represented on the screen (50/50), a box (or lines) displays on
the map that is covering the most screen area. The box/lines indicate the
area that is in view on the other map.
To Drag and Zoom In
Use the following steps to zoom in either the right or left map.
1. Click and hold down the left mouse button as you drag the mouse in a downright direction on the map to encompass the area you want to display. A view
box displays on the screen and changes dimension as you move the mouse. A
label displays the data zoom level at the current map center.
2. Once you reach the map area or data zoom level you want to display, release
the mouse button. The area you selected fills the map window, the map recenters, and the map view adjusts to show the appropriate level of detail.
Tip You can move the view box to another location by pressing the SHIFT
key at anytime during this procedure.
To Drag and Zoom Out
Use the following steps to zoom in either the right or left map.
1. Click and hold down the left mouse button as you drag the mouse in an upleft direction on the map. A staircase with a small circle displays on the
screen.
2. Continue dragging the mouse in an up-left direction. The small circle moves
up the steps, one step per data zoom level. A label displays the data zoom
level to the bottom-right of the staircase.
3. Once you reach the data zoom level you want to display, release the mouse
button. The map view adjusts to display the appropriate level of detail. The
map center is retained on your screen.
17
Page 26
XMap User Guide
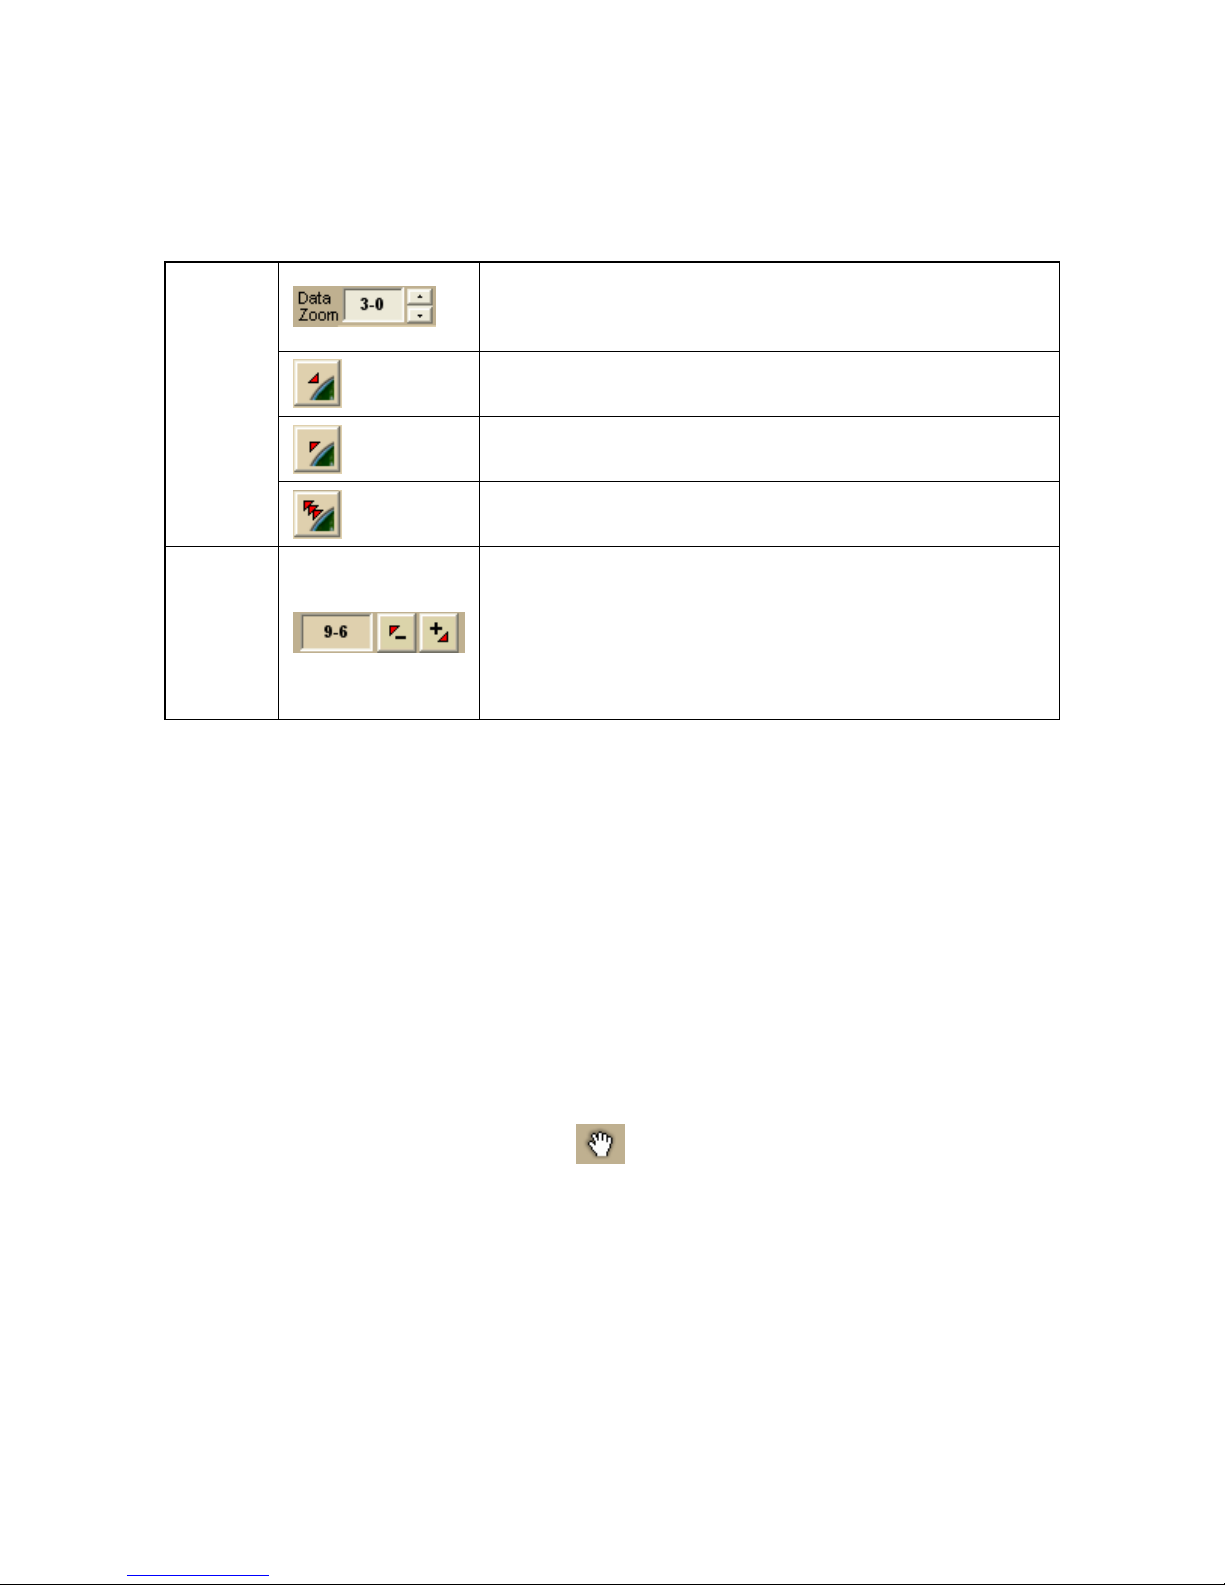
To Zoom In/Out Using the Zoom Tools
There are two sets of zoom tools. The zoom tools for the right map are located in the
Control Panel. The zoom tools for the left map are located at the top of the left map
view.
Click the up arrow to zoom out one minor data zoom
level at a time. Click the down arrow to zoom in one
minor data zoom level at a time.
Right
Map
Controls
Click the Zoom In 1 tool to increase the detail
number to the next full level.
Click the Zoom Out 1 tool to decrease the detail
number to the next full level.
Click the Zoom Out 3 tool to decrease the detail
number by three full levels.
Click the plus button to increase the detail number to
the next full level.
Left
Map
Controls
Click the minus button to decrease the detail number
to the next full level.
The data zoom level of the left map displays in the
text area to the left of the buttons.
Tips
• Press ALT+PAGE UP on your keyboard to zoom out to the next full data zoom
level. Press ALT+PAGE DOWN on your keyboard t o zoom in to the next full
data zoom level.
• Use the mouse wheel to zoom the map in and out. Rotate the mouse wheel to
zoom in by individual data zoom level steps or hold the SHIFT key while
rotating the mouse wheel to zoom to the next full data zoom level.
Panning/Centering the Map
Use any of the following methods to pan (move) or center the map.
• Click anywhere on the current map view. The point you click becomes the
new map center.
• Double-click a layer name in the GIS workspace.
• When you point near the map edge, a white hand displays. Drag the hand to
move the map in that direction.
• Click the Grab and Pan button
on the toolbar to drag/pan the 2-D or 3-
D map in any direction.
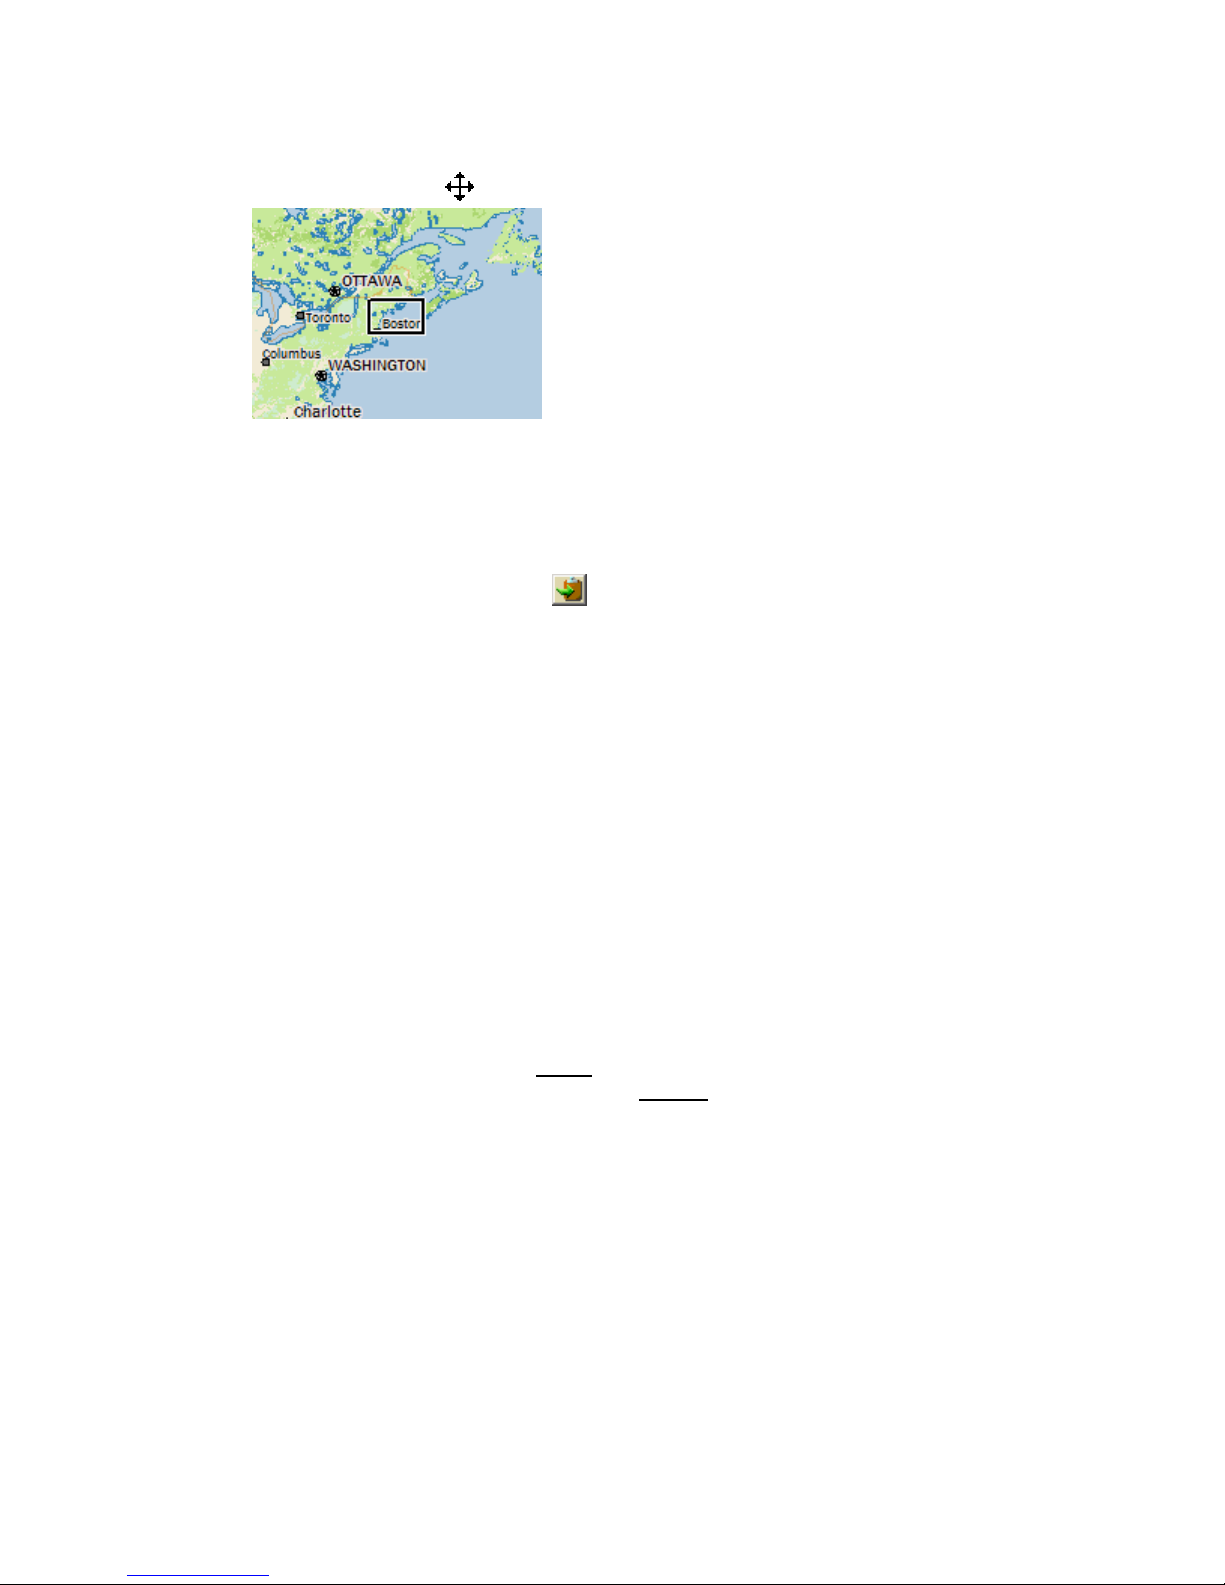
• Click anywhere on the overview map. The point you click becomes the new
map center. This allows you to traverse greater distances with each mouse
click than you can within the main map.
18
Page 27
Getting Started
• Point anywhere on the black view box in the overview map window. When the
pointer becomes a
, drag the view box to the new location.
• Use the search features in the Find tab to center the map on a particular
location.
• Assign shortcut keys to pan the map up, down, left, or right in small
increments.
Copying Your Map to the Clipboard
Click the Copy to Clipboard button on the Print tab to copy your map to the
clipboard. You can then paste it into a graphics program such as Microsoft® Paint or
Adobe® Photoshop®.
You can also right-click anywhere on the map and click Copy Map to Clipboard.
Saving a Map as a Bitmap or JPEG Image
You can save the current map view as a bitmap (.bmp) or J PEG (.jpg) image in all
page layout formats: Single, 2 x 2, and 3 x 3. If you select a multi-page format, all
the active pages are saved as individual bitmaps or JPEGs. The file name is the
specified file name with an incremental page number at the end.
See Printing a Map for information about printing a map without saving it as a file.
To Save a Map as a Bitmap or JPEG
Use the following steps to save a map as an image.
1. Locate the area on the map that you want to save as an image.
2. Click the Print tab and then click the Map subtab (if it is not already
selected).
3. Under Map, select Left, Right, or Both.
4. Under Print Layout, select Page
size specified in the Setup options) or Screen
(the map print area is based on the paper
(the map print area is based on
the screen size).
The print area for a Page map displays as a red box and the print area for a
Screen map displays as a blue box on the overview map.
5. If you selected Page in step 4, the following options are available.
• Under Print Layout, select a layout option (Single, 2 x 2, or 3 x 3).
The print area displays on both the Map and the Overview Map. In the
example below, 2 x 2 is selected. This means the print area
encompasses four standard pages at whatever paper size you specified
in the Setup options. You can assemble a multipage map into a large
19
Page 28

XMap User Guide
map.
• If you selected 2 x 2 or 3 x 3 and do not want to save all the pages in
the multipage map on the map layout graphic, click each page you do
not want to save. The page appears dimmed or gray. In the example
below, page 4 will not print.
• Verify this is the location and photo zoom you want to save. If not,
pan the map to the location and zoom to the level you want.
Note Changing the photo zoom enlarges/reduces the map features
and changes the map area that you save as an image. If you increase
the photo zoom level, map text, lines, symbols, etc. are larger and
your map area is reduced. If you decrease the photo zoom level, map
text, lines, symbols, etc. are smaller and your map area is enlarged.
The reduction/enlargement percentages for your photo zoom level
display under the Photo Zoom drop-down list.
• If you want to use other tabs and functions but not lose your current
print area, print photo zoom, or other settings, select the Lock Print
Center check box. This locks the print area and changes the tab label
to red.
• Add text or graphics to your map.
• Select the Print Preview check box to zoom the map and view the
entire area that will be saved as a bitmap image. Clear the check box
to return to your previous data zoom level.
6. Click the Save button
.
The Save 2D Map Image dialog box opens.
7. Type the file name in the File Name text box, select to save the file as a
.bmp or .jpg from the Save as Type drop-down list, select the DPI (dots per
inch) value (optional), and click Save.
Measuring Distance and Area
Use the Measure tool on the toolbar to measure linear distance and area on
the map based on the units chosen in the Display tab of the Options dialog box.
The snap function snaps (attaches) the point of a measurement line to a point on a
road or another measurement object. This ensures a more accurate measurement of
distance or area.
The snap function is essential when measuring area. To measure area, you must
completely enclose the area by snapping your finish point to your starting point.
20
Page 29
Getting Started
Notes
• The measure tool is the best way to measure short distances on the map. If you
want to measure the distance of a road, try creating a route. If you want to
measure a large area on the map, use the area object tools in the Draw tab.
• To disable the auto-snap function, hold down the ALT key on your keyboard
while using the Measure tool.
• Measure objects (lines and areas) are saved with the current project. When you
create a new project, the measure objects do not display. If you want the same
measure objects on your new project, you must recreate them.
• To view information about a measurement line, right-click it and click Info. The
measurement information is automatically displayed in the Info tab.
To Measure Distance or Area
Use the following steps to measure linear distance or area on the map.
1. Verify you have the correct units of measure selected in the Display tab of the
Options dialog box. For more information, see Setting Units of Measure
Preferences.
2. On the toolbar, click the Measure tool
. The pointer changes to .
3. Click point-by-point to draw a measurement line on the map. A text box
displays next to your pointer indicating the total distance of the measurement
taken.
Note When you pass over a point in a road, measurement line, or
measurement area to which you can snap, a yellow circle
defines the snap
point. Click to snap the point of the measure line to the road or measurement
object's point coordinate.
4. To end a measurement line, double-click the last point of the measurement
line.
OR
Click the last point of your measure line or area and then click the Measure
tool on the toolbar.
The measure line is a two-pixel wide yellow line and th e total length of the line
is displayed in a label at each endpoint of the line.
5. To end a measure area, hover over the starting point until the yellow snap
circle
displays, and then double-click the last point to the starting point. The
closure area is transparently shaded, and the area and perimeter
measurements display.
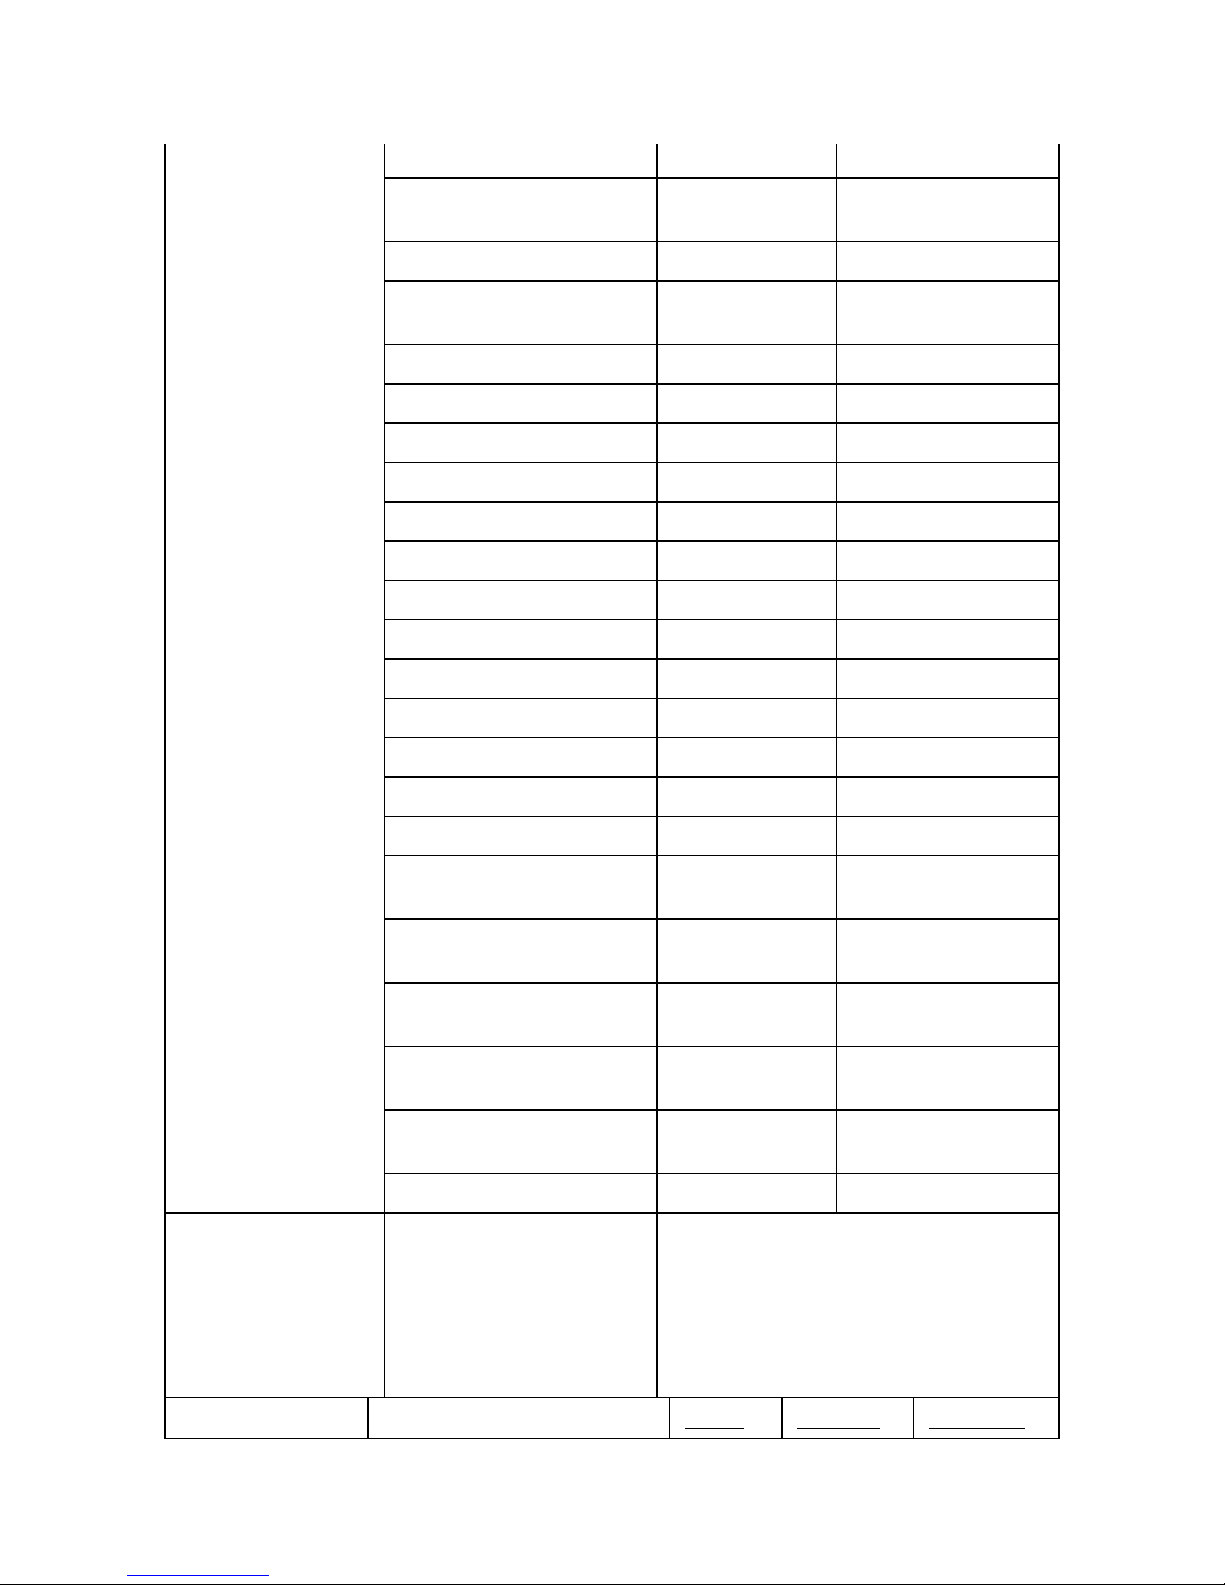
Chart of Supported Coordinate Formats
These are the supported search formats. Sample coordinates are for Yarmouth,
Maine.
Tip Examples of search formats are listed in the Advanced search drop-down text
boxes along with a history of your most current search criteria.
Coordinate
QuickSearch Advanced Search
Format
N 43 48 30, W70 9 52 N 43 48 30 W70 9 52 Latitude/Longitude
N 43 48.4910, W 070 N 43 48.4910 W 070 09.8440
21
Page 30
XMap User Guide
09.8440
N434829.4600,
N434829.4600 W0700950.6400
W0700950.6400
N43-48-30, W70-9-52 N43-48-30 W70-9-52
N 43:48:29.46, W
N 43:48:29.46 W 70:9:50.64
70:9:50.64
4348, -7009 4348 -7009
4348N, 7009W 4348N 7009W
N4348, W7009 N4348 W7009
4348n, 7009w 4348n 7009w
n4348, w7009 n4348 w7009
4348 N, 7009 W 4348 N 7009 W
N 4348, W 7009 N 4348 W 7009
4348 n, 7009 w 4348 n 7009 w
n 4348 w 7009 n 4348 w 7009
434829, -700950 434829 -700950
4348.491, -7009.844 4348.491 -7009.844
4348.491, -7009.844 4348.491 -7009.844
434829.46, -700950.64 434829.46 -700950.64
43.80818333, -
70.16406667
43 48.4910 N, 70 09
50.64 W
43 48.4910 n, 70 09
50.64 w
N 43 48.4910, W 70 09
50.64
434829.46 N,
700950.64 W
43, -70 43 -70
MGRS/USNG 19TDJ 06354 51187
19TDJ0635451187
(NAD27)*
19TDJ06355109
19TDJ064511
19TDJ0651
43.80818333 -70.16406667
43 48.4910 N 70 09 50.64 W
43 48.4910 n 70 09 50.64 w
N 43 48.4910 70 09 50.64 W
434829.46 N 700950.64 W
Same as QuickSearch
UTM/UPS 19T 0406311E 4850964N Zone: Easting: Northing:
22
Page 31
Getting Started
19T 0406311E 4850964N
19T 0406311 4850964 Zone:
19T
19T / 0406311 / 4850964 Zone:
19T
SPCS ME-W 0500490 0355150 Zone:
ME-W
Easting:
0406311
Easting:
0406311
Easting:
0500490
Northing:
4850964
Northing:
4850964
Northing:
0355150
* Use this example for USNG with non-standard datum.
Searching Tips
When you use the Quick Search subtab on the Find tab or the Route tab to search for
a location, you must enter the information in a specific format.
Tips
• Use punctuation as in the examples in the table below.
• Do not use periods.
• Search with the minimum amount of information to increase the number of
results. For example, if you are searching for a road, and you are not sure of
the spelling, type in part of the name and then scroll through the list of
results until you find a match.
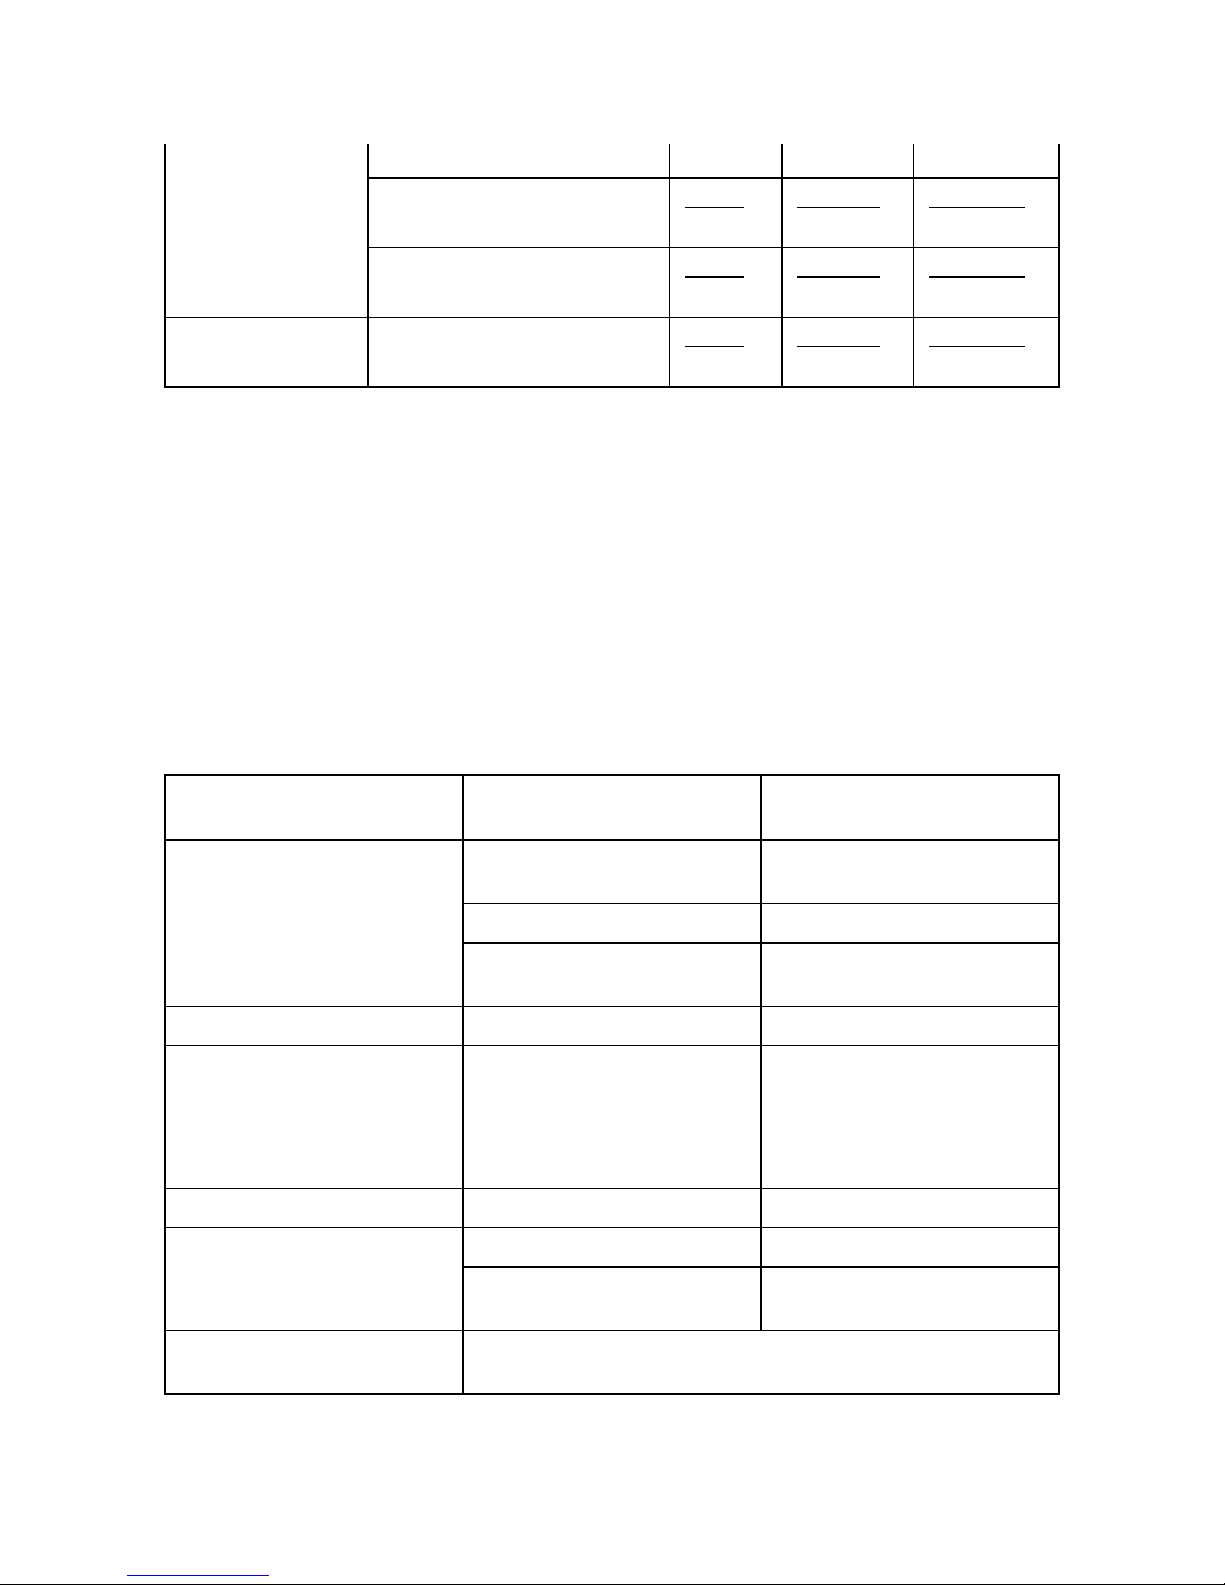
This table shows formats for search types.
For this type of
Use this format... Example
search...
Address
Street address, City,
State
100 Baxter Blvd, Portland,
ME
Street address, ZIP Code 100 Congress St, 04101
Street address, City,
State, ZIP Code
100 Congress St,
Portland, ME 04101
City City, State Atlanta, Georgia
ZIP/Postal Code Within the U.S.: #####
(5-digit ZIP Codes only)
04096
J8E756
or
Within Canada: ### 6digit Postal Codes only)
Minor Point of Interest POI name, City, State Subway, Columbus, OH
POI/landmark name Mount Rushmore Major Point of Interest or
Landmark
POI/landmark name,
Space Needle, WA
State
Latitude/Longitude See Chart of Supported of Supported Coordinate
Formats
23
Page 32

XMap User Guide
For more information about the Find tab, see the Help topics under Finding a
Location on the Map.
About the Interface
Tab Area
You can access most of the application's functions from the tab area at the bottom of
the screen. To access Help for a specific tab, click the Help button
You can also reorder the tabs, show or hide individual tabs or show or hide the tab
panel.
• Map Data
• GIS
• Find
• Print
• Phone
• Draw
• GPS
• Voice
• Route
• Profile
• 3-D
• Info
• NetLink
• ImageReg
• Handheld Export
• XData (Hidden by default. Use Tab Manager to view the tab.)
on the tab.
Control Panel
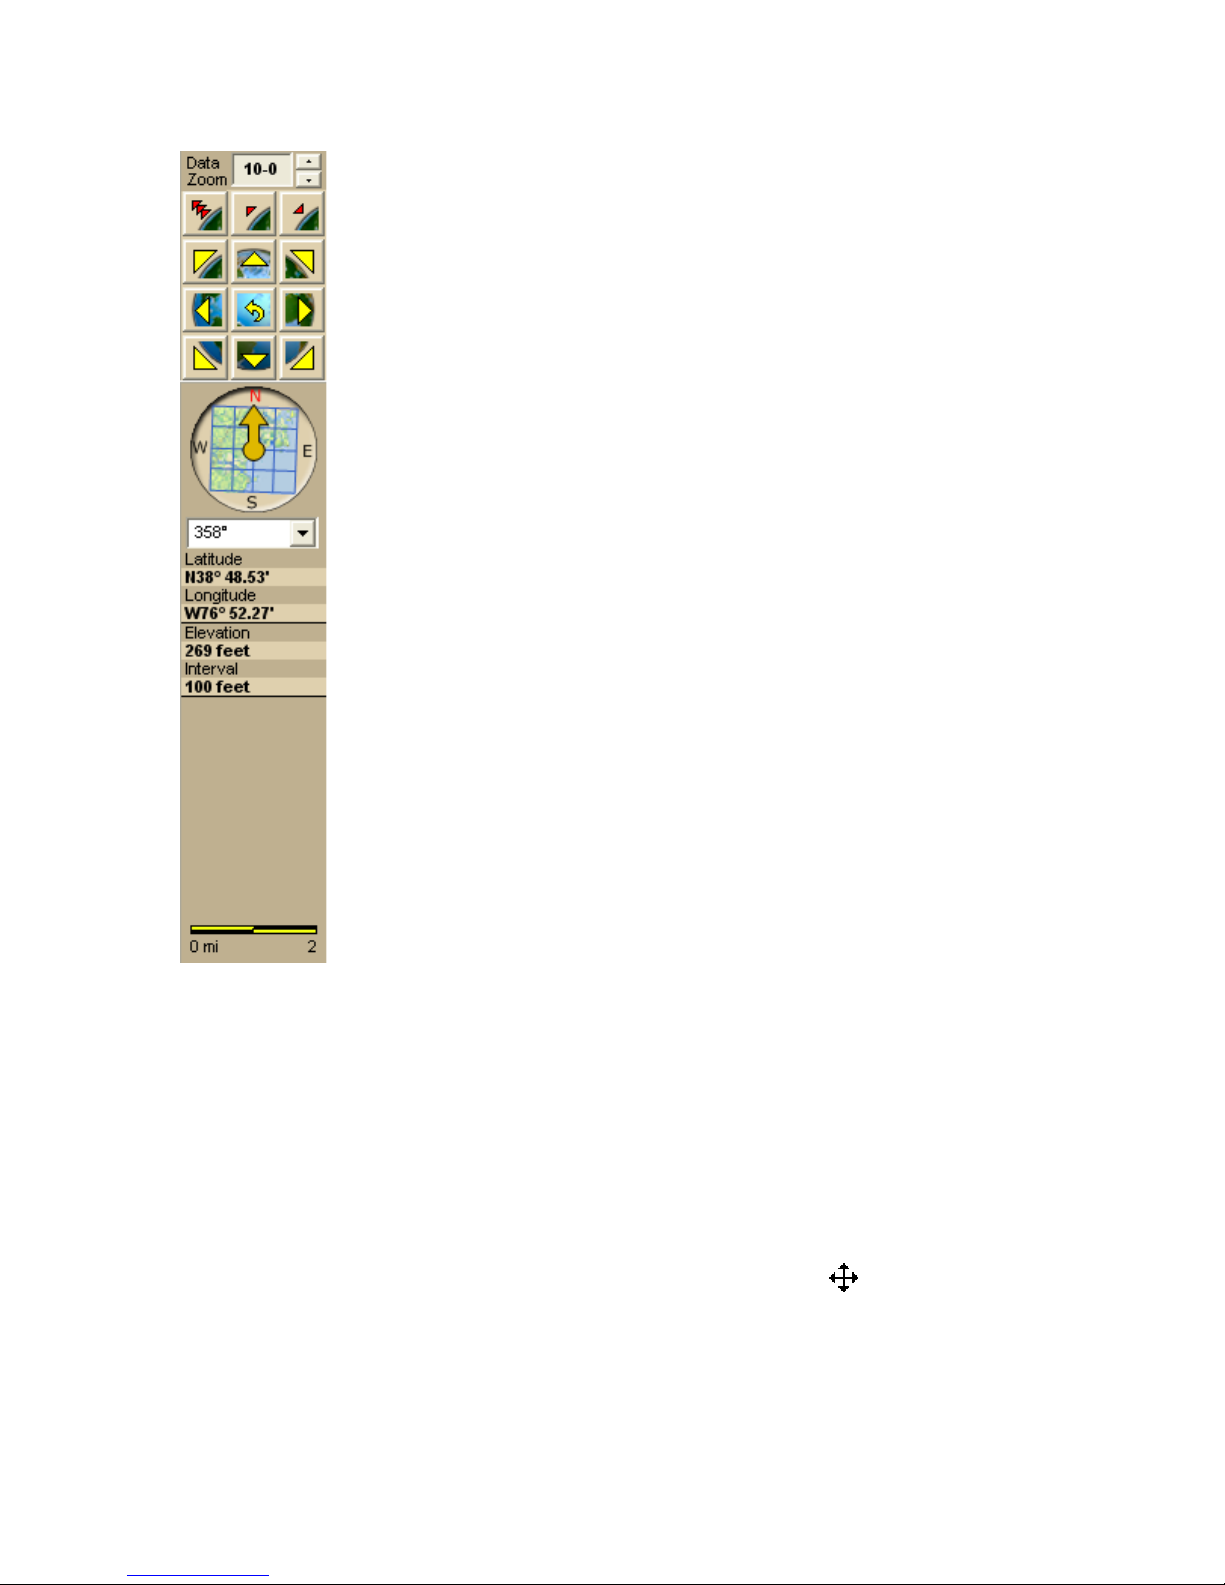
The Control Panel, located to the right of the map view, displays information
pertinent to the current map view and map cursor position. It also includes zoom and
map pan buttons.
You can customize your interface to show or hide the Control Panel.
24
Page 33
Getting Started
Data Zoom Level—The current data zoom level of the map
view; ranges between 0-0 (maximum zoom out) and 20-0
(maximum zoom in).
Zoom Tools—Buttons that quickly zoom out three levels, out
one level, or in one level. For more informatio n, see Zooming In
and Out.
Compass Rose—A group of nine buttons on a globe. The outer
buttons have yellow arrows; click one of the arrow buttons to
pan the map in that direction. Click the middle button to center
the map on the previous map view. This button performs an
undo function for the last pan or zoom (up to 256 times).
Map Rotation Tool—The arrow in the graphic indicates True
North in relation to the rotated map. Use the Map Rotation Tool
to rotate the map in any direction. You can rotate the map by
clicking or dragging the square map graphic in the direction you
want or by selecting/typing the degree of map rotation from the
drop-down list.
Map Coordinates—Coordinates for the current map cursor
position display based on the units of measurement preferences
chosen in the Display tab of the Options dialog box.
Elevation and Interval—Display in the measurement chosen in
the Display tab of the Options dialog box. The data zoom level
affects interval display.
Scale Bar—Indicates the distance one scale bar unit equals in
the measurement chosen under in the Display tab of the Options
dialog box.
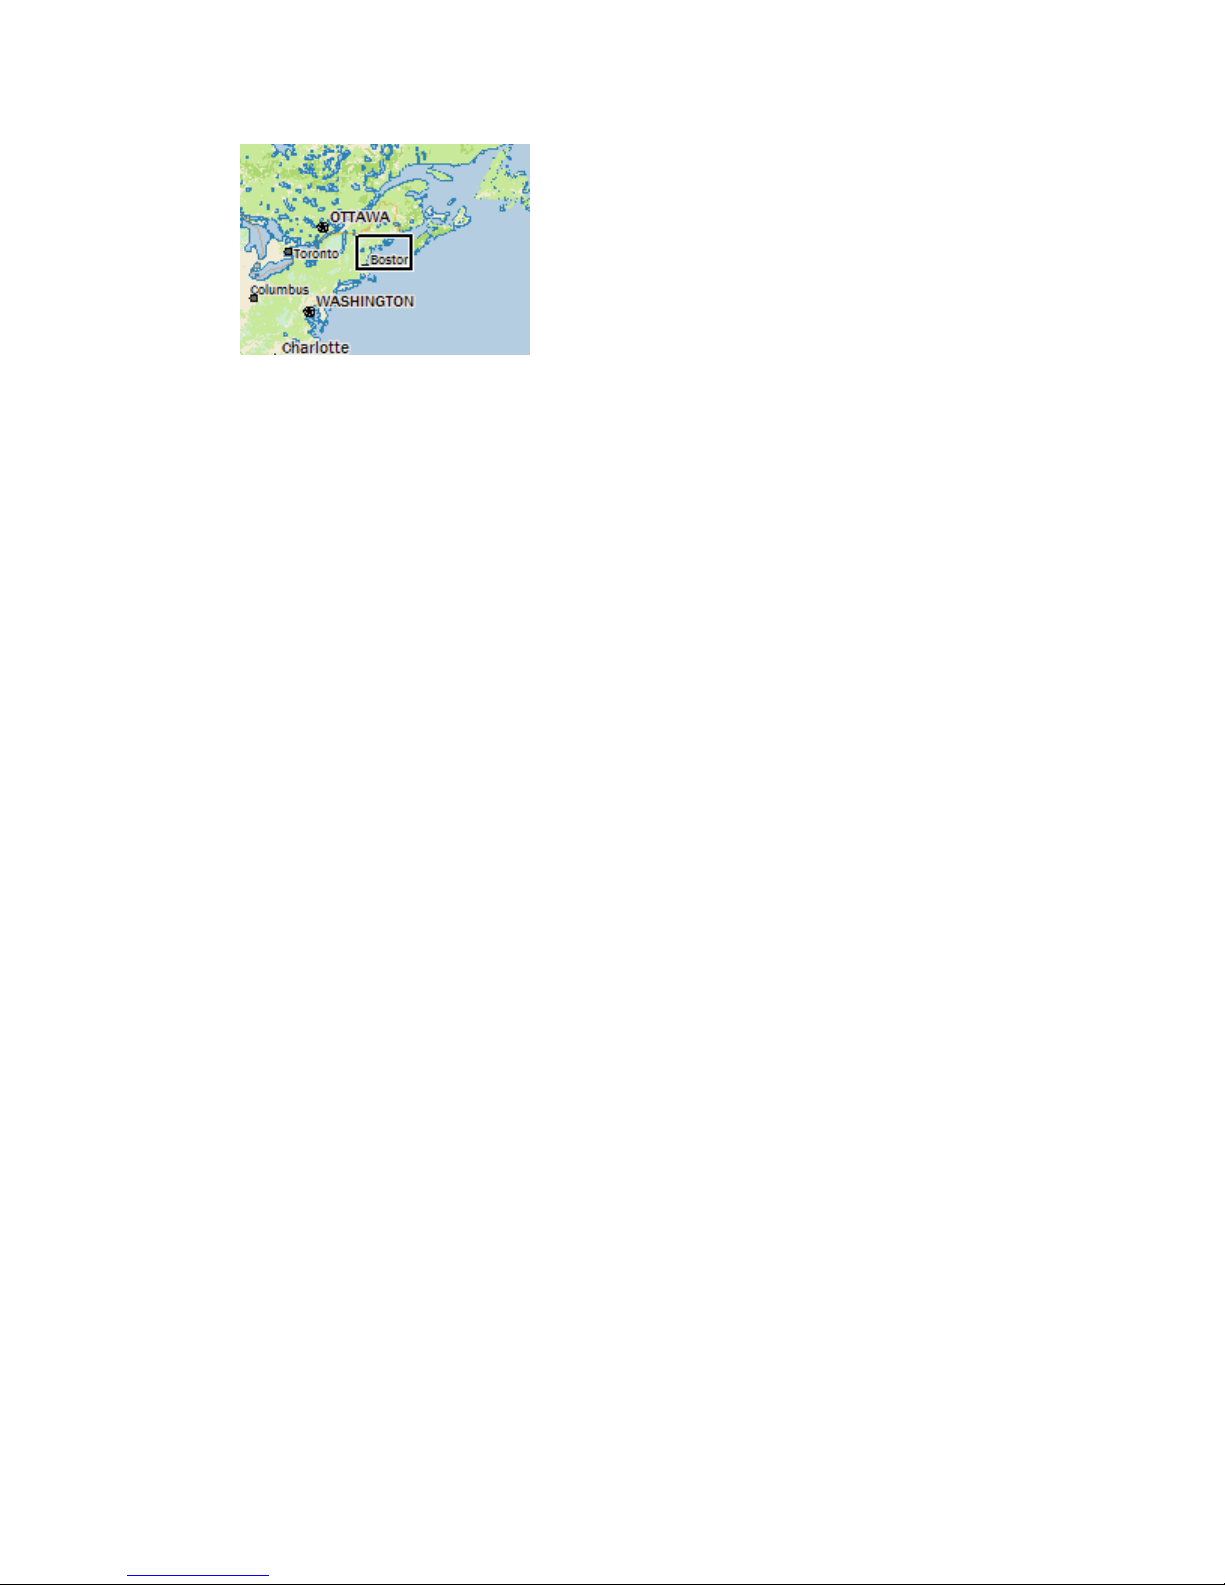
Overview Map
The overview map is a small map in the lower-right corner of the screen that offers a
wide-angle view of your current map view area. It is approximately three data zoomlevels out from the current map view.
Tips
• Click anywhere on the overview map and that point becomes the new map
center. This allows you to travel greater distances with each mouse click than
you can within the larger, current map view.
• Use the black view box in the overview map window to pan the map. Point
anywhere on the view box. When the pointer becomes a
box to the new location.
, drag the view
25
Page 34
XMap User Guide
Toolbar
Use the toolbar to perform many functions in the application without navigating
through the tab area.
*These tools are available only in XMap Editor and XMap Enterprise.
**These tools appear only when an active database subscription exists.
Exchange
• Exchange routes, waypoints, or tracks with a GPS or PDA.
Note The GPS and Exchange groups are combined into the GPS/Exchange
group in XMap Professional.
GeoTagger
• Combine images and data with GPS information on the map.
GIS Layer Management
• Import a layer into a database from a file or ArcSDE database.
• Add and remove layers from your workspace, delete layers from the source
database, or remove a database reference.
GIS Tools
• Select a layer from your workspace as the active layer.
• Save all your changes to the active layer.*
• Select geometries on the map without risk of accidental editing.
• Analyze the topographical relationship of lines based on their attributes.
• Move or change the size of a geometry.*
• Edit points in a polygon/line layer.*
• Rotate a geometry.*
• Add geometries to a layer.*
• Build polygon, line, or point geometries by coordinates, angle/distance
measurements, or bearing/distance measurements.*
• Modify the class for a selected geometry or automatically create geometries
as with a specified class.*
GPS
• Start or stop your GPS connection (also available on the GPS tab).
• Turn GPS NavMode on or off.
Note The GPS and Exchange groups are combined into the GPS/Exchange
group in XMap Professional.
26
Page 35

Getting Started
Map Navigation
• Recenter the map and zoom it in and out.
• Grab and pan the map in any direction.
Map Tools
• Measure linear distance and area on the map based on the units chosen in the
Display tab of the Options dialog box.
• Get information about a location on the map. You can also right-click a
location on the map and click Info.
• Profile a linear object on the map. You can also select the Profile tab, rightclick the linear object on the map and then click Profile.
MapShare/Portable Maps
• Share maps, route directions, or profiles with friends, family, or associates
with MapShare using the Internet.
• Launch the Earth Community Atlas wizard.
• Send static maps to your iPod with Portable Maps.
Options/Help
• Open the Options dialog box to set GPS, display, map feature, voice
navigation, 3-D, handheld export, and keyboard shortcut preferences. This is
also available in the tab area on the GPS, 3-D, and Handheld Export tabs).
• Open the Help menu to access the XMap Help topics, Map Legend, and more.
Print
• Print your current map screen. See the Print tab for more printing options.
• Quick print with the current Print tab settings.
Project
• Create, save, and/or open projects. You can also access these options on the
Map Data tab.
Redline/Sync Tools
• Redline/mark up a GIS layer.**
• Refresh subscription layers and send redline layers to the source database.**
• Add all of the layers that are in the active subscription to your workspace.**
Route
• Set route start, finish, and stop, and via points and calculate a route. You can
also access these options from the Route tab.
Undo/Redo
• Undo/redo your last GIS edit and measure tool actions.
Notes
• Not all of the toolbar features are activated by default. To modify which toolbar
items you want to view, right-click the toolbar. Toolbar options with selected
check box next to them are currently displayed on the toolbar. Click the item to
activate or inactivate it on the toolbar.
• In addition
to customizing which toolbar features are displayed, you can also
reposition the toolbar segments horizontally or vertically. Just drag the vertical
27
Page 36

XMap User Guide
dotted bar
that separates each segment to the new location (left, right, up, or
down). You cannot move a toolbar segment above the top-most line on the
toolbar, customize toolbar groups, or remove toolbar groups from the toolbar.
28
Page 37
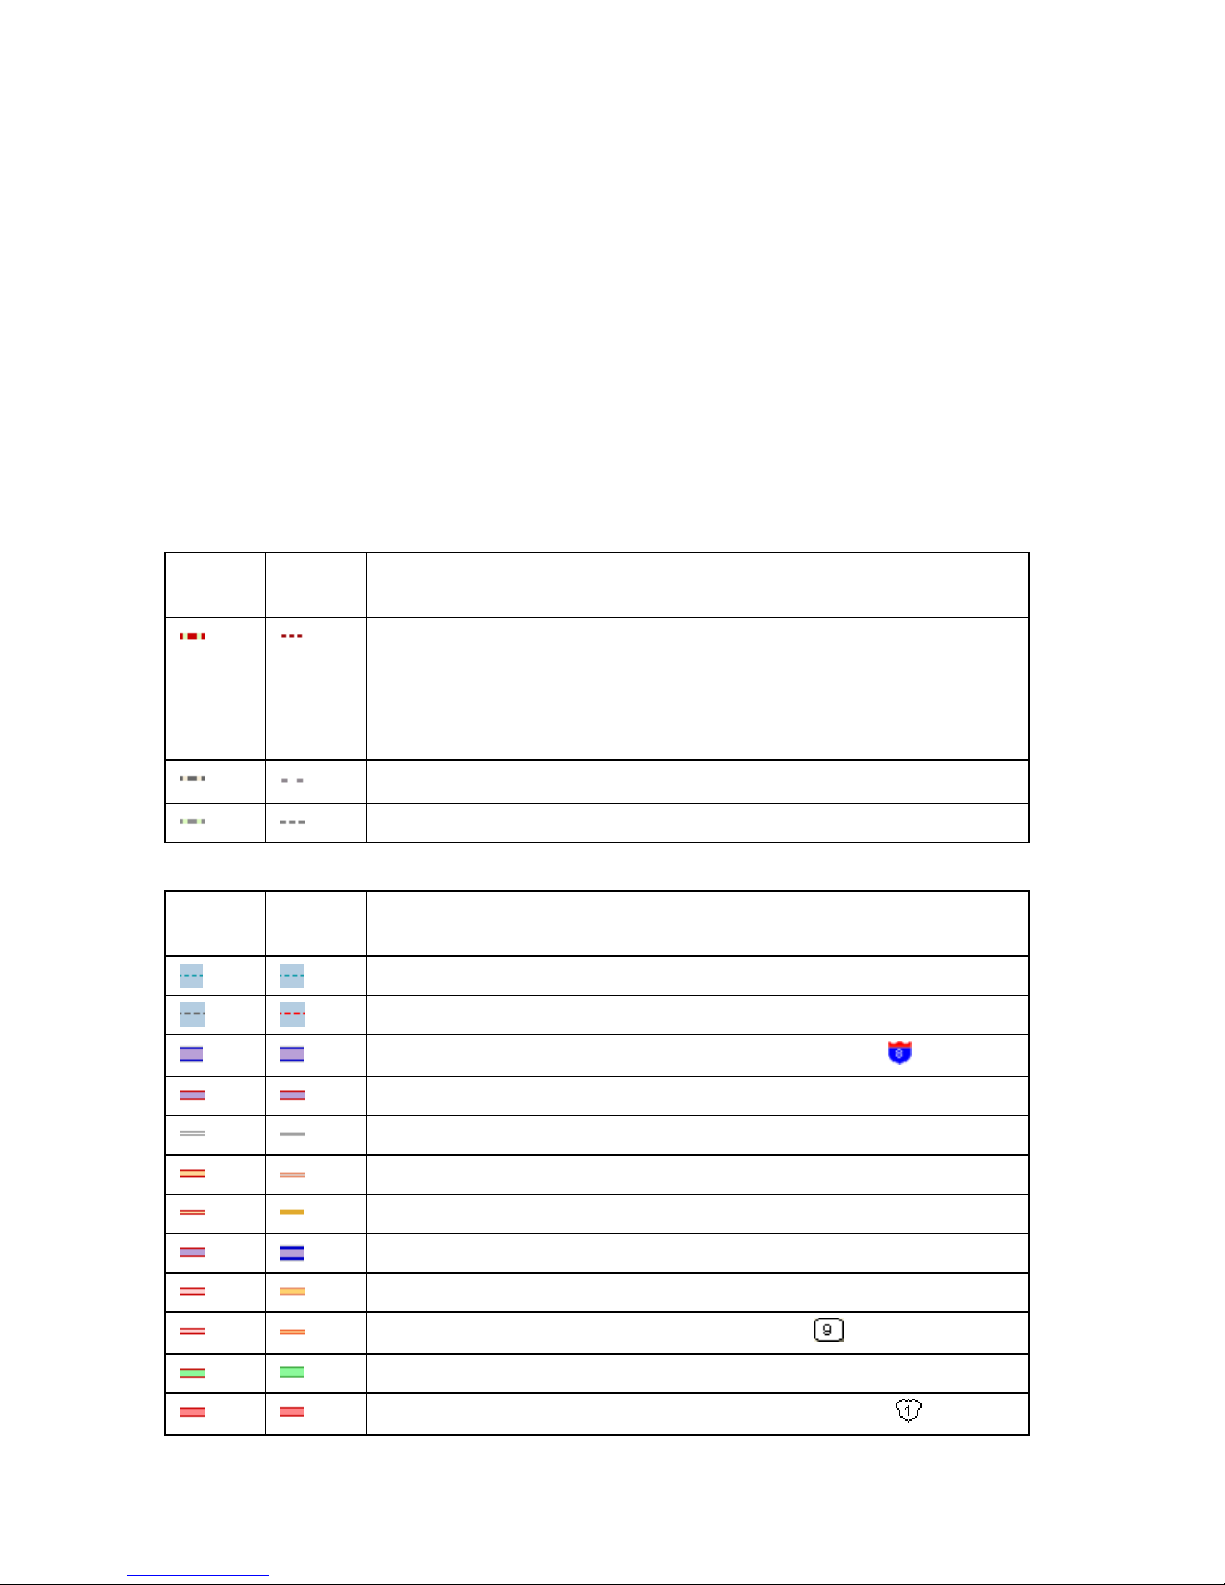
Map Legend
Map Legend
The features that display on the map may display differently depending on which
map colors you chose on the Display tab of the Options dialog box. The tables below
show the symbolization of each feature, by map color.
Notes
• Not all features are available at all zoom levels.
• Not all features are available in all datasets.
• High-contrast Color features display the same as Street Color features (except
for land, which displays as black).
Routable Trail Features
Topo
Colors
Street
Colors
Description
Major Trail
Important Some trails may cross private property. Contact
the applicable trail department to ensure you have the
appropriate permissions before following a major trail. For
contact information, see Recreational Contacts.
4-wheel Drive Trail
Trail/Walkway/Foot Trail
Routable Road Features
Topo
Colors
Street
Colors
Description
Ferry Passenger
Ferry Vehicle
Interstate Highway (can also include this symbol:
Limited Access Road
Local Road
)
Major Connector, Forest Road
Minor Connector
Non Limited Access Interstate
Primary State Route
State Route (can also include this symbol:
Toll Road
U.S./National Route (can also include this symbol:
)
)
29
Page 38
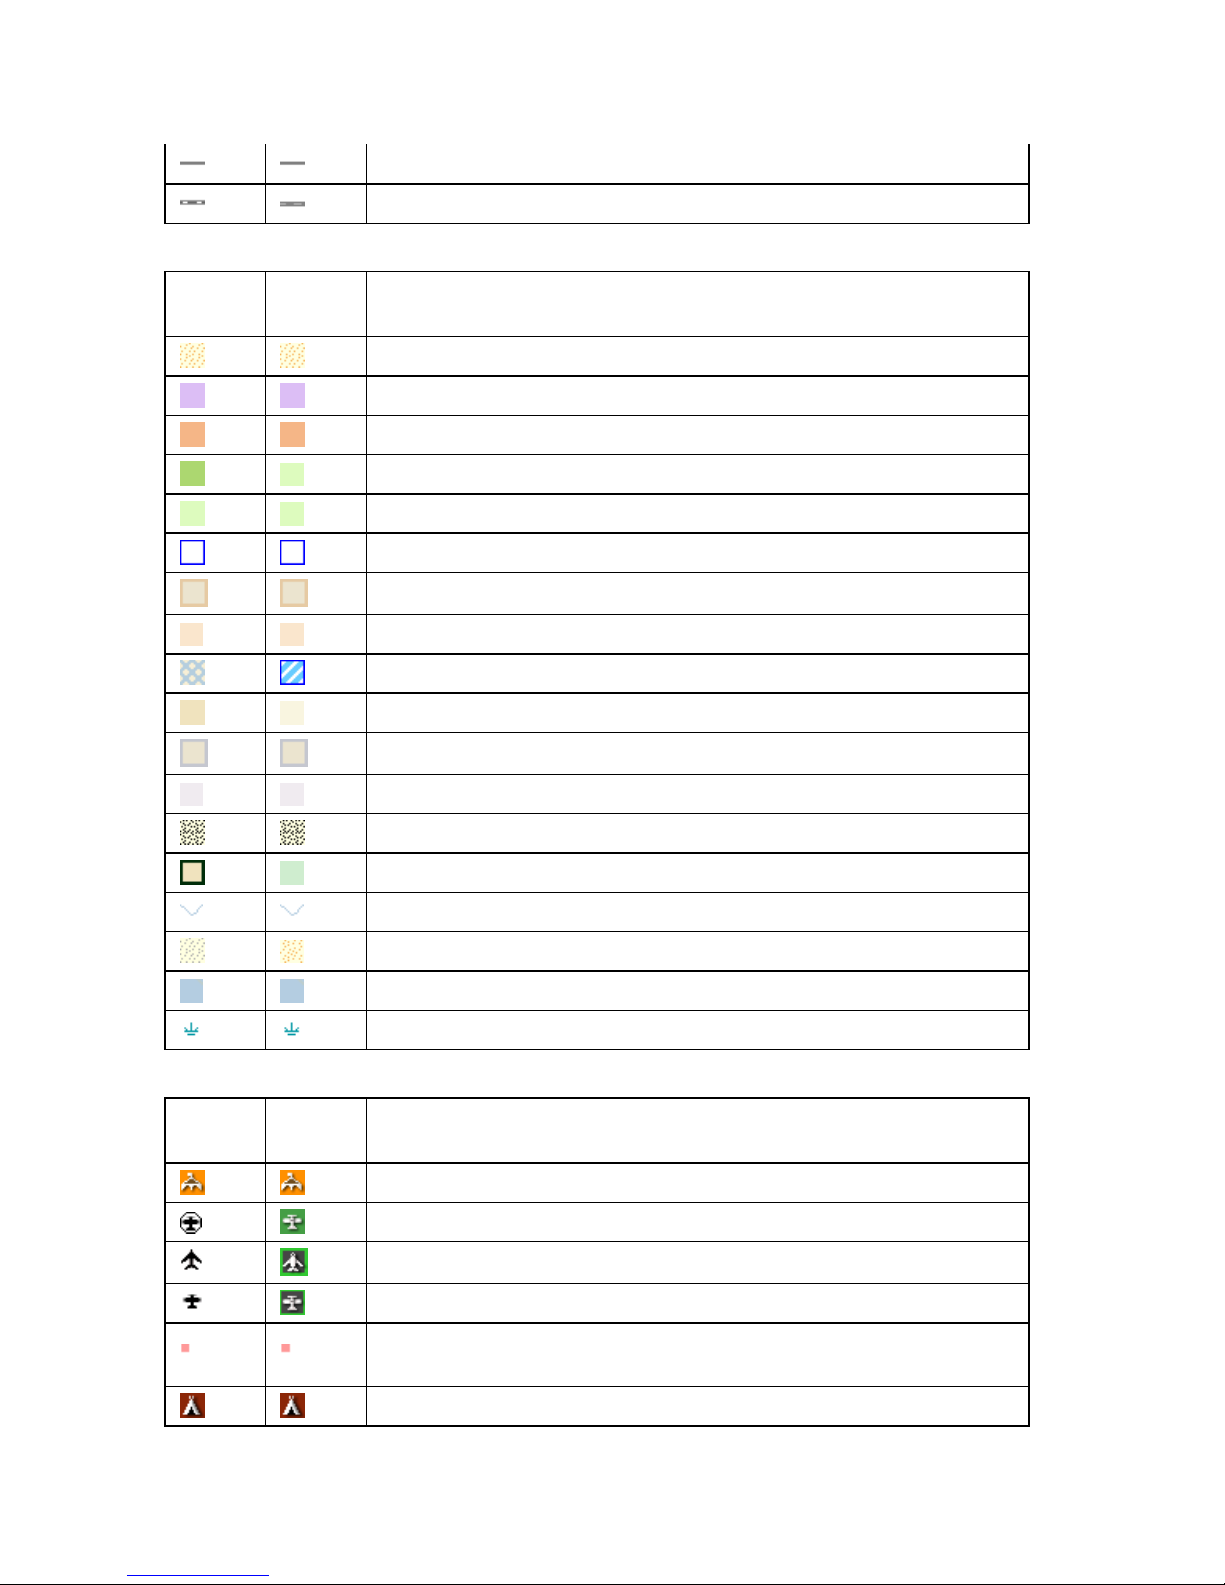
XMap User Guide
Land Cover
Topo
Colors
Street
Colors
Unclassified Road
Unimproved Road
Description
Bare Rock or Sand
Bureau of Land Management Land
Bureau of Mine Reclamation Land
Forest, evergreen
Forest, mixed
Ice or Snowfield
Indian Reservation (at data zoom level 11)
Indian Reservation (at data zoom level 2 thru 10-7)
Intermittent Water
Land
Point Features
Topo
Colors
Street
Colors
Military Area (at data zoom level 11)
Military Area (at data zoom level 2 thru 10-7)
Mine or Quarry
Parks
River/Stream
Transitional Area, Lava, Salt Flats, or Mixed Barren
Water
Wetlands
Description
Amusements
Airport (private)
Airport (commercial public)
Airport (general aviation public)
Business (Amusement, Recreation, Specialty or Department
Store)
Camping (at data zoom level 14)
30
Page 39
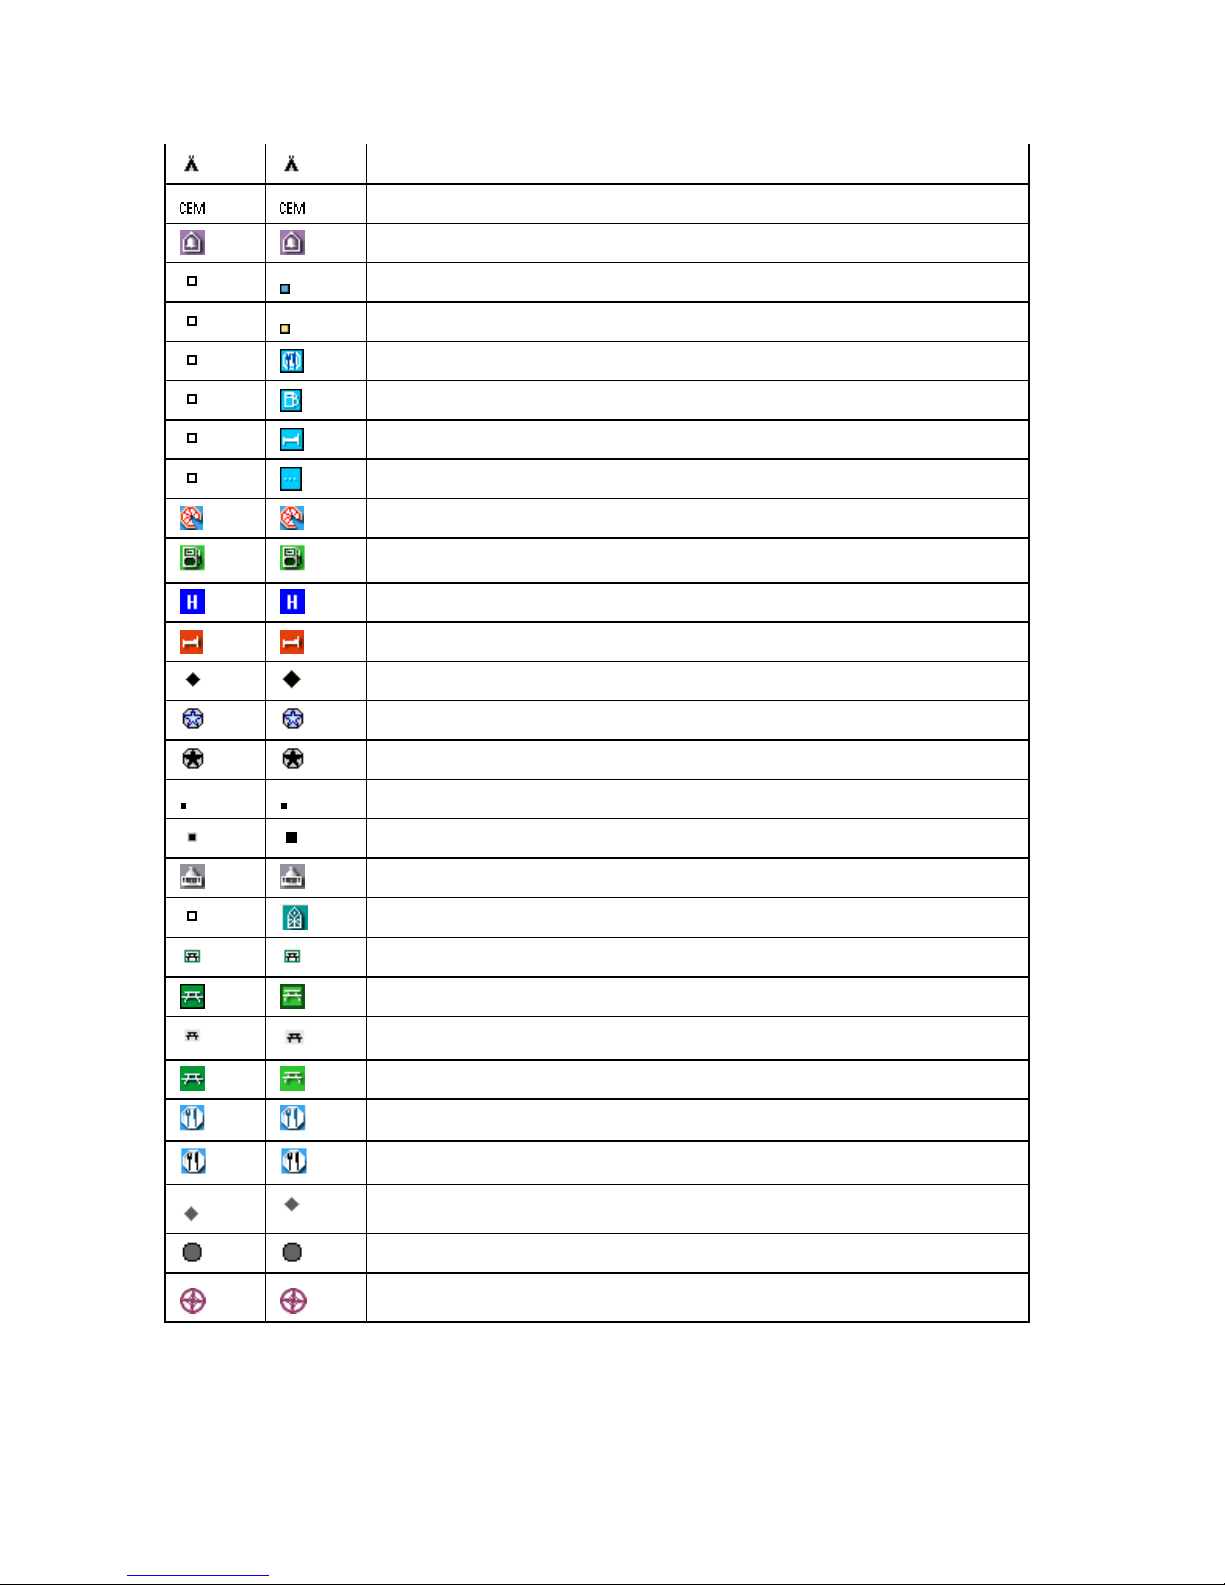
Map Legend
Camping (at data zoom level 11 thru 13)
Cemetery
Educational Facility
Exit, with services (at data zoom levels 10 thru 11-7)
Exit, without services (at data zoom levels 10 thru 11-7)
Exit, food (at data zoom levels 12 thru 17)
Exit, gas (at data zoom levels 12 thru 17)
Exit, lodging (at data zoom levels 12 thru 17)
Exit, other (at data zoom levels 12 th ru 17)
Fast Food
Gas
Hospital
Lodging
Metropolitan City
National Capital (data zoom level 7 thru 10)
National Capital (data zoom levels 2 thru 6)
Point of Interest (smaller black square)
Population Center
Public Service
Religious (buildings)
Rest Area with Facilities (at data zoom levels 10 thru 11)
Rest Area with Facilities (at data zoom level 12)
Rest Area without Facilities (at data zoom levels 10 thru 11)
Rest Area without Facilities (at data zoom level 12)
Restaurants (general)
Restaurants (specialty)
Small City
State Capital
Unique Natural Feature (at data zoom level 8)
31
Page 40
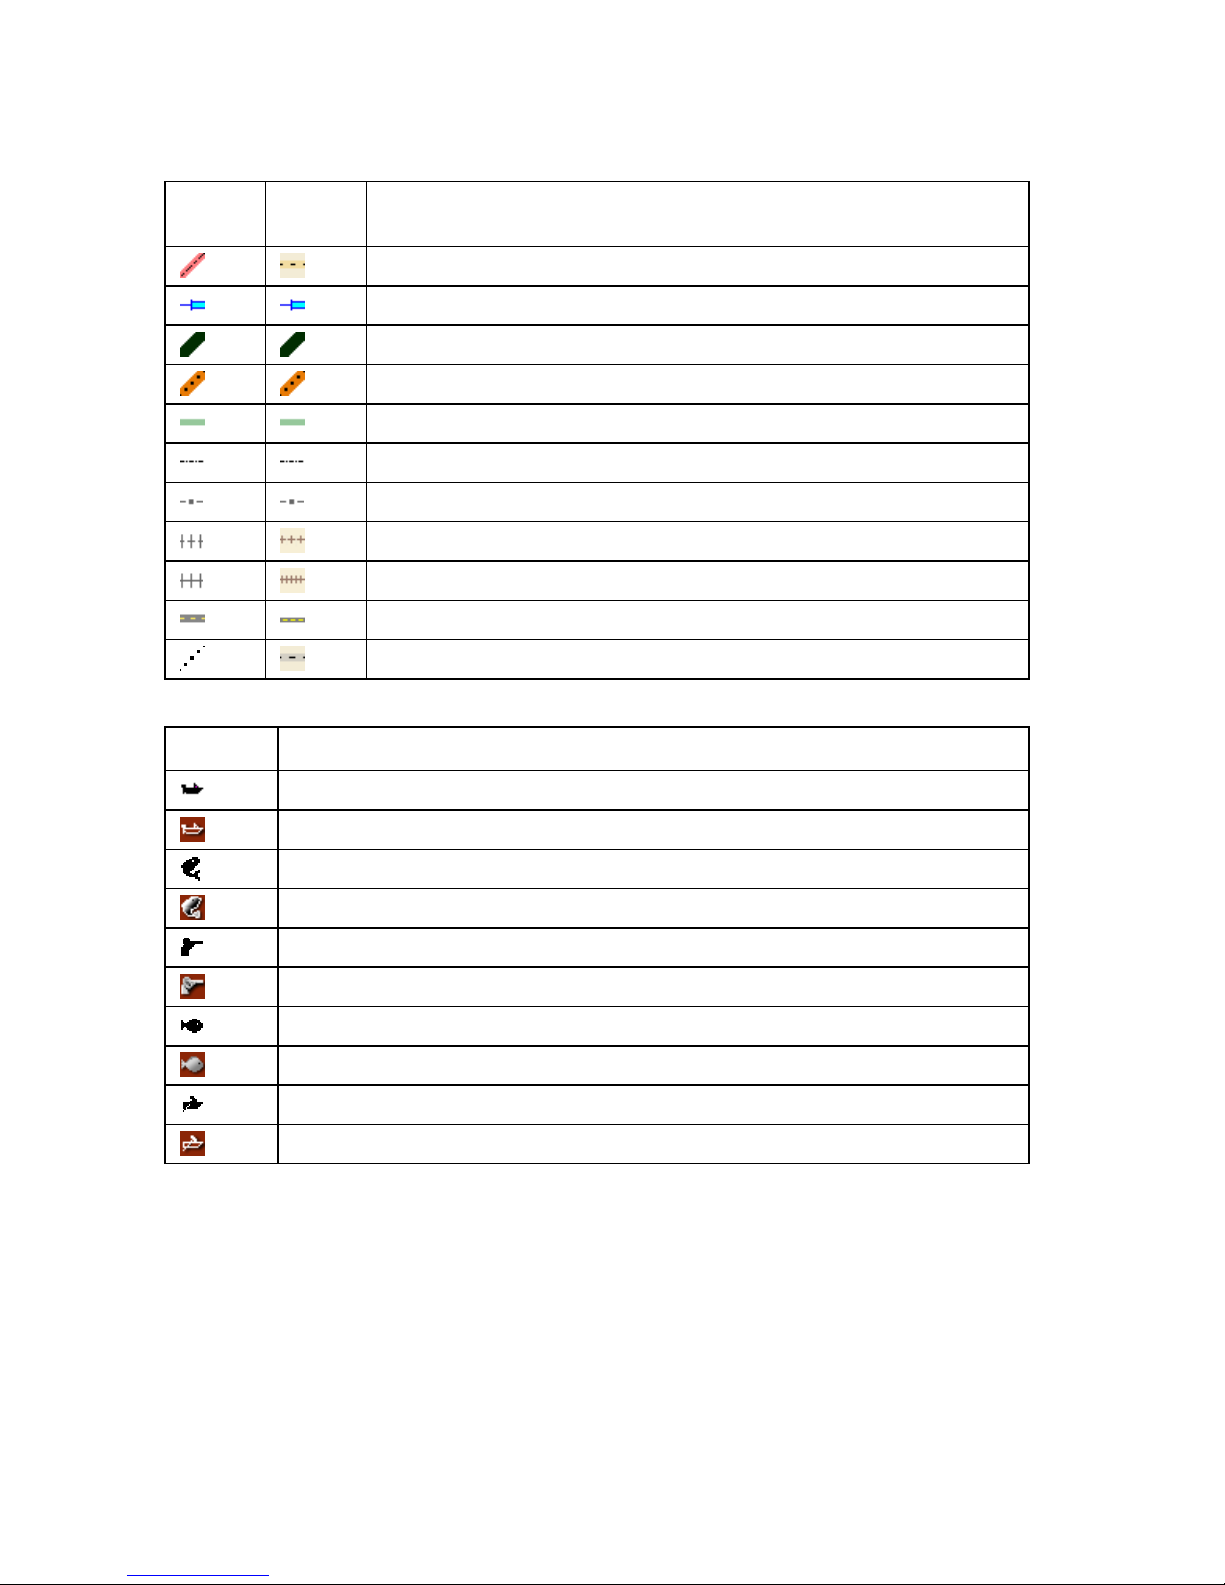
XMap User Guide
Line Features
Topo
Colors
Street
Colors
Description
County Boundary
Dam
Game Management District
International Boundary
Park Boundary
Pipeline
Power Line
Railroad (Abandoned)
Railroad
Runway
State Boundary
DeLorme Atlas and Gazetteer Symbols
Symbol Description
Developed Boat Ramp (at data zoom levels 11 and 12)
Developed Boat Ramp (at data zoom level 13)
Freshwater Fishing (at data zoom levels 11 and 12)
Freshwater Fishing (at data zoom level 13)
Hunting (at data zoom levels 11 and 12)
Hunting (at data zoom level 13)
Saltwater Fishing (at data zoom levels 11 and 12)
Saltwater Fishing (at data zoom level 13)
Undeveloped Boat Ramp (at data zoom levels 11 and 12)
Undeveloped Boat Ramp (at data zoom level 13)
32
Page 41
Using the Toolbar
Showing/Hiding Toolbar Options
You can customize the toolbar to show the options you use most. You can also
activate toolbar options that are not turned on by default.
To modify the toolbar.
1. Right-click the toolbar.
Toolbar options with a selected check box next to them are displayed on the
toolbar.
2. Click an item to activate or inactivate it in the toolbar.
Reordering the Toolbar Options
To reposition the toolbar segments horizontally or vertically, just drag the dotted
vertical bar
down). You cannot move a toolbar segment above the top line on the toolbar.
that separates each segment to the new location (left, right, up, or
To Use the GIS Tools
There are many GIS tools available on the toolbar, including tools that allow you to
edit geometries, create redline layers, perform COGO editing, and more.
• Click the Manage Layers tool
workspace, delete layers from the source database, or remove a database
reference.
• Click the Import Layers tool
file or ArcSDE database.
• Click the Selection tool
risk of accidental editing.
• Click the Edit tool
• Click the Edit Points tool
• Click the Rotate tool
to highlight geometries on the map without the
to move or change the size of a geometry.
to rotate a geometry.
to add and remove layers from your
to import a layer into a database from a
to edit points in a polygon/line layer.
• Click the Draw Geometries tool (
layer type) to add points, lines, or polygons to a layer.
• Click the COGO tool
angle/distance measurements, or bearing/distance measurements.
• Click the Classification tools (
type) modify the classification for a selected geometry.
• Use the Active Layer drop-down list to select a layer from your workspace as
the active layer.
, , or depending on the active
to place a polygon/line/point by coordinates,
, , or depending on the active layer
33
Page 42
XMap User Guide
• Click the Commit Changes tool
made to the active layer.
• Click the Undo
• Click the Redlining tool
• Click the Synchronizing tool
redline layers to the source database.
• Click the Add Synchronized Layers tool
are in the active subscription to your workspace.
• Click the Magic Wand tool
and Redo tools to undo/redo your last action.
to mark up a GIS layer.
to save all of the changes you have
to refresh subscription layers and send
to add all of the layers that
to edit topological lines.
To Create New Projects
To create a new project, click the New button on the toolbar. If you made
changes to the open project, the Save Changes dialog box opens to ask you if you
want to save your changes.
For more information, see Creating and Deleting Projects.
To Open a Project
To open an existing project:
1. Click the Open button
OR
Click the arrow next to the Open button, and then click Open Project.
If you made changes to a project that is already open, the Save Changes
dialog box opens. Note Projects have .xmp extensions and are saved by
default in C:\...\DeLorme Docs\Projects.
The Open File dialog box opens.
2. Select the project you want to view and click Open.
Note If the project has not been migrated to the new DeLorme Docs location,
you will be prompted to migrate it. Click Migrate to create a copy of the file
in the new DeLorme Docs location. Click No to cancel. For more information
about migrating projects, see Migrating Data to the New DeLorme Docs
Location.
For more options for opening files, see Opening a Project.
on the toolbar.
34
Page 43
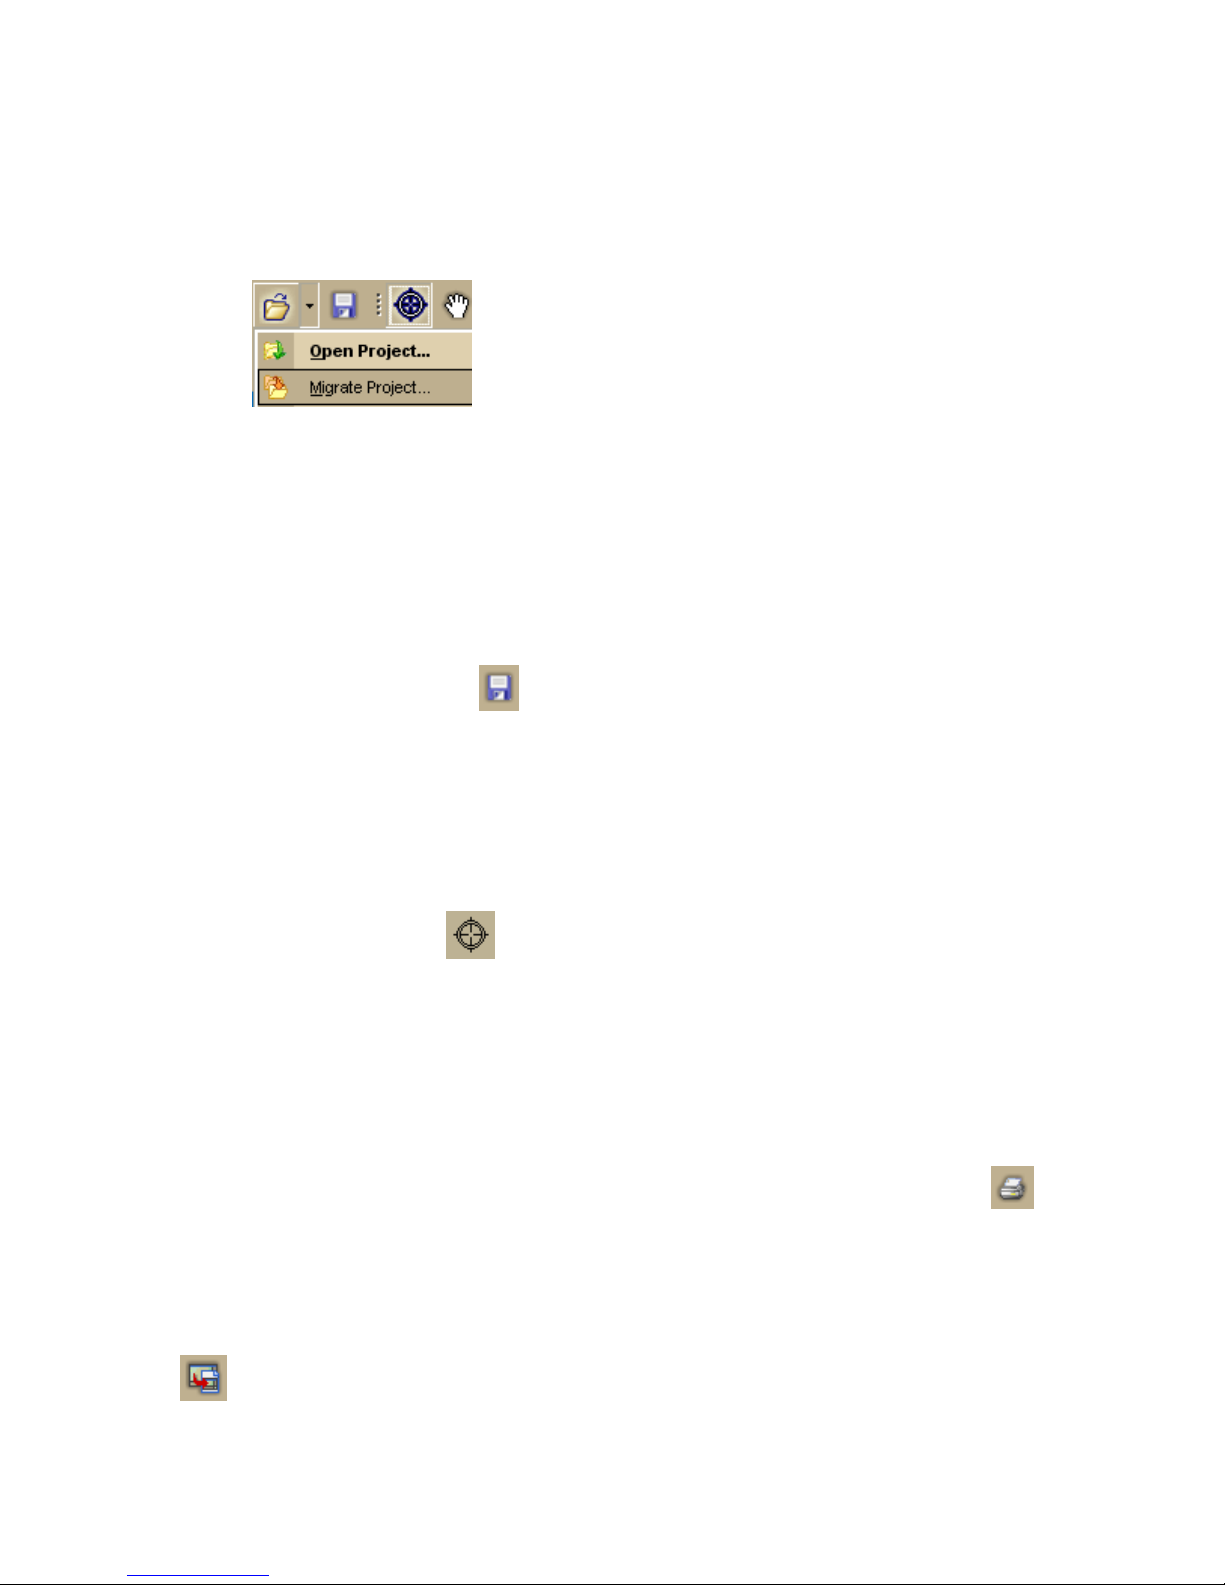
Using the Toolbar
To Migrate a Project
To migrate an existing project from C:\DeLorme Docs\Projects to C:\...\DeLorme
Docs\Projects:
1. Click the arrow next to the Open button, and then click Migrate Project.
The Migrate Project dialog box opens.
2. Browse to the project you want to migrate and click Migrate.
After the migration is complete, a confirmation message appears.
3. Click Open to open the project or Close to close the message.
For more information about migrating projects, see Migrating Data to the New
DeLorme Docs Location.
To Save a Project
To save the project that is currently open:
1. Click the Save button
The Save File dialog box opens.
2. Browse to the location where you want to save the project.
If you want to rename the project, type a new name in the File Name text
box.
3. Click Save.
on the toolbar.
To Use the Map Navigation Tool
Click the Navigation tool on the toolbar to enable Navigation mode.
• To zoom in, click the map, hold down the left mouse button, and drag down
and right. (2-D maps only)
• To zoom out, click the map, hold down the left mouse button, and drag up
and left. (2-D maps only)
• To re-center the map, click the map where you want to center it.
To Print
To print a map using the current settings in the Print t ab, click the Print button
on the toolbar.
For more information, see Printing a Map.
To Print the Map Screen
To print the current view as it displays on the screen, click the Print Screen button
on the toolbar.
35
Page 44
XMap User Guide
To Share Maps
To share your current map view, a route map and directions, or a profile, click the
MapShare button
MapShare lets you share maps — even 3-D maps, routes, and profiles.
For information on e-mailing maps, routes, and profiles w ith the MapShare Wizard,
click the Help button in the MapShare Wizard.
on the toolbar to open the MapShare Wizard.
To Share Online With Eartha Community Atlas
To launch the Eartha Community Atlas (ECA) wizard, click the ECA button on
the toolbar. You can also access the Eartha Community Atlas website or click here to
open the website in a new window.
See Using Eartha Community Atlas for more information.
To Send Maps to Your Portable Media Player
To send your current map view as multiple static maps to your portable media
player, click the Portable Maps button
Maps Wizard.
For more information, click the Help button in the Portable Maps dialog box or see
the Portable Maps tutorial in the application’s Help.
on the toolbar to open the Portable
To Create a Route
To set route points using the toolbar:
1. Type the location where you want to start your route in the Start text box
(next to the green Start button).
OR
Click the green Start button
where you want to start your route.
OR
Select an address book entry, a previous location, or your current GPS
position from the Start drop-down list.
2. Type the location where you want to end your route in the Finish text box
(next to the red Finish button).
OR
Click the red Finish button
where you want to end your route.
OR
Select an address book entry or your current GPS position from the Finish
drop-down list.
3. Optional. If you want to add a stop or via to your route, click the Stop button
or the Via button and then click the location on the map where you
want to add or insert the stop or via. Repeat this step for each stop or via you
want to add to your route.
and then click the location on the map
and then click the location on the map
36
Page 45
Using the Toolbar
Note If the Add option is selected in the Route tab, stops and vias are added
in the order they are added to the route. If the Insert option is selected in the
Route tab, stops and vias are added in the order they are approached in the
route. For more information, see Adding and Inserting Stops and Vias.
4. Click the Calculate button
Important If you have only the left map window open, the route Start, Finish, and
Stop buttons on the toolbar and on the Route tab are grayed out. To activate the
options, use the map resize tool to expose the right map window.
Note To use the current GPS location in a route, you must connect your device to
your computer and click the Start GPS button on the toolbar or on the GPS tab.
Tip Once a route is calculated, you can use the subtabs in the Route tab to view
route directions, edit a route, and more. Click the Directions subtab to view the
route directions, the Advanced subtab to display the advanced routing options, or
click Back on Track to add your current GPS position as a stop to the current route.
.
To Start/Stop Your GPS Connection
To start or stop your GPS connection, click the GPS button on the toolbar.
• If you start a connection and you are using the UMPC option or NavMode, the
GPS tab is minimized, but you can show it. For more information , see
Customizing the Interface.
• If you start a connection and you are not using the UMPC option or NavMode,
the GPS tab area opens so you can monitor your GPS status.
Note The GPS button on the toolbar is a toggle button that lets you start your GPS
connection if the device is not active or stop the connection if it is active.
To Exchange Files with a Handheld Device
Use the Exchange button on the toolbar (also on the GPS and Handheld
Export tabs) to exchange objects such as maps, waypoints, tracks, and routes with a
handheld device.
• If you have enabled an Earthmate PN-Series GPS device on your computer,
click the Exchange button to open the Earthmate PN-Series GPS Exchange
dialog. You can switch to another device from this dialog.
• If you have another GPS device, a Palm OS device, or a Pocket PC device,
click the Exchange button to open the Earthmate PN Series GPS Exchange
dialog and then click Use Other Device.
For more information on exchanging objects, see Help topics listed under Using
Handheld Devices.
37
Page 46
XMap User Guide
To Use GPS NavMode
NavMode—a hands free full-screen view that you can view in 2-D or 3-D — is the
default view when you navigate or track with GPS. You can turn off NavMode to
display the GPS tab view.
To Turn NavMode On/Off
Click the NavMode button to turn it on or off. When the button appears
indented
Note The button is greyed out
playing back a GPS log file.
You can also change your GPS view in the Options dialog box:
1. Click the Options button
You can also click the Options button
2. Clear the Use NavMode check box to turn it off, or select the check box to
turn it on.
3. Click OK.
, NavMode is on.
unless you have a GPS device plugged in or are
on the toolbar and click the GPS tab.
on the GPS tab.
To Grab and Pan the Map
To drag and pan the 2-D or 3-D map in any direction, click the Grab and Pan button
on the toolbar.
To Create a Profile
To create a profile:
1. Center your 2-D map on the area with the linear object you want to profile.
OR
Center the route you want to profile on the map.
2. Click the Profile button
3. Move your pointer over the map. The pointer changes from
when it passes over an object that you can profile.
4. Select a linear object or route on the map to generate its profile.
When the object is selected, it is highlighted and the Profile graph displays in
the Profile tab area.
Note Move your pointer along the elevation profile in the Profile graph. The
intersection of the vertical and horizontal blue lines travels along the top of
the terrain profile. These lines indicate the height and distance of the
particular location. A small crosshair follows along the corresponding object
on the map.
You can also right-click a linear object or route on the map and click Profile. For
more information about profiles, see the Help topics under Profiling Linear Objects.
38
on the toolbar.
to
Page 47
Using the Toolbar
To Measure Distance
Use the following steps to measure linear distances and perimeter/area on the map.
For more information, see Measuring Distance and Area.
1. Click the Measure tool
2. Click point-by-point to draw a measurement line on the map. A text box
displays next to your pointer indicating the total distance of the measurement
taken.
Note When you pass over a point in a road, measurement line, or
measurement area to which you can snap, a yellow circle
point. Click to snap the point of the measure line to the road or measurement
object's point coordinate. Press and hold the ALT key on your keyboard to
disable snapping.
3. To end a measurement line, double-click the last point of the measurement
line. The measure line displays as a two-pixel wide yellow line and the total
length of the line displays in a label at each endpoint of the line.
4. To end a measure area, hover over the starting point until the yellow snap
circle
perimeter measurements display.
displays and then double-click the last point to the starting point. The
on the toolbar.
defines the snap
To Get Information About a Location
Use the Information button on the toolbar to click a point, symbol, feature,
measurement line, track, or area on the map to identify it and view detailed
information about it.
Use the following steps to get information about a particu lar map feature.
1. Click the Information button.
2. Click the map feature you want information for, such as a road, town,
measurement line, waypoint, track, draw symbol, or point of interest.
The Info tab opens and displays a list of information categories.
Note Descriptive information may include a name or feature type,
length/area, ZIP/Postal Code, town name, county name, state/province,
coordinates, and Standard Industrial Classification categories.
3. Click the plus sign next to each of the information categories to expand the
category to view more detailed information.
OR
Right-click in the information box and click Expand All to expand all of the
information categories. Right-click in the information box again an d click
Collapse All to minimize all of the information categories.
4. Optional. Repeat steps 1–3 to get information about another location.
5. Optional. Right-click in the information box and click Print to print your map
feature information.
Notes
• You can also get information about a location usin g the right-click option. Just
right-click the location and click Info.
• The status bar (located above the tab area) displays draw object type, draw file
information, point of interest name (if applicable), street name/address,
39
Page 48
XMap User Guide
highway, city, state/province, and ZIP/Postal Code information for the map
location that your cursor is positioned on.
• Some map features (such as campgrounds, national scenic/historic trail
information centers, and state parks) display with a blue outline at higher data
zoom levels. The blue outline indicates that the feature has a hyperlink to its
website. To open the hyperlink, right-click the feature and then click Open
Hyperlink OR click the URL in the Info tab.
To Choose Options
To open the Options dialog box, click the Options button on the
toolbar. Use the Options dialog box to set GPS, voice, display, map feature,
handheld, 3-D, and keyboard shortcut preferences. An Options button that opens the
Options dialog box is also available on the 3-D, Handheld Export, and GPS tabs.
To open the Options menu, click the arrow next to the Options button
on the toolbar. The following menu options are available:
• Options—Opens the Options dialog box.
• Tab Manager—Opens the Tab Manager dialog box where you can show or
hide individual tabs and reorder tabs.
• UMPC Mode—Allows you to turn the default UMPC view on or off. If UMPC
mode is turned on, the check box next to it is selected. Click UMPC Mode to
turn it on or off. For more information, see Using Small-screen Devices.
You can also customize your interface:
• Show Tab Area Panel—Allows you to show or hide all the tabs. If Show All
Tabs is turned on, the check box next to it is selected. Click Show Tab Area
Panel to show or hide the tab area.
• Show Control Panel—Allows you to show or hide the Control Panel. If Show
Control Panel is turned on, the check box next to it is selected. Click Show
Control Panel to show or hide it.
To Add Images and Data to a GPS Location
To open the GeoTagger Wizard, where you can combine images and data with GPS
information on the map, click the GeoTagger button
information, see Getting Started with GeoTagger.
on the toolbar. For more
40
Page 49
Customizing the Map and Tab Display
Display Options Overview
The following topics explain how to use the Display options in the Options dialog box:
• Displaying Basic Map Features
• Customizing the Interface
• Customizing the Map Features Preferences
• Changing the Map Colors
• Changing the Map Magnification Level
• Changing How POIs Display on the Map
• Setting Units of Measure Preferences
Customizing the Interface
You can customize the interface for your application by hiding the tab panel area and
the Control Panel. You can also turn UMPC Mode on or off.
To Customize the Interface
Click the arrow next to the Options button on the toolbar.
• Click Tab Manager to show or hide individual tabs or reorder tabs.
• If the tab panel area is showing and you want to hide it, click Show Tab Area
Panel to clear the check box next to it.
OR
If the tab panel area is hidden and you want to show it, click Show Tab Area
Panel to select the check box next to it.
• If the Control Panel is showing and you w ant to hide it, click Show Control
Panel to clear the check box next to it.
OR
If the Control Panel is hidden and you want to show it, click Show Control
Panel to select the check box next to it.
• You can click UMPC Mode to turn the optimized UMPC view on or off. UMPC
Mode is on when the check box next to it is selected. For more information , see
Using UMPC and Small-screen Devices.
Notes
• You can also use keyboard shortcuts to hide and show the tab area panel and
Control Panel and to optimize the interface for small-screen devices.
• Your settings are saved until you change them.
Displaying Basic Map Features
You can show or hide basic map features on your map.
You can also customize map features and customize the interface.
Notes
• If you cannot make changes to the basic preference check boxes, verify the Use
Custom Map Features check box is not selected.
41
Page 50

XMap User Guide
• Click Use Defaults to change the map feature settings to the default
preferences.
• The options available depend on the datasets you are using.
To Select Basic Map Feature Preferences
Use the following steps to change the basic map feature preferences. Changes made
to the map view display almost immediately after selection.
1. Click the Options button
on the toolbar.
OR
Click the arrow next to the Options toolbar button to open the menu. Then,
click Options to open the dialog box.
2. Click the Map Features tab.
3. Select the check box next to the map features you want to display on the
map.
OR
Clear the check box next to the map features you want to hide on the map.
• Shaded Relief—Shaded relief becomes visible at data zoom level 6-0
or greater. It simulates the effect of sun shining on terrain features
and casting shadows, providing greater depth perception of the image.
Lighter shades of gray indicate gentle terrain and darker shades
indicate steep terrain. Using shaded relief may slow down the draw
time of the map screen as you pan.
• Contours—Contour lines are available at data zoom level 6-0 or
greater. Contour lines show the elevation of the land in feet or meters.
The closer the contour lines, the greater the slope. The distance
between the lines is the contour interval, wh ich is indicated in the
Control Panel (distance units are controlled in t he Options dialog box).
• Land Cover—Land cover colors are available at all data zoom levels.
Colors indicate vegetation and land cover areas on the map such as
rock and sand, forests, transitional areas, and wetlands.
• Grids—The Grids option can be used to identify coordinate points on
the map. Grid lines automatically adjust for the data zoom level of
your map.
• Parks or Reserves—Parks and Reserves are available at data zoom
level 7-0 or greater and include areas such as parks, preserves,
recreational area and public forests.
• Publicly Managed Lands—Publicly Managed Lands are only available
when the Bureau of Land Management (BLM) dataset is downloaded
and installed. The feature includes areas such as lands managed
through the Bureau of Land Management and displays at all data zoom
levels.
• Game Management Districts—Wildlife Management Units are only
available when the Wildlife Management Units ( WMU) dataset is
downloaded and installed. The feature includes areas of managed
wildlife and game and displays at data zoom level 6-0 or greater.
• USGS Quadrangle Coverage—The USGS 7.5 minute quadrangle
coverage is indicated by red lines. These display at data zoom level 80 or greater. Quadrangle names display at data zoom level 9-0 and
higher. To view quad info such as Orig Date and Quad Order ID
42
Page 51

Customizing the Map and Tab D isplay
number (needed when purchasing quads), right-click a point within the
quad and then click Info. An information box displays in the lowerright corner of the screen.
• 3DTQ Region Coverage—Displays the DeLorme 3DTQ product CD
volume label, which covers each map area at data zoom level 10-0 or
greater.
• Map Center Crosshair—The map center crosshair indicates the map
center at any data zoom level.
• Exits—View exits on primary limited access roads, interstates, and toll
roads. Available at data zoom level 10-0 or greater.
• One Ways—One ways display as bright green triangles on roads,
pointing toward the direction of travel (most noticeable in large cities).
They are available at data zoom level 13-0 or greater.
• Places (Minor)—View smaller towns, suburbs, locales, and natural
features. Zoom levels vary.
• Roads (Minor)—View secondary roads, local and rural routes, trails,
and railroads. Zoom levels vary.
• Points of Interest
• Major—View many different points of interest, including
recreational areas, public safety, rest areas, and more.
• Minor—View general points of interest including educational,
technology, government, and religious buildings/locations.
• Business (Major)—View many different travel-related points
of interest including hospitals, camping, restaurants, and more.
• Business (Minor)—View general points of interest including
small shops and food stores, laundromats, and golfing.
• ZIP-Postal Codes—ZIP/Postal Code boundaries display at data zoom
level 8-0 and greater, with ZIP/Postal Code labels displaying at data
zoom level 10-0 and greater.
• Town Borders—View town borders at data zoom level 10-0 and
greater for the following states:
Arkansas
Connecticut
Illinois
Indiana
Iowa
Kansas
• County Borders—View shaded outlines of U.S. counties at data zoom
levels 7-0 or greater.
• International Labels—View country labels at data zoom levels 0-0
through 4-0.
• Urban Area Color—Displays a shaded map area in populated regions
at data zoom levels 5-0.
Louisiana
Maine
Maryland
Massachusetts
Michigan
Minnesota
Mississippi
Missouri
Nebraska
New
Hampshire
New
Jersey
New York
North
arolina
C
North
Dakota
Ohio
Pennsylvania
Rhode
Island
South
Dakota
Vermont
Virginia
Washington
DC
West
Virginia
Wisconsin
43
Page 52
XMap User Guide
3. Click OK to commit the change and exit the Options dialog box.
OR
Click Apply to commit the change and keep working in the Options dialog
box.
Customizing the Map Feature Preferences
You can change the display of a wide variety of map features so you can customize
your map to meet your specific needs. You can even customize which POIs display.
To Set Custom Map Features
This is an advanced feature that lets you create a specific, custom set of map
features for your map display from hundreds of options. Note that changes are not
visible until you click the Done button.
1. Click the Options button
OR
Click the arrow next to the Options toolbar button to open the menu. Then,
click Options to open the dialog box.
2. Click the Map Features tab.
3. Select the Use Custom Map Features check box and then click Customize
Features to display the custom options.
Note Custom map feature selections override selections in the basic features
list.
4. To quickly search for a particular type of feature, type the name of the item in
the Search text box.
A list of matching keywords displays and corresponding feature types are
listed in the Search Results window. Results for the number of keywords
and types found also display.
A selected check box indicates the feature displays on the map.
• Select/clear the individual feature check box to show or hide that
feature.
• Click the small None button to the right of the Search Results
window to show none of the features listed.
• Click the small All button to the right of the Search Results window
to display all of the features listed.
• Click Only to display only those features listed in th e Search Results
window.
• Click Exclude to display all features except those listed in the Search
Results window.
5. To use the map feature tree to select which POIs display on the map, click the
plus signs to expand the individual branches. A selected check box indicates
the feature type displays on the map.
Note Some branches expand further than others. Selecting/clearing a check
box at a certain branch of the tree shows/hides all the items below that level.
• Select/clear the individual map feature check box to show or hide that
feature.
• Click All to select all map features in the program.
on the toolbar.
44
Page 53
Customizing the Map and Tab D isplay
• Click None to select none of the types in the program.
Note A small number of features cannot be turned off. They are part
of the base map display and cannot be changed. This is why certain
levels on the tree remain unavailable (appear dimmed or gray).
6. Click OK to accept the change and exit the Options dialog box.
OR
Click Apply to accept the change and keep working in the Options dialog box.
Notes
• When you save the current project, the following feature preferences are saved
in reference to map features:
o Major map features preferences
o Individual custom feature preferences
o When you create a new project, the current map settings are used. Click Use
Defaults to return to the default settings.
Changing the Map Colors
When you use a laptop computer while traveling, it can be difficult to see the map
display on your screen. This can be especially true at night or on a bright sunny day.
Changing your default map colors to high-contrast map colors can make your map
display easier to see.
To Change the Map Colors
Use the following steps to change the map display.
1. Click the Options button
OR
Click the arrow next to the Options toolbar button to open the menu. Then,
click Options to open the dialog box.
2. Click the Display tab.
3. From the Map Colors drop-down list, select High-Contrast Colors to make
the map display darker for improved in-vehicle visibility, Street Colors to
emphasize streets and highways on the map, or Topo Colors to emphasize
contours, parks and public lands, land cover, and so on.
4. Click OK to accept the change and exit the Options dialog box.
OR
Click Apply to accept the change and keep working in the Options dialog box.
on the toolbar.
Changing the Map Magnification Level
If you want to change the size of the map image, but not change the degree of
geographic detail on the map, use the magnification settings in the Options dialog
box.
To Change the Map Magnification
Use the following steps to change the map magnification.
1. Click the Options button
OR
on the toolbar.
45
Page 54
XMap User Guide
Click the arrow next to the Options toolbar button to open the menu. Then,
click Options to open the dialog box.
2. Click the Display tab.
3. Select a magnification percentage (50%, 75%, 100%, 125%, 150%,
175%, or 200%) from the Magnification drop-down list.
Note Although the size of the image changes, the degree of geographic
detail does not.
4. Click OK to accept the change and exit the Options dialog box.
OR
Click Apply to accept the change and keep working in the Options dialog box.
Changing How POIs Display on the Map
You can change the data zoom level at which large POI symbols display on the map.
To Change the Data Zoom Level for Large POI Symbols
Use the following steps to change the data zoom level at which large P OI symbols
are displayed on the map.
1. Click the Options button
OR
Click the arrow next to the Options toolbar button to open the menu. Then,
click Options to open the dialog box.
2. Click the Display tab.
3. Select the data zoom level from the Large Symbols At drop-down list.
4. Click OK to accept the change and exit the Options dialog box.
OR
Click Apply to accept the change and keep working in the Options dialog box.
Notes
• The appearance of a POI many change at different data zoom levels.
• The number of points of interest that displays is dependent on the basic map
features you selected on the Map Features tab in the Options dialog box. For
more information, see Displaying Basic Map Features.
This table shows the actions that may happen if you display major and minor POIs.
If you
view
large
symbols
at data
zoom
level...
You will see
the
following
information
at data
zoom level
13-0
You will see
the
following
information
at data
zoom level
14-0
on the toolbar.
You will see
the
following
information
at data
zoom level
15-0
You will see
the
following
information
at data
zoom level
16-0
You will see
the
following
information
at data
zoom level
17-0
14 names and
small
square
symbols
15 small name of name of name of name of
46
name of
the POI
and the
large
symbol
name of
the POI
and the
large
symbol
name of
the POI
and the
large
symbol
name of
the POI
and the
large
symbol
Page 55
Customizing the Map and Tab D isplay
squares
only
16 N/A small
17, 18,
19, or
20
N/A small
the POI
and a small
square
symbol
square
symbols
only
square
symbols
and some
names of
POIs
the POI
and the
large
symbol
name of
the POI
and a small
square
symbol
name of
the POI
and a small
square
symbol
the POI
and the
large
symbol
name of
the POI
and the
large
symbol
name of
the POI
and a small
square
symbol
the POI
and the
large
symbol
name of
the POI
and the
large
symbol
name of
the POI
and the
large
symbol
Setting Units of Measure Preferences
You can change the units of measure used to represent how coordinate formats,
distance, datum, and bearing listings display. Changing these preferences affects
how units of measure display in several areas of the program: such as on the map
and in the Control Panel.
As you change your unit of measure preferences, a description of each choice
displays in the information box (in the center of the Options dialog box) immediately
after you select it.
To Change the Coordinate Preferences
Changing the coordinate preferences affects the:
• Coordinates display on the Control Panel.
• Coordinate MapNotes.
• Grid label display, if Grids are selected in Map Features.
• Any other place where coordinates display or print.
Use the following steps to change how coordinate measurement units display.
1. Click the Options button
OR
Click the arrow next to the Options toolbar button to open the menu. Then,
click Options to open the dialog box.
2. Click the Display tab.
3. Select the coordinate display format from the Coordinates drop-down list.
• Degrees
• Degrees, Minutes
• Deg, Min, Sec
• UTM/UPS (Universal Transverse Mercator/Universal Polar
Stereographic)
on the toolbar.
47
Page 56
XMap User Guide
• MGRS (Military Grid Reference System)
• USNG (United States National Grid)
• SPCS (State Plane Coordinate System)
Note When you select SPCS, an additional drop-down box displays for
Zone. Select the zone from the list.
3. Select the datum from the Datum drop-down list.
• WGS84 (World Geodetic System of 1984)
• NAD27 (North American Datum of 1927), which also includes OOH
(Old Hawaiian) Datum when in Hawaii
• NAD83 (North American Datum of 1983)
4. Click OK to commit the change and exit the Options dialog box.
OR
Click Apply to commit the change and keep working in the Options dialog
box.
Notes
• UTM/UPS and MGRS coordinate systems are best used with NAD27 datum.
95% of the USGS quads containing UTM grid lines uses the NAD27 datum,
which is helpful if you are comparing a map generated from your mappin g
application to a USGS map.
• If the USNG coordinate system is not matched with NAD83 datum, a warning
message displays (unless you selected the Do Not Show This Message Again
option).
• If the UTM/UPS or MGRS coordinate system is mismatched to WGS84 datum,
a warning message displays (unless you selected the Do Not Show This
Message Again option).
• The State Plane Coordinate System originally used NAD27 datum and was
measured in statute miles. Some states have updated their systems to
WGS84 datum and/or kilometers. If you are working with a site map, verify
the datum, distance measures, and zone used and match them in your
application.
To Change the Distance Preferences
Distance preferences affect how distance and areas display throughout the program.
Use the following steps to change the measurement units for distance and area.
1. Click the Options button
2. Click the Display tab.
3. Select the measurement from the Measurements drop-down list.
• Statute Miles (statute feet are used for small distances)
• Kilometers (meters are used for small distances)
• Nautical Miles/Feet (statute feet are used for small distances)
• Nautical Miles/Meters (meters are used for small distances)
3. Click OK to commit the change and exit the Options dialog box.
OR
Click Apply to commit the change and keep working in the Options dialog
box.
48
on the toolbar and then click Options.
Page 57
Customizing the Map and Tab D isplay
To Change the Bearing Preferences
Bearing listings are created as the result of creating route directions in the Route tab
or from an Advanced (Distance From) search in the Find tab. Bearing refers to the
compass direction of a given object measured clockwise in degrees (for example,
30°) or nearest compass point (for example, NNE) and indicated from True North or
Magnetic North.
Notes:
• Magnetic declination is the difference in degrees between True North and
Magnetic North at a specific location.
• The bearing setting does not affect map appearance.
Use the following steps to change the bearing.
1. Click the Options button
2. Click the Display tab.
3. Select the bearing from the Bearing drop-down list.
• True North—The direction to the north pole. This is the default setting.
• Magnetic North—The direction that a compass needle points.
3. Click OK to commit the change and exit the Options dialog box.
OR
Click Apply to commit the change and keep working in the Options dialog
box.
on the toolbar and then click Options.
Resizing the Map and Tab Areas
You can horizontally and vertically resize the primary (right) map, secondary (left)
map, tab area, and overview map with the map and tab area resize tools.
Notes
• The tab and overview map window size does not change when you choose
another tab.
• Some tab areas that provide search results automatically resize depending on
the number of results.
• You can also hide the tab area panel.
To Resize the Map and Tab Area Using the Drag Method
Use the drag method to horizontally or vertically resize these areas.
1. Point to the frame area between the tab and overview map windows. The
pointer becomes a
OR
Point to the horizontal edge of the tab/main map window. The pointer
becomes a
2. Drag to resize.
3. To cancel the resize while dragging, press the ESC key on your keyboard. The
size just prior to this resize is restored.
.
.
49
Page 58
XMap User Guide
To Resize the Map Area Using the Resize Tools
The map resize tool runs perpendicular to the tab area. If the secondary and primary
maps are both displaying, the resize tool is the bar that separates them. When the
bar is moved all the way to the left of the map, only the primary map displays. When
the bar is moved all the way to the right of the map, only the secondary map
displays.
There are several methods you can use to resize the map area:
• Drag the bar left to expose the area of the primary map you want to see.
• Drag the bar right to expose the area of the secondary map you want to see.
• Click the right arrow on the resize tool once to move the secondary map 1/4
of the screen width. You can repeat this step until the primary map is no
longer visible.
• Click the left arrow on the resize tool once to move the primary map 1/4 of
the screen width. You can repeat this step until the secondary map is no
longer visible.
• Double-click the bar above the right arrow to show only the secondary map.
• Double-click the bar below the left arrow to show only th e primary map.
• Double-click the bar between the right and left arrows to display an equal
percentage of both the secondary and primary maps.
To Resize the Tab and Map Area Using the Resize Tools
There are two tab area resize tools. The horizontal resize tool is located above the
tab area and lets you adjust the height of the tab area. The vertical resize tool is
located between the tab area and the overview map lets you resize the width of the
tab area.
Using the Horizontal Resize Tool
• Drag the horizontal bar up/down to expose the tab area you want to see.
• Click the up arrow on the horizontal resize tool once to incrementally increase
the tab height. You can repeat this step until the top of the tab area is flush
with the bottom of the compass rose in the control panel.
• Click the down arrow on the horizontal resize tool once to incrementally
decrease the tab height. You can repeat this step until only the tab names
display.
• Double-click the bar to the right of the up arrow to expand the tab height to
its maximum percentage (if the tab height is at the default mode or higher).
Note If the tab area is below the default mode, double-click the bar to return
the tab height to its default percentage.
• Double-click the bar to the left of the down arrow to decrease the tab height
to its minimum percentage (if the tab height is at the default mode).
Note If the tab area is above the default mode, double-click the bar to return
the tab height to its default percentage.
• Double-click the bar between the up and down arrows to return the tab height
to its default view.
50
Page 59

Customizing the Map and Tab D isplay
Using the Vertical Resize Tool
• Drag the vertical bar left to expose the area of the overview map you want to
see.
• Drag the vertical bar right to expose the tab area you want to see.
• Click the right arrow on the vertical resize tool once to incrementally increase
the tab width. You can repeat this stop until the overview map is no longer
exposed.
• Click the left arrow on the vertical resize tool on ce to incrementally increase
the width of the overview map. You can repeat this step until the tab area is
no longer exposed.
• Double-click the bar above the right arrow to show only the tab area.
• Double-click the bar below the left arrow to show only th e overview map.
• Double-click the bar between the right and left arrows to return the tab and
overview maps to their default views.
Viewing Two Maps at the Same Time
The split-window lets you view two maps at the same time.
The maps interact as follows:
• If you are viewing both the right and left maps at different data zoom levels,
a box (or lines, depending on the current data zoom level) displays on the
map that is zoomed out the furthest. The box/lines in dicate the area that is in
view on the opposite map.
• If you are viewing the right and left maps at the same data zoom level but
they are not equally represented on the screen (50/50), a box (or lines)
displays on the map that is covering the larger amount of screen area. The
box/lines indicate the area that is in view on the opposite map.
• Both windows are centered on the same coordinate position. Panning or
rotating in one map causes the same action on both maps.
• The left map window has its own zoom level controls. You can change the
zoom level of the left map without affectin g the zoom level in the right map
window. However, after you adjust the zoom level in the left map window, the
zoom tools on the Control Panel incrementally adjust the map. For example, if
the left map is at zoom level 6-0 and the right map at zoom level 8-0, and
you click the Zoom Out 1 tool, the left map displays at zoom level 5-0 and th e
right map at 7-0.
• The overview map in the tab area is always associated with the right map
window.
• Other tab functionality may be affected by use of the split-screen function, as
follows:
Draw—The line and polygon draw tools work in either map window.
The Select tool
and you can then manipulate both objects at the same time. Draw files
are created for both windows in the same project.
Route—You can create routes only in the right window; routes display
in both windows.
highlights the same draw object on both maps
51
Page 60
XMap User Guide
GPS—You can log with GPS in the right map window; log playback
displays in both windows.
3-D—The 3-D map always displays in the left map window.
Showing or Hiding Tabs
The Tab Manager feature allows you to customize your program by showing or hiding
individual tabs. You can access Tab Manager:
• During installation
• After installation using the Tab Manager option in the Options menu
• From the Start menu
Notes
• If you use Tab Manager while the program is open, you must exit and rest art
the program to view the tab changes.
• To show or hide the entire tab area panel, click the arrow next to the Options
button
to hide it, click Show Tab Area Panel to clear the check box next to it. If the
tab area is hidden and you want to show it, click Show Tab Area Panel to
select the check box.
on the toolbar. If the tab area is showing and you want
To Show Individual Tabs
Use the following steps to show tabs using Tab Manager.
1. Open XMap, click the arrow next to the Options button
toolbar, and select Tab Manager from the menu.
OR
From the Start menu, point to Programs> DeLorme>XMap...>Tools, and
then click Tab Manager.
2. Select the check box next to each tab you want to display in the program.
Note Click Default to show all the tabs in the program in the default order.
3. Click OK.
4. Exit XMap.
5. Open XMap.
To Hide Individual Tabs
Hiding tabs may significantly increase the startup speed of XMap.
Use the following steps to hide tabs using Tab Manager.
on the
1. Open XMap, click the arrow next to the Options button
toolbar, and select Tab Manager from the menu.
OR
From the Start menu, point to Programs> DeLorme>XMap...>Tools, and
then click Tab Manager.
2. Clear the check box next to each tab you want to hide in the program.
OR
Click Minimum. Only the required tabs will display in the program.
Note Find, Map Data, Info, GIS, and NetLink are required tabs and cannot be
hidden.
52
on the
Page 61
Customizing the Map and Tab D isplay
3. Click OK.
4. Exit XMap.
5. Open XMap.
Importing/Exporting Tab Manager Preferences
Tab Manager includes a feature that allows you to share your custom tab manager
preferences with other XMap users.
To Import Tab Manager Preferences
Use the following steps to import another user's Tab Manager preferences.
1. If your application is open, click the arrow next to the Options button
on the toolbar and click Tab Manager.
OR
From the Start menu, point to Programs> DeLorme>XMap...>Tools, and
then click Tab Manager.
2. Click File and then click Import.
The Import Tab Configuration dialog box opens.
3. Browse to the location of the configuration (preferences) file, select it, and
then click Open.
Tab Manager displays with the preferences saved in the imported
configuration file.
4. Click OK to close Tab Manager.
5. Exit your application.
6. Open your application.
To Export Tab Manager Preferences
Use the following steps to export your Tab Manager preferences as a configuration
file.
1. If your application is open, click the arrow next to the Options button
on the toolbar and click Tab Manager.
OR
From the Start menu, point to Programs> DeLorme>XMap...>Tools, and
then click Tab Manager.
2. Click File and then click Export.
The Export Tab Configuration dialog box opens.
3. Type a name for the configuration (preferences) file in the File Name text
box and then click Save. Configuration files are saved by default in
C:\...\DeLorme Docs\Configuration.
4. Click OK to close Tab Manager.
Reordering the Tabs
The Tab Manager feature allows you to customize your program by reordering tabs.
You can access Tab Manager:
• During installation
• After installation using the Tab Manager option in the Options menu
53
Page 62
XMap User Guide
• From the Start menu
Note If you use Tab Manager to make changes while the program is open, you must
exit and restart the program to view the tab changes.
To Reorder the Tabs
Use the following steps to reorder the tabs with Tab Manager.
1. Open XMap, click the arrow next to the Options button
on the
toolbar and click Tab Manager.
OR
From the Start menu, point to Programs> DeLorme>XMap...>Tools, and
then click Tab Manager.
2. Click the tab you want to reorder to highlight it.
3. Click the up arrow
or the down arrow to move the tab to the new
position.
4. Repeat steps 2 and 3 for each tab you want to reorder.
5. Optional. Click Default to cancel the reordering process and use the default
tab order (showing all available tabs).
6. Click OK.
7. Exit XMap.
8. Open XMap.
54
Page 63
Using Keyboard Shortcuts
Selecting a Keyboard Shortcut Scheme
Your application comes with the following DeLorme keyboard shortcut schemes:
• 3-D Navigation
• Desktop Mapping
• In-vehicle Navigation
You cannot edit DeLorme schemes; however, you can create custom schemes that
you can edit. You can create as many additional custom schemes as you need.
To Select a Keyboard Shortcut Scheme
Use the following steps to select a keyboard shortcut scheme.
1. Click the Options button
OR
Click the arrow next to the Options toolbar button to open the menu. Then,
click Options to open the dialog box.
2. Click the Keyboard Shortcuts tab.
3. Select a scheme from the Scheme drop-down list.
4. Click Apply to activate the selected scheme.
on the toolbar.
Creating a New Custom Scheme
You can create a custom keyboard shortcut scheme for different program uses.
To Create a Custom Scheme
Use the following steps to create a custom scheme.
1. Click the Options button
OR
Click the arrow next to the Options toolbar button to open the menu. Then,
click Options to open the dialog box.
2. Click the Keyboard Shortcuts tab.
3. Click File and then click New.
The Scheme drop-down list is completed with Custom Scheme# (where #
indicates the incremental number for the number of custom scheme files you
have created).
Note If you want to rename the new scheme file, click File, click Rename,
and then type a new name in the Scheme text box. Press the ENTER key on
your keyboard when finished. The new name displays.
4. Assign keyboard shortcuts for the commands that are listed.
on the toolbar.
Assigning Keyboard Shortcuts in a Custom Scheme
There are three DeLorme keyboard shortcut schemes that you cannot edit; however,
you can create a custom scheme that you can edit with Keyboard Shortcuts tab in
the Options dialog box.
55
Page 64

XMap User Guide
To Assign Keyboard Shortcuts in a Custom Scheme
Use the following steps to edit a custom scheme.
1. Click the Options button
on the toolbar.
OR
Click the arrow next to the Options toolbar button to open the menu. Then,
click Options to open the dialog box.
2. Click the Keyboard Shortcuts tab.
3. Select a custom scheme from the Scheme drop-down list.
Note You cannot edit DeLorme schemes.
4. Select the List option (if it is not already selected).
5. Select the command grouping you want to assign shortcuts to from the
Commands drop-down list. If you want assign shortcuts to several
groupings, select All Commands.
6. Click to select the command you want to assign a shortcut to.
7. Click inside the Customize Shortcut text box.
8. Press the shortcut key combination on your keyboard that you want to assign
for that command.
9. Click Assign. The shortcut for that command changes to the combination you
assigned and displays as "pending."
10. Repeat the steps for each command you want to assign.
11. Click Apply to save the changes.
OR
Click OK to save the changes and close the Options dialog box.
OR
Click Cancel to cancel your pending changes and close the Options dialog
box.
Notes
• You can sort the command list view at any time by clicking the heading you want
to sort by (Group, Command, or Shortcut).
• You cannot change the following keyboard shortcut combinations:
o ALT+F4 (Close Window)
o F1 (Help)
o ALT+F1 (Help Menu)
o SHIFT+F10 (Context Menu)
CTRL
o
+C (Copy)
o CTRL+V (Paste)
o CTRL+X (Cut)
o CTRL+Y (Redo)
o CTRL+Z (Undo)
o ALT+M (Set Focus on Map)
a. You cannot use the following keys when assigning shortcuts:
o Windows Key
o Application Key
o Print Screen
56
Page 65
Using Keyboard Shortcuts
o Scroll Lock
o Sleep
o Pause/Break
o Enter
o Caps Lock
o Num Lock
o Spacebar
o Insert
o Backspace
o Multi-media Keys
b. You cannot assign a letter or number on its own. For example, you cannot assign
a keyboard shortcut with the number 3; you must use a modifier (such as CTRL
or ALT) with letters and numbers.
Customizing a DeLorme Scheme
You cannot edit DeLorme schemes; however, you can create a copy of a DeLorme
scheme that you can modify to fit your needs.
To Customize a DeLorme Scheme
Use the following steps to customize a DeLorme scheme.
1. Click the Options button
OR
Click the arrow next to the Options toolbar button to open the menu. Then,
click Options to open the dialog box.
2. Click the Keyboard Shortcuts tab.
3. Select the DeLorme scheme you want to copy from the Scheme drop-down
list.
4. Click File and then click Copy.
The active scheme changes to Copy of Desktop Mapping#, Copy of In-vehicle
Navigation#, Copy of 3-D Navigation#, etc. (depending on the DeLorme
scheme you chose to copy).
5. Assign keyboard shortcuts for the copied scheme.
6. Optional. Rename the scheme.
on the toolbar.
Renaming a Custom Scheme
Custom schemes can be renamed to whatever name you choose. You cannot rename
DeLorme schemes.
To Rename a Custom Scheme
Use the following steps to rename a custom scheme.
1. Click the Options button
OR
Click the arrow next to the Options toolbar button to open the menu. Then,
click Options to open the dialog box.
on the toolbar.
57
Page 66
XMap User Guide
2. Click the Keyboard Shortcuts tab.
3. Select the custom scheme you want to rename from the Scheme drop-down
list.
4. Click File and then click Rename.
The Scheme text box becomes active.
5. Type the name in the Scheme text box.
6. Click Apply. The new name displays.
OR
Press the ENTER key on your keyboard. The new name displays.
OR
Press the ESC key on your keyboard to keep the old name.
Deleting a Custom Scheme
Once you have created a custom scheme, you can delete it at any time. You cannot
delete DeLorme schemes.
To Delete a Custom Scheme
Use the following steps to delete a custom keyboard shortcut scheme.
1. Click the Options button
OR
Click the arrow next to the Options toolbar button to open the menu. Then,
click Options to open the dialog box.
2. Click the Keyboard Shortcuts tab.
3. Select the custom scheme you want to delete from the Scheme drop-down
list.
4. Click File and then click Delete.
5. Click Yes when asked if you are sure you want to delete the scheme.
on the toolbar.
Importing a Custom Scheme
You can share their keyboard shortcut schemes with other DeLorme users.
To Import a Custom Scheme
Use the following steps to import a custom scheme.
1. Click the Options button
OR
Click the arrow next to the Options toolbar button to open the menu. Then,
click Options to open the dialog box.
2. Click the Keyboard Shortcuts tab.
3. Click File and then click Import.
The Import Scheme File dialog box opens.
4. Browse to the location where you saved the .keyscheme file, select it, and
then click Open.
The imported file is now your active scheme.
on the toolbar.
58
Page 67
Using Keyboard Shortcuts
Exporting a Custom Scheme
You can share their keyboard shortcut schemes with other DeLorme users.
To Export a Custom Scheme
Use the following steps to export a custom scheme.
1. Click the Options button
OR
Click the arrow next to the Options toolbar button to open the menu. Then,
click Options to open the dialog box.
2. Click the Keyboard Shortcuts tab.
3. Select the scheme you want to export from the Scheme drop-down list.
4. Click File and then click Export.
The Export Scheme File dialog box opens.
5. Type a name in the File Name text box, browse to the location where you
want to save the .keyscheme file, and then click Save.
on the toolbar.
Searching For Commands
The Keyboard Shortcuts tab in the Options dialog box has a Search feature that lets
you search for a specific command or command group.
Note You can sort the command list view at any time by clicking the heading you
want to sort by (Group, Command, or Shortcut).
To Search For a Command or Command Group
Use the following steps to search for a command or command group.
1. Click the Options button
OR
Click the arrow next to the Options toolbar button to open the menu. Then,
click Options to open the dialog box.
2. Click the Keyboard Shortcuts tab.
3. Select the Search option.
4. In the Commands text box, begin typing the name of the command or
command group you are searching for. As you type, the list box under the
Commands text box displays word matches.
on the toolbar.
Viewing All of the Shortcut Keys for a Scheme
The Reference Card option in the Keyboard Shortcuts tab lets you view a complete
list of all of the scheme's shortcut keys.
To View a List of Shortcut Keys
Use the following steps to view a list of shortcut keys for a scheme.
1. Click the Options button
OR
on the toolbar.
59
Page 68

XMap User Guide
Click the arrow next to the Options toolbar button to open the menu. Then,
click Options to open the dialog box.
2. Click the Keyboard Shortcuts tab.
3. Select the scheme that contains the shortcut keys you want to view from the
Scheme drop-down list.
4. Optional. To sort the list view, click the heading you want to sort by (Group,
Command, or Shortcut).
5. Click Reference Card.
The list displays in your default Web browser and is sorted by the same
column you selected in step 3.
6. Optional. Print the list from your Web browser.
Tips for printing a reference card from your Web browser
• Use the Print Preview functionality in your Web browser to see if the list will
display as you want it to. If you do not like the way the list looks in the
preview (for example, the list prints without grid lines in the table or does not
print in color), change the advanced print settings in your Web browser.
• If you want to remove the header and footer text from the printout, from the
File menu, select Page Setup. Remove the text and the header and footer
text boxes and then click OK.
• Changes made to the browser's advanced print settings and page setup affect
the printing of all Web pages.
60
Page 69

Using Projects
Map Data Overview
XMap lets you save all of the work that you have done as a single project file so y o u
can open it again later. You can create various map views and save each in a
different project.
What is a Project?
A project includes the current GIS workspace, map center coordinates, the current
data zoom level, the current magnification, rotation, preferences, and links to routes
or draw layers you have added to it.
As you create routes, draw, and GIS layers, they are added to the currently selected
project. Projects are saved by default in C:\...\DeLorme Docs\Projects.
Each associated file is saved in its respective folder in the DeLorme Docs directory.
For example, a draw layer is saved in C:\...\DeLorme Docs\Draw.
Can I Reuse Draw Layers and Routes in Other Projects?
After you create routes or add your own roads, you may not want to do all of the
work again in another project. You can share routes and draw layers between
projects using the Add button on the Map Data tab.
Can I Send Routes or Draw Layers to Another XMap User?
You can package projects, including their routes and draw layers, into one transfer
file for convenience. The transfer file facilitates e-mailing, copying project
information to other computers, and copying projects between DeLorme programs.
You can use MapShare to share maps, routes, or profiles with non-XMap users. For
more information, see To Share Maps.
Migrating Data to the New DeLorme Docs Locations
In previous versions of XMap, and in other DeLorme products, your projects, draw
files, route files, log files, XData files, imagery, and other DeLorme files were stored
by default in the DeLorme Docs folder on the root of your computer's C drive unless
you specified a different directory during installation.
In XMap 6:
• The DeLorme Docs folder for all files except NetLink downloads is located in
the My Documents (Windows XP) or Documents (Windows Vista) folder under
your user name.
• The DeLorme Docs folder for NetLink downloads is located in the DeLorme
Docs folder under Shared Documents (Windows XP) or Public Documents
(Windows Vista). This allows all users on the computer to access NetLink
downloads.
What is Migration?
The migration process does not move your files—it copies them to the new locations.
When you are sure your files are working correctly in the new locations, you can
delete them from the old locations as long as you are not using them for another
DeLorme program. For example, if you have an imagery file you use in a previous
61
Page 70

XMap User Guide
version of XMap or in Topo USA or XMap, keep both files. Eventually, all DeLorme
programs will be moved to the new file system.
Because all new information you add to a project will be saved to the new file
location—even if you open it from the old location, we strongly recommend that you
migrate your files. If you do not, you could have project data in two DeLorme Docs
locations; your project will work correctly, but your data will not all be in the same
location.
Initial Migration
The initial migration process, which occurs when you open XM ap 6 the first time,
copies the data in the existing NetLink Downloads, Symbols, and GPSLogs folders to
their new locations as indicated above.
Note The automatic migration process copies files from only one existing DeLorme
Docs location. If you have more than one DeLorme Docs location on your computer,
only one location will be recognized
New Users
When you installed XMap 6 on your computer, you were asked if you had previously
installed a DeLorme program. If you had not, you clicked New User and the
application opened. The migration process does not apply to you if you have never
installed a DeLorme program on your computer.
Existing Users
When you open XMap 6 for the first time after installation, your computer is scanned
for an existing DeLorme Docs directory. If a DeLorme Docs directory is found, any
data in the existing NetLink Downloads, Symbols, and GPSLogs folders was copied to
their new locations as indicated above.
If an existing DeLorme Docs folder is not automatically detected on your computer,
you were asked if you had previously installed a DeLorme program. If you had, you
clicked Existing User which opened a dialog box for browsing to the existing DeLorme
Docs location and choosing one of the following migration options:
• Migrate–The data in the NetLink Downloads, Symbols, and GPSLogs fo lders
was migrated to their new DeLorme Docs locations.
• Don't Migrate–The migration was cancelled and any data in the NetLink
Downloads, Symbols, and GPSLogs folders was not migrated. You will not be
prompted to migrate again.
• Try Again Later–Cancels the migration, but you are prompted to migrate the
next time you open XMap. You will be prompted each time you open the
program until you select Migrate or Don't Migrate.
Project Migration
When you migrate a project, all associated files (routes, draw layers, XData sets, and
connections to GIS layers in a database) are moved with it. When you open a project
from any location other than the new DeLorme Docs location, you are prompted to
migrate it. You can also directly migrate projects.
To Migrate a Project When You Open It
Use the following steps to migrate a project when you open it.
1. Open a project.
2. When the Migrate Project dialog box opens, click Migrate.
The Migration Completed dialog box opens. Go to step 4.
62
Page 71

Using Projects
OR
If a file with the same name already exists in the new DeLorme Docs location,
the Confirm Link to Existing File dialog box opens. Go to step 3.
3. Click Link to replace the project link to the existing file in the new location
and then go to step 4.
OR
Click Link All to replace any project links to existing files in the new location
and then go to step 4.
OR
Click Save Copy to maintain the project link to the current file and save it
with a different name.
OR
Click Cancel to stop the migration process and roll back any file migration
that has occurred up to this point.
4. In the Migration Completed dialog box, click OK to open the migrated project.
Note If there is a problem with the migration, a message will notify you of
any corrective action you need to take.
To Directly Migrate a Project
Use the following steps to migrate a project at any time.
1. Click the arrow next to the Open button
on the toolbar and then click
Migrate Project.
OR
Click the Map Data tab, click File, and then click Migrate Project.
The Migrate Project dialog box opens.
2. Browse to the project you want to migrate, click the project, and then click
Migrate.
3. The Migration Completed dialog box opens. Go to step 5.
OR
If a file with the same name already exists in the new DeLorme Docs location,
the Confirm Link to Existing File dialog box opens. Go to step 4.
4. Click Link to replace the project link to the existing file in the new location
and then go to step 5.
OR
Click Link All to replace any project links to existing files in the new location
and then go to step 5.
OR
Click Save Copy to maintain the project link to the current file and save it
with a different name.
OR
Click Cancel to stop the migration process and roll back any file migration
that has occurred up to this point.
5. In the Migration Completed dialog box, click Open to open the migrated
project or Close to close the dialog box and return to your last active project.
Note If there is a problem with the migration, a message will notify you of
any corrective action you need to take.
63
Page 72

XMap User Guide
Managing Data
Adding Data and Imagery to XMap
XMap is compatible with a variety of DeLorme datasets and imagery formats. You
may have some of these datasets installed on your hard drive, or you may access
the data on a DVD.
Whether the data is on a DVD or saved on your hard drive, you can choose to add
the data to current and future projects or only the current project.
Notes
• When adding third-party imagery formats, such as MrSID (.sid) and GeoTIFF
(.tif), a DeLorme .adc file is automatically created in the directory where the
data resides. This file is a connection between the original data and the
DeLorme application.
• When you add MrSID or GeoTIFF to future projects, you can select the .adc
file to automatically add the data. If you select the .sid or .tif extension, an
.adc file with the same name is created and you are prompted to overwrite
the file name if it exists.
Adding Data to Current and Future Projects
Data that is in current and future projects is considered "base data." If your data is
saved on your hard drive, you must update the Base Data settings in the Map Data
tab to include that data in your current and future projects.
Note If you are accessing data from a DVD, your data is added to every project you
create while the DVD is in the DVD drive and it is not necessary for you to follow the
steps below.
Use the following steps to add data to current and future projects.
1. Click the Map Data tab.
2. Create a new or open an existing project.
3. Click Data and then click Base Data.
The Data Locations dialog box opens listing each of the data sources on your
system.
4. Click Add, select the hard drive location where your saved your data from the
Browse for Folder dialog box, and click OK. The OK button is enabled when
you select a folder containing a file that contains the .adc file of the map data
being added.
Note Your hard drive location may already be listed in the Data Location
dialog box, but the check box for that location might not be selected. Ensure
all of the data locations you want to display in your current and future
projects have selected check boxes.
5. Click Done.
Adding Data to the Current Project
You can choose to add data to only the current project if the data is saved on your
hard drive. Any data on a DVD in your DVD drive displays in your projects as long as
the DVD is in the drive.
Use the following steps to add data to the current project.
1. Click the Map Data tab.
64
Page 73
Using Projects
2. If the project you want to add data to is not displaying, open the project.
Note To verify the project you want is displaying, check the title bar. The
project name displays directly after the product name.
3. Click Data and then click Add.
The Add Data to Maps dialog box opens.
4. Browse to the folder where the file you want to add is located and click the
file to select it.
5. Select the map you want to add the file to (primary, secondary, or both) from
the Add To drop-down list.
6. Click Add. The file is added to the current project under the selected map.
Note If you add a file to a project and later update the file, the file is
updated in every project you have added to.
7. Save your project. Projects have .xmp extensions and are saved by default in
C:\...\DeLorme Docs\Projects.
Notes
• For information about migrating data to XMap 6, see Migrating Data to the New
DeLorme Docs Location.
• Select the check box next to a file to display it. Clear the check box to hide it.
• Use the Move to Primary Map
and Move to Secondary Map buttons to
move datasets from one map to the other.
Adding/Removing Base Data
Use the Base Data function in the Map Data tab to modify the default map data
source(s) for your current and future projects.
To Add Base Data
Use the following steps to add base data to your current and future projects.
1. Click the Map Data tab.
2. Create a new or open an existing project.
3. Click Data and then click Base Data.
The Data Locations dialog box opens and lists each of the data sources on
your system.
4. Select the check box next to the data source you want to use as a data
source for your current and future projects.
AND/OR
Click Add, select a data folder from the Browse for Folder dialog box, and
click OK.
5. Click Done.
To Remove Base Data
Use the following steps to remove base data from your current and future projects.
1. Click the Map Data tab.
2. Create a new or open an existing project.
3. Click Data and then click Base Data.
The Data Locations dialog box opens and lists each of the data sources on
your system.
4. Click to select the data source you want to remove from your current and
future projects. Click Remove. Click OK when the confirmation message
65
Page 74
XMap User Guide
displays. The base data is removed from the list.
OR
Clear the check box next to the base data you want to remove. The base data
is kept in the list, but is removed from the current and future projects.
5. Click Done.
Setting Data as Routing Data
The first dataset added to your project is the default routing dataset; however, not
all datasets support road and direct routing. If you are using more than one dataset
in XMap, you can determine which dataset to use for routing.
To Set Data to be Used as Routing Data
Use the following steps to assign a dataset for routing.
1. Click the Map Data tab.
In the Primary Map window, the dataset that is currently set to be used for
routing displays the routing icon
2. Under Primary Map, highlight the dataset you want to assign as your routing
dataset.
3. Click Data and then click Set as Routing Data.
The routing data is updated and the routing icon
dataset highlighted in step 2.
OR
Right-click the selected dataset and click Set as Routing Data.
The routing data is updated and the routing icon
dataset highlighted in step 2.
to the left of the dataset name.
displays next to the
displays next to the
Viewing Data from NetLink
When you use NetLink to download imagery and data, the dataset is automatically
listed as base data. Downloaded imagery is saved by default in saved in
C:\...\DeLorme Docs\Downloads. If you purchased a DVD, you can add your imagery
and data to your current and future projects by adding it as base data.
Note Not all data displays at all data zoom levels.
To View Imagery
Use the following steps to view imagery.
1. Click the Map Data tab.
2. Under Primary Map and/or Secondary Map (depending on the map window
you want to use to view the dataset), click the plus sign next to the dataset.
3. Double-click the file name.
The imagery displays on the map(s).
ADP Data
If you have an ADP (Aerial Data Packet) dataset from a previous version of a
DeLorme application, you still have access to it.
To Designate Which ADP Layer Displays on the Map
Once the dataset is listed in the Map Data tab, you can designate which layer you
want to display on the map. For example, an ADP dataset may consist of DOQQ data
and Sat 10 data. If you select both of these, the last check box you select is the data
that displays on the map.
Use the following steps to designate which data layer to display on the map.
66
Page 75

Using Projects
1. Click the Map Data tab.
2. Under Primary Map and/or Secondary Map (depending on the map window
you want to use to view the dataset), click the plus sign next to ADP
Dataset.
Each of your ADP datasets display.
3. Click the plus sign next to the ADP location.
The contents of the dataset display.
4. If the check box next to the data layer you want to display on the map is
selected, clear the check box and then select it again. The data layer displays
on the map.
OR
If the check box next to the data layer you want to display is cleared, select
the check box. The data layer displays on the map.
Managing Projects
Creating and Deleting Projects
You can create different data configurations and save them in separate projects.
To Create a New Project
When you create a new project, all of the data selected as your base data is
available in the new project. For more information, see Adding/Removing Base Data.
Use the following steps to create a new project.
1. Click the Map Data tab.
2. Click File and then click New.
A new untitled project opens, using the last map view as the default view.
Untitled # displays in the title bar after the product name.
OR
To name the file and save it, click File and then click Save As. Type the
name in the File Name text box and then click Save.
Note Projects have .xmp extensions and are saved by default in
C:\...\DeLorme Docs\Projects.
To Delete a Project
Use the following steps to delete a project.
1. On your computer, browse to the location of the project you want to delete.
Note Projects have .xmp extensions and are saved by default in
C:\...\DeLorme Docs\Projects. Projects created in XMap 5.x or earlier are
stored in the DeLorme Docs folder on the root of your C drive. For more
information, see Migrating Data to the New DeLorme Docs Location.
2. Select the file from the file list and then click the Delete button on the
toolbar or press the DELETE key on your keyboard.
OR
Right-click the file in the file list and click Delete.
Tip You can open a project to verify it is the one you want to delete. For more
information, see Opening a Project.
Opening a Project
You can open projects created in all versions of XMap.
To Open a Project
67
Page 76
XMap User Guide
Use the following steps to open a project.
1. Open a project from the toolbar.
OR
Click the Map Data tab, click File, and then click Open.
The Open File dialog box opens.
Note If you made changes to a project that is already open, the Save
Changes dialog box opens. Note Projects have .xmp extensions and are
saved by default in C:\...\DeLorme Docs\Projects.
2. Click the project and then click Open.
The last saved map view for that project displays.
OR
Double-click the project. The last saved map view for that project displays.
Note If the project has not been migrated to the new DeLorme Docs location,
you will be prompted to migrate it. Click Migrate to create a copy of the file
in the new DeLorme Docs location. Click No to cancel. For more information
about migrating projects, see Migrating Data to the New DeLorme Docs
Location.
Saving a Project
Use the Map Data tab to save each of your projects quickly and easily using one of
the following methods:
• Click File and then click Save or click the Save button
.
o If you have not saved the project before, the Save File dialog box
opens. Type a file name in the File Name text box and click Save.
o If you have saved the project before, the Save dialog box opens. All of
the changes made to the current project display as a check list. Select
the check box next to each change you want to save and clear the
check box next to each change you do not want to save. Click Yes to
save the selected changes, click No to save the file without the
changes, or click Cancel to cancel the saving process.
• Click File and then click Save As.
The Save File dialog box opens. Type a file name in the File Name text box
and click Save.
You can also click the Save button
on the toolbar.
Adding/Removing Files in a Project
As you create new GIS layers, routes, draw layers, XData datasets, and so on, or
need to add more datasets to the Map Data tab, they are added to the current
project.
To Add Files to a Project
Use the following steps to add specific files to a particular project.
1. Click the Map Data tab.
2. If the project you want to add files to is not displaying, open the project.
The contents of the current project display in the primary map window on the
right side of the dialog area.
Note To verify the correct project is displaying, check the title bar. The
project name displays directly after the product name.
68
Page 77
Using Projects
3. To add a new route or draw file, click Data, click New, and then click Draw
File or Route File.
A new draw or route file is added to your project.
OR
To add an existing route, draw, .adc, .dcf, .tif, .sid, .txt, or .dds file:
a. Click Data and then click Add.
The Add Data to Maps dialog box opens.
b. Browse to the folder where the file you want to add is located and click
to select it.
c. Select the map you want to add the file to (primary, secondary, or
both) from the Add To drop-down list.
Notes
• .adc, .txt, .tif, and .sid files are the only files you can add to
both the primary and secondary maps.
• .sid and .tiff/.tif files must contain spatial reference information
to add them. If they do not, an error message displays and you
must use a third-party application to specify the spatial
reference information.
d. Click Add.
The file is added to the current project under the selected map.
Note If you add a file to a project and then edit and save it later, the
file is updated in every project you have added it to. This does not
apply to raster property settings for .sid and .tiff/.tif data.
4. Save the project. Projects have .xmp extensions and are saved by default in
C:\...\DeLorme Docs\Projects.
To Remove Files in a Project
Use the following steps to add or delete specific files in a particular project.
1. Click the Map Data tab.
2. If the project you want to remove files from is not displaying, open the
project.
The contents of the current project display in the primary map window on the
right side of the dialog area.
Note To verify the correct project is displaying, check the title bar. The
project name displays directly after the product name.
3. To remove a file, select that file from the project list on the Map Data tab and
then click the Remove button
.
Note This does not delete the file; it removes it from the selected project.
4. Save the project. Projects have .xmp extensions and are saved by default in
C:\...\DeLorme Docs\Projects.
Notes
• Projects created in XMap 5.x or earlier are stored in the DeLorme Docs folder
on the root of your C drive. For more information, see Migrating Data to the
New DeLorme Docs Location.
• Select the check box next to a file to display it. Clear the check box to hide it.
• Use the Move to Primary Map
and Move to Secondary Map buttons to
move datasets from one map to the other.
Renaming a Project
69
Page 78

XMap User Guide
Projects are untitled when you first add them to XMap. When you save the map, you
can accept the default name or give it a specific name. When you have many
different projects and are trying to locate a specific map view, you may find it more
helpful to rename the project.
To Rename a Project
Use the following steps to rename a project.
1. Click the Map Data tab.
2. If the project you want to add/delete files for is not displaying, open the
project.
The contents of the current project display in the Primary Map window on the
right side of the dialog area.
Note To verify the correct project is displaying, check the title bar. The
project name displays directly after the product name.
3. Click File and then click Save As.
The Save File dialog box opens.
4. Type the name in the text box and then click Save.
You now have two files; one with the original name and one with the new
name.
Using Transfer Files
Using Transfer Files Overview
This section describes how to create, import, and e-mail a transfer file. You can
package projects, including their routes, draw layers, and other contents, into one
transfer file for convenience. The transfer file facilitates e-mailing, copying project
information to other computers, and copying projects between DeLorme programs.
Transfer files do not include map data or GIS data.
Creating Transfer Files
A project and its contents can be packaged into a single file, called a transfer file, to
facilitate e-mailing or copying.
You can create a transfer file with or without hyperlinked file attachments. When you
create a transfer file with hyperlinked files, you h ave the option of saving the
common directory structure of the hyperlinked files. Saving the directory structure of
common files can be helpful when you are sharing and updating transfer files.
Transfer files do not include map data or GIS data.
To Create a Transfer File
Use the following steps to create a transfer file.
1. Click the Map Data tab.
2. Open the project you want to create as a transfer file.
3. Click File, click Transfer, and then click Create.
The Create Transfer File dialog box opens.
4. In the File Name text box, type the file name.
Transfer files have .dmt extensions and are saved by default in
C:\...\DeLorme Docs\Projects.
5. Click Create.
Your file is created and saved in the specified location.
70
Page 79
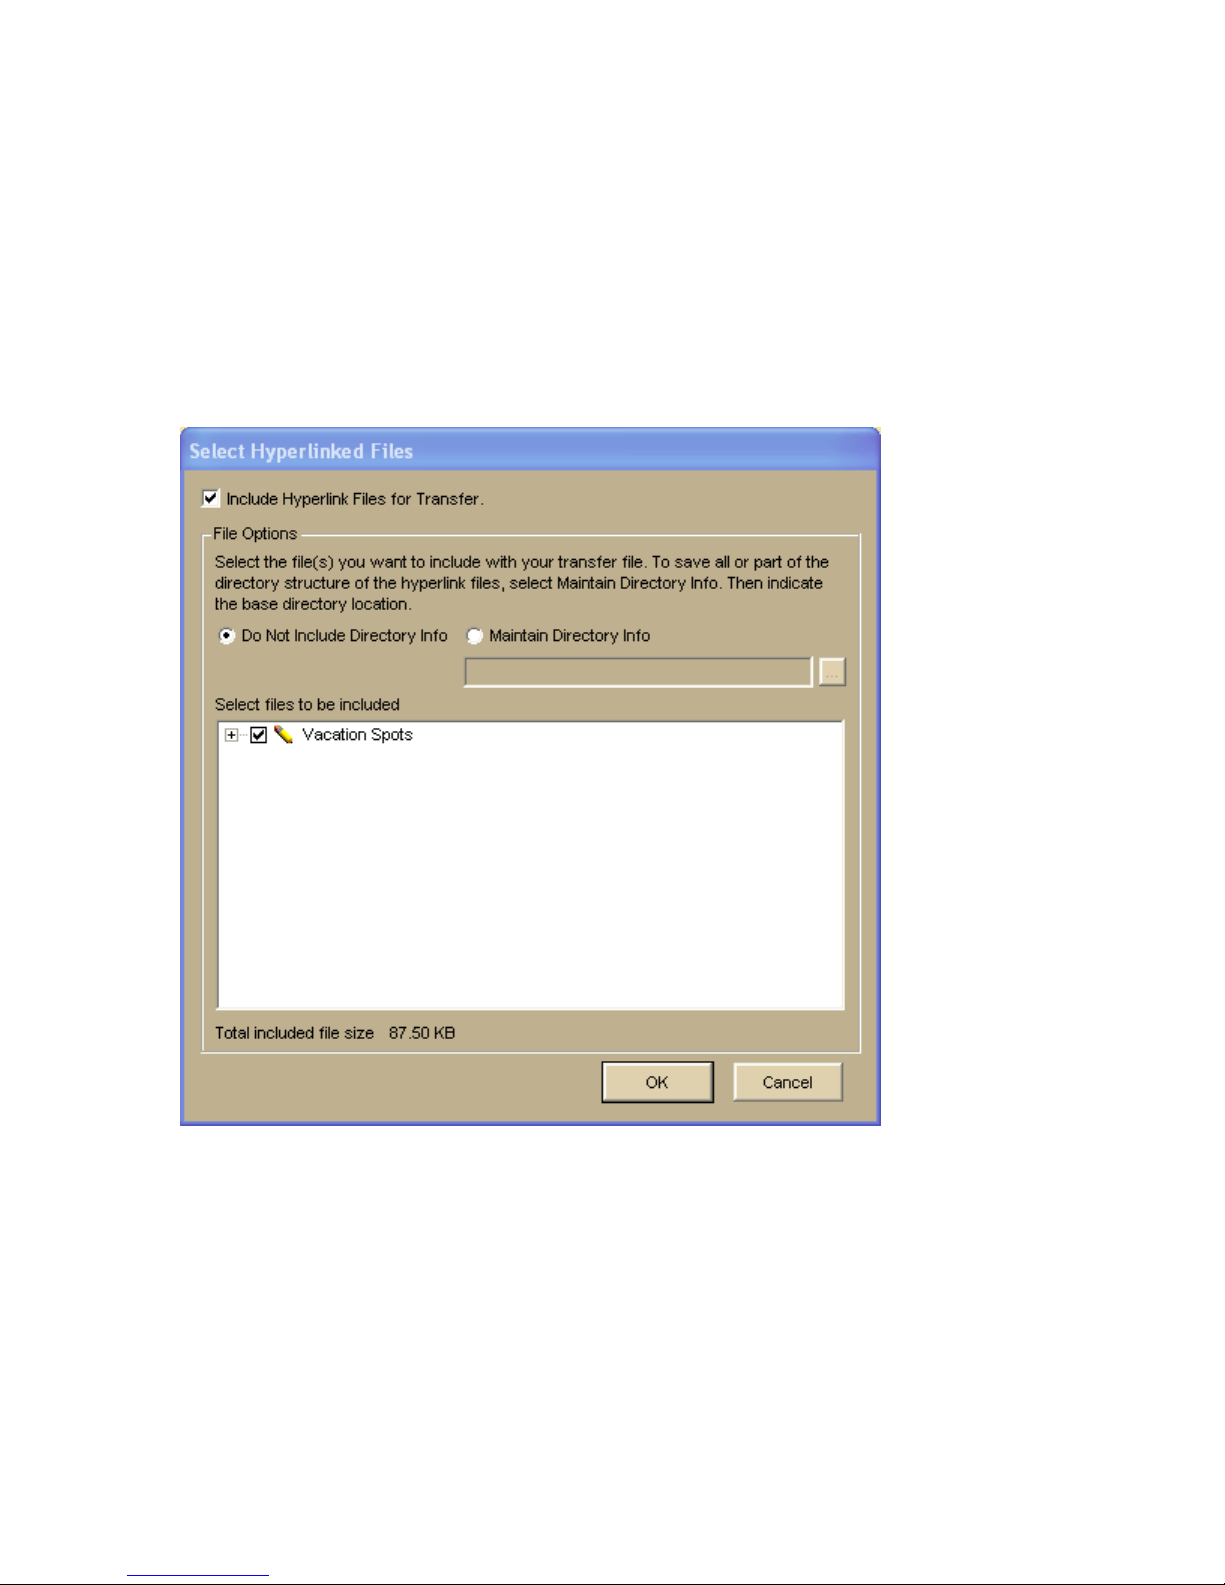
Using Projects
To Maintain the Directory Structure When Creating a Transfer File with
Hyperlinked Files
When you create a transfer file containing hyperlinked files, you can select to
maintain part of the directory structure for files with at least a common drive
location.
Use the following steps to create a transfer file with hyperlinked files.
1. Click the Map Data tab.
2. Open the project you want to create as a transfer file.
3. Click File, click Transfer, and then click Create. The following dialog box
opens.
4. Verify the Include Hyperlink Files for Transfer check box is selected.
If you do not want to include hyperlink files in you r transfer file, clear this
check box and go to step 8.
5. Under File Options, select Maintain Directory Info to save the directory
structure of the hyperlinked files.
If you do not want to include the directory information for the hyperlinked
files in the transfer file, select Do Not Include Directory Info and go to
step 7.
6. Type the common base directory location of the hyperlinked files (up to the
folder location that you want to mainta in) in the text box.
OR
71
Page 80

XMap User Guide
Click the Browse button
and browse to the common base directory
location.
7. Under Select Files to Be Included, clear the check box next to each file you
do not want to include in your transfer file.
8. Click OK.
The Create Transfer File dialog box opens.
9. In the File Name text box, type the file name.
Transfer files have .dmt extensions and are saved by default in
C:\...\DeLorme Docs\Projects.
10. Click Create.
Your file is created and saved in the specified location. The default location for
imported transfer file attachments is C:\...\DeLorme Docs\Transfer Files.
Importing Transfer Files
You can package a project and its contents into a single file, called a transfer file, to
facilitate e-mailing or copying. You can also import transfer f iles, allowing you to
share your projects with other DeLorme users.
You can import a transfer file with or without attached hyperlink files. When you
create a transfer file with hyperlinked files, you can choose t o maintain the directory
information of common files. By doing this, the recipient of the transfer file can keep
a similar directory structure as the creator. This is helpful when a transfer file is
shared and updated between users. Transfer files do not include map data or GIS
data.
To Import a Transfer File
Use the following steps to import a transfer file, including transfer files that have
been e-mailed to you by other DeLorme users.
1. Click the Map Data tab.
2. Click File, click Transfer, and then click Import.
The Import Transfer File dialog box opens. The default location is
C:\...\DeLorme Docs\Projects. Browse to another location to change it.
Transfer files have .dmt extensions.
3. Click a file to select it.
The name displays in the File Name text box.
4. Click Import to finish the import process.
The imported project opens and displays in the map view.
To Import a Transfer File with Hyperlinked Files
Use the following steps to import a transfer file that includes hyperlinked file
attachments.
1. Click the Map Data tab.
2. Click File, click Transfer, and then click Import.
The Import Transfer File dialog box opens. The C:\...\DeLorme Docs\Projects
directory displays by default. Browse to another location to change it.
Transfer files have .dmt extensions.
3. Click a file to select it. The name displays in the File Name text box.
4. Click Import. The Browse for Folder dialog box opens.
72
Page 81

Using Projects
5. Select the folder where you want to save the hyperlinked files. The default
location is C:\...\DeLorme Docs\Transfer Files. Transfer files have .dmt
extensions.
6. Click OK.
The imported project opens in the map view.
E-mailing a Transfer File
You can package a project and its contents into a single file, called a transfer file, to
facilitate e-mailing or copying. Transfer files do not include map data or GIS data.
To E-mail a Transfer File
This procedure creates an attachment file but does not permanently save a file to
C:\...\DeLorme Docs\Projects.
Use the following steps to e-mail a transfer file.
1. Click the Map Data tab.
2. Open the project you want to e-mail as a transfer file.
3. Click File, click Transfer, and then click E-mail.
A transfer file is created and your computer's default operating system e-mail
program opens with the transfer file included as an attachment.
4. Complete the e-mail in accordance with your e-mail program.
Changing the Properties of Your Data
Changing the Properties in Your Data Overview
You can adjust the properties of some data categories to accommodate your needs.
For example, you can adjust the shaded relief properties to account for the sun
shining in a different direction, have contours display at varying den sities at
particular zoom levels, etc.
Each dataset contains its own sub-categories of data (raster, vector, contours, etc.).
Because of this, not all of the property information in this section of the Help will
pertain to every dataset.
Note It is important to remember that any changes made to the dataset properties
are permanent only when saved in a project.
Changing Imagery Display
When you use the Map Data tab to add imagery files, such as GeoTIFF, imagery, and
ImageReg data, or data and imagery downloads from NetLink, to a map—by default,
the image appears on top of any DeLorme vector base map by default. However, you
can customize the layering sequence so that selected vector map features (roads,
contours, etc.) appear on top of the image. Any added imagery files are listed in the
Map Data tree view under the appropriate series.
To Change the Properties of an Imagery File
Use the following steps to change the properties of an imagery file.
1. Click the Map Data tab.
2. Under Secondary Map or Primary Map, click the plus sign next to the
imagery series you want to modify.
3. Click the plus sign next to the specific imagery file you want to modify.
The types of imagery in the file display.
73
Page 82

XMap User Guide
4. Right-click the imagery file and click Properties.
The Raster Properties dialog box opens.
5. Optional. For MrSID and some types of GeoTIFF data, you may be able to
select a color to display as transparent (for example, black). To do so, select
the Transparent Color check box, select a color, and click OK. Note that
doing so makes the default transparent color (bright pink) show around the
imagery.
OR
If you do not want to select a color to display as transparent, click Next.
6. Type the minimum and maximum data zoom range for your custom raster
properties in the text boxes.
7. Select the raster data position for that data zoom range from the drop-down
list.
Note The raster data position you select includes all of the options above it
in the list.
8. Click Add Change to update your data positioning selections to the map. You
must perform this step to apply any change.
9. Click Next.
10. Drag the gray tab markers to the minimum and maximum data zoom levels
at which you want to see the imagery file on the map.
11. Click Next.
12. Select the check box next to each connection usage you want to include with
your raster properties.
13. Click Finish.
Changing Point Properties
Use the Properties option on the Map Data tab to change the properties of various
map features such as rasters, vectors, shaded relief, contours, points, etc.
Note You must select to show points of interest in the Display tab of the options
dialog box to view any changes made to the point properties on the map. See
Displaying Basic Map Features for information on showing/hiding points of interest.
To Change Point Properties
Use the following steps to change the properties of point data.
1. Click the Map Data tab.
2. Under Secondary Map or Primary Map, click the plus sign next to the
dataset for which you want to modify the properties.
3. Click the plus sign next to the sub-data category.
4. Highlight Map Points, click Data, and then click Properties.
The Point Properties dialog box opens.
OR
Right-click Map Points and click Properties.
The Point Properties dialog box opens.
5. Under Set Data Zoom Range For Display, drag the gray tab markers to the
minimum and maximum level you want.
The minimum and maximum zoom range displays above the Set Zoom Range
For Display area.
Note The Show URLs check box is enabled if your dataset supports showing
points as hyperlinks on the map.
74
Page 83

Using Projects
6. Click Next.
7. Review the dataset information and click Next, if applicable.
8. Select the check box next to each connection usage you want to include with
your point properties.
9. Click Finish.
The Point Properties for that dataset are modified and are visible on the map.
Note The point property changes are made only in the current project. You
must save your project to retain the property changes.
Changing Vector Properties
Use the Properties option on the Map Data tab to change the properties of various
map features such as rasters, vectors, shaded relief, contours, points, etc.
Note You must select to show land thoroughfares in the Display tab of the Options
dialog box to view any changes made to the vector properties on the map. See
Customizing the Map Features Preferen ces for information on showing/hiding land
thoroughfares.
To Change Vector Properties
Use the following steps to change the properties of vector data.
1. Click the Map Data tab.
2. Under Secondary Map or Primary Map, click the plus sign next to the
dataset for which you want to modify the properties.
3. Click the plus sign next to the sub-data category.
4. Highlight Vectors, click Data, and then click Properties.
The Vector Properties dialog box opens.
OR
Right-click Vectors and click Properties.
The Vector Properties dialog box opens.
5. Under Set Data Zoom Range For Display, drag the gray tab markers to the
minimum and maximum level you want.
The minimum and maximum zoom range displays above the Set Zoom Range
For Display area.
6. Click Next.
7. Select the check box next to each connection usage you want to include with
your vector properties.
8. Review the dataset information and click Next, if applicable.
9. Click Finish.
The vector properties for that dataset are modified and are visible on the
map.
Note The vector property changes are made only in the current project. You
must save your project to retain the property changes.
Changing the Contour Properties
Use the Properties option in the Map Data tab to change the properties of various
map features such as rasters, vectors, shaded relief, contours, points, DEM
properties, etc.
Notes
75
Page 84

XMap User Guide
• You must select to show contours in the Display tab of the Options dialog box to
view any changes made to the contour properties on the map. See Displaying
Basic Map Features for information on showing/hiding contours.
• XMap remembers the last customized contour values. For example, if you
customize your contour settings and then change the settings to the default, the
next time you try to customize your contour settings the last saved customized
values display.
To Change the Contour Properties
Use the following steps to change the properties of contours.
1. Click the Map Data tab.
2. Under Secondary Map or Primary Map, click the plus sign next to the
dataset for which you want to modify the properties.
3. Click the plus sign next to the sub-data category.
4. Right-click Contours and click Properties.
The Contour Properties dialog box opens (for Contours).
5. Select a contour option (Default, High Density, Low Density, or Custom) from
the drop-down list.
• Default—Uses the default values for displaying contours and labels.
• High Density—Approximately doubles the default values for
displaying contours and labels.
• Low Density—Approximately halves the default values for displaying
contours and labels.
• Custom—Allows you to customize how contours and labels display on
the map.
6. For Contours, select the data zoom level at which you want labels to begin to
display.
7. Click Next.
8. If you selected Default, High Density, or Low Density in step 5, go to step 9.
OR
If you selected Custom in step 5, you can customize the contour display by
choosing the distance (in feet or meters) between contours and how many
minor (unlabeled) contour lines for every major (labeled) contour line.
• For a given range of data zoom levels, type the distance (in feet or
meters) between contour lines for those data zoom levels.
• Type the number of minor lines for each major line. For example, type
0 to label every contour line or type 2 to label every third contour line.
Labels display only on major lines beginning at the zoom level
Note
that you specified step 6.
• Click Add/Change to update the contour rules list.
OR
Click Reset to reset the settings to what displayed when you first
launched the dialog box.
OR
Click Use Defaults to use the default values to display contours and
labels.
9. Click Next.
10. Under Set Data Zoom Range For Display, drag the gray tab marker to the
minimum and maximum level you want.
76
Page 85

Using Projects
The minimum and maximum zoom range displays above the Set Zoom Range
For Display area.
11. Click Next.
12. Select the check box next to each connection usage you want to include with
your point properties.
13. Click Finish.
The Contour Properties for that dataset are modified and are visible on the
map.
Notes
• The contour property changes are only made in the current project.
You must save your project to retain the property changes.
• Selecting Custom changes the Interval section in th e Control Panel to
read, "Custom."
Changing Coordinate Grid Properties
Use the Properties option on the Map Data tab to change the properties of various
map features, such as coordinate grids, rasters, vectors, shaded relief, contours,
points, and so on.
You must select to show grids in the Display tab of the Options dialog box to view
any changes made to the coordinate grid properties on the map. See Displaying
Basic Map Features for information on showing/hiding grids.
To Change Coordinate Grid Properties
Use the following steps to change the properties of coordinate grids.
1. Click the Map Data tab.
2. Under Secondary Map or Primary Map, click the plus sign next to the
dataset for which you want to modify the properties.
3. Click the plus sign next to the sub-data category.
4. Highlight Grid Lines, click Data, and then click Properties.
The Coordinate Grid Properties dialog box opens.
OR
Right-click Grid Lines and click Properties.
The Coordinate Grid Properties dialog box opens.
5. Under Set Data Zoom Range For Display, drag the gray tab markers to the
minimum and maximum level you want.
The minimum and maximum zoom range displays above the Set Zoom Range
For Display area.
6. Click Next.
7. Select the check box next to each connection usage you want to include with
your coordinate grid properties.
8. Click Finish.
The Coordinate Grid Properties for that dataset are modified and are visible
on the map.
Note The coordinate grid property changes are made only in the current
project. You must save your project to retain the property changes.
Changing USGS Quad Line Connection Properties
Use the Properties option on the Map Data tab to change the properties of various
map features such as USGS quad line connections, rasters, vectors, shaded relief,
contours, points, etc.
77
Page 86

XMap User Guide
Note You must select to show USGS quadrangle coverage in the Display tab of the
Options dialog box to view any changes made to the USGS quad line connection
properties on the map. See Displaying Basic Map Features for information on
showing/hiding USGS quadrangle coverage.
To Change USGS Quad Line Connection Properties
Use the following steps to change the properties of USGS quad line connections.
1. Click the Map Data tab.
2. Under Secondary Map or Primary Map, click the plus sign next to the
dataset for which you want to modify the properties.
3. Click the plus sign next to the sub-data category.
4. Highlight USGS Quad Lines, click Data, and then click Properties.
The USGS Quad Line Connection Properties dialog box opens.
OR
Right-click USGS Quad Lines and click Properties.
The USGS Quad Line Connection Properties dialog box opens.
5. Under Set Data Zoom Range For Display, drag the gray tab markers to the
minimum and maximum level you want.
The minimum and maximum zoom range displays above the Set Zoom Range
For Display area.
6. Click Next.
7. Select the check box next to each connection usage you want to include with
your USGS quad line connection properties.
8. Click Finish.
The USGS quad line connection properties for that dataset are modified and
are visible on the map.
Note The USGS quad line connection property changes are only made in the
current project. You must save your project to retain the property changes.
Changing Draw Connection Properties
Use the Properties option on the Map Data tab to change the properties of various
map features, such as draw objects, rasters, vectors, shaded relief, contours, points,
and so on.
To Change Draw Connection Properties
Use the following steps to change the properties of draw objects.
1. Click the Map Data tab.
2. Under Secondary Map or Primary Map, click the plus sign next to the draw
file for which you want to modify the properties.
3. Right-click the draw file and click Properties.
The Draw Connection Properties dialog box opens.
4. Under Set Data Zoom Range For Display, drag the gray tab markers to the
minimum and maximum level you want.
The minimum and maximum zoom range displays above the Set Zoom Range
For Display area.
5. Click Next.
6. Select the check box next to each connection usage you want to include with
your draw connection properties.
7. Click Finish.
The Draw Connection Properties are modified and are visible on the map.
78
Page 87

Using Projects
Note The draw connection property changes are made only in the current
project. You must save your project to retain the property changes.
Changing the Raster Properties
Use the Properties option on the Map Data tab to change the properties of various
map features such as rasters, vectors, shaded relief, contours, points, DEM
properties, etc.
Note You must select to show images in the Display tab of the Options dialog box to
view any changes made to the raster properties on the map. See Customizing the
Map Features Preferences for information on showing/hiding images.
To Change Raster Properties
Use the following steps to change the raster properties.
1. Click the Map Data tab.
2. Under Secondary Map or Primary Map, click the plus sign next to the
dataset for which you want to modify the properties.
3. Click the plus sign next to the sub-data category.
4. Right-click Quad Rasters and click Properties.
The Raster Properties dialog box opens.
5. Under Set Data Zoom Range For Display, drag the gray tab marker to the
minimum and maximum level you want.
The minimum and maximum data zoom range displays above the Set Data
Zoom Range For Display area.
6. Click Next.
7. Type the minimum and maximum data zoom range for your custom raster
properties in the text boxes.
8. Select the raster data positions from the drop-down list for that data zoom
range.
Note The raster data position you select also includes all of the options
above it in the list.
9. Continue to enter data zoom ranges and choose a position for each range.
10. Click Add Change to update your data positioning selections to the map.
Note You must perform this step to apply any change.
11. Optional. Click Use Default to use the default zoom range and data
positioning options.
12. Click Next.
13. Review the dataset information and click Next, if applicable.
14. Select the check box next to each connection usage you want to include with
your raster properties.
lick Finish.
15. C
The Raster Properties for that dataset are modified and are visible on the
map.
Note The raster property changes are only made in the current project. You
must save your project to retain the property changes.
Changing the Shaded Relief Properties
Use the Properties option on the Map Data tab to change the properties of various
map features such as rasters, vectors, shaded relief, contours, points, etc.
79
Page 88

XMap User Guide
Note You must select to show shaded relief in the Display tab of the Options dialog
box to view any changes made to the shaded relief properties on the map. See
Displaying Basic Map Features for information on showing/hiding shaded relief.
To Change the Shaded Relief Properties
Use the following steps to change the properties of shaded relief.
1. Click the Map Data tab.
2. Under Secondary Map or Primary Map, click the plus sign next to the
dataset for which you want to modify the properties.
3. Click the plus sign next to the sub-data category.
4. Right-click Shaded Relief and click Properties.
The Digital Elevation Model (DEM) Properties dialog box opens (for Shaded
Relief).
5. Select the direction from which you want the sun to shine for displaying the
shaded relief from the Sun Bearing drop-down list.
6. Select how many degrees you want the sun to be above the horizon from the
Sun Inclination drop-down list.
7. Under Brightness Range, drag the gray tab markers to the minimum and
maximum levels you want.
8. Optional. Click Reset if you have previously changed your shaded relief
properties and want to return to the settings whi ch were in effect before you
opened the Properties dialog.
9. Optional. Click Use Defaults to change to the product defaults.
10. Click Next.
11. Under Set Data Zoom Range For Display, drag the gray tab markers to the
desired minimum and maximum levels.
The minimum and maximum zoom range displays above the Set Zoom Range
For Display area.
12. Click Next.
13. Select the check box next to each connection usage you want to include with
your shaded relief properties.
14. Click Finish.
The Shaded Relief Properties for that dataset are modified and are visible on
the map.
Note
The shaded relief property changes are made only in the current
project. You must save your project to retain the property changes.
Changing the Radio Coverage Ellipses Properties
Use the Properties option on the Map Data tab to change the properties of various
map features such as radio ellipses, rasters, vectors, shaded relief, contours, points,
etc.
To Change the Radio Coverage Ellipses Properties
Use the following steps to change the properties of radio coverage ellipses.
1. Click the Map Data tab.
2. Under Secondary Map or Primary Map, click the plus sign next to the
dataset for which you want to modify the properties.
3. Click the plus sign next to the sub-data category.
80
Page 89

Using Projects
4. Highlight Radio Coverage Ellipses, click Data, and then click Properties.
The Ellipse Connection Properties dialog box opens.
OR
Right-click Radio Coverage Ellipses and click Properties.
The Ellipse Connection Properties dialog box opens.
5. Under Set Data Zoom Range For Display, drag the gray tab markers to the
minimum and maximum level you want.
6. Click Next.
7. Select the check box next to each connection usage you want to include with
your properties.
8. Click Finish.
The Radio Coverage Ellipse Connection Properties for that dataset are
modified and are visible on the map.
Note The radio coverage ellipse property changes are made only in the
current project. You must save your project to retain the property changes.
Changing the Elevation Properties
Use the Properties option on the Map Data tab to change the properties of various
map features such as elevations, rasters, vectors, shaded relief, contours, points,
DEM properties, etc.
To Change the Elevation Properties
Use the following steps to change the properties of elevation.
1. Click the Map Data tab.
2. Under Secondary Map or Primary Map, click the plus sign next to the
dataset for which you want to modify the properties.
3. Click the plus sign next to the sub-data category.
4. Right-click Elevation and click Properties.
The Digital Elevation Model (DEM) Properties dialog box opens (for Elevation).
5. Select a priority (1-100) from the Priority scroll list.
Note When the program has more than one elevation connection, the
connection with the highest priority takes precedence in areas where there is
coincident data.
6. Select the data zoom level at which you want elevations to begin to display.
7. Click Next.
8. Under Connection Usages, select or clear the appropriate check boxes to
show or hide elevation data.
9. Click Finish.
The Elevation Properties for that dataset are modified and are visible on the
map.
Note The elevation property changes are made only in the current project.
You must save your project to retain the property changes.
Changing XData Dataset Properties
Use the Properties option on the Map Data tab to change the properties of various
map features such as XData datasets, radio ellipses, rasters, vectors, shaded relief,
contours, points, etc.
To Change the XData Dataset Properties
Use the following steps to change the properties of XData datasets.
81
Page 90

XMap User Guide
1. Click the Map Data tab.
2. Under Secondary Map or Primary Map, click the plus sign next to the
XData dataset for which you want to modify the properties.
3. Highlight the dataset name, click Data, and then click Properties.
The User Database Connection Properties dialog box opens.
OR
Right-click the XData dataset and click Properties.
The User Database Connection Properties dialog box opens.
4. Under Set Data Zoom Range For Display, drag the gray tab markers to the
minimum and maximum level you want.
The minimum and maximum zoom range displays above the Set Zoom Range
For Display area.
5. Click Next.
6. Select the check box next to each connection usage you want to include with
your properties.
Note Select the Include in Name Search check box to search for the
contents of your XData dataset using the Find tab (additional address
information is required). If you select the Add to World Placename
Dictionary check box in addition to the Include in Name Search check box,
you can use the Find tab to search the contents of your XData dataset without
providing additional address information.
7. Click Finish.
The properties for that XData dataset are modified and are visible on the
map.
Note The property changes are made only in the current project. You must
save your project to retain the property changes.
82
Page 91
Working With GIS
GIS Overview
The topics that are in the Working with GIS Help section cover
functionality that is included in XMap Professional, XMap GIS
Editor, and XMap GIS Enterprise. Be sure to check the
important note at the top of each topic to see if its content
pertains to your version of XMap.
With the GIS tab, you can view and analyze the data in your ESRI files (.shp, .e00),
MapInfo (.mif, .tab), AutoCAD (.dxf, .dwf, dwg), OGIS Geographic Markup Language
files (.gml, .xml), Geocode Type files (.asc, .csv, .dbf, .txt, .tab, .mdb, .xls), XData
datasets (.dds), Draw files (.an1), or DeLorme OpenSpace transfer files (.openspace)
on the map. Once the data is imported as a layer, you can choose to classify,
symbolize, and label the data in the layers to your specifications. Y ou can also:
• Create a database on a network server to share data among group members.
• Create attribute queries using the fields in your layer.
• Create spatial queries between layers.
• Add fields to your layer.
• Create a new layer— a new empty layer or a new layer based on an existing
layer, query results, or map selections.
• Use XMap Web to publish your newly analyzed data and let other registered
users view the information.
• Send GIS data to an Earthmate® PN-Series GPS device.
• Create default option settings for layers and queries.
• And much more!
The GIS tab has five subtabs:
Subtab
Name
Workspace The Workspace subtab is the primary area for using the GIS tab.
Attributes The Attributes subtab has two different views, the Datasheet View
Query The Query subtab lets you create custom attribute an d spatial
Description
You can use the tools in the Workspace subtab to manage and
analyze layers in your databases as well as manage the databases
themselves. See also, Handling Disconnected or Deleted Layers.
and the Design View. The Datasheet View displays the fields that
are selected to be "visible" in the Design View and lets you edit th e
attribute values. The Design View lets you edit properties of the
fields, view field metadata, create fields, and import and link
additional fields to your layer.
queries to perform analysis on your layers. You can also rename,
save, copy, delete, and symbolize custom queries in the selected
layer.
83
Page 92
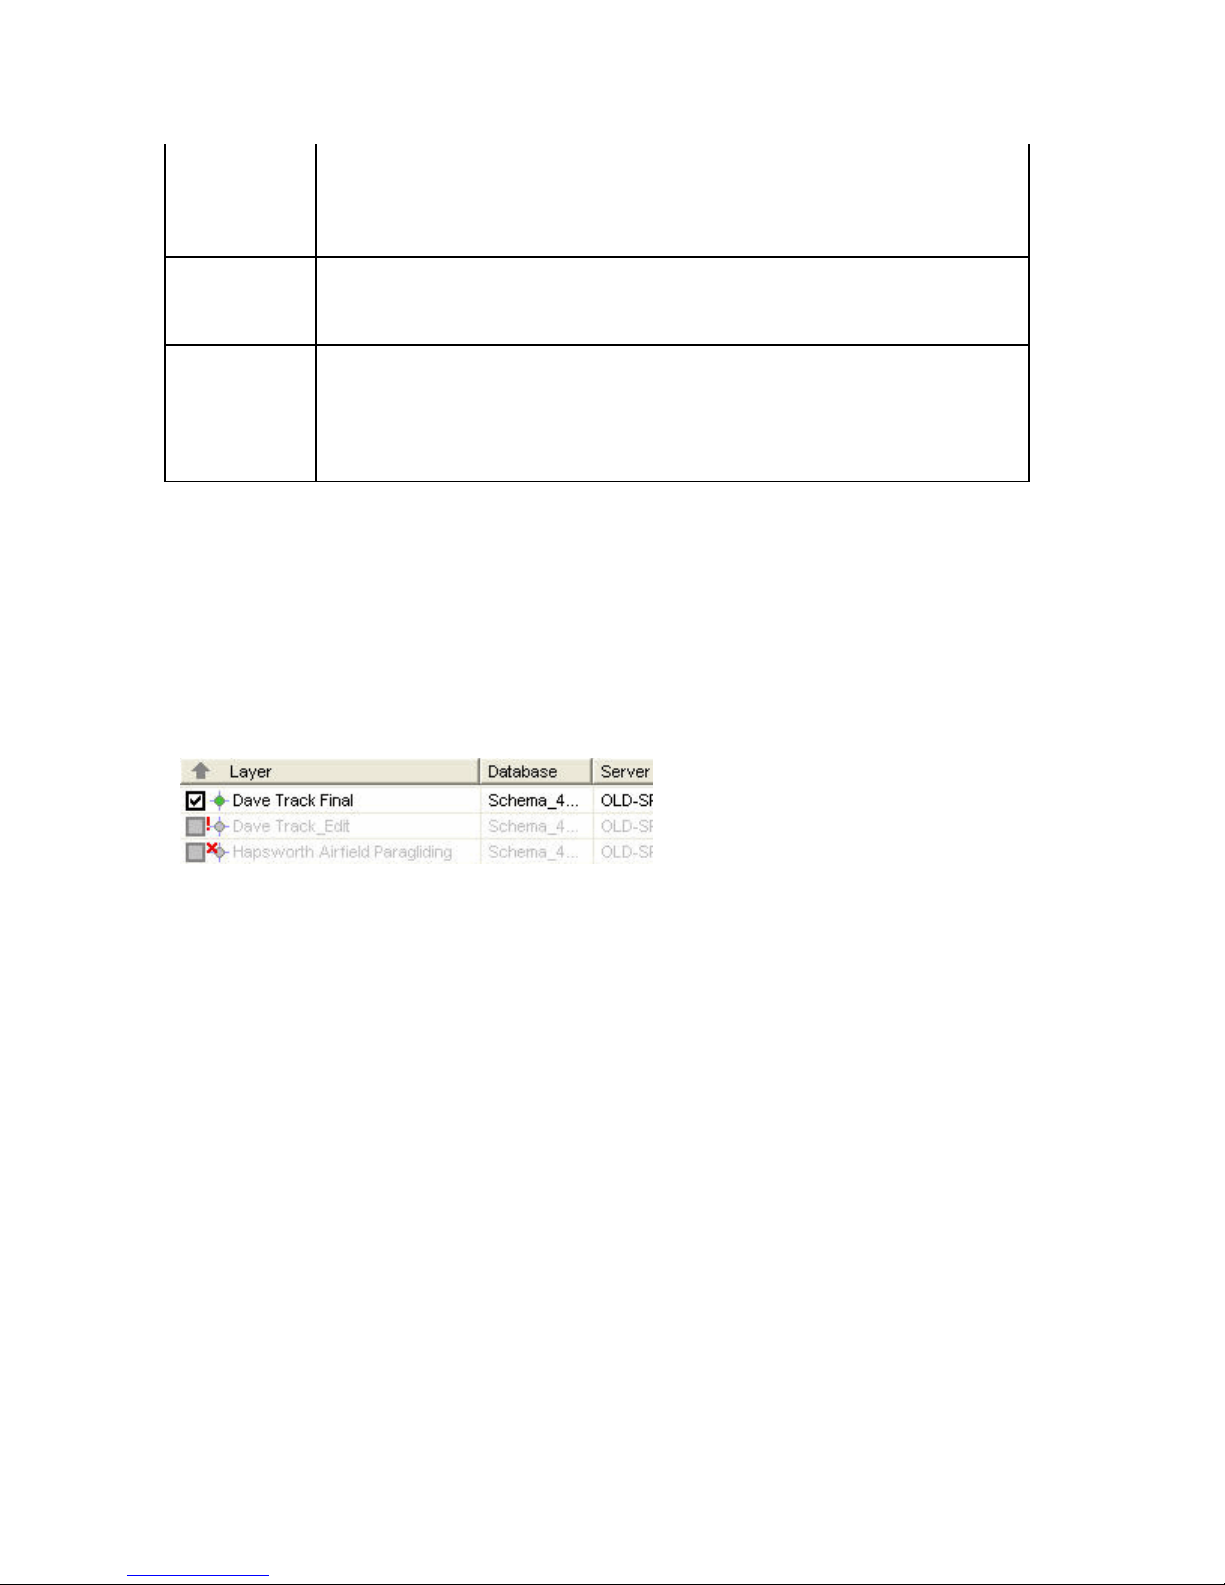
XMap User Guide
Layering The Layering subtab lets you move the layers in your workspace
above, below, or equal to other layers and/or the standard
DeLorme data layers. Moving a layer up in the list helps to ensure
the layer will be visible on the map.
Checkout/in
Registration The Registration tab appears when you import a CAD layer that
Note If a shared layer in a single database is being manipulated by more than one
user at the same time, any analysis of that layer may produce unpredictable results.
The Check-out/in tab lets you check out/reserve portions of layers
for editing outside of the source database and then check them
back in, updating the source layer.
has no spatial reference to the Earth’s surface. The tab functions
the same as the ImageReg tab by allowing you to place control
points between the unregistered layer (in the left map) and the
corresponding location on the ground (in the right map).
Handling Disconnected or Deleted Layers
When a layer is disconnected or deleted, a red exclamation point (disconnected) or a
red X (deleted) displays next to the layer name in the Workspace.
This happens if the database the layer was connected to has been moved or deleted
or if the local source is unavailable (for example, if the database is on a laptop
computer that is turned off, the connection will be broken).
You can try to refresh the connection, establish a new connection, or remove the
disconnected or deleted layer from the Workspace.
• To refresh the connection for all layers, click the Layers button and click
Refresh All Layers.
OR
To refresh the connection for specific layers; highlight the layers, right-click
the highlighted area, and click Refresh Selected Layers.
• To reconnect all layers to the original database or to connect them to a new
database, click the Layers button and click Reconnect. The Connect Layers
dialog box opens.
OR
To reconnect/connect specific layers, highlight the layers, right-click the
highlighted area, and click Reconnect. The Connect Layers dialog box opens.
• To remove the active layer, click the Layers button and click Remove.
OR
To remove specific layers, highlight the layers, right-click the highlighted
area, and click Remove.
84
Page 93

GIS Options
GIS Layer Options
You can customize the default settings for managing GIS layers.
To Set GIS Layer Options
Use the following steps to create default settings for GIS layers.
Working With GIS
1. Click the Options button
OR
Click the arrow next to the Options toolbar button to open the menu. Then,
click Options to open the dialog box.
2. Click the GIS tab, and then click the Layers subtab .
3. Set the following options:
• Add imported layers to Workspace–Select this check box to
automatically add imported layers to the Workspace subtab.
• Show imported layers on map–If you selected the above check box,
select this check box to show layers on the map after they are
imported to the Workspace subtab.
• Show layers added from Manage Layers on map–Select this check
box to show layers on the map when you add them from the Manage
Layers dialog box.
• Zoom map when centering on points–Use the drop-down list to
select the zoom level to use when you double-click a poin t geometry to
center it on the map in the Attributes subtab Datasheet View.
• Default attribute records filter–Use the drop-down list to select the
default setting for the Show drop-down list on the Attributes subtab for
layers added to the Workspace. You can manually change the filter
after a layer is added to Workspace. Options are Mag Region (default),
All, and Toolbar Select.
• Refresh attribute records for Map Region filter–Select this check
box to automatically refresh the Attributes subtab Datasheet View
when the map extent changes and Map Region is selected in the Show
drop-down list. The Map Region filter hides all attribute records whose
map bounding region (MBR) is not currently within the map window.
• Large layer definition (# of geometries)–Type the minimum
number of geometries a layer must include to define it as a large
layer. When a layer includes at least that number of geometries, XMap
will handle the layer differently to improve processing speed. For
example, the map will not zoom to the location of the geometries and
the count function for query results is suppressed. The default number
of geometries for a large layer is 50,000.
• Geometry selection color–Click the button to open the Color dialog
box and click the color for selection highlights on the map. Select
on the toolbar.
geometries with the Selection Tool
records on the Attributes subtab in datasheet view.
in the toolbar or by selecting
85
Page 94
XMap User Guide
GIS Query Options
Use the Query subtab on the GIS tab in the Options dialog box to create default
settings for managing queries.
Note Changes to query options apply only to the queries you create after you make
the changes.
To Set GIS Query Options
Use the following steps to create default settings for GIS queries.
1. Click the Options button
OR
Click the arrow next to the Options toolbar button to open the menu. Then,
click Options to open the dialog box.
2. Click the GIS tab, and then click the Queries subtab.
3. Set the following options:
• Zoom map to query results–Select this check box to zoom the map
to show the results of a query.
• Count results when running query–Select this check box to show a
count of the results in the Query Results area on the Query subtab
when you run a query.
• Attribute effect–Use the drop-down list to select the default attribute
effect of a new query for any layer. Options are Highlight, Filter, and
None.
• Map effect–Use the drop-down list to control the default map effect of
a new query for any layer. Options are Highlight, Filter, and None.
on the toolbar.
Using Database Manager
Database Manager Overview
Database Manager delivers essential tools for DeLorme OpenSpace database
management. Its easy-to-use interface allows database administrators to add new
SQL server connections, add server account users, create databases and add users,
modify database permissions, create database subscriptions, and more. You can
open the Database Manager from the GIS tab or from the XMap GIS install directory.
The following topics are covered in this section.
Connecting to a Server
Adding a User to a Server
Disconnecting from/Reconnecting to a Server
Removing a Server
Creating a New Database
Attaching a Database
Adding/Removing a Database User
Activating/Deactivating a Database
Deleting a Database
Database User Roles
Creating User Subscriptions
XMap Database Limitations
86
Page 95
Working With GIS
Backing Up a Database
Restoring a Backed Up Database
Connecting to a Server
This Help topic describes features that are available in XMap
Professional, XMap GIS Editor, and XMap GIS Enterprise.
You can use Database Manager to connect to single or multiple SQL servers.
To Connect to a Server
Use the following steps to connect to a server with Database Manager.
1. Click the GIS tab.
2. Click the Workspace subtab if it is not selected.
3. Click DB Manager to open Database Manager.
4. From the Server menu, click New Connection.
The Connect dialog box opens.
5. Type the name of the server in the Server text box.
Note If SQL Server was installed on your local machine, type
localhost\xmap6 (or localhost\delormemapping if SQL Server w as installed in
a previous version of XMap). If you are connecting to a remote server, see
your Database Administrator to obtain the server name information.
6. Select the authentication method; Windows Authentication or SQL Server
Authentication.
7. If you selected SQL Server Authentication, type the appropriate login name
and password in the applicable text boxes.
8. Click Connect.
Adding a User to a Server
This Help topic describes features that are available in XMap
Professional, XMap GIS Editor, and XMap GIS Enterprise.
Once you connect to a SQL server, you can give users access to the databases on
the server. The Server Administrator can modify a user's role on that server to be
Server User (default), Database Creator, or Server Administrator.
To Add a User to a Server
Use the following steps to add a user to a server.
1. Click the GIS tab.
2. Click the Workspace subtab if it is not selected.
3. Click DB Manager to open Database Manager.
4. On the left side of the window (tree view), click the server to which you want
add a new user.
5. From the Server menu, click New User.
The Add Server Account dialog box opens.
6. Type the individual's network user name in the User Name text box.
87
Page 96
XMap User Guide
7. If you are using Windows Authentication, select that option and then type the
user's network domain.
OR
If you are using SQL Server Authentication, select that option and then type
and confirm a password for that user in the applicable text boxes.
8. Click OK.
9. On the left side of the window (tree view), expand the server menu and click
Server Users.
A list of all of the users who have access to the server displays on the right
side of the window.
10. To change a user's role for that server, find the name in the list and click the
System Role. Double-click to select a role (Server User, Database Creator,
or Server Administrator) from the drop-down list.
• Server Users have limited access to the server. They can log in and
access any databases that they have been granted access to, but they
cannot create or delete (drop) databases. Their permissions on each
OpenSpace database are governed by the database role they have
been assigned.
• Database Creators can log in to the server and create databases.
Database creators have full access to the databases that they create,
including deleting the databases. Their database role on their own
OpenSpace databases is automatically XMap Owner. Their permissions
on OpenSpace databases that they did not create are governed by the
database role they have been assigned.
• Server Administrators have full access to the server and any
database on the server regardless of their database roles. They can
add and remove server users and assign server roles to users.
Tip Users can modify their SQL Server Authentication passwords at any time using
the Change Password feature in Database Manager.
Disconnecting from/Reconnecting to a Server
This Help topic describes features that are available in XMap
Professional, XMap GIS Editor, and XMap GIS Enterprise.
Use Database Manager to disconnect a server or completely remove the connection.
Connected servers display in Database Manager with a green arrow next to the
server icon. Disconnected servers display with a red arrow next to the server icon.
Once a server is disconnected, XMap cannot connect to it.
For information on removing a server, see Removing a Server.
To Disconnect a Server
Use the following steps to disconnect from a server with Database Manager.
1. Click the GIS tab.
2. Click the Workspace subtab if it is not selected.
3. Click DB Manager to open Database Manager.
4. On the left side of the window (tree view), click the server that you want
disconnect.
5. From the Server menu, click Disconnect.
88
Page 97
Working With GIS
To Reconnect a Server
Use the following steps to reconnect to a server with Database Manager.
1. Click the GIS tab.
2. Click the Workspace subtab if it is not currently selected.
3. Click DB Manager to open Database Manager.
4. On the left side of the window (tree view), click the server that you want
reconnect.
5. From the Server menu, click Connect.
Removing a Server
This Help topic describes features that are available in XMap
Professional, XMap GIS Editor, and XMap GIS Enterprise.
Use Database Manager to completely remove a server connection or simply
disconnect it. For information on disconnecting a server, see Disconnecting
from/Reconnecting to a Server.
To Remove a Server
Use the following steps to remove a server and the databases it contains with
Database Manager.
1. Click the GIS tab.
2. Click the Workspace subtab if it is not selected.
3. Click DB Manager to open Database Manager.
4. On the left side of the window (tree view), click the server that you want
remove.
5. From the Server menu, click Remove.
Creating a New Database
This Help topic describes features that are available in XMap
Professional, XMap GIS Editor, and XMap GIS Enterprise.
There are two ways to create a new database in XMap. You can use the Create
Database dialog box within XMap, which is accessed from the Import Layer wizard or
Create Layer dialog box, or use the Database Manager utility to create a new
database.
To Create a New Database with the Create Database Dialog Box
Use the following steps to create a new database.
1. Click the GIS tab, click the Workspace subtab if it is not selected.
2. Click the Layers button, point to Create, and then click Empty Layer.
The Create Empty Layer dialog box opens.
OR
Click the Import Layer menu button
Import - New Layer.
The Import Layer Wizard opens.
on the toolbar, and then click
89
Page 98

XMap User Guide
3. At the bottom of the dialog box, select New from the Target Database
drop-down list.
The Create Database dialog box opens.
4. Select the server you want the database to be created on from the Server
drop-down list.
If the server you want to use does not display in the list, type the server
name in the text box.
Note If SQL Server was installed on your local machine, type
localhost\xmap6 (or localhost\delormemapping if SQL Server w as installed in
a previous version of XMap). If you are connecting to a remote server, see
your Database Administrator to obtain the server name information.
5. Select the authentication method; Windows authentication or SQL Server
authentication (Windows Authentication (NTLM) is an authentication process
used by all members of the Windows NT family of products. It uses a
challenge/response process to prove the client’s identity without requiring
that either a password or a hashed password be sent across the network. If
Use Windows Authentication is selected, the user does not need to provide
login name or password information to create a new database on the specified
server machine. This is because SQL Server revalidates the Windows user
account name and password. SQL Server Authentication uses credentials
stored in a SQL Server database to get access to the server. When this choice
is selected, the Login and Password text boxes are enabled.)
.
6. If you selected to use SQL Server Authentication, type a login name in the
Login text box and a password in the Password text box.
7. Type a name for the new database in the Database Name text box. The
name should be alphanumeric (not case sensitive), may include underscores,
has a 128 character limit, and cannot include spaces or start with a number.
8. From the Compatibility drop-down list:
Select XMap 6 if you want the layers you import into this database to have
access to all of the features of XMap 6.
OR
Select XMap 5 if you want the layers you import into this database to have
access to all of the features of XMap 5.
OR
Select XMap 4.5 if the layers that you import into this database need to be
accessed from that version of XMap. This option is only available if you are
using Microsoft SQL 2000.
Note XMap 4.5 databases will not have access to all of the functionality
available in XMap 5 and above. See XMap Database Limitations for more
information.
9. Click OK.
The database is added to the server.
To Create a New Database with Database Manager
Use the following steps to create a new database.
1. Click the GIS tab.
2. Click the Workspace subtab if it is not selected.
3. Click DB Manager to open Database Manager.
4. Connect to the server where your new database will be stored.
90
Page 99
Working With GIS
5. Use the tree view on the left to select the server where you will store t he new
database.
6. From the Database menu, click New.
7. Type a name for the new database in the Database Name text box. The
name should be alphanumeric (not case sensitive), may include underscores,
has a 128 character limit, and cannot include spaces.
8. Select a schema type (XMap 6, XMap 5, or XMap 4.5) from the Schema drop-
down list.
9. Click OK.
The database is added to the server.
Attaching/Connecting a Database
This Help topic describes features that are available in XMap
Professional, XMap GIS Editor, and XMap GIS Enterprise.
Attach Database: When importing a layer with the Import Layer or Manage Layers
dialog box, the Attach Database dialog opens if you Other as the database.
Connect Database: If you are attempting to reconnect to a database for a
disconnected or deleted layer, the Connect Database dialog opens.
To Attach/Connect a Database
Use the following steps to attach a database.
1. Select the server you want the database to be connected to from the Server
drop-down list.
If the server you want to use does not display in the list, type the server
name in the text box.
Note If SQL Server was installed on your local machine, type
localhost\xmap6 (or localhost\delormemapping if SQL Server w as installed in
a previous version of XMap). If you are connecting to a remote server, see
your Database Administrator to obtain the server name information.
2. Select the authentication method; Windows Authentication or SQL Server
Authentication. (Windows Authentication (NTLM) is an authentication process
used by all members of the Windows NT family of products. It uses a
challenge/response process to prove the client’s identity without requiring
that either a password or a hashed password be sent across the network. If
Use Windows Authentication is selected, the user does not need to provide
login name or password information to create a new database on the specified
server machine. This is because SQL Server revalidates the Windows user
account name and password. SQL Server Authentication uses credentials
stored in a SQL Server database to get access to the server. When this choice
is selected, the Login and Password text boxes are enabled.)
3. If you selected to use SQL Server Authentication, type a login name in the
Login text box and a password in the Password text box.
4. Type a name for the new database in the Database Name text box.
5. Click OK.
The database is added.
Adding/Removing a Database User
91
Page 100

XMap User Guide
This Help topic describes features that are available in XMap
Professional, XMap GIS Editor, and XMap GIS Enterprise.
Once you add users to a server, you can give them access to the databases that are
on that server. Once a user is added to a database, an administrator can assign the
user's role for using the database (for example, XMap User, XMap Edit, XMap
Checkout Creator, XMap Administrator, or XMap Owner). You can add or remove
individual users or a Windows Group.
To Add a Database User
Use the following steps to give a user access to a particular database.
1. Click the GIS tab.
2. Click the Workspace subtab if it is not selected.
3. Click DB Manager to open Database Manager.
4. On the left side of the window (tree view), expand the server and databases
menus.
5. To add a user to an individual database, click a database in the tree view or in
the working view (right side).
OR
To add a user to multiple databases, in the working view (right side of th e
window), hold the CTRL key on your keyboard while you click each of the
databases to which you want to add a user.
6. From the Database menu, click Add User.
The Add Users dialog box opens all of the users who have access to the
database's server.
7. Click to select a user from the Add Users dialog box. If you want to add
multiple users at once, press the CTRL key on your keyboard and click each
user.
8. Click OK.
9. On the left side of the window (tree view), expand the database's menu and
then click the Database Users option underneath it.
A list of all of the users who have access to the database displays on the right
side of the window.
10. To change a user's role for that database, find the name in the list, click the
role, and then select a new role (XMap User, XMap Edit, XMap Checkout
Creator, XMap Administrator, or XMap Owner) from the available drop-down
list. For definitions of each role, see Database User Roles.
To Remove a Database User
Use the following steps to remove a user's database privileges.
1. Click the GIS tab.
2. Click the Workspace subtab if it is not currently selected.
3. Click DB Manager to open Database Manager.
4. On the left
menus to view the database to which you want to remove a user.
5. Expand the database and then click the Database Users option underneath
it.
92
side of the window (tree view), expand the server and database
 Loading...