

Page 1
SRS
Spectral Reflectance Sensor
Operator’s Manual
Decagon Devices, Inc.
Version: January 15, 2014 — 12:16:45
Page 2

SRS Sensors
Decagon Devices, Inc.
2365 NE Hopkins Court
Pullman WA 99163
Phone: 509-332-5600
Fax: 509-332-5158
Website: www.decagon.com
Email: support@decagon.com or sales@decagon.com
Trademarks
c
2007-2013 Decagon Devices, Inc.
All Rights Reserved
ii
Page 3

SRS Sensors CONTENTS
Contents
1 Introduction 1
1.1 Customer Support . . . . . . . . . . . . . . . . . . . . 1
1.2 About This Manual . . . . . . . . . . . . . . . . . . . 2
1.3 Warranty . . . . . . . . . . . . . . . . . . . . . . . . . 2
1.4 Seller’s Liability . . . . . . . . . . . . . . . . . . . . . . 2
2 About SRS 3
2.1 Overview . . . . . . . . . . . . . . . . . . . . . . . . . 3
2.2 Specifications . . . . . . . . . . . . . . . . . . . . . . . 4
3 Theory 6
3.1 Normalized Difference Vegetation Index (NDVI) . . . 6
3.2 Fractional Interception of Photosynthetically Active
Radiation . . . . . . . . . . . . . . . . . . . . . . . . . 8
3.3 Canopy Phenology . . . . . . . . . . . . . . . . . . . . 10
3.4 Photochemical Reflectance Index (PRI) . . . . . . . . 11
3.5 Sun-Sensor-Surface Geometry Considerations . . . . . 12
3.6 Calculating Percent Reflectance from Paired Up and
Down Looking Sensors . . . . . . . . . . . . . . . . . . 14
4 Connecting the SRS 19
4.1 Connecting to Decagon Data Logger . . . . . . . . . . 19
4.2 3.5 mm Stereo Plug Wiring . . . . . . . . . . . . . . . 20
4.3 Connecting to a Non-Decagon Logger . . . . . . . . . 20
4.4 Pigtail End Wiring . . . . . . . . . . . . . . . . . . . . 21
5 Communication 23
5.1 SDI-12 Communication . . . . . . . . . . . . . . . . . 23
6 Understanding Data Outputs 25
6.1 Using Decagon’s Em50 series data loggers . . . . . . . 25
6.1.1 Up Looking Sensor Outputs . . . . . . . . . . . 25
6.1.2 Down Looking Sensor Outputs . . . . . . . . . 25
6.2 Using other data loggers . . . . . . . . . . . . . . . . . 26
7 Installing the SRS 27
7.1 Attaching and Leveling . . . . . . . . . . . . . . . . . 27
7.2 Cleaning and Maintenance . . . . . . . . . . . . . . . . 27
iii
Page 4

CONTENTS SRS Sensors
8 Troubleshooting 28
8.1 Data Logger . . . . . . . . . . . . . . . . . . . . . . . . 28
8.2 Sensors . . . . . . . . . . . . . . . . . . . . . . . . . . 28
8.3 Calibration . . . . . . . . . . . . . . . . . . . . . . . . 28
9 Declaration of Conformity 29
iv
Page 5

SRS Sensors 1 INTRODUCTION
1 Introduction
Thank you for choosing Decagon’s Spectral Reflectance Sensor (SRS).
We designed the SRS for continuous monitoring of Normalized Difference Vegetation Index (NDVI) and/or the Photochemical Reflectance
Index (PRI) of plant canopies. We intend it to be low cost, easily
and quickly deployable, and capable of reliable operation over years.
Deploy the sensors over plant canopies to record first appearance of
green canopy, canopy closure, canopy senescence, light use efficiency,
and other variables. Customers can use these measurements to determine light capture, water use, phenology and biomass production.
This manual will help you understand the sensor features and how
to use this device successfully.
1.1 Customer Support
If you ever need assistance with your sensor, have any questions or
feedback, there are several ways to contact us. Decagon has Customer Service Representatives available to speak with you Monday
through Friday, between 7am and 5pm Pacific time.
Note: If you purchased your sensor through a distributor, please contact them for assistance.
Email:
support@decagon.com or sales@decagon.com
Phone:
509-332-5600
Fax:
509-332-5158
If contacting us by email or fax, please include as part of your message your instrument serial number, your name, address, phone, fax
number, and a description of your problem or question.
1
Page 6

1 INTRODUCTION SRS Sensors
1.2 About This Manual
Please read these instructions before operating your sensor to ensure
that it performs to its full potential.
1.3 Warranty
The sensor has a 30-day satisfaction guarantee and a one-year warranty on parts and labor. Your warranty is automatically validated
upon receipt of the instrument.
1.4 Seller’s Liability
Seller warrants new equipment of its own manufacture against defective workmanship and materials for a period of one year from the
date of receipt of equipment.
Note: We do not consider the results of ordinary wear and tear,
neglect, misuse, or accident as defects.
The Seller’s liability for defective parts shall in no event exceed the
furnishing of replacement parts “freight on board” the factory where
originally manufactured. Material and equipment covered hereby
which is not manufactured by Seller shall be covered only by the
warranty of its manufacturer. Seller shall not be liable to Buyer for
loss, damage or injuries to persons (including death), or to property
or things of whatsoever kind (including, but not without limitation,
loss of anticipated profits), occasioned by or arising out of the installation, operation, use, misuse, nonuse, repair, or replacement of said
material and equipment, or out of the use of any method or process
for which the same may be employed. The use of this equipment constitutes Buyer’s acceptance of the terms set forth in this warranty.
There are no understandings, representations, or warranties of any
kind, express, implied, statutory or otherwise (including, but without limitation, the implied warranties of merchantability and fitness
for a particular purpose), not expressly set forth herein.
2
Page 7

SRS Sensors 2 ABOUT SRS
2 About SRS
2.1 Overview
The SRS are two-band radiometers that measure either incident or
reflected radiation in wavelengths appropriate for calculating the
Normalized Difference Vegetation Index (NDVI) or the Photochemical Reflectance Index (PRI). Sensors are manufactured in four different versions: NDVI-hemispherical, NDVI-field stop, PRI-hemispherical
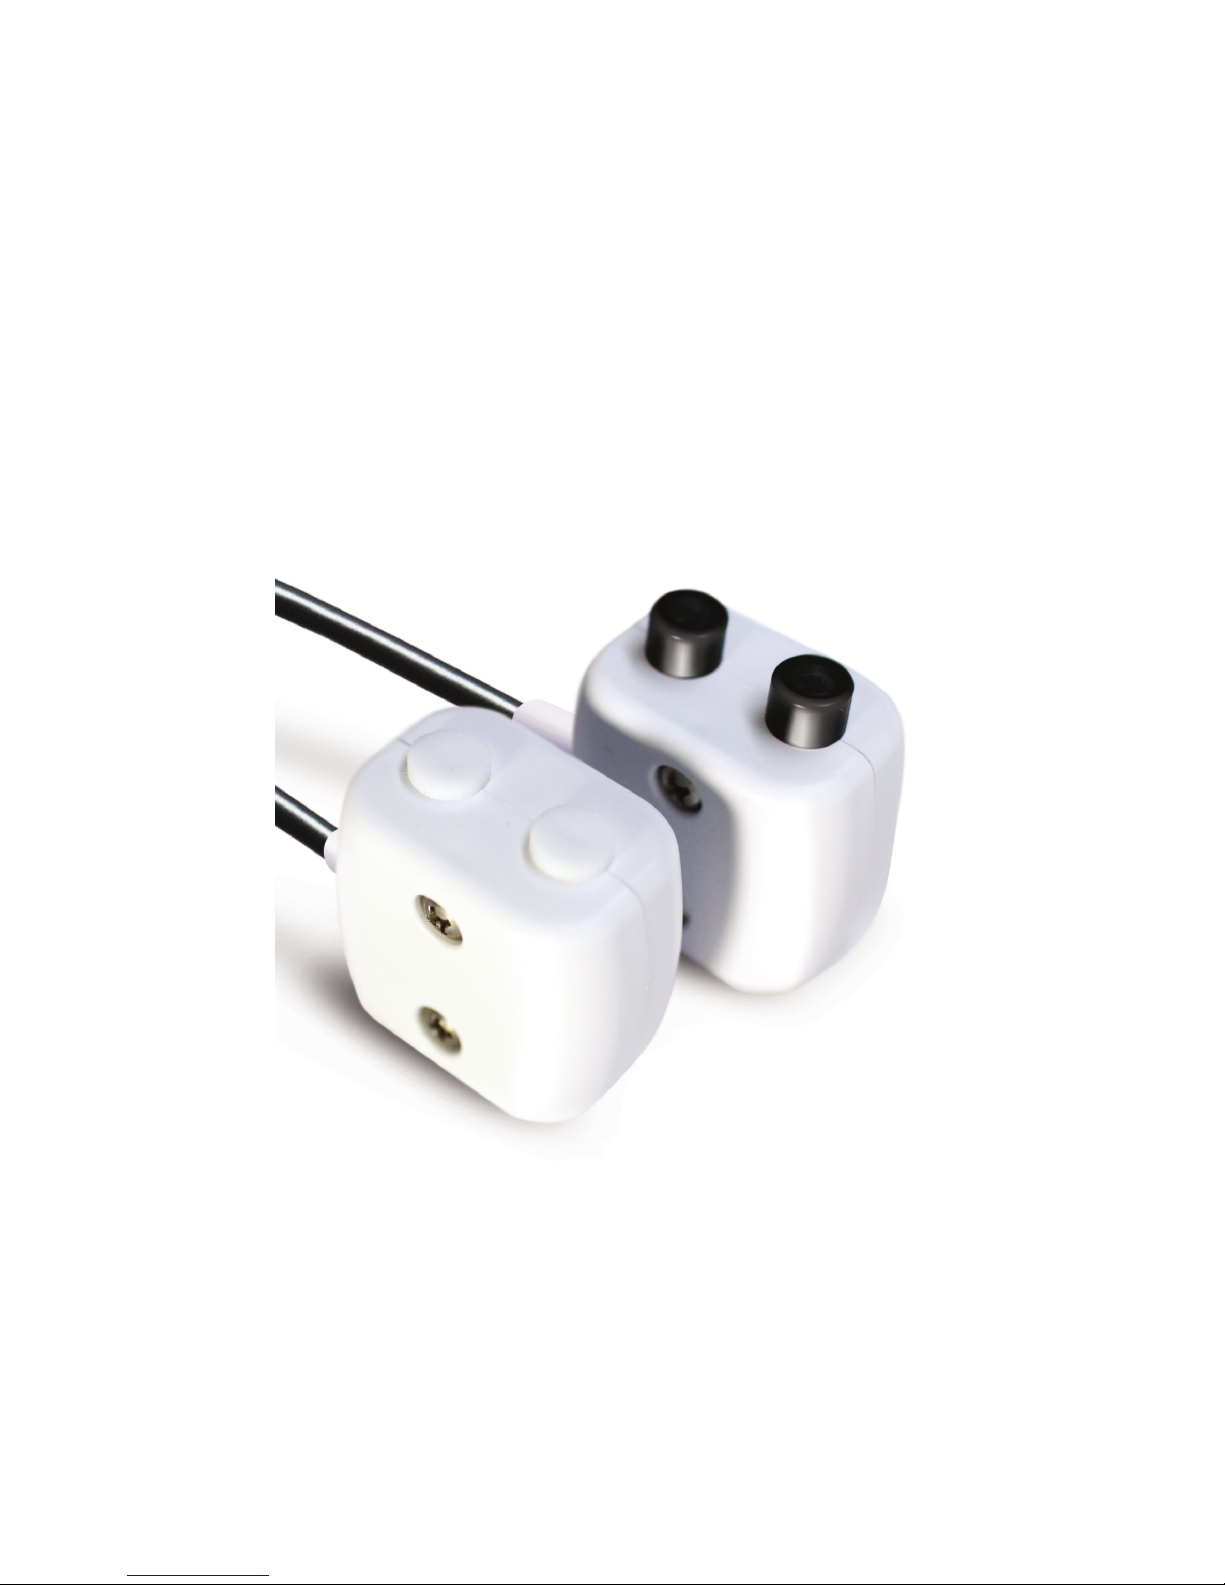
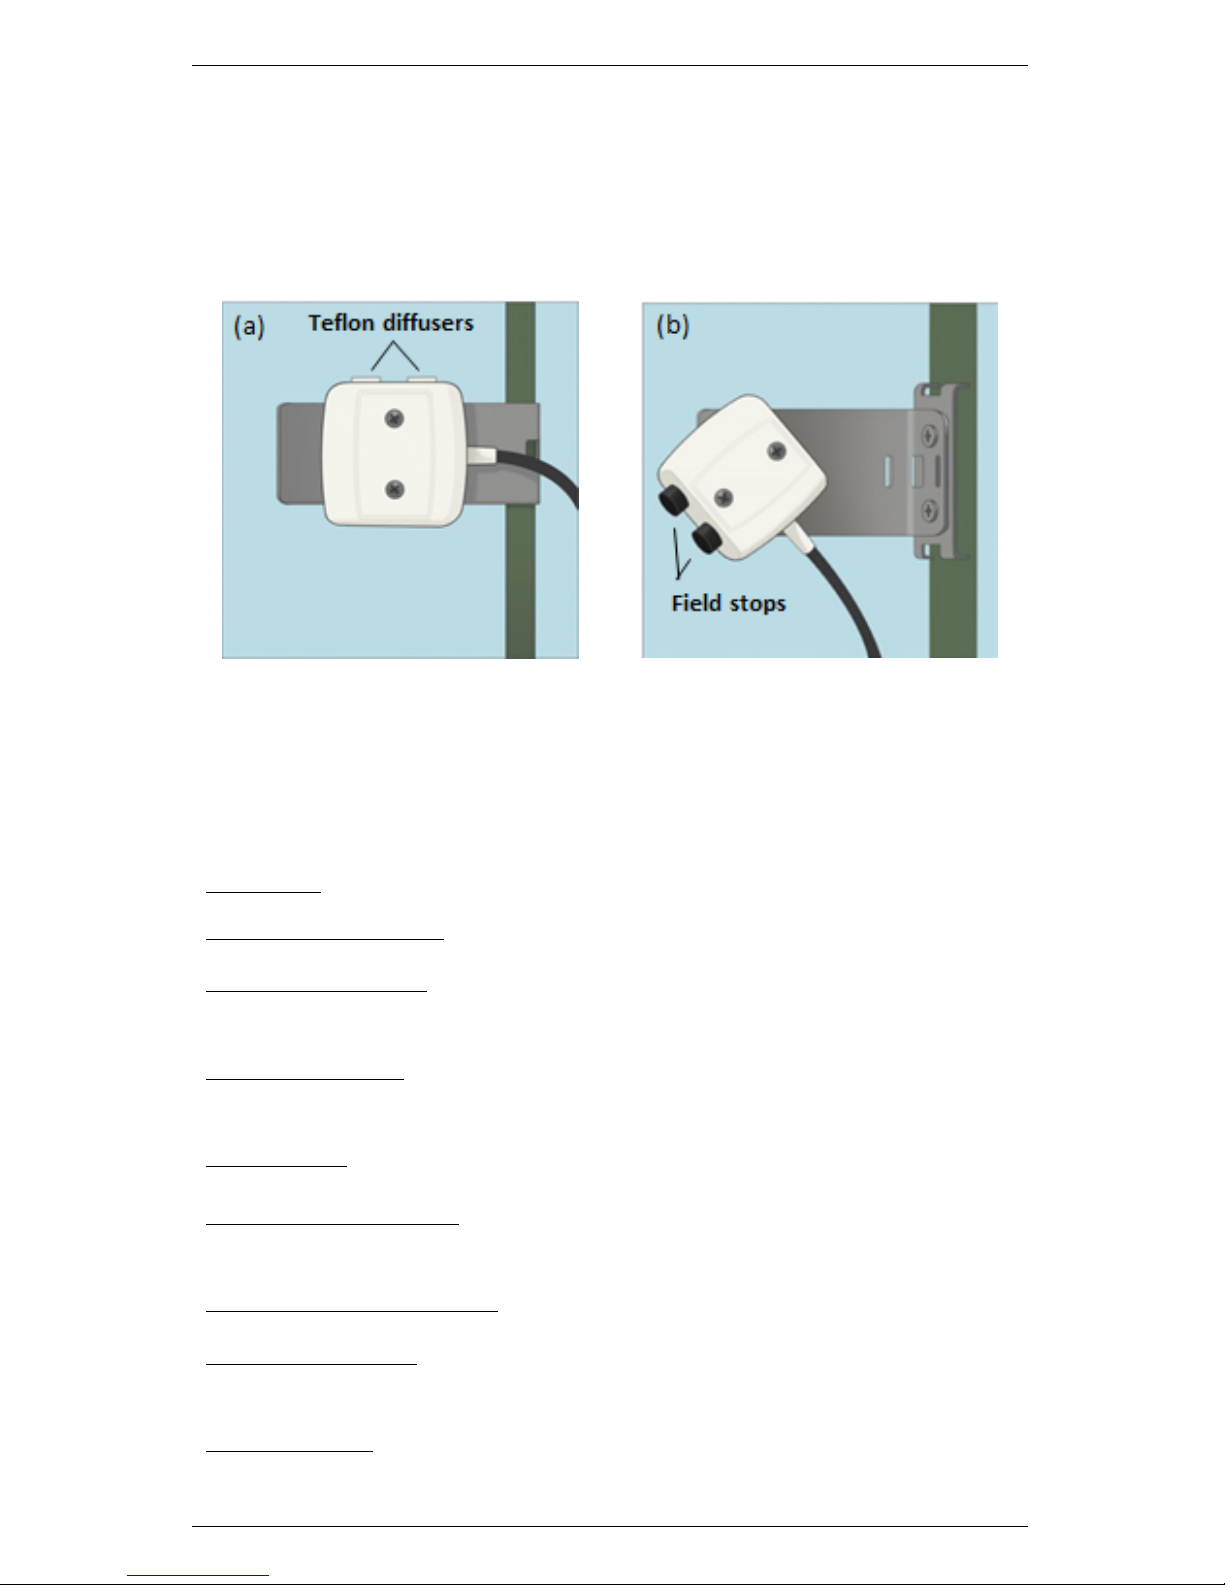
and PRI-field stop. The hemispherical versions (Figure 1) are built
with Teflon diffusers for making cosine-corrected measurements, and
are primarily designed for up looking measurements of incident radiation. The field stop versions (Figure 2) have a field of view restricted
to 20◦and are designed for pointing downward to measure canopy
reflected radiation in NDVI and PRI wavelengths.
The reflected radiation from a vegetated surface is highly variable,
depending on the amount and type of vegetation cover. This variability requires a relatively large number of sensors to properly characterize this surface. The field stop and hemispherical versions can
both be used to quantify canopy reflected radiation. The correct
choice of sensor will depend on the objectives of the study. The
hemispherical sensor will do a better job of averaging reflected radiation over a broad area, but if it is not installed normal to the canopy
surface it will also average sky, leading to measurement error. The
field stop sensor can be aimed at a particular spot or have a particular orientation giving the user more control over what portion of the
canopy is being measured. When using the field stop sensor in an
off-nadir orientation the user should be careful that the sensor is not
pointed above the horizon.
Calculating NDVI or PRI requires knowing both the incoming and
reflected radiation. Unlike the reflected radiation, the incoming radiation is spatially uniform above the canopy. So, you only need one up
facing radiometer to compute the vegetation indices for many down
facing radiometers. The up looking radiometer should be leveled and
have a hemispherical field of view.
3
Page 8
2 ABOUT SRS SRS Sensors
The SRS is a digital sensor. Its outputs follow the SDI-12 standard. The SRS is best suited for use with Decagon’s Em50, Em50R,
and Em50G data loggers. However, customers can use the SRS with
other loggers, such as those from Campbell Scientific.
Figure 1: Hemispherical Version
Figure 2: Field Stop Version
2.2 Specifications
Accuracy: 10% or better for spectral irradiance and radiance values
Measurement Time: < 300 ms
NDVI Wavebands: 630 and 800 nm central wavelengths, with 50
and 40 nm full width half maximum band widths
PRI Wavebands: 531 and 571 nm central wavelengths, with 10 nm
full width half maximum band widths
Dimensions: 43 x 40 x 27 mm
Power Requirements: 3.6 to 15 V DC, 4 mA (reading, 300 ms) 30
µA (quiescent)
Operating Temperature: −40 to 50◦C
Connector Types: 3.5 mm (stereo) plug or stripped & tinned lead
wires (Pigtail)
Cable Length: 5 m standard; custom cable length available upon
request.
4
Page 9

SRS Sensors 2 ABOUT SRS
Other Features:
• SDI-12 digital sensor, compatible with Decagon’s EM50
family and CSI loggers
• In-sensor storage of calibration values
• Four versions
NDVI-hemispherical
NDVI-field stop
PRI-hemispherical
PRI-field stop
• NDVI or PRI sensors with Teflon cosine correcting heads
• NDVI or PRI sensors with 20 degree field stops sealed
with clear acrylic
• NIST traceable calibration to known spectral radiance or
irradiance values
• Sensors can be mounted facing up or down, singly or in
tandem, leveled or aimed
• Fully sealed from the elements and UV resistant to minimize drift over time
5
Page 10

3 THEORY SRS Sensors
3 Theory
Decagon designed the SRS instruments to measure the NDVI and
PRI vegetation indices from plant canopies. We caution users that
NDVI and PRI are measurements of electromagnetic radiation reflected from canopy surfaces, and therefore provide indirect or correlative associations with several canopy variables of interest and
should not be treated as direct measurements of these variables.
NDVI has a well-established and long history of use in remote sensing research and ecological applications related to canopy structure.
PRI, while showing great promise for quantifying canopy physiological function, is far more experimental with new uses and caveats
continually being uncovered. While NDVI and PRI can be powerful
tools for inferring structure and function of plant canopies, you must
take into account their limitations when interpreting the data. Section 3 provides an overview of the theory and discusses some of the
uses and limitations of each vegetation index.
3.1 Normalized Difference Vegetation Index (NDVI)
A number of nondestructive methods exist for remotely monitoring
and quantifying certain canopy characteristics. Some of those characteristics are: foliar biochemistry and pigment content, leaf area
index (LAI, Nguy-Robinson et al., 2012), phenology, and canopy
photosynthesis (Ryu et al., 2010). One of the most common nondestructive techniques involves measuring the NDVI. The NDVI is one
of a large number of vegetation indices. The principle derives from
a well known concept that vegetation reflects light differently in the
visible spectrum (400 to 700 nm) compared to the near infrared (>
700 nm).
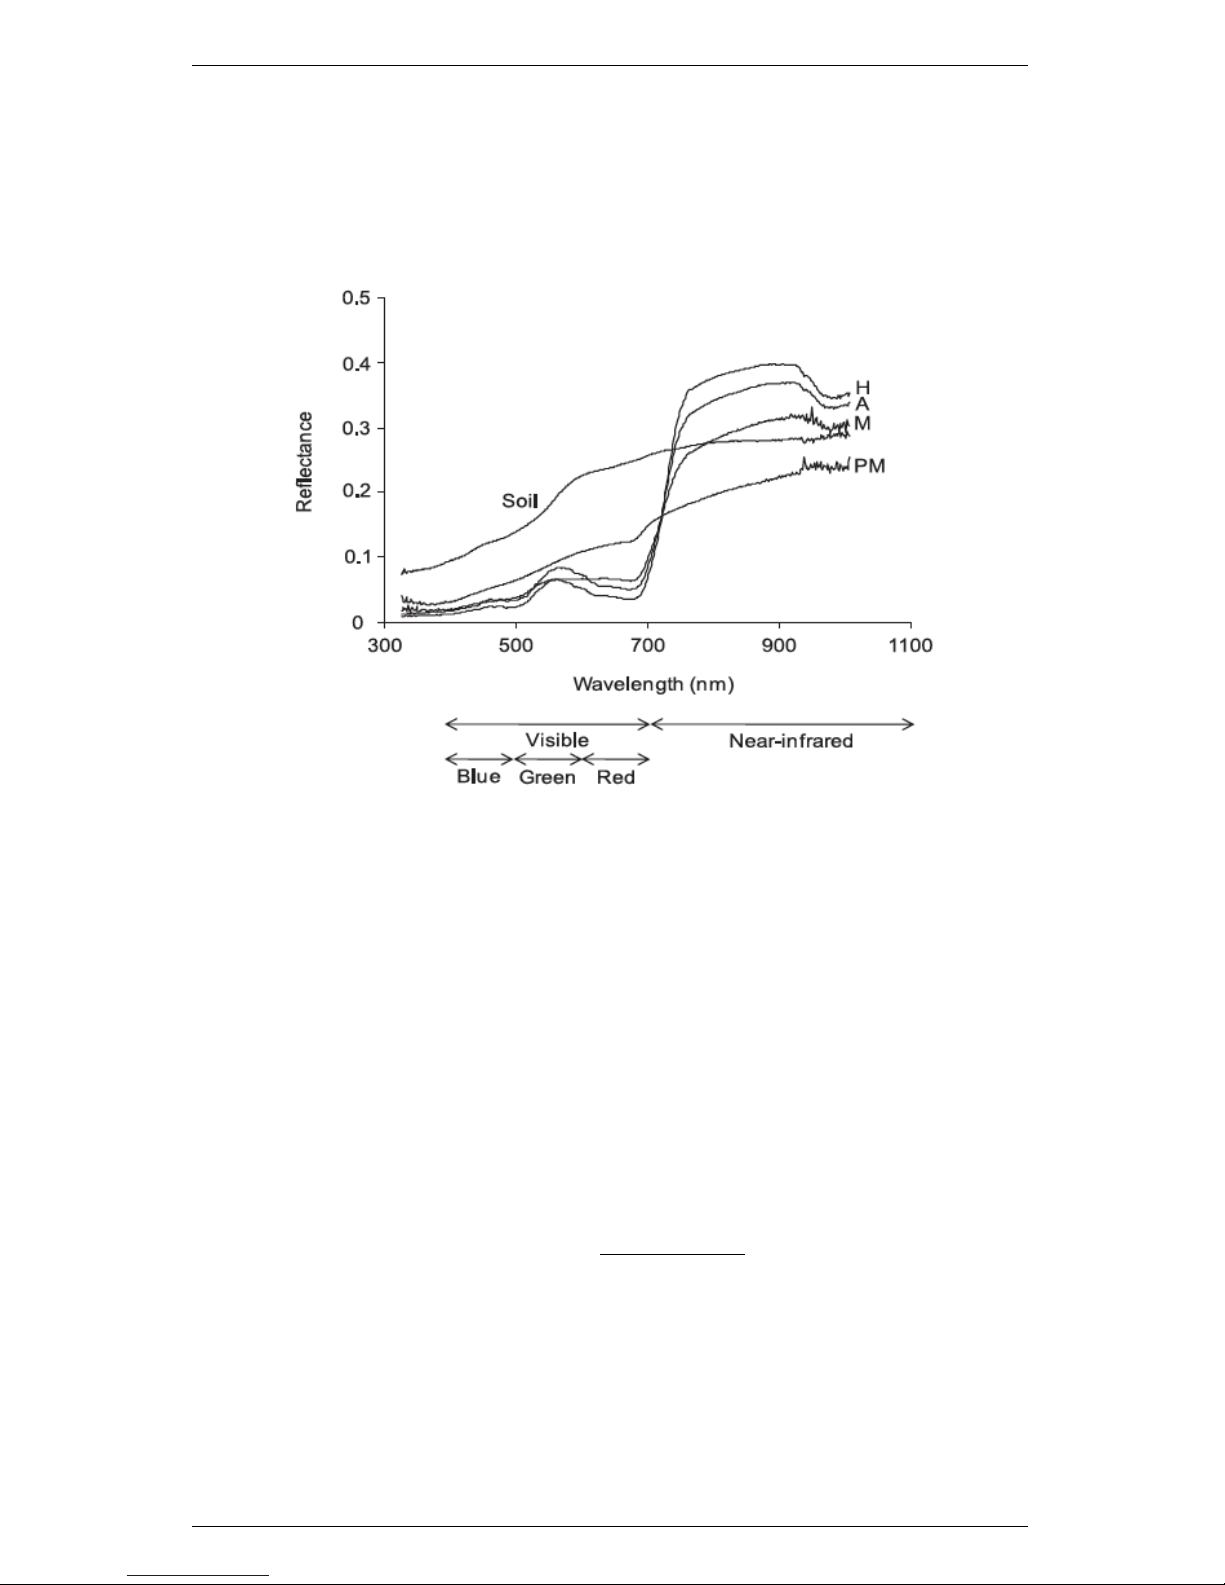
Green leaves absorb light most strongly in the visible spectrum,
but are highly reflective in the near infrared region (Figure 3). Because bare soil, detritus, stems, trunks, branches, and other nonphotosynthetic elements show relatively little difference in reflectance
between the visible and near infrared, measuring the difference between reflectance in these two bands can be related to the amount
6
Page 11
SRS Sensors 3 THEORY
of photosynthetic vegetation in the field of view of a radiometer.
See Royo and Dolors (2011) for an extensive introduction to using
spectral indices for plant canopy measurements.
Figure 3: Reflectance spectra for bare soil (Soil) and a healthy
wheat crop at various stages of development: heading (H), anthesis
(A), milk-grain stage (M), and post maturity (PM). Consider two
things about this figure: First, the considerable difference between
reflectance spectra from the soil and all stages of plant
development. Second, the changes in the visible spectra as the
canopy matures and senesces. We reproduced this figure with
permission from Royo and Dolors (2011).
Calculate NDVI with equation 1.
NDV I =
ρ
NIR
− ρ
red
ρ
NIR
+ ρ
red
(1)
Where, ρ
red
and ρ
NIR
are percent reflectances in the red and near
infrared (NIR). We assume percent reflectance to be the ratio of reflected to incident radiation in the specified waveband. A detailed
description of how to calculate reflectances from measured radiation
values is provided in equation number 4. NDVI has been shown to
7
Page 12

3 THEORY SRS Sensors
correlate well with green LAI, although the relationship is specific
for each crop or natural canopy. For example, Aparicio et al. (2002)
studied NDVI versus LAI in more than twenty different durum wheat
genotypes in seven experiments over two years and found the relationship shown in Figure 4. Nguy-Robinson (2012) also studied the
behavior of NDVI versus LAI in maize and soybean. Their data suggest a similar relationship between the two crops, but not identical.
These relationships have been developed for a wide range of crop
and natural canopies and we encourage our customers to seek out
the best relationship for their application.
Figure 4: Relationship between leaf area index and NDVI for 20-25
durum wheat genotypes studied over two years in seven different
experiments by Aparicio et al. (2002). Values shown were taken at
anthesis and milk-grain stage. Used with permission from author.
3.2 Fractional Interception of Photosynthetically Ac-
tive Radiation
The use of NDVI for determination of leaf area index has limitations. Like many nondestructive techniques (e.g., fisheye and ceptometer techniques), the measurement of NDVI becomes less and less
sensitive as LAI increases above a certain point (Figure 3). Nguy-
8
Page 13

SRS Sensors 3 THEORY
Robinson et al. (2012) suggest changes in LAI are difficult to detect
when LAI is much greater than 3 m2m−2. This should not be surprising considering the spectral measurement being made. NDVI measurements rely on reflected light from leaf surfaces. As the canopy
fills and upper leaves begin to cover lower leaves, the leaf area will
continue to increase without making a further contribution to reflected radiation. Furthermore, foliar chlorophyll is a very efficient
absorber of radiation in red wavelengths so that reflectance from
leaves is typically very low in the red region (Figure 3). Therefore,
increasing LAI, and thus canopy chlorophyll content does not substantially change red reflectance beyond a certain point. Thus, NDVI
has limited predictive ability in canopies with high LAI. For some
applications NDVI saturation at high LAI may not be as important
as it would appear.
Although the technique may give poor estimates of LAI at high LAI,
shaded leaves tend to have much less impact on resource capture
compared to sunlit leaves, and therefore contribute proportionally
less to canopy productivity. As a general modeling parameter, an
estimate of sunlit leaves may be adequate for estimating photosynthesis and biomass accumulation (i.e., carbon uptake) for some applications.Monteith (1977) proposed the now well-known relationship
between biomass accumulation and radiation capture seen in equation 2.
An, canopy = fsS
t
(2)
In equation 2, A
n,canopy
is the biomass accumulation or carbon assimilation and is a conversion efficiency often referred to as light use efficiency (LUE). The LUE depends on a variety of factors such as photosynthetic acclimation, physiological stress level, and plant species.
fsis the fractional interception of radiation by the canopy, and S
t
is the total incident radiation. The relationship between NDVI and
LAI in Nguy-Robinson et al. (2012) and the relation between fractional interception and LAI (Campbell and Norman, 1998) show that
NDVI and fractional interception are approximately related linearly
(Figure 5). NDVI can provide a good estimate of the fractional interception by green leaves in a canopy; a value that is critical for
carbon assimilation models.
9
Page 14

3 THEORY SRS Sensors
Figure 5: Relationship between fractional canopy interception and
NDVI, where NDVI is converted to LAI using Nguy-Robinson et al.
(2012). Campbell and Norman (1998) give the relationship between
LAI and fractional interception.
3.3 Canopy Phenology
Like all spectral measurements, NDVI is an indirect measurement.
Over the years, researchers have correlated parameters of interest,
like LAI and fs, to measurements made at 630 nm and 800 nm.
Researchers have estimated other variables using NDVI besides these
relationships. Two of these variables are the focus of Ryu et al.
(2010), who used a simple two-band LED-based sensor, similar to the
SRS-NDVI, to measure canopy phenology and associated changes in
photosynthesis in an annual grassland over a four year period. Ryu
et al (2010). show an exponential relationship between NDVI and
canopy photosynthesis, but found that the LAI of grassland never
increases above 2.5 m2m−2. Ecosystem phenology can also be tracked
in the time series data from their NDVI sensor with errors on the
order of a few days. It should be noted that they filtered their data
by limiting NDVI measurements to a particular sun elevation angle
(e.g., sampling under identical sun zenith and azimuth angles from
day to day).
10
Page 15

SRS Sensors 3 THEORY
3.4 Photochemical Reflectance Index (PRI)
As described above, the NDVI is primarily useful as a proxy for
canopy structural variables. Although structural properties are critical, sometimes it is useful to have information about canopy functional properties. For example, estimating the gross primary productivity (GPP) of ecosystems is critical for modeling the global carbon
balance. The simple model presented in Equation 2 can be used to
predict GPP from three variables: incident light (St), intercepted
light (fs), and light use efficiency (). Stcan generally be estimated
depending on geographic location and time of day or measured with
a PAR sensor or pyranometer. Considering the near linear relationship between NDVI and fractional interception noted above, a simple
two-band spectral reflectance sensor like the SRS-NDVI can provide
an estimate of fs. The light use efficiency term () remains to be
quantified in order to make accurate predictions of GPP.
Gamon et al. (1990, 1992) proposed a dual band vegetation index
(similar to the NDVI) to predict . The foundation of the measurement is based on the absorbance of xanthophyll pigments at 531 nm
that correlates with LUE in many plant species (Gamon et al., 1997).
This ratio is called the Photochemical Reflectance Index (PRI) and
is calculated with Equation 3.
P RI =
ρ
531
− ρ
570
ρ
531
+ ρ
570
(3)
Where, ρ
531
and ρ
570
are percent reflectances at 531 and 570 nm,
respectively. When combined, you can use NDVI and PRI to predict
biomass accumulation or GPP of an ecosystem without the expense
and work of some of the other approaches (Gamon et al., 2001). Because of the low cost, light weight, small footprint and low power use
of the sensors, they can be deployed very quickly, over long periods
of time, or in a spatially distributed network to quantify spatiotemporal variations in canopy productivity (Garrity et al., 2010).
In addition to LUE, the PRI has also been shown to correlate with
numerous other physiological variables associated with plant photosynthetic performance from the leaf to the ecosystem level (Gamon et
al., 1992, 1997, 2001). Xanthophylls absorb radiation at 531 nm and
11
Page 16

3 THEORY SRS Sensors
will absorb more radiation as a consequence of saturation of chlorophyll centers. A normalized difference of reflectance at 570 nm that
remains unchanged despite changes in light saturation to 531 nm
will indicate the level of xanthophyll absorbance and the efficiency
of plant light use. Because increased xanthophyll absorbance is not
solely correlated with LUE, researchers have investigated many other
relationships too.
Numerous studies correlate PRI to various ecophysiological variables
including the epoxidation state of xanthophyll, maximum photochemical efficiency of photosystem II, effective quantum yield, maximum photosynthesis rate, electron transport under saturating light,
non-photochemical quenching, and chlorophyll to carotenoid content ratio (Sims & Gamon, 2002; Garrity et al., 2011; Garbulsky
et al., 2011; Porcar-Castell et al., 2012). Garbulsky et al. (2011)
and Porcar-Castell et al. (2012) provide excellent overviews of what
has been done with PRI including analyses of PRI correlations with
several of these variables at the leaf, canopy, and ecosystem levels.
We encourage our customers to use these references as a starting
resource.
3.5 Sun-Sensor-Surface Geometry Considerations
Spectral reflectance measurements are inherently variable due to radiation source, reflecting surface, and sun-sensor-surface geometry.
Hence, it is not uncommon for a time series of NDVI or PRI to contain high amounts of variability. Consider changes in daily NDVI
measured at four-day intervals in a subalpine meadow. (Figure 6)
Figure 6 shows the control treatment green-up under drought conditions. The well-watered treatment in Figure 7 includes the same
time period but has already undergone initial green-up.
There are three things to notice about these data. First, canopy
green-up is clearly visible in the time series of the control (upper
graph) treatment. Second, the track of daily NDVI is generally concave, which indicates that sampling across a consistent sun angle (e.g.
60◦elevation angle (Ryu et al., 2012)) or around solar noon is advisable when summarizing an entire day to a single value. If comparing
12
Page 17

SRS Sensors 3 THEORY
measurements acquired under different sun-sensor-surface configurations, it is necessary to first calculate a bidirectional reflectance
distribution function (BRDF). Once you have empirically derived
a BRDF model from the measurements and canopy-specific parameters, you can use it to reduce variations that arise from changes
in sun-sensor-surface geometry across diurnal time series. For additional details on BRDF normalization of vegetation index time series,
see Hilker et al. (2008).
Sometimes NDVI values will exhibit erratic behavior due to environmental conditions (see Day 178 on both graphs). Data filtering
(e.g., visual inspection for short time series or automated despiking
algorithms for longer time series) may be required to remove spurious
data points.
Figure 6: Daily variation in NDVI measurements 1 m above a
sub-alpine meadow
13
Page 18

3 THEORY SRS Sensors
Figure 7: Another daily variation in NDVI measurements 1 m
above a sub-alpine meadow
3.6 Calculating Percent Reflectance from Paired Up
and Down Looking Sensors
Equation 1 shows that NDVI is the ratio of the difference to the
sum of NIR and red reflectances. Each reflectance is the ratio of upwelling (down looking sensor) to incident (up looking sensor) radiant
flux in each of the wave bands. Calculating this ratio is only possible when measurements of downwelling and upwelling radiation are
collected simultaneously under the same ambient conditions. Combining measurements made with sensors located long distances apart
is typically not recommended because atmospheric conditions (e.g.,
cloud cover, aerosols) can be highly variable in space. Reasonable
distances between up looking and down looking sensors will depend
on the typical radiation environment of a given location.
It is also important to arrange paired up looking and down looking sensors to collect data at the same time, which will account for
14
Page 19

SRS Sensors 3 THEORY
temporal variability in radiation conditions. In cases where multiple
down looking sensors have been deployed within close proximity to
each other, it is only necessary to have one up looking sensor. The
measurements from the single up looking sensor can be combined
with the measurements from each of the down looking sensors to calculate reflectances
In the event that up looking measurements are not available, rearrangement of the vegetation index equations allows for a rough
approximation of the measurements. The following derivation is for
NDVI, but similar equations apply to the PRI. If Rnis the reflected
NIR radiation from the canopy, Rris the reflected red radiation, I
n
is the incident NIR, and Iris the incident red, then
NDV I =
Rn/In− Rr/I
r
Rn/In+ Rr/I
r
=
(Ir/In)Rn− R
r
(Ir/In)Rn+ R
r
=
αRn− R
r
αRn+ R
r
(4)
Where α = Ir/In, equation 4 allows the computation of NDVI from
just the down facing measurements if you know the ratio of red to
NIR spectral irradiance, α. Although not extensively tested, we have
found that this ratio (α = 1.86 for NDVI bands) can be used as a
rough approximation during midday under relatively clear sky conditions. However, we caution that direct measurements of downwelling
radiation is more accurate by accounting for any fluctuations in α
that occur with changes in atmospheric conditions or across large
variations in sun elevation angle.
In the event that you do not want to use the default α value or
measurements from an up facing sensor are not available, it is is possible to use a spectralon panel or similar reflectance standard with a
field stop SRS to measure incident irradiance. To measure incident
irradiance with a down facing sensor, place a reflectance standard
within the field of view of the field stop sensor, making sure that the
reflectance panel is level, uniformly illuminated and that the field of
view of the sensor is fully within the area of the reflectance panel.
Measurements obtained from field stop sensors pointed at the reflectance panel must be multiplied by π to convert radiance values
to irradiance values. Irradiance values can then be used in Equation
4 or to calculate α directly.
15
Page 20

3 THEORY SRS Sensors
References
Aparicio, N., Villegas, D., Casadesus, J., Araus, J.L., and Royo,
C., (2000). Spectral vegetation indices as nondestructive tools for
determining durum wheat yield. Agronomy Journal, 92: 83-91.
Aparicio, N.; Villegas, D.; Araus, J.L.; Casadess, J.; Royo, C.,
(2002). Relationship between growth traits and spectral reflectance
indices in durum wheat. Crop Science, 42: 1547-1555.
Campbell, G.S. and Norman, J.M., (1998). An Introduction to Environmental Biophysics. Springer-Verlag. New York.
Gamon, J.A., Field, C.B., Bilger, W., Bjorkman, O., Fredeen, A.L.,
Penuelas, J., (1990). Remote sensing of the xanthophylls cycle and
chlorophyll fluorescence in sunflower leaves and canopies. Oecologia,
85: 1-7.
Gamon, J.A., Peuelas, J., Field, C.B., (1992). A narrow-waveband
spectral index that tracks diurnal changes in photosynthetic efficiency. Remote Sensing of Environment, 41: 35-44.
Gamon, J. A., Serrano, L., Surfus, J. S., (1997). The photochemical
reflectance index: an optical indicator of photosynthetic radiation
use efficiency across species, functional types, and nutrient levels.
Oecologia, 112: 492-501.
Gamon, J. A., Field, C. B., Fredeen, A. L., Thayer, S., (2001). Assessing photosynthetic downregulation in sunflower stands with an
optically based model. Photosynthesis Research, 67: 113-125.
Garbulsky, M.F., Peuelas, J., Gamon, J., Inoue, Y., Filella, Y. (2011).
The photochemical reflectance index (PRI) and the remote sensing
of leaf, canopy and ecosystem radiation use efficiencies: A review and
meta-analysis. Remote Sensing of the Environment, 115: 281-297.
Garrity, S.R., Vierling, L.A., Bickford, K., (2010). A simple filtered
photodiode instrument for continuous measurement of narrowband
16
Page 21

SRS Sensors 3 THEORY
NDVI and PRI over vegetated canopies. Agricultural & Forest Me-
teorology, 150: 489-496.
Garrity, S. R., Eitel, J. U. H., Vierling, L. A., (2011). Disentangling the relationships between plant pigments and the photochemical reflectance index reveals a new approach for remote estimation of
carotenoid content. Remote Sensing of Environment, 115: 628-635.
Hilker, T., Coops, N. C., Hall, F. G., Black, T. A., Wulder, M.
A., Nesic, Z., Krishnan, P., (2008). Separating physiologically and
directionally induced changes in PRI using BRDF models. Remote
Sensing of Environment, 112: 2777-2788.
Monteith, J.L., (1977). Climate and the efficiency of crop production
in Britain. Philosophical Transactions Royal Society of London B,
281: 277-294.
Nguy-Robertson, A. Gitelson, A., Peng, Y., Via, A., Arkebauer, T.,
and Rundquist, D., (2012). Green leaf area index estimation in maize
and soybean: Combining vegetation indices to achieve maximal sensitivity. Agronomy Journal, 104: 1336-1347.
Porcar-Castell, A., Garcia-Plazaola, J. I., Nichol, C. J., Kolari, P.,
Olascoaga, B., Kuusinen, N., Fernndez-Marn, B., Pulkkinen, M., Juurola, E., Nikinmaa, E., (2012). Physiology of the seasonal relationship between the photochemical reflectance index and photosynthetic
light use efficiency. Oecologia, 170: 313-323.
Royo, C. and Villegas, D., (2011). Field Measurements of Canopy
Spectra for Biomass Assessment of Small-Grain Cereals, Biomass Detection, Production and Usage, Darko Matovic (Ed.), ISBN: 978953-307-492-4, InTech, Available from: http://www.intechopen.com/bo
oks/biomass-detection-production-and-usage/field-measurements-ofcanopy-spectra-for-biomass-assessment-of-small-grain-cereals.
Ryu, Y., Baldocchi, D.D., Verfaillie, J., Ma, S., Falk, M., RuizMercado, I., Hehn, T., Sonnentag, O., (2012). Testing the performance of a novel spectral reflectance sensor, built with light emit-
17
Page 22

3 THEORY SRS Sensors
ting diodes (LEDs), to monitor ecosystem metabolism, structure and
function. Agricultural & Forest Meteorology, 150: 1597-1606.
Sims, D. A., Gamon, J. A., (2002). Relationships between leaf pigment content and spectral reflectance across a wide range of species,
leaf structures and developmental stages. Remote Sensing of Envi-
ronment, 81: 337-354.
18
Page 23

SRS Sensors 4 CONNECTING THE SRS
4 Connecting the SRS
4.1 Connecting to Decagon Data Logger
The SRS is most easily used with Decagon’s Em50, Em50R and
Em50G loggers (firmware version 2.13 or later). SRS sensors can
also be used with other SDI-12 enabled data loggers, such as those
from Campbell Scientific, Inc. The SRS requires an excitation voltage in the range of 3.6 to 15 volts.
To download data to your computer from an Em50 series logger, you
will need to install ECH2O Utility or DataTrac 3 on your computer.
The following software supports the SRS sensor:
Em50 Firmware version 2.14 or greater
ECH2O Utility 1.68 or greater
DataTrac 3.8 or greater
ProCheck 1.51 or greater
Note: Please check your software version to ensure it will support
the SRS.
To update your software to the latest versions, please visit Decagon’s
support site at http://www.decagon.com/support/.
To use the SRS with your Em50 series data logger, simply plug the
stereo plug into one of the five ports on the data logger and use either
ECH2O Utility, or DataTrac 3 software (see respective manuals) to
configure that port for the SRS and set the measurement interval.
The highest logging frequency for the Em50 and Em50R data loggers
is one minute and for the Em50G logger it is five minutes. When
you set the logging interval to greater than one minute on any of the
Em50 seiries loggers, reported readings are automatically averaged
using data sampled from the sensor at one minute intervals. Users
need to be cautious when choosing a sampling interval with SRS
sensors connected to an Em50 series logger, so that the averaging
feature does not result in erroneous measurement. For example, if
19
Page 24

4 CONNECTING THE SRS SRS Sensors
you desire only one reading per day and you select 24 hours as the
measurement interval, then each 24 hour reading will be an average
of values recorded over the previous 1,440 minutes, including periods
during the night. To avoid such errors, we recommend you log data
from the SRS sensors more frequently, even if you are not using all
logged data.
If customers require logging intervals shorter than one minute, then
they must use a Campbell Scientific or similar logger capable of
recording data at the desired frequency.
4.2 3.5 mm Stereo Plug Wiring
The SRS for Decagon loggers ships with a 3.5 mm stereo plug connector. The stereo plug allows for rapid connection directly to Decagon’s
Em50 and Em50G data loggers. Figure 8 shows the wiring configuration for this connector.
Figure 8: 3.5 mm Stereo Plug Wiring
4.3 Connecting to a Non-Decagon Logger
Customers may purchase the SRS for use with non-Decagon data
loggers. These sensors typically come configured with stripped and
tinned (pigtail) lead wires for use with SDI BUS terminals. Refer
to your particular logger manual for details on wiring. Our integrator’s guide gives detailed instructions on connecting the SRS to
non-Decagon loggers. Please visit www.decagon.com/support for the
complete integrator’s guide.
20
Page 25

SRS Sensors 4 CONNECTING THE SRS
4.4 Pigtail End Wiring
Figure 9: Pigtail End Wiring
SRS sensors with the stripped and tinned cable option can be made
with custom cable lengths (up to 305 meters) on a per meter fee
basis. This option gets around the need for splicing wire (a possible
failure point). Connect the wires to the data logger as Figure 10
shows. Connect the supply wire (white) to the excitation, the digital
out wire (red) to a digital input, and the bare ground wire to ground.
Figure 10: Pigtail End Wiring to Data Logger
Note: The acceptable range of excitation voltages is from 3.6 to 15
VDC. If you wish to read the SRS with the Campbell Scientific Data
Loggers, you will need to power the sensors off of a 12 V or switched
12 V port.
If your SRS is equipped with the standard 3.5 mm plug, and you
wish to connect it to a non-Decagon data logger, you have two op-
21
Page 26

4 CONNECTING THE SRS SRS Sensors
tions. First, you can clip off the plug on the sensor cable, strip and
tin the wires, and wire it directly into the data logger. This has the
advantage of creating a direct connection with no chance of the sensor becoming unplugged; however, it then cannot be easily used in
the future with a Decagon data logger. The other option is to obtain
an adapter cable from Decagon. The 3-wire sensor adapter cable has
a connector for the sensor jack on one end, and three wires on the
other end for connection to a data logger (this is referred to as a
“pigtail adapter,” Figure 10). Both the stripped and tinned adapter
cable wires have the same termination as seen above; the white wire
is excitation, red is data output, and the bare wire is ground.
Note: Be extra careful to secure your stereo to pigtail adapter connections to ensure that sensors do not become disconnected during
use.
22
Page 27

SRS Sensors 5 COMMUNICATION
5 Communication
The SRS communicates using SDI-12 protocol. This chapter discusses the specifics of SDI-1 Communication. For more information,
please visit www.decagon.com/support for an integrator’s guide that
gives more detailed explanations and instructions.
5.1 SDI-12 Communication
The SRS communicates using the SDI-12 protocol, a three-wire interface where all sensors are powered (white wire), grounded (bare
wire) and communicate (red wire) on shared wires (for more info,
go to www.sdi-12.org). There are some positive and negative elements of this protocol. On the positive side, multiple sensors can be
connected to the same 12 V supply and communication port on the
data logger. This simplifies wiring because no multiplexer is necessary. On the negative side, one sensor problem can bring down the
entire array (through a short circuit, etc.). To mitigate this problem,
we recommend the user make an independent junction box with wire
harnesses where all sensor wires are connected to binding posts so
you can disconnect sensors if a problem arises. A single three-wire
bundle can be run from the junction box to the data logger.
The SDI-12 protocol requires that each sensor have a unique address. The SRS comes from the factory with an SDI-12 address of
0. To add more than one SDI-12 sensor to a system, the sensor address must change. Address options include 0-9, A-Z, a-z. There are
two ways to set the SDI-12 sensor address. The best and easiest is
to use Decagon’s ProCheck (if the option is not available on your
ProCheck, please upgrade to the latest version of firmware). Access SDI-12 addressing in the “CONFIG” menu by selecting “SDI-12
Address” and pressing Enter. To change the SDI-12 address, press
the up and down arrows until you see the desired address and push
Enter. SDI-12 communication allows many parameters to be communicated at once, so you can also see things like the sensor model,
SDI-12 version, etc.
Campbell Scientific data loggers, like the CR10X, CR1000, CR3000,
23
Page 28

5 COMMUNICATION SRS Sensors
among others, also support SDI-12 Communication. Direct SDI-12
communication is supported in the “Terminal Emulator” mode under the “Tools” menu on the “Connect” screen. Detailed information
on setting the address using CSI data loggers can be found on our
website at http://www.decagon.com/support/downloads/.
The sensor can be powered using any voltage from 3.6 to 15 V DC.
The SDI-12 protocol allows the sensors to be continuously powered,
so the power (white wire) can be connected to a continuous 12 VDC
source. However, the sensor can also be used with a switched 12 V
source. This can help reduce power use (although the SRS uses very
little power, 0.03 mA quiescent) and will allow the sensor array to
be reset if a problem arises.
Reading the SRS in SDI-12 mode using a CSI data logger requires a
function call. An example program from Edlog and CRBasic can be
found in the software section of http://www.decagon.com/support/.
24
Page 29

SRS Sensors 6 UNDERSTANDING DATA OUTPUTS
6 Understanding Data Outputs
6.1 Using Decagon’s Em50 series data loggers
Each SRS sensor generates multiple outputs when connected to Decagon’s
Em50 data logger. The exact outputs will in part depend on how
many and what type of SRS sensors are attached to the data logger.
All SRS sensors are equipped with an internal tilt sensor. The orientation of the SRS, and therefore the tilt sensor, will determine the
output from each sensor.
6.1.1 Up Looking Sensor Outputs
For any hemispherical sensor oriented in the up looking position,
outputs will include the calibrated spectral irradiance (W m−2nm
−
1
)
and α, where α is the ratio of 630 nm to 800 nm for NDVI sensors
and 570 nm to 532 nm for PRI sensors. See Equation 4 for further
details on α.
6.1.2 Down Looking Sensor Outputs
When hemispherical or field stop sensors are mounted in a downlooking orientation, outputs include the calibrated spectral radiance
(W m−2nm−1sr−1) of each band and either NDVI or PRI. If both
up looking and down looking sensors of the same variety (e.g., up
looking hemispherical NDVI and down looking field stop NDVI) are
connected to the same data logger then α from the up looking sensor
is combined with the spectral radiance values from the down looking
sensor to calculate the vegetation index, using Equation 4. In the
event that only down looking sensors are connected to a data logger,
then either the default or the user-specified static α value is used
to calculate the vegetation index. Based on observations collected
near Pullman, WA (46◦45’0”N, 117◦09’6”W), default α values have
been set to 0.98 and 1.86 for PRI and NDVI, respectively. Note that
actual values of α will change depending on atmospheric conditions
and sun angle, so users are encouraged to measure α with an up looking hemispherical sensor. In the event that nearby up looking and
25
Page 30

6 UNDERSTANDING DATA OUTPUTS SRS Sensors
down looking sensors are connected to different data loggers, you can
export tabular data as Excel files and manually combine α from the
up looking sensor with the spectral radiance values from the down
looking sensor to calculate NDVI or PRI.
6.2 Using other data loggers
When connected to non-Decagon data loggers (e.g., Campbell Scientific) sensors will output the calibrated spectral irradiance or radiance from each band and an orientation value from the tilt sensor.
Spectral irradiance and radiance are output as radiant fluxes (in W
m−2nm−1or W m−2nm−1sr−1) for the shorter and then the longer
wavelength sensor. Tilt sensor readings are output as a single value
between 0 and 2, with 0 indicating an indeterminate orientation, 1
indicating a down facing orientation, and 2 indicating an up facing
orientation. Additional information about using the SRS with nonDecagon data loggers can be accessed at www.decagon.com/srs. For
additional information about connecting your SRS to non-Decagon
data loggers, see Section 4.3.
26
Page 31

SRS Sensors 7 INSTALLING THE SRS
7 Installing the SRS
7.1 Attaching and Leveling
The SRS comes with a variety of mounting hardware, allowing it
to be mounted on posts, rebar, poles, tripods, etc. The mounting
hardware allows for vertical adjustment and orientation on the pole
and allows for sensor tilt. Up-facing sensors have Teflon diffusers
and measure radiation from the entire upper hemisphere. The sensor therefore needs to be leveled and mounted in a location where it
will not be shaded and has an unobstructed view of the sky.
For down-facing sensors, the SRS can be mounted any distance from
the canopy, but it is important to keep in mind that the influence of
individual plants on the reading increases as the sensor gets closer
to the canopy.
You may use hemispherical down facing sensors, but make sure to
mount them facing directly down so they are not “seeing” sky. The
influence of the pole and sky can be avoided by using field stop radiometers. These will average over just the area within the 20◦field
of view where you aimed them. Assure that the area they see is
representative and carefully choose the view elevation and azimuth.
When the view angle is directly away from the sun the sensor sees
mostly sunlit leaves. If it points perpendicular to the sun rays the
sensor will see an increased fraction of shadow. Field stop sensors are
intended for measuring canopy-reflected radiation and should not be
mounted in an up facing orientation.
7.2 Cleaning and Maintenance
Optical surfaces need to be kept clean and free from dust, debris and
deposits. Clean surfaces with water and a soft cloth as necessary.
Return the radiometer to the factory for recalibration after approximately one year of outdoor exposure. See section 8.3 for more details
on calibration.
27
Page 32

8 TROUBLESHOOTING SRS Sensors
8 Troubleshooting
Any problem with the SRS will most likely manifest as failed communication or erroneous readings. Before contacting Decagon about
the sensor, please check these troubleshooting steps.
8.1 Data Logger
1. Check to make sure the connections to the data logger are both
correct and secure.
2. Ensure that your data logger batteries are not dead or loose.
3. Check the configuration of your data logger in ECH2O Utility
or DataTrac 3 to make sure you have selected the correct SRS
version (NDVI or PRI).
4. If using Decagon loggers make sure that you are using the correct versions of logger firmware and software.
8.2 Sensors
1. Ensure that you install the sensors according to the “Installation” section of this manual.
2. Check sensor cables for nicks or cuts that could cause a malfunction.
8.3 Calibration
Decagon Devices Inc. factory calibrates the Spectral Reflectance Sensor against a NIST traceable light source. Details about your sensor
calibration are available upon request. We have a recalibration service available and recommend that you send in your SRS sensors for
recalibration every one to two years. You will need a Return Material
Authorization (RMA) form to send your sensor in for recalibration.
Call or email Decagon at 509-332-5600 or support@decagon.com to
arrange for a RMA, or to obtain your sensor calibration information.
28
Page 33

SRS Sensors 9 DECLARATION OF CONFORMITY
9 Declaration of Conformity
Application of Council Directive: 89/336/EE6
Standards to which conformity is
declared:
EN61326 : 1998 and EN500082 :
1998
Manufacturer’s Name: Decagon Devices, Inc 2365 NE
Hopkins Ct. Pullman, WA 99163
USA
Type of Equipment: Spectral Reflectance Sensor
Model Number: SRS
Year of First Manufacture: 2013
This is to certify that the SRS Spectral Reflectance Sensor, manufactured by Decagon Devices, Inc., a corporation based in Pullman,
Washington, USA meets or exceeds the standards for CE compliance
as per the Council Directives noted above. All instruments are built
at the factory at Decagon and pertinent testing documentation is
freely available for verification.
29
Page 34

Index
Calibration, 28
CE Compliance, 29
Cleaning, 27
Connecting Sensors
Non-Decagon Logger, 20
Connecting the Sensors, 19
Contact Information, 1
Customer Support, 1
Declaration of Conformity, 29
Email, 1
Fax, ii
Fractional Interception, 8
Installation, 27
Leaf Area Index(LAI), 6
Measurement Angle, 12
NDVI, 6
Phenology, 10
Phone, ii
Photochemical Reflectance Index,
1
Photosynthesis, 10
Pigtail End Wiring, 21
SDI-12 Communication, 23
Seller’s Liability, 2
Specifications, 4
Stereo Wiring 3.5 mm, 20
Troubleshooting, 28
Warranty, 2
30
 Loading...