

Page 1

DEC4000AXP
ServiceGuide
Order Number: EK–KN430–SV. B01
Digital Equipment Corporation
Maynard, Massachusetts
Page 2

Revised, July 1993
First Printing, December 1992
The information in this document is subject to change without notice and should not be construed
as a commitment by Digital Equipment Corporation.
Digital Equipment Corporation assumes no responsibility for any errors that may appear in this
document.
The software, if any, described in this document is furnished under a license and may be used or
copied only in accordance with the terms of such license. No responsibility is assumed for the use
or reliability of software or equipment that is not supplied by Digital Equipment Corporation or its
affiliated companies.
Copyright © Digital Equipment Corporation, 1992. All Rights Reserved.
The Reader’s Comments form at the end of this document requests your critical evaluation to assist
in preparing future documentation.
The following are trademarks of Digital Equipment Corporation: Alpha AXP, AXP, DEC, DECchip,
DECconnect, DECdirect, DECnet, DECserver, DEC VET, DESTA, MSCP, RRD40, ThinWire,
TMSCP, TU, UETP, ULTRIX, VAX, VAX DOCUMENT, VAXcluster, VMS, the AXP logo, and the
DIGITAL logo.
OSF/1 is a registered trademark of Open Software Foundation, Inc.
All other trademarks and registered trademarks are the property of their respective holders.
FCC NOTICE: The equipment described in this manual generates, uses, and may emit radio
frequency energy. The equipment has been type tested and found to comply with the limits for
a Class A computing device pursuant to Subpart J of Part 15 of FCC Rules, which are designed
to provide reasonable protection against such radio frequency interference when operated in a
commercial environment. Operation of this equipment in a residential area may cause interference,
in which case the user at his own expense may be required to take measures to correct the
interference.
This document was prepared using VAX DOCUMENT, Version 2.1.
S2384
Page 3

Contents
Preface ................................................ xiii
1 System Maintenance Strategy
1.1 Troubleshooting the System . ....................... 1–1
1.2 Service Delivery Methodology ...................... 1–7
1.3 Product Service Tools and Utilities . . . ............... 1–8
1.4 Information Services ............................. 1–11
1.5 Field Feedback . . . ............................... 1–12
2 Power-On Diagnostics and System LEDs
2.1 Interpreting System LEDs . . ....................... 2–1
2.1.1 Power Supply LEDs ........................... 2–2
2.1.2 Operator Control Panel LEDs ................... 2–7
2.1.3 I/O Panel LEDs .............................. 2–9
2.1.4 Futurebus+ Option LEDs ....................... 2–11
2.1.5 Storage Device LEDs . . . ....................... 2–12
2.2 Power-Up Screens ............................... 2–15
2.2.1 Console Event Log ............................ 2–17
2.2.2 Mass Storage Problems Indicated at Power-Up ...... 2–18
2.2.3 Robust Mode Power-Up . ....................... 2–26
2.3 Power-Up Sequence .............................. 2–27
2.3.1 AC Power-Up Sequence . ....................... 2–27
2.3.2 DC Power-Up Sequence . ....................... 2–29
2.3.3 Firmware Power-Up Diagnostics . . ............... 2–32
2.3.3.1 Serial ROM Diagnostics ..................... 2–32
2.3.3.2 Console Firmware-Based Diagnostics........... 2–33
2.4 Boot Sequence . . . ............................... 2–33
2.4.1 Cold Bootstrapping in a Uniprocessor Environment . . 2–34
2.4.2 Loading of System Software ..................... 2–35
2.4.3 Warm Bootstrapping in a Uniprocessor
Environment . ............................... 2–36
v
Page 4

2.4.4 Multiprocessor Bootstrapping ................... 2–37
2.4.5 Boot Devices . . ............................... 2–37
3 Running System Diagnostics
3.1 Running ROM-Based Diagnostics ................... 3–1
3.1.1 test . ....................................... 3–3
3.1.2 show fru .................................... 3–5
3.1.3 show_status . . ............................... 3–7
3.1.4 show error . . . ............................... 3–8
3.1.5 memexer ................................... 3–10
3.1.6 memexer_mp . ............................... 3–11
3.1.7 exer_read ................................... 3–12
3.1.8 exer_write . . . ............................... 3–14
3.1.9 fbus_diag ................................... 3–16
3.1.10 show_mop_counter ............................ 3–18
3.1.11 clear_mop_counter ............................ 3–19
3.1.12 Loopback Tests............................... 3–20
3.1.12.1 Testing the Auxiliary Console Port (exer) . . ...... 3–20
3.1.12.2 Testing the Ethernet Ports (netexer) ........... 3–20
3.1.13 kill and kill_diags ............................ 3–21
3.1.14 Summary of Diagnostic and Related Commands ..... 3–21
3.2 DSSI Device Internal Tests . ....................... 3–22
3.3 DECVET...................................... 3–25
3.4 Running UETP . . ............................... 3–26
3.4.1 Summary of UETP Operating Instructions . . . ...... 3–26
3.4.2 System Disk Requirements ..................... 3–28
3.4.3 Preparing Additional Disks ..................... 3–28
3.4.4 Preparing Magnetic Tape Drives . . ............... 3–29
3.4.5 Preparing Tape Cartridge Drives . . ............... 3–29
3.4.5.1 TLZ06 Tape Drives. . ....................... 3–30
3.4.6 Preparing RRD42 Compact Disc Drives ............ 3–30
3.4.7 Preparing Terminals and Line Printers ............ 3–30
3.4.8 Preparing Ethernet Adapters .................... 3–30
3.4.9 DECnet for OpenVMS AXP Phase . ............... 3–31
3.4.10 Termination of UETP . . . ....................... 3–32
3.4.11 Interpreting UETP VMS Failures . ............... 3–32
3.4.12 Interpreting UETP Output ..................... 3–32
3.4.12.1 UETP Log Files ........................... 3–33
3.4.12.2 Possible UETP Errors ...................... 3–33
3.5 Acceptance Testing and Initialization. . ............... 3–34
vi
Page 5

4 Error Log Analysis
4.1 Fault Detection and Reporting ...................... 4–1
4.1.1 Machine Check/Interrupts ...................... 4–2
4.1.2 System Bus Transaction Cycle ................... 4–4
4.2 Error Logging and Event Log Entry Format ........... 4–4
4.3 Event Record Translation. . . ....................... 4–6
4.3.1 OpenVMS AXP Translation ..................... 4–6
4.3.2 DEC OSF/1 Translation . ....................... 4–7
4.4 Interpreting System Faults Using ERF and UERF ...... 4–7
4.4.1 Note 1: System Bus Address Cycle Failures . . ...... 4–12
4.4.2 Note 2: System Bus Write-Data Cycle Failures ...... 4–13
4.4.3 Note 3: System Bus Read Parity Error ............ 4–14
4.4.4 Note 4: Backup Cache Uncorrectable Error . . . ...... 4–14
4.4.5 Note 5: Data Delivered to I/O Is Known Bad. . ...... 4–15
4.4.6 Note 6: Futurebus+ DMA Parity Error ............ 4–15
4.4.7 Note 7: Futurebus+ Mailbox Access Parity Error .... 4–16
4.4.8 Note 8: Multi-Event Analysis of Command/Address
Parity, Write-Data Parity, or Read-Data Parity
Errors ..................................... 4–16
4.4.9 Sample System Error Report (ERF) ............... 4–16
4.4.10 Sample System Error Report (UERF) ............. 4–18
5 Repairing the System
5.1 General Guidelines for FRU Removal and Replacement . . 5–1
5.2 Front FRUs .................................... 5–4
5.2.1 Operator Control Panel . ....................... 5–4
5.2.2 Vterm Module ............................... 5–4
5.2.3 Fixed-Media Storage . . . ....................... 5–4
5.2.3.1 3.5-Inch Fast-SCSI Disk Drives (RZ26, RZ27,
RZ35) ................................... 5–4
5.2.3.2 3.5-Inch SCSI Disk Drives ................... 5–5
5.2.3.3 5.25-Inch SCSI Disk Drive ................... 5–6
5.2.3.4 SCSI Storageless Tray Assembly .............. 5–6
5.2.3.5 3.5-Inch DSSI Disk Drive .................... 5–7
5.2.3.6 5.25-Inch DSSI Disk Drive ................... 5–7
5.2.3.7 DSSI Storageless Tray Assembly .............. 5–8
5.2.4 Removable-Media Storage (Tape and Compact
Disc) ....................................... 5–8
5.2.4.1 SCSI Bulkhead Connector ................... 5–8
5.2.4.2 SCSI Continuity Card ...................... 5–8
5.2.5 Fans ....................................... 5–9
vii
Page 6

5.3 Rear FRUs ..................................... 5–16
5.3.1 Modules (CPU, Memory, I/O, Futurebus+) .......... 5–16
5.3.2 Ethernet Fuses .............................. 5–17
5.3.3 Power Supply . ............................... 5–17
5.3.4 Fans ....................................... 5–17
5.4 Backplane ..................................... 5–20
5.5 Repair Data for Returning FRUs .................... 5–22
6 System Configuration and Setup
6.1 Functional Description ............................ 6–1
6.1.1 System Bus . . ............................... 6–7
6.1.1.1 KN430 CPU .............................. 6–7
6.1.1.2 Memory . . ............................... 6–10
6.1.1.3 I/O Module ............................... 6–13
6.1.2 Serial Control Bus ............................ 6–15
6.1.3 Futurebus+ . . ............................... 6–16
6.1.4 Power Subsystem ............................. 6–17
6.1.5 Mass Storage . ............................... 6–19
6.1.5.1 Fixed-Media Compartments . . . ............... 6–19
6.1.5.2 Removable-Media Storage Compartment . . ...... 6–21
6.1.6 System Expansion ............................ 6–23
6.1.6.1 Power Control Bus for Expanded Systems . ...... 6–23
6.2 Examining System Configuration.................... 6–25
6.2.1 show config . . . ............................... 6–25
6.2.2 show device . . ............................... 6–26
6.2.3 show memory . ............................... 6–29
6.3 Setting and Showing Environment Variables ........... 6–29
6.4 Setting and Examining Parameters for DSSI Devices .... 6–33
6.4.1 show device du pu ............................ 6–33
6.4.2 cdp........................................ 6–34
6.4.3 DSSI Device Parameters: Definitions and Function. . 6–36
6.4.3.1 How OpenVMS AXP Uses the DSSI Device
Parameters .............................. 6–38
6.4.3.2 Example: Modifying DSSI Device Parameters .... 6–39
6.5 Console Port Baud Rate ........................... 6–41
6.5.1 Console Serial Port ........................... 6–42
6.5.2 Auxiliary Serial Port . . . ....................... 6–44
viii
Page 7

A Environment Variables
B Power System Controller Fault Displays
C Worksheet for Recording Customer Environment
Variable Settings
Glossary
Index
Examples
3–1 Running DRVTST ............................ 3–24
3–2 Running DRVEXR ............................ 3–25
4–1 ERF-Generated Error Log Entry Indicating CPU
Corrected Error .............................. 4–17
4–2 UERF-Generated Error Log Entry Indicating CPU
Error ...................................... 4–18
Figures
2–1 Power Supply LEDs ........................... 2–3
2–2 LDC and Fan Unit Locations and Error Codes ...... 2–6
2–3 OCP LEDs . . . ............................... 2–7
2–4 Module Locations Corresponding to OCP LEDs ...... 2–9
2–5 I/O Panel LEDs .............................. 2–10
2–6 Futurebus+ Option LEDs ....................... 2–11
2–7 Fixed-Media Mass Storage LEDs (SCSI) ........... 2–13
2–8 Fixed-Media Mass Storage LEDs (DSSI) ........... 2–14
2–9 Power-Up Self-Test Screen ...................... 2–16
2–10 Sample Power-Up Configuration Screen............ 2–17
2–11 Flowchart for Troubleshooting Fixed-Media
Problems ................................... 2–19
2–12 Flowchart for Troubleshooting Fixed-Media Problems
(Continued) . . ............................... 2–20
ix
Page 8

2–13 Flowchart for Troubleshooting Removable-Media
Problems ................................... 2–23
2–14 Flowchart for Troubleshooting Removable-Media
Problems (Continued) . . ....................... 2–24
2–15 AC Power-Up Sequence . ....................... 2–28
2–16 DC Power-Up Sequence . ....................... 2–30
2–17 DC Power-Up Sequence (Continued) .............. 2–31
4–1 ERF/UERF Error Log Format ................... 4–5
5–1 SCSI Continuity Card Placement . . ............... 5–9
5–2 Front FRUs . . ............................... 5–10
5–3 Storage Compartment with Four 3.5-inch Fast-SCSI
Drives (RZ26, RZ27, RZ35)...................... 5–11
5–4 Storage Compartment with Four 3.5-inch SCSI/DSSI
Drives ..................................... 5–12
5–5 3.5-Inch SCSI Drive Resistor Packs and Power
Termination Jumpers . . . ....................... 5–13
5–6 Position of Drives in Relation to Bus Node ID
Numbers ................................... 5–14
5–7 Storage Compartment with One 5.25-inch SCSI/DSSI
Drive ...................................... 5–15
5–8 Rear FRUs . . . ............................... 5–18
5–9 Ethernet Fuses and Ethernet Address ROMs . ...... 5–19
5–10 Removing Shell .............................. 5–21
5–11 Removing Backplane . . . ....................... 5–22
6–1 System Block Diagram . . ....................... 6–3
6–2 System Backplane ............................ 6–4
6–3 BA640 Enclosure (Front) ....................... 6–5
6–4 BA640 Enclosure (Rear) . ....................... 6–6
6–5 CPU Block Diagram ........................... 6–8
6–6 MS430 Memory Block Diagram . . . ............... 6–12
6–7 I/O Module Block Diagram ...................... 6–14
6–8 Serial Control Bus EEPROM Interaction ........... 6–16
6–9 Power Subsystem Block Diagram . . ............... 6–18
6–10 Fixed-Media Storage . . . ....................... 6–20
6–11 Removable-Media Storage ...................... 6–22
6–12 Sample Power Bus Configuration . . ............... 6–24
6–13 Device Name Convention ....................... 6–27
x
Page 9

6–14 How OpenVMS Sees Unit Numbers for DSSI
Devices ..................................... 6–39
6–15 Sample DSSI Buses for an Expanded DEC 4000 AXP
System ..................................... 6–41
6–16 Console Baud Rate Select Switch . . ............... 6–43
Tables
1–1 Recommended Troubleshooting Procedures . . . ...... 1–2
1–2 Diagnostic Flow for Power Problems .............. 1–5
1–3 Diagnostic Flow for Problems Getting to Console
Mode ...................................... 1–5
1–4 Diagnostic Flow for Problems Reported by the Console
Program .................................... 1–6
1–5 Diagnostic Flow for Boot Problems ............... 1–6
1–6 Diagnostic Flow for Errors Reported by the Operating
System ..................................... 1–7
2–1 Interpreting Power Supply LEDs . . ............... 2–4
2–2 Interpreting OCP LEDs . ....................... 2–8
2–3 Interpreting I/O Panel LEDs .................... 2–10
2–4 Interpreting Futurebus+ Option LEDs ............. 2–12
2–5 Interpreting Fixed-Media Mass Storage LEDs . ...... 2–14
2–6 Fixed-Media Mass Storage Problems .............. 2–21
2–7 Removable-Media Mass Storage Problems .......... 2–25
2–8 Supported Boot Devices . ....................... 2–37
3–1 Summary of Diagnostic and Related Commands ..... 3–21
4–1 DEC 4000 AXP Fault Detection and Correction ...... 4–2
4–2 Error Field Bit Definitions for Error Log
Interpretation ............................... 4–8
6–1 Memory Features ............................. 6–11
6–2 Power Control Bus ............................ 6–24
6–3 Environment Variables Set During System
Configuration . ............................... 6–30
6–4 Console Line Baud Rates ....................... 6–43
A–1 Environment Variables ....................... A–1
B–1 Power System Controller Fault ID Display . . . ...... B–1
C–1 Nonvolatile Environment Variables ............... C–1
xi
Page 10

Page 11

Preface
This guide describes the procedures and tests used to service DEC 4000 AXP
systems.
Intended Audience
This guide is intended for use by Digital Equipment Corporation service personnel
and qualified self-maintenance customers.
Conventions
The following coventions are used in this guide.
Convention Meaning
Return
Ctrl/x Ctrl/x indicates that you hold down the Ctrl key while you
bold type In the online book (Bookreader), bold type in examples
lowercase Lowercase letters in commands indicate that commands can be
A key name enclosed in a box indicates that you press that key.
press another key, indicated here by x. In examples, this key
combination is enclosed in a box, for example,
indicates commands and other instructions that you enter
at the keyboard.
entered in uppercase or lowercase.
Ctrl/C
.
xiii
Page 12

In some illustrations, small drawings of the DEC 4000 AXP
system appear in the left margin. Shaded areas help you locate
components on the front or back of the system.
Warning Warnings contain information to prevent personal injury.
Caution Cautions provide information to prevent damage to equipment
[]
console command
abbreviations
boot
italic type Italic type in console command sections indicates a variable.
< > In console mode online help, angle brackets enclose a
{ } In command descriptions, braces containing items separated by
or software.
In command format descriptions, brackets indicate optional
elements.
Console command abbreviations must be entered exactly as
shown.
Console and operating system commands are shown in this
special typeface.
placeholder for which you must specify a value.
commas imply mutually exclusive items.
xiv
Page 13

1
System Maintenance Strategy
Any successful maintenance strategy is based on the proper understanding
and use of information services, service tools, service support and escalation
procedures, field feedback, and troubleshooting procedures. This chapter
describes the maintenance strategy for the DEC 4000 AXP system.
• Section 1.1 provides a diagnostic strategy you should use to troubleshoot a
DEC 4000 AXP system.
• Section 1.2 explains the service delivery methodology.
• Section 1.3 lists the product tools and utilities.
• Section 1.4 lists available information services.
• Section 1.5 describes field feedback procedures.
1.1 Troubleshooting the System
Before troubleshooting any system problem, check the site maintenance log for
the system’s service history. Be sure to ask the system manager the following
questions:
• Has the system been used before and did it work correctly?
• Have changes to hardware or updates to firmware or software been made to
the system recently?
• What is the state of the system—is the operating system up?
If the operating system is down and you are not able to bring it up, use the
console environment diagnostic tools, such as RBDs and LEDs.
If the operating system is up, use the operating system environment
diagnostic tools, such as error logs, crash dumps, DEC VET and UETP
exercisers, and other log files.
System Maintenance Strategy 1–1
Page 14

System problems can be classified into the following five categories:
1. Power problems
2. Problems getting to the console
3. Failures reported by the console subsystem
4. Boot failures
5. Failures reported by the operating system
Using these categories, you can quickly determine a starting point for diagnosis
and eliminate the unlikely sources of the problem. Table 1–1 provides the
recommended tools or resources you should use to isolate problems in each
category.
Table 1–1 Recommended Troubleshooting Procedures
Description
1. Power Problems (Table 1–2)
Diagnostic
Tools/Resources Reference
No power at system
enclosure or trouble with
power supply subsystem, as
indicated by LEDs.
2. Problems Getting to Console Mode (Table 1–3)
System powers up, but
does not display power-up
screen.
Power supply
subsystem
LEDs
OCP LEDs Refer to Section 2.1.2 for information on
Console
terminal
troubleshooting
flow
Power-up
sequence
description
Robust mode
power-up
Refer to Section 2.1.1 for information on
interpreting power supply LEDs.
interpreting OCP LEDs.
Refer to Table 1–3 for information
on troubleshooting console terminal
problems.
Refer to Section 2.3 and 2.3.3 for a
description of the power-up and self-test
sequence.
Refer to Section 2.2.3 for a description of
robust mode power-up and its functions.
(continued on next page)
1–2 System Maintenance Strategy
Page 15

Table 1–1 (Cont.) Recommended Troubleshooting Procedures
Description
3. Failures Reported by the Console Program (Table 1–4)
Diagnostic
Tools/Resources Reference
Power-up console screens
indicate a failure.
4. Boot Failures (Table 1–5)
System fails to boot
operating system.
Power-up
screens
Console event
log
RBD device
tests
Console
commands
(to examine
environment
variables
and device
parameters)
Storage device
troubleshooting
flowcharts
RBD device
tests
Boot sequence
description
Refer to Section 2.2 for information on
interpreting power-up self-tests.
Refer to Section 2.2 for information on
the console event log.
Refer to Section 3.1 for information on
running RBD device tests.
Refer to Chapter 6 for instructions on
setting and examining environment
variables and device parameters.
Refer to Section 2.2.2.
Refer to Section 3.1 for information on
running RBD device tests.
Refer to Section 2.4 for a description of
the boot sequence.
(continued on next page)
System Maintenance Strategy 1–3
Page 16

Table 1–1 (Cont.) Recommended Troubleshooting Procedures
Description
5. Failures Reported by the Operating System (Table 1–6)
Diagnostic
Tools/Resources Reference
Operating system generates
error logs; process hangs or
operating system crashes.
Error logs Refer to Chapter 4 for information on
Crash dump Refer to OpenVMS AXP Alpha System
DEC VET or
UETP
Other log files Refer to Chapter 4 for information on
interpreting error logs.
Dump Analyzer Utility Manual for
information on how to interpret
OpenVMS crash dump files.
Refer to the Guide to Kernel Debugging
(AA–PS2TA–TE) for information on
using the DEC OSF/1 Krash Utility.
Refer to Section 3.3 for a description
of DEC VET, and Section 3.4 for
information on running UETP software
exercisers.
using log files such as SETHOST.LOG
and OPERATOR.LOG to aid in
troubleshooting.
Use the following tables to identify the diagnostic flow for the five types of system
problems:
• Table 1–2 provides the diagnostic flow for power problems.
• Table 1–3 provides the diagnostic flow for problems getting to console mode.
• Table 1–4 provides the diagnostic flow for problems reported by the console
program.
• Table 1–5 provides the diagnostic flow for boot problems.
• Table 1–6 provides the diagnostic flow for errors reported by the operating
system.
1–4 System Maintenance Strategy
Page 17

Table 1–2 Diagnostic Flow for Power Problems
Symptom Action Reference
No AC power at system
as indicated by AC
present LED.
AC power is present, but
system does not power
on.
Check the power source and power cord.
Check the system AC circuit breaker
setting.
Check the DC on/off switch setting.
Examine power supply subsystem LEDs
to determine if a power supply unit
or fan has failed, or if the system has
shut down due to an overtemperature
condition.
Section 2.1.1
Table 1–3 Diagnostic Flow for Problems Getting to Console Mode
Symptom Action Reference
Power-up screens (or
console event log) are
not displayed.
Check OCP LEDs for a failure during
self-tests. If two OCP LEDs remain lit,
either option could be at fault.
Check baud rate setting for console
terminal and system. The system default
baud rate setting is 9600.
Try connecting the console terminal to
the auxiliary console port.
Note: No console output is directed to
the auxiliary console port untill the
power-up self-tests have completed and
you press the Enter key or Ctrl/x.
For certain situations, power up under
robust mode to bypass the power-up
script and get to a low-level console.
From console mode, you can then edit the
nvram file, set and examine environment
variables, or initialize individual phases
of drivers.
Section 2.1.2
Section 6.5
Section 2.2.3
System Maintenance Strategy 1–5
Page 18

Table 1–4 Diagnostic Flow for Problems Reported by the Console Program
Symptom Action Reference
Power-up screens are
displayed, but tests do
not complete.
Console program reports
error.
Use power-up display and/or OCP LEDs
to determine error.
Examine the console event log to check
for embedded error messages recorded
during power-up.
If power-up screens indicate problems
with mass storage devices, use the
troubleshooting flow charts to determine
the problems.
Run RBD tests to verify problem. Section 3.1
Use the
examine error information contained
in serial control bus EEPROMs.
show error
command to
Section 2.2 and
Section 2.1.2
Section 2.2.1
Section 2.2.2
Section 3.1.4
Table 1–5 Diagnostic Flow for Boot Problems
Symptom Action Reference
System cannot find boot
device.
Device does not boot. Run device test to check that boot device
Check system configuration for correct
device parameters (node ID, device name,
and so on) and environment variables
(bootdef_dev, boot_file, boot_osflags).
is operating.
Section 6.2.1,
Section 6.3, and
Section 6.4
Section 3.2
1–6 System Maintenance Strategy
Page 19

Table 1–6 Diagnostic Flow for Errors Reported by the Operating System
Symptom Action Reference
System is hung or has
crashed.
Operating system is up. Examine the operating system error log
Examine the crash dump file. Operating system
Use the
examine error information contained
in serial control bus EEPROMs (console
environment error log).
files to isolate the problem.
If the problem occurs intermittently, run
DEC VET or UETP to stress the system.
Examine other log files, such as
SETHOST.LOG, OPCOM.LOG, and
OPERATOR.LOG.
show error
command to
documentation
Section 3.1.4
Chapter 4
Section 3.3 and
Section 3.4
1.2 Service Delivery Methodology
Before beginning any maintenance operation, you should be familiar with the
following:
• The site agreement
• Your local and area geography support and escalation procedures
• Your Digital Services product delivery plan
System Maintenance Strategy 1–7
Page 20

Service delivery methods are part of the service support and escalation
procedure. When appropriate, remote services should be part of the initial
system installation. Methods of service delivery include the following:
• Local support
• Remote call screening
• Remote diagnosis (using modem support)
Recommended System Installation
The recommended system installation includes:
1. Hardware installation and acceptance testing. Acceptance testing includes
running ROM-based diagnostics.
2. Software installation and acceptance testing. For example, using OpenVMS
Factory Installed Software (FIS), and then acceptance testing with DEC VET
or UETP.
3. Installation of the remote service tools and equipment to allow a Digital
Service Center to dial in to the system. Refer to your remote service delivery
strategy.
If you do not follow your service delivery methodology, you risk incurring
excessive service expenses for any product.
1.3 Product Service Tools and Utilities
This section lists the array of service tools and utilities available for acceptance
testing, diagnosis, and serviceability and provides recommendations for their use.
Error Handling/Logging
OpenVMS and DEC OSF/1 operating systems provide recovery from errors,
fault handling, and event logging. The OpenVMS Error Report Formatter
(ERF) provides bit-to-text translation of the event logs for interpretation.
DEC OSF/1 uses UERF to capture the same kinds of information.
RECOMMENDED USE: Analysis of error logs is the primary method of
diagnosis and fault isolation. If the system is up, or the customer allows the
service representative to bring the system up, look at this information first.
Refer to Chapter 4 for information on using error logs to isolate faults.
1–8 System Maintenance Strategy
Page 21

ROM-Based Diagnostics (RBDs)
ROM-based diagnostics have significant advantages:
• There is no load time.
• The boot path is more reliable.
• Diagnosis is done in console mode.
RECOMMENDED USE: The ROM-based diagnostic facility is the primary
means of console environment testing and diagnosis of the CPU, memory,
Ethernet, Futurebus+, and SCSI and DSSI subsystems. Use ROM-based
diagnostics in the acceptance test procedures when you install a system,
add a memory module, or replace the following: CPU module, memory
module, backplane, I/O module, Futurebus+ device, or storage device. Refer
to Section 3.1 for information on running ROM-based diagnostics.
Loopback Tests
Internal and external loopback tests are used to isolate a failure by testing
segments of a particular control or data path. The loopback tests are a subset
of the ROM-based diagnostics.
RECOMMENDED USE: Use loopback tests to isolate problems with the
auxiliary console port and Ethernet controllers. Refer to Section 3.1.12 for
instructions on performing loopback tests.
Firmware Console Commands
Console commands are used to set and examine environment variables and
device parameters. For example, the
and
show device
set
(bootdef_dev, auto_action, and boot_osflags) commands are used to set
environment variables; and the
parameters.
RECOMMENDED USE: Use console commands to set and examine
environment variables and device parameters. Refer to Section 6.2 for
information on firmware commands and utilities.
commands are used to examine the configuration; the
show memory,show configuration
cdp
command is used to configure DSSI
System Maintenance Strategy 1–9
,
Page 22

Option LEDs During Power-Up
The power supply LEDs display pass/fail test results for the power supply
subsystem; the operator control panel (OCP) LEDs display pass/fail self-test
results for CPU, memory, I/O, and Futurebus+ modules. Storage devices and
Futurebus+ modules have their own LEDs as well.
RECOMMENDED USE: Monitor LEDs during power-up to see if the devices
pass their self-tests. Refer to Chapter 2 for information on LEDs and powerup tests.
Operating System Exercisers (DEC VET or UETP)
The Digital Verifier and Exerciser Tool (DEC VET) is supported by the
OpenVMS and DEC OSF/1 operating systems. DEC VET performs exerciseroriented maintenance testing of both hardware and operating system. UETP
is included with OpenVMS and is designed to test whether the OpenVMS
operating system is installed correctly.
RECOMMENDED USE: Use DEC VET or UETP as part of acceptance testing
to ensure that the CPU, memory, disk, tape, file system, and network are
interacting properly. Also use DEC VET or UETP to stress test the user’s
environment and configuration by simulating system operation under heavy
loads to diagnose intermittent system failures.
Crash Dumps
For fatal errors, such as fatal bugchecks, OpenVMS and DEC OSF/1 operating
systems will save the contents of memory to a crash dump file.
RECOMMENDED USE: The support representative should analyze crash
dump files. To save a crash dump file for analysis, you need to know
proper system settings. Refer to the OpenVMS AXP Alpha System Dump
Analyzer Utility Manual or the Guide to Kernel Debugging (AA–PS2TA–TE)
for instructions.
Other Log Files
Several types of log files, such as operator log, console event log, sethost log,
and accounting file (accounting.dat) are useful in troubleshooting.
RECOMMENDED USE: Use the sethost log and other log files to
capture/examine the console output and compare with event logs and crash
dumps in order to see what the system was doing at the time of the error.
1–10 System Maintenance Strategy
Page 23

1.4 Information Services
As a Digital service representative, you may access several information resources,
including advanced database applications, online training courses, and remote
diagnostic tools. A brief description of some of these resources follows.
Technical Information Management Architecture (TIMA)
TIMA is an online database that delivers technical and reference information
to service representatives. A key benefit of TIMA is the pooling of worldwide
knowledge and expertise.
DEC 4000 AXP Model 600 Series Information Set
The DEC 4000 AXP Model 600 Series Information Set consists of service
documentation that contains information on installing and using, servicing
and upgrading, and understanding the system. The guide you are reading
is part of the set. The hardcopy kit number is EK–KN430–DK. The set is
also available on TIMA. Refer to your DEC 4000 Model 600 Information Map
(EK–KN430–IN) for detailed information.
Training
Computer Based Training (CBT) and lecture lab courses are available from
the Digital training center:
• DEC 4000 System Installation and Troubleshooting (CBT course, EY–
I090E–CO)
• Alpha Architecture Concepts (CBT course, EY–K725E–MT—magnetic
tape; EY–K725E–TK—TK50 tape)
• Futurebus+ Concepts (EY–F479E–CO)
Digital Services Product Delivery Plan (Hardware or Software)
The Product Delivery Plan documents Digital Services’ delivery commitments.
The plan is the communications vehicle used among the various groups
responsible for ensuring consistency between Digital Services’ delivery
strategies and engineering product strategies.
Blitzes
Technical updates are ‘‘blitzed’’ to the field using online mail and TIMA.
System Maintenance Strategy 1–11
Page 24

Storage and Retrieval System (STARS)
STARS is a worldwide database for storing and retrieving technical
information. The STARS databases, which contain more than 150,000 entries,
are updated daily.
Using STARS, you can quickly retrieve the most up-to-date technical
information via DSNlink or DSIN.
1.5 Field Feedback
Providing the proper feedback to the corporation is essential in closing the loop
on any service call. Consider the following when completing a service call:
• Fill out repair tags accurately and with as much symptom information as
possible so that repair centers can fix a problem.
• Provide accurate call closeout information for Labor Activity Reporting
System (LARS) or Call-Handling and Management Planning (CHAMP).
• Keep an up-to-date site maintenance log, whether hardcopy or electronic, to
provide a record of the performed maintenance.
1–12 System Maintenance Strategy
Page 25

2
Power-On Diagnostics and System
LEDs
This chapter provides information on how to interpret system LEDs and the
power-up console screens. In addition, a description of the power-up and
bootstrap sequence is provided as a resource to aid in troubleshooting.
• Section 2.1 describes how to interpret system LEDs.
• Section 2.2 describes how to interpret the power-up screens.
• Section 2.3 describes the power-up sequence.
• Section 2.3.3 describes power-on self-tests.
• Section 2.4 describes the boot sequence.
2.1 Interpreting System LEDs
DEC 4000 AXP systems have several diagnostic LEDs that indicate whether
modules and subsystems have passed self-tests. The power system controller
constantly monitors the power supply subsystem and can indicate several types
of failures. The system LEDs are used primarily to troubleshoot power problems
and problems getting to the console program.
This section describes the function of each of the following types of system LEDs,
and what action to take when a failure is indicated.
• Power supply LEDs
• Operator control panel (OCP) LEDs
• I/O panel LEDs
• Futurebus+ option LEDs
• Storage device LEDs
Power-On Diagnostics and System LEDs 2–1
Page 26

2.1.1 Power Supply LEDs
The power supply LEDs (Figure 2–1) are used to indicate the status of the
components that make up the power supply subsystem. The following types of
failures will cause the power system controller to shut down the system:
• Power system controller (PSC) failure
• Fan failure
• Overtemperature condition
• Power regulator failures (indicated by the DC3 or DC5 failure LEDs)
• Front end unit (FEU) failure
Note
The AC circuit breaker will also shut down the system. If a power surge
occurs, the breaker will trip, causing the switch to return to the off
position (0). If the circuit breaker trips, wait 30 seconds before setting the
switch to the on position (1).
Refer to Table 2–1 for information on interpreting the LEDs and determining
what actions to take when a failure is indicated.
Figure 2–2 shows the local disk converter (LDC) and fan locations as they
correspond to the fault ID display.
2–2 Power-On Diagnostics and System LEDs
Page 27
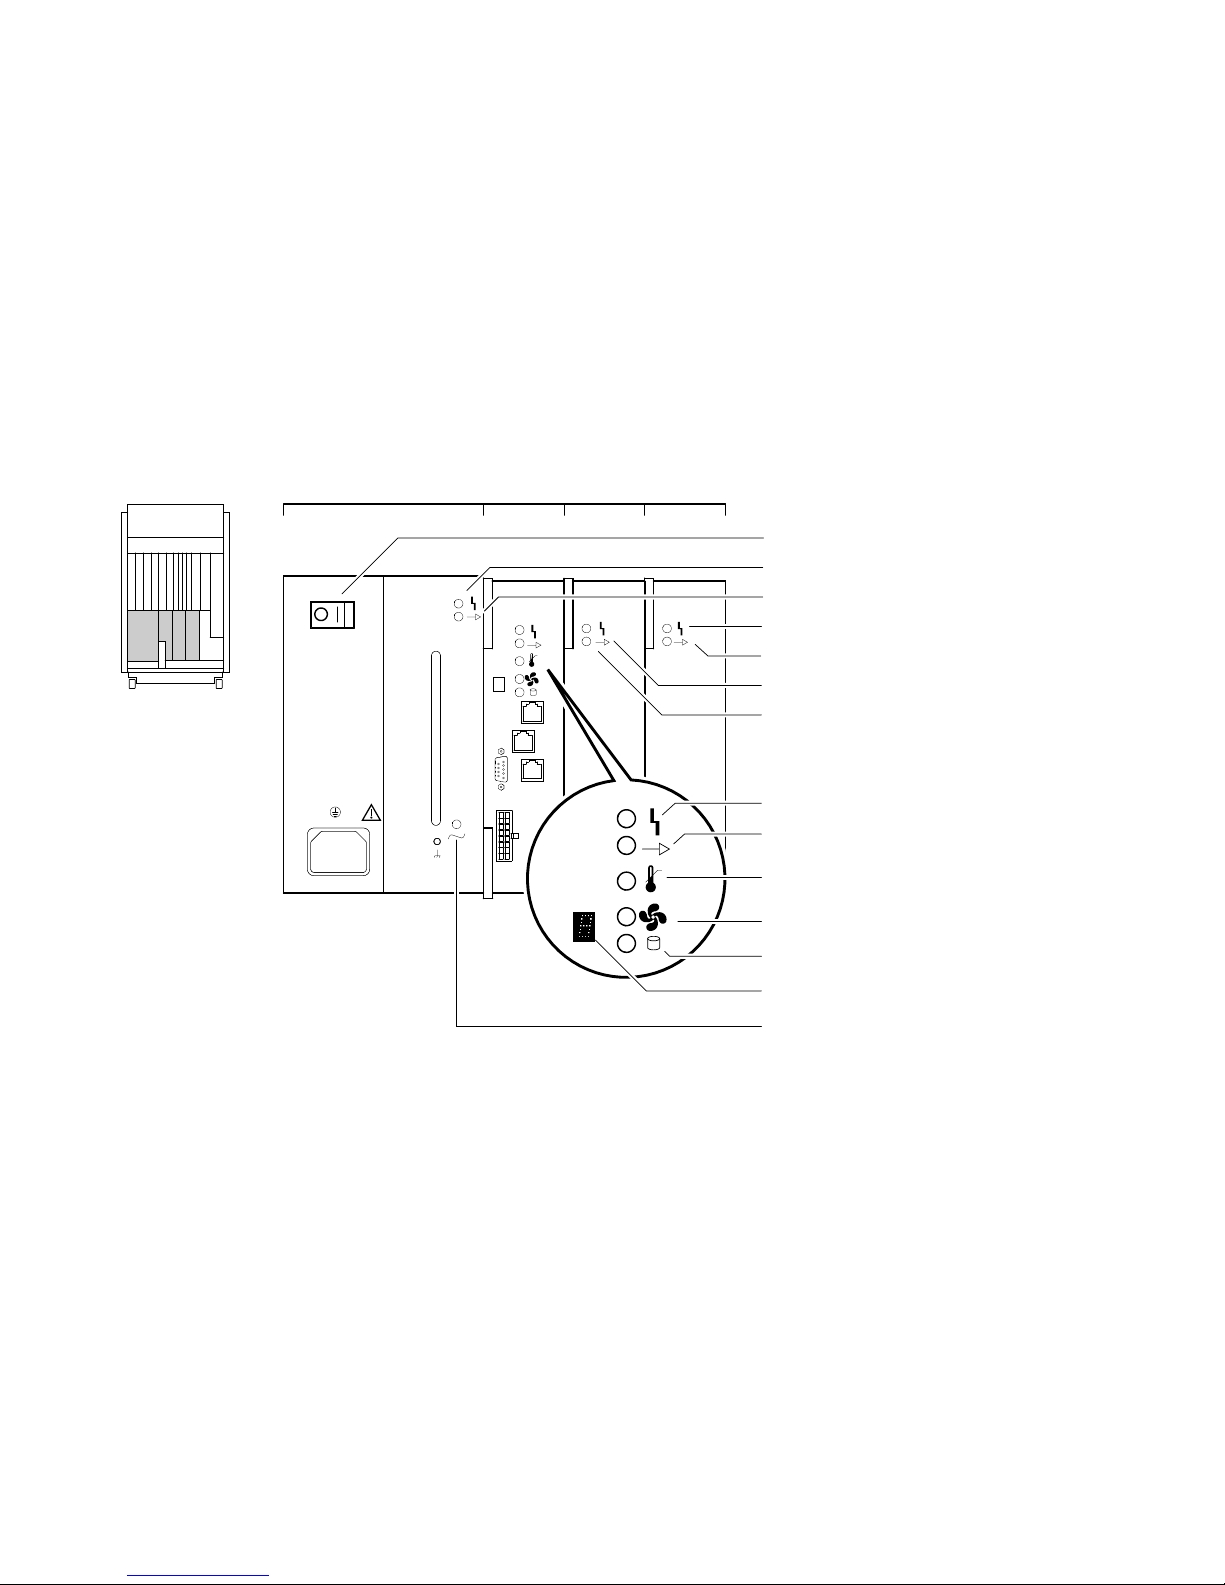
Figure 2–1 Power Supply LEDs
PSC DC3FEU DC5
MO
SI
SO
AC Circuit
Breaker
FEU Failure
FEU OK
DC3 Failure
DC3 OK
DC5 Failure
DC5 OK
PSC Failure
PSC OK
Over
Overtemperature
Shutdown
Fan Failure
Disk Power Failure
Fault ID Display
AC Present
LJ-02011-TI0
Power-On Diagnostics and System LEDs 2–3
Page 28

Table 2–1 Interpreting Power Supply LEDs
Indicator Meaning Action on Error
Front End Unit (FEU)
AC Present When lit, indicates AC power
is present at the AC input
connector (regardless of circuit
breaker position).
FEU OK When lit, indicates DC output
voltages for the FEU are above
the specified minimum.
FEU Failure When lit, indicates DC output
voltages for the FEU are less
than the specified minimum.
If AC power is not present, check
the power source and power cord.
If the system will not power up and
the AC LED is the only lit LED,
check if the system AC circuit
breaker has tripped. Replace the
front end unit (Chapter 5) if the
system circuit breaker is broken.
Replace front end unit (Chapter 5).
(continued on next page)
2–4 Power-On Diagnostics and System LEDs
Page 29

Table 2–1 (Cont.) Interpreting Power Supply LEDs
Indicator Meaning Action on Error
Power System Controller (PSC)
PSC OK When blinking, indicates the
PSC Failure When lit, indicates the PSC has
Disk Power
Failure
Fan Failure When lit, indicates a fan has
Overtemperature
Shutdown
PSC is performing power-up
self-tests.
When steady, indicates the PSC
is functioning normally.
detected a fault in itself.
When lit, indicates a disk
power problem for the storage
compartment specified in the
hexadecimal fault ID display.
The most likely failing unit is
the local disk converter, but a
shorting cable or drive could also
be at fault.
failed or a cable guide is not
properly secured. The failure is
identified by a number displayed
in the hexadecimal fault ID
display.
When lit, indicates the PSC has
shut down the system due to
excessive internal temperature.
Replace power system controller
(Chapter 5).
To isolate the local disk converter,
disconnect the drives on the
specified bus and then power
up the system. If the Disk Power
Failure LED lights with the drives
disconnected, replace the failing
local disk converter (Chapter 5).
Refer to Figure 2–2 to locate the
local disk converter specified by
the fault ID display. A is the top
compartment, D is the bottom
compartment.
Refer to Figure 2–2 to locate the
failure specified by the fault ID
display.
Replace the failing fan (Chapter 5).
Set the AC circuit breaker to off (0)
and wait one minute before turning
on the system.
Make sure the air intake is
unobstructed and that the room
temperature does not exceed
maximum requirement as
described in the DEC 4000 Site
Preparation Checklist.
(continued on next page)
Power-On Diagnostics and System LEDs 2–5
Page 30
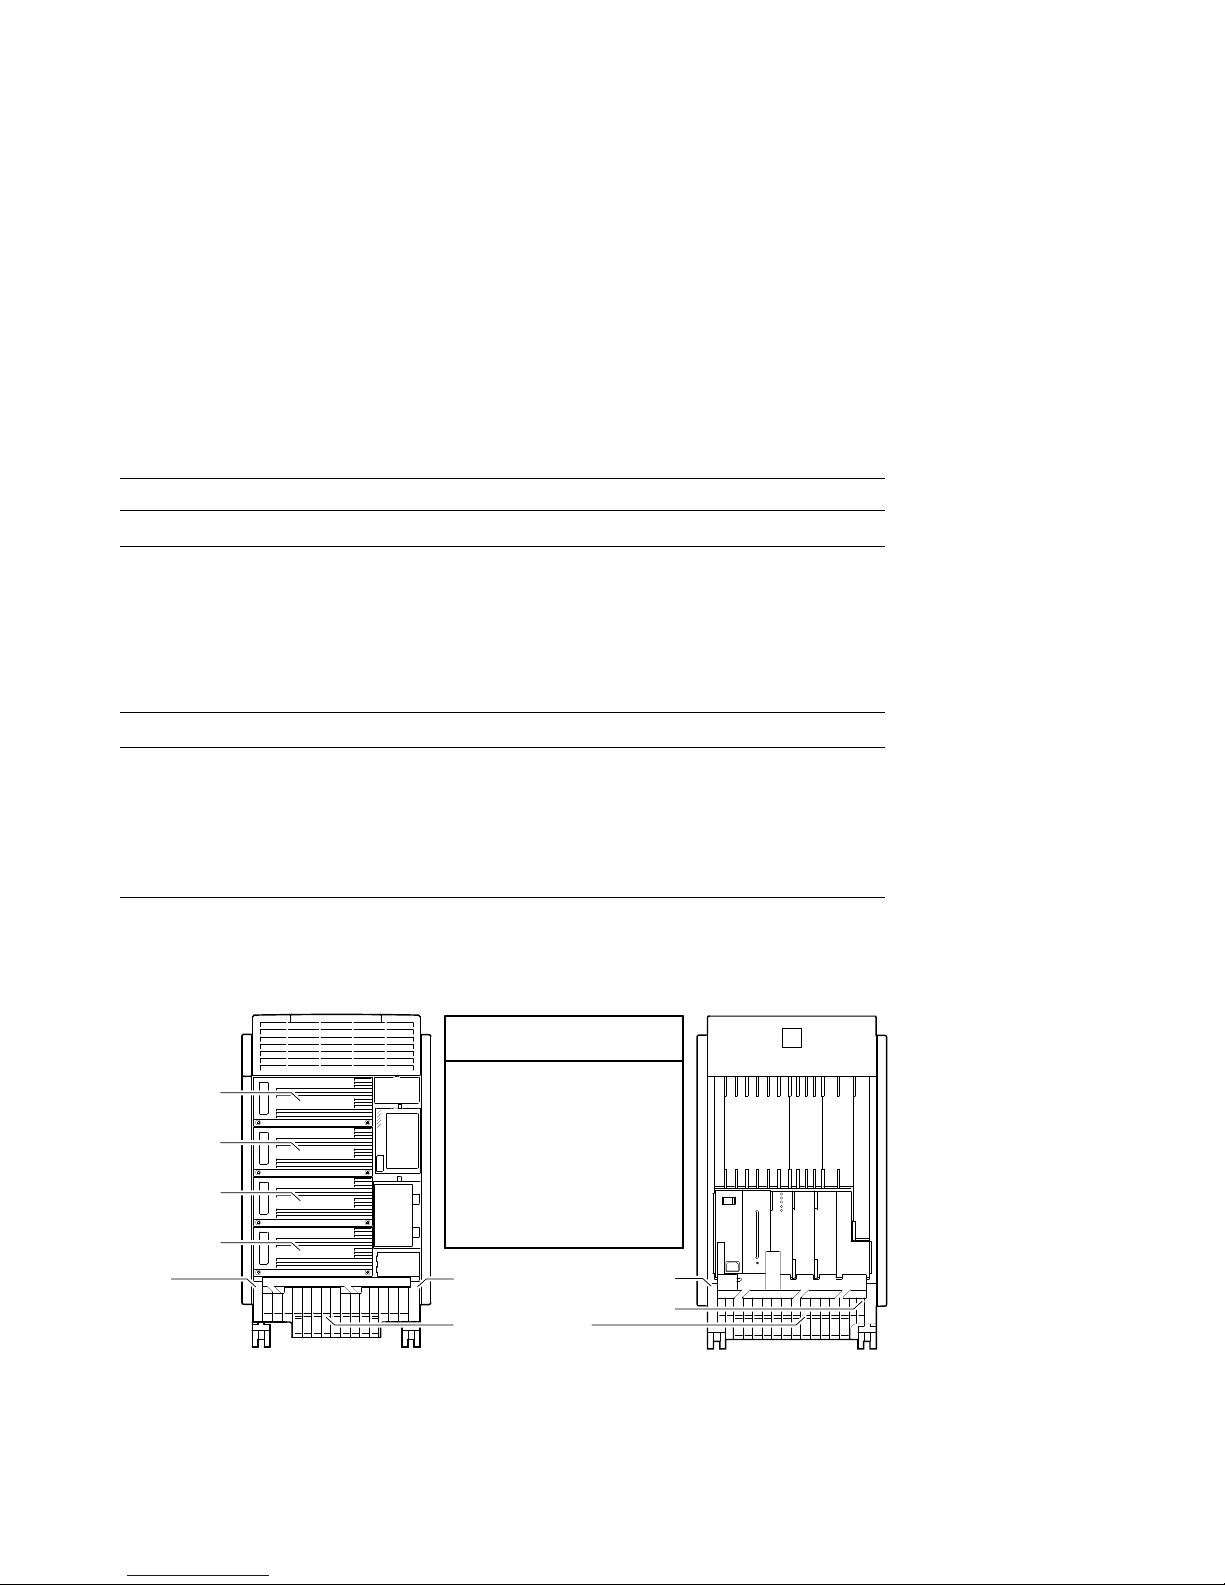
Table 2–1 (Cont.) Interpreting Power Supply LEDs
Indicator Meaning Action on Error
DC–DC Converter (DC3)
DC3 OK When lit, indicates that all the
DC3 output voltages are within
specified tolerances.
DC3 Failure When lit, indicates that one of
the output voltages is outside
Replace the DC3 converter
(Chapter 5).
specified tolerances.
DC–DC Converter (DC5)
DC5 OK When lit, indicates the DC5
output voltage is within specified
tolerances.
DC5 Failure When lit, indicates the DC5
output voltage is outside
Replace the DC5 converter
(Chapter 5).
specified tolerances.
Figure 2–2 LDC and Fan Unit Locations and Error Codes
Fan Error Codes
Local Disk
Converter A
Local Disk
Converter B
Local Disk
Converter C
Local Disk
Converter D
Fan 3 Fan 4 Fan 1
3
1 - Rear left
2 - Rear right
3 - Front left
4 - Front right
9 - A cable guide is not
properly secured or
two or more fans have
failed.
4
Fans are located
behind the cable guides
Fan 2
1
2
MLO-010872
2–6 Power-On Diagnostics and System LEDs
Page 31

2.1.2 Operator Control Panel LEDs
The OCP LEDs (Figure 2–3) are used to indicate the progress and result of
self-tests for Futurebus+, memory, CPU, and I/O modules. These LEDs are
the primary diagnostic tool for troubleshooting problems getting to the console
program.
Note
A failure in the CPU, memory module, or I/O module can cause both the
I/O and CPU LEDs or I/O and memory LEDs to indicate self-test failures
even if only one of the modules is failing. If two LEDs are lit, the I/O
module is the more likely source of the failure.
Figure 2–3 OCP LEDs
DC On/Off
Switch
DC Power
LED
Self-Test
Status LEDs
Reset Halt
6-1 3 2 1 0 0 1
MEM CPU I/O
LJ-02008-TI0
Power-On Diagnostics and System LEDs 2–7
Page 32

Refer to Table 2–2 for information on interpreting the OCP LEDs and
determining what actions to take when a failure is indicated.
Figure 2–4 shows the module locations as they correspond to the LEDs.
Table 2–2 Interpreting OCP LEDs
Indicator Meaning Action on Error
Futurebus+ 6–1 Remains lit if a Futurebus+
option has failed power-on
diagnostics.
MEM 3, 2, 1, 0 Remains lit if a memory module
has failed power-on diagnostics.
If no good memory is found, all
four memory LEDs may remain
lit even if there are less than
four memory modules present.
CPU 0, 1 Remains lit if a CPU module has
failed power-on diagnostics.
I/O Remains lit if the I/O module
has failed power-on diagnostics.
DC Power When lit indicates the proper
DC power is present. When
unlit, indicates no DC power is
present.
Examine LEDs on the Futurebus+
options to determine which option
to replace.
Replace the failed module
(Chapter 5).
Replace the failed module
(Chapter 5).
Replace the I/O module (Chapter 5).
If no DC power is indicated, set
the DC on/off switch to on (1) and
examine the power supply LEDs.
2–8 Power-On Diagnostics and System LEDs
Page 33

Figure 2–4 Module Locations Corresponding to OCP LEDs
F1
0
F2
F3
6
4321
5
3210
MEM
01
CPU
1
F4
I/O
LJ-02052-TI0
2.1.3 I/O Panel LEDs
The I/O panel LEDs (Figure 2–5) are used to indicate the status of ThinWire and
thickwire (standard) Ethernet fuses.
Refer to Table 2–3 for information on interpreting the LEDs and determining
what actions to take when a failure is indicated.
Power-On Diagnostics and System LEDs 2–9
Page 34

Figure 2–5 I/O Panel LEDs
F1
F2
F3
F4
ThinWire Ethernet Fuse OK
0
Thickwire Ethernet Fuse OK
ThinWire Ethernet Fuse OK
1
Thickwire Ethernet Fuse OK
LJ-02012-TI0
Table 2–3 Interpreting I/O Panel LEDs
Indicator Meaning Action on Error
ThinWire
Ethernet Fuse
OK
Thickwire
Ethernet Fuse
OK
When lit, indicates ThinWire
fuse is good; unlit indicates fuse
has blown.
When lit, indicates thickwire
fuse is good; unlit indicates fuse
has blown.
Replace fuse (refer to Chapter 5).
Replace fuse (refer to Chapter 5).
2–10 Power-On Diagnostics and System LEDs
Page 35

2.1.4 Futurebus+ Option LEDs
The Futurebus+ option LEDs (Figure 2–6) are used to indicate the progress and
result of self-tests for a specific Futurebus+ option.
Refer to Table 2–4 for information on interpreting the LEDs and determining
what actions to take when a failure is indicated.
Figure 2–6 Futurebus+ Option LEDs
Fault
Run
LJ-02010-TI0
Power-On Diagnostics and System LEDs 2–11
Page 36

Table 2–4 Interpreting Futurebus+ Option LEDs
Indicator Meaning Action on Error
Fault The Fault indicator lights during
self-tests. If it remains lit, the
module has failed self tests.
Run The Run indicator blinks during
self-tests and remains lit if the
module passes self-tests.
Replace module.
2.1.5 Storage Device LEDs
Storage device LEDs are used to indicate the status of the device. The LEDs for
fixed-media storage devices are shown in Figures 2–7 and Figure 2–8. Refer to
the DEC 4000 Model 600 Series Owner’s Guide for information on LEDs for the
removable-media devices.
Refer to Table 2–5 for information on interpreting the LEDs and determining
what actions to take when a failure is indicated.
2–12 Power-On Diagnostics and System LEDs
Page 37

Figure 2–7 Fixed-Media Mass Storage LEDs (SCSI)
Fast SCSI
3.5-Inch SCSI
5.25-Inch SCSI
Fault
Local Disk
Converter OK
Online
Fault
Local Disk
Converter OK
Online
SCSI
Terminator
Local Disk
Converter OK
SCSI
Terminator
LJ-02486-TI0
Power-On Diagnostics and System LEDs 2–13
Page 38

Figure 2–8 Fixed-Media Mass Storage LEDs (DSSI)
3.5-Inch DSSI
5.25-Inch DSSI
Fault
Local Disk
Converter OK
Online
DSSI Terminator
with LED
Fault
Write Protect
Local Disk
Converter OK
Run/Ready
DSSI Terminator
with LED
LJ-02483-TI0
Table 2–5 Interpreting Fixed-Media Mass Storage LEDs
Indicator Meaning Action on Error
Fault When lit, indicates an error
condition in the device. The
Fault indicator may light
temporarily during self-tests.
Online DSSI: When lit, indicates the
device is on line and available
for use. Under normal operation,
flashes as seek operations are
performed.
SCSI: Flashes as seek operations
are performed; indicates drive
activity.
2–14 Power-On Diagnostics and System LEDs
Run device RBD tests and internal
device tests to determine the
nature of the error, and replace
device.
(continued on next page)
Page 39

Table 2–5 (Cont.) Interpreting Fixed-Media Mass Storage LEDs
Indicator Meaning Action on Error
DSSI Terminator When lit, indicates DSSI
Local Disk
Converter OK
termination power is present.
When lit, indicates local disk
converter for the specified
storage compartment has power
(this LED is located on the
local disk power supply module
behind the front panel of the
storage compartment).
If the DSSI terminator LED does
not light, check the DSSI bus
connections for that bus. If bus
connections seem secure, the local
disk converter module or DC5
converter may need to be replaced
(Section 5.2):
• Local disk converters (located
in the fixed-media storage
compartments) supply
termination power for fixedmedia storage devices.
• The DC5 converter (part of
the power supply subsystem)
supplies termination power
for storageless fixed-media
compartments.
Confirm that the system power
supply is working properly (by
checking power supply LEDs).
Replace the local disk converter
module (Section 5.2).
2.2 Power-Up Screens
During power-up self-tests a screen similar to the one shown in Figure 2–9 is
displayed on the console terminal. The screen shows the status and result of the
self-tests.
Power-On Diagnostics and System LEDs 2–15
Page 40

Figure 2–9 Power-Up Self-Test Screen
VMS PAlcode Xn.nnX, OSF PAlcode Xn.nnX (CPU 1 of 1, DECchip 21064)
17:33:56 Tuesday, January 26, 1993
Digital Equipment Corporation
DEC 4000 AXP
\ Executing Power-Up Diagnostics
Memory Storage Net
CPU
APBPCPDPEP0P1P1 2 3 4 5 60P1 0 123
P
* Test in progress P Pass F Fail - Not Present
TM
Futurebus+
TM
? Sizing
LJ-02266-TI0
A power-on self-test failure indicated under Storage A–E may represent
a failure of an embedded storage adapter (A–E) or failure of a drive on
the specified bus. Check the console event log for additional information
(Section 2.2.1).
Power-on self-tests failures indicated for all six Futurebus+ slots indicate
a failure of the Futurebus+ bridge on the I/O module. Replace the I/O
module in the event that all six Futurebus+ slots show failures.
When the power-up diagnostics are completed, a second screen similar to the
one shown in Figure 2–10 is displayed. This screen provides configuration
information for the system.
2–16 Power-On Diagnostics and System LEDs
Note
Page 41

Figure 2–10 Sample Power-Up Configuration Screen
Console Vn.n-nnnn VMS PALcode Xn.nnX, OSF PALcode Xn.nnX
CPU 0
CPU 1
Memory 0
Memory 1
Memory 2
Memory 3
Ethernet 0
Ethernet 1
A SCSI
B DSSI
C DSSI
D DSSI
E SCSI
Futurebus+
B2001-AA DECchip 21064-2
P
-
-
-
B2002-DA 128 MB
P
Address 08-00-2B-2A-D6-97
P
Address 08-00-2B-2A-D6-A6
P
ID 1 ID 2 ID 3 ID 4 ID 5 ID 6 ID 7
ID 0
RZ73
P
RF73
P
P
P
P
P
TZ85
RRD42
FBA0
TM
-----
Host
Host
Host
Host
Host
Host
Host
System Status Pass
>>>
Type
b
to boot dka0.0.0.0.0
LJ-02267-TI0
2.2.1 Console Event Log
DEC 4000 AXP systems maintain a console event log consisting of status
messages received during power-on self-tests. If there are problems during
power-up, standard error messages may be embedded in the console event log. To
display a console event log, use the
Use the
set screen_mode off
log during power-up, rather than the two power-up screens.
The following example shows an abbreviated console event log that contains two
standard error messages: The first (a hard error) indicates a failure with storage
bus B. This failure could be caused by a bad LDC, improperly seated storage
drawer, or a disconnected power cable within the storage drawer. The second (a
soft error) indicates a SCSI continuity card is missing from the removable-media
storage compartment.
cat el
command.
command if you want to display the console event
Power-On Diagnostics and System LEDs 2–17
Page 42

>>>
cat el
Starting console.
halt code = 1
PC=0
initialized idle PCB
initializing semaphores
.
.
.
test Storage Bus B
ncr1, loopback connector attached OR
SCSI bus failure, could not acquire bus; Control Lines:ff Data lines:ff
ncr1 SCSI bus failure
*** Hard Error - Error #800 Diagnostic Name ID Device Pass Test Hard/Soft 7-OCT-1970
powerup 00000004 ncr1 0 0 1 0 10:48:58
Storage Bus B failure
*** End of Error ***
enable ncr2 ACK
test Storage Bus C
port p_c0.7.0.2.0 initialized, scripts are at 1d07e0
SCSI device found on pkc.0.0.2.0
loading SCSI driver for port p_c0.7.0.2.0
.
.
.
*** Soft Error - Error #1 - Lower SCSI Continuity Card Missing (connector J7)
Diagnostic Name ID Device Pass Test Hard/Soft 7-OCT-1992
io_test 00000067 scsi_low_con 1 1 0 1 11:25:53
*** End of Error ***
device mud9.5.0.3.0 (TF85) found on pud0.5.0.3.0
>>>
2.2.2 Mass Storage Problems Indicated at Power-Up
Mass storage failures at power-up are usually indicated in one of two ways:
• The power-up screens report a storage adapter port failure (indicated by an
‘‘F’’).
• One or more drives are missing from the configuration screen display (or too
many drives are displayed).
Figures 2–11 and 2–12 provide a flowchart for troubleshooting fixed-media mass
storage problems indicated at power-up. Use the flowchart to diagnose the likely
cause of the problem. Table 2–6 lists the symptoms and corrective action for each
of the possible problems.
2–18 Power-On Diagnostics and System LEDs
Page 43

Figure 2–11 Flowchart for Troubleshooting Fixed-Media Problems
Does the disk drive have power?
Check the Disk Power Failure LED on the PSC.
LED off LED on Likely LDC failure
Check the LDC OK LED on the storage compartment front panel.
LED on LED off
Continue
Has the disk drive failed?
Check the drive’s fault LED.
LED on (steady) Drive failure
LED off
LED flashing
Continue
Are bus node ID plugs improperly set?
Check that all drives on the bus have unique bus node ID numbers (no duplicates).
Duplicate bus node IDs Configuration rule violation
Check that no drive is set to bus node ID 7 (reserved for host ID).
Drive set to host ID 7
Continue
Is the storage drawer properly seated?
Power down, remove drawer and inspect connectors, reseat drawer and power up.
LDC failure
Drive is performing
extended calibration;
wait for tests to complete
Configuration rule violation
Problems persist
Continue
Problems solved Drawer not properly seated
LJ-02548-TI0A
Power-On Diagnostics and System LEDs 2–19
Page 44

Figure 2–12 Flowchart for Troubleshooting Fixed-Media Problems (Continued)
Are cables loose or missing?
Power down, remove drawer and check all cable connections, reseat drawer and power up.
Problems persist
Continue
Is the storage bus terminated?
Check that a terminator is in place.
Check that terminator power is present. For DSSI buses, check that the terminator LED is on.
For SCSI buses use a volt meter on the port connector (termination power is supplied by pin 38,
ground on pin 1).
Power present
Continue
Is the I/O module the source of the problem?
Swap the failing drive drawer to another compartment.
Likely problem with drive, drawer, or cables. Check again before continuing.
Is the backplane the source of the problem?
Eliminate all of the preceding problem sources before suspecting the backplane.
The backplane is the least likely to fail.
Disassemble the system as described in Section 5.4. Inspect the two
backplane interconnect cables.
Problems solved
Terminator missing Terminator missingTerminator present
No termination power LDC failure (with fixed-media devices)
Problems solvedProblems persist
Cable disconnected
-
-
DC5 failure (for storageless fixed-media
compartments)
I/O module failure
Cables are OK
Replace backplane assembly as described in Section 5.4.
Cable connections are Backplane interconnect cable failure
loose or damaged
2–20 Power-On Diagnostics and System LEDs
LJ-02548-TI0B
Page 45

Table 2–6 Fixed-Media Mass Storage Problems
Problem Symptom Corrective Action
LDC failure Disk power failure LED on PSC
Drive failure Fault LED for drive is on
Duplicate bus
node ID plugs
(or a missing
plug)
Bus node ID set
to 7 (reserved
for host ID)
Storage drawer
not properly
seated
is on.
LDC OK LED on storage
compartment front panel is
off.
Power-up screen reports a failing
storage adapter port.
(steady).
Drives with duplicate bus node
ID plugs are missing from the
configuration screen display.
A drive with no bus node ID plug
defaults to zero.
Valid drives are missing from
the configuration screen display.
One drive may appear seven
times on the configuration screen
display.
Disk power failure LED on PSC
is on.
LDC OK LED on storage
compartment front panel is
off.
Power-up screen reports a failing
storage adapter port.
Replace LDC.
Replace drive.
Correct bus node ID plugs.
Correct bus node ID plugs.
Remove drawer and check its
connectors. Reseat drawer.
(continued on next page)
Power-On Diagnostics and System LEDs 2–21
Page 46

Table 2–6 (Cont.) Fixed-Media Mass Storage Problems
Problem Symptom Corrective Action
Missing or loose
cables
Terminator
missing
No termination
power
I/O module
failure
Backplane
failure
Cable: storage device to ID
panel—Bus node ID defaults to
zero; online LEDs do not come
on.
Flex circuit: LDC to storage
interface module—Disk power
failure LED on PSC is on;
LDC OK LED on storage
compartment front panel is
off; and power-up screen reports
a failing storage adapter port.
Cable: LDC to storage interface
module—Power-up screen
reports a failing storage adapter
port; drive LEDs do not come on
at power-up.
Cable: LDC to storage device—
Drive does not show up in
configuration screen display.
Read/write errors in console
event log; storage adapter port
may fail
DSSI terminator LED is off, or
no termination voltage measured
at SCSI connector (pin 38,
ground pin 1); Read/write errors;
storage adapter port may fail.
The storage drawer exhibits no
problems when moved to another
compartment.
Replacing the I/O module does
not solve problem. The port
continues to fail and the problem
is not with the storage drawer.
Remove storage drawer and inspect
cable connections.
Attach terminator to connector
port.
Replace LDC (termination power
source for fixed-media storage
compartments).
Replace DC5 converter (termination power source for storageless
fixed-media storage compartments).
Replace I/O module.
Disassemble system and inspect
backplane interconnect cables. If
the cables and cable connections
do not appear to be the problem,
replace the backplane.
Figures 2–13 and 2–14 provide a flowchart for troubleshooting removable-media
storage problems indicated at power-up. Use the flowchart to diagnose the likely
cause of the problem. Table 2–7 lists the symptoms and corrective action for each
of the possible problems.
2–22 Power-On Diagnostics and System LEDs
Page 47

Figure 2–13 Flowchart for Troubleshooting Removable-Media Problems
Has the drive failed?
Check the drive’s fault LED.
LED off LED on (steady) Drive failure
Continue
Are bus node ID plugs improperly set?
Check that all drives on the bus have unique bus node ID numbers (no duplicates).
Duplicate bus node IDs Configuration rule violation
Check that no drive is set to bus node ID 7 (reserved for host ID).
Drive set to host ID 7
Continue
Is the SCSI continuity card missing?
Check the console event log for an error message indicating a SCSI continuity card
is missing. If the top and/or bottom storage compartments do not have half-height
drives, a SCSI continuity card is needed to continue the bus. Refer to Section 6.1.5.2
for more information.
Half-height drive or
SCSI continuity card
present
If console event log reports erroneously that the SCSI continuity card is missing,
replace the Vterm module. The Vterm module contains the logic for reporting
SCSI continuity card errors.
Continue
missing
Configuration rule violation
SCSI continuity card missingSCSI continuity card
LJ-02549-TI0A
Power-On Diagnostics and System LEDs 2–23
Page 48

Figure 2–14 Flowchart for Troubleshooting Removable-Media Problems
(Continued)
Are cables loose or missing?
Power down, remove drive and check all cable connections, replace drive and power up.
Problems persist
Continue
Is the storage bus terminated?
Check that a terminator is in place.
Check that terminator power is present. Use a voltmeter on the port connector
(termination power is supplied by pin 38, ground on pin 1).
Power present
Continue
Is the I/O module the source of the problem?
Replace the I/O module.
Likely problem with drive or cables. Check again before continuing.
Is the backplane the source of the problem?
Eliminate all of the preceding problem sources before suspecting the backplane.
The backplane is the least likely to fail.
Disassemble the system as described in Section 5.4. Inspect the two
backplane interconnect cables.
Problems solved
Terminator missing Terminator missingTerminator present
No termination power Vterm module failure
Problems solvedProblems persist
Cable disconnected
I/O module failure
Cables are OK
Replace backplane assembly as described in Section 5.4.
Cable connections are Backplane interconnect cable failure
loose or damaged
2–24 Power-On Diagnostics and System LEDs
LJ-02549-TI0B
Page 49

Table 2–7 Removable-Media Mass Storage Problems
Problem Symptom Corrective Action
Drive failure Fault LED for drive is on
Duplicate bus
node ID plugs
(or a missing
plug)
Bus node ID set
to 7 (reserved
for host ID)
SCSI continuity
card missing
Missing or loose
cables
Terminator
missing
Vterm module
failure
(steady).
Drives with duplicate bus node
ID plugs are missing from the
configuration screen display.
A drive with no bus node ID plug
defaults to zero.
Valid drives are missing from
the configuration screen display.
One drive may appear seven
times on the configuration screen
display.
Power-up screen reports a
failing storage adapter port;
console event log contains soft
error message reporting a SCSI
continuity card is missing; drives
on Bus E are not displayed on
configuration screen; possible
read/write errors.
Cable: storage device to ID
panel—Bus node ID defaults to
zero; online LED does not come
on.
Cable: Power—Drive does not
show up in configuration screen
display.
Read/write errors in console
event log; storage adapter port
may fail
No termination voltage
measured at Bus E SCSI
connector (pin 38, ground pin
1); Read/write errors; storage
adapter port may fail; or
console erroneously reports
SCSI continuity card as missing.
Replace drive.
Correct bus node ID plugs.
Correct bus node ID plugs.
Attach SCSI continuity card
(Section 6.1.5.2).
If console erroneously reports
SCSI continuity card as missing,
replace the Vterm module. The
Vterm module contains the logic
for reporting SCSI continuity card
errors.
Remove device and inspect cable
connections.
Attach terminator to connector
port.
Replace Vterm module (termination power source for removablemedia storage compartment).
(continued on next page)
Power-On Diagnostics and System LEDs 2–25
Page 50

Table 2–7 (Cont.) Removable-Media Mass Storage Problems
Problem Symptom Corrective Action
I/O module
failure
Backplane
failure
Problems persist after
eliminating the above problem
sources.
Replacing the I/O module does
not solve problem—the port
continues to fail and the problem
is not with the device or cables.
Replace I/O module.
Disassemble system and inspect
backplane interconnect cables. If
the cables and cable connections
do not appear to be the problem,
replace the backplane.
2.2.3 Robust Mode Power-Up
Robust mode allows you to power up without initiating drivers or running
power-up diagnostics.
Robust mode permits you to get to the console program when one of the following
is the cause of a problem getting to the console program under normal power-up:
• An error in the nonvolatile nvram file
• An incorrect environment variable setting
• A driver error
Note
The console program has limited functionality in robust mode.
Once in console mode, you can:
• Edit the nvram file (using the
• Assign a correct value to an environment variable (using the
commands)
• Start individual classes or sets of drivers, called phases (using the
-driver #
command. The pound sign (#) is the phase number 2, 3, 4, or 5,
and each phase is started individually in increasing order.
2–26 Power-On Diagnostics and System LEDs
edit
command)
show
and
init
set
Page 51

Note
The nonvolatile file, nvram, is shipped from the factory with no contents.
The customer can use the
command file that is executed as the last step of every power-up.
To set the system to robust mode, set the baud rate select switch located behind
the OCP to 0, as shown in Section 6.5. The robust mode setting uses a 9600
console baud rate.
edit
command to create a customized script or
2.3 Power-Up Sequence
During the DEC 4000 AXP power-up sequence, the power supplies are stabilized
and tested and the system is initialized and tested via the firmware power-on
self-tests.
The power-up sequence includes the following:
• Power supply power-up:
– Includes AC power-up and power supply self-test.
– Includes DC power-up and power supply self-tests.
• Two sets of power-on diagnostics:
– Serial ROM diagnostics
– Console firmware-based diagnostics
2.3.1 AC Power-Up Sequence
With no AC power applied, no energy is supplied to the entire enclosure. AC
power is applied to the system with the AC circuit breaker on the front end unit
(FEU) of the power supply (see Figure 2–1) . With just AC power applied, the AC
present LED is the only LED illuminated on the power supply.
Figure 2–15 provides a description of the AC power-up sequence.
Failures during AC power-up are indicated by the power supply subsystem LEDs.
Additional error information is displayed on the PSC Fault ID display. Refer to
Appendix B for PSC fault display information.
Power-On Diagnostics and System LEDs 2–27
Page 52

Figure 2–15 AC Power-Up Sequence
AC plug is inserted into wall outlet
AC circuit breaker is set to on (1)
AC power (country-specific voltage) enters FEU module
FEU creates two +48V outputs:
+48 VDC enters PSC, energizes microprocessor power system
PSC module verifies microprocessor power
OK FAILED Micro power system output not valid
PSC microprocessor performs internal self-test and PSC interface test
OK FAILED
PSC microprocessor self-test passed, PSC OK LED is turned on
PSC verifies +48 VDC BUS_DIRECT output is okay, turns on FEU OK LED
PSC verifies input voltage conditions: AC_POWER, FEU_HVDC, DIRECT_48V
All three are okay
-
AC power
-
FEU high voltage (HVDC)
-
+48V BUS_DIRECT
1.BUS_DIRECT +48 VDC output (always on) immediately
goes to +48 DC inputs on DC5, DC3 and PSC modules
2.BUS_SWITCHED (+V-V) +48 VDC output (off) goes to
+48 VDC input on LDCs and Futurebus+ modules
-
-
FEU failure LED is turned on
-
PSC microprocessor latches into shutdown
-
PSC microprocessor failed self-test
-
PSC failure LED is turned on
-
PSC microprocessor latches into shutdown
If BUS_DIRECT and AC power are not okay,
the system is in AC low line condition
-
PSC waits for either output to become okay
-
NO FEU LEDs are turned on
PSC waits for power-up command
PSC loops in routine checking status
WAIT
2–28 Power-On Diagnostics and System LEDs
If +48 VDC BUS_DIRECT is not asserted,
but AC power is okay, FEU has failed
-
FEU failure LED comes on
-
PSC latches in shutdown
LJ-02484-TI0
Page 53

2.3.2 DC Power-Up Sequence
DC power is applied to the system with the DC on/off switch on the operator
control panel.
Figures 2–16 and 2–17 provide a description of the DC power-up sequence.
Failures during DC power-up are indicated by the power supply subsystem LEDs.
Additional error information is displayed on the PSC Fault ID display. Refer to
Appendix B for PSC fault display information.
Power-On Diagnostics and System LEDs 2–29
Page 54

Figure 2–16 DC Power-Up Sequence
DC on/off switch set to on (1)
PSC starts DC power-up sequence and status check
PSC checks temperature sensor
OK FAILED
PSC checks overtemperature status (onboard)
OK FAILED
PSC commands FEU to start fans by asserting FAN_POWER_ENABLE H.
All fans are started at maximum speed, rotation speed is verified.
OK FAILED
PSC negates ASYNC_RESET signal to system CPU
PSC commands FEU to turn on +48 VDC BUS_SWITCHED output
PSC waits 100 ms for FEU to assert BUS_SWTCHD_OK signal
OK FAILED
FEU +48 VDC switched output (+V-V) goes to local disk
converters (LDCs) and Futurebus+ slots
PSC commands DC3 to turn on +3.3 VDC output
PSC waits 50 ms for +3.3 VDC to reach regulation
-
Failed PSC fault LED is turned on
-
Fans operate at full speed
-
Fans kept running while orderly shutdown is initiated
-
Fan Failure LED is turned on
-
Fans turned off after 30-sec. delay
-
One or more fans fail to start
-
Fans kept running while orderly shutdown is initiated
-
Overtemperature shutdown LED is turned on
and fan number is displayed
and fan number is displayed
-
Fans turned off after 30-sec. delay
-
BUS_SWTCHD_OK did not assert within 100 ms
-
Fans are turned off
-
FEU OK LED is turned off
-
FEU failure LED is turned on
-
PSC latches in shutdown mode
OK FAILED
PSC commands DC5 to turn on +5.1 VDC output
Go to next page
2–30 Power-On Diagnostics and System LEDs
-
Output did not reach regulation in time
-
Fans and active DC outputs are turned off
-
Failure LED on DC3 module is turned on
-
PSC latches in shutdown mode
LJ-02485-TI0A
Page 55

Figure 2–17 DC Power-Up Sequence (Continued)
PSC waits 30 ms for +5.1 VDC to reach regulation
-
-
OK FAILED
DC5 OK LED is turned on
PSC commands DC3 to turn on +2.1 VDC output
PSC waits 20 ms for +2.1 VDC to reach regulation
OK FAILED
PSC commands DC3 to turn on +12 VDC output
PSC waits 100 ms for +12 VDC to reach regulation
-
Output did not reach regulation in time
-
Fans and active DC outputs are turned off
-
Failure LED on DC5 module is turned on
-
PSC latches in shutdown mode
-
-
Output did not reach regulation in time
-
Fans and active DC outputs are turned off
-
Failure LED on DC3 module is turned on
-
PSC latches in shutdown mode
OK FAILED
DC3 OK LED is turned on
All DC outputs except LDCs are energized
PSC checks status of entire power system and delays for 45 ms
PSC negates ASYNC_REST_L and asserts POK_H; begins powering LDCs
Each LDC has an enable bit that, when asserted, starts a timer.
The LDC has 50 ms to respond with its LDC_OK signal asserted.
OK FAILED
LDC_OK is received within 50 ms, a 5-sec. timeout is initiated for disk spin-up time.
System power-up is complete
PSC microprocessor begins ongoing status monitoring
-
Output did not reach regulation in time
-
Fans and active DC outputs are turned off
-
Failure LED on DC3 module is turned on
-
PSC latches in shutdown mode
-OK FAILED
One of the above outputs has failed;
failure mode indicated as described
above for the appropriate output.
-
-
LDC did not respond in time allowed
-
Disk power failure LED is turned on
-
Corresponding letter (A, B, C, or D) is
displayed on fault ID display
-
The next LDC is tested
LJ-02485-TI0B
Power-On Diagnostics and System LEDs 2–31
Page 56

2.3.3 Firmware Power-Up Diagnostics
After successful completion of AC and DC power-up sequences, the processor
performs its power-up diagnostics. These tests verify system operation, load the
system console, and test the kernel system, including all boot path devices. These
tests are performed as two distinct sets of diagnostics:
1. Serial ROM diagnostics—These tests are loaded from the serial ROM located
on the CPU module into the CPU’s instruction cache (I-cache). They check the
basic functionality of the system and load the console code from the FEPROM
on the I/O module into system memory.
Failures during these tests are indicated by LEDs on the operator control
panel.
2. Console firmware-based diagnostics—These tests are executed by the console
code. They test the kernel system, including all boot path devices.
Failures during these tests are reported to the console terminal (via the
power-up screen or console event log).
2.3.3.1 Serial ROM Diagnostics
The serial ROM diagnostics are loaded into the CPU’s I-cache from the serial
ROM on the CPU module. They test the system in the following order:
1. Test the CPU and backup cache located on the CPU module.
2. Test the CPU module’s system bus interface.
3. Check the access to the I/O module.
4. Locate the largest memory module in the system and test the first 4 MB of
memory on the module. Only the first 4 MB of memory are tested. If there is
more than one memory module of the same size, the one closest to the CPU is
tested first.
If the memory test fails, the next largest memory module in the system
is tested. Testing continues until a good memory module is found. If a
good memory module is not found, the corresponding LEDs on the OCP are
illuminated and the power-up diagnostics are terminated.
5. After finding the first memory module with a good first 4 MB of memory,
the console program is loaded into memory from the FEPROM on the I/O
module. At this time control is passed to the console code and the console
firmware-based diagnostics are run.
2–32 Power-On Diagnostics and System LEDs
Page 57

2.3.3.2 Console Firmware-Based Diagnostics
Console firmware-based tests are executed once control is passed to the console
code in memory. They check the system in the following order:
1. Perform a complete check of system memory. If a system has more than one
memory module, the modules are checked in parallel.
2. Set memory interleave to maximize interleave factor across as many memory
modules as possible (one, two, or four-way interleaving). During this time the
console firmware is moved into backup cache on the primary CPU module.
After memory interleave is set, the console firmware is moved back into
memory.
Steps 3–7 may be completed in parallel.
3. Start the I/O drivers for mass storage devices and tapes. At this time a
complete functional check of the machine is made. After the I/O drivers
are started, the console program continuously polls the bus for devices
(approximately every 20 or 30 seconds).
4. Size, configure, and test the Futurebus+ options.
5. Exercise memory.
6. Check that the SCSI continuity card or a storage device is installed in the
removable-media storage bus (Bus E, connectors J6 and J7).
7. Run exercisers on the disk drives currently seen by the system.
This step does not currently ensure that all disks in the system will be
tested or that any device drivers will be completely tested. To ensure
complete testing of disk devices, use the
8. Enter console mode or boot the operating system. This action is determined
by the auto_action environment variable.
2.4 Boot Sequence
Bootstrapping is the process of loading a program image into memory and
transferring control to the loaded program. The system firmware uses the
bootstrap procedure defined by the Alpha AXP architecture and described in the
Alpha System Reference Manual. On a DEC 4000 AXP system, bootstrap can be
attempted only by the primary processor or boot processor. The firmware uses
Note
test
command.
Power-On Diagnostics and System LEDs 2–33
Page 58

device and optional filename information specified either on the command line or
in appropriate environment variables.
There are only three conditions under which the boot processor attempts to
bootstrap the operating system:
1. The
2. The system is reset or powered up and AUTO_ACTION is set to boot (and the
3. An operating system restart is attempted and fails.
The firmware’s function in a bootstrap is to load a program into memory and
begin its execution. This program may be a primary bootstrap program, such as
Alpha Primary Boot (APB), Ultrixboot, or any other applicable program specified
by the user or residing in the boot block, MOP server, or TCP/IP server.
boot
command is typed on the console terminal.
halt switch is not set to halt).
2.4.1 Cold Bootstrapping in a Uniprocessor Environment
This section describes a cold bootstrap in a uniprocessor environment. A system
bootstrap will be a cold bootstrap when any of the follow occur:
• Power is first applied to the system
• A console
variable is set to ‘‘Boot.’’
• The boot_reset environment variable is set to ‘‘On.’’
• A cold bootstrap is requested by system software.
The console must perform the following steps in the cold bootstrap sequence:
1. Perform a system initialization
2. Size memory
initialize
command is issued and the auto_action environment
3. Test sufficient memory for bootstrapping
4. Load PALcode
5. Build a valid Hardware Restart Parameter Block (HWRPB)
6. Build a valid Memory Data Descriptor Table in the HWRPB
7. Initialize bootstrap page tables and map initial regions
8. Locate and load the system software primary bootstrap image
9. Initialize processor state on all processors
10. Transfer control to the system software primary bootstrap image
2–34 Power-On Diagnostics and System LEDs
Page 59

The steps leading to the transfer of control to system software may be performed
in any order. The final state seen by system software is defined, but the
implementation-specific sequence of these steps is not. Prior to beginning a
bootstrap, the console must clear any internally pended restarts to any processor.
2.4.2 Loading of System Software
The console uses the boot_dev environment variable to determine the bootstrap
device and the path to that device. These environment variables contain lists of
bootstrap devices and paths; each list element specifies the complete path to a
given bootstrap device. If multiple elements are specified, the console attempts to
load a bootstrap image from each in turn.
The console uses the bootdef_dev, boot_dev, and booted_dev environment variables
as follows:
1. At console initialization, the console sets the bootdef_dev and boot_dev
environment variables to be equivalent. The format of these environment
variables is determined by the console implementation and is independent of
the console presentation layer; the value may be interpreted and modified by
system software.
2. When a bootstrap results from a
device list, the console uses the list specified with the command. The console
modifies boot_dev to contain the specified device list. Note that this may
require conversion from the presentation layer format to the registered
format.
3. When a bootstrap is the result of a
bootstrap device list, the console uses the bootstrap device list contained
in the bootdef_dev environment variable. The console copies the value of
bootdef_dev to boot_dev.
4. When a bootstrap is not the result of a
bootstrap device list contained in the boot_dev environment variable. The
console does not modify the contents of boot_dev.
5. The console attempts to load a bootstrap image from each element of the
bootstrap device list. If the list is exhausted prior to successfully transferring
control to system software, the bootstrap attempt fails and the subsequent
console action is determined by auto_action.
6. The console indicates the actual bootstrap path and device used in the
booted_dev environment variable. The console sets booted_dev after loading
the primary bootstrap image and prior to transferring control to system
software. The booted_dev format follows that of a boot_dev list element.
boot
command that specifies a bootstrap
boot
command that does not specify a
boot
command, the console uses the
Power-On Diagnostics and System LEDs 2–35
Page 60

7. If the bootstrap device list is empty, bootdef_dev or boot_dev are null, and
the action is implementation-specific. The console may remain in console I/O
mode or attempt to locate a bootstrap device in an implementation-specific
manner.
The boot_file and boot_osflags environment variables are used as default values
for the bootstrap filename and option flags. The console indicates the actual
bootstrap image filename (if any) and option flags for the current bootstrap
attempt in the booted_file and booted_osflags and environment variables. The
boot_file default bootstrap image filename is used whenever the bootstrap
requires a filename and either none was specified on the
bootstrap was initiated by the console as the result of a major state transition.
The console never interprets the bootstrap option flags, but simply passes them
between the console presentation layer and system software.
boot
command or the
2.4.3 Warm Bootstrapping in a Uniprocessor Environment
The actions of the console on a warm bootstrap are a subset of those for a cold
bootstrap. A system bootstrap will be a warm bootstrap whenever the boot_
reset environment variable is set to ‘‘Off’’ (46 4E4F16) and console internal state
permits.
The console program performs the following steps in the warm bootstrap
sequence.
1. Locates and validates the Hardware Reset Parameter Block (HWRPB)
2. Locates and loads the system software primary bootstrap image
3. Initializes processor state on all processors
4. Initializes bootstrap page tables and maps initial regions
5. Transfers control to the system software primary bootstrap image
At warm bootstrap, the console does not load PALcode, does not modify the
Memory Data Descriptor Table, and does not reinitialize any environment
variables. If the console cannot locate and validate the previously initialized
HWRPB, the console must initiate a cold bootstrap. Prior to beginning a
bootstrap, the console must clear any internally pended restarts to any processor.
2–36 Power-On Diagnostics and System LEDs
Page 61

2.4.4 Multiprocessor Bootstrapping
Multiprocessor bootstrapping differs from uniprocessor bootstrapping primarily
in synchronization between processors. In a shared memory system, processors
cannot independently load and start system software; bootstrapping is controlled
by the primary processor.
DEC 4000 AXP systems always select CPU0 as the primary processor. The
secondary processor polls a mailbox for a start address.
2.4.5 Boot Devices
The supported boot devices shown in Table 2–8 are determined by the console’s
device drivers.
Table 2–8 Supported Boot Devices
Adapter Bus Device Name
I/O module Ethernet TGEC EZAn
I/O module DSSI/SCSI Disk DUan/DKan
I/O module DSSI/SCSI Tape MUan/MKan
Power-On Diagnostics and System LEDs 2–37
Page 62

Page 63

3
Running System Diagnostics
This chapter provides information on how to run system diagnostics.
• Section 3.1 describes how to run ROM-based diagnostics, including error
reporting utilities, and loopback tests.
• Section 3.2 describes how to run DSSI internal device tests.
• Section 3.3 describes the DEC VET verifier and exerciser software.
• Section 3.4 describes how to run UETP environmental test package software.
• Section 3.5 describes acceptence testing and initialization procedures.
3.1 Running ROM-Based Diagnostics
DEC 4000 AXP ROM-based diagnostics (RBDs), which are part of the console
firmware that is loaded from the FEPROM on the I/O module, offer many
powerful diagnostic utilities, including the ability to examine error logs from the
console environment and run system- or device-specific exercisers.
Unlike previous systems, DEC 4000 AXP RBDs rely on exerciser modules,
rather than functional tests to isolate errors. The exercisers are designed to run
concurrently, providing a maximum bus interaction between the console drivers
and the target devices.
The multitasking ability of the console firmware allows you to run diagnostics in
the background (using the background operator ‘‘&’’ at the end of the command).
You run RBDs by using console commands.
RBDs can be separated into four types of utilities:
1. System or device diagnostic test/exercisers using the
(Section 3.1.1).
The
test
command is the primary diagnostic for acceptance testing and
console environment diagnosis.
test
command
Running System Diagnostics 3–1
Page 64

2. Three related commands are used to list system bus FRUs, report the status
of RBDs in progress, and report errors:
• The
• The
• The
3. Several commands allow you to perform extended testing and exercising of
specific system components. These commands are used for troubleshooting
and are not needed for routine acceptance testing:
• The
• The
• The
• The
• The
show fru
part numbers, hardware and software revision numbers, and summary
error information.
show_status
status of RBD test/exercisers currently in progress.
show error
test-directed diagnostics (TDD), via the RBDs, and by symptom-directed
diagnostics (SDD), via the operating system.
memexer
specified number of memory tests. The tests are run in the background.
memexer_mp
multiprocessor system by running a specified number of memory exerciser
sets. The tests are run in the background.
exer_read
random reads on the device.
exer_write
random writes to the specified device.
fbus_diag
command (Section 3.1.2) reports system bus FRUs, module
command (Section 3.1.3) reports the error count and
command (Section 3.1.4) reports errors captured by
command (Section 3.1.5) exercises memory by running a
command (Section 3.1.6) tests memory in a
command (Section 3.1.7) tests a disk by performing
command (Section 3.1.8) tests a disk by performing
command (Section 3.1.9) tests the Futurebus+ modules.
• The
• The
4. Loopback tests for testing console and Ethernet ports (Section 3.1.12)
In addition to the four utilities listed above, there are two diagnostic-related
commands. The
terminate diagnostics.
3–2 Running System Diagnostics
show_mop_counters
MOP counters.
clear_mop_counters
MOP counters.
kill
and
kill_diags
command (Section 3.1.10) is used to read the
command (Section 3.1.11) is used to reset the
commands (Section 3.1.13) are used to
Page 65

3.1.1 test
The
test
command runs firmware diagnostics for the entire system, specified
subsystems, or specific devices. These firmware diagnostics are run in the
background. When the tests are successfully completed, the message ‘‘tests done’’
is displayed. If any of the tests fail, a failure message is displayed.
If you do not specify an argument with the
test
command, all tests except those
for tape drives are performed.
Note
By default, no write tests are performed on disk; and read and write tests
are performed for tape drives. You need a scratch tape to test tape drives.
Early systems may not support RBD testing for tape drives.
All tests run concurrently for a minimum of 30 seconds. Tests complete when all
component tests have completed at least one pass. Test passes are repeated for
any component that completes its test before other components.
The run time of a test is proportional to the amount of memory to be tested
and the number of disk and tape drives to be tested. Running
test all
on a
system with fully configured 512-MB memory takes approximately 10 minutes to
complete.
Synopsis:
test ([all] [cpu] [disk] [tape] [dssi] [scsi] [fbus] [memory] [ethernet] [device_list])
Arguments:
[all] Firmware diagnostics will test/exercise all the devices present in
[cpu] Firmware diagnostics will test backup cache and memory coherency.
[disk] Firmware diagnostics will perform read-only tests of all disk drives
[tape] Firmware diagnostics will perform read and write tests of all the tape
[dssi] Firmware diagnostics will test the DSSI subsystem, including read-only
the system configuration: CPU, disk, tape, DSSI subsystem, SCSI
subsystem, Futurebus+ subsystem, memory, Ethernet, and I/O devices.
present in the system. One pass consists of seeking to a random block
on the disk and reading a packet of 2048 bytes and repeating until 512
packets are read.
devices present in the system. Testing the tape drives requires that a
scratch tape be loaded in the tape drive.
tests of all DSSI disks, and read-write tests for tape drives.
Running System Diagnostics 3–3
Page 66

[scsi] Firmware diagnostics will test the SCSI subsystem, including read-only
[fbus] Firmware diagnostics will instruct all Futurebus+ modules to perform
[memory] Firmware diagnostics will test memory modules present in the system.
[ethernet] Firmware diagnostics will test the Ethernet logic.
[device_list] Use the device_list argument to specify disk, tape, or Futurebus+ devices
tests of all SCSI disks and read-write tests for SCSI tape drives.
extended category default self-tests.
to be tested. As with all the RBDs, uses the exer script to perform readonly tests on the specified disk devices, and read-write tests for tape
drives. Legal devices are disk, tape, and Futurebus+ device names.
Examples:
>>> test
tests done
>>>
>>> test
*** Soft Error - Error #1 - Lower SCSI Continuity Card Missing
Diagnostic Name ID Device Pass Test Hard/Soft
31-JUL-1992
io_test 0000032d scsi_low_con 1 1 0 1
14:23:18
*** End of Error ***
>>>
3–4 Running System Diagnostics
Page 67

3.1.2 show fru
The
show fru
FRUs based on the serial control bus EEPROM data:
• CPU modules
• Memory modules
• I/O modules
• Futurebus+ modules
For each of the above FRUs, the slot position, option, part, revision, and serial
numbers, as well as any reported symptom-directed diagnostics (SDD) and
test-directed diagnostics (TDD) event logs are displayed.
Synopsis:
show fru ([target [target . . . ]])
Arguments:
[target] CPU{0,1}, mem{0,1,2,3}, io, fbus, and fban.
Examples:
>>>
show fru
!" # $ % &
Slot Option Part# Hw Sw Serial# SDD TDD
1 IO B2101-AA D3 2 AY21739158 00 00
2
3 CPU0 B2001-AA D1 0 AY21328712 00 00
4
5
6
7 MEM3 B2002-BA B1 0 GA21700025 00 00
Futurebus+ Nodes
Slot Option Part# Hw Fw Serial# Description
1
2
3 fbc0 B2102-AA B02 X1.53 ML22000053 Fbus+ Profile_B Exerciser
4
5
6
>>>
command reports FRU and error information for the following
Rev Events Logged
'
Rev
(
!
Slot number for FRU (slots 1–7 right to left)
Slot 1: I/O module
Slot 2, 3: CPU modules
Slot 4–7: Memory modules
Running System Diagnostics 3–5
Page 68

"
Option name (I/O, CPU#, or MEM#)
#
Part number of option
$
Revision numbers (hardware and firmware)
%
Serial number
&
Events logged:
SDD: Number of symptom-directed diagnostic events logged by the
operating system, or in the case of memory, by the operating system and
firmware diagnostics.
TDD: Number of test-directed diagnostic events logged by the firmware
diagnostics.
'
Futurebus+ option name, fban, where:
fb indicates Futurebus+ option
a indicates corresponding Futurebus+ slot a–f (1–6)
n indicates the Futurebus+ node number, 0 or 1
(
Description of Futurebus+ module
3–6 Running System Diagnostics
Page 69

3.1.3 show_status
The
show_status
diagnostic. The information includes ID, diagnostic program, device under
test, error counts, passes completed, bytes written and read.
Many of the diagnostics run in the background and provide information only
if an error occurs. Use the
diagnostics.
The following command string is useful for periodically displaying diagnostic
status information for diagnostics running in the background:
>>> while true;show_status;sleep n;done
command reports one line of information per executing
show_status
command to display the progress of
Where n is the number of seconds between
show_status
displays.
Synopsis:
show_status
Examples:
>>>
show_status
!" #$% & '
ID Program Device Pass Hard/Soft Bytes Written Bytes Read
-------- ------------ ------------ ------ --------- ------------- ------------00000001 idle system 0 0 0 0 0
000000ea memtest memory 2 0 0 67108864 67108864
000000f1 exer_kid dub0.0.0.1.0 1 0 0 0 0
000000f2 exer_kid duc0.6.0.2.0 1 0 0 0 0
000000f3 exer_kid dud0.7.0.3.0 1 0 0 0 0
000000f4 exer_kid dka0.0.0.0.0 1 0 0 0 0
>>>
!
Process ID
"
Program module name
#
Device under test
$
Diagnostic pass count
%
Error count (hard and soft): Soft errors are not usually fatal; hard errors halt
the system or prevent completion of the diagnostics.
&
Bytes successfully written by diagnostic
'
Bytes successfully read by diagnostic
Running System Diagnostics 3–7
Page 70

3.1.4 show error
The
show error
bus EEPROM data. Both the operating system and the ROM-based diagnostics
log errors to the serial control bus EEPROMs. This functionality provides the
ability to generate an error log from the console environment.
command reports error information based on the serial control
A closely related command,
show fru
(Section 3.1.2), reports FRU and error
information for FRUs.
Synopsis:
show error ([target [target . . . ]])
Arguments:
[target] CPU{0,1}, mem{0,1,2,3}, and io.
Examples:
>>> show error mem3
Test Directed Errors
No Entries Found
Symptom Directed Entries
MEM3 Module EEROM Event Log
!"# $ % &
Entry Offest RAM # Bit Mask Multi-Chip Event Type
0 383 9 0001 0 10
1 402 10 0001 1 10
2 402 11 0001 1 10
3 402 2 0001 1 10
4 402 3 0001 1 10
5 404 0 0001 1 10
6 404 1 0001 1 10
7 408 12 0001 0 10
Entry Error Mask Device # Event Type
15 f01 71 0
>>>
!
Event log entry number
"
Offset address of fault in RAM
#
RAM number—indicates the RAM location on the board
$
Four-bit bit field value, indicates bit in DRAM
Using the offset, RAM number, and bitmask, you can determine the location
of the specific cell in memory.
3–8 Running System Diagnostics
Page 71

%
Multi-chip (0=no, 1=yes)—indicates that a group of entries are the result of a
single error.
&
Event type:
11—DRAM hard-failure
01—Correctable read data (CRD) error
10—Uncorrectable error
00—Other (non-DRAM error)
Running System Diagnostics 3–9
Page 72

3.1.5 memexer
The
memexer
exercisers. The exercisers are run in the background and nothing is displayed
unless an error occurs. Each exerciser tests all available memory in 2-MB blocks
for each pass.
command tests memory by running a specified number of memory
To terminate the memory tests, use the
diagnostic or the
show_status
kill_diags
command to terminate all diagnostics. Use the
display to determine the process ID when killing an individual
kill
command to terminate an individual
diagnostic test.
Synopsis:
memexer [number]
Arguments:
[number] Number of memory exercisers to start. The default is 1.
The number of exercisers, as well as the length of time for testing,
depends on the context of the testing. Generally, running 3–5 exercisers
for 15 minutes to 1 hour is sufficient for troubleshooting most memory
problems.
Examples:
>>>
memexer 4
>>>
show_status
ID Program Device Pass Hard/Soft Bytes Written Bytes Read
-------- ------------ ------------ ------ --------- ------------- ------------00000001 idle system 0 0 0 0 0
000000c7 memtest memory 3 0 0 635651584 62565154
000000cc memtest memory 2 0 0 635651584 62565154
000000d0 memtest memory 2 0 0 635651584 62565154
000000d1 memtest memory 3 0 0 635651584 62565154
kill_diags
>>>
>>>
3–10 Running System Diagnostics
Page 73

3.1.6 memexer_mp
The
memexer_mp
system by running a specified number of memory exerciser sets. A set is a
memory test that runs on each processor checking alternate longwords. The
exercisers are run in the background and nothing is displayed unless an error
occurs.
command tests memory cache coherency in a multiprocessor
To terminate the memory tests, use the
diagnostic or the
show_status
kill_diags
command to terminate all diagnostics. Use the
display to determine the process ID when killing an individual
kill
command to terminate an individual
diagnostic test.
Synopsis:
memexer_mp [number]
Arguments:
[number] Number of memory exerciser sets to start. The default is 1.
The number of exercisers, as well as the length of time for testing,
depends on the context of the testing. Generally, running 2 or 3
exercisers for 5 minutes is sufficient.
Examples:
>>>
memexer_mp 2
>>>
kill_diags
>>>
Running System Diagnostics 3–11
Page 74

3.1.7 exer_read
The
exer_read
on one or more devices. The exercisers are run in the background and nothing is
displayed unless an error occurs.
The tests continue until one of the following conditions occurs:
1. All blocks on the device have been read for a passcount of d_passes (default is
1).
command tests a disk by performing random reads of 2048 bytes
2. The exer_read process has been terminated via the
killorkill_diags
commands, or Ctrl/C.
3. The specified time has elapsed.
To terminate the read tests, enter Ctrl/C, or use the
an individual diagnostic or the
Use the
show_status
display to determine the process ID when killing an
kill_diags
command to terminate all diagnostics.
kill
command to terminate
individual diagnostic test.
Synopsis:
exer_read [-sec seconds] [device_name device_name . . . ]
Arguments:
[device_name] One or more device names to be tested. The default is du*.* dk*.* to test
all DSSI and SCSI disks that are on line.
Options:
[-sec seconds] Number of seconds to run exercisers. If you do not enter the number
of seconds, the tests will run until d_passes have completed (d_passes
default is 1).
If you want to test the entire disk, run at least one pass across the
disk. If you do not need to test the entire disk, run the test for 5 or 10
minutes.
3–12 Running System Diagnostics
Page 75

Examples:
>>>
exer_read
failed to send command to pkc0.1.0.2.0
failed to send Read to dkc100.1.0.2.0
*** Hard Error - Error #5 Diagnostic Name ID Device Pass Test Hard/Soft
31-JUL-1992
exer_kid 00000175 dkc100.1.0.2 0 0 1 0
14:54:18
Error in read of 0 bytes at location 014DD400 from device dkc100.1.0.2.0
*** End of Error ***
>>>
Running System Diagnostics 3–13
Page 76

3.1.8 exer_write
The
exer_write
more devices. The exercisers are run in the background and nothing is displayed
unless an error occurs.
The exer_write tests cause the device to seek to a random block and read a
2048-byte packet of data, write that same data back to the same location on the
device, read the data again, and compare it to the data originally read.
The tests continue until one of the following conditions occurs:
1. All blocks on the device have been read for a passcount of d_passes (default is
1).
command tests a disk by performing random writes on one or
2. The exer_read process has been terminated via the
killorkill_diags
commands, or Ctrl/C.
3. The specified time has elapsed.
To terminate the read tests, enter Ctrl/C, or use the
an individual diagnostic or the
Use the
show_status
display to determine the process ID when killing an
kill_diags
command to terminate all diagnostics.
kill
command to terminate
individual diagnostic test.
Caution
Running the
exer_write
diagnostic may distroy data on the specified
disk.
Synopsis:
exer_write [-sec seconds] [device_name device_name...]
Arguments:
[device_name] One or more device names to be tested. The default is du*.* dk*.* to test
all DSSI and SCSI disks that are on line.
Options:
[-sec seconds] Number of seconds to run exercisers. If you do not enter the number
of seconds, the tests will run until d_passes have completed (d_passes
default is 1).
If you want to test the entire disk, run at least one pass across the
disk. If you do not need to test the entire disk, run the test for 5 or 10
minutes.
3–14 Running System Diagnostics
Page 77

Examples:
>>>
exer_write dka0
EXECUTING THIS COMMAND WILL DESTROY DISK DATA
OR DATA ON THE SPECIFIED DEVICES
Do you really want to continue? [Y/(N)]:
failed to send command to pkc0.1.0.2.0
failed to send Read to dkc100.1.0.2.0
*** Hard Error - Error #5 Diagnostic Name ID Device Pass Test Hard/Soft
31-JUL-1992
exer_kid 0000012e dka0.0.0.0 0 0 1 0
15:21:22
Error in read of 0 bytes at location 017B3400 from device dka0.0.0.0.0
*** End of Error ***
failed to send command to pka0.0.0.0.0
failed to send Read to dka0.0.0.0.0
>>>
y
Running System Diagnostics 3–15
Page 78

3.1.9 fbus_diag
The
fbus_diag
onboard a specific Futurebus+ device.
The
fbus_diag
initiate commands on specific Futurebus+ devices, waits for tests to complete, and
then reports the results to the console. If an error is reported by the Futurebus+
node, the diagnostic issues a dump buffer command to gain any available
extended information that will also be reported to the console.
Refer to documentation for the specific Futurebus+ option for the recommended
test procedures and form of the
diagnostics. For more information, consult the Futurebus+ Handbook.
Test categories that require a buffer pointer in the argument CSR will have a
default buffer provided by this diagnostic if the user does not specify a buffer
address.
Process options and command line arguments are used to specify the specific
test or test script to be executed as well as the target Futurebus+ node for this
command.
Synopsis:
fbus_diag [-rb] [-p pass_count] [-st test_number] [-cat test_group node [test_arg]
Arguments:
command is used to start execution of a diagnostic test script
comand uses the Futurebus+ standard test CSR interface to
fbus_diag
command to initiate module-resident
node Specifies the device name of the Futurebus+ device to execute the test.
Use the command
names.
[test_arg] Specifies an argument to be passed to the Futurebus+ node in the test
argument CSR. If this parameter is not specified and the category is
either extended or system, the routine allocates a buffer and passes the
buffer address through the test argument CSR.
Options:
[-rb] Randomly allocates from memzone on each pass with a block size of
4096.
[-p] (pass_count) Specifies the number of times to run the test. If 0, the
test runs continuously. This overrides the value of the pass_count
environment variable. In the absence of this option, pass_count is used.
The default for pass_count is 1.
[-st] (test_number) Specifies the test number to be run. The default is 0,
which runs the default tests in the category.
3–16 Running System Diagnostics
show device fb
to display the Futurebus+ device
Page 79

[-cat] (test_group) Specifies the test category to be executed. The possible
categories are as follows:
• Init: Initialization tests
• Extended: Extended tests (default category)
• System: System tests
• Manual: Manual tests
• x: Bit mask of the desired test categories
[-opt] (test_option) Specify the Test Start CSR Option field bits to be set. The
possible option bits are as follows:
• Loop_error: Loop on test if an error is detected
• Loop_test: Loop on this test
• Cont_error: Continue if an error is detected
• x: Bit mask of the desired option bits
The default value for this qualifier is based on the current values in the
global enviroment variables as follows:
• Loop_test: 1 if D_PASSES == 0 ; 0 otherwise
• Loop_error: 1 if D_HARDERR == "Loop" ; 0 otherwise
• Cont_error: 1 if D_HARDERR == "Continue" ; 0 otherwise
Running System Diagnostics 3–17
Page 80

3.1.10 show_mop_counter
The
show_mop_counter
Ethernet port.
Synopsis:
show_mop_counter [port_name]
Arguments:
command displays the MOP counters for the specified
[port_name] Specifies the Ethernet port for which to display MOP counters: eza0 for
Ethernet port 0; ezb0 for Ethernet port 1.
Examples:
>>>
show_mop_counter eza0
eza0 MOP Counters
DEVICE SPECIFIC:
TI: 211 RI: 34834 RU: 1 ME: 0 TW: 0 RW: 0 BO: 0
HF: 0 UF: 0 TN: 0 LE: 0 TO: 0 RWT: 33535 RHF: 33536 TC: 56
PORT INFO:
tx full: 0 tx index in: 2 tx index out: 2
rx index in: 3
MOP BLOCK:
Network list size: 0
MOP COUNTERS:
Time since zeroed (Secs): 4588
TX:
Bytes: 117068 Frames: 210
Deferred: 1 One collision: 32 Multi collisions: 15
TX Failures:
Excessive collisions: 0 Carrier check: 0 Short circuit: 0
Open circuit: 0 Long frame: 0 Remote defer: 0
Collision detect: 0
RX:
Bytes: 116564 Frames: 194
Multicast bytes: 16730668 Multicast frames: 36953
RX Failures:
Block check: 0 Framing error: 0 Long frame: 0
Unknown destination: 36953 Data overrun: 0 No system buffer: 18
No user buffers: 0
>>>
3–18 Running System Diagnostics
Page 81

3.1.11 clear_mop_counter
The
clear_mop_counter
Ethernet port.
Synopsis:
show_mop_counter [port_name]
Arguments:
command initializes the MOP counters for the specified
[port_name] Specifies the Ethernet port for which to initialize MOP counters: eza0
for Ethernet port 0; ezb0 for Ethernet port 1.
Examples:
>>>
clear_mop_counter eza0
>>>
Running System Diagnostics 3–19
Page 82

3.1.12 Loopback Tests
Internal and external loopback tests can be used to isolate a failure by testing
segments of a particular control or data path. The loopback tests are a subset of
the RBDs.
3.1.12.1 Testing the Auxiliary Console Port (exer)
Using a loopback connector (29–24795–00) and a form of the
can test the auxiliary serial port. Before running the loopback test, you must
set the tt_allow_login environment variable to 1; after the test is completed, you
must set tt_allow_login to 0.
Use the following commands to send a fixed data pattern through the auxiliary
serial port:
>>> set tt_allow_login 1
>>> exer -bs 1 -a "wRc" -p 0 tta1 &
>>> kill_diags
>>> set tt_allow_login 0
>>>
In the above command, the portion in quotes (the write, read, and compare
instruction) is case sensitive. The background operator &, at the end of the
command, causes the loopback tests to run in the background. Nothing is
displayed unless an error occurs.
exer
command, you
To terminate the console loopback test, use the
individual diagnostic or the
Use the
individual diagnostic test.
3.1.12.2 Testing the Ethernet Ports (netexer)
The
between eza0 and ezb0. The network ports must be connected and terminated.
The loopback tests are run in the background. Nothing is displayed unless an
error occurs.
To terminate the console loopback test, use the
individual diagnostic or the
Use the
individual diagnostic test.
3–20 Running System Diagnostics
show_status
netexer
command performs an Ethernet port-to-port MOP loopback test
show_status
kill_diags
display to determine the process ID when killing an
kill_diags
display to determine the process ID when killing an
kill
command to terminate the
command to terminate all diagnostics.
kill
command to terminate the
command to terminate all diagnostics.
Page 83

3.1.13 kill and kill_diags
The
kill
and
kill_diags
executing .
commands terminates diagnostics that are currently
• The
• The
kill
command terminates a specified process.
kill_diags
command terminates all diagnostics.
Synopsis:
kill_diags
kill [PID . . . ]
Arguments:
[PID . . . ] The process ID of the diagnostic to terminate. Use the
command to determine the process ID.
show_status
3.1.14 Summary of Diagnostic and Related Commands
Table 3–1 provides a summary of the diagnostic and related commands.
Table 3–1 Summary of Diagnostic and Related Commands
Command Function Reference
Acceptance Testing
test Test the entire system, subsystem, or specific device. Section 3.1.1
Error Reporting and Diagnostic Status
show fru Reports system bus and Futurebus+ FRUs,
module identification numbers, and summary error
information.
show_status Reports the status of currently executing
test/exercisers.
show error Reports some errors captured by diagnostics and
operating system.
(continued on next page)
Section 3.1.2
Section 3.1.3
Section 3.1.4
Running System Diagnostics 3–21
Page 84

Table 3–1 (Cont.) Summary of Diagnostic and Related Commands
Command Function Reference
Extended Testing/Troubleshooting
memexer Exercises memory by running a specified number of
memexer_mp Tests memory in a multiprocessor system by running
exer_read Tests a disk by performing random reads on the
exer_write Tests a disk by performing random writes to the
fbus_diag Initiates onboard tests for a specified Futurebus+
show_mop_
counter
clear_mop_
counter
Loopback Testing
exer Conducts loopback tests for the specified console
netexer Conducts loopback tests for the Ethernet ports. Section 3.1.12.2
Diagnostic-Related Commands
kill Terminates a specified process. Section 3.1.13
kill_diags Terminates all currently executing diagnostics. Section 3.1.13
memory tests. The tests are run in the background.
a specified number of memory exerciser sets. The
tests are run in the background.
specified device.
specified device.
device.
Displays the MOP counters for the specified
Ethernet port.
Initializes the MOP counters for the specified
Ethernet port.
port.
Section 3.1.5
Section 3.1.6
Section 3.1.7
Section 3.1.8
Section 3.1.9
Section 3.1.10
Section 3.1.11
Section 3.1.12.1
3.2 DSSI Device Internal Tests
A DSSI storage device may fail either during initial power-up or during normal
operation. In both cases, the failure is indicated by the lighting of the red Fault
LED on the drive’s front panel.
If the drive is unable to execute the Power-On Self-Test (POST) successfully, the
red Fault LED remains on and the Run/Ready LED does not come on, or both
LEDs remain on.
3–22 Running System Diagnostics
Page 85

POST is also used to handle two types of error conditions in the drive:
• Controller errors are caused by the hardware associated with the controller
function of the drive module. A controller error is fatal to the operation of the
drive, since the controller cannot establish a logical connection to the host.
The red Fault LED comes on. If this occurs, replace the drive module.
• Drive errors are caused by the hardware associated with the drive control
function of the drive module. These errors are not fatal to the drive, since
the drive can establish a logical connection and report the error to the host.
Both LEDs go out for about 1 second, then the red Fault LED comes on. In
this case, run either DRVTST, DRVEXR, or PARAMS via the
set host -dup
command, as described in the drive’s service documentation, to determine the
error code.
Three configuration errors are often the cause of drive errors:
• More than one node with the same bus node ID number
• Identical node names
• Identical MSCP unit numbers
The first error cannot be detected by software. Use the
show device
command
(Section 6.2) to display the second and third types of errors. This command
displays each device along with such information as bus node ID, unit number,
and node name.
If the device is connected to the front panel of the storage compartment, you
must install a bus node ID plug in the corresponding socket on the front panel. If
the device is not connected to the front panel, it reads the bus node ID from the
three-switch DIP switch on the side of the drive.
DSSI storage devices contain the following local programs:
DIRECT A directory, in DUP-specified format, of available local programs
DRVTST A comprehensive drive functionality verification test
DRVEXR A utility that exercises the device
HISTRY A utility that saves information retained by the drive, including the
ERASE A utility that erases all user data from the disk
VERIFY A utility that is used to determine the amount of ‘‘margin’’ remaining in
DKUTIL A utility that displays disk structures and disk data
PARAMS A utility that allows you to look at or change drive status, history,
internal error log
on-disk structures
parameters, and the internal error log
Running System Diagnostics 3–23
Page 86

Use the
set host -dup
command to access the local programs listed above.
Example 3–1 provides an abbreviated example of running DRVTST for a device
(Bus node 2 on Bus 0).
Caution
When running internal drive tests, always use the default (0 = No) in
responding to the ‘‘Write/read anywhere on medium?’’ prompt. Answering
Yes could destroy data.
Example 3–1 Running DRVTST
>>>
set host -dup -task drvtst dub0
Starting DUP server...
Copyright (C) 1992 Digital Equipment Corporation
Write/read anywhere on medium? [1=Yes/(0=No)]
5 minutes to complete.
GAMMA::MSCP$DUP 17-MAY-1992 12:51:20 DRVTST CPU= 0 00:00:09.29 PI=160
GAMMA::MSCP$DUP 17-MAY-1992 12:51:40 DRVTST CPU= 0 00:00:18.75 PI=332
GAMMA::MSCP$DUP 17-MAY-1992 12:52:00 DRVTST CPU= 0 00:00:28.40 PI=503
.
.
.
GAMMA::MSCP$DUP 17-MAY-1992 12:55:42 DRVTST CPU= 0 00:02:13.41 PI=2388
Test passed.
Stopping DUP server...
>>>
Return
Example 3–2 provides an abbreviated example of running DRVEXR for an
RF-series disk (Bus node 2 on Bus 0).
3–24 Running System Diagnostics
Page 87

Example 3–2 Running DRVEXR
>>>
set host -dup -task drvexr dub0
Starting DUP server...
Copyright (C) 1992 Digital Equipment Corporation
Write/read anywhere on medium? [1=Yes/(0=No)]
Test time in minutes? [(10)-100]
Number of sectors to transfer at a time? [0 - 50]
Compare after each transfer? [1=Yes/(0=No)]:
Test the DBN area? [2=DBN only/(1=DBN and LBN)/0=LBN only]:
10 minutes to complete.
GAMMA::MSCP$DUP 17-MAY-1992 13:02:40 DRVEXR CPU= 0 00:00:25.37 PI=1168
GAMMA::MSCP$DUP 17-MAY-1992 13:03:00 DRVEXR CPU= 0 00:00:29.53 PI=2503
GAMMA::MSCP$DUP 17-MAY-1992 13:03:20 DRVEXR CPU= 0 00:00:33.89 PI=3835
.
.
.
GAMMA::MSCP$DUP 17-MAY-1992 13:12:24 DRVEXR CPU= 0 00:02:24.19 PI=40028
13332 operations completed.
33240 LBN blocks (512 bytes) read.
0 LBN blocks (512 bytes) written.
33420 DBN blocks (512 bytes) read.
0 DBN blocks (512 bytes) written.
0 bytes in error (soft).
0 uncorrectable ECC errors.
Complete.
Stopping DUP server...
>>>
Return
Return
5
Return
Return
Refer to the RF-Series Integrated Storage Element Service Guide for instructions
on running these programs.
3.3 DEC VET
Digital’s DEC Verifier and Exerciser Tool (DEC VET) software is a multipurpose
system maintenance tool that performs exerciser-oriented maintenance testing.
DEC VET runs on both OpenVMS AXP and DEC OSF/1 operating systems.
DEC VET consists of a manager and exercisers that test devices. The DEC VET
manager controls these exercisers.
DEC VET exercisers test system hardware and the operating system.
DEC VET supports various exerciser configurations, ranging from a single device
exerciser to full system loading—that is, simultaneous exercising of multiple
devices.
Refer to the DEC Verifier and Exerciser Tool User’s Guide (AA–PTTMA–TE) for
instructions on running DEC VET.
Running System Diagnostics 3–25
Page 88

3.4 Running UETP
The User Environment Test Package (UETP) tool is an OpenVMS AXP software
package designed to test whether the OpenVMS AXP operating system is
installed correctly. UETP software puts the system through a series of tests that
simulate a typical user environment, by making demands on the system that are
similar to demands that might occur in everyday use.
Run UETP after system installation when OpenVMS AXP is running; or when
you need to run stress tests to pinpoint intermittent errors.
UETP is not a diagnostic program; it does not attempt to test every
feature exhaustively. When UETP runs to completion without encountering
unnrecoverable errors, the system being tested is ready for use.
UETP exercises devices and functions that are common to all VMS and OpenVMS
AXP systems, with the exception of optional features, such as high-level language
compilers. The system components tested include the following:
• Most standard peripheral devices
• The system’s multiuser capability
• DECnet for OpenVMS AXP software
3.4.1 Summary of UETP Operating Instructions
This section summarizes the procedure for running all phases of UETP with
default values.
1. Log in to the SYSTEST account as follows:
Username: SYSTEST
Password:
Because the SYSTEST and SYSTEST_CLIG accounts have privileges,
unauthorized use of these accounts might compromise the security of your
system.
3–26 Running System Diagnostics
Caution
Page 89

2. Make sure no user programs are running and no user volumes are mounted.
Caution
By design, UETP assumes and requests the exclusive use of system
resources. If you ignore this restriction, UETP may interfere with
applications that depend on these resources.
3. After you log in, check all devices to be sure that the following conditions
exist:
• All devices you want to test are powered up and are on line to the system.
• Scratch disks are mounted and initialized.
• Disks contain a directory named [SYSTEST] with OWNER_
UIC=[1,7]. (You can create this directory with the DCL command
CREATE/DIRECTORY.)
• Scratch magnetic tape reels are physically mounted on each drive you
want tested and are initialized with the label UETP (using the DCL
command INITIALIZE). Make sure magnetic tape reels contain at least
600 feet of tape.
• Scratch tape cartridges have been inserted in each drive you want to test
and are initialized with the label UETP.
• Line printers and hardcopy terminals have plenty of paper.
• Terminal characteristics and baud rate are set correctly (see the user’s
guide for your terminal).
4. To start UETP, enter the following command and press Return:
$ @UETP
UETP responds with the following question:
Run "ALL" UETP phases or a "SUBSET" [ALL]?
Press Return to choose the default response enclosed in brackets. UETP
responds with three more questions in the following sequence:
How many passes of UETP do you wish to run [1]?
How many simulated user loads do you want [n]?
Do you want Long or Short report format [Long]?
Use the default values when acceptance testing with UETP. For stress testing,
enter your own values.
Running System Diagnostics 3–27
Page 90

Press Return after each prompt. After you answer the last question, UETP
initiates its entire sequence of tests, which run to completion without further
input. The final message should look like the following:
*****************************************************
**
END OF UETP PASS 1 AT 20-JUL-1992 16:30:09.38
**
*****************************************************
5. After UETP runs, check the log files for errors. If testing completes
successfully, the OpenVMS AXP operating system is working properly.
Note
After a run of UETP, you should run the Error Log Utility to check for
hardware problems that can occur during a run of UETP. For information
on running the Error Log Utility, refer to the VMS Error Log Utility
Manual.
If UETP does not complete successfully, refer to Section 3.4.11.
3.4.2 System Disk Requirements
Before running UETP, be sure that the system disk has at least 1200 blocks
available. Systems running more than 20 load test processes may require a
minimum of 2000 available blocks. If you run multiple passes of UETP, log files
will accumulate in the default directory and further reduce the amount of disk
space available for subsequent passes.
If disk quotas are enabled on the system disk, you should disable them before you
run UETP.
3.4.3 Preparing Additional Disks
To prepare each disk drive in the system for UETP testing, use the following
procedure:
1. Place a scratch disk in the drive and spin up the drive. If a scratch disk is
not available, use any disk with a substantial amount of free space. UETP
does not overwrite existing files on any volume. If your scratch disk contains
files that you want to keep, do not initialize the disk; go to step 3.
2. If the disk does not contain files you want to save, initialize it. For example:
$ INITIALIZE DUA1: TEST1
3–28 Running System Diagnostics
Page 91

This command initializes DUA1, and assigns the volume label TEST1 to the
disk. All volumes must have unique labels.
3. Mount the disk. For example:
$ MOUNT/SYSTEM DUA1: TEST1
This command mounts the volume labeled TEST1 on DUA1. The /SYSTEM
qualifier indicates that you are making the volume available to all users on
the system.
4. UETP uses the [SYSTEST] directory when testing the disk. If the volume
does not contain the directory [SYSTEST], you must create it. For example:
$ CREATE/DIRECTORY/OWNER_UIC=[1,7] DUA1:[SYSTEST]
This command creates a [SYSTEST] directory on DUA1 and assigns a user
identification code (UIC) of [1,7]. The directory must have a UIC of [1,7] to
run UETP.
If the disk you have mounted contains a root directory structure, you can
create the [SYSTEST] directory in the [SYS0.] tree.
3.4.4 Preparing Magnetic Tape Drives
Set up magnetic tape drives that you want to test by doing the following:
1. Place a scratch magnetic tape with at least 600 feet of magnetic tape in the
tape drive. Make sure that the write-enable ring is in place.
2. Position the magnetic tape at the beginning-of-tape (BOT) and put the drive
on line.
3. Initialize each scratch magnetic tape with the label UETP. For example, if
you have physically mounted a scratch magnetic tape on MTA1, enter the
following command and press Return:
$ INITIALIZE MTA1: UETP
Magnetic tapes must be labeled UETP to be tested. As a safety feature, UETP
does not test tapes that have been mounted with the MOUNT command.
3.4.5 Preparing Tape Cartridge Drives
Set up tape cartridge drives that you want to test by doing the following:
1. Insert a scratch tape cartridge in the tape cartridge drive.
2. Initialize the tape cartridge. For example:
$ INITIALIZE MKE0: UETP
Running System Diagnostics 3–29
Page 92

Tape cartridges must be labeled UETP to be tested. As a safety feature,
UETP does not test tape cartridges that have been mounted with the MOUNT
command.
3.4.5.1 TLZ06 Tape Drives
During the initialization phase, UETP sets a time limit of 6 minutes for a TLZ06
unit to complete the UETTAPE00 test. If the device does not complete the
UETTAPE00 test within the alloted time, UETP displays a message similar to
the following:
-UETP-E-TEXT, UETTAPE00.EXE testing controller MKA was stopped ($DELPRC) at 16:23:23.07
To increase the timeout value, type a command similar to the following before
running UETP:
$ DEFINE/GROUP UETP$INIT_TIMEOUT "0000 00:08:00.00"
This example defines the initialization timeout value as 8 minutes.
because the time out period (UETP$INIT_TIMEOUT) expired or
because it seemed hung or because UETINIT01 was aborted.
3.4.6 Preparing RRD42 Compact Disc Drives
To run UETP on an RRD42 compact disc drive, you must first load the test disc
that you received with your compact disc drive unit.
3.4.7 Preparing Terminals and Line Printers
Terminals and line printers must be turned on to be tested by UETP. They must
also be on line. Check that line printers and hardcopy terminals have enough
paper. The amount of paper required depends on the number of UETP passes
that you plan to execute. Each pass requires two pages for each line printer and
hardcopy terminal.
Check that all terminals are set to the correct baud rate and are assigned
appropriate characteristics (see the user’s guide for your terminal).
Spooled devices and devices allocated to queues fail the initialization phase of
UETP and are not tested.
3.4.8 Preparing Ethernet Adapters
Make sure that no other processes are sharing the Ethernet adapter device when
you run UETP.
3–30 Running System Diagnostics
Page 93

Note
UETP will not test your Ethernet adapter if DECnet for OpenVMS AXP
or another application has the device allocated.
Because either DECnet for OpenVMS AXP or the LAT terminal server might also
try to use the Ethernet adapter (a shareable device), you must shut down DECnet
for OpenVMS AXP and the LAT terminal server before you run the device test
phase, if you want to test the Ethernet adapter.
3.4.9 DECnet for OpenVMS AXP Phase
The DECnet for OpenVMS AXP phase of UETP uses more system resources than
other tests. You can, however, minimize disruptions to other users by running the
test on the ‘‘least busy’’ node.
By default, the file UETDNET00.COM specifies the node from which the DECnet
for OpenVMS AXP test will be run. To run the DECnet for OpenVMS AXP test
on a different node, enter the following command before you invoke UETP:
$ DEFINE/GROUP UETP$NODE_ADDRESS node_address
This command equates the group logical name UETP$NODE_ADDRESS to the
node address of the node in your area on which you want to run the DECnet for
OpenVMS AXP phase of UETP.
For example:
$ DEFINE/GROUP UETP$NODE_ADDRESS 9.999
When you use the logical name UETP$NODE_ADDRESS, UETP tests
only the first active circuit found by NCP. Otherwise, UETP tests all
active testable circuits.
When you run UETP, a router node attempts to establish a connection between
your node and the node defined by UETP$NODE_ADDRESS. Occasionally, the
connection between your node and the router node might be busy or nonexistent.
When this happens, the system displays the following error messages:
%NCP-F-CONNEC, Unable to connect to listener
-SYSTEM-F-REMRSRC, resources at the remote node were insufficient
%NCP-F-CONNEC, Unable to connect to listener
-SYSTEM-F-NOSUCHNODE, remote node is unknown
Note
Running System Diagnostics 3–31
Page 94

3.4.10 Termination of UETP
At the end of a UETP pass, the master command procedure UETP.COM displays
the time at which the pass ended. In addition, UETP.COM determines whether
UETP needs to be restarted.
At the end of an entire UETP run, UETP.COM deletes temporary files and does
other cleanup activities.
Pressing Ctrl/Y or Ctrl/C lets you terminate a UETP run before it completes
normally. Normal completion of a UETP run, however, includes the deletion of
miscellaneous files that have been created by UETP for the purpose of testing.
The use of Ctrl/Y or Ctrl/C might interrupt or prevent these cleanup procedures.
3.4.11 Interpreting UETP VMS Failures
When UETP encounters an error, it reacts like a user program. It either returns
an error message and continues, or it reports a fatal error and terminates
the image or phase. In either case, UETP assumes the hardware is operating
properly and it does not attempt to diagnose the error.
If the cause of an error is not readily apparent, use the following methods to
diagnose the error:
• VMS Error Log Utility—Run the Error Log Utility to obtain a detailed report
of hardware and system errors. Error log reports provide information about
the state of the hardware device and I/O request at the time of each error.
For information about running the Error Log Utility, refer to the VMS Error
Log Utility Manual and Chapter 4 of this manual.
• Diagnostic facilities—Use the diagnostic facilities to test exhaustively a device
or medium to isolate the source of the error.
3.4.12 Interpreting UETP Output
You can monitor the progress of UETP tests at the terminal from which they were
started. This terminal always displays status information, such as messages that
announce the beginning and end of each phase and messages that signal an error.
The tests send other types of output to various log files, depending on how you
started the tests. The log files contain output generated by the test procedures.
Even if UETP completes successfully, with no errors displayed at the terminal,
it is good practice to check these log files for errors. Furthermore, when errors
are displayed at the terminal, check the log files for more information about their
origin and nature.
3–32 Running System Diagnostics
Page 95

3.4.12.1 UETP Log Files
UETP stores all information generated by all UETP tests and phases from its
current run in one or more UETP.LOG files, and it stores the information from
the previous run in one or more OLDUETP.LOG files. If a run of UETP involves
multiple passes, there will be one UETP.LOG or one OLDUETP.LOG file for each
pass.
At the beginning of a run, UETP deletes all OLDUETP.LOG files, and renames
existing UETP.LOG files to OLDUETP.LOG. Then UETP creates a new
UETP.LOG file and stores the information from the current pass in the new
file. Subsequent passes of UETP create higher versions of UETP.LOG. Thus, at
the end of a run of UETP that involves multiple passes, there is one UETP.LOG
file for each pass. In producing the files UETP.LOG and OLDUETP.LOG, UETP
provides the output from the two most recent runs.
If the run involves multiple passes, UETP.LOG contains information from all
the passes. However, only information from the latest run is stored in this file.
Information from the previous run is stored in a file named OLDUETP.LOG.
Using these two files, UETP provides the output from its tests and phases from
the two most recent runs.
The cluster test creates a NETSERVER.LOG file in SYS$TEST for each pass
on each system included in the run. If the test is unable to report errors (for
example, if the connection to another node is lost), the NETSERVER.LOG file on
that node contains the result of the test run on that node. UETP does not purge
or delete NETSERVER.LOG files; therefore, you must delete them occasionally to
recover disk space.
If a UETP run does not complete normally, SYS$TEST might contain other log
files. Ordinarily these log files are concatenated and placed within UETP.LOG.
You can use any log files that appear on the system disk for error checking, but
you must delete these log files before you run any new tests. You may delete
these log files yourself or rerun the entire UETP, which checks for old UETP.LOG
files and deletes them.
3.4.12.2 Possible UETP Errors
This section is intended to help you identify problems you might encounter
running UETP.
The following are the most common failures encountered while running UETP:
• Wrong quotas, privileges, or account
• UETINIT01 failure
• Ethernet device allocated or in use by another application
Running System Diagnostics 3–33
Page 96

• Insufficient disk space
• Incorrect cluster setup
• Problems during the load test
• DECnet for OpenVMS AXP error
• Lack of default access for the FAL object
• Errors logged but not displayed
• No PCB or swap slots
• Hangs
• Bugchecks and machine checks
For more information refer to the VAX 3520, 3540 VMS Installation and
Operations (ZKS166) manual.
3.5 Acceptance Testing and Initialization
Perform the acceptance testing procedure listed below, after installing a system,
or whenever adding or replacing the following:
CPU modules
Memory modules
I/O module
Backplane
Storage devices
Futurebus+ options
1. Run the RBD acceptance tests using the
2. Bring up the operating system.
3. Run DEC VET or UETP to test that the operating system is correctly
installed. Refer to Section 3.3 for information on DEC VET. Refer to
Section 3.4 for instructions on running UETP.
3–34 Running System Diagnostics
test
command.
Page 97

4
Error Log Analysis
This chapter provides information on how to interpret error logs reported by the
operating system.
• Section 4.1 describes machine check/interrupts and how these errors are
detected and reported.
• Section 4.2 describes the entry format used by the ERF/UERF error
formatters.
• Section 4.3 describes how to translate the error log information using the
OpenVMS AXP and DEC OSF/1 error formatters.
• Section 4.4 describes how to interpret the system error log to isolate the
failing FRU.
4.1 Fault Detection and Reporting
Table 4–1 provides a summary of the fault detection and correction components of
DEC 4000 AXP systems.
Generally, PALcode handles exceptions as follows:
• The PALcode determines the cause of the exception.
• If possible, it corrects the problem and passes control to the operating system
for reporting before returning the system to normal operation.
• If a problem is not correctable, or if error/event logging is required, control is
passed through the system control block (SCB) to the appropriate exception
handler.
Error Log Analysis 4–1
Page 98

Table 4–1 DEC 4000 AXP Fault Detection and Correction
Component Fault Detection/Correction Capability
KN430 Processor Module
DECchip 21064 microprocessor
Backup cache (B-cache) EDC check bits on the data store; and parity on the tag
MS430 Memory Modules
Memory module EDC logic protects data by detecting and correcting up to
KFA40 I/O Module
I/O module DSSI/SCSI buses: Data parity is checked and generated.
System Bus
System bus Longword parity on command, address, and data.
Error Detection and Correction (EDC) logic. For all data
entering the 21064 microprocessor, single bits are checked
and corrected; for all data exiting the 21064 microprocessor,
the appropriate check bits are generated. A single-bit error
on any of the four longwords being read can be corrected
(per cycle).
store and control store.
2 bits per DRAM chip per gate array. The four bits of data
per DRAM are spread across two gate arrays (one for even
longwords, the other for odd longwords).
Lbus data transfers to Ethernet and SCSI/DSSI controllers:
Data parity is checked and generated.
Futurebus+ data transfers: Parity is checked and passed
on.
4.1.1 Machine Check/Interrupts
The exceptions that result from hardware system errors are called machine
check/interrupts. They occur when a system error is detected during the
processing of a data request. There are three types of machine check/interrupts
related to system events:
1. Processor machine check
2. System machine check
3. Processor corrected machine check
4–2 Error Log Analysis
Page 99

The causes for each of the machine check/interrupts are as follows. The system
control block (SCB) vector through which PALcode transfers control to the
operating system is shown in parentheses.
Processor Machine Check (SCB: 670)
Processor machine check errors are fatal system errors and immediately crash
the system.
• The DECchip 21064 microprocessor detected one or more of the following
uncorrectable data errors:
– Uncorrectable B-cache data error
– Uncorrectable memory data error (CU_ERR asserted)
– Uncorrectable data from other CPU’s B-cache (CU_ERR asserted)
• A B-cache tag or tag control parity error occurred
• Hard error status was asserted in response to:
– A read data parity error
– System bus timeouts (NOACK error bit asserted)—The bus responder
detected a write data or command address error and did not acknowledge
the bus cycle.
System Machine Check (SCB: 660)
A system machine check is a system detected error, external to the DECchip
21064 microprocessor and possibly not related to the activities of the microprocessor. It occurs when C_ERROR is asserted on the system bus.
Fatal errors:
• The I/O module detected a system bus error while serving as system bus
commander:
– System bus timeouts (NOACK error bit asserted)—The bus responder
detected a write data or command address error and did not acknowledge
the bus cycle
– Uncorrectable data (CU-ERR asserted) from responder
• Any system bus device detected a command/address parity error
• A bus responder detected a write data parity error
• Memory or I/O system bus gate array detected an internal error (SYNC error)
Error Log Analysis 4–3
Page 100

Nonfatal errors:
• A memory module correctable error occurred
• Correctable B-cache errors were detected while the B-cache was providing
data to the system bus (errors from other CPU)
• Duplicate tag store parity errors occurred
Processor Corrected Machine Check (SCB: 630)
Processor corrected machine checks are caused by B-cache errors that are
detected and corrected by the DECchip 21064 microprocessor. These errors
are nonfatal and result in an error log entry.
4.1.2 System Bus Transaction Cycle
In order to interpret error logs for system bus errors, you need a basic
understanding of the system bus transaction cycle and the function of the
commander, responder, and bystanders.
For any particular bus transaction cycle there is one commander (either CPU or
I/O) that initiates bus transactions and one responder (memory, CPU, or I/O) that
accepts or supplies data in response to a command/address from the system bus
commander. A bystander is a system bus node (CPU, I/O, or memory) that is not
addressed by a current system bus commander.
There are four system bus transaction types: read, write, exchange, and nut.
• Read and write transactions consist of a command/address cycle followed by
two data cycles.
• Exchange transactions are used to replace the cache block when a cache block
resource conflict occurs. They consist of a command/address cycle followed by
four data cycles: two writes and two reads.
• Nut transactions consist of a command/address cycle and two dummy data
cycles for which no data is transferred.
For more information, refer to the DEC 4000 Model 600 Series Technical Manual.
4.2 Error Logging and Event Log Entry Format
The OpenVMS AXP and DEC OSF/1 error handlers can generate several entry
types. All error entries, with the exception of correctable memory errors, are
logged immediately. Entries can be of variable length based on the number of
registers within the entry.
4–4 Error Log Analysis
 Loading...