

Page 1

WT3
is produced by:
Dayton Audio
725 Pleasant Valley Drive
Springboro, Ohio 45066 USA
http://www.daytonaudio.com
Online User’s Guide
Revised: May 11, 2008
Copyright © 2007-2008 by John L. Murphy, Andersonville, TN USA All Rights Reserved.
No part of this publication may be reproduced without prior express written permission.
Page 2

Minimum Requirements for the PC
The minimum requirements to run WT3 are:
•
A PC with a processor running at no less than 500 MHz with 64 MB RAM
•
One available USB port
•
A display with resolution of at least 800 x 600 pixels
WT3 runs under Microsoft Windows 98, Me, 2000, XP and VISTA operating systems.
Page 3

*** VERY IMPORTANT SAFETY NOTE ***
Quick Start for the WT3 Woofer Tester
NEVER connect the test leads of the WT3 to a speaker that
is connected to any other equipment or to an equipment
ground! Severe damage could occur to the WT3 unit or to
the other equipment. Only connect the WT3 to an
unconnected loudspeaker.
Naturally, you will want to test your first woofer as soon as you get your WT3. Here are step-by-step
instructions to get you going quickly.
1) Install the WT3 software.
•
Insert the WT3 CD and allow the file named "WT3_setup.exe" to auto-run.
(Alternately you can double-click on the "WT3_setup.exe" file to start the installation
process.)
•
Follow the on-screen instructions to complete the software installation
•
Check for available upgrades at: http://www.daytonaudio.com/wt3updates.html
2) Connect the WT3 hardware unit to any convenient USB port on your computer.
After a few seconds the PC will recognize the new hardware. However, on initial power up the unit
requires a full 90 seconds to stabilize before measurements can be made. After this initial plug-in
delay, impedance measurements take only a few seconds to complete. This settling time is due to the
extremely wide low frequency bandwidth required for high precision measurements down to 1 Hz.
3) Set the Windows Volume Controls to Maximum.
From the task bar, double-click on Volume Control to open the mixer and Raise both the "Master" and
the "Wave" sliders to maximum. Make sure the Wave signal is panned to center. Although drivers can
be tested at lower signal levels, WT3 was designed to normally be used with the Windows Volume
control set at maximum.
4) Launch the WT3 application software.
From the Windows "Start" button select "All Programs" then select "WT3". The WT3 software will
launch.
5) Connect the alligator clips from the WT3 unit to the 1k Ohm calibration resistor.
Page 4

6) Select “Impedance Calibration” under the “Impedance Analyzer” menu.
The software will sweep the resistor and plot the results. The uncalibrated impedance is
displayed and the calibration is complete. You should also calibrate the test leads at this time
by selecting the appropriate command under the "Impedance Analyzer" menu and following
the on-screen instructions.
7) Connect the alligator clips from the WT3 unit to the terminals of the driver under
test.
The driver MUST NOT BE CONNECTED to an amplifier or other equipment. The connection
polarity does not matter. For the best results the driver should be clamped in place during testing. It
may be necessary to elevate drivers with vented pole pieces in order to make sure the vent is not
blocked during testing.
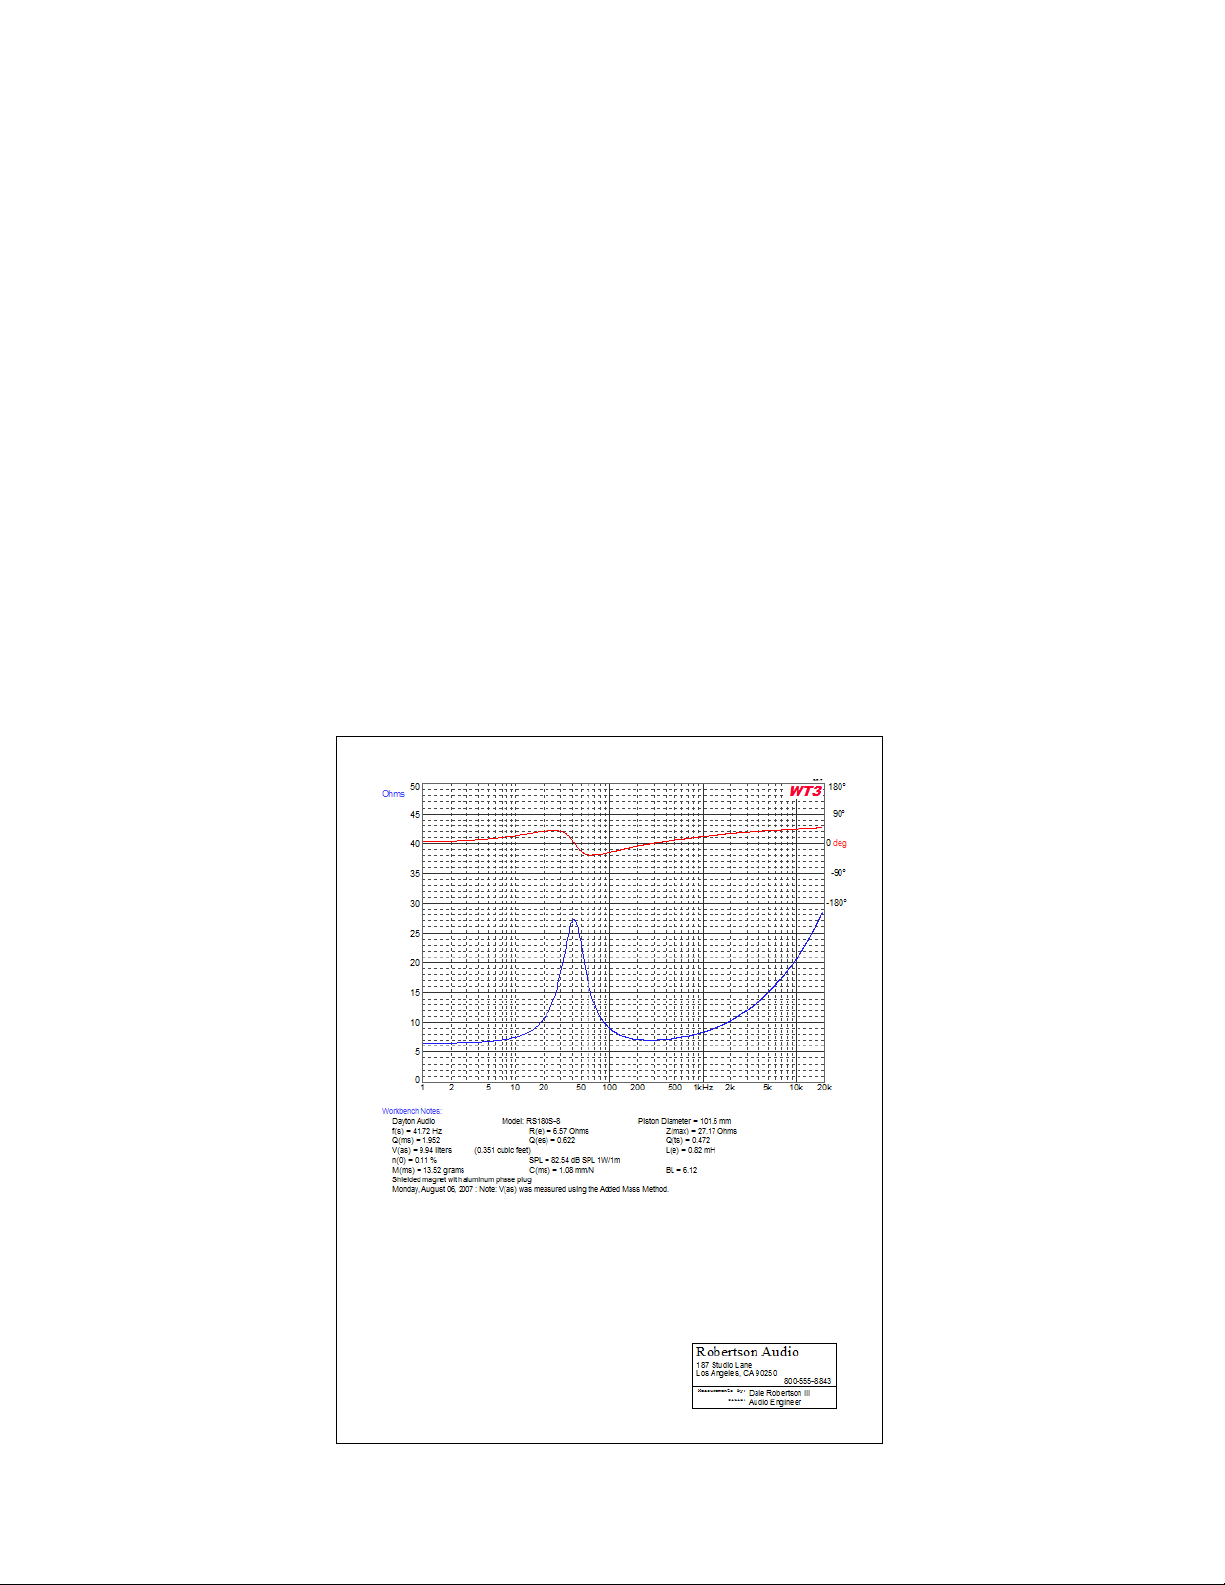
8) Click on the "Measure Free Air Parameters" button at the left of the WT3 window.
You should hear the sweep and then see the impedance response of the driver appear on the screen
similar to the figure below. Note that the driver's measured parameters are displayed in the Parameters
Bar at the right side of the screen. The Impedance Bar at the left side of the screen is where you can set
the upper impedance limit as well as the high and low frequency limits of the display.
Page 5
9) Measure the driver's V(as).
Once you have measured the driver's free air parameters the "Measure V(as)" button becomes enabled.
Select one of the three methods to measure the V(as). Then press the “Measure V(as)” button to start
the measurement procedure. The three V(as) measurement methods are:
Test Box Method
Added Mass Method
Specified SPL Method
10) After measuring the driver you can:
•
Save the data to one of 20 project memories.
•
Save your work to a WT3 test project file (file type .wt3) which includes your test setup
and all 20 memories.
•
Export the impedance and phase data in either .txt or .zma formats. Parameters are
included in the text notes.
•
Overlay plots of various measured impedances from the 20 memories for detailed
comparison.
•
Print a report showing the impedance plots and parameters of the displayed memories
(see below).
Page 6
Windows Vista - Additional Setup Requirements
PLEASE NOTE: STEP 2 IS CRITICAL FOR WINDOWS VISTA USERS!
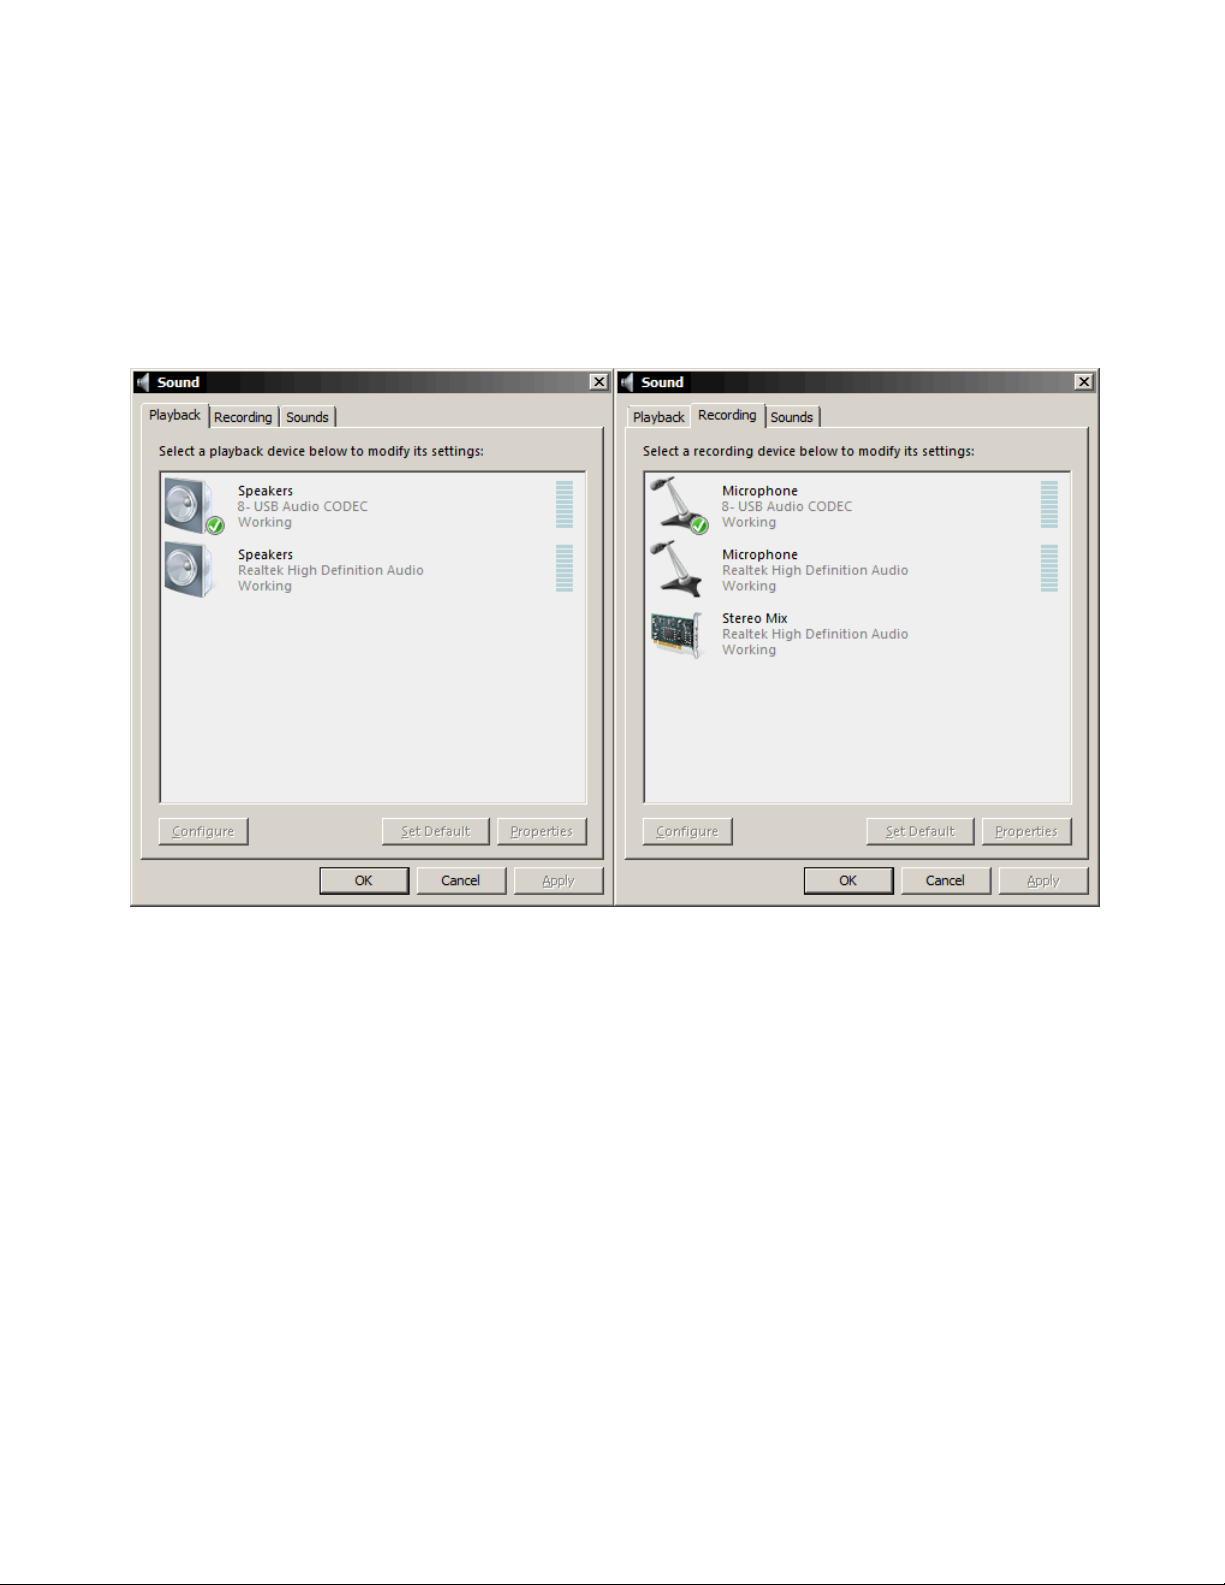
1. Go to the Windows Control Panel and open the “Sound” control panel. At the "Playback" tab make
sure that "USB Audio Codec" is selected as the default sound system for playback. (the icon should
appear with a green check mark as shown). If not, click on the "USB Audio Codec" and then click the
"Set Default" button below.
2. Change to the "Recording" tab at the top of the Sound control panel. As above, make sure that "USB
Audio Codec" is selected as the default sound system for recording (the icon should appear with a
green check mark as shown). If not, click on the "USB Audio Codec" selection and then click the "Set
Default" button below. The "USB Audio Codec" should now appear as the default selection. While at
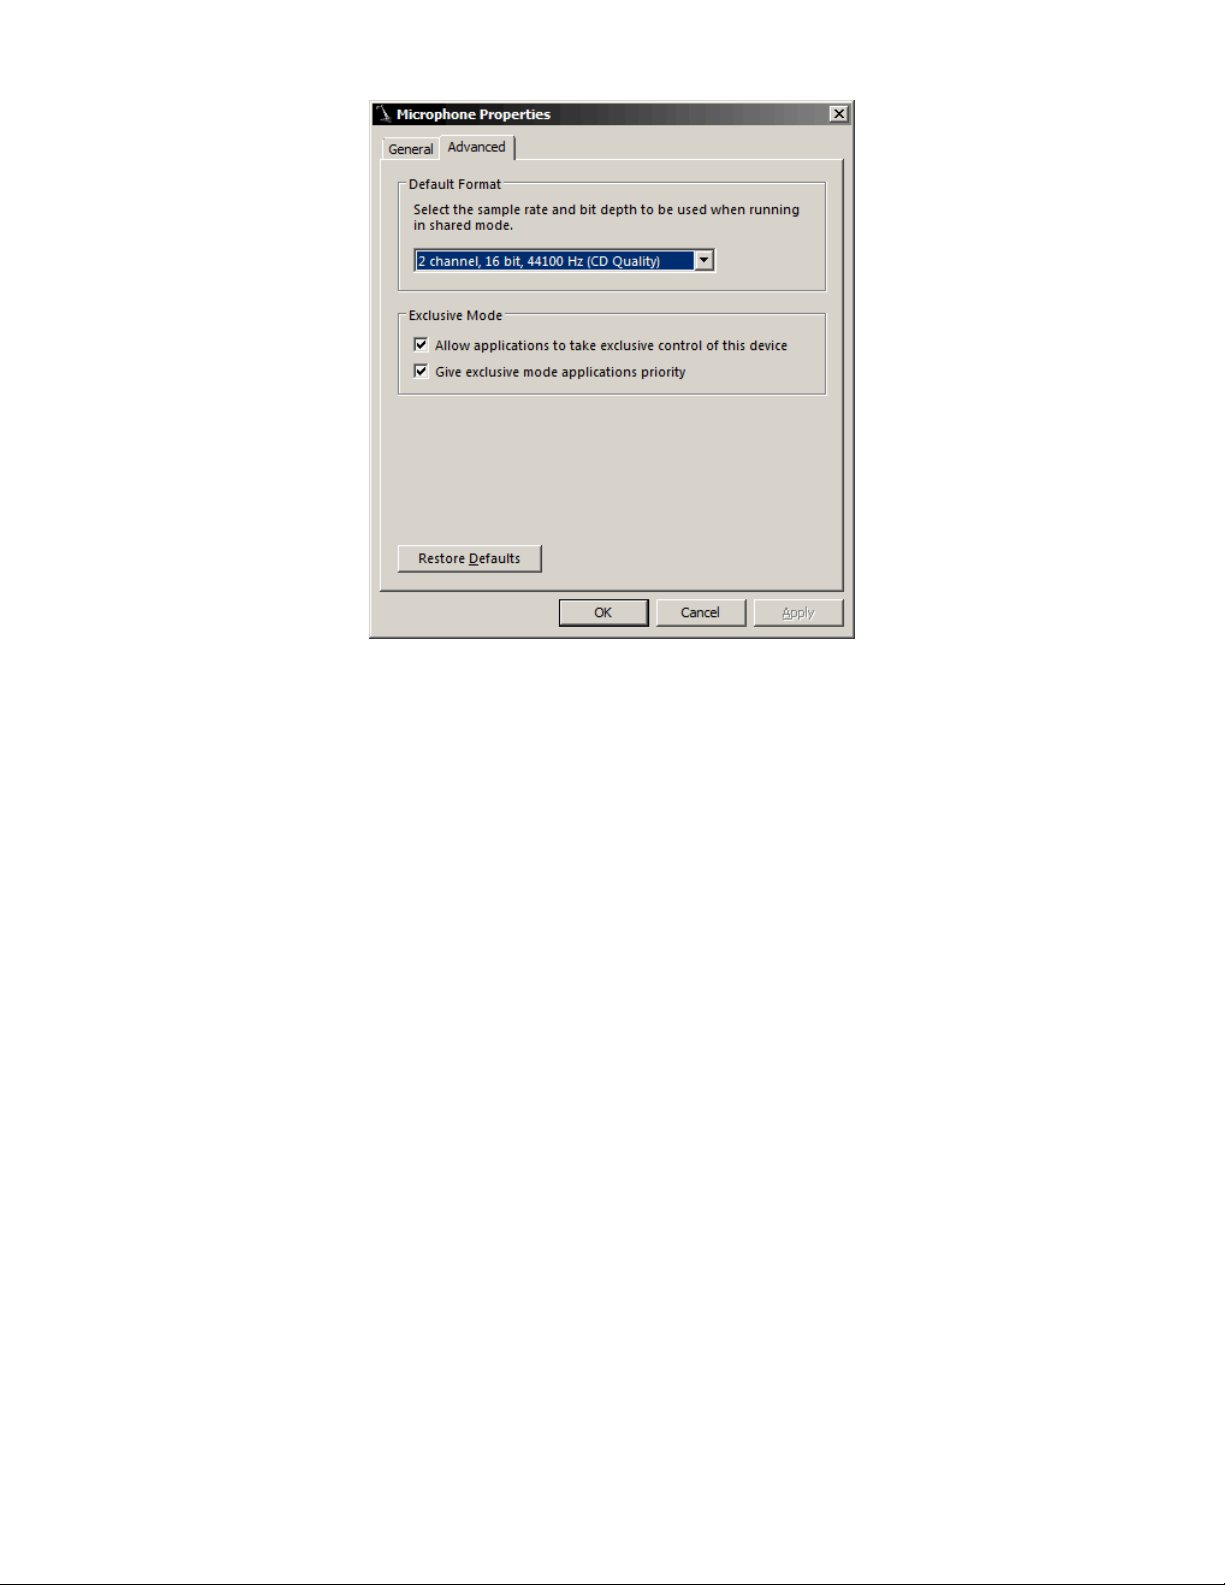
the "Recording" tab click on the "Properties" button and switch to the "Advanced" tab (shown below).
If not already selected, then select "2 channel, 16 bit, 44100 Hz (CD Quality)" from the list. Click
OK to set the recording format and close the dialog.
Page 7
3. Click OK to close the "Sound" control panel.
Note that this setup must be performed once for each USB port with which the WT3 unit will be used.
Also, when starting WT3, always click on the Speaker icon in the task bar and make sure the Windows
Volume Control is set at maximum.
Page 8

Introducing WT3
No other loudspeaker parameter measurement system is as fast or as easy to use as Dayton Audio’s
WT3. WT3 employs powerful new DSP measurement techniques to provide highly accurate
parameters in seconds. While previous generation woofer testers took around 6 minutes to measure 30
impedance points, the new WT3 measures over 30,000 data points in only a few seconds! Using a new
swept sine technique that is only available in WT3 the system achieves very accurate, high resolution
impedance measurements that allow the extraction of high quality driver parameters suitable for the
most critical loudspeaker design work. WT3 is designed to measure impedances in the range from
about 1 Ohm up to 5k Ohms; it operates over a frequency range from 1 Hz to 20k Hz. Within this
range of operation, and with proper calibration, the accuracy of WT3's impedance measurements is
typically within 1%.
The WT3 software is supplied on a CD. The software runs under Windows and provides an easy to use
interface that allows users to be up and running quickly. When the software is launched it opens with
an Untitled Project file. You can save as many as 20 impedance measurements per project and overlay
any or all of the measurements to create a custom report. Your personal notes are included with each
measurement. Operation of WT3 is very simple. Free air parameters are measured first, then V(as) can
be measured by one of three methods:
•
Test Box Method
•
Added Mass Method
•
Specified SPL Method
While the primary application for WT3 will be testing raw drivers in order to gather the speaker
parameters required for speaker design, loudspeaker designers can also use WT3 as follows:
•
Measure a Woofer's Parameters
•
Measure a Tweeter's Parameters
•
Measure a Resistor
•
Measure an Inductor
•
Evaluate a Closed Box Loudspeaker
•
Evaluate a Vented Box Loudspeaker
•
Evaluate a Complete Speaker System
•
Diagnose Loudspeaker Fault Conditions
•
Design a Zobel Network
The WT3 hardware consists of a compact USB interface unit with attached USB cable and alligator
clip leads. A precision resistor (1k Ohm 1%) is included for calibrating the unit.
Page 9
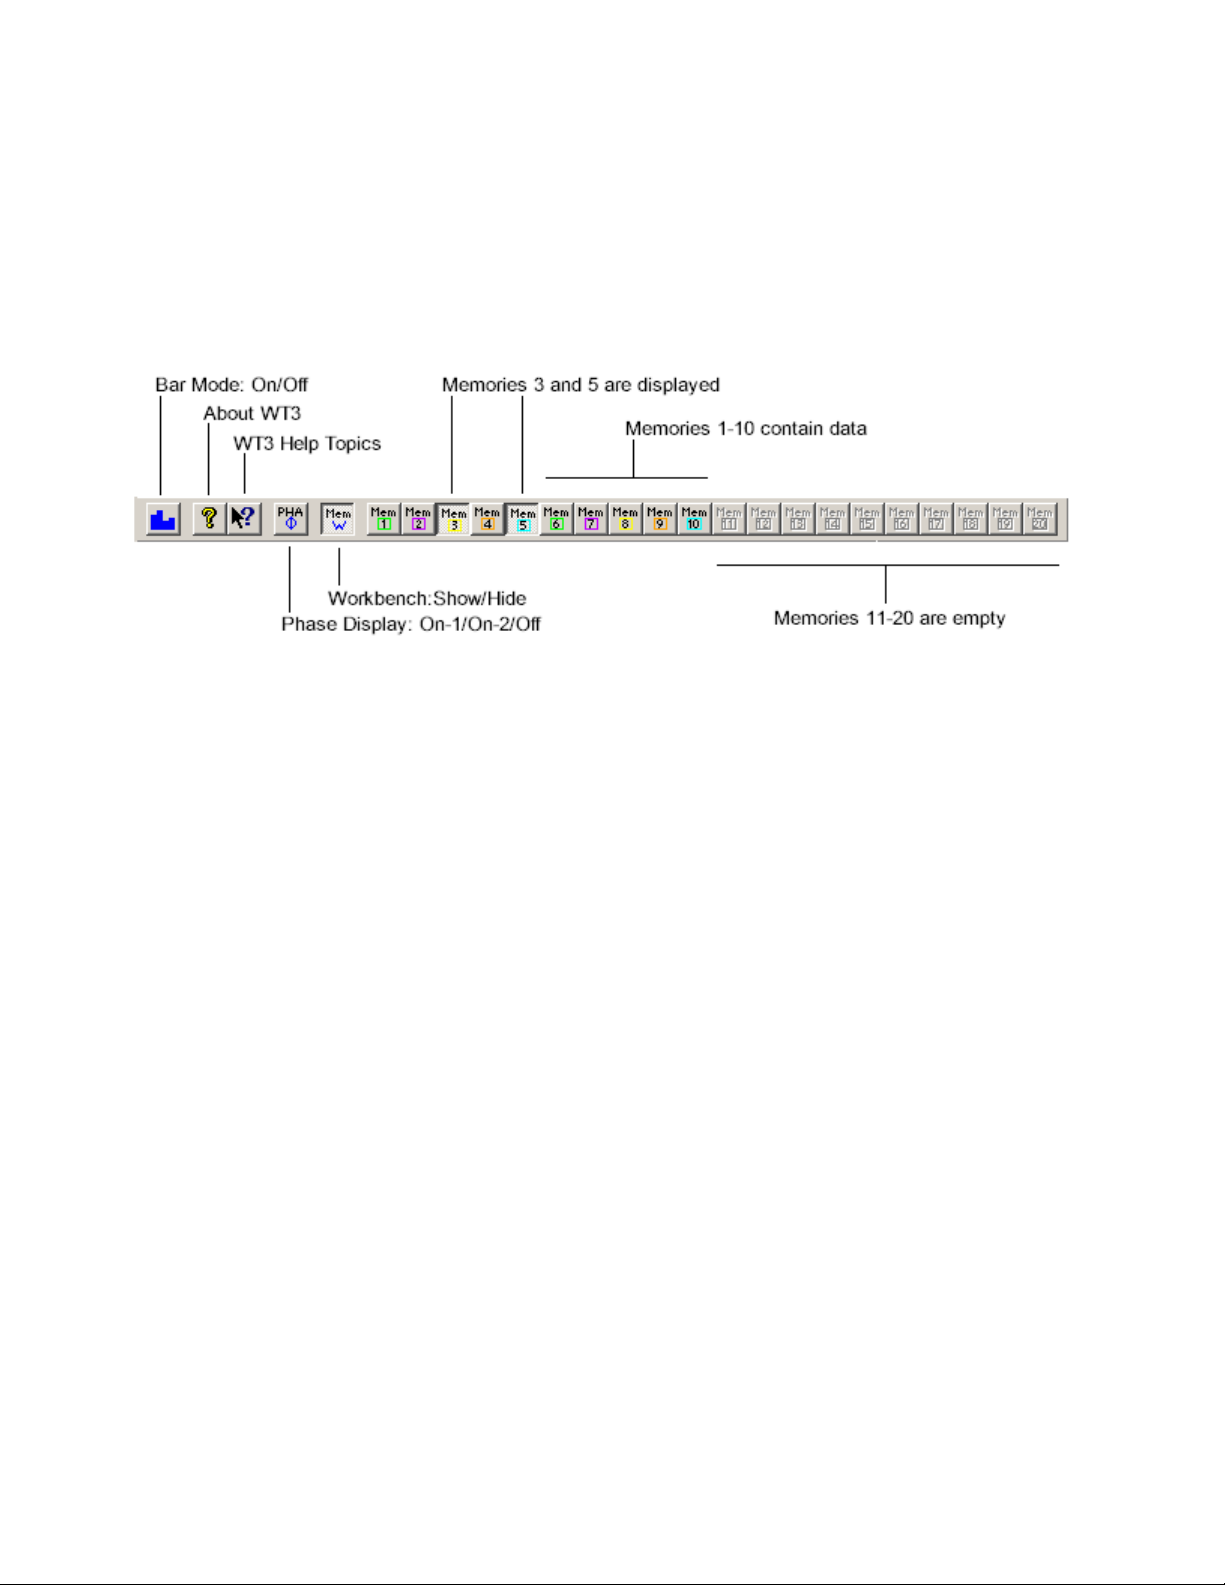
The WT3 Toolbar
The WT3 Toolbar provides easy access for many frequently used commands. Memory show and hide
operations are especially convenient with the toolbar. Note that empty memories are grayed out until
data is saved to them. Once they contain data they become enabled to switch between show and hide
modes.
Page 10

Using the WT3 Memories
The WT3 software features 20 user memories for saving your detailed measurements along with much
other user entered information about the driver. Each memory consists of the impedance and phase
plots, the test setup information (test box volume, added mass etc.) along with the three pages of
parameters, ,specifications and comments that are seen at the Driver Editor. When you save a WT3 file
(type ".wt3") to disc this measurement project file contains all the measurements in the projects 20
memories as well as the data currently on the Workbench.
Note: The most recently measured impedance plot is said to reside on the WT3 “Workbench.” This
measurement is overwritten each time the analyzer is run. The Workbench is also overwritten when a memory is
recalled or when data is imported. Once you have measured data you want to keep (even temporarily) save it to
one of the 20 memories before proceeding with another measurement. All data in the 20 memories is saved with
the WT3 project file. Multiple memories can be overlaid to allow for easy comparison of various measurements.
Use the memory buttons in the Toolbar to show or hide various memories. After a memory has been recalled it
can then be saved to a different memory. After a memory is recalled it is available to be exported to a .txt file.
All the commands related to memory operations can be found under the "View" menu. Here are the
details of the memory commands. Note that each command has a keyboard shortcut that you may find
more convenient than the menu command after you become familiar with the software.
View Menu: Save to Memory
These commands cause the plot on the Workbench to be saved to the selected Memory along with all
the driver parameters.
From the keyboard, use Alt+1, Alt+2 etc. through Alt+0 to save to memories 1 through 10. Use
Alt+Shift+1, 2 etc. through 0 to save to memories 10 through 20. For example, to save the current
response to Memory 5 you would press and hold the Alt key and then press the 5 key.
View Menu: Show/Hide Memory
These commands alternately show and hide the selected memory.
•
From the keyboard, use Ctrl+1, Ctrl+2 etc. through Ctrl+0 to show or hide memories
1 through 10
•
Use Ctrl+Shift+1, 2 etc. through Ctrl+Shift+0 to show or hide memories 10 through
20
For example, to toggle the display of the response in Memory 5 you would press and hold the Ctrl key
and then press the 5 key. Use Ctrl+W to toggle the display of the Workbench response. In addition to
the menu and keyboard commands, you can also toggle each memory on or off at the Memory
Toolbar.
Page 11
View Menu: Clear Memory
These commands erase the contents of the specified memory.
•
From the keyboard, use Ctrl+Alt+1, Ctrl+Alt+2 etc. through Ctrl+Alt+0 to clear the
contents of memories 1 through 10
•
Use Ctrl+Alt+Shift+1, 2 etc. through Ctrl+Alt+Shift+0 to clear the contents of
memories 10 through 20
For example, to erase the response in Memory 5 you would press and hold the Ctrl and Alt keys and
then press the 5 key. Should you need to clear all of the memories it is usually easier to just create a
new project file by selecting "New" under the "File" menu.
View Menu: Hide All Memories (Ctrl+E)
This command turns off the display of all memories without affecting the contents of the memories.
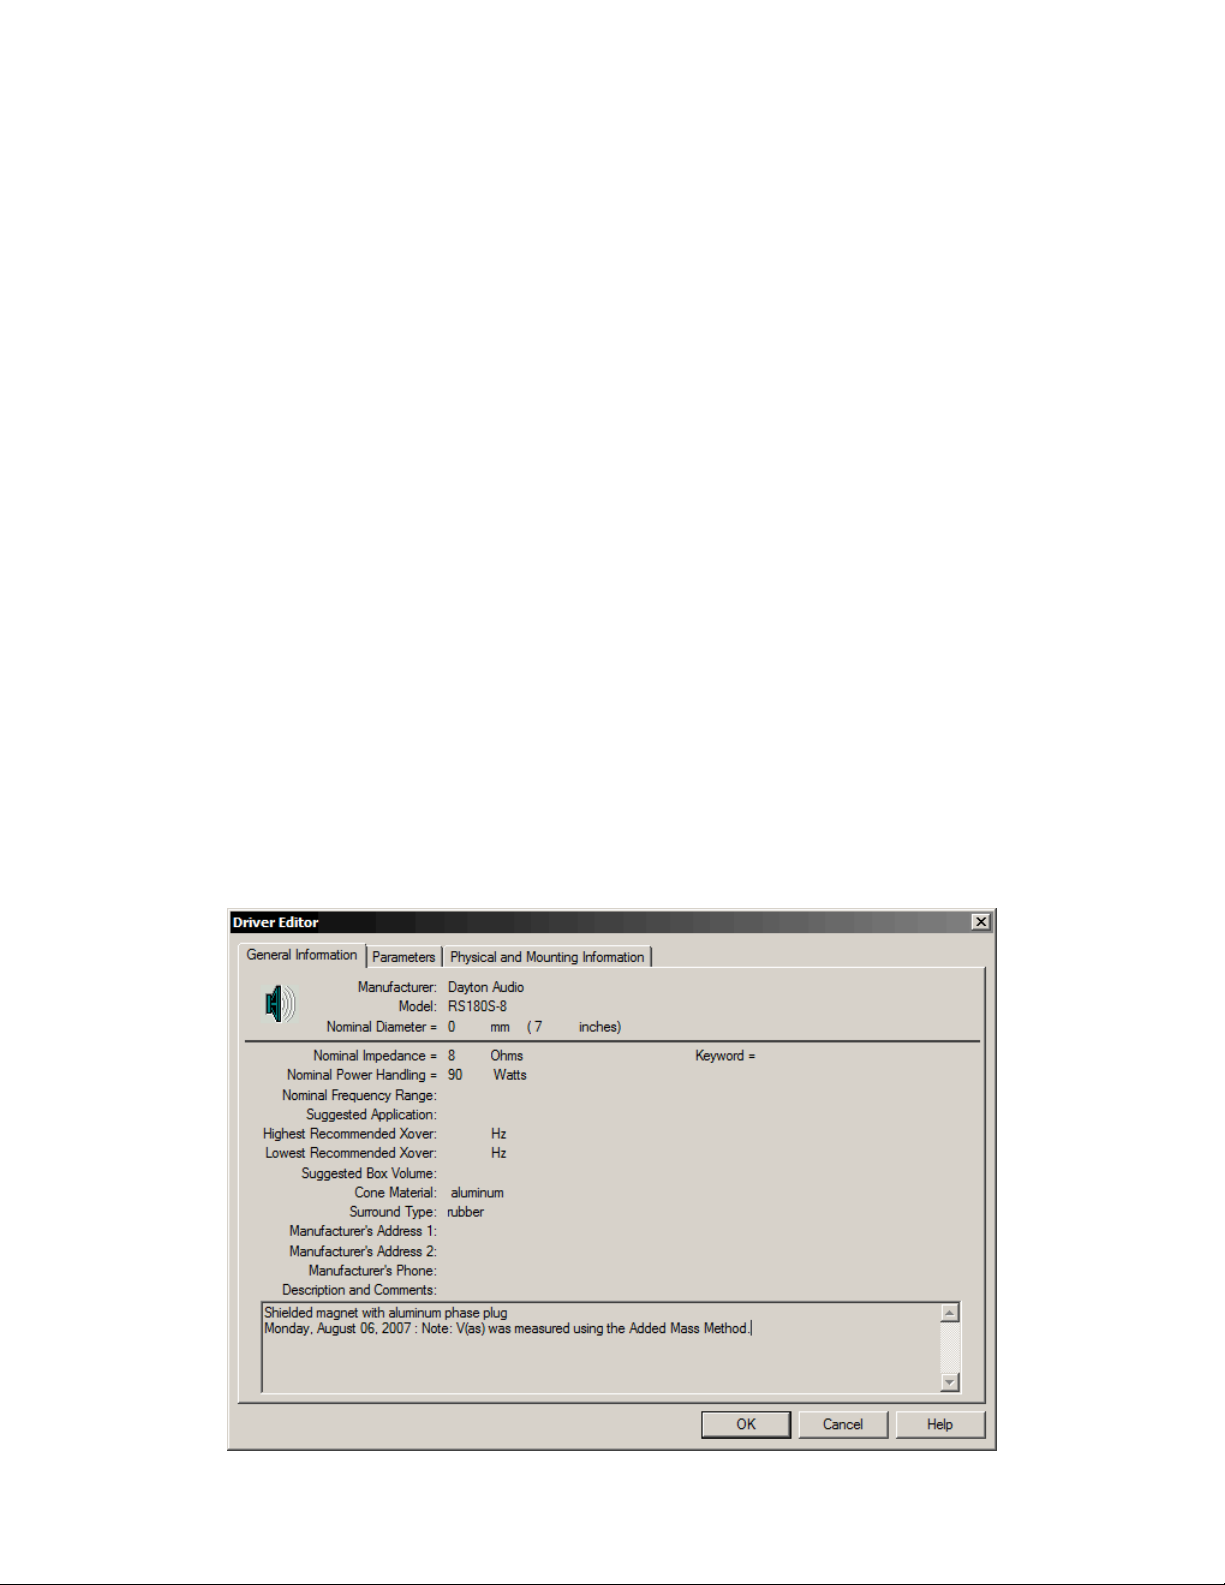
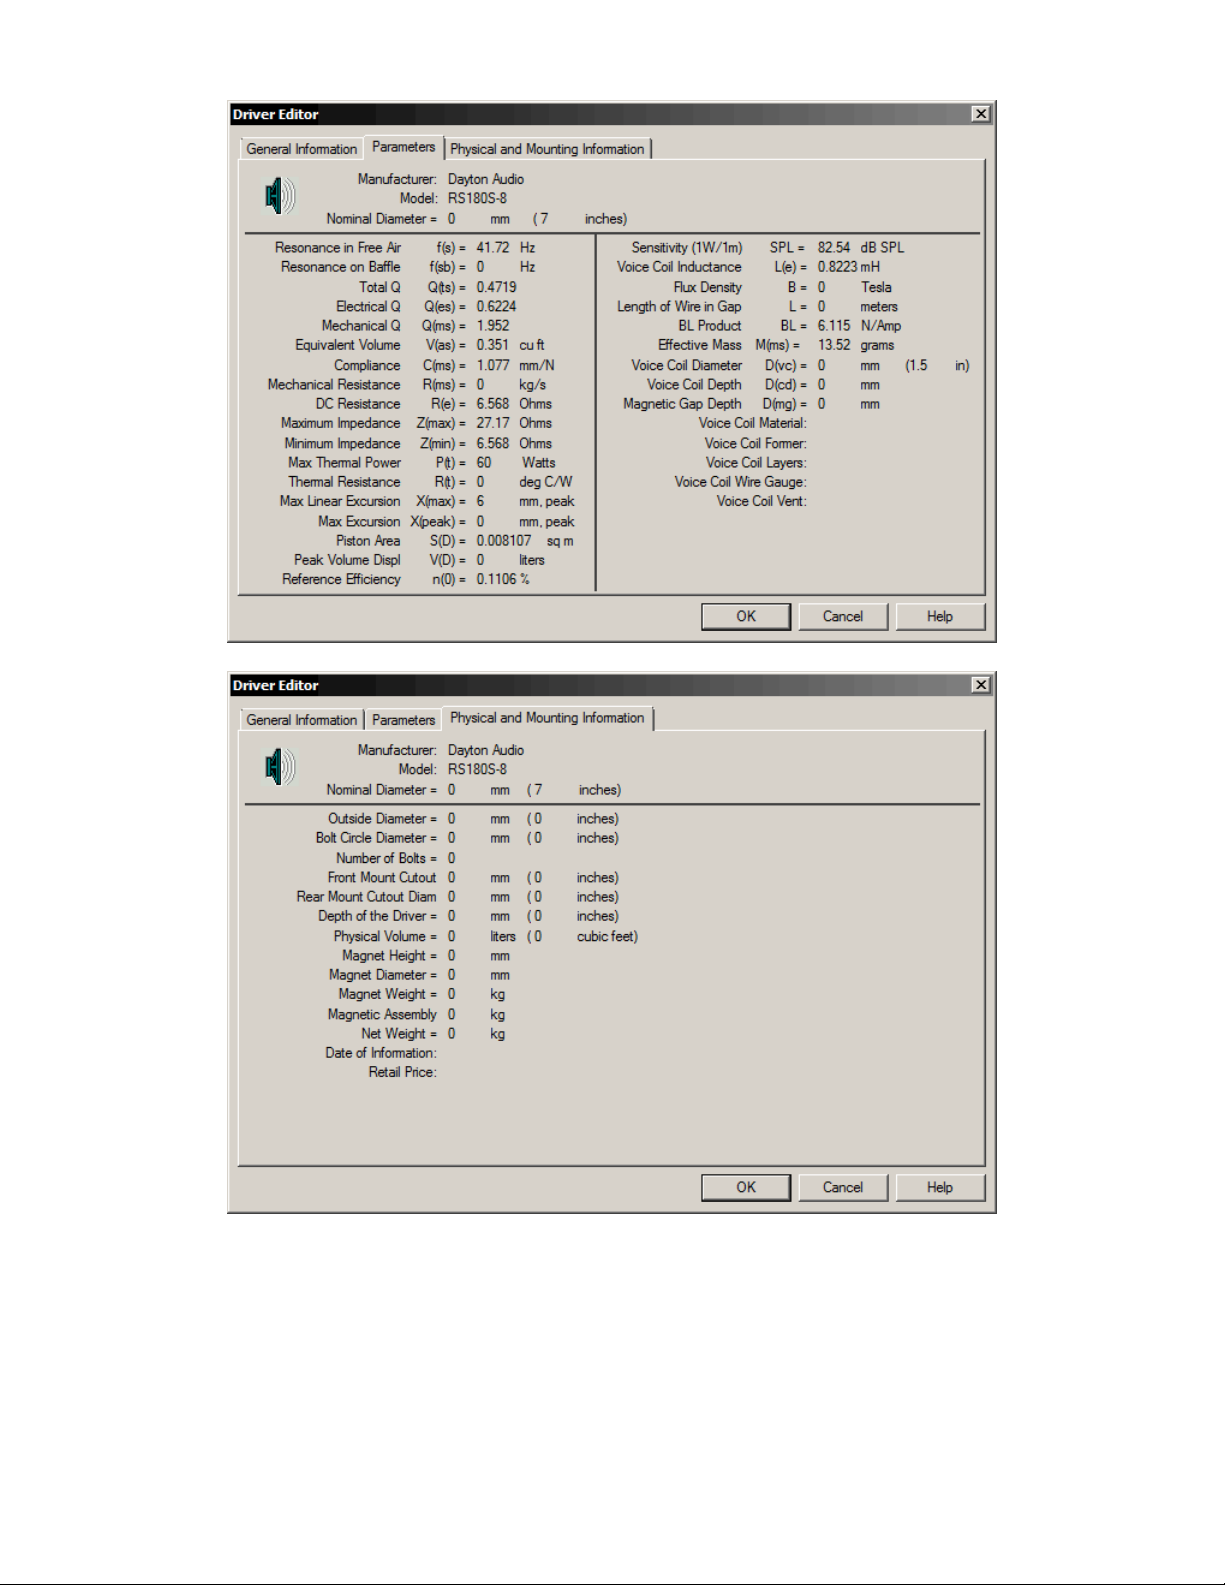
Below are sample screen shots of the three Driver Editor pages. While the WT3 system measures
many of the parameters detailed on the second page the remainder of the data, such as the driver's
manufacturer and model number, may be entered by the user to create a more complete record on the
driver under test. You can add any notes you wish at the Comments field and your notes will be saved
when you save the Workbench to a memory. When you recall a memory to the Workbench your notes
will be displayed at both the driver editor General Information page and in the Notes field below the
plot window. Entering a line or two of descriptive information before saving data to one of the 20
memories makes it easy to keep track of the multiple measurements that make up each WT3 project
file.
Page 12
Page 13

Frequently Asked Questions about WT3
Q: Why do I have to wait 90 seconds for the WT3 hardware to warm up?
A: The initial 90 second waiting period delay is required in order for the hardware power supplies to
ramp up and stabilize. To perform precision measurements down to 1 Hz very wide low frequency
bandwidth is required.
Q: My WT3 was working fine but it seems to have stopped working correctly. What might have
happened?
A: The Windows Volume control settings may have been changed (reduced) when the hardware unit
was connected or disconnected. Open the Windows audio mixer by double-clicking on the speaker
icon in the task bar. Make sure that both the "Master" volume and the "Wave" signal are set to
maximum. The "Wave" signal must be panned to center and the audio must not be muted.
Note that it is possible to upset the DC balance of the unit momentarily should a test lead be
accidentally grounded or come in contact with any stray electrical charge. This may result in erratic
measurements until the system stabilizes again (this can take up to 90 seconds). Remember, never
connect the WT3 to a speaker that is connected to any other equipment or damage to the WT3 unit
could result.
Q: The title block is empty on my printed reports. How do I enter my info?
A: Go to Help > User Information to open the User Information dialog. The information you enter here
will appear in the title block of your printed reports.
Q: How accurate is WT3?
A: Because the speaker parameters are extracted from the impedance data they can only be as accurate
as the impedance measurement itself. When calibrated WT3 provides measurements below 1000 Ohms
and above 1 Ohm that are typically accurate to better than ± 1 %.
Page 14

Removing WT3 from your Computer
You can easily remove WT3 from your computer’s hard drive if needed.
•
Go to the control panel and double click on the “Add/Remove Programs” icon
•
When the Add/Remove dialog appears, locate WT3 in the list
•
Select WT3 and then click on the Add/Remove button
•
When you are asked “Are you sure you want to completely remove the selected application and
all of its components?” select “Yes”
WT3 will be removed from your computer.
Page 15
File Menu
The commands under the File menu are as follows:
ew (Ctrl+)
Clears all current data to create a new empty WT3 project file. Each project file holds up to 20
measurements in individual memories. The memories can be displayed or hidden by clicking the
corresponding memory buttons on the toolbar.
Open… (Ctrl+O)
Opens a WT3 project file (.wt3) which you have previously saved to disc. Note that WT3 can be
launched and a project .wt3 file opened from the desktop by double-clicking on the file icon. Project
files can also be opened by dragging and dropping them onto the open application window.
Save (Ctrl+S)
Saves a WT3 project file to disc with the .wt3 filename extension. A single .wt3 file can contain up to
20 memories of data and notes in addition to the immediate data and notes on the Workbench. Project
files also contain complete test setup information so that opening a saved project file restores the test
setup that was in place when the project file was saved. This includes such settings as the Impedance
and Frequency plot limits. In addition, a large number of measurement setup variables are saved within
each project file.
Save As…
Brings up a save as file dialog which allows you to save the current project file under a different name
or to a different location on your system.
Page 16

Import Impedance Data…
Opens a file dialog to select a .txt (or .zma) file containing data to be imported to the Workbench.
Within the .txt file each data point must be on a single line in the format: “Frequency Impedance
Phase” with the frequency, impedance and phase data separated by a tab or spaces. When the file is
opened the data is imported to the WT3 Workbench, interpolated via a powerful cubic spline routine
and then plotted on the screen. Note that imported phase data must be in degrees. A minimum of two
data points are required. Data below 1 Hz will be ignored.
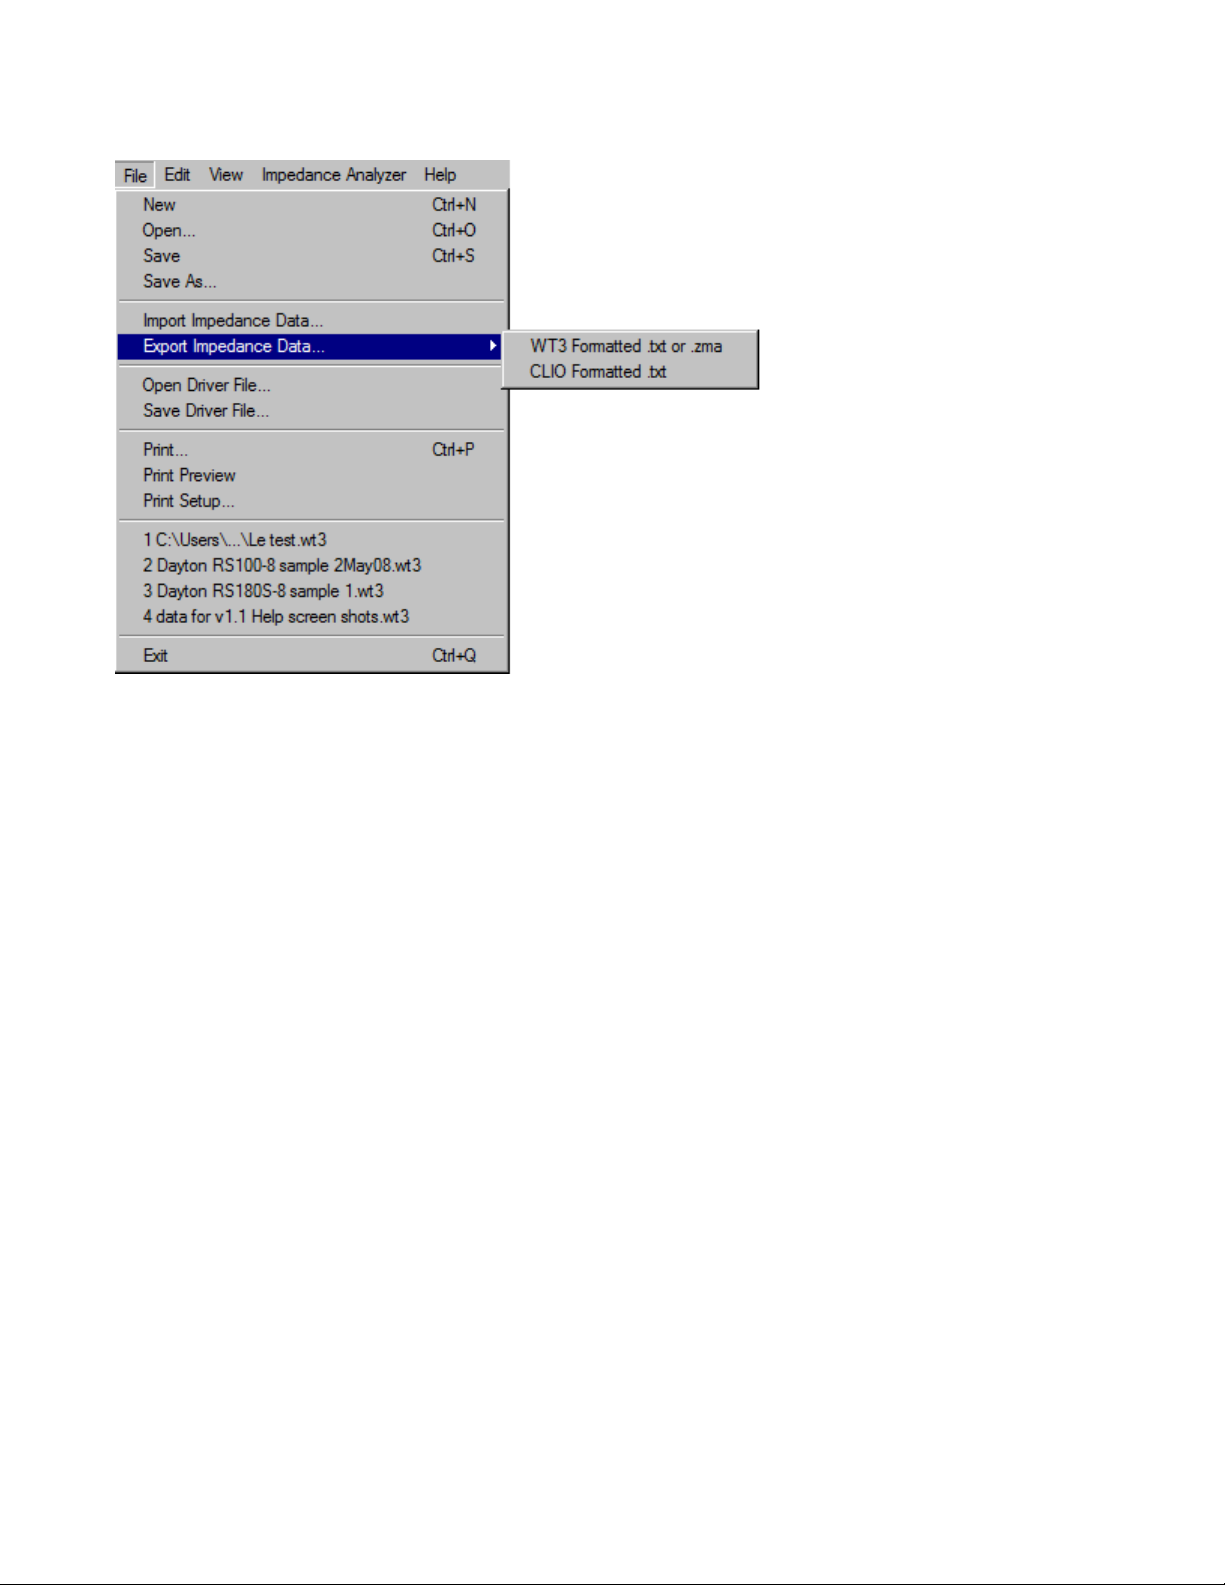
Export Impedance Data…
Exports the response on the workbench to a .txt (or .zma) file for use with other applications. Each
frequency and its impedance magnitude and phase are listed on a single line separated by tabs. The full
frequency range from 1 Hz up to F(s)/2 is exported. Note that exported phase data is in degrees. A text
header is included which contains details on the extracted driver parameters. Data can also be exported
in a format similar to data exported from CLIO. This allows importing driver parameters into
loudspeaker simulation software such as Bass Box .
Open Driver File…
This opens a file dialog which allows you to select a WinSpeakerz individual driver file (.dvr) to open
to the WT3 Workbench. This is useful for exchanging data with WinSpeakerz (loudspeaker simulation
software available separately from True Audio). Driver files contain only the Driver Editor data, no
impedance plot data is contained in these files.
Save Driver File …
Brings up a "save file" dialog which allows you to save the data and notes currently on the Workbench
to a WinSpeakerz individual driver (.dvr) file. Driver files are saved with the .dvr filename extension.
You can use individual driver files to exchange data with WinSpeakerz (available separately from True
Audio).
Print… (Ctrl+P)
Brings up a print dialog box and prints a report based on the currently displayed memories. The report
shows all of the currently displayed memories. You can print in either Portrait or Landscape mode and
the report will adapt to the shape. The use of color and other preferences can be set at the menu: Edit/
Preferences.
Print Preview
Shows an on-screen preview of what the printed page will look like..
Print Setup…
This command displays the printer setup dialog to allow you to select the printer, paper and page
orientation. Printing in portrait orientation provides space for the most printed notes, while printing in
landscape orientation provides a larger printed plot with less space for notes.
Page 17

Recent Files...
A list of recently used files is displayed for easy access.
Exit (Ctrl+Q)
Exits the application. The keyboard shortcut is very convenient.
Page 18

Edit Menu
The commands under the Edit menu are as follows:
Undo (Ctrl+Z)
Undo is not implemented
Cut (Ctrl+X)
Cut is implemented for various text fields. Text is cut and placed on the clipboard for pasting to
another location if desired
Copy (Ctrl+C)
Copy is implemented for various text fields. Copied text is placed on the clipboard for pasting to
another location
Paste (Ctrl+V)
Paste is implemented for various text fields. Use this command to paste text that has been placed on
the clipboard
Open the Driver Editor (Ctrl+D)
Opens the Driver Editor for access to a fully detailed set of driver data. Besides the measured driver
parameters there are fields for you to enter as much additional data as you wish. Each of the 20
memories in a project file holds its own complete set of driver data. When you save a driver file the
complete set of data is saved to a .dvr file which can be opened by the popular loudspeaker design
program WinSpeakerz. Similarly, individual driver files saved by WinSpeakerz can be opened in WT3.
Page 19

Preferences
This command opens the Preferences Dialog (shown below) where you can change various printing,
measurement and display settings
Plots can be switched between fine and bold lines separately for display and printing. You can select
metric units separately for Volumes and other units. Auto Ranging is normally on but can be switched
off for those occasions where you need a different fixed scale for repeat measurements. An initial
"connect the driver" dialog can be enabled for production testing. A preference can be set to measure
L(e) at either 1 kHz or 10 kHz. Measurement at 1 kHz is recommended for general use except when
measuring inductors less than 0.5 mH or drivers smaller than 6 inches in diameter where measurement
at 10 kHz is likely to be more representative.
Page 20

View Menu
The commands under the View menu are as follows:
Toolbar
Select the Toolbar command to alternately hide or show the toolbar.
Status Bar
Select the Status Bar command to alternately hide or show the status bar at the bottom of the main
page. The Status Bar displays information for menu items and buttons. The Status Bar also shows
who's parameters are currently displayed.
Show Phase Response
The Phase Response has three different display modes: Off, On (located center screen) and On (located
at top half). The display rotates through these three states as the menu (or tool bar) command is
selected. The phase range is always +180 degrees to -180 degrees but the scale division varies with the
selected impedance range (in order to use the same grid lines as impedance).
Grid in Front
Displays the grid in front of data on the main screen in order to facilitate reading precise signal levels.
Normally the grid is displayed behind the data.
Background Color
Selects the background color for the main screen. The trace and grid colors also change with each
background color. Choices are: Black, White, Green, Light Gray and Dark Gray.
Save to Memory
These commands cause the plot on the Workbench to be saved to the selected Memory along with all
the driver parameters.
Page 21

From the keyboard, use Alt+1, Alt+2 etc. through Alt+0 to save to memories 1 through 10. Use
Alt+Shift+1, 2 etc. through 0 to save to memories 10 through 20. For example, to save the current
response to Memory 5 you would press and hold the Alt key and then press the 5 key.
Note: The most recently measured impedance plot is said to reside on the WT3 “Workbench.” This
measurement is overwritten each time the analyzer is run. The Workbench is also overwritten when a memory is
recalled or when data is imported. Once you have measured data you want to keep (even temporarily) save it to
one of the 20 memories before proceeding with another measurement. All data in the 20 memories is saved with
the WT3 project file. Multiple memories can be overlaid to allow for easy comparison of various measurements.
Use the memory buttons in the Toolbar to show or hide various memories. After a memory has been recalled it
can then be saved to a different memory. After a memory is recalled it is available to be exported to a .txt file.
Show/Hide Memory
These commands alternately show and hide the selected memory.
•
From the keyboard, use Ctrl+1, Ctrl+2 etc. through Ctrl+0 to show or hide memories
1 through 10
•
Use Ctrl+Shift+1, 2 etc. through Ctrl+Shift+0 to show or hide memories 10 through
20
For example, to toggle the display of the response in Memory 5 you would press and hold the Ctrl key
and then press the 5 key. Use Ctrl+W to toggle the display of the Workbench response. In addition to
the menu and keyboard commands, you can also toggle each memory on or off at the Memory
Toolbar.
Clear Memory
These commands erase the contents of the specified memory.
•
From the keyboard, use Ctrl+Alt+1, Ctrl+Alt+2 etc. through Ctrl+Alt+0 to clear the
contents of memories 1 through 10
•
Use Ctrl+Alt+Shift+1, 2 etc. through Ctrl+Alt+Shift+0 to clear the contents of
memories 10 through 20
For example, to erase the response in Memory 5 you would press and hold the Ctrl and Alt keys and
then press the 5 key. Should you need to clear all of the memories it is usually easier to just create a
new project file by selecting "New" under the "File" menu.
Hide All Memories (Ctrl+E)
This command turns off the display of all memories without affecting the contents of the memories.
Page 22

Impedance Analyzer Menu
The Impedance Analyzer Menu contains commands for running measurements and for performing
calibration of the test lead resistance and master calibration as follows:
Measure Free Air Parameters
This command causes WT3 to run an impedance sweep and then extract the driver's free air
parameters. You can also use this command to measure resistor and inductor values. Measuring a
resistor should result in a flat impedance plot indicating the resistance is the same across the audio
frequency band. R(e) is the measured resistance value. The measured resistance can also be read
directly from the plot. When measuring an inductor, the plot will rise at high frequencies and L(e)
indicates the measured inductance value. You can also execute the Free Air Parameters command by
clicking the same named button at the Impedance Bar at the left side of the main window.
Measure V(as) by the Selected Method
Before any measurements are made this command is disabled (grayed out). After making a free air
measurement this command becomes enabled and can be used to measure the V(as) of a driver by any
of three methods. The V(as) test method is selected at the Parameters Bar at the right side of the main
window. You can also Measure V(as) by clicking the same named button at the Impedance Bar at the
left side of the main window. The three methods are: Test Box, Added Mass and Specified SPL.
•
Test Box: This method is probably the most widely used and trusted. For this method
you will need a test speaker enclosure of suitable size for the driver being tested
•
Added Mass: Although the added mass method can employ added mass in the simple
form of coins added to the cone it is best to make sure the added mass actually adheres
to the cone so that it moves with the cone at all times. If the mass "decouples" as the
cone moves then accuracy will be compromised. Use an added mass that will shift the
F(s) lower by about 25-50%. An added mass equal to the driver's Mms is just about
right. WT3 will warn you if the shift in the measured F(s) is not within the above
recommended range.
Some items used for added mass include: coins, modeling clay, carpenters putty, rope caulk, tape rolls.
In general you should measure the weight of the added mass accurate to 1/10th of a gram. In a pinch,
US coins can provide an easy source of standard weights. One US nickel ($.05) weighs 5.0 grams.
•
Specified SPL: This is the simplest V(as) method as it requires no test box or added
masses. It is also probably the least accurate as it depends strongly on the accuracy of
the SPL you specify.
Page 23

Impedance Sweep
Use this command to perform a simple impedance sweep without the extraction of any parameters.
Driver parameters will be cleared to prevent any confusion.
Impedance Calibration...
When first installed, WT3 is calibrated to within about 2% for the impedance range under 100 Ohms.
This is adequate for measuring driver parameters. For even finer calibration you can use this command
to custom calibrate the system for your particular WT3 hardware unit. When you select this command
the impedance calibration dialog (shown below) will open.
Enter the actual value of the calibration resistor you are using (if different from the recommended 1k
Ohms). Then, connect the calibration resistor to the WT3 test leads and click OK. The software will
measure the calibration resistor and adjust its internal calibration accordingly. After calibration, you
might want to make another measurement of the calibration resistor to confirm the new calibration. By
design, WT3 is most accurate in the lower impedance range with accuracy decreasing at higher
impedances (above 1k Ohms). Calibration in the lower impedance range will typically be improved to
within 1% following calibration at 1k Ohms with the 1% resistor included with the unit. You can
actually calibrate the unit with any convenient resistor in the range from about 500 to 2k Ohms. It is
important that the actual value of the resistor be known to within 1%. High quality digital multi-meters
will often be able to measure any resistor to within 1%.
When you exit the application the new calibration will be remembered for your next session.
Impedance calibration only needs to be performed one time after the software is installed on a PC.
Page 24

Test Leads Calibration...
When the software is first installed the default test lead impedance is 0.3 Ohms which is typical of the
units. Use this command to refine the test lead calibration for your WT3 unit. Shown below is the test
leads calibration dialog. Just short the test leads and click OK. The software will measure the test lead
resistance and adjust the internal calibration. When you exit the application the new test lead
calibration will be remembered for your next session.
Page 25

Help Menu
The commands under the Help menu are as follows:
Help Topics
The complete WT3 User’s Guide can be found under the Help menu > Help Topics.
User Information
Enter your personal information in this window. This is the information that will display at the Splash
Screen and in the title block of your printed reports.
About WT3
Displays the WT3 version number, copyright and user information.
Page 26

Using WT3 to Measure a Woofer's Parameters
The basic steps to measure a driver's parameters are as follows. Before starting, be sure the unit has
been calibrated.
•
Start by connecting the WT3 hardware unit to a USB port on your PC.
•
Next, launch the WT3 software.
•
Make sure that the woofer is not connected to any other equipment and then connect the test
leads of the WT3 unit to the terminals of the speaker under test.
•
Raise the Windows volume control to maximum.
•
Click the "Measure Free Air Parameters" button at the left side of the WT3 screen.
•
You should hear the sweep from the speaker, the impedance is plotted and the parameters are
displayed.
•
Select a method to measure V(as), enter the required data and click on the "Measure V(as)"
button.
After measuring a speaker you may want to enter additional information (say, the manufacturer and
model of the speaker) at the Driver Editor. Then save the measurement to an empty memory. As an
example, the keyboard sequence "Alt + 1" saves new data to memory 1.
Here is a typical measurement result:
Page 27

Using WT3 to Measure a Tweeter's Parameters
A typical sealed back moving coil tweeter operates as a very small closed box system and therefore
can be characterized by it's closed box resonance and Q, F(sc) and Q(tc). You can use WT3 to measure
both of these parameters for tweeters as well as woofers and midranges. The frequency response of a
tweeter is the same as that of a purely electrical second order high-pass filter with the same electrical
resonance frequency and Q as the tweeter's electro-acoustic resonance and Q. While the resonance
frequency determines the low frequency bandwidth of the tweeter, the Q(tc) determines the shape of
the response in the corner region with Q = .707 corresponding to a maximally flat Butterworth
response.
The impedance response of a tweeter operating as a closed box loudspeaker has a single well defined
peak at the tweeter's primary resonance frequency at the low end of the tweeter's operating range.
Before starting, make sure the WT3 unit has been calibrated and has stabilized for at least 90 seconds.
Measure the tweeter's impedance as follows:
•
Launch the WT3 software and make sure the volume is at maximum.
•
Under the Edit menu select Preferences and set the L(e) Measurement Frequency to 10 kHz.
•
Make sure that the tweeter is not connected to any other equipment and then connect the test
leads of the WT3 unit to the tweeter under test.
•
Click the "Measure Free Air Parameters" button at the left side of the WT3 screen.
•
You should hear the sweep from the tweeter, the impedance is plotted and the parameters are
displayed.
•
The tweeter's equivalent closed box resonance frequency, F(sc) is displayed in the F(s) data
field.
•
The tweeter's equivalent closed box total Q, Q(tc) is displayed in the Q(ts) field.
•
Save the equivalent closed box data to a memory for future reference.
•
The DC resistance of the tweeter is displayed in the R(e) field. Ignore all other parameters.
•
Repeat the measurement to confirm the result. Repeated measurements should be in good
agreement.
Page 28

Here is a typical result when measuring a tweeter:
We can read the tweeter's resonance frequency, F(s) (or, more strictly F(sc)), directly from the
impedance plot or note the value at the Measured Parameters F(s) field. Just as with a closed box, the
system's Q(tc) is read from the Q(ts) field. Similarly for the electrical and mechanical Q's. The above
tweeter is seen to have a resonance of 1.848 kHz and Q(tc) of .5067.
Page 29

Using WT3 to Measure a Resistor
Before starting, make sure the WT3 unit has been calibrated and has stabilized for at least 90 seconds.
Measure the value of a resistor as follows:
•
Launch the WT3 software and make sure the volume is set at maximum.
•
Make sure that the resistor is not connected to any other equipment and then connect the test
leads of the WT3 unit to the resistor under test.
•
Click the "Measure Free-Air Parameters" button at the left side of the WT3 screen.
•
The sweep is silent, then the impedance is plotted and the parameters are displayed.
•
Read the value of the resistor in the R(e) field at the right side of the screen. Ignore the other
parameter fields.
•
Repeat the measurement to confirm the result. Repeat measurements should be in good
agreement.
Here is a typical result when measuring a 10 Ohm resistor:
An ideal resistor would have a perfectly flat impedance response at exactly the rated value of the
resistor. Notice that the measured impedance (shown above in blue) of this 10 Ohm precision resistor
is almost perfectly flat over the audio frequency range. This is not unusual for a resistor because real
resistors typically do behave largely as ideal resistors. The impedance phase response is essentially flat
Page 30

at 0 degrees except for a slight rise at the high frequency limit. Here the measured value of 9.998
Ohms is seen to closely match the resistor's specified value of 10 Ohms +/- 0.1%.
At full playback volume the "noise" on the measurement is usually only one or two pixels as seen
above. Higher noise levels can indicate that the test signal level was low and should be raised.
Page 31

Using WT3 to Measure an Inductor
Before starting, make sure the WT3 unit has been calibrated and has stabilized for at least 90 seconds.
Measure the value of an inductor as follows:
•
Launch the WT3 software and make sure the volume is set at maximum.
•
Make sure that the inductor is not connected to any other equipment and then connect the test
leads of the WT3 unit to the inductor under test.
•
Click the "Measure Free-Air Parameters" button at the left side of the WT3 screen.
•
The sweep is silent, then the impedance is plotted and the parameters are displayed.
•
Read the value of the inductor in the L(e) field at the right side of the screen. The DC resistance
of the inductor is displayed in the R(e) field. Ignore all other parameters.
•
Repeat the measurement to confirm the result. Repeat measurements should be in good
agreement.
Here is a typical result when measuring a 1.0 mH inductor:
An ideal inductor would have an impedance of zero Ohms at the lowest frequencies and then the
impedance would rise with increasing frequency. The phase response of the inductance depends on the
exact circuit in which the inductor finds itself. At very low frequencies (1 Hz) the impedance
measurement reveals the DC resistance of the inductor. Notice that the impedance (blue) of the real
inductor measured above is near zero at low frequencies and rises at high frequencies as expected. The
Page 32

phase response (red) is seen to be near zero degrees at low frequencies and increases to 90 degrees at
high frequencies as expected for the simple (R-L) test circuit. The measured value of 0.9893 mH is in
good agreement with the inductor's nominal 1.0 mH rating. At 0.2422 Ohms the inductor's DC
resistance is nicely low as required for use in a passive crossover. Note that WT3 can measure
inductance at either 1kHz or 10 kHz based on the selection at the Preferences dialog. Measurement at
1 kHz is recommended for general use except when measuring inductors less than 0.5 mH or drivers
smaller than 6 inches in diameter where measurement at 10 kHz is likely to be more representative.
Page 33

Using WT3 to Evaluate a Closed Box Loudspeaker
A closed box type of loudspeaker system is characterized by a resonance frequency F(sc), an electrical
Q value Q(ec), a mechanical Q value Q(mc) and a total Q value Q(tc). Just as you can use WT3 to
measure a driver's parameters you can also use WT3 to measure the corresponding parameters of a
closed box loudspeaker system. The frequency response of a closed box speaker is the same as that of
a purely electrical second order high-pass filter with the same electrical resonance frequency and Q as
the loudspeaker's electro-acoustic resonance and Q. While the resonance frequency determines the low
frequency bandwidth of the system, the Q(tc) determines the shape of the high-pass response in the
corner region with Q = .707 corresponding to a maximally flat Butterworth response.
The impedance response of a closed box loudspeaker has a single well defined peak at the system's
primary resonance frequency. Compared to the same driver in free air, the resonance frequency will
always be seen to increase when a driver is mounted on a closed box enclosure. The larger the
enclosure the less the resonance frequency is increased. The same is also true for the driver's Q(ts)
parameter versus the closed box system's Q(tc). The Q(tc) for the driver in an infinitely large enclosure
would equal the Q(ts) of the driver. As the enclosure size is reduced the Q(tc) of the closed box system
increases. So a given closed box speaker will always have F(sc) and Q(tc) values somewhat higher
than the driver's corresponding free air parameters F(s) and Q(ts).
Before starting, make sure the WT3 unit has been calibrated and has stabilized for at least 90 seconds.
Measure the system impedance as follows:
•
Launch the WT3 software and make sure the volume is at maximum.
•
Make sure that the speaker system is not connected to any other equipment and then connect
the test leads of the WT3 unit to the speaker under test.
•
Click the "Measure Free Air Parameters" button at the left side of the WT3 screen.
•
You should hear the sweep from the speaker, the impedance is plotted and the parameters are
displayed.
•
The system's closed box resonance frequency, (F(sc) is displayed in the F(s) data field.
•
The system's closed box total Q, Q(tc) is displayed in the Q(ts) field.
•
The system's closed box mechanical Q, Q(mc) is displayed in the Q(ms) field.
•
The system's closed box electrical Q, Q(ec) is displayed in the Q(es) field.
•
The DC resistance of the system is displayed in the R(e) field. Ignore all other parameters.
•
Repeat the measurement to confirm the result. Repeated measurements should be in good
agreement.
Page 34

Here is a typical result when measuring a single full range driver in a closed box type enclosure:
By inspecting the impedance plot we can determine that this is a closed box type of loudspeaker
system from the presence of the single impedance peak in the low frequency range. From the
impedance plot alone we can identify the closed box resonance frequency F(sc) = 95 Hz by reading the
center frequency of the impedance peak from the frequency scale below. The impedance rise at higher
frequencies is due to the inductance of the voice coil. At very low frequencies (1 Hz) the system's DC
resistance is seen to be about 3 Ohms. The height of the impedance peak is largely dependent of the
mechanical Q of the driver or system. The Measured Parameters bar at the right side of the screen
show that this closed box system's resonance is at 95.55 Hz with a system Q(tc) of 0.6232 (displayed in
the Q(ts) field). The system's Q(ec) and Q(mc) appear in the Q(es) and Q(ms) fields respectively, for a
closed box measurement. The R(e) field gives the DC resistance of the system.
Page 35

Using WT3 to Evaluate a Vented Box Loudspeaker
A vented box type of loudspeaker system can be characterized by it's equivalent closed box Q(tc) and
the vented enclosure's Helmholtz tuning frequency F(b). You can use WT3 to measure both of these
parameters for any vented box loudspeaker system. The frequency response of a vented box speaker is
more complex than that of a closed box being equal to the frequency response of a fourth order highpass filter. The characteristics of the fourth order high-pass response depend on both the equivalent
closed box response and the vent tuning frequency.
The impedance response of a typical vented box speaker is characterized by two impedance peaks in
the low frequency region. The enclosure's tuning frequency is indicated by the frequency where the
impedance is a minimum between the resonance two peaks.
Before starting, make sure the WT3 unit has been calibrated and has stabilized for at least 90 seconds.
Measure the system impedance as follows:
•
Launch the WT3 software and make sure the volume is at maximum.
•
Make sure that the speaker system is not connected to any other equipment and then connect
the test leads of the WT3 unit to the speaker under test.
•
Temporarily block the speaker's vent using an airtight plug to convert the speaker to the
equivalent closed box system.
•
Click the "Measure Free Air Parameters" button at the left side of the WT3 screen.
•
You should hear the sweep from the speaker, the impedance is plotted and the parameters are
displayed.
•
The system's equivalent closed box resonance frequency, F(sc) is displayed in the F(s) data
field.
•
The system's equivalent closed box total Q, Q(tc) is displayed in the Q(ts) field.
•
Save the equivalent closed box data to a memory for future reference.
•
Unplug the vent and click the "Measure Free Air Parameters" button again.
•
You should hear the sweep from the speaker, the impedance is plotted.
•
Identify the two resonance peaks in the low frequency range.
•
Read the system's box tuning frequency, F(b) as the frequency at the minimum between the two
peaks.
•
The DC resistance of the system is displayed in the R(e) field. Ignore all other parameters.
•
Repeat the measurement to confirm the result. Repeated measurements should be in good
agreement.
Page 36

Here is a typical result when measuring a single full range driver in a vented box type enclosure:
Page 37

In order to read the vent tuning frequency, F(b), more precisely we can adjust the frequency display
limits to zoom in on the frequency range containing the two impedance peaks as shown below:
At this screen we can determine that F(b), the tuning frequency of the vented box, is approximately 40
Hz by locating the impedance minimum between the two peaks and reading the frequency where the
minimum occurs. The closely zoomed view makes it easier to read the frequency from the scale below.
Page 38

Using WT3 to Evaluate a Complete Speaker System
You can use WT3 to measure the impedance of complete multi-way loudspeaker systems. Based on
this impedance curve we can tell a number of things about the system, such as whether the woofer uses
a closed or vented enclosure. While a single peak in the low frequency range suggests a closed box, a
single peak would also be seen for a driver operating as a dipole on a large baffle. Twin resonance
peaks typically indicate a vented enclosure. The enclosure tuning frequency is the frequency between
the two peaks where the impedance is a minimum.
Before starting, make sure the WT3 unit has been calibrated and has stabilized for at least 90 seconds.
Measure the speaker system impedance as follows:
•
Launch the WT3 software and make sure the volume is at maximum.
•
Make sure that the speaker system is not connected to any other equipment and then connect
the test leads of the WT3 unit to the speaker under test.
•
Click the "Measure Free Air Parameters" button at the left side of the WT3 screen.
•
You should hear the sweep from the speaker, the impedance is plotted and the parameters are
displayed.
•
Save the system's impedance response to a memory for future reference.
•
The DC resistance of the system is displayed in the R(e) field. Ignore all other parameters.
•
Repeat the measurement to confirm the result. Repeated measurements should be in good
agreement.
Page 39

Here is a typical result when measuring a complete 2-way speaker system:
We can see that this system employs a vented woofer system with the vented enclosure tuned to about
40 Hz. Even with a minimum impedance of just over 6 Ohms this would often be considered to be a
nominal 8 Ohm loudspeaker system.
Page 40

Using WT3 to Diagnose Loudspeaker Fault Conditions
When carefully applied WT3 can be used to spot common problems with a speaker system. For
example, the screen below shows two impedance measurements of the same two-way speaker system.
The green (lower) plot shows the normal impedance response of this system. The purple (upper) plot
shows the system with the tweeter in an open circuit fault condition. The missing tweeter load causes
the impedance response to rise above 2 kHz suggesting that the tweeter has faulted to an "open
circuit". If only the faulty system is available for testing it may be less apparent that there is a problem.
But if a suspect speaker is compared to a good speaker the fault condition is easy to see.
Page 41

In the screen below you see the same system as above but this time with a shorted tweeter. The green
(upper) plot again shows the normal impedance response of this system. The yellow (lower) plot shows
the system with a shorted tweeter. The system with the shorted tweeter appears to have a suspiciously
low impedance above 4 kHz or so but when compared to the normal response (green) it is easy to see
there is a problem.
Page 42

Now let's examine similar fault conditions for the woofer. The screen below shows the same 2-way
system as above with the green plot representing the normal system and the orange plot showing the
system in a fault mode with an open circuit woofer. The system is seen to be unloaded (high
impedance) over most of the woofer's frequency range. (not that a dead woofer is very hard to detect!)
Page 43

Finally, here is a screen shot showing the same system with the woofer in a short circuit fault condition
(lower blue trace). As we see in these examples often a system fault is most easily detected by
comparing the suspect system to a known good system.
Page 44

Using WT3 to Design a Zobel Network
Zobel networks are used to control the impedance of a loudspeaker driver in the upper frequency range
where voice coil inductance normally causes the impedance to rise with increasing frequency. Zobel
networks are used to help crossovers do a better job of keeping the highs from passing to the woofer.
A Zobel consists of a resistor and capacitor connected in series and attached between the terminals of
the driver. The resistor is normally selected to match the nominal impedance of the system. The
capacitor value can then be calculated or, in this case, determined empirically. Because WT3 is able to
perform impedance sweeps in just a few seconds it can be used for any type of repetitive adjust and
measure process...such as designing a Zobel network to neutralize the inductance of a driver. Yes, you
can calculate the component values for a Zobel network but sometimes it is easier to just clip a
resistor/capacitor network across the driver and see what you get for the impedance.
Below is the impedance response of a small woofer with no other components connected. Notice the
rising impedance above 500 Hz. We would like to design a Zobel network to compensate the woofer
and restore the impedance to some nominal value above 500 Hz.
With a DC resistance of 5.5 Ohms this would most likely be considered to be an 8 Ohm driver. So let's
set the resistor value to about 8 Ohms. Looking in my parts bin I see the closest values on hand are 5
and 10 Ohms. Let's use 10 Ohms so that we tend to under compensate. We'll select the capacitor value
by starting too low and stepping up the capacitor until the impedance response looks about as flat as
Page 45

we can get it in the upper frequency range. Let's start with around 1 uF for the capacitor and see what
we get for a new impedance response. The screen below shows the new impedance response in purple
with the original (uncompensated) response in blue. Notice that the impedance has only been reduced
above 5 kHz. This is because our capacitor value is too low. Let's increase the capacitor and see what
happens.
Page 46

Below is the impedance with the capacitor increased to 2 uF (blue trace). The original
(uncompensated) impedance is shown in green. The 2 uF capacitor has flattened out the impedance so
that it rises only slightly above 8 Ohms. Since it is easy to do let's continue to increase the capacitor
value and see if we can get a further improvement. Ideally we would like the impedance to be as flat as
possible...at least above the resonance peak.
Page 47

The screen below shows the effect of increasing the capacitor to 3 uF (blue trace). The increase from 2
to 3 uF gave even further improvement as the impedance above resonance is now quite flat. Just to see
what happens, let's increase the capacitor further to 5 uF.
Page 48

Below we see the effect of increasing the capacitor to 5 uF in the lowest (blue) trace. It seems we have
gone too far with the increase to 5 uF. The impedance in the 2 to 3 kHz range has been reduced to the
DC resistance value and is now rising above the previous measurement with the 3 uF capacitor. This
rise may be due to an interaction with the voice coil inductance. It looks like the 3 uF capacitor will be
the best overall choice to tame the driver's high frequency impedance.
The point of the exercise was to demonstrate how an inductance compensating network, or Zobel
network could be designed experimentally by "trial and error". Even if you choose to calculate the
values for the Zobel network you still might want to verify the resulting impedance response of the
driver with the Zobel connected. In general you could take the same approach to verify other networks
such as the resonance compensation network (R-L-C) sometimes used to neutralize the impedance
peak of a tweeter. As an impedance measurement system the additional applications for WT3 are
limited only by the user's imagination.
 Loading...