


WeatherLink®
Console
USER GUIDE

DAVIS | WeatherLink Console User Guide
Table of Contents
Introduction … 03
WHAT’S IN THE BOX … 03
Chapter 1: Get Ready … 04
SET UP YOUR WEATHER STATION SENSOR SUITE … 04
GATHER THE STATION IDS … 04
SIGN UP FOR WEATHERLINK.COM … 04
Chapter 2: Set Up Your WeatherLink Console … 04
POWER UP AND CONNECT TO WI-FI AND WEATHERLINK.COM … 04
CONFIGURE DEVICES … 05
DISPLAY FORMAT SETTINGS … 06
UNIT OF MEASUREMENT SETTINGS … 06
GENERAL CONSOLE SET TINGS … 06
Chapter 4: Navigating Your Console … 08
YOUR DISPLAY SCREEN … 08
CURRENT WEATHER HOME TAB … 09
GRAPH TAB … 10
DATA TAB … 11
ACCOUNT TAB … 11
1. Account Information … 11
2. Console Conguration … 11
3. Customize Display … 11
• Console Settings … 13
• Alarms … 14
• Device Information … 14
• Terms and Conditions … 14
CONSOLE USE … 06
Chapter 3: Mounting Your Console … 07
CHOOSE THE CONSOLE LOCATION … 07
MOUNTING YOUR CONSOLE ON A WALL … 07
USING YOUR CONSOLE ON A TABLE, SHELF OR DESKTOP … 07
page – 2
Chapter 5: Troubleshooting and FAQs … 15
CONTACTING DAVIS TECHNICAL SUPPORT … 16
Appendices … 17
APPENDIX A: WEATHER DATA … 17
APPENDIX B: SPECIFICATIONS … 21
APPENDIX C: WEATHER DATA SPECIFICATIONS … 22
APPENDIX D: WIRELESS REPEATER CONFIGURATION … 24
davisinstruments.com

DAVIS | WeatherLink Console User Guide
Introduction
WHAT’S IN THE BOX
• WeatherLink Console
It’s here!
Your next-gen WeatherLink Console
will revolutionize the way you access,
analyze, and understand the hyper-local
weather data reported by your Vantage
™
Pro2
To get started, here are a few of the exciting features of this
console.
• Sophisticated & Stylish Color Touchscreen:
• Data Viewing: Access all your sensor data – from
or Vantage Vue® sensor suite.
Easily navigate and customize your view right on
the console Display screen.
temperature to wind to rain – both offline and
logged into WeatherLink.com. Add an additional
console to any room (within transmission range).
• Wall mount bracket
• Tabletop kickstand
• AC adapter and cable (no adapter with USB model)
• Hardware kit
• Custom Charting: Visualize any of your sensor data
in graph form.
• Wi-Fi Connected: Push your data to the WeatherLink
Cloud to access your data on WeatherLink website.
Use the WeatherLink app and join the largest global
network of personal weather stations and share
your data across the globe.
• Data Collection: See data from up to 8 transmitting
stations – even 8 separate sensor suites.
• Alarms: Set hundreds of different alarms for
multiple functions simultaneously.
• Stores years of historical data with settable local
archive update rates. This console offers years of
data and analysis even without internet connection.
(Dependent upon update rate.)
• Smart Home: Connect your data to Alexa,
Google Assistant, or other IoT/smart devices.
page – 3
davisinstruments.com

DAVIS | WeatherLink Console User Guide
Chapter 1: Get Ready
1. SET UP YOUR WEATHER STATION SENSOR SUITE
If you have a purchased your WeatherLink Console along with
a new Vantage Pro2 or Vantage Vue sensor suite, you should
set up your sensor suite rst and have it up and running. Do
this by following the instructions included with your sensor
suite, but it might be easier if you wait to mount the sensor
suite outside.
If you already have a Vantage Pro2 or Vantage Vue sensor suite
up and running, you don’t need to unmount it.
2. GATHER THE STATION IDS.
You will need to know what ID number your sensor suite is
transmitting on. The default factory setting is ID1, but you
may have changed this setting. If you have more than one
transmitting station, each will be set to a different ID and you
must know which station is transmitting on which ID.
Chapter 2: Set Up Your
WeatherLink Console
POWER UP AND CONNECT TO WI-FI AND WEATHERLINK.COM
Note: You’ll need your Wi-Fi password.
1. Plug your Console into AC power using the AC adapter
and power cable. The Console is AC-powered, with battery
backup. The backup battery is meant to keep data logging
when there is no AC power and will last less than a day.
Tip: If you have a Vantage Pro2 sensor suite, the ID is set
by moving the DIP switches in the transmitter shelter of
your sensor suite.
If you have a Vantage Vue sensor suite, the ID is set by
pressing the transmitter ID button.
Refer to your sensor suite’s manual if you need more
information on conrming or changing your ID number.
3. SIGN UP FOR WEATHERLINK.COM.
A WeatherLink account is not required for this Console. It
is a fully functional and powerful data display, storage, and
analysis tool on its own. However, using it with a WeatherLink
account will add considerable benets including access to
your data on your phone or computer, the option to store and
access your archive data in safe cloud data archive, the ability
to share your data with others, and the opportunity to be
part of the WeatherLink global communit y of Davis weather
stations. A basic account is free, but you can upgrade to Pro or
Pro+ to enjoy added features.
On the back of the Console, remove the plastic kickstand
stand and any cardboard packaging.
Plug the USB A connector into the AC adapter and the USB
C connector into the port on the back of the Console. Then
plug the AC connector into AC power. Tuck the cable into the
channel below the USB C jack.
Your Console will automatically power up.
page – 4
davisinstruments.com

DAVIS | WeatherLink Console User Guide
2. The Console Installation screen will appear. Make sure
you have a list of the transmitter IDs for your sensor suite
and any other transmitting stations (such as a standalone
Temperature/ Humidity Sensor installed on a Sensor
Transmitter) ready. Tap Begin Setup.
3. Follow the prompts to connect to your Wi-Fi.
Tip: If the device doesn’t nd your Wi-Fi network, make sure
you have entered the correct password and that you are
connecting to a 2.4 GHz network. It will not connect to a 5
GHz network. Then try repeating these steps.
Note: The console uses Wi-Fi to update the rmware
upon rst use, as well as to maintain very accurate time.
You should connect to Wi-Fi even if you do not intend to
upload your data to WeatherLink.com. After setup, the
Console will not need to be connect to Wi-Fi, except to
get automatic rmware updates which occur automatically
at 3:00 a.m. local time when they are available. However,
you can set it up without Wi-Fi. Choose Use Offline Mode
and skip to step 6.
4. Wait while the Console installs the latest updates. This may
take as long as 30 minutes.
CONFIGURE DEVICES
The next screens will let you set up the Console to “listen”
to your transmitters.
1. Click on the ID to which your sensor suite is set.
2. In the next screen, choose the station type such as
Vantage Vue or Vantage Pro2.
3. Enter a name for this station such as My Vantage Vue,
or Cellar Humidity Sensor.
4. Make sure the Rain Collector setting matches your station’s
rain collector type (0.01 inches or 0.2 millimeters). Select
any additional sensors you may have on your sensor suite
or transmitter. For example, if you have a Vantage Pro2 Plus,
choose Solar Rad and UV.
5. Advanced settings: This screen allows you to add a
yearly rain value to date. (For example, if you are setting
this device up in March, you can insert the rain data you
may already have for January and February). If you have
added a repeater, or a second wind station or third-party
anemometer, congure those on this screen.
5. The next screen will allow you to create or log into your
WeatherLink account. Either create your account, log in to
an existing account, or skip this section.
6. Set your station’s latitude and longitude. You can use the
map to nd your location if your console is connected to
Wi-Fi, and latitude, longitude, and elevation will be set
automatically.
Tip: Make sure the elevation is correctly set to the
elevation of your Console, not your sensor suite. The
barometer is housed in the Console and changes quickly
with elevation. If your Console is in an upstairs room, be
sure to add that elevation.
7. Select country, time zone, time, and date (time should be
automatically set if using in online mode) and choose to see
time in either 24- or 12-hour format. Tap Next.
8. Name your Console. Give you Console a short name, such as
Bob’s Home, or Aspen Cottage Weather. Tap Next.
You can also calibrate temperature, humidity, or wind using
this screen. Please be aware that Davis sensors are quite
accurate, and calibration is normally not needed. (See FAQs
on calibration, page 15)
6. Tap Save, then Save again to return to the Congure
Devices Screen. Continue adding any transmitting stations
you have in your system. Your Console can “listen” to up to
8 different transmitters.
7. When you are nished, tap Next.
page – 5
davisinstruments.com

DAVIS | WeatherLink Console User Guide
DISPLAY FORMAT SETTINGS
Make sure the display formats are as you want them to be.
Tap Next.
UNIT OF MEASUREMENT SETTINGS
Make sure the unit measurements are as you want them to be.
Tap Next.
GENERAL CONSOLE SETTINGS
1. On this screen, you can change your Local Archive Rate
from the default of 5 minutes to 1 minute, 15 minutes,
30 minutes, or 50 minutes. You can change the Online
Archive Rate in this screen as well.
Note: Understanding Data Rates
Your console will display current data as well as store it
internally and optionally upload data to the WeatherLink
Cloud for you to view on the WeatherLink app or website.
Current Conditions: Sensor suite data is transmitted
every 2.5 seconds. See sensor update intervals, page 22.
Archive Data: Historical, or archive, data is stored both in
the console, called “Local” archive data and, optionally,
to the WeatherLink Cloud, called “Online” archive data.
“Local” Archive Rate refers to the frequency at which
archive data is recorded on the Console’s internal
database. The Console default archive rate is every
5 minutes. The more frequently data is added to the
database, the faster the database will ll. However, the
Console’s robust database will store historical data for
years before it starts to overwrite the oldest data.
“Online” Archive Rate is the frequency at which the
Console uploads data for online display and storage on
WeatherLink.com. This archive rate depends on the type
of WeatherLink plan you have selected. The default is
set is 15 minutes. You can change it on the Console or on
WeatherLink.com.
Tip: For Online Archive Rates more frequent than
15 minutes, you must be a Pro or Pro+ subscriber.
You can upgrade to Pro or Pro+ on WeatherLink.com.
2. You can also set when you want your yearly rain season to
star t. For example, if your rainy season starts in April, you
might want to start yearly accumulations on April 1 rather
than January 1.
3. Choose whether you want your Console to track ambient
lighting and automatically change the brightness depending
on the light levels in the room. Or you can choose the
brightness level yourself using the brightness slider.
4. Tap Next.
CONSOLE USE
On the next screens, select the primary use for your Console.
Choose home or business. This information helps us design
better hardware, software, and services. Tap Next.
Your installation is now complete! You should see data on
your Display screen within 2 to 5 minutes.
page – 6
davisinstruments.com

DAVIS | WeatherLink Console User Guide
Chapter 3: Mounting Your
Console
CHOOSE THE CONSOLE LOCATION
You will want to place your WeatherLink Console in a location
where it is accessible, and the Display screen is easy to read.
It can either be mounted on a wall or used on a table, shelf, or
desktop.
For the most accurate readings:
• Avoid placing the Console in direct sunlight. This may cause
erroneous inside temperature and humidity readings and
may damage the unit.
• Avoid placing the Console near radiators or heating/air
conditioning vents.
• If you are mounting the Console on a wall, choose an interior
wall. Avoid exterior walls that tend to heat up or cool down
depending on the weather.
• Avoid placing your Console near large metallic appliances
such as refrigerators, televisions, heaters, or air conditioners.
5. Place the bracket on the wall and use a Philips head
screwdriver and the included screws to mount the bracket
as shown.
6. Slide the Console down onto the bracket.
USING YOUR CONSOLE ON A TABLE, SHELF OR DESKTOP
Use the tabletop kickstand included. Insert kickstand into the
back of the Console. There are “bumpers” on the legs to keep it
from sliding.
MOUNTING YOUR CONSOLE ON A WALL
1. Use the wall mount bracket included with your Console.
2. Use the holes to mark screw holes on the wall. Use a level to
make sure the holes are level to each other.
3. Use a drill and a 7/64” (2.5 mm) drill bit to drill two pilot
holes for the screws.
4. Use a hammer to carefully tap the drywall anchor into the
hole until the collar of the drywall anchor is ush with the
wall surface. Be careful to avoid driving the drywall anchor’s
collar beneath the surface of the wall.
page – 7
davisinstruments.com

DAVIS | WeatherLink Console User Guide
Chapter 4: Navigating Your
Console
YOUR DISPLAY SCREEN
The customizable Display screen will let you see just what
information you most want at a glance.
The Display screen is packed with all the current weather
data you need as well as date and time, sunrise and sunset,
alarms, and ticker tape. You will see real-time data as it
arrives from the sensors. The ticker tape area offers
informational messages about active alarms, low batteries
on the sensor suite, resyncing with sensor suite and more.
(And in a good rainstorm, look for the “raining cats and dogs”
message!) You can also see how many alarms you have set;
the number will appear next to the clock in the lower left
corner of the Display screen.
Or choose the 2 X 2 layout for 4 different tiles, plus the center
wind rose, with two or just one aspect in each.
Tip: Want to make your Console easier to read from
across the room? Choose the 2 X 2 layout with just one
aspect in each tile. The displayed values will be bigger,
making it easier to see from a distance. You can also
choose High Contrast mode to make it even easier to see.
The layout can be customized to show you the data you
are most interested in. Choose a 3 X 2 layout for a total of 6
different tiles, plus the center wind rose. Within each tile, you
can choose up to 2 different aspects. (For example, Outside
Temperature and Outside Humidity in one tile.)
page – 8
Note: All your data, whether you choose to display it or
not on the Display is still updating. You can access it on
the Data screen. You can change the Display at any time.
Note: To Customize your Display Screen, see Customize
Display Menu Item on page 11.
davisinstruments.com

DAVIS | WeatherLink Console User Guide
CURRENT WEATHER HOME TAB
Tap the House symbol area at the top of the display screen to
access the various tab sections.
This will take you to the rst tab:
the Current Weather Home screen.
• In the lower right corner, tap the “Jump to Current” button to
move the “now” divider to center of the chart.
• Tap the “7-day” tab to see data graphs for 7 days with actual
historical data for past days and forecasts for future days.
Use the < and > arrows on the top of the chart to move the
star t of the week backward or forward. Days in the past will
show your historical data, while days in the future will show
forecasts.
This screen gives you all the details of your current weather
including sunrise and sunset, and daily highs, lows and
averages, and today’s forecast. Scroll down to see current data
from all your sensors.
If you are online (that is, logged into WeatherLink.com), you’ll
also get hourly, 7-day, Monthly, and Annual forecast history
and forecasts.
• Tap the “Hourly” tab to see hour by hour historical data back
24 hours, and forecasts forward hour by hour for 24 hours.
Scroll right and left more data.
page – 9
davisinstruments.com

DAVIS | WeatherLink Console User Guide
• Tap the “Monthly” tab to see weather data recaps for every
day of the month. At the top of the page, you’ll see the
average high and low temperature, as well as rainfall and any
records set this month to date. On the calendar you’ll see
actual temperature highs and lows, forecasts, humidity, and
rainfall data for days in the past. For days in the future, you’ll
see forecast expected high and low temperature, humidity,
forecasts, and rainfall data. Use the < and > arrows to scroll
to months in the past or future.
• Tap the “Annual” tab to see climatological information for
your area. Scroll down to see temperature and rainfall
charted for both the climatological average and your
station’s data.
GRAPH TAB
Tap the graph symbol to open the Graph screen.
On this page, you can graph your weather data over a period
you select. You can touch the graph line to get pinpointed data
for each graphed point.
1. To choose one or two parameters you want to graph, tap
the Data symbol: Choose the parameters you want
to graph, such as High Temperature, Low Temperature or
Dew Point.
2. To choose the date and span you want to graph, click the
Calendar and time range symbols: You can choose
1 hour to 1 year starting at any date/time. Check
“Automatically show last set amount of time” to start
backward from now. If you uncheck the box, you can select
a star t time and date. The graph will show data from this
start time forward over the span you choose. For example,
choosing to start on November 21, this year, for 3 days,
star ting at 2 p.m., will show a graph of data from November
21 at 2 p.m. to November 24 at 2 p.m.
3. Tap Save.
page – 10
davisinstruments.com
DAVIS | WeatherLink Console User Guide
DATA TAB
Tap the data symbol to open the Data screen.
This screen shows your archive, or historical, data over any
selected day. You can choose which data to see by tapping the
data symbol: in the upper left corner, and the day and
star t time by clicking the calendar symbol below it.
Scroll down and side to side to see all the data in your
Console’s database for that day.
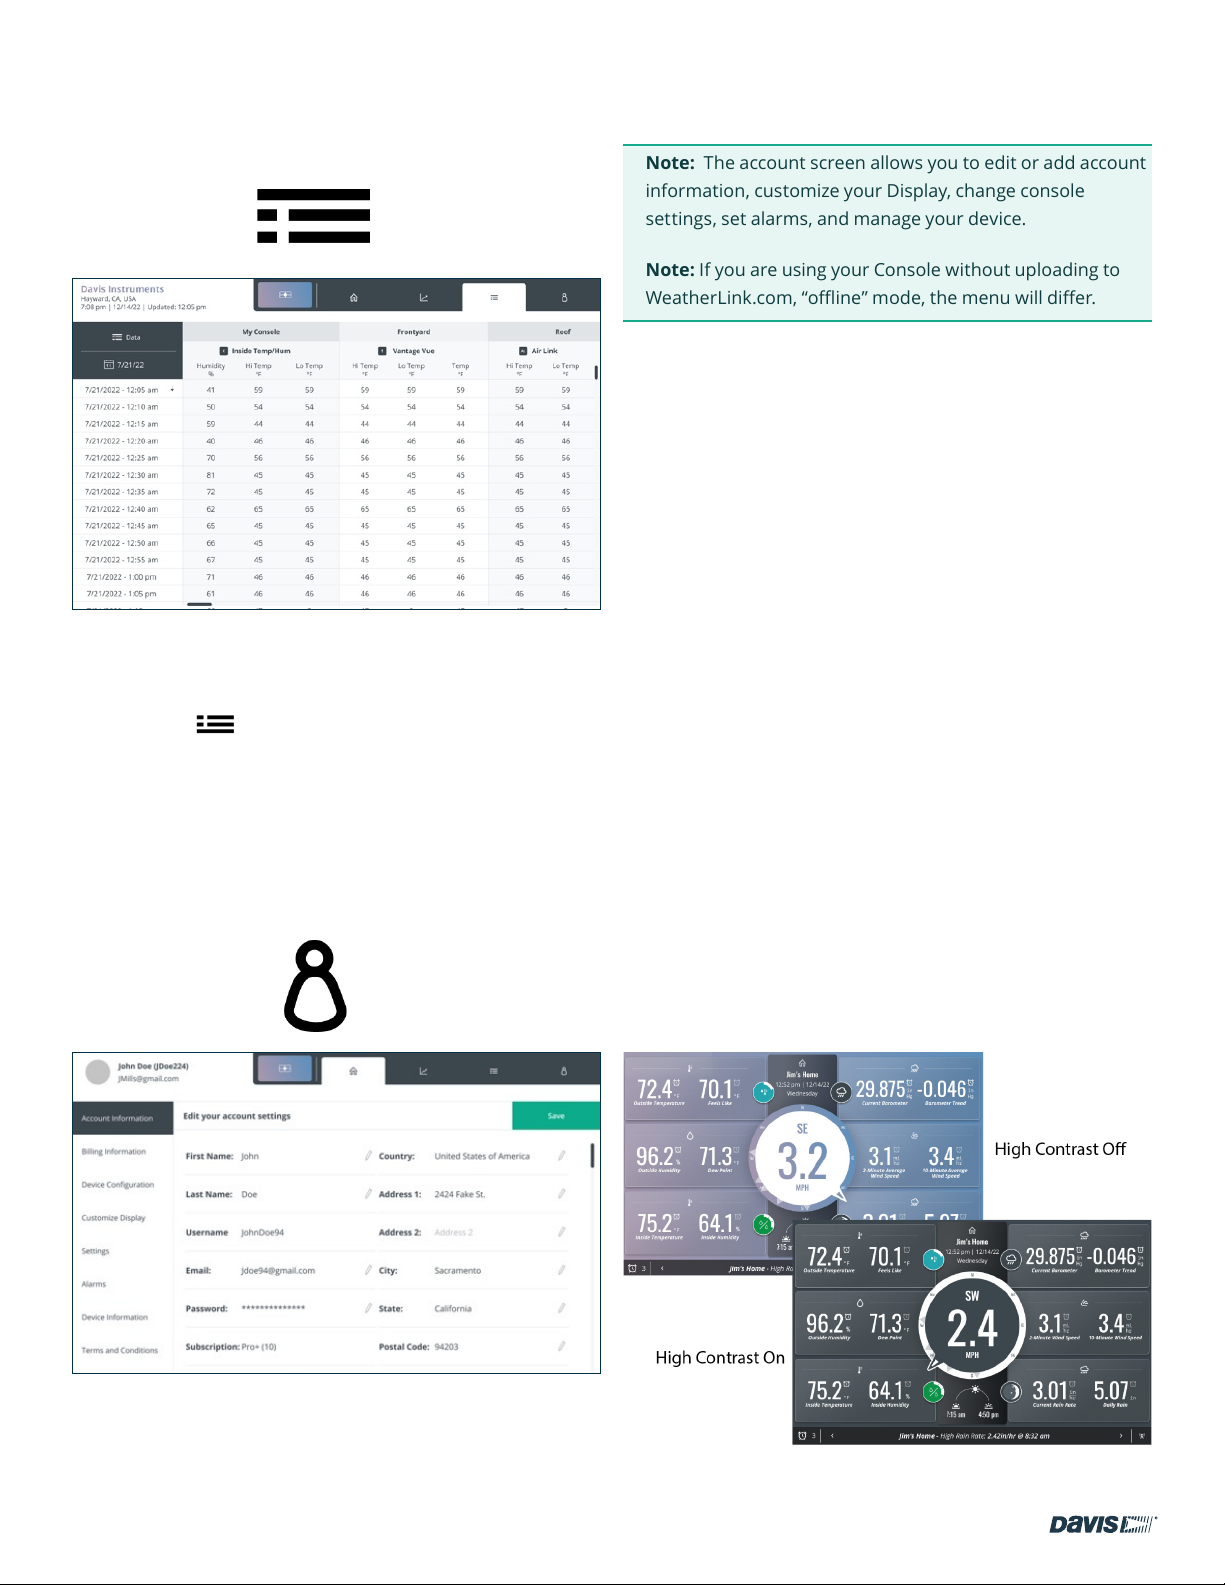
ACCOUNT TAB
Tap the Account symbol to open the Account screen.
Note: The account screen allows you to edit or add account
information, customize your Display, change console
settings, set alarms, and manage your device.
Note: If you are using your Console without uploading to
WeatherLink.com, “offline” mode, the menu will differ.
Account Tab Menu items
1. Account Information
Tap this option to edit your account information such as
your name, address, or email address. Your WeatherLink
subscription status and when your subscription is due for
renewal are also shown. Tap the pencil to edit the eld.
2. Console Conguration
Tap this option to see your Console’s name, Wi-Fi network,
location, and time zone. To edit, tap the pencil.
3. Customize Display
To customize your Display, tap the Customize Display
menu item.
1. Choose the layout. Choose a 3 X 2 layout for a total
of 6 different tiles, plus the center wind rose. Within
each tile, you can choose up to 2 different data
points. (For example, Outside Temperature and
Outside Humidity in one tile.)
Or choose the 2 X 2 layout for 4 different tiles, plus
the center wind rose, with two or just one aspect in
each.
2. You can choose to turn High Contrast Mode on for
easiest viewing.
At the top left, you will see your name, your username, and
your email address.
page – 11
davisinstruments.com

DAVIS | WeatherLink Console User Guide
3. Tap the Customize Display button on upper right
to save your layout choice and proceed to the tile
and bubble options page.
Display Tips: Want to make your Console easier to read
from across the room? Choose the 2 X 2 layout with just
one data point in each tie. The displayed values will be
bigger, making it easier to see from a distance. Turn High
Contrast on for even easier viewing.
Keep data points with the longest values displayed, like
barometer in the corners where the most space is available.
You might notice that the center wind rose encroaches a bit
on the two center row tiles.
5. Make sure the correct sensor is selected. (For
example, outside temperature from your sensor
suite; inside temperature from your Console.)
6. Click Save.
7. Continue to choose options for all the tiles. You
can see a preview of your selection at any time by
tapping the Live Preview button in the upper right
side of the Customize Display page.
8. Customize the four “Weather Bubbles” as well.
Scroll down to choose each bubble location, then
tap Edit to choose a parameter for that bubble. You
will see the various graphical images that will be
displayed as the data changes over the day.
Choose a weather parameter:
• Temperature
• Humidity
• Heat Index
• Wind Chill
• Barometric Trend
• UV
• Sky Condition/Forecast
• Moon Phase
4. Choose the data points you want to see in each tile.
Starting with the upper left tile, choose the parameter
you want to see: Temperature/Humidity, Wind,
Barometer, Rain, Solar/UV, Leaf Wetness and Soil
Temperature, or Current Daily Forecast. Tap Edit to
see your options for each parameter in either a Visual
Preview or List view.
For example, if you choose to have Temperature/
Humidity in the upper left tile, on this page you
can choose whether you want Outside and Inside
Temperature in the tile, or Outside Temperature and
Dew Point, or just Outside Temperature.
9. Tap Next. Make sure the correct sensor for this
data is selected, then tap Save.
page – 12
davisinstruments.com

DAVIS | WeatherLink Console User Guide
Console Settings
This menu item lets you ne tune your Console.
There are three tabs at the top of this screen.
1. Console Settings Tab allows you change display
formats to more precision, calibrating, or to change
what you set up previously.
• Calibrate Inside Temperature and Humidity or
Barometer.
Note: Davis Instruments sensors are quite
accurate and should not need calibrating.
However, you may do so on this screen.
• Set Local Archive Rate
This is the rate at which archive data is stored in
the Console’s database. (It is NOT the frequency
at which current data is updated, nor is it the
frequency at which archive data is stored on
WeatherLink.com.)
You can select 1 minute, 5 minutes (default setting),
15 minutes, 30 minutes, or 60 minutes. Remember
that less frequent rates mean more data can be
stored and therefore it will take longer before the
database is lled and older data is overwritten.
WeatherLink Cloud. Some faster update rates
can only be selected if you have a Pro or Pro+
subscription.
• Control the Console’s brightness
• Choose Ambient Light Tracking to allow the
console to change brightness according to the
available light in the room.
2. The Units of Measure Tab allows you to customize
the units of measurement you prefer.
• Temperature: Fahrenheit or Celsius
• Soil Moisture: Kpa, bar, or cb
• Wind: miles per hour, knots, kilometers per hour,
or meters per second
• Rain & ET: inches or millimeters
• Elevation: Feet or meters
• Barometer: inHg, mmHg, mb, hPa
3. Display Format Tab allows you to choose how you
want to see information on your Display Screen.
• Language
• Date Format
• Time Format
• Number Format
• Display Resolution
• Alarms
Tip: To better understand Local Archive Rate, see
Note: Understanding Data Rates on page 6.
• Edit elevation. Elevation is important for accurate
barometric pressure readings. The Elevation
should be as close as possible to the elevation of
the Console itself, which houses the barometer.
Take into account such things as the Console
being in an upstairs room.
• Edit yearly rain year start.
• Set Online Archive Rate. This is the frequency
at which your historical data is uploaded to the
page – 13
davisinstruments.com

DAVIS | WeatherLink Console User Guide
Alarms
This menu item allows you to set any number of alarms for
any parameter. For example, you can set an alarm to notify
you when the outside temperature nears freezing, or inside
humidity reaches your selected threshold. When the condition
for which you set an alarm occurs, the Console will notify you
by listing the condition in the ticker tape area of the Display
(when your Console showing the Display screen) and with an
audible alarm if you choose. You can choose the sound and the
volume of the audible alarm.
Tip: The volume and sound can be set for each alarm
individually. This means you can have one sound that
indicates that your rain alarm has been activated and
another that indicates your temperature alarm has been
activated.
There are two tabs on this screen:
Use the Set Alarm tab to set up your alarms.
1. To set an alarm, enter a threshold value in the
parameter you choose. For example, in the Outside
Temperature elds, enter 33°F in the “Lo” eld.
2. Click the Alarm Sound symbol to
select an alarm sound and volume
and to preview the sound.
3. Click Save to save your alarm.
Device Information
This menu item lets you see information about your Console
and transmitters. At the top of the screen, you’ll see the
console’s rmware, operating system, and radio module.
Note: Console and operating system are both updated
automatically at 3:00 a.m. local time when they become
available.
You’ll also see diagnostic information about your Console and
sensor suite, including:
Console:
• Strength of Wi-Fi signal
• Whether the Console is connected to Wi-Fi
• Battery charge
Sensor Suite (or other transmitting station):
• Radio signal strength
• Whether it is connected to the Console
• Sensor suite battery state
Click the > arrow next to your sensor suite for further
diagnostic information.
You can also choose Factory Reset on this screen. Use this to
reset your Console to factory settings. Note that all data in
your Console will be lost if you reset your Console.
4. To turn off the alarm, click the Off
Alarm symbol that will appear on
the Display screen. It will go off
itself otherwise after one minute.
Use the Alarm History tab to see a list of alarms that have
occurred and when.
page – 14
Terms and Conditions
Please read the Davis Instruments Privacy Policy.
To return to the Display screen at any time, tap the Display
symbol.
davisinstruments.com

DAVIS | WeatherLink Console User Guide
How long will the backup battery last if I lose AC power?
Chapter 5: Troubleshooting
and FAQs
My weather readings seem wrong. How can I calibrate my
console?
Davis sensors are factory-calibrated for accuracy and will
normally not need any calibration. Comparing your data to
TV reports or other sources is not recommended because
weather data varies by microclimate. However, if you believe
your Console does need calibration, go to the Accounts tab,
then tap Console Conguration, then tap Stations and Sensors.
Scroll down to the ID number of your station and tap Edit. On
the sensor detail page, tap Advanced Settings. On the next
screen, you may enter calibrations for outside temperature
and humidity, and wind. To calibrate inside temperature and
humidity, in the Accounts tab, tap Console Settings.
Why didn’t I hear the audible alarm when an alarm was
triggered?
The main Display screen must be open to hear the audible
alarm.
On the diagnostics page, my radio signal strength shows
“fair.” Is that okay?
Yes. The signal strength is a real-time reading and can
uctuate. Fair and good are both indicators of sucient
strength. You can verify by looking at the reception percentage.
How do I turn o an alarm?
Less than a day.
Why can’t I see forecasts?
Internet-based, localized forecasts are only available when you
are in Online mode. (Logged in to WeatherLink.com.)
Can I power my console from a USB port on my computer?
No. The computer USB port will not supply sucient power.
Use the included 2A AC adapter.
Do I need to connect to Wi-Fi?
No, the console will run as a standalone device. However,
Wi-Fi is needed for keeping accurate time on the console and
for rmware updates. (You do NOT need to be logged in to
WeatherLink.com; you just need to be connected to Wi-Fi.)
I am not sure about whether to upload to WeatherLink.com.
Can I set this up later?
Yes, you can create a WeatherLink.com account any time
now or in the future. However, the start date for your data on
WeatherLink.com will be when you create and connect your
Console to your account.
If I disconnect from WeatherLink.com account and reconnect
later, will the data stored in the Console be pushed to
WeatherLink.com?
Yes. When reconnected, your Console’s stored data will be
pushed to your WeatherLink.com account.
When an alarm is activated, you will see a notication in the
Ticker Tape area of the Display screen. To silence the audible
alarm, tap the Alarm Off symbol. The alarm will go off by itself
after a minute if you do not turn it off.
Can I clear some data like erroneous rain tips?
No. If you have a Vantage Pro2 sensor suite, it is important to
disconnect your sensor cables when doing maintenance work
on your sensor suite.
page – 15
davisinstruments.com

DAVIS | WeatherLink Console User Guide
What does “Oine” and “Online” mode mean?
Offline mode keeps you connected to Wi-Fi to ensure accurate
time but disconnected from WeatherLink.com.
Online means your Console is connected to Wi-Fi and also
connected to your account on WeatherLink.com. This will give
you access to live updates on your mobile app and your page
on WeatherLink.com, as well as specialized internet-based
forecasts.
Your Console can also operate offline and off Wi-Fi as a
standalone device.
How can I change my Wi-Fi network?
Go to the Account tab and tap Console Conguration. Tap the
pencil icon next to your network.
Can I retransmit from an older Vantage Pro2 or Vantage Vue
console?
Yes. Your older console is a useful transmitter that can
retransmit to your new one. Refer to the original Vantage Pro2
or Vantage Vue Console User Guides to learn how to set up
your old console to retransmit on its own ID number. Choose
any open ID.
CONTACTING DAVIS TECHNICAL SUPPORT
For questions about installing or operating your
WeatherLink Console, please contact Davis
Technical Support. We’ll be glad to help.
Online: www.davisinstruments.com See user
manuals, product specications, application notes,
software updates, and more.
E-mail: support@davisinstruments.com
If needed, you can also call our support team at
510 732-7814, Mon. - Fri. 7:00 a.m. to 5:30 p.m.,
Pacic time.
You will need to set your WeatherLink Console to listen
to this transmitter ID. The old console will become one of
your “Stations and Sensors.” To add it, go to the Accounts
screen, choose Console Conguration, then choose Stations
and Sensors. Tap the ID number that the old console is
retransmitting on. On the next screen, choose Vantage Pro2 or
Vantage Vue depending on your sensor suite.
page – 16
davisinstruments.com

DAVIS | WeatherLink Console User Guide
Note: Wind chill is not calculated above 92° F (33° C).
Appendices
APPENDIX A: WEATHER DATA
Refer to this appendix to learn more about the weather
variables that are measured, displayed, and logged by your
Console. Some weather variables require optional sensors.
Wind
The anemometer measures wind speed and direction. The
Console calculates a 10-minute average wind speed and
10-minute dominant wind direction. The 10-minute average
wind speed is displayed in the Console ticker whenever wind
has been selected on the Console. The last six 10-minute
dominant wind directions are included in the compass rose
wind display.
Temperature
The sensor suite houses the outside temperature sensor in
a vented and shielded enclosure that minimizes the solar
radiation induced temperature error. The Console houses the
inside temperature sensor. Additional temperature sensors
are available for wireless stations and can measure up to eight
locations.
Apparent Temperatures
Your Console calculates three apparent temperature readings:
Wind Chill, Heat Index, and the Temperature/Humidity/Sun/
Wind (THSW) Index. Apparent temperatures use additional
weather data to calculate what a human body perceives the
temperature to be in those conditions.
Wind chill
Wind chill takes into account how the speed of the wind affects
our perception of the air temperature. Our bodies warm the
surrounding air molecules by transferring heat from the skin.
If there’s no air movement, this insulating layer of warm air
molecules stays next to the body and offers some protection
from cooler air molecules. However, wind sweeps that warm
air surrounding the body away. The faster the wind blows, the
faster heat is carried away and the colder you feel. Wind has a
warming effect at higher temperatures.
Heat Index
The Heat Index uses temperature and the relative humidity
to determine how hot the air actually “feels.” When humidity
is low, the apparent temperature will be lower than the air
temperature since perspiration evaporates rapidly to cool
the body. However, when humidity is high (i.e., the air is more
saturated with water vapor) the apparent temperature “feels”
higher than the actual air temperature, because perspiration
evaporates more slowly.
Temperature/Humidity/Sun/ Wind (THSW) Index
The THSW Index uses humidity and temperature like for the
Heat Index, but also includes the heating effects of sunshine
and the cooling effects of wind (like wind chill) to calculate an
apparent temperature of what it “feels” like out in the sun. The
THSW Index requires a solar radiation sensor.
Humidity
Humidity itself simply refers to the amount of water vapor
in the air. However, the total amount of water vapor that the
air can contain varies with air temperature and pressure.
Relative humidity takes into account these factors and offers
a humidity reading which reects the amount of water vapor
in the air as a percentage of the amount the air is capable of
holding. Relative humidity, therefore, is not actually a measure
of the amount of water vapor in the air, but a ratio of the air’s
water vapor content to its capacity. When we use the term
humidity in the manual and on the screen, we mean relative
humidity.
It is important to realize that relative humidity changes with
temperature, pressure, and water vapor content. A parcel of
air with a capacity for 10 g of water vapor which contains 4 g
of water vapor, the relative humidity would be 40%. Adding 2 g
more water vapor (for a total of 6 g) would change the humidity
to 60%. If that same parcel of air is then warmed so that it has
a capacity for 20 g of water vapor, the relative humidity drops
to 30% even though water vapor content does not change.
Relative humidity is a crucial factor in determining the amount
of evaporation from plants and wet surfaces since warm air
with low humidity has a large capacity to absorb extra water
vapor.
page – 17
davisinstruments.com

DAVIS | WeatherLink Console User Guide
Dew Point
Dew point is the temperature to which air must be cooled
for saturation (100% relative humidity) to occur, providing
there is no change in water vapor content. The dew point is an
important measurement used to predict the formation of dew,
frost, and fog. If dew point and temperature are close together
in the late afternoon when the air begins to turn colder, fog
is likely during the night. Dew point is also a good indicator of
the air’s actual water vapor content, unlike relative humidity,
which takes the air’s temperature into account. High dew point
indicates high water vapor content; low dew point indicates low
water vapor content. In addition, a high dew point indicates a
better chance of rain, severe thunderstorms, and tornadoes.
You can also use dew point to predict the minimum overnight
temperature. Provided no new fronts are expected overnight
and the afternoon relative humidity is greater than or equal
to 50%, the afternoon’s dew point gives you an idea of what
minimum temperature to expect overnight, since the air can
never get colder than the dew point. Dew point is equal to air
temperature when humidit y = 100%.
Rain
Your Vantage Pro2 or Vantage Vue sensor suite uses a tipping
spoon rain collector that measures 0.01” or 0.2mm for each tip
of the spoon. Your Console logs rain data in the same units it
is measured in and converts the logged totals into the selected
display units (inches or millimeters) at the time it is displayed.
Four separate variables track rain totals: “rain storm,” “daily
rain,” “monthly rain,” and “yearly rain.” Rain rate calculations
are based on the interval of time between each bucket tip,
which is each 0.01’’ rainfall increment or 0.2 mm.
Barometric Pressure
The weight of the air that makes up our atmosphere exerts
pressure on the surface of the earth. This pressure is
known as atmospheric pressure. Generally, the more air
above an area, the higher the atmospheric pressure, this
means that atmospheric pressure changes with altitude.
For example, atmospheric pressure is greater at sea level
than on a mountaintop. To compensate for this difference
and facilitate comparison between locations with different
altitudes, atmospheric pressure is generally adjusted to the
equivalent sea level pressure. This adjusted pressure is known
as barometric pressure. The Console measures atmospheric
pressure. When you enter your location’s altitude, the Console
stores the necessary offset value to consistently translate
atmospheric pressure into barometric pressure.
Barometric pressure also changes with local weather
conditions, making barometric pressure an extremely
important and useful weather forecasting tool. High-
pressure zones are generally associated with fair weather
while low-pressure zones are linked with poor weather. For
forecasting purposes, however, the absolute barometric
pressure value is generally less important than the change
in barometric pressure. In general, rising pressure indicates
improving weather conditions while falling pressure indicates
deteriorating weather conditions.
Solar Radiation
What we call “current solar radiation” is technically known as
Global Solar Radiation, a measure of the intensity of the sun’s
radiation reaching a horizontal surface. This irradiance includes
both the direct component from the sun and the reected
component from the rest of the sky. The solar radiation
reading gives a measure of the amount of solar radiation
hitting the solar radiation sensor at any given time, expressed
in Watts/sq. meter (W/m2). Solar radiation requires the solar
radiation sensor.
UV (Ultraviolet) Radiation
Energy from the sun reaches the earth as visible, infrared,
and ultraviolet (UV) rays. Exposure to UV rays can cause
numerous health problems, such as sunburn, skin cancer,
skin aging, cataracts, and can suppress the immune system.
The Vantage Pro2 helps analyze the changing levels of UV
radiation and can advise of situations where exposure is
particularly unacceptable. UV radiation requires the UV
radiation sensor. The Console displays UV readings in two
scales: MEDs and UV Index.
page – 18
davisinstruments.com

DAVIS | WeatherLink Console User Guide
Note: Your station’s UV readings do not take into
account UV reected off snow, sand, or water, which
can signicantly increase your exposure. Nor do your UV
readings take into account the dangers of prolonged UV
exposure. The readings do not suggest that any amount
of exposure is safe or healthful. Do not use your Console
to determine the amount of UV radiation to which you
expose yourself. Scientic evidence suggests that UV
exposure should be avoided and that even low UV doses
can be harmful.
UV MEDs
MED (Minimum Erythemal Dose) is dened as the amount of
sunlight exposure necessary to induce a barely perceptible
redness of the skin within 24 hours after sun exposure. In
other words, exposure to 1 MED will result in a reddening of
the skin. Because different skin types burn at different rates,
1 MED for persons with very dark skin is different from 1 MED
for persons with very light skin.
Both the U.S. Environmental Protection Agency (EPA) and
Environment Canada have developed skin type categories
correlating characteristics of skin with rates of sunburn.
UV Index
The Console can also display UV Index, an intensity
measurement rst dened by Environment Canada and since
been adopted by the World Meteorological Organization. UV
Index assigns a number between 0 and 16 to the current UV
intensit y. The US EPA categorizes the Index values as shown
in table A-3. The lower the number, the lower the danger
of sunburn. The Index value published by the U.S. National
Weather Service is a forecast of the next day’s noontime
UV intensity. The index values displayed are real-time
measurements.
page – 19
davisinstruments.com

DAVIS | WeatherLink Console User Guide
Evapotranspiration (ET)
Evapotranspiration (ET) is a measurement of the amount of
water vapor returned to the air in a given area. It combines
the amount of water vapor returned through evaporation
(from wet surfaces) with the amount of water vapor returned
through transpiration (exhaling of moisture through plant
stomata) to arrive at a total. Effectively, ET is the opposite
of rainfall, and it is expressed in the same units of measure
(inches, millimeters).
The Console uses air temperature, relative humidity, average
wind speed, and solar radiation data to estimate ET, which is
calculated once an hour on the hour. ET requires the optional
solar radiation sensor.
Leaf Wetness
Leaf wetness provides an indication of whether the surface
of foliage in the area is wet or dry by indicating how wet the
surface of the sensor is. The leaf wetness reading ranges
from 0 (dry) to 15. Leaf wetness requires an optional Leaf &
Soil Moisture/Temperature Station and is only available for
Wireless Vantage Pro2 Stations.
Soil Moisture
Soil Moisture, as the name suggests, is a measure of the
moisture content of the soil. Soil moisture is measured on a
scale of 0 to 200 centibars and can help choose times to water
crops. The soil moisture sensor measures the vacuum created
in the soil by the lack of moisture. A high soil moisture reading
indicates dryer soil; a lower soil moisture reading means
wetter soil. Soil Moisture requires an optional Leaf & Soil
Moisture/Temperature Station or Soil Moisture Station and is
only available for Wireless Vantage Pro2 Stations.
Time
The Console has a built-in clock and calendar for time and
date. When connected to Wi-Fi, the user sets the location and
the Console then automatically sets the current time/date,
and time zone, as well as determining whether Daylight Saving
Time is in use.
page – 20
davisinstruments.com

DAVIS | WeatherLink Console User Guide
APPENDIX B: SPECIFICATIONS
Console Operating Temperature +32° to +122° F (0° to +50° C)
Non-Operating (Storage) Temperature -20° to +60° C (-4° to +60° C)
Console Current Draw 2A max
Power Adapter 5 VDC, 2000 mA
Battery Backup Lithium Polymer
Battery Life (no AC power) Less than one day when fully charged
Console Display Type In-Plane Switching LED
Dimensions
Console 8.25” x 6” x 0.75” (210mm x 152mm x 19mm)
Display Area 6.75” X 4.25” (171mm x 107mm)
Weight 1.1 pounds (501 grams)
Wireless Communication Specications and Receive Frequencies:
USA 902 - 928 MHz FHSS
EU 868.0 - 868.6 MHz FHSS
Australia, Brazil 918 - 926 MHz FHSS
New Zealand, Peru 921 - 928 MHz FHSS
India 865 - 867 MHz FHSS
Japan 928.15 - 929.65 MHz FHSS
Taiwan, Pakistan 920 - 925 MHz FHSS
ID codes available 8
Range
Line of Sight up to 1000 feet (300 m)
Through Walls 200 to 400 feet (75 to 120 m)
page – 21
davisinstruments.com

DAVIS | WeatherLink Console User Guide
APPENDIX C: UPDATE INTERVALS AND WEATHER DATA SPECIFICATIONS
Update Intervals by Sensor
Barometric Pressure 1 minute
Barometer
Inside Humidity 1 minute
Outside Humidity 50 seconds
Humidity
Dew Point 10 seconds
Rainfall Amount 20 seconds
Rain
Rain Storm Amount 20 seconds
Rain Rate 20 seconds
Inside Temperature 1 minute
Temperature
Outside Temperature 10 seconds
Heat Index 10 seconds
Wind Chill 10 Seconds
Wind Speed 2.5 seconds
Wind
Wind Direction 2.5 seconds
Direction of High Speed 2.5 seconds
ET Evapotranspiration 1 hour
page – 22
davisinstruments.com

DAVIS | WeatherLink Console User Guide
Specications by Sensor
The following specications may include parameters that require optional sensors that may not be installed on your sensor suite.
Variable Resolution Range Nominal Accuracy
Barometric Pressure**
Barometric Trend (3 hour)
Evapotranspiration (ET)*
Inside Temperature
Outside Temperature*
Extra Temperature
Inside Humidity
Outside Humidity
Extra Humidity
Dew Point
Heat Index
Daily & Storm Rainfall
Monthly & Yearly Rainfall
Rain Rate
Evapotranspiration (ET)
0.01'' Hg; 0.1 mm Hg;
0.1 hPa; 0.1 mb
Change Rates Rapidly:
≥.06'' Hg; 1.5 mm Hg; 2 hPa; 2 mb
Slowly: ≥.02'' Hg; 0.5 mm Hg; 0.7
hPa; 0.7 mb
0.01''; 0.1 mm 199.99''; 1999.9mm Greater of 5% or 0.01'';
0.1ºF; 0.1ºC +32º to +140ºF; 0 to +60ºC 0.4ºF; 0.2ºC
0.1ºF; 0.1ºC -40º to +150ºF; -40º to +65ºC 0.5º F, 0.3ºC Pro
0.1ºF; 0.1ºC -40º to +150ºF; -40º to +65ºC 1ºF; 0.5ºC
1% 1 to 100% 2% RH
1% 1 to 100% 2% RH
1% 1 to 100% 2% RH
1ºF; 1ºC 105º to +130ºF; -76º to +54ºC 2ºF; 1ºC
1ºF; 1ºC - 40ºto +165ºF; -40º to +74º C 2ºF; 1ºC
0.01''; 0.2 mm to 99.99", 999.8 mm Greater of 3% or 1 tip
0.01''; 0.2 mm
(1mm at totals over 2000 mm)
0.01''; 0.1 mm to 40''/hr.; 1016 mm/hr. 5% when rate is under 5”/hr.; 127
0.01''; 0.1 mm 199.99''; 1999.9 mm greater of 5% or 0.01’’; 0.25 mm
16'' to 32.5'' Hg; 410 to 820 mm Hg;
540 to 1100 hPa; 540 to 1100 mb
5 Arrow Positions: Rising Rapidly
Rising Slowly Steady Falling
Slowly Falling Rapidly
to 199.99''; 6553 mm Greater of 4% or 1 tip
0.03'' Hg; 0.8 mm Hg 1.0 hPa; 1.0 m
0.25 mm
1ºF; 0.5ºC VUE
mm/hr.
Requires Solar Radiation Sensor
Solar Radiation
1 W/m2 0 to 1800 W/m2 5% of full scale
Requires Solar Radiation Sensor
UV Index
0.1 Index 0.0 to 16.0 5% of full scale
Requires UV Sensor
Wind Direction
Compass Rose
Wind Speed
Wind Chill
Leaf Wetness
1º 1 to 360º 3º
22.5º 16 compass pts.
1 mph; 1 kt; 0.5 m/s; 1 km/h 0 to 200 mph; 0 to 173 kts 3 to
322 km/h, 0 to 89 m/s
1ºF; 1ºC -110º to +135ºF -79º to +57ºC 2ºF; 1ºC
1 0 to 15 0.5
Greater of 2 mph/kts; 1 m/s; 3
km/h or 5%
(on Leaf & Soil Stn.)
Leaf Wetness
1 cb 0 to 200 cb
(on Leaf & Soil Stn.)
* Outside temperature accuracy is based on the temperature sensor itself and not on the sensor and the passive shielding together. The solar radiation induced
error for the radiation shield: +4ºF (2ºC) at solar noon with the wind speed at less than or equal to 2 mph (1 m/s); The higher the wind speed, the less solar
radiation induced error.
**Barometric pressure readings are standardized to sea level. Elevation Range: -1410’ to +15,000’; -600 to +4660 m.
page – 23
davisinstruments.com

DAVIS | WeatherLink Console User Guide
APPENDIX D: WIRELESS REPEATER CONFIGURATION
A Vantage Pro2 Wireless Repeater (#7627) or Long-Range Wireless Repeater (#7654) increase transmission distances or improve
transmission quality between a station and the Console. A repeater receives information transmitted from a transmitting
station and retransmits it to the Console. Depending on transmission distance, one repeater or several repeaters can be used to
collect and retransmit weather data. Console communicating with repeaters must be set up with the correct Transmitter ID and
Repeater ID before the Console can correctly receive station information.
1. On the Account tab, tap Console Conguration, then tap the pencil icon on Stations and Sensors.
2. Scroll down to the sensor you want to retransmit and tap Edit, then tap Advanced Settings.
3. In the Repeater eld, tap > and choose the repeater name that you want console to listen to. If you have more than
one this is the one that is closest to the Console. Tap Save Changes.
4. To verify that you have successfully set up your console to receive the repeater, wait 15 minutes to see data appear.
FCC Part 15 Class B Registration Warning
This equipment has been tested and found to comply with the limits for a Class B digital device, pursuant to Part 15 of the FCC
Rules. These limits are designed to provide reasonable protection against harmful interference in a residential installation. This
equipment radiates radio frequency energy and, if not installed and used in accordance with the instructions, may cause harmful
interference to radio communications.
However, there is no guarantee that interference will not occur in a particular installation.
This device complies with part 15 of the FCC Rules. Operation is subject to the following two conditions: (1) this device may not
cause harmful interference, and (2) this device must accept any interference, including interference received, including inference
that may cause undesired operation.
If this equipment does cause harmful inter ference to radio or television reception, which can be determined by turning the
equipment on and off, the user is encouraged to try to correct the interference by one or more of the following measures:
• Reorient or relocate the receiving antenna.
• Increase the separation between the equipment and receiver.
• Connect the equipment into an outlet on a circuit different from that to which the receiver is connected.
• Consult the dealer or an experienced radio/T V technician for help.
This device complies with Industry Canada license-exempt RSS standard(s). Operation is subject to the following two conditions:
(1) this device may not cause interference, and (2) this device must accept any interference, including interference that may cause
undesired operation of the device.
Le présent appareil est conforme aux CNR d’Industrie Canada applicables aux appareils radio exempts de licence. L’exploitation
est autorisée aux deux conditions suivantes: (1) l’appareil ne doit pas produire de brouillage, et (2) l’appareil doit accepter tout
brouillage radioelectrique subi, même si le brouillage est susceptible d’en compromettre le fonctionnement.
page – 24
davisinstruments.com

DAVIS | WeatherLink Console User Guide
Innovation, Science and Economic Development Canada ICES-003 Compliance Label: CAN ICES-3 (B)/NMB-3(B)
Changes or modication not expressly approved in writing by Davis Instruments may void the warranty and void the user’s
authority to operate this equipment.
FCC ID: IR2DWW6313U, IC: 3788A-6313U
Information Regarding Exposure to Radio Frequency Energy: The antenna used for this transmitter must be installed to provide
a separation distance of at least 20 cm from all persons and must not be co-located or operating in conjunction with any other
antenna or transmitter.
Davis Instruments, 3465 Diablo Ave., Hayward, CA 94545
Power Supply Model identier: FX18B-050200J1 or FX18E-040100J1
Input voltage: 100-240 VAC Input AC frequency: 50/60 Hz
Output voltage: 5.0 VDC Output current: 2.0 A
Output power: 10.0 W Average active eciency: 78.7%
Eciency at low load (10 %): N/A % No-load power consumption <0 .1 W
EC-Declaration of Conformity
Directive 2014/53/EU (RED) and 2014/30/EU (EMC)
Manufacturer/responsible person: Davis Instruments
Compliance Engineer
3465 Diablo Ave., Hayward, CA 94545 USA
Declares that the WeatherLink Console models 6313EU, 6313UK, and 6313USB are in compliance with Directive 2014/53/EU. The
full text of the EU Declaration of Conformity is available at https://www.davisinstruments.com/legal. RoHS Compliant.
WeatherLink Console User Guide
Document number: 7395.402 Rev. A 12/31/2022
For WeatherLink Consoles #6313, 6313EU, 6313UK, 6313USB
Vantage Pro, Vantage Vue, and WeatherLink are registered trademarks of Davis Instruments Corp., Hayward, CA.
Davis Instruments, 2022. All rights reserved.
Information in this document is subject to change without notice. Davis Instruments Quality Management is ISO 9001 certied.
page – 25
davisinstruments.com
 Loading...