

Page 1

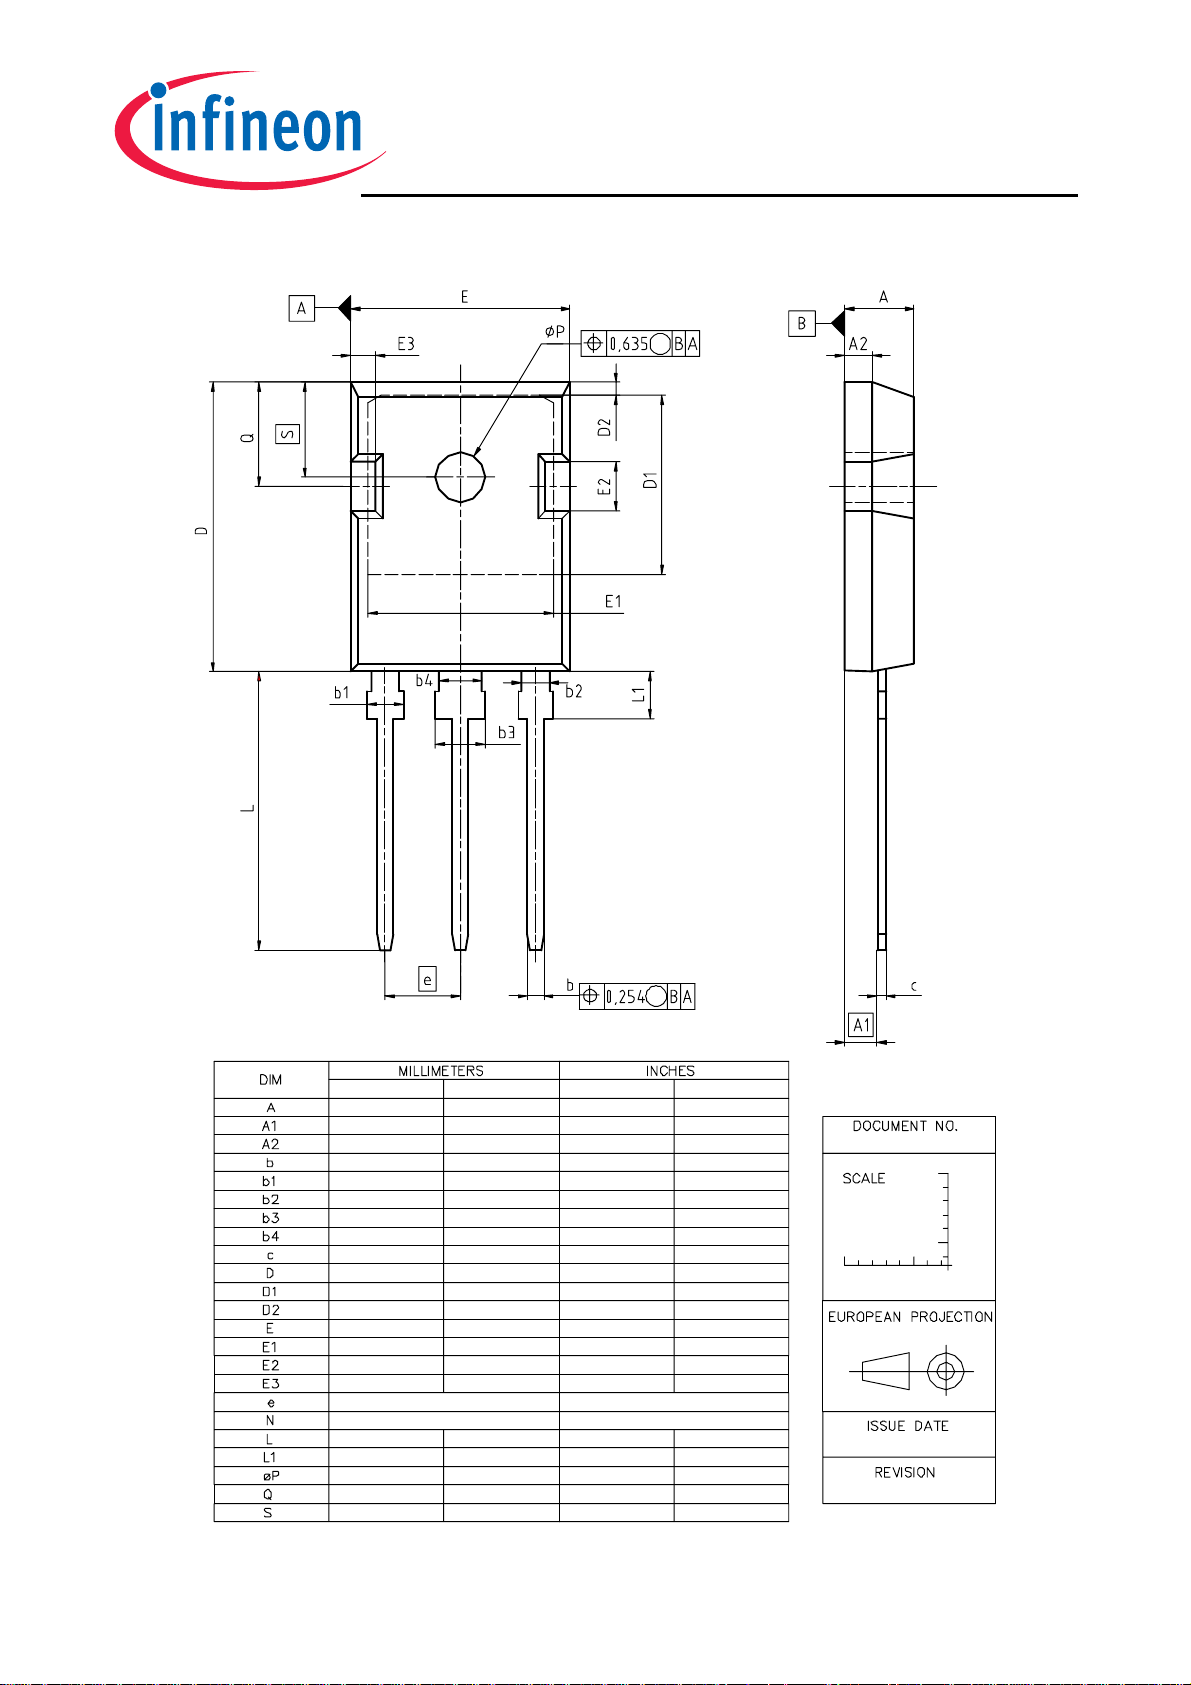
SKW30N60
Fast IGBT in NPT-technology with soft, fast recovery anti-parallel EmCon diode
• 75% lower E
compared to previous generation
off
combined with low conduction losses
• Short circuit withstand time – 10 µs
• Designed for:
- Motor controls
- Inverter
• NPT-Technology for 600V applications offers:
- very tight parameter distribution
- high ruggedness, temperature stable behaviour
- parallel switching capability
• Very soft, fast recovery anti-parallel EmCon diode
• Pb-free lead plating; RoHS compliant
• Qualified according to JEDEC
1
for target applications
• Complete product spectrum and PSpice Models : http://www.infineon.com/igbt/
Type V
I
CE
C
V
Tj Marking Package
CE(sat)
C
G
E
PG-TO-247-3
SKW30N60 600V 30A 2.5V
150°C
K30N60 PG-TO-247-3
Maximum Ratings
Parameter Symbol Value Unit
Collector-emitter voltage VCE 600 V
DC collector current
= 25°C
T
C
= 100°C
T
C
Pulsed collector current, tp limited by T
Turn off safe operating area
≤ 600V, Tj ≤ 150°C
V
CE
Diode forward current
= 25°C
T
C
= 100°C
T
C
Diode pulsed current, tp limited by T
jmax
I
jmax
I
I
C
Cpuls
-
I
F
Fpuls
Gate-emitter voltage VGE
Short circuit withstand time
VGE = 15V, V
≤ 600V, Tj ≤ 150°C
CC
Power dissipation
= 25°C
T
C
Soldering temperature
2
tSC 10
P
tot
Ts 260 °C
41
30
112
112
41
30
112
±20
250 W
A
V
µs
wavesoldering, 1.6 mm (0.063 in.) from case for 10s
Operating junction and storage temperature Tj , T
-55...+150
stg
°C
1
J-STD-020 and JESD-022
2
Allowed number of short circuits: <1000; time between short circuits: >1s.
1 Rev. 2_2 Sep 08
Page 2

SKW30N60
Thermal Resistance
Parameter Symbol Conditions Max. Value Unit
Characteristic
IGBT thermal resistance,
junction – case
Diode thermal resistance,
junction – case
Thermal resistance,
junction – ambient
Electrical Characteristic, at T
= 25 °C, unless otherwise specified
j
Parameter Symbol Conditions
Static Characteristic
Collector-emitter breakdown voltage V
Collector-emitter saturation voltage V
Diode forward voltage
Gate-emitter threshold voltage V
Zero gate voltage collector current I
Gate-emitter leakage current I
Transconductance gfs VCE=20V, IC=30A - 20 - S
Dynamic Characteristic
Input capacitance C
Output capacitance C
Reverse transfer capacitance C
Gate charge Q
Internal emitter inductance
measured 5mm (0.197 in.) from case
Short circuit collector current1) I
R
0.5
thJC
K/W
R
R
1
thJCD
40
thJA
Value
Unit
min. Typ. max.
(BR)CES
CE(sat)
VGE=0V, I
VGE = 15V, IC=30A
=25°C
T
j
=150°C
T
j
=500µA
C
VF VGE=0V, IF=30A
=25°C
T
j
=150°C
T
j
=700µA,V
GE(th)
CES
GES
- 1600 1920
iss
oss
rss
Gate
I
C
CE=VGE
VCE=600V,VGE=0V
=25°C
T
j
=150°C
T
j
VCE=0V,VGE=20V - - 100 nA
=25V,
V
CE
V
- 150 180
=0V,
GE
f=1MHz
VCC=480V, IC=30A
V
=15V
GE
600 - -
1.7
-
1.2
-
2.1
2.5
1.4
1.25
2.4
3.0
1.8
1.65
3 4 5
-
-
-
-
40
3000
- 92 110
- 140 182 nC
V
µA
pF
LE - 13 - nH
C(SC)
=15V,t
V
GE
≤ 600V,
V
CC
≤ 150°C
T
j
≤10µs
SC
- 300 - A
1)
Allowed number of short circuits: <1000; time between short circuits: >1s.
2 Rev. 2_2 Sep 08
Page 3
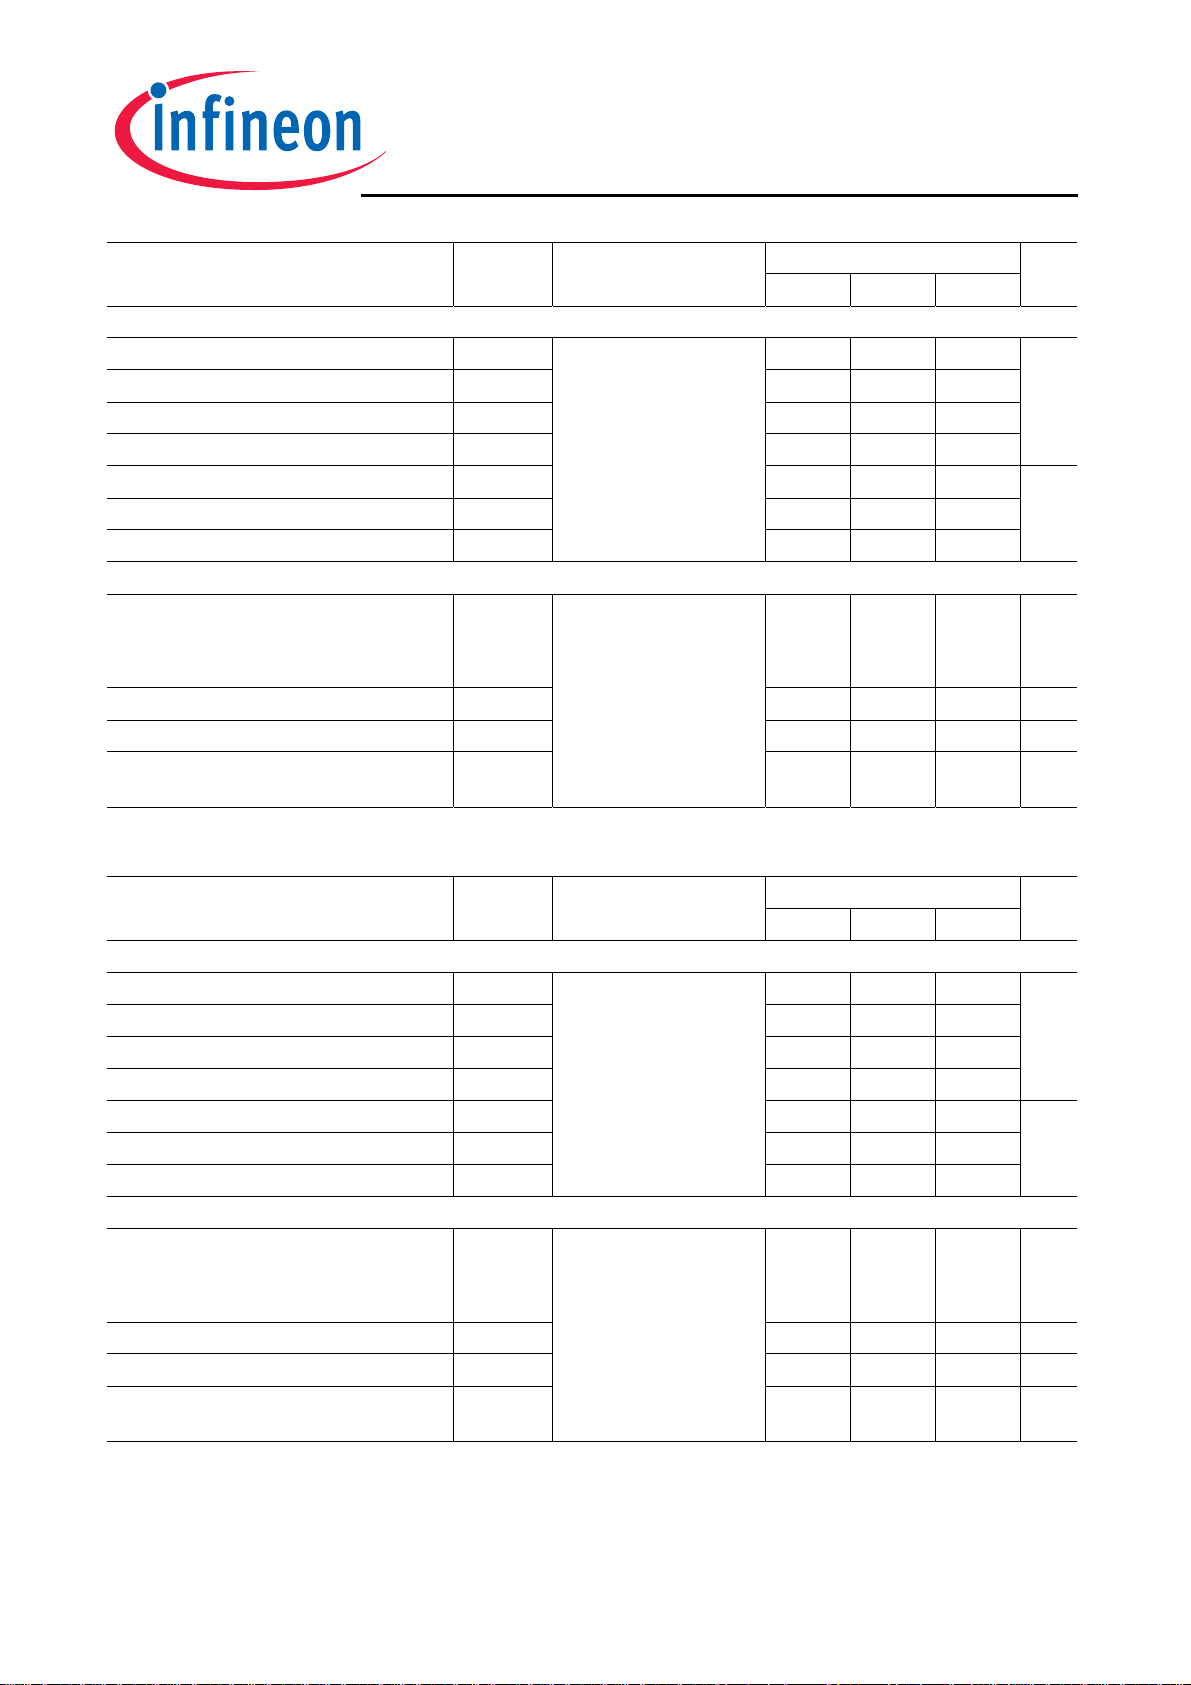
SKW30N60
Switching Characteristic, Inductive Load, at T
Parameter Symbol Conditions
IGBT Characteristic
Turn-on delay time t
d(on)
Rise time tr - 34 40
Turn-off delay time t
d(off)
Fall time tf - 58 70
Turn-on energy Eon - 0.64 0.77
Turn-off energy E
off
Total switching energy Ets
Anti-Parallel Diode Characteristic
Diode reverse recovery time t
rr
t
S
tF
Diode reverse recovery charge Qrr - 610 - nC
Diode peak reverse recovery current I
Diode peak rate of fall of reverse
recovery current during t
b
di
rrm
rr
Switching Characteristic, Inductive Load, at T
Parameter Symbol Conditions
IGBT Characteristic
Turn-on delay time t
Rise time tr - 34 40
Turn-off delay time t
Fall time tf - 67 80
Turn-on energy Eon - 0.98 1.18
Turn-off energy E
Total switching energy Ets
Anti-Parallel Diode Characteristic
Diode reverse recovery time t
Diode reverse recovery charge Qrr - 1740 - nC
Diode peak reverse recovery current I
Diode peak rate of fall of reverse
recovery current during t
b
d(on)
d(off)
off
rr
t
S
tF
rrm
di
rr
=25 °C
j
Value
Unit
min. typ. max.
T
- 44 53
- 291 349
- 0.65 0.85
=25°C,
j
V
=400V,IC=30A,
CC
V
=0/15V,
GE
R
=11Ω,
G
1)
=180nH,
L
σ
1)
=900pF
C
σ
Energy losses include
“tail” and diode
reverse recovery.
T
=25°C,
j
V
=200V, IF=30A,
R
/dt=200A/µs
di
F
ns
mJ
- 1.29 1.62
-
-
-
400
32
368
-
ns
-
-
- 5.5 - A
/dt
=150 °C
j
- 180 -
Value
A/µs
Unit
min. typ. max.
T
- 44 53
- 324 389
- 0.92 1.19
=150°C
j
V
=400V,IC=30A,
CC
V
=0/15V,
GE
R
= 11Ω,
G
1)
=180nH,
L
σ
1)
=900pF
C
σ
Energy losses include
“tail” and diode
reverse recovery.
T
=150°C
j
V
=200V, IF=30A,
R
/dt=200A/µs
di
F
ns
mJ
- 1.90 2.38
-
-
-
520
56
464
-
ns
-
-
- 9.0 - A
/dt
- 200 -
A/µs
1)
Leakage inductance L
and Stray capacity Cσ due to dynamic test circuit in Figure E.
σ
3 Rev. 2_2 Sep 08
Page 4
SKW30N60
160A
t
=4µs
p
140A
I
c
100A
120A
100A
80A
TC=80°C
60A
, COLLECTOR CURRENT
40A
C
I
20A
0A
10Hz 100Hz 1kHz 10kHz 100kHz
TC=110°C
I
c
f, SWITCHING FREQUENCY
10A
, COLLECTOR CURRENT
C
I
0.1A
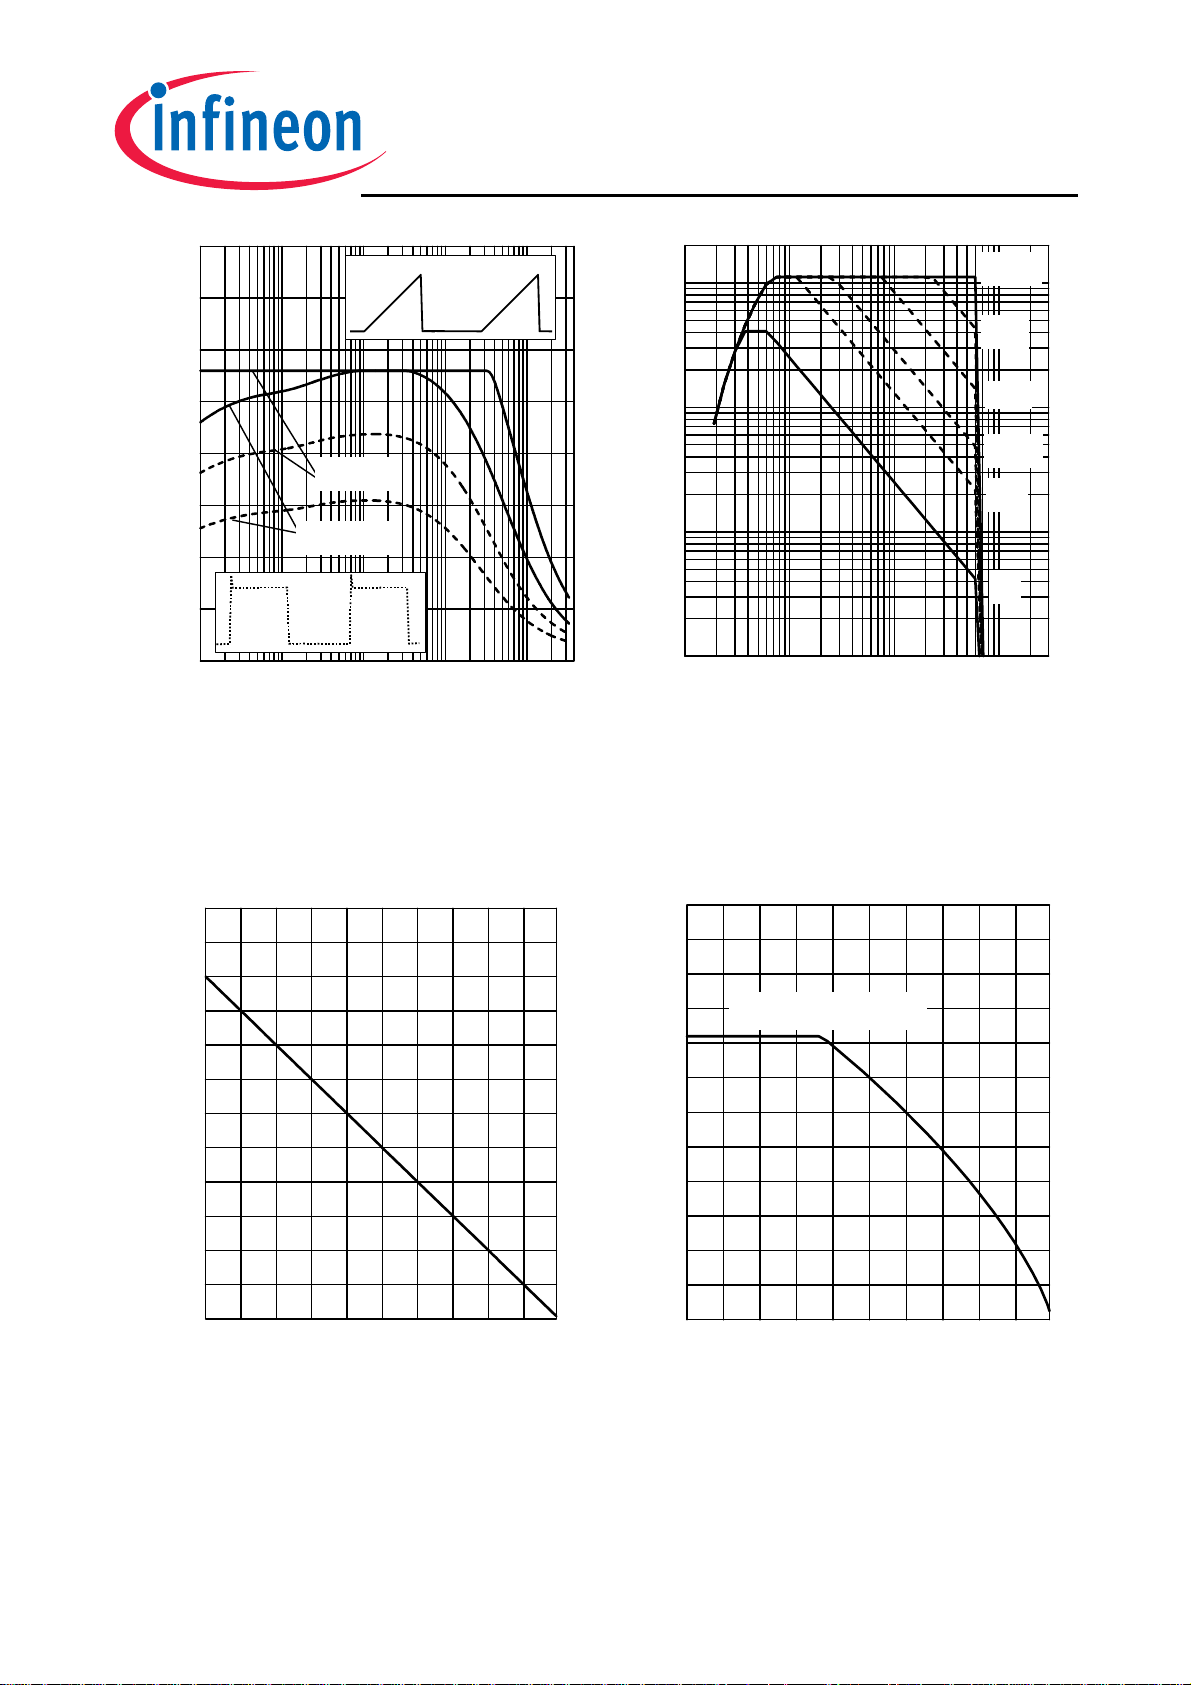
Figure 1. Collector current as a function of
switching frequency
≤ 150°C, D = 0.5, V
(T
j
= 0/+15V, R
V
GE
= 11Ω)
G
= 400V,
CE
300W
60A
1A
1V 10V 100V 1000V
VCE, COLLECTOR-EMITTER VOLTAGE
Figure 2. Safe operating area
(D = 0, T
= 25°C, Tj ≤ 150°C)
C
15µs
50µs
200µs
1ms
DC
250W
50A
Limited by bond wire
, POWER DISSIPATION
tot
P
200W
150W
100W
50W
0W
25°C 50°C 75°C 100°C 125°C
40A
30A
20A
, COLLECTOR CURRENT
C
I
10A
0A
25°C 50°C 75°C 100°C 125°C
TC, CASE TEMPERATURE TC, CASE TEMPERATURE
Figure 3. Power dissipation as a function
of case temperature
≤ 150°C)
(T
j
Figure 4. Collector current as a function of
case temperature
(V
≤ 15V, Tj ≤ 150°C)
GE
4 Rev. 2_2 Sep 08
Page 5
SKW30N60
90A
90A
80A
70A
60A
50A
40A
30A
, COLLECTOR CURRENT
C
I
20A
10A
0A
VGE=20V
15V
13V
11V
9V
7V
5V
0V 1V 2V 3V 4V 5V
80A
70A
60A
50A
40A
30A
, COLLECTOR CURRENT
C
I
20A
10A
0A
VGE=20V
15V
13V
11V
9V
7V
5V
0V 1V 2V 3V 4V 5V
VCE, COLLECTOR-EMITTER VOLTAGE VCE, COLLECTOR-EMITTER VOLTAGE
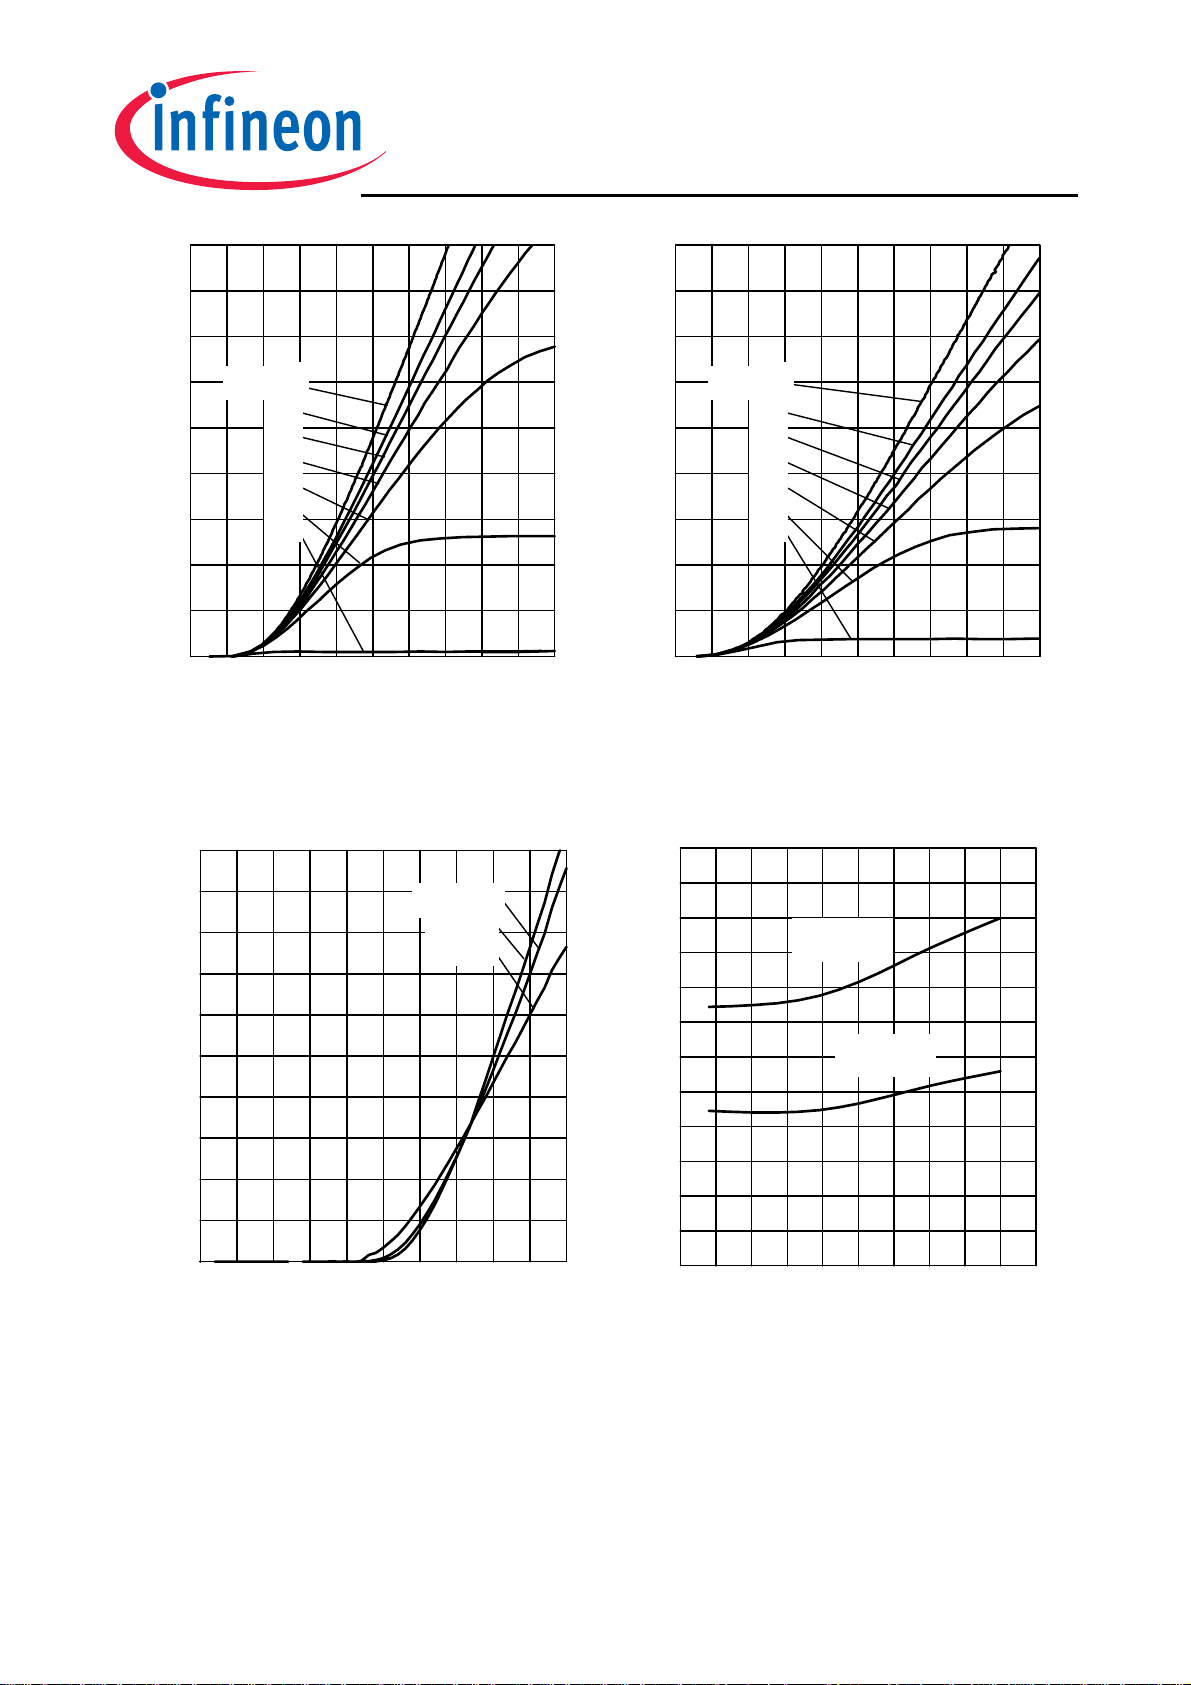
Figure 5. Typical output characteristics
= 25°C)
(T
j
Figure 6. Typical output characteristics
(T
= 150°C)
j
100A
4.0V
90A
80A
70A
60A
50A
40A
30A
, COLLECTOR CURRENT
C
I
20A
Tj=+25°C
-55°C
+150°C
3.5V
3.0V
2.5V
2.0V
IC = 60A
IC = 30A
1.5V
10A
0A
0V 2V 4V 6V 8V 10V
, COLLECTOR-EMITTER SATURATION VOLTAGE
CE(sat)
1.0V
V
-50°C 0°C 50°C 100°C 150°C
VGE, GATE-EMITTER VOLTAGE Tj, JUNCTION TEMPERATURE
Figure 7. Typical transfer characteristics
(V
= 10V)
CE
Figure 8. Typical collector-emitter
saturation voltage as a function of junction
temperature
= 15V)
(V
GE
5 Rev. 2_2 Sep 08
Page 6
SKW30N60
1000ns
t, SWITCHING TIMES
100ns
10ns
t
d(off)
t
f
t
d(on)
t
r
10A 20A 30A 40A 50A 60A
t, SWITCHING TIMES
1000ns
100ns
10ns
0Ω 10Ω 20Ω 30Ω 40Ω
IC, COLLECTOR CURRENT RG, GATE RESISTOR
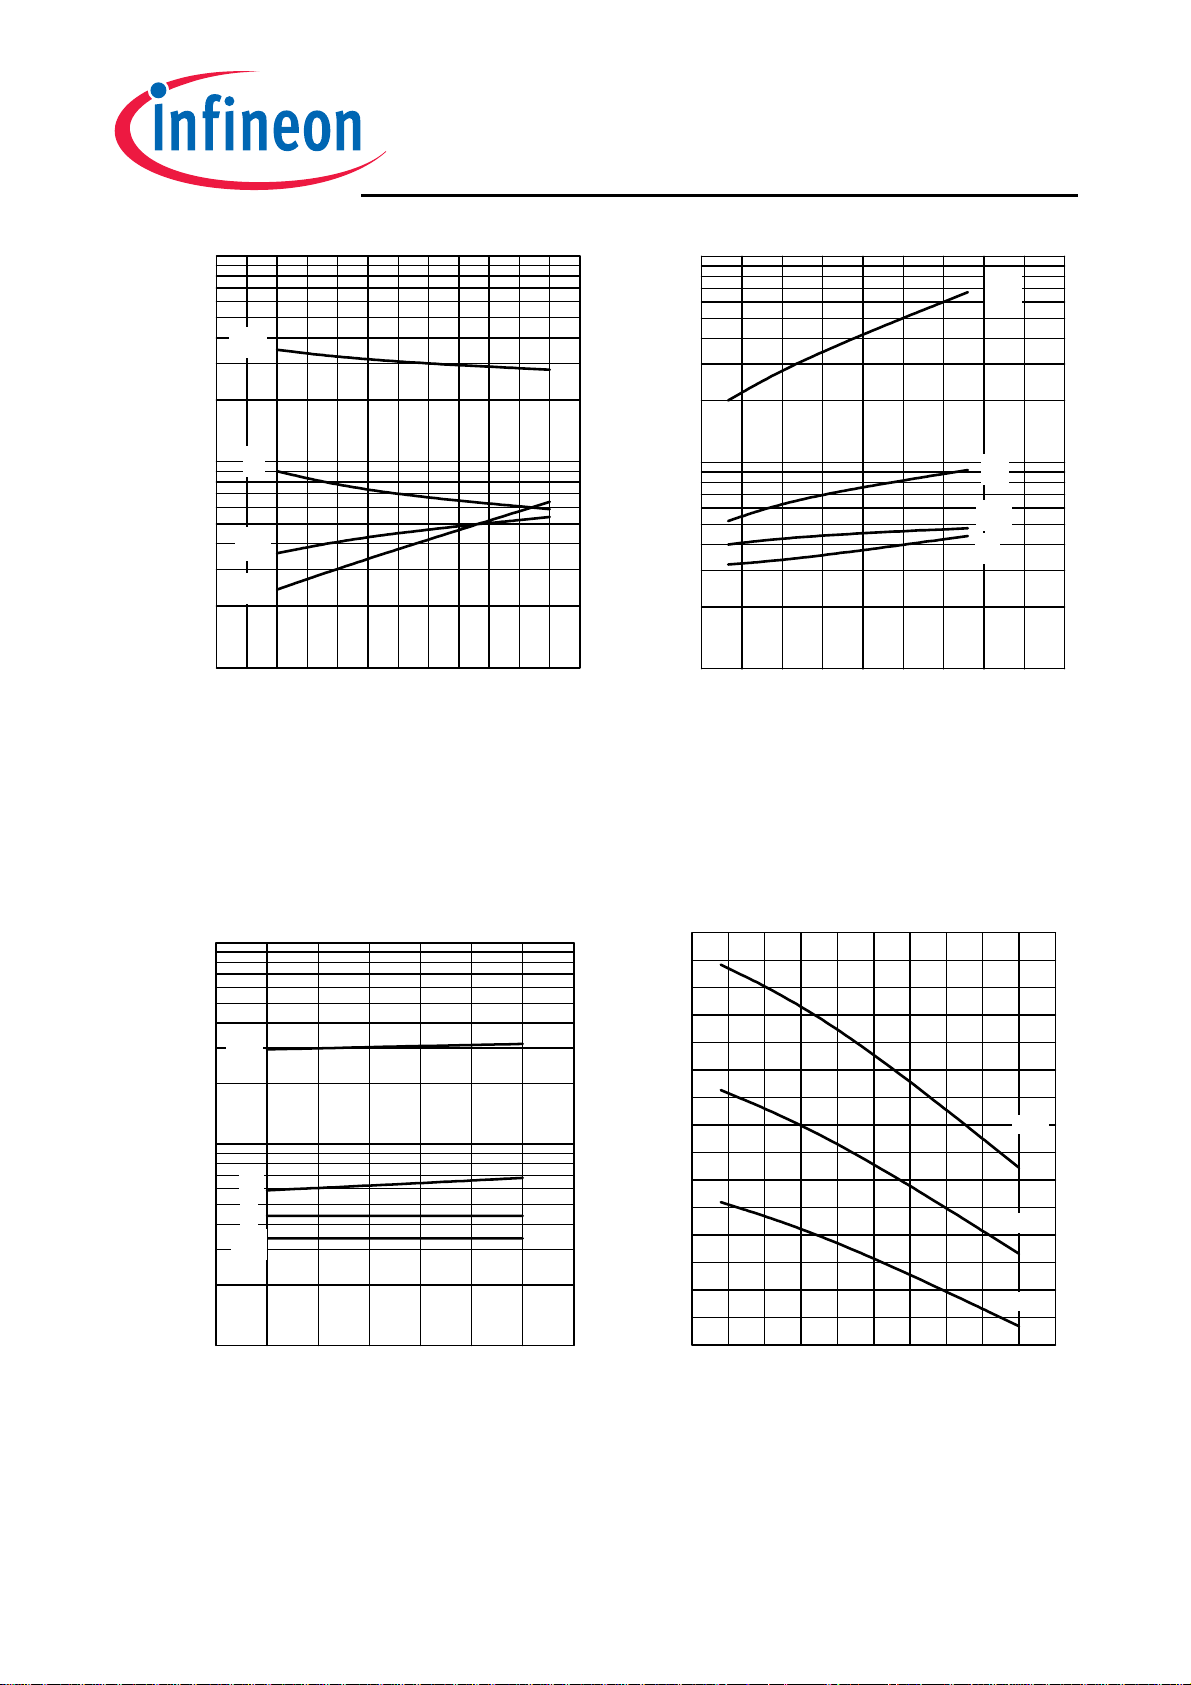
Figure 9. Typical switching times as a
function of collector current
(inductive load, T
= 0/+15V, R
V
GE
= 150°C, V
j
= 11Ω,
G
= 400V,
CE
Dynamic test circuit in Figure E)
Figure 10. Typical switching times as a
function of gate resistor
(inductive load, T
V
= 0/+15V, IC = 30A,
GE
= 150°C, V
j
= 400V,
CE
Dynamic test circuit in Figure E)
t
t
t
r
t
f
d(on)
d(off)
1000ns
5.5V
5.0V
t
d(off)
4.5V
4.0V
100ns
, GATE-EMITTER THRESHOLD VOLTAGE
GE(th)
V
3.5V
3.0V
2.5V
2.0V
-50°C 0°C 50°C 100°C 150°C
t
f
t
t, SWITCHING TIMES
t
r
d(on)
10ns
0°C 50°C 100°C 150°C
Tj, JUNCTION TEMPERATURE Tj, JUNCTION TEMPERATURE
Figure 11. Typical switching times as a
function of junction temperature
(inductive load, V
I
= 30A, R
C
= 11Ω,
G
= 400V, VGE = 0/+15V,
CE
Figure 12. Gate-emitter threshold voltage
as a function of junction temperature
(I
= 0.7mA)
C
Dynamic test circuit in Figure E)
max.
typ.
min.
6 Rev. 2_2 Sep 08
Page 7
SKW30N60
5.0mJ
4.5mJ
*) Eon and Ets include losses
due to diode recovery.
Ets*
4.0mJ
3.5mJ
*) Eon and Ets include losses
due to diode recovery.
4.0mJ
3.0mJ
3.5mJ
3.0mJ
2.5mJ
2.0mJ
Eon*
E
off
2.5mJ
2.0mJ
1.5mJ
1.5mJ
1.0mJ
1.0mJ
E, SWITCHING ENERGY LOSSES
0.5mJ
0.0mJ
10A 20A 30A 40A 50A 60A 70A
E, SWITCHING ENERGY LOSSES
0.5mJ
0.0mJ
0Ω 10Ω 20Ω 30Ω 40Ω
IC, COLLECTOR CURRENT RG, GATE RESISTOR
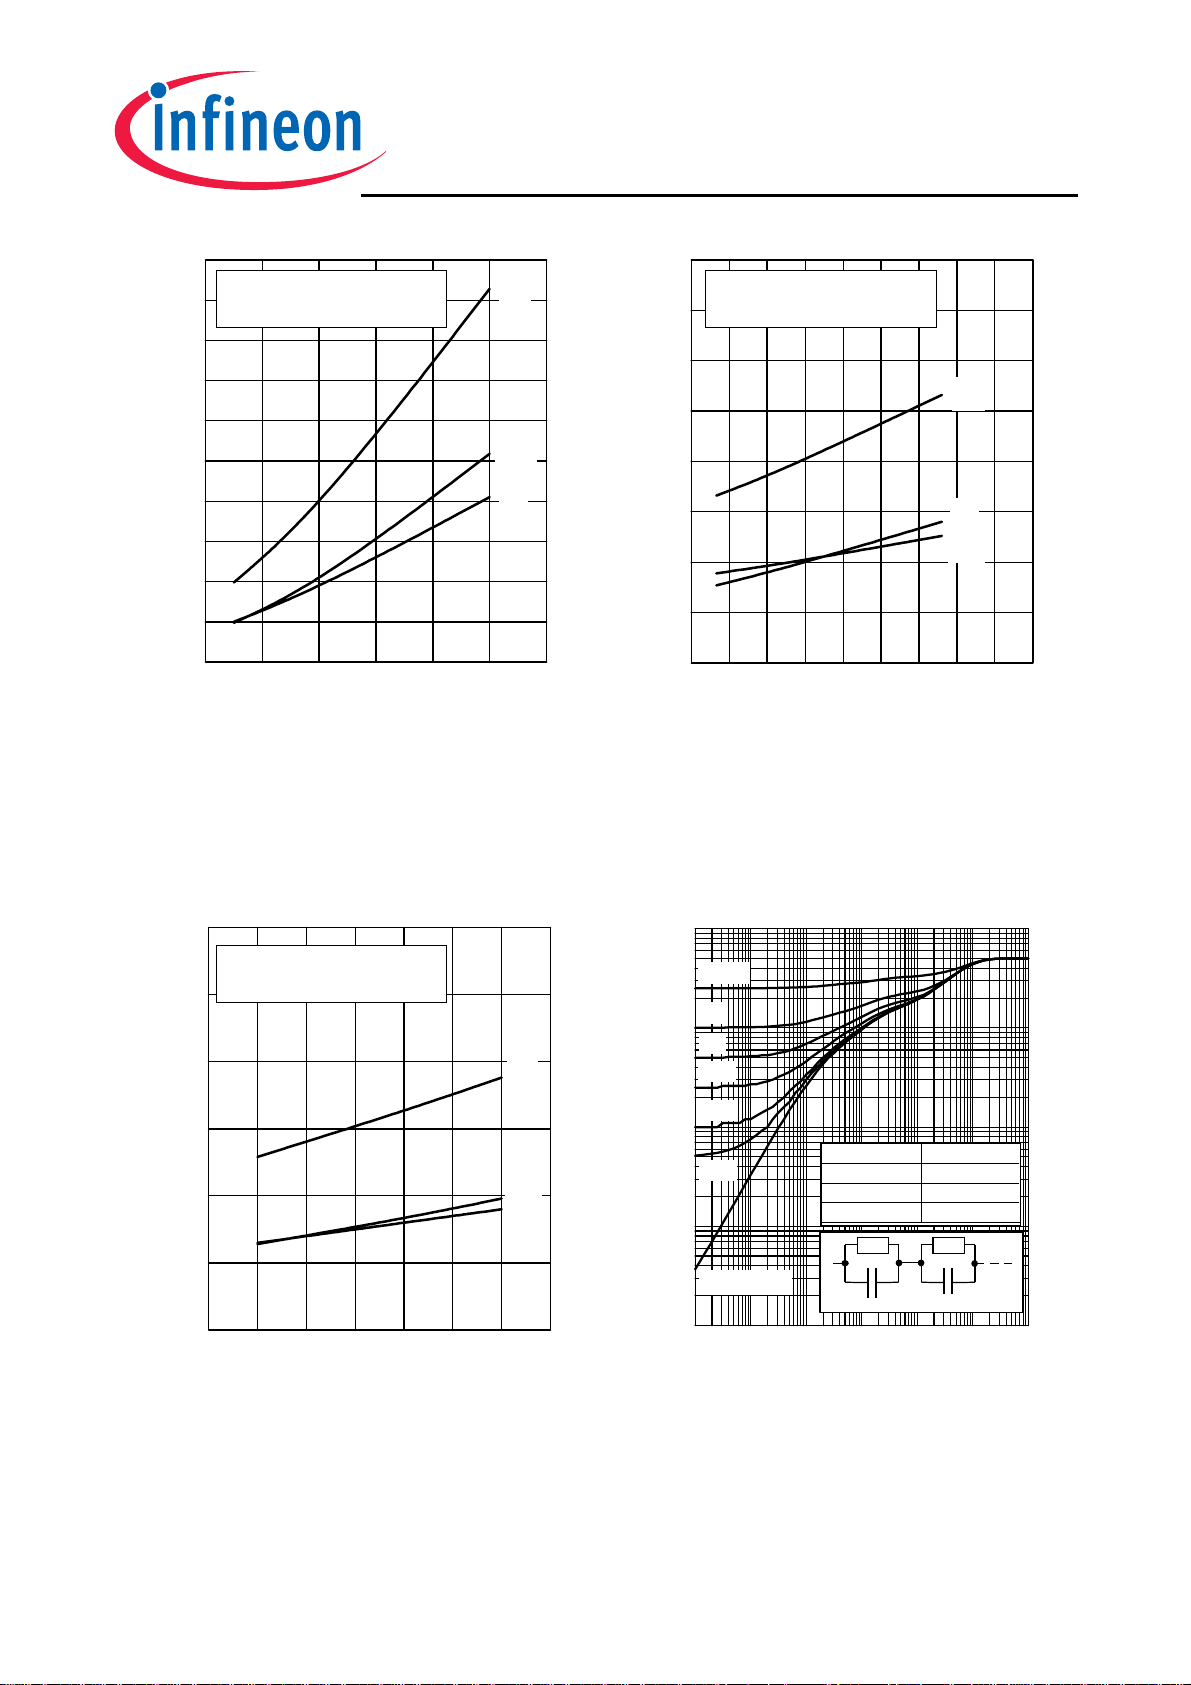
Figure 13. Typical switching energy losses
as a function of collector current
(inductive load, T
= 0/+15V, R
V
GE
= 150°C, V
j
= 11Ω,
G
= 400V,
CE
Dynamic test circuit in Figure E)
Figure 14. Typical switching energy losses
as a function of gate resistor
(inductive load, T
V
= 0/+15V, IC = 30A,
GE
= 150°C, V
j
= 400V,
CE
Dynamic test circuit in Figure E)
10
10
0
-1
K/W
K/W
D=0.5
0.2
0.1
0.05
3.0mJ
2.5mJ
2.0mJ
*) Eon and Ets include losses
due to diode recovery.
Ets*
Ets*
E
off
Eon*
1.5mJ
1.0mJ
E, SWITCHING ENERGY LOSSES
0.5mJ
0.0mJ
0°C 50°C 100°C 150°C
, JUNCTION TEMPERATURE
T
j
Figure 15. Typical switching energy losses
as a function of junction temperature
(inductive load, V
I
= 30A, R
C
= 11Ω,
G
= 400V, VGE = 0/+15V,
CE
Dynamic test circuit in Figure E)
Eon*
E
off
0.02
-2
K/W
10
-3
K/W
10
, TRANSIENT THERMAL IMPEDANCE
thJC
Z
-4
10
K/W
1µs 10µs 100µs 1ms 10ms 100ms 1s
t
0.01
single pulse
R ,(1/W)
0.3681 0.0555
0.0938 1.26*10
0.0380 1.49*10-4
R
1
C1=
τ
1
, PULSE WIDTH
p
τ
, (s)
-3
R
2
/ R
C2=
/ R
τ
1
2
2
Figure 16. IGBT transient thermal
impedance as a function of pulse width
(D = t
/ T)
p
7 Rev. 2_2 Sep 08
Page 8
µ
A
SKW30N60
25V
C
20V
15V
120V
1nF
480V
iss
C
oss
10V
100pF
C, CAPACITANCE
, GATE-EMITTER VOLTAGE
GE
5V
V
0V
0nC 50nC 100nC 150nC 200nC
10pF
0V 10V 20V 30V
QGE, GATE CHARGE VCE, COLLECTOR-EMITTER VOLTAGE
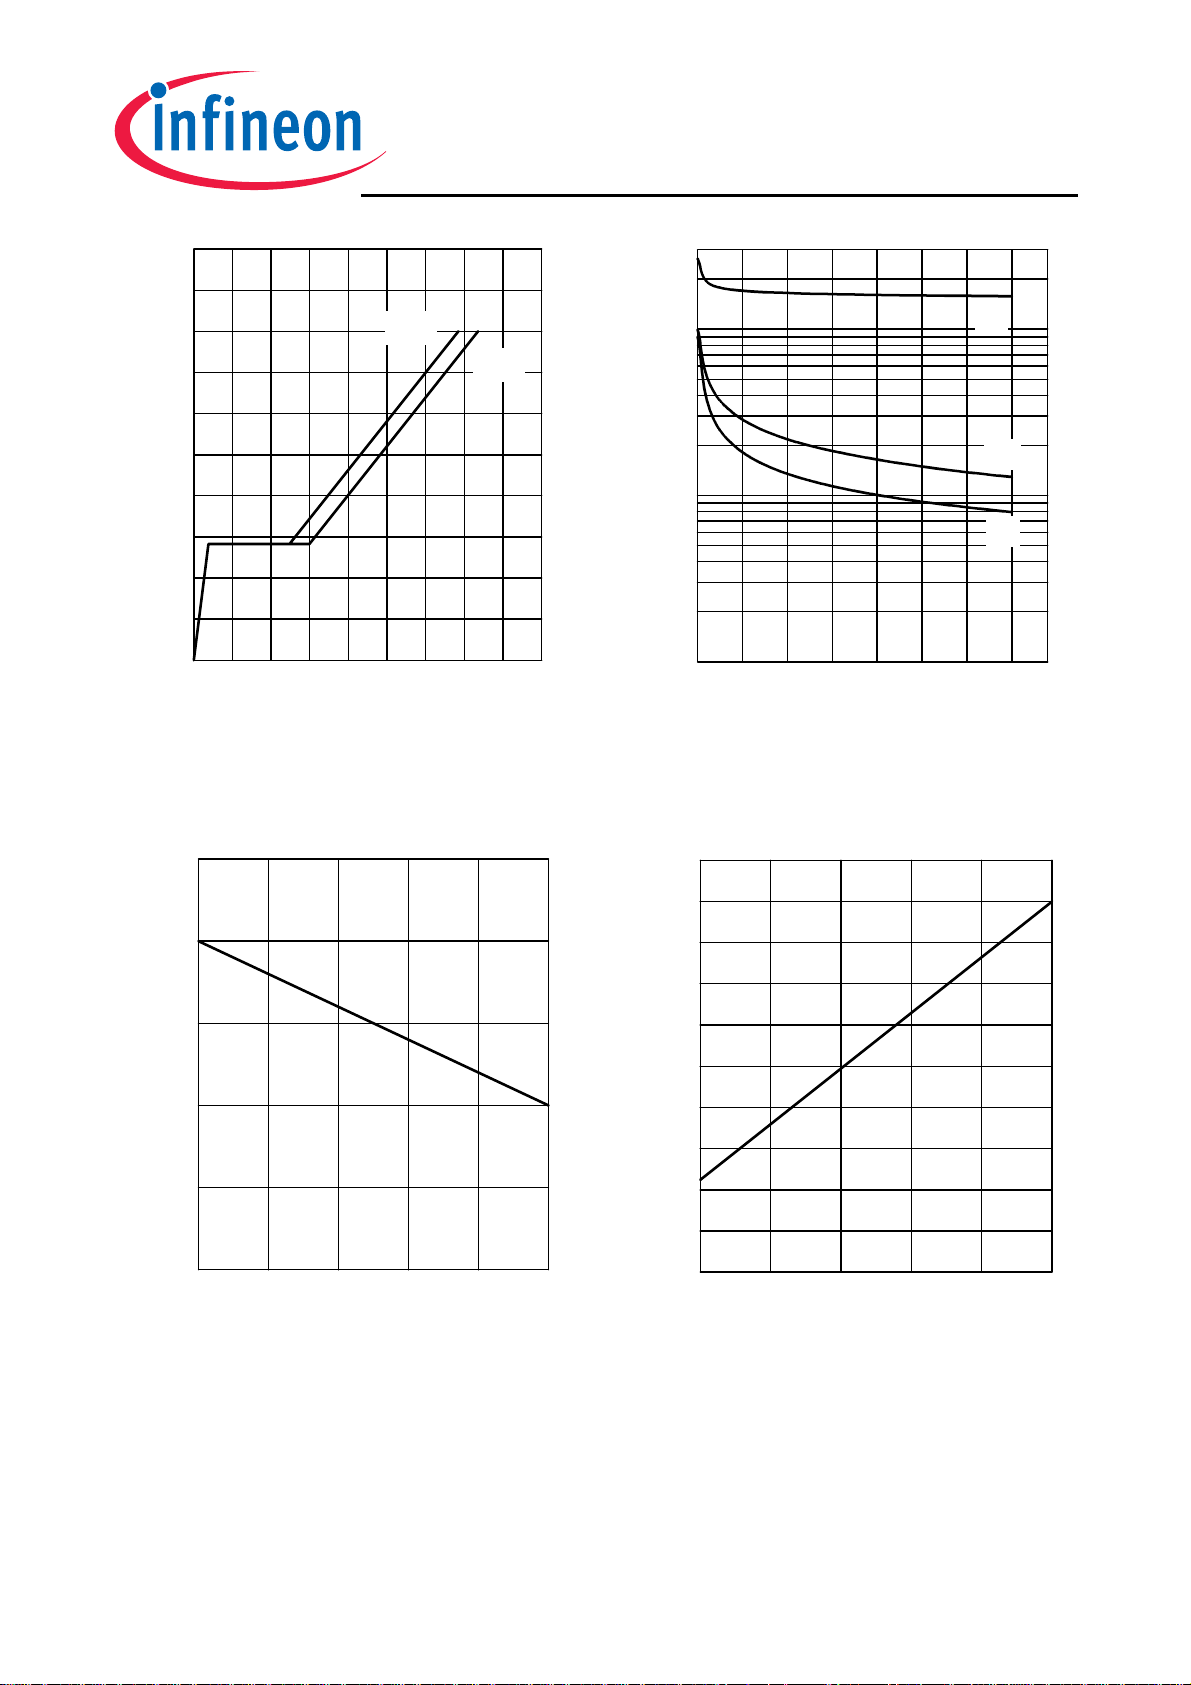
Figure 17. Typical gate charge
(I
= 30A)
C
Figure 18. Typical capacitance as a
function of collector-emitter voltage
(V
= 0V, f = 1MHz)
GE
25
20
15
s
µs
µs
500
450A
400A
350A
300A
250A
C
rss
10
µs
200A
150A
µs
5
, SHORT CIRCUIT WITHSTAND TIME
sc
t
µs
0
10V 11V 12V 13V 14V 15V
, SHORT CIRCUIT COLLECTOR CURRENT
C(sc)
I
100A
50A
0A
10V 12V 14V 16V 18V 20V
VGE, GATE-EMITTER VOLTAGE VGE, GATE-EMITTER VOLTAGE
Figure 19. Short circuit withstand time as a
function of gate-emitter voltage
= 600V, start at T
(V
CE
= 25°C)
j
Figure 20. Typical short circuit collector
current as a function of gate-emitter voltage
(V
≤ 600V, Tj = 150°C)
CE
8 Rev. 2_2 Sep 08
Page 9
SKW30N60
700ns
3500nC
600ns
3000nC
IF = 60A
500ns
400ns
300ns
IF = 15A
200ns
, REVERSE RECOVERY TIME
rr
t
100ns
0ns
100A/µs300A/µs500A/µs700A/µs900A/µs
IF = 30A
2500nC
2000nC
1500nC
1000nC
, REVERSE RECOVERY CHARGE
rr
Q
500nC
0nC
100A/µs300A/µs 500A/µs 700A/µs 900A/µs
IF = 60A
IF = 30A
IF = 15A
diF/dt, DIODE CURRENT SLOPE diF/dt, DIODE CURRENT SLOPE
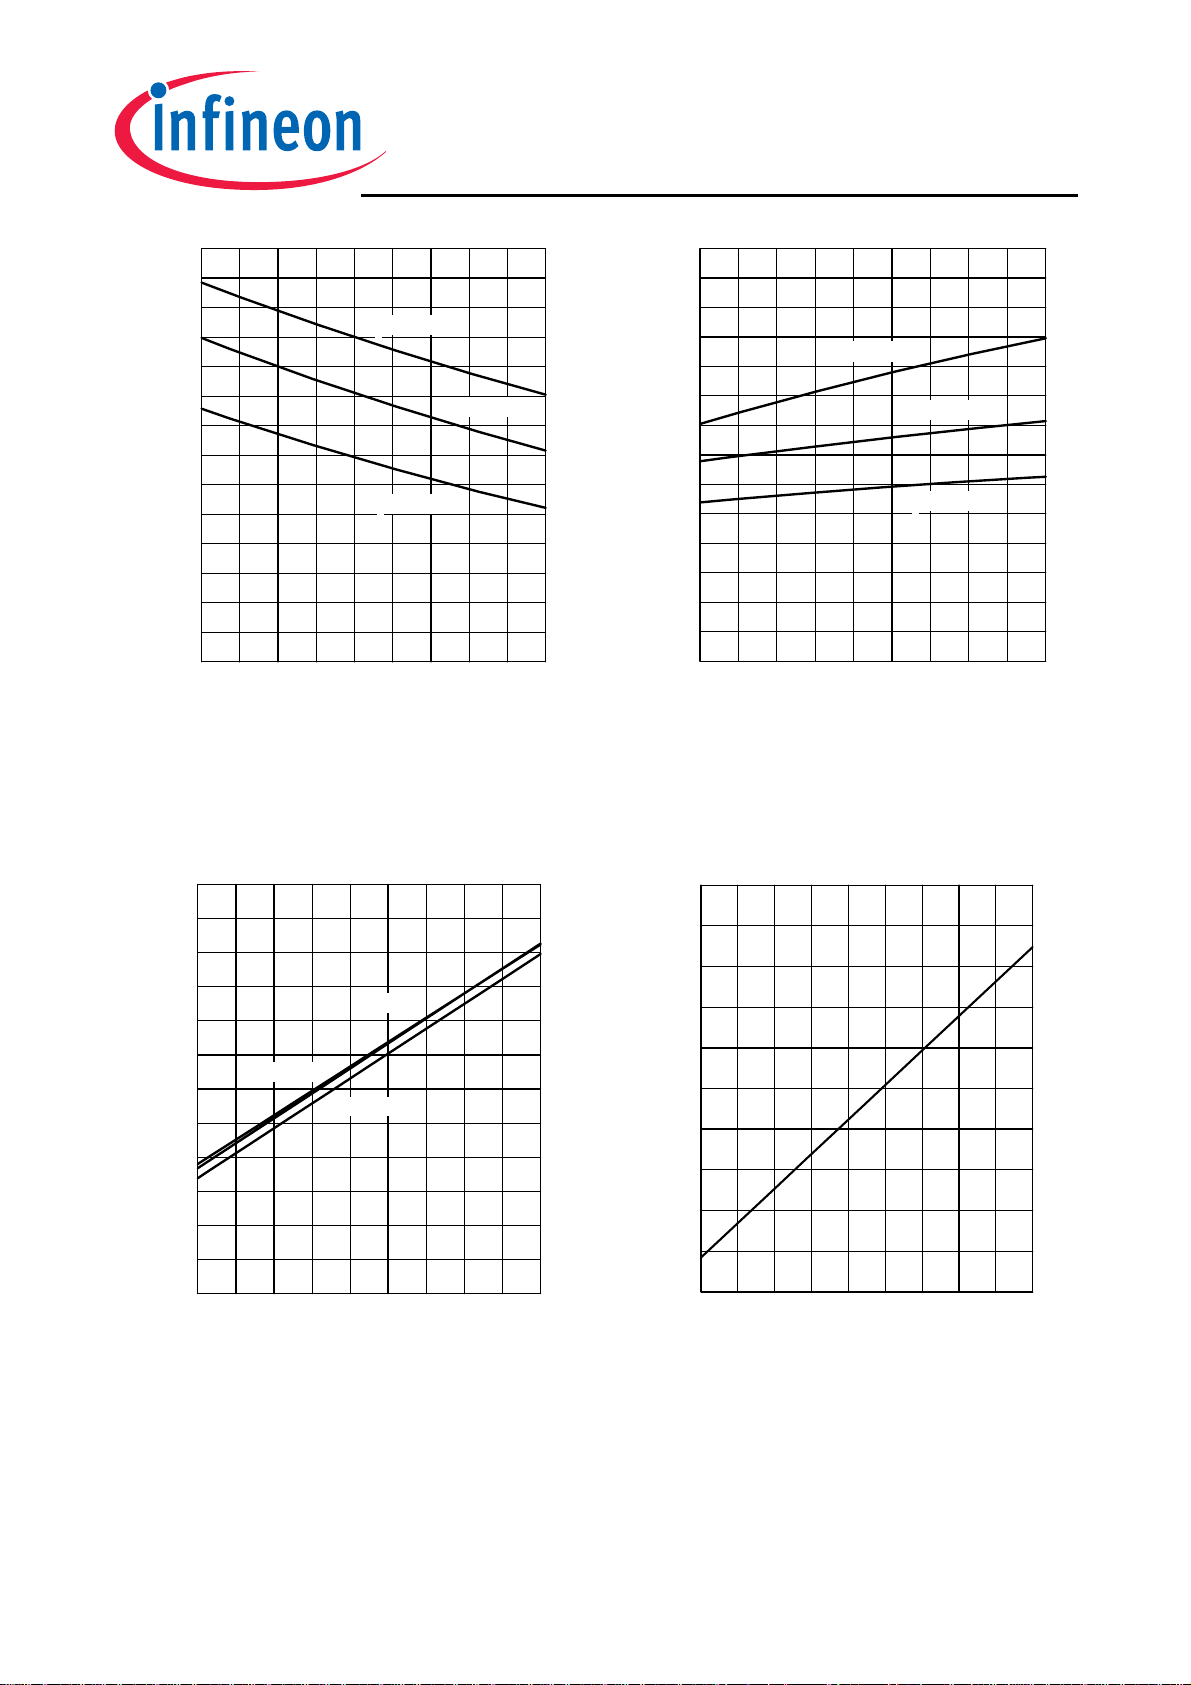
Figure 21. Typical reverse recovery time as
a function of diode current slope
= 200V, T
(V
R
= 125°C,
j
Dynamic test circuit in Figure E)
Figure 22. Typical reverse recovery charge
as a function of diode current slope
(VR = 200V, T
= 125°C,
j
Dynamic test circuit in Figure E)
24A
1000A/µs
20A
800A/
µs
IF = 60A
16A
600A/
µs
IF = 30A
12A
IF = 15A
µs
400A/
8A
µs
200A/
/dt, DIODE PEAK RATE OF FALL
4A
, REVERSE RECOVERY CURRENT
rr
I
0A
100A/µs 300A/µs 500A/µs 700A/µs 900A/µs
rr
OF REVERSE RECOVERY CURRENT
di
µs
0A/
100A/µs 300A/µs 500A/µs700A/µs900A/µs
diF/dt, DIODE CURRENT SLOPE diF/dt, DIODE CURRENT SLOPE
Figure 23. Typical reverse recovery current
as a function of diode current slope
= 200V, T
(V
R
= 125°C,
j
Dynamic test circuit in Figure E)
Figure 24. Typical diode peak rate of fall of
reverse recovery current as a function of
diode current slope
(V
= 200V, T
R
= 125°C,
j
Dynamic test circuit in Figure E)
9 Rev. 2_2 Sep 08
Page 10
A
τ
τ
SKW30N60
60
2.0V
50A
IF = 60A
40A
150°C
30A
100°C
20A
, FORWARD CURRENT
F
I
10A
25°C
-55°C
0A
0.0V 0.5V 1.0V 1.5V 2.0V
1.5V
IF = 30A
, FORWARD VOLTAGE
F
V
1.0V
-40°C 0°C 40°C 80°C 120°C
VF, FORWARD VOLTAGE Tj, JUNCTION TEMPERATURE
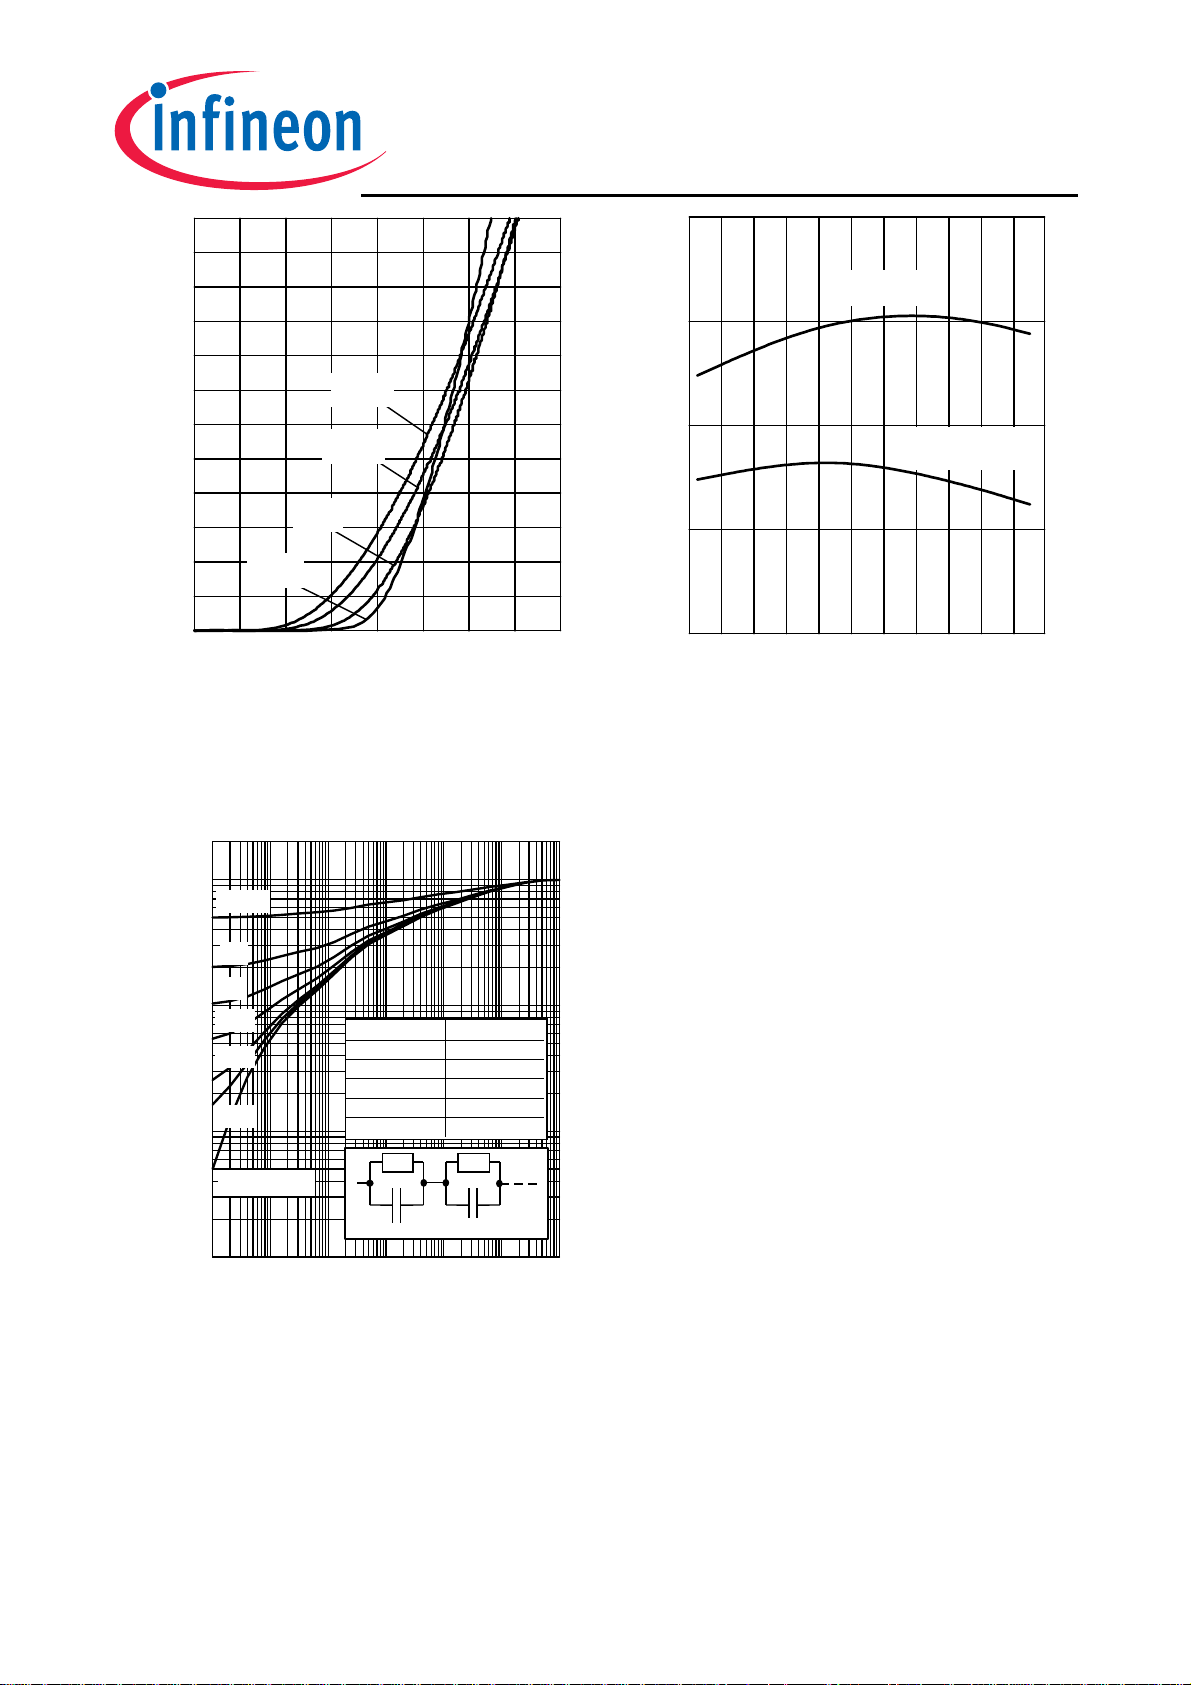
Figure 25. Typical diode forward current as
a function of forward voltage
Figure 26. Typical diode forward voltage as
a function of junction temperature
0
10
K/W
D=0.5
0.2
0.1
-1
10
K/W
, TRANSIENT THERMAL IMPEDANCE
thJCD
Z
0.05
0.02
0.01
-2
K/W
10
single pulse
-3
K/W
10
1µs 10µs 100µs 1ms 10ms 100ms 1s
R ,(1/W)
0.270 0.157
0.231 2.08*10
0.221 2.29*10-3
0.203 2.04*10-4
0.070 1.03*10-5
R
1
C1=
1/R1
C2=
τ
, (s)
2/R2
-2
R
2
tp, PULSE WIDTH
Figure 27. Diode transient thermal
impedance as a function of pulse width
(D = t
/ T)
p
10 Rev. 2_2 Sep 08
Page 11
SKW30N60
PG-TO247-3
M
M
5.44
3
MAX
5.16
2.53
2.11
1.33
2.41
2.16
3.38
3.13
0.68
21.10
17.65
1.35
16.03
14.15
5.10
2.60
20.31
4.47
3.70
6.00
6.30
MIN MAX
0.193
0.089
0.073
0.042
0.075
0.075
0.113
0.113
0.022
0.820
0.640
0.041
0.618
0.516
0.145
0.066
0.780
0.164
0.138
0.216
0.238
0.203
0.099
0.083
0.052
0.095
0.085
0.133
0.123
0.027
0.831
0.695
0.053
0.631
0.557
0.201
0.102
0.214
3
0.799
0.176
0.146
0.236
0.248
Z8B00003327
0
17-12-2007
0
5
5
7.5mm
03
MIN
4.90
2.27
1.85
1.07
1.90
1.90
2.87
2.87
0.55
20.82
16.25
1.05
15.70
13.10
3.68
1.68
19.80
4.17
3.50
5.49
6.04
11 Rev. 2_2 Sep 08
Page 12
v
j
τ
τ
τ
C
SKW30N60
i,
+
di /dt
F
I
F
t=t t
rr S F
Q=Q Q
rr S F
t
rr
t
S
+
t
F
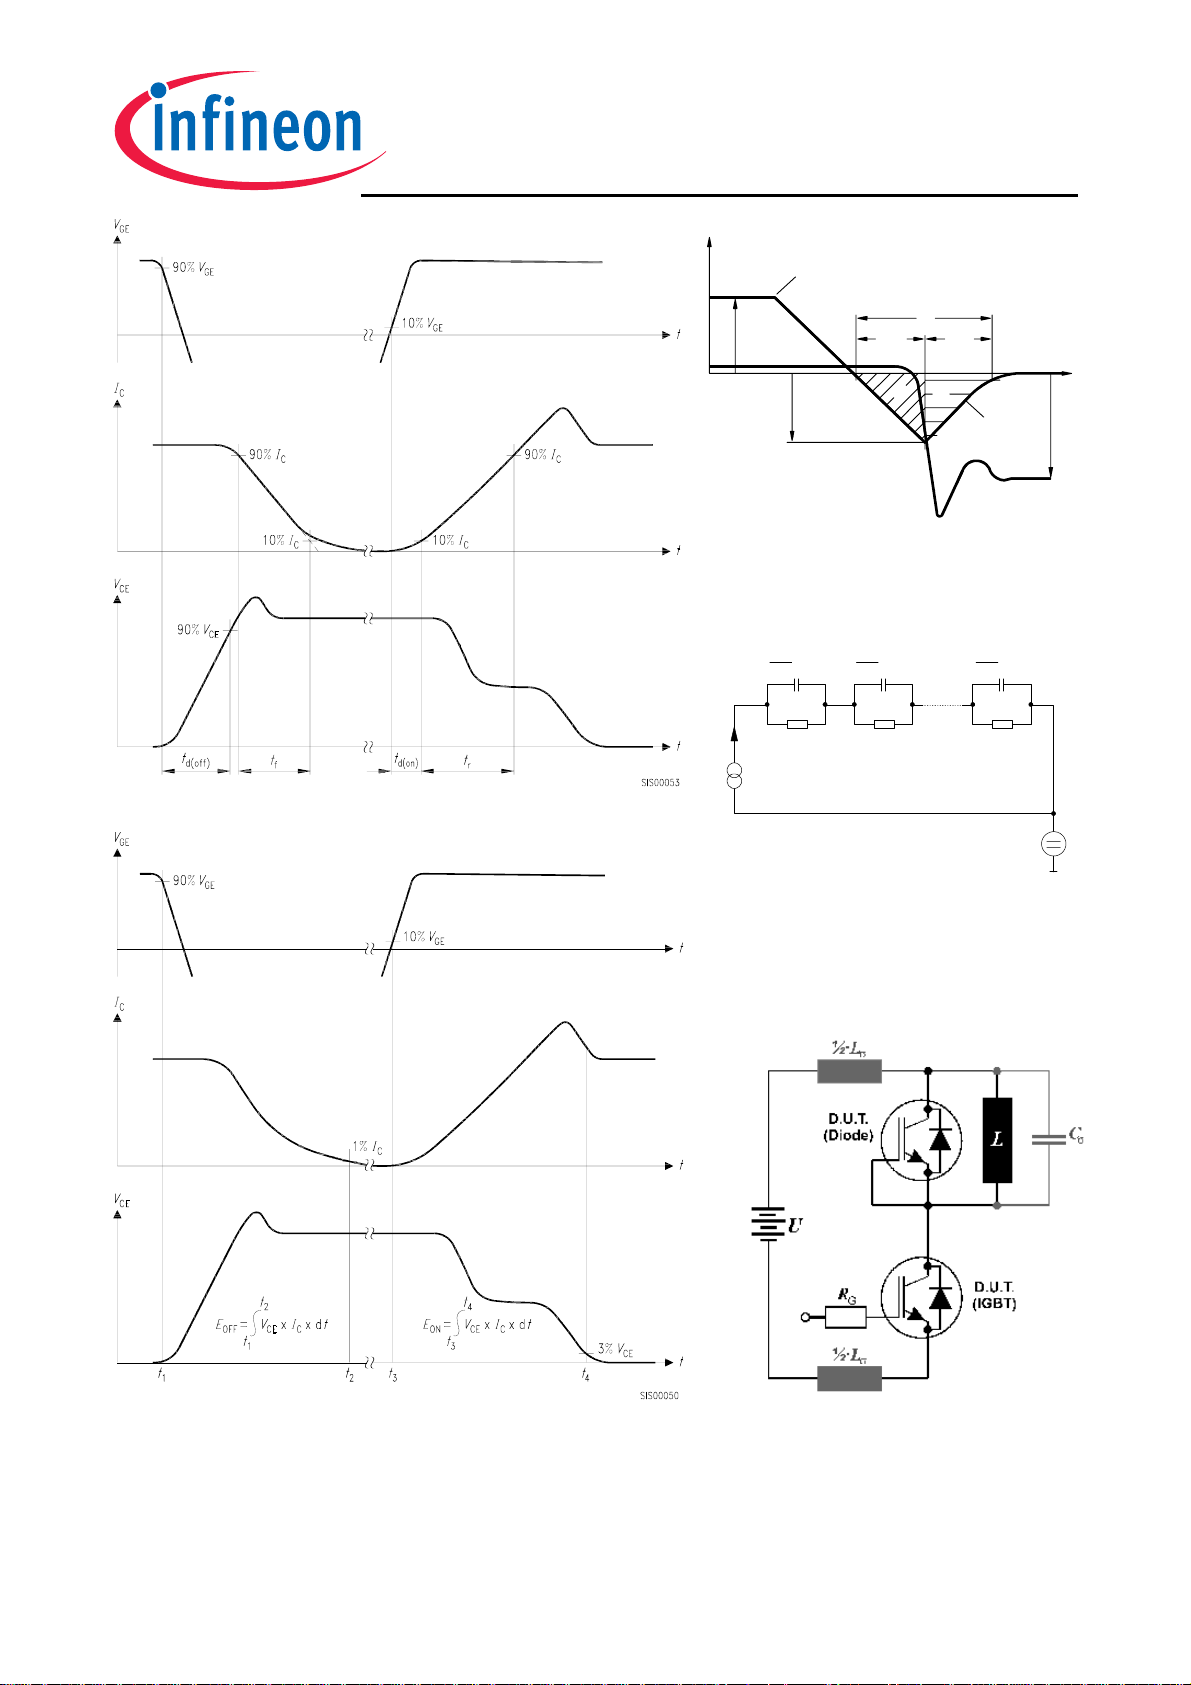
Figure A. Definition of switching times
I
rrm
Q
S
Q
F
90% I
10% I
di /dt
rr
rrm
rrm
t
V
R
Figure C. Definition of diodes
switching characteristics
p(t)
1
rrrr
1
T(t)
12 n
2
2
n
n
rr
T
Figure D. Thermal equivalent
circuit
Figure B. Definition of switching losses
Figure E. Dynamic test circuit
Leakage inductance L
=180nH
σ
and Stray capacity Cσ =900pF.
Published by
Infineon Technologies AG,
12 Rev. 2_2 Sep 08
Page 13

SKW30N60
Published by
Infineon Technologies AG
81726 Munich, Germany
© 2008 Infineon Technologies AG
All Rights Reserved.
Legal Disclaimer
The information given in this document shall in no event be regarded as a guarantee of conditions or
characteristics. With respect to any examples or hints given herein, any typical values stated herein and/or
any information regarding the application of the device, Infineon Technologies hereby disclaims any and all
warranties and liabilities of any kind, including without limitation, warranties of non-infringement of intellectual
property rights of any third party.
Information
For further information on technology, delivery terms and conditions and prices, please contact the nearest
Infineon Technologies Office (www.infineon.com).
Warnings
Due to technical requirements, components may contain dangerous substances. For information on the
types in question, please contact the nearest Infineon Technologies Office. Infineon Technologies
components may be used in life-support devices or systems only with the express written approval of
Infineon Technologies, if a failure of such components can reasonably be expected to cause the failure of
that life-support device or system or to affect the safety or effectiveness of that device or system. Life support
devices or systems are intended to be implanted in the human body or to support and/or maintain and
sustain and/or protect human life. If they fail, it is reasonable to assume that the health of the user or other
persons may be endangered.
13 Rev. 2_2 Sep 08
 Loading...