

Page 1

SIOV metal oxide varistors
Selection procedure
Date: April 2011
© EPCOS AG 2011. Reproduction, publication and dissemination of this publication, enclosures hereto and the
information contained therein without EPCOS' prior express consent is prohibited.
Page 2
Selection procedure
1 Selection procedure
1.1 Overvoltage types and sources
Overvoltages are distinguished according to where they originate.
1.1.1 Internal overvoltages
Internal overvoltages originate in the actual system which is to be protected, e.g. through
inductive load switching,
arcing,
direct coupling with higher voltage potential,
mutual inductive or capacitive interference between circuits,
electrostatic charge,
ESD.
With internal overvoltages the worst-case conditions can often be calculated or traced by a test
circuit. This enables the choice of overvoltage protective devices to be optimized.
1.1.2 External overvoltages
External overvoltages affect the system that is to be protected from the outside, e.g. as a result of
line interference,
strong electromagnetic fields,
lightning.
In most cases the waveform, amplitude and frequency of occurrence of these transients are not
known or, if so, only very vaguely. And this, of course, makes it difficult to design the appropriate
protective circuitry.
There have been attempts to define the overvoltage vulnerability of typical supply systems (e.g.
industrial, municipal, rural) so that the best possible protective device could be chosen for the purpose. But the scale of local differences makes such an approach subject to uncertainty. So, for reliable protection against transients, a certain degree of “overdesign” must be considered.
Therefore the following figures for overvoltage in 230 V power lines can only be taken as rough
guidelines:
Amplitude up to 6 kV
Pulse duration 0.1 µs to 1 ms
Where varistors are operated directly on the line (i.e. without series resistor), normally the type
series S20 should be chosen. In systems with high exposure to transients (industrial, mountain locations) block varistors are to be preferred.
Requirements are stipulated in IEC 61000-4-X. Severity levels are specified in the respective
product standards.
Table 2 in chapter “Application notes” shows the selection of varistors for surge voltage loads according to IEC 61000-4-5 as an example.
and Cautions and warnings.
Page 2 of 19Please read Important notes
Page 3
Selection procedure
1.2 Principle of protection and characteristic impedance
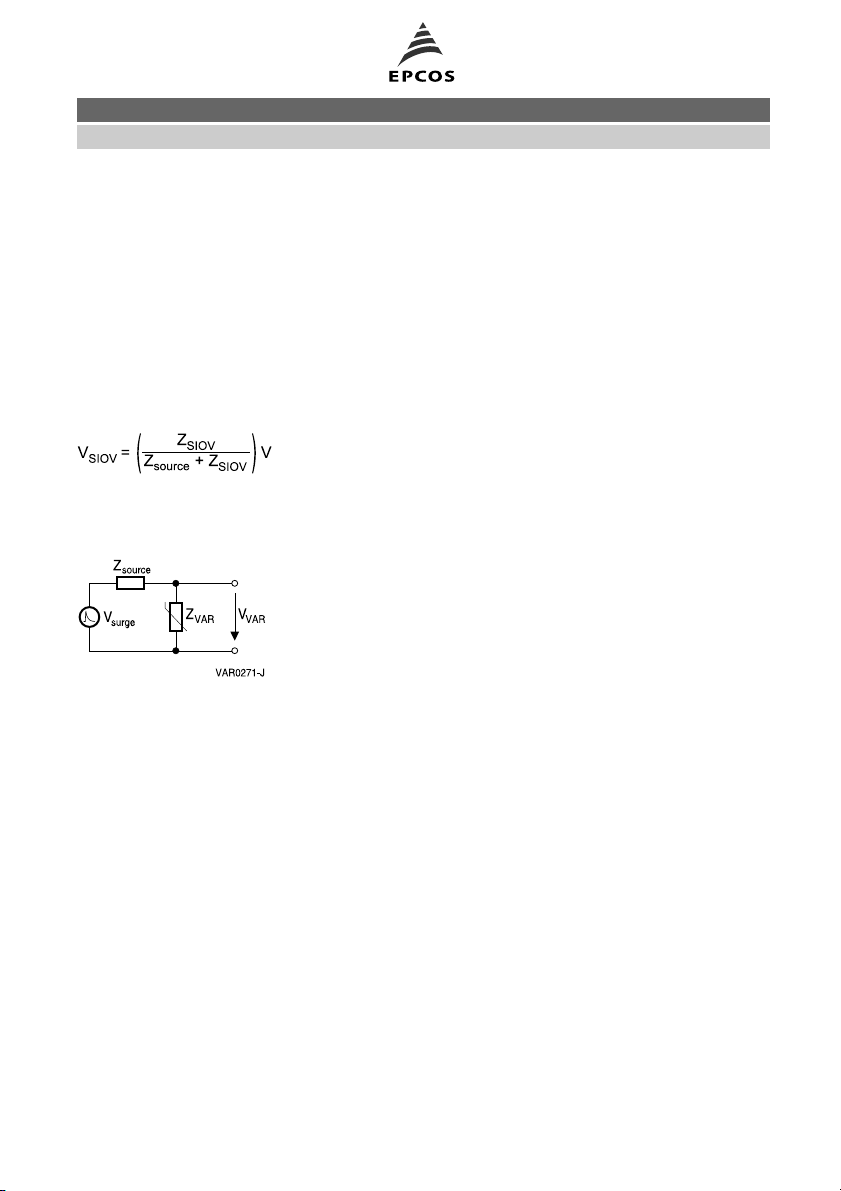
The principle of overvoltage protection by varistors is based on the series connection of voltageindependent and voltage-dependent resistance. Use is made of the fact that every real voltage
source and thus every transient has a voltage-independent source impedance greater than zero.
This voltage-independent impedance Z
in figure 1 can be the ohmic resistance of a cable or
source
the inductive reactance of a coil or the complex characteristic impedance of a transmission line.
If a transient occurs, current flows across Z
and the varistor that, because v
source
source
= Z
source
· i,
causes a proportional voltage drop across the voltage-independent impedance. In contrast, the
voltage drop across the SIOV is almost independent of the current that flows.
Because
(equ. 8)
the voltage division ratio is shifted so that the overvoltage drops almost entirely across Z
circuit parallel to the varistor (voltage V
Figure 1 Equivalent circuit in which Z
) is protected.
SIOV
source
symbolizes
the voltage-independent source impedance
source
. The
and Cautions and warnings.
Page 3 of 19Please read Important notes
Page 4
Selection procedure
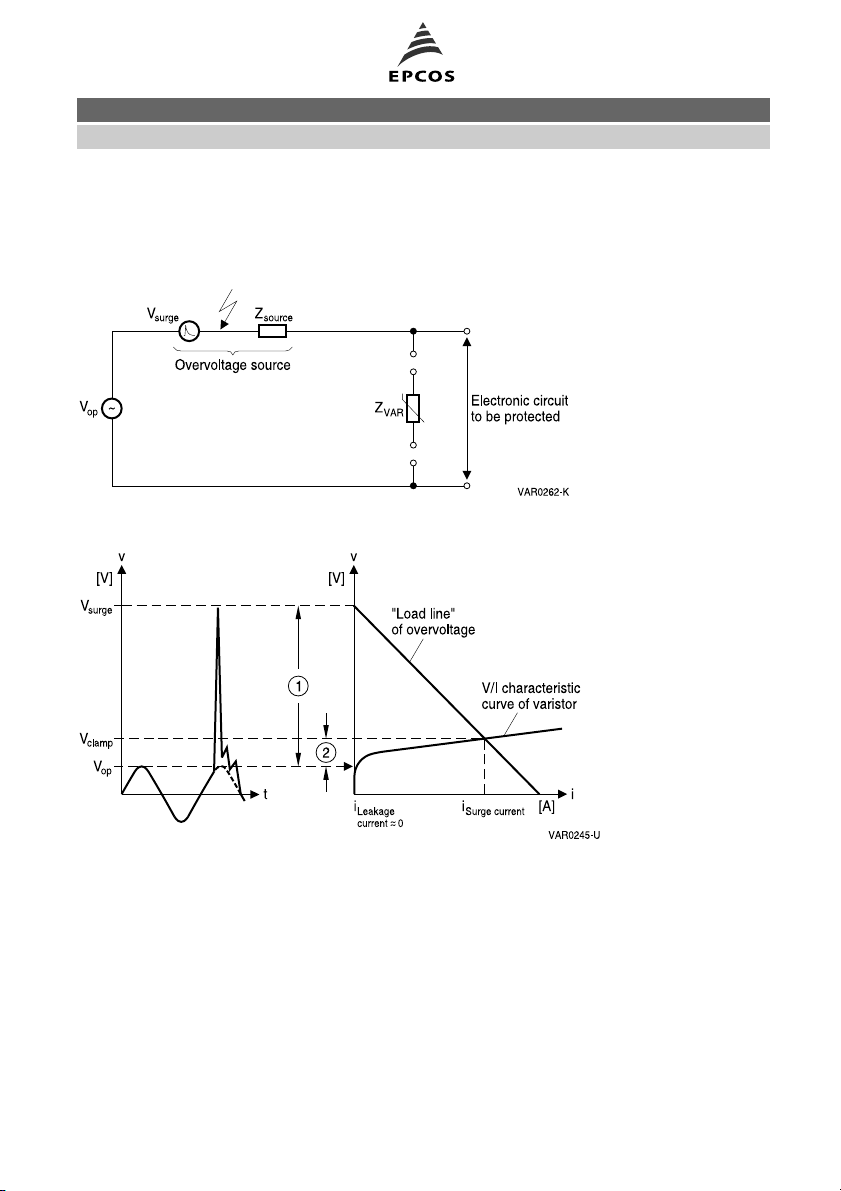
Figures 2 and 3 show the principle of overvoltage protection by varistors:
The intersection of the “load line” of the overvoltage with the V/I characteristic curve of the varistor
is the “operating point” of the overvoltage protection, i.e. surge current amplitude and protection
level.
Figure 2 Principle of overvoltage protection by varistors
Figure 3 Principle of overvoltage protection by varistors
The overvoltage ➀ is clamped to ➁ by a varistor.
V
V
V
Operating voltage
op
Superimposed surge voltage
surge
Clamping voltage
clamp
For selection of the most suitable protective element, you must know the surge current waveform
that goes with the transient. This is often, and mistakenly, calculated by way of the (very small)
source impedance of the line at line frequency. This leads to current amplitudes of unrealistic proportions. Here you must remember that typical surge current waves contain a large portion of frequencies in the kHz and MHz range, at which the relatively high characteristic impedance of cables, leads, etc. determines the voltage/current ratio.
and Cautions and warnings.
Page 4 of 19Please read Important notes
Page 5
Selection procedure
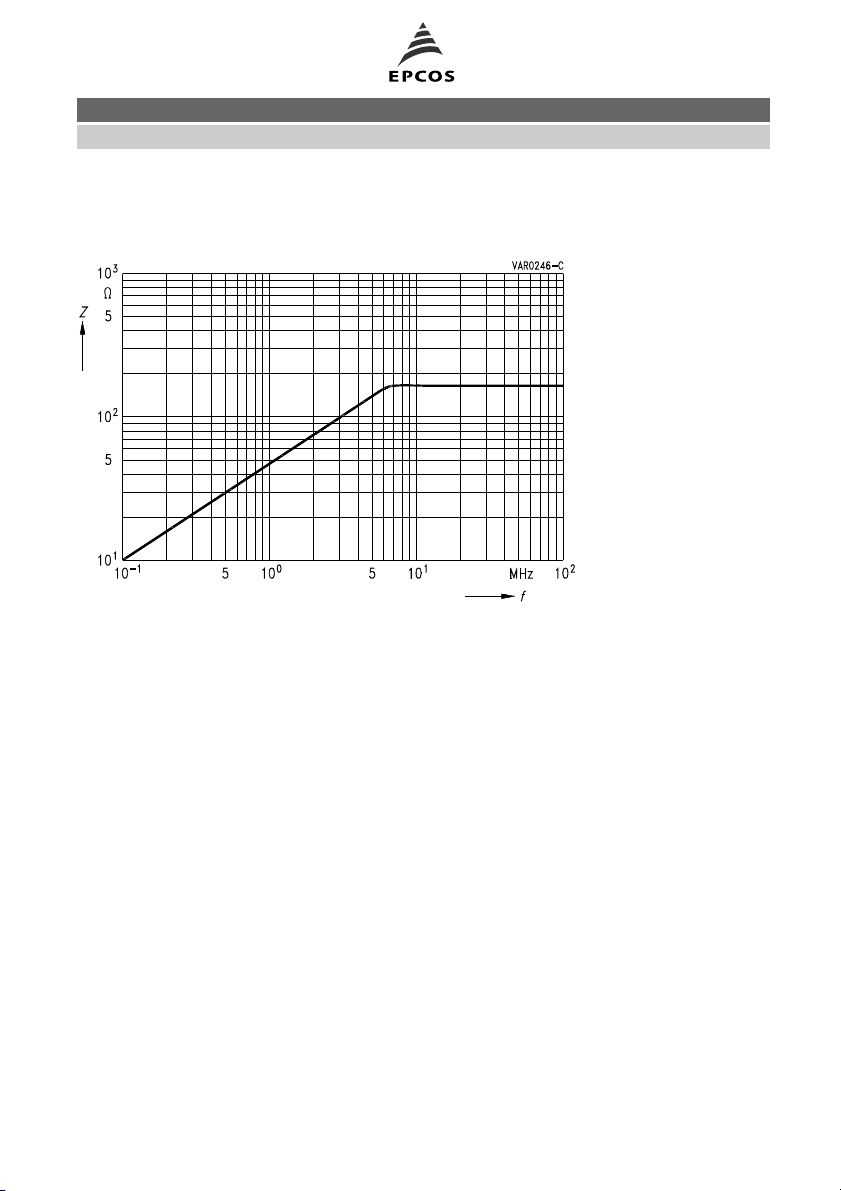
Figure 4 shows approximate figures for the characteristic impedance of a supply line when there
are high-frequency overvoltages. For calculation purposes the characteristic impedance is normally taken as being 50 Ω. Artificial networks and surge generators are designed accordingly.
Figure 4 Impedance of a supply line for high-frequency overvoltages
and Cautions and warnings.
Page 5 of 19Please read Important notes
Page 6

Selection procedure
1.3 Areas of application for varistors
A wide selection of types is available to cover very different requirements for protective level and
load capability. Straightforward conditions of use and an attractive price/performance ratio have
made SIOVs from EPCOS successful in just about every area of electrical engineering and electronics. The table below summarizes them:
Telecommunications
Private branch exchanges
Telephone subscriber sets
Telephone pushbutton modules
Teleprinters
Answering sets
Power supply units
Transmitting systems
Fax machines
Modems
Cellular (mobile) phones
Cordless phones
Chargers
Car kits
Industrial controls
Telemetering systems
Remote control systems
Machine controls
Elevator controls
Alarm systems
Proximity switches
Lighting controls
Power supply units
Ground fault interrupters
Gas heating electronics
Electronic ballasts
LCDs
Power electronics
Bridge rectifiers
Brake rectifiers
Electric welding
Electric vehicles
Power engineering
Transformers
Inductors
Motor and generator windings
Electrical power meter
Automotive electronics
Central protection of
automotive electrical systems
Load-dump protection
Anti-skid brake systems
Trip recorders
Radios
Engine control units
Generator rectifiers
Central locking systems
Trip computers
Wiper motors
Power window systems
Airbag electronics
Carphones
Seat memories
Traffic lighting
Traffic signals
Runway lighting
Beacon lights
Medical engineering
Diagnostic equipment
Therapeutic equipment
Power supply units
Data systems
Data lines
Power supply units
Personal computers
Interfaces
ASIC resets
Microcontrollers
I/O ports
Keyboards
Handheld PCs
Stepped protection
Microelectronics
EMI/RFI suppression
EMP/NEMP protection
Entertainment electronics
Video sets
Television sets
Slide projectors
Power supply units
HIFI equipment
Set-top boxes
Household electronics
Washer controls
Dimmers
Lamps
Quartz clocks
Electric motor tools
Thermostats
Replacement of
Suppressor diodes
Diodes
Switch-mode power supplies
High-power current converters
DC/AC converters
Power semiconductors
and Cautions and warnings.
Page 6 of 19Please read Important notes
Page 7

Selection procedure
If semiconductor devices like diodes, thyristors and triacs are paralleled with SIOVs for protection,
they may do with lower reverse-voltage strength. This leads to a marked cost reduction and can
be the factor that really makes a circuit competitive.
1.4 Series and parallel connection
1.4.1 Series connection
SIOV varistors can be connected in series for more precise matching to uncommon voltage ratings or for voltage ratings higher than those available. For this purpose the types selected should
be of the same series (i.e. same diameter). The maximum permissible operating voltage in series
configuration is produced by adding the maximum DC or AC voltages of the varistors.
1.4.2 Parallel connection
Metal oxide varistors can be connected in parallel to achieve higher current load capabilities or
higher energy absorption than can be obtained with single components. To this end, the intended
operating point in the surge current region (see chapter “General technical information”, section
1.5) must be taken into account.
1.4.2.1 Medium current region
Since the surge current is well below its maximum permissible value in this region, parallel connection may only be used to increase energy absorption. The varistor has to absorb the energy of
currents that have a relatively low amplitude, but a high energy content due to their duration.
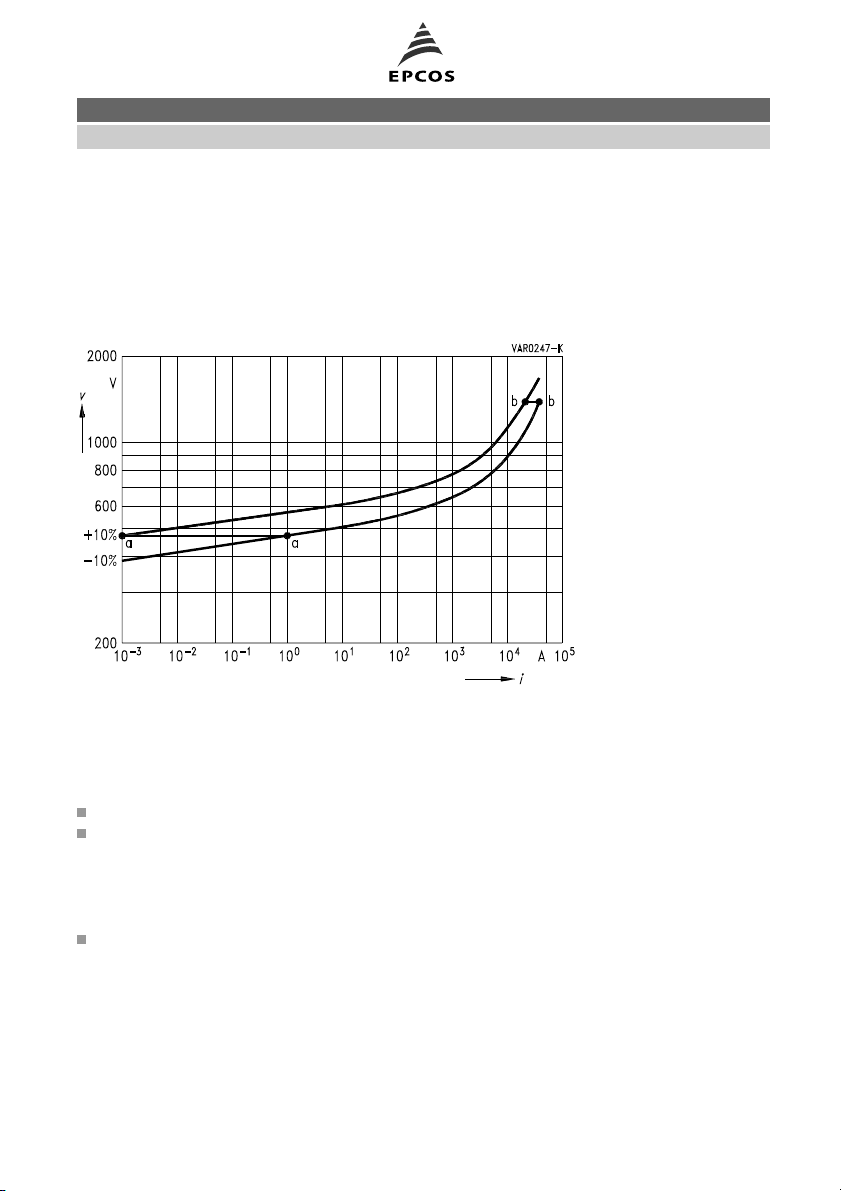
Example surge current i* = 1 A in figure 5:
In the worst case, 2 varistors may have been chosen for parallel connection with the first having a
V/I characteristic curve corresponding to the upper limits and the second having a V/I characteristic curve corresponding to the lower limits of the tolerance band. From the region boundary a) one
can see that then a current of 1 mA flows through the first varistor and a current of 1 A flows
through the second varistor. The energy absorptions of the two varistors are in the same ratio.
This means that if unselected varistors are used in this current region, current distributions of up
to 1000:1 may render the parallel connection useless. To achieve the desired results, it is necessary to match voltage and current to the intended operating point.
1.4.2.2 High-current region
In this region, the ohmic resistance of the zinc oxide causes a higher voltage drop across the
varistor that carries the higher surge current. Thus, the current distribution is shifted to the varistor
with the lower current. Region b) in figure 5 shows that in the worst case the current ratio is approx. 15 kA:40 kA, which is a considerably better result than in the medium operating region. Accordingly, parallel connection can increase the maximum permissible surge current for two block
varistors, e.g. from 40 kA to 55 kA for B40K275 varistors.
The graphical method in accordance with figure 5 can only provide guideline values, since the deviation of the individual varistors from the standard nonlinear values is not taken into consideration. In practice, the individual varistors must be measured for the current region for which parallel
operation is envisaged. If this region is within the two upper decades of the maximum surge current, the varistors should be measured at 1% of the maximum current to prevent the measure-
and Cautions and warnings.
Page 7 of 19Please read Important notes
Page 8
Selection procedure
ment itself reducing the service life of the varistor. Example: using B40K275, maximum permissible surge current 40 kA. The measurement should take place using 400 A with surge current
pulse 8/20 µs.
The effort required for measurements of this kind will make parallel connection an exception. The
possibility of using a single varistor with a higher load capacity should always be preferred, in this
example it would be a type from the LS50, B60 or B80 series.
Figure 5 Tolerance band of the SIOV-B40K275
1.5 Selection guide
The choice of a varistor involves three main steps:
Select varistors that are suitable for the operating voltage.
Determine the varistor that is most suitable for the intended application in terms of
a) surge current,
b) energy absorption,
c) average power dissipation,
(for a and b also estimating the number of repetitions).
Determine the maximum possible voltage rise on the selected varistor in case of overvoltage
and compare this to the electric strength of the component or circuit that is to be protected.
and Cautions and warnings.
Page 8 of 19Please read Important notes
Page 9
Selection procedure
To ensure proper identification of circuit and varistor data, the following distinction is made:
Maximum possible loading of varistor that is determined by the electrical specifications of the
intended location.
Identification: *
Maximum permissible loading of varistor that is given by its surge current and absorption capability.
Identification: max
(e.g. x*, x
max
)
So the following must always apply:
i* ≤ i
W* ≤ W
P* ≤ P
max
max
max
(equ. 9)
(equ. 10)
(equ. 11)
1.5.1 Operating voltage
Maximum permissible AC and DC operating voltages are stated in the product tables for all varistors. To obtain as low a protection level as possible, varistors must be selected whose maximum
permissible operating voltage equals or minimally exceeds the operating voltage of the application.
Nonsinusoidal AC voltages are compared with the maximum permissible DC operating voltages
so that the peak or amplitude of the applied voltage does not exceed the maximum permissible
DC voltage.
Note:
Of course, you may also select any varistor with a higher permissible operating voltage. This procedure is used, for example, when it is more important to have an extremely low leakage current
than the lowest possible protection level. In addition, the service life of the varistor is increased.
Also the type for the highest operating voltage may be selected to reduce the number of types being used for different voltages.
1.5.2 Surge current
Definition of the maximum possible operating voltage in the previous step will have narrowed
down the choice of an optimum SIOV to the models of a voltage class (e.g. those whose designation ends in 275 for 230 V + 10% = 253 V). Then you check, with reference to the conditions of
the application, what kind of load the SIOV can be subjected to.
Determining the load on the varistor when limiting overvoltage means that you have to know the
surge current that is to be handled.
1.5.2.1 Predefined surge current
Often the surge current is predefined in specifications. After transformation into an equivalent rectangular wave (figure 9) the suitable varistor type can be selected by the derating curves.
and Cautions and warnings.
Page 9 of 19Please read Important notes
Page 10
Selection procedure
1.5.2.2 Predefined voltage or network
If the voltage or a network is predefined, the surge current can be determined in one of the following ways:
Simulation
Using the PSpice simulation models of the SIOV varistors, the surge current, waveform and energy content can be calculated without difficulty. In these models, the maximum surge current is deduced for the lower limit of the tolerance band, i.e. setting TOL = –10.
Test circuit
The amplitude and waveform of the surge current can be determined with the aid of a test circuit.
The dynamic processes for overvoltages require adapted measuring procedures.
Graphical method
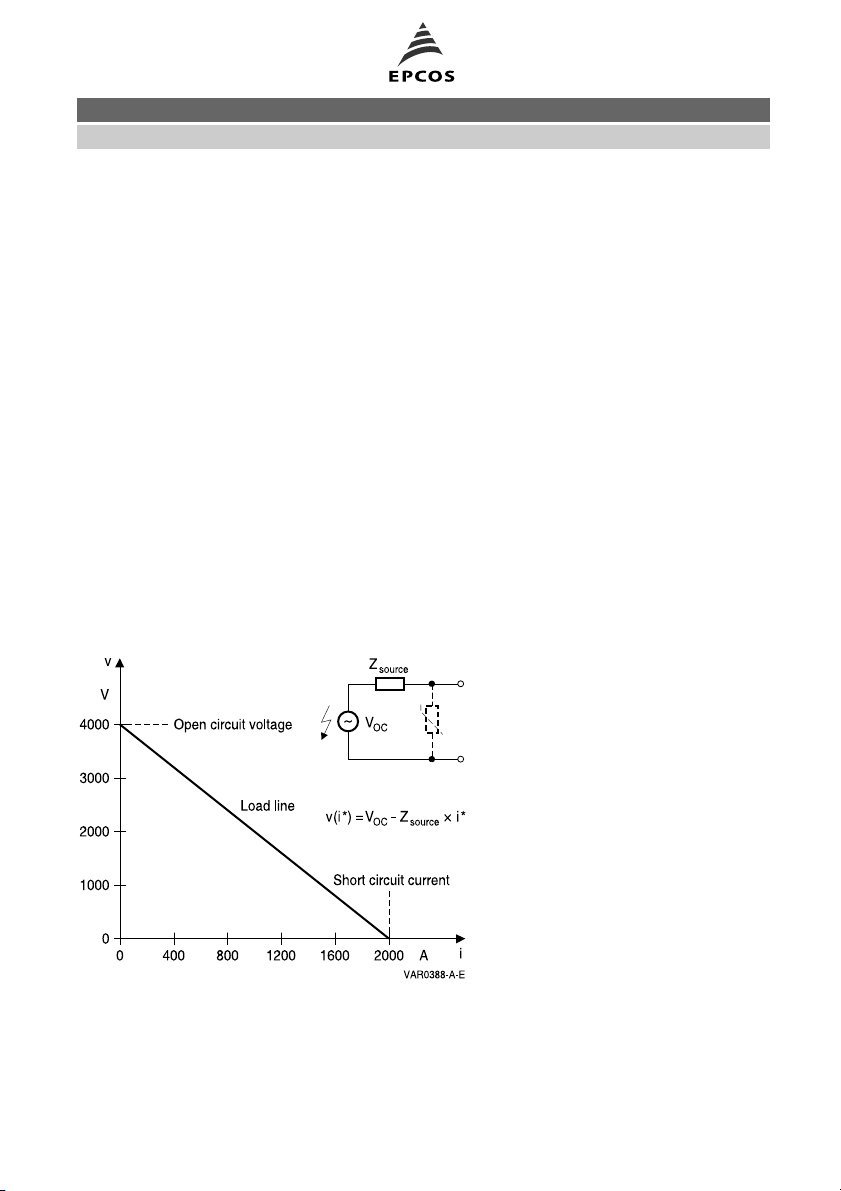
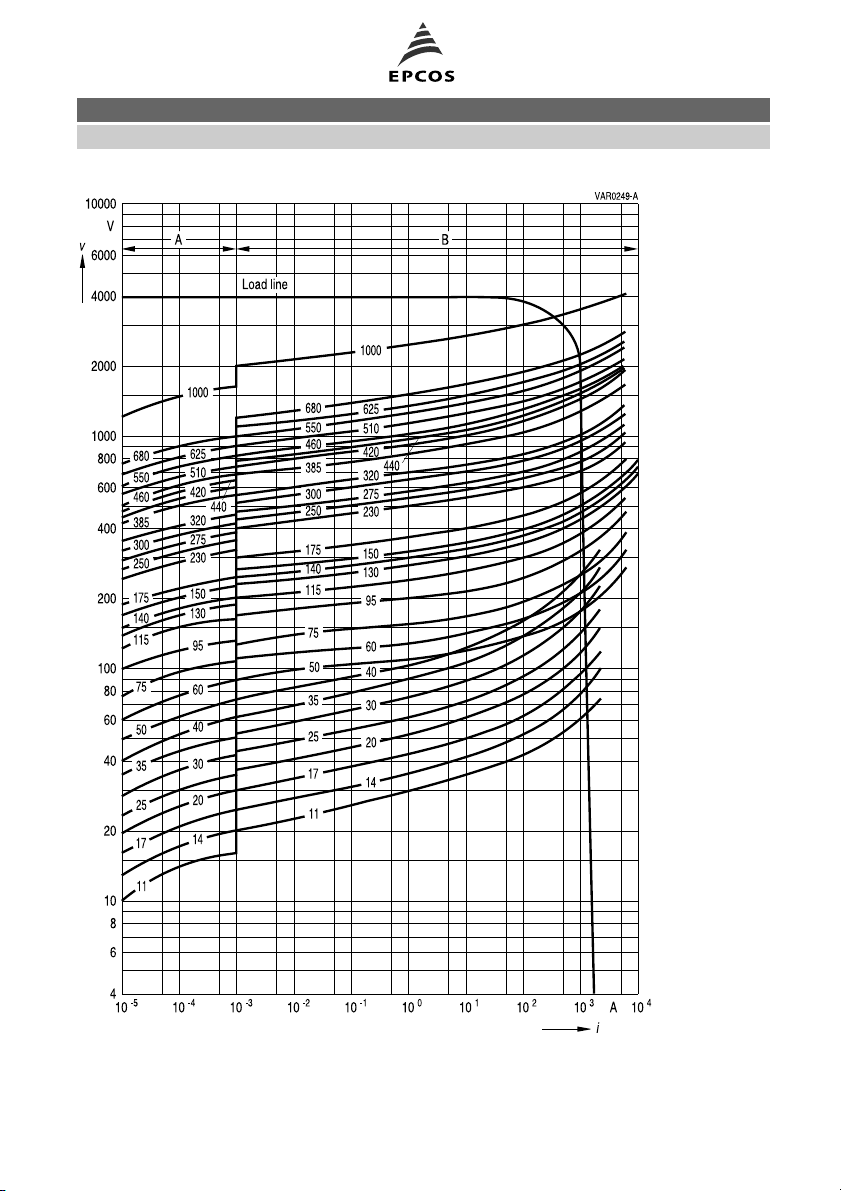
As shown in figures 6 and 7, the overvoltage can be drawn into the V/I characteristic curve fields
as a load line (open circuit voltage, short circuit current). At the intersection of this “load line” with
the varistor curve selected to suit the operating voltage, the maximum protection level and the
corresponding surge current can be read off. The waveform and thus the energy content cannot
be determined by this method.
Since the V/I characteristic curves are drawn in a log-log representation, the “load line” in figure 7
is distorted to a curve.
Figure 6 Load line on linear scale
and Cautions and warnings.
Page 10 of 19Please read Important notes
Page 11
Selection procedure
Figure 7 V/I characteristic curves SIOV-S20 with the load line drawn in
for a surge current amplitude 4 kV with Z
and Cautions and warnings.
Page 11 of 19Please read Important notes
source
= 2 Ω
Page 12
Selection procedure
Mathematic approximation
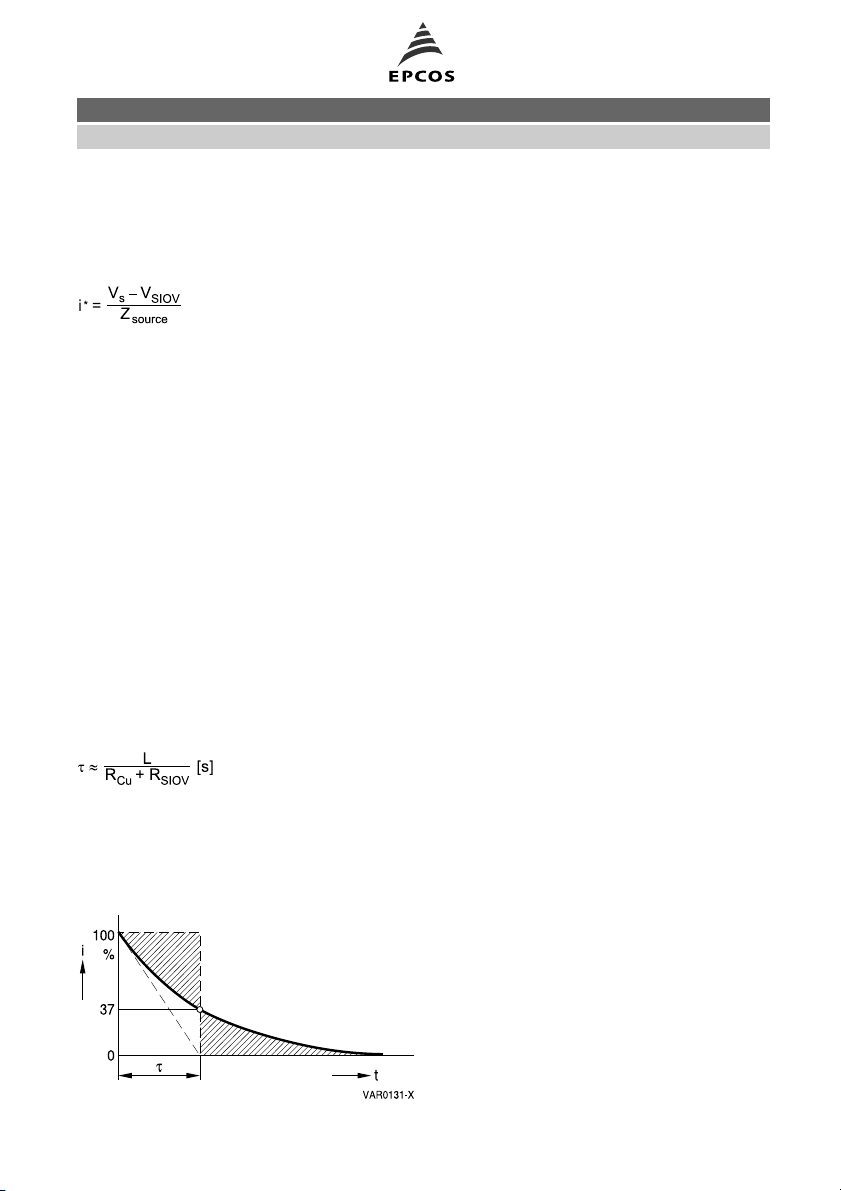
The surge current is determined solely from the source impedance of the surge voltage (Vs). By
subtracting the voltage drop across the varistor (from the V/I curve) you can approximate the
maximum surge current as follows:
See 4.2 for an example. (equ. 12)
Switching off inductive loads
If the transient problems are caused by switching off an inductor, the “surge current” can be estimated as follows:
The current through an inductance cannot change abruptly, so, when switching off, a current of
the order of the operating current must flow across the varistor as an initial value and then decay
following an e function. The path taken by the current during this time is referred to as a flywheel
circuit (refer to chapters “Calculation examples”, “Switching off inductive loads”).
The time constant τ = L/R that can be calculated from the inductance and the resistance of the flywheel circuit (including varistor resistance) shows how long the current requires to return to the
1/e part (approx. 37%) of its original value. According to theory, t is also the time that the flywheel
current must continue to flow at constant magnitude to transport the same charge as the decaying
current.
So the amplitude of the “surge current” is known, and its duration is approximately τ (figure 8).
τ depends on the value of the inductance and the resistances of the flywheel circuit, generally
therefore on the resistance of the coil and the varistor. The latter is, by definition, dependent on
voltage and thus also current and so, for a given current, it has to be calculated from the voltage
drop across the varistor (V/I characteristic).
L
[H]
Inductance
R
[Ω]
Cu
R
SIOV
R
increases as current decreases. So τ is not constant either during a decay process.
SIOV
Coil resistance
[Ω]
SIOV resistance at operating current
(equ. 13)
This dependence can be ignored in such a calculation however.
For comparison with the derating curves of the current you can say that τ = tr(refer to chapters
“Calculation examples”, “Switching off inductive loads”).
Figure 8 Time constant of flywheel circuit
and Cautions and warnings.
Page 12 of 19Please read Important notes
Page 13
Selection procedure
1.5.2.3 Comparison: determined surge current / derating curve
The maximum permissible surge current of the SIOV depends on the duration of current flow and
the required number of repetitions. Taking these two parameters, it can be read from the derating
curves. It is compared to the maximum possible surge currents in the intended electrical environment of the varistor.
From the derating curves one can obtain maximum figures for rectangular surge current waves.
For correct comparison with these maximum permissible values, the real surge current wave (any
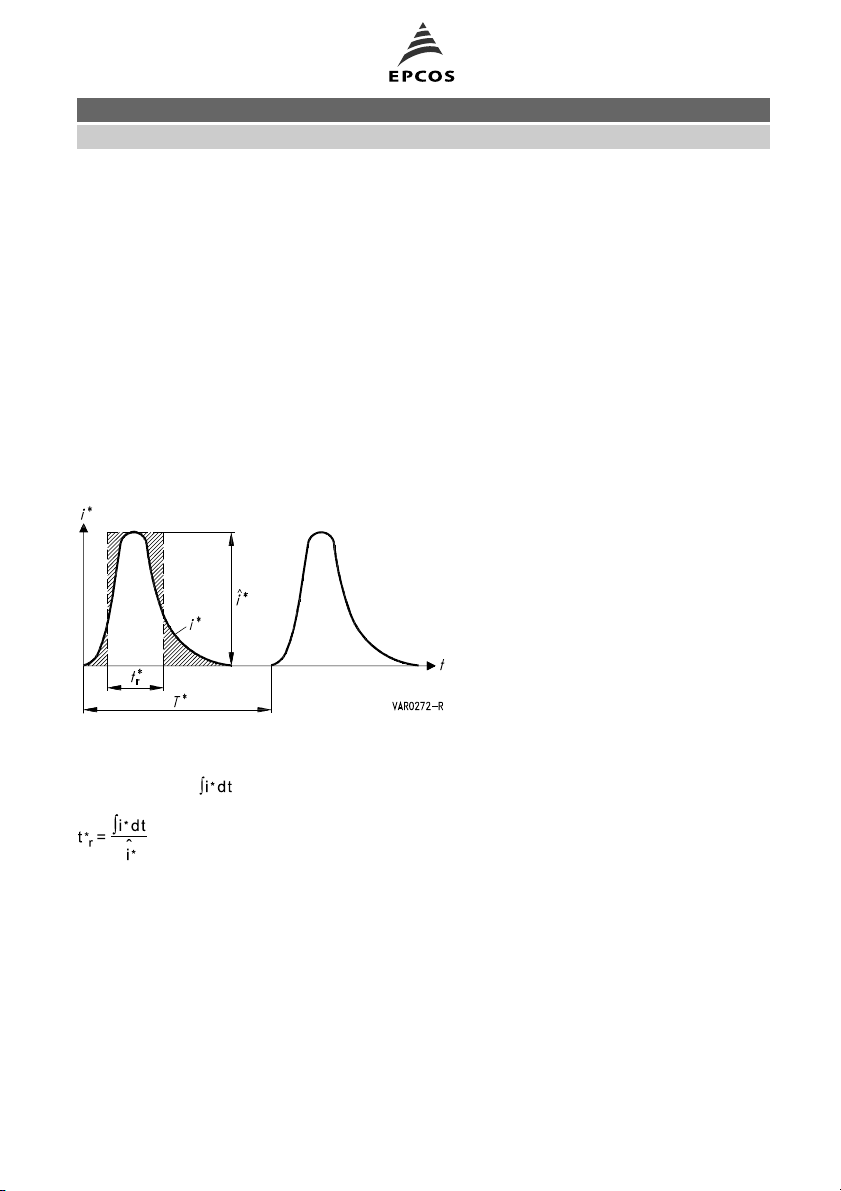
shape) has to be converted into an equivalent rectangular wave. This is best done graphically by
the “rectangle method” illustrated in figure 9.
Keeping the maximum value, you can change the surge current wave into a rectangle of the same
area. t*ris then the duration of the equivalent rectangular wave and is identical to the “pulse width”
in the derating curves. (The period T* is needed to calculate the average power dissipation resulting from periodic application of energy.)
Figure 9 Rectangle method
If the pulse load is known, then trcan be calculated using the following equation:
(equ. 14)
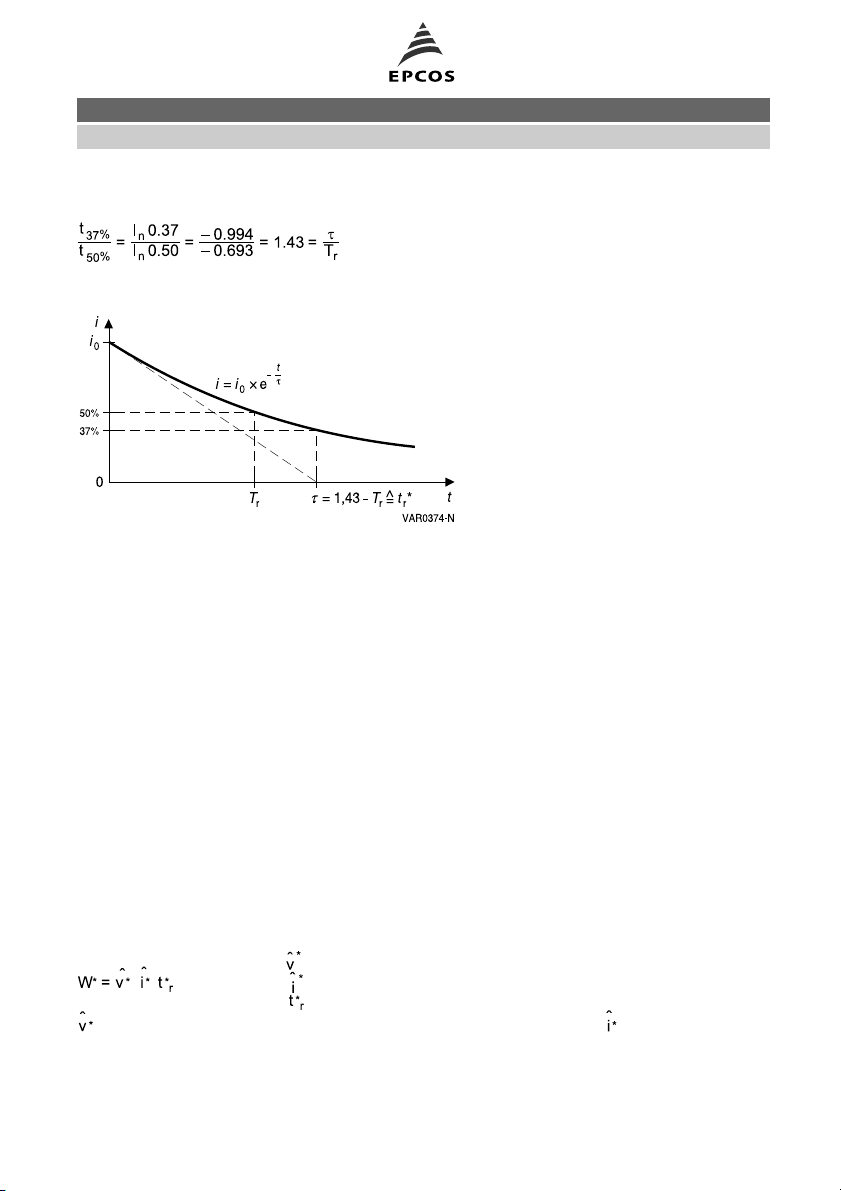
The duration of surge current waves is frequently specified using the 50% value of the trailing
edge (ref. figure 16 in “General technical information”). The decay pattern of such waves can be
represented by an exponential function.
and Cautions and warnings.
Page 13 of 19Please read Important notes
Page 14
Selection procedure
According to figure 10 and the equation derived from this,
(equ. 15)
the “equivalent rectangular wave” for such processes is found to be t*r= 1.43 T
r
Figure 10 Equivalent rectangular wave of an e-function
1.5.3 Energy absorption
When a surge current flows across the varistor, there will be absorption of energy. The amount of
energy to be absorbed by the varistor can generally be calculated by equation 6.
Calculation method
Often the energy absorption can be read directly from a storage oscilloscope or can be calculated
from the voltage/current curve using numerical methods. An example for W* = 100 J is shown in
figures 12 to 14 in chapter “Application notes”).
Simulation
Determination of the energy absorption by simulation (PSpice) is even more convenient.
Graphic method
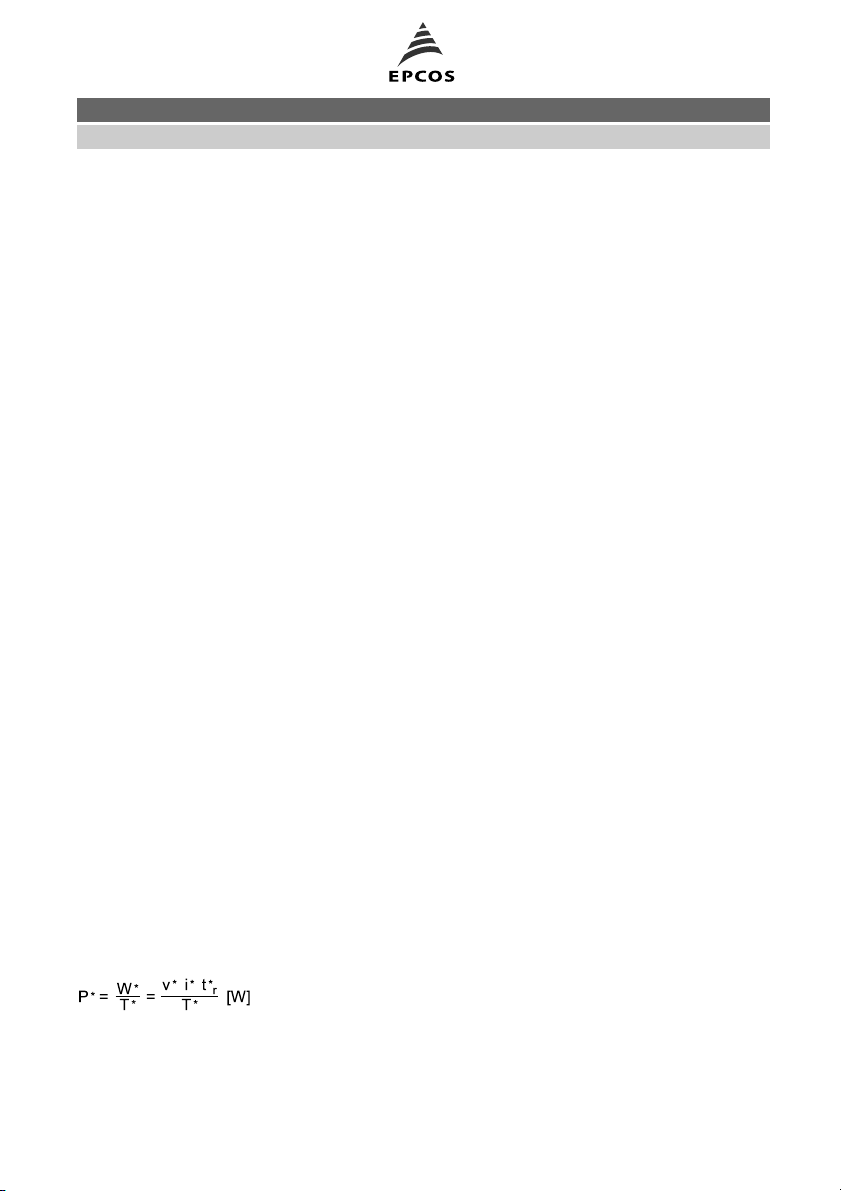
Otherwise equation 6 can be solved graphically with sufficient accuracy by using the rectangle
method. i* (t) is converted as in figure 9 and multiplied by the highest voltage appearing on the
varistor according to equation 16:
[V]
[J]
[A]
(equ. 16)
[s]
can either be derived from the V/I characteristic as the value matching , or likewise be deter-
mined with the aid of an oscilloscope as the maximum voltage drop across the varistor.
and Cautions and warnings.
Page 14 of 19Please read Important notes
Page 15
Selection procedure
Switching off inductive loads
If transients are caused by interrupting the current supply of an inductor, the worst-case principle
can be applied to calculate the necessary energy absorption of a varistor. The energy to be absorbed by the varistor cannot be greater than that stored in the inductor:
W* = ½ L i*
2
[J] Li*[H]
[A]
(equ. 17)
This calculation will always include a safety margin because of losses in other components. Refer
to chapter “Calculation examples”, section 1.1.
Note:
When used for overvoltages caused by switching off inductive loads, varistors should always be
applied in freewheeling circuits as shown in “Calculation examples”, section 1.1 and figure 5 in
chapter “Application notes".
Discharging of capacitors
The statements made for inductors also apply for capacitances. This means that the load placed
on the varistors in many of the tests according to IEC 61000-4-X can be estimated.
Comparison: determined energy input / maximum permissible energy absorption
To check the selection requirement W* ≤ W
(equation 10), you have to determine the maximum
max
permissible energy absorption for the intended varistor. This can be calculated by equation 18 as
a function of the time the energy is applied (tr) and the number of repetitions from the derating
curves:
W
= v
max
maximaxtr max
v
is derived from the V/I characteristic of the intended varistor type for the surge current i
max
t
can be taken as being the same as t*r, because W
r max
(equ. 18)
is to be calculated for the given time of
max
max
.
current flow.
1.5.4 Average power dissipation
The actual power dissipation of a varistor is composed of the basic dissipation P0caused by the
operating voltage and, possibly, the average of periodic energy absorption. If metal oxide varistors are chosen from the product tables in agreement with the maximum permissible operating
voltages, P0will be negligible.
Periodic energy absorption produces an average power dissipation of:
W*
[J]
i*
[A]
T*
[s]
t*
[s]
[V]
P*
r
[W]
v*
(equ. 19)
W* takes the value of a single absorption of energy.
T* is the period of figure 9.
and Cautions and warnings.
Page 15 of 19Please read Important notes
Page 16
Selection procedure
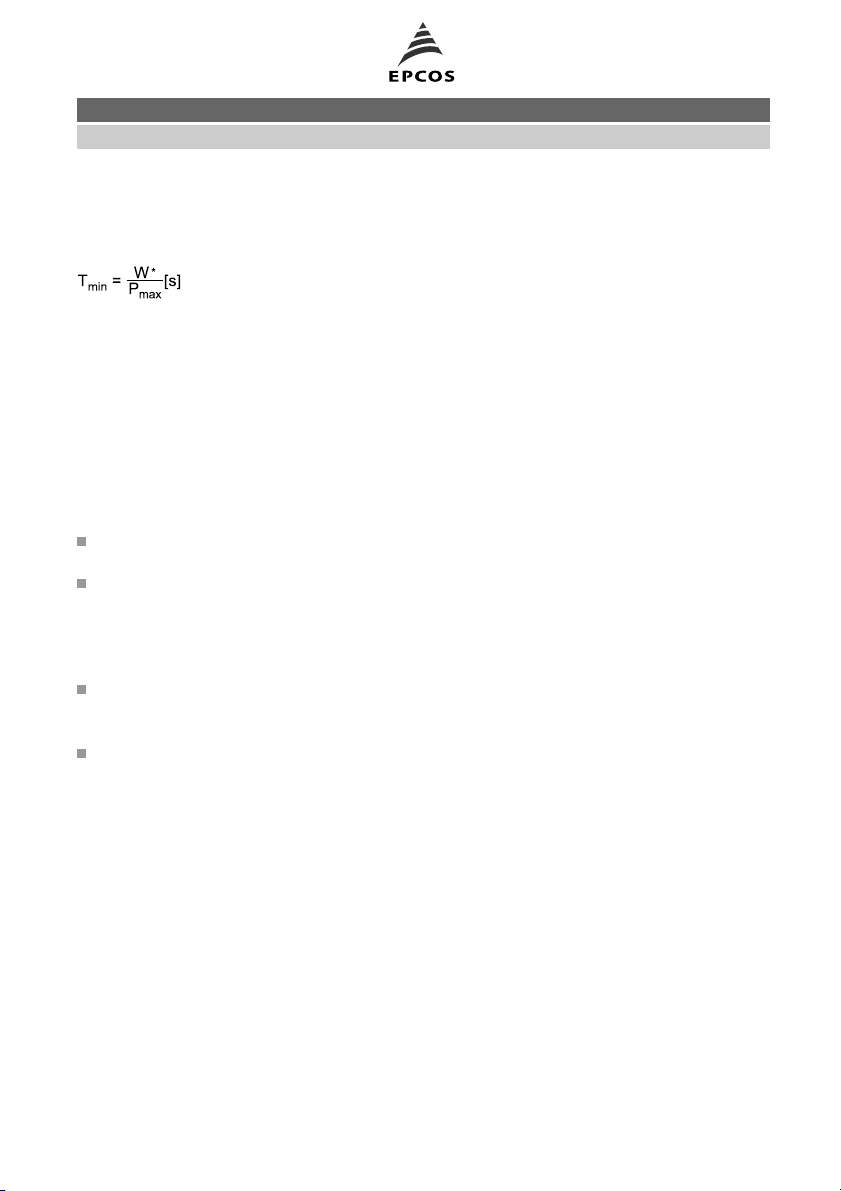
By solving this equation for T* it is possible to calculate the minimum time that must elapse before
energy is applied again without exceeding the maximum permissible average power dissipation of
the varistor:
W*
[J]
T
[s]
P
max
min
[W]
(equ. 20)
Note:
Metal oxide varistors are not to be “operated” at P
. They are not suitable for “static” power dis-
max
sipation, e.g. voltage stabilization. There are other kinds of components, like zener diodes, designed primarily for this kind of application, but with much lower surge current handling capability.
1.5.5 Maximum protection level
The maximum possible voltage rise in the event of a surge current is checked with the aid of the
V/I curves or PSpice models. This figure can be read directly from the curve for a given surge current (for worst-case varistor tolerances). If the voltage value thus obtained is higher than acceptable, the following possibilities may assist in reducing the protection level:
Choose a type with a larger disk diameter
The protection level is lower for the same surge current because the current density is reduced.
Better matching to the operating voltage by series connection
Example: 340 V AC
Here, according to the first step in selection, a standard SIOV with the end number “385” would
normally be chosen. But if two SIOVs with the end number “175” are connected in series, the
response of a 350 V varistor is obtained.
Choose a tighter tolerance band
A special type is introduced that only utilizes the bottom half of the standard tolerance band for
example. This would mean a drop in the protection level by approx. 10%.
Insert a series resistor
This reduces the amplitude of the surge current and thus the protection level of the varistor.
Note:
If the protection level obtained from the V/I curve is lower than required, you can change to a
varistor with a higher protection level, i.e. higher end number in its type designation. This has a favorable effect on load handling capability and operating life. The leakage current is further reduced. If necessary, the number of different types used can be reduced.
1.5.6 Selection by test circuit
The maximum permissible ratings of varistors refer to the amount of energy that will cause the
varistor voltage to change by maximum ±10%.
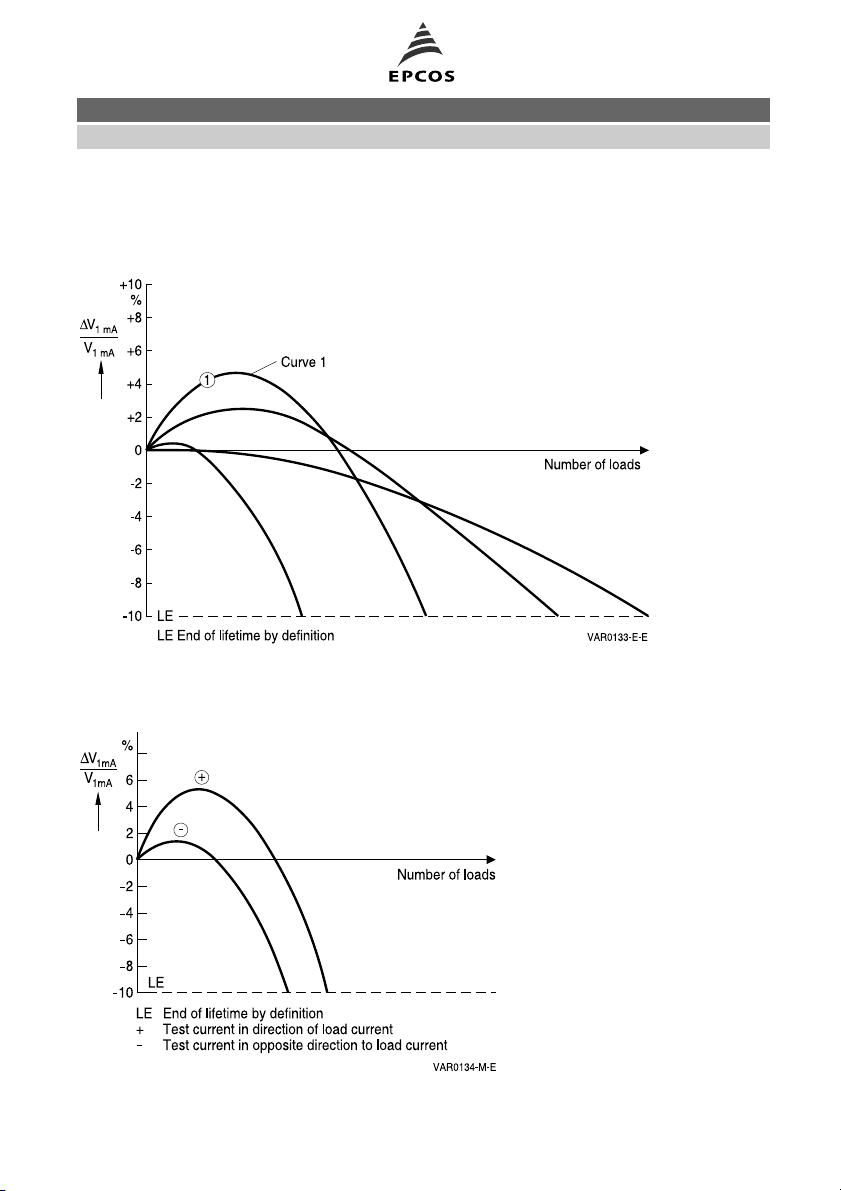
Figures 11 and 12 show typical curves for the change in varistor voltage of metal oxide varistors
when energy is repeatedly applied through a bipolar or unipolar load. You often find an increase
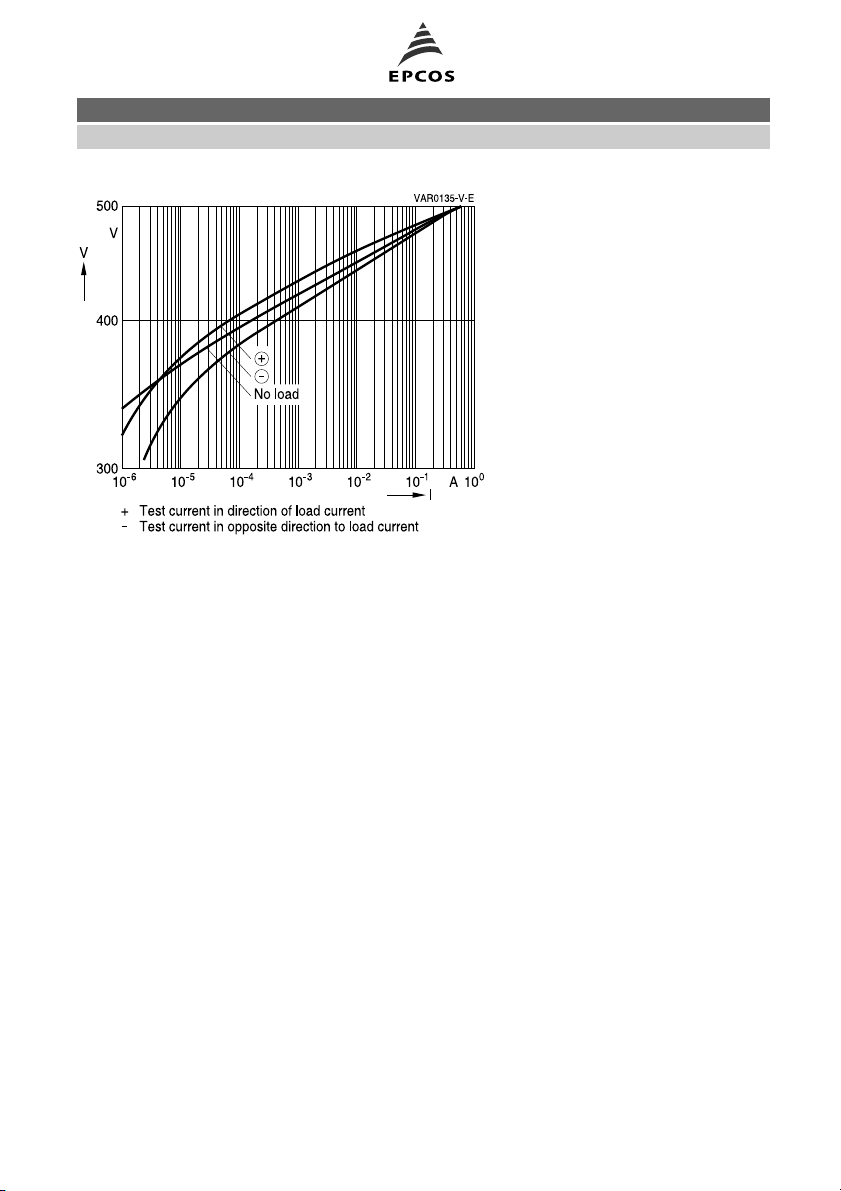
of a few percent to begin with, and for a unipolar load there are also polarization effects. This is
seen in figure 12 for the leakage current. Such phenomena have to be considered when interpreting measured results.
and Cautions and warnings.
Page 16 of 19Please read Important notes
Page 17
Selection procedure
So, in test circuits, you start by determining the varistor voltage for every single type as accurately
as possible (at a defined temperature). It is advisable to check the change in varistor voltage from
time to time, making sure the temperature is the same. By extrapolation of the measured results
to the intersection with the –10% line, a guide value for the lifetime of varistors is obtained.
Figure 11 Typical curves for change in varistor voltage when metal oxide varistors are
repeatedly loaded
Figure 12 Typical polarization effect for unipolar loading of metal oxide varistors
and Cautions and warnings.
Page 17 of 19Please read Important notes
Page 18
Selection procedure
Figure 13 Typical polarization effects of leakage current for unipolar loading
of metal oxide varistors
and Cautions and warnings.
Page 18 of 19Please read Important notes
Page 19
Selection procedure
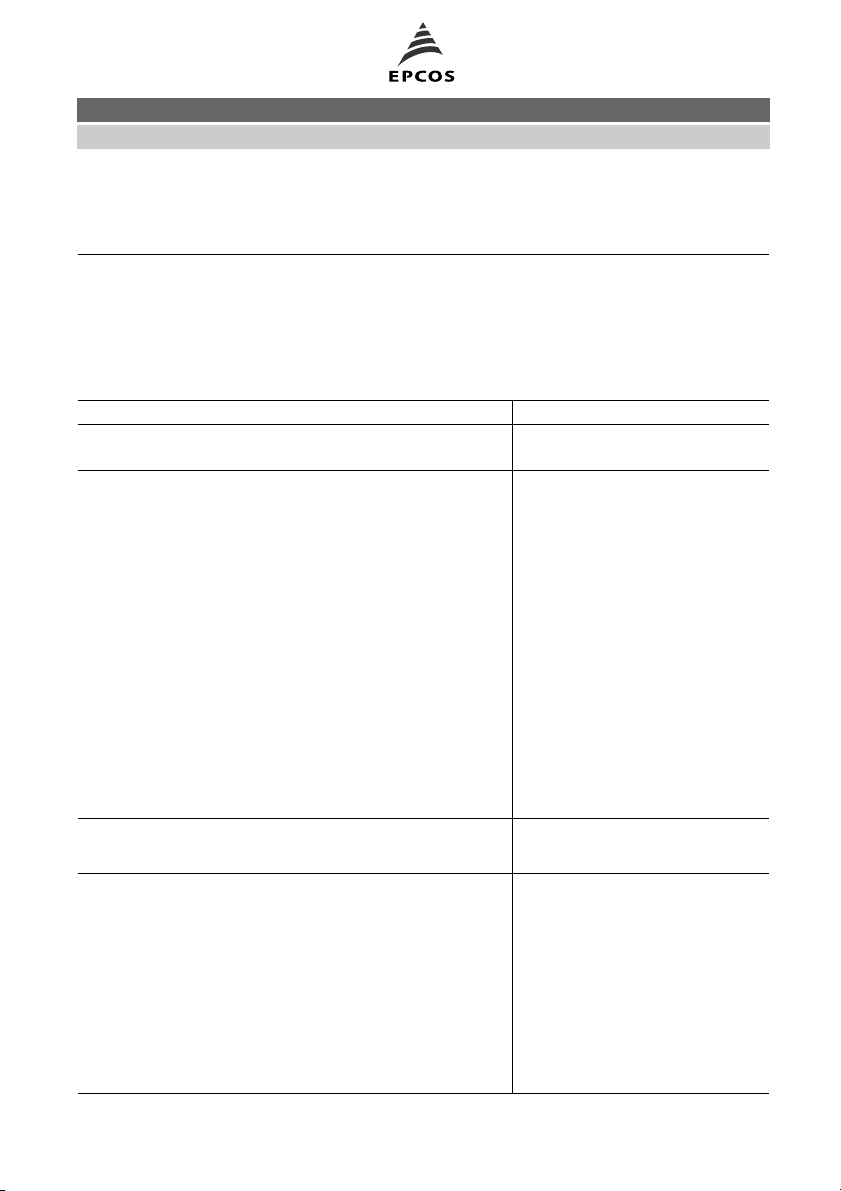
1.6 Questionnaire for selecting SIOVs
Table 1
Date . . . . . . . . . . . . . . . . . . . . . . . . . . . . . . . . . . . . . . . . . . . . . . . . . . . . . . . . . . . . . . . . .
Company . . . . . . . . . . . . . . . . . . . . . . . . . . . . . . . . . . . . . . . . . . . . . . . . . . . . . . . . . . . . .
Project . . . . . . . . . . . . . . . . . . . . . . . . . . . . . . . . . . . . . . . . . . . . . . . . . . . . . . . . . . . . . . .
Remarks
1. Max. operating voltage ... VACor … V
Operating voltage including
DC
all +tolerances
2.1 Surge current amplitude ............ kA
Waveform .............. s e.g. 8/20 µs, 10/1000 µs, 2 ms
No. of repetitions through lifetime ........ times
Minimum time between consecutive loads .............. s
and / or
2.2 Energy per load .............. J
Duration of energy input .............. s e.g. 8/20 µs, 10/1000 µs, 2 ms
No. of repetitions through lifetime ........ times
Minimum time between consecutive loads .............. s
and / or
2.3 Test standard .................. e.g.: IEC 61000-4-5
Test severity .................. e.g.: 3
Protection class .................. e.g.: 4
3. Required protection level
Reference current
... V
... A
4. Desired package Please mark
Disk type
Disk varistors in housing
ThermoFuse varistor (ETFV)
Fail-safe varistor (SFS)
EnergetiQ type
Block type
Strap type
and Cautions and warnings.
Page 19 of 19Please read Important notes
 Loading...