

Page 1
Low Noise, Low Drift
OP213
OUT A
–IN A
+IN A
V–
V+
OUT B
–IN B
+IN B
1
5
8
4
OP213
OUT A
–IN A
+IN A
V–
1
2
3
4
8
7
6
5
V+
OUT B
–IN B
+IN B
1
2
3
4
5
6
7
14
13
12
11
10
9
8
OP413
OUT A
–IN A
+IN A
V+ V–
OUT B
–IN B
+IN B
OUT D
–IN D
+IN D
+IN C
–IN C
OUT C
OUT C
OUT B
OP413
OUT A
–IN A
+IN A
V+
–IN B
+IN B
NC
V–
OUT D
–IN D
+IN D
+IN C
–IN C
NC
NC = NO CONNECT
116
89
OP113
OP113
NULL
–IN A
+IN A
V–
1
2
3
4
8
7
6
5
NC
V+
OUT A
NULL
NULL
–IN A
+IN A
V–
NC
V+
OUT A
NULL
NC = NO CONNECT
NC = NO CONNECT
1
5
8
4
a
Single-Supply Operational Amplifiers
FEATURES
Single- or Dual-Supply Operation
Low Noise: 4.7 nV/√Hz @ 1 kHz
Wide Bandwidth: 3.4 MHz
Low Offset Voltage: 100 mV
Very Low Drift: 0.2 mV/8C
Unity Gain Stable
No Phase Reversal
APPLICATIONS
Digital Scales
Multimedia
Strain Gages
Battery Powered Instrumentation
Temperature Transducer Amplifier
GENERAL DESCRIPTION
The OP113 family of single supply operational amplifiers features both low noise and drift. It has been designed for systems with internal calibration. Often these processor-based
systems are capable of calibrating corrections for offset and
gain, but they cannot correct for temperature drifts and noise.
Optimized for these parameters, the OP113 family can be used
to take advantage of superior analog performance combined
with digital correction. Many systems using internal calibration
operate from unipolar supplies, usually either +5 volts or +12
volts. The OP113 family is designed to operate from single
supplies from +4 volts to +36 volts, and to maintain its low
noise and precision performance.
The OP113 family is unity gain stable and has a typical gain
bandwidth product of 3.4 MHz. Slew rate is in excess of 1 V/µs.
Noise density is a very low 4.7 nV/√
Hz, and noise in the 0.1 Hz
to 10 Hz band is 120 nV p-p. Input offset voltage is guaranteed
and offset drift is guaranteed to be less than 0.8 µV/°C. Input
common-mode range includes the negative supply and to within
1 volt of the positive supply over the full supply range. Phase
reversal protection is designed into the OP113 family for cases
where input voltage range is exceeded. Output voltage swings
also include the negative supply and go to within 1 volt of the
positive rail. The output is capable of sinking and sourcing
current throughout its range and is specified with 600 Ω loads.
Digital scales and other strain gage applications benefit from the
very low noise and low drift of the OP113 family. Other applications include use as a buffer or amplifier for both A/D and
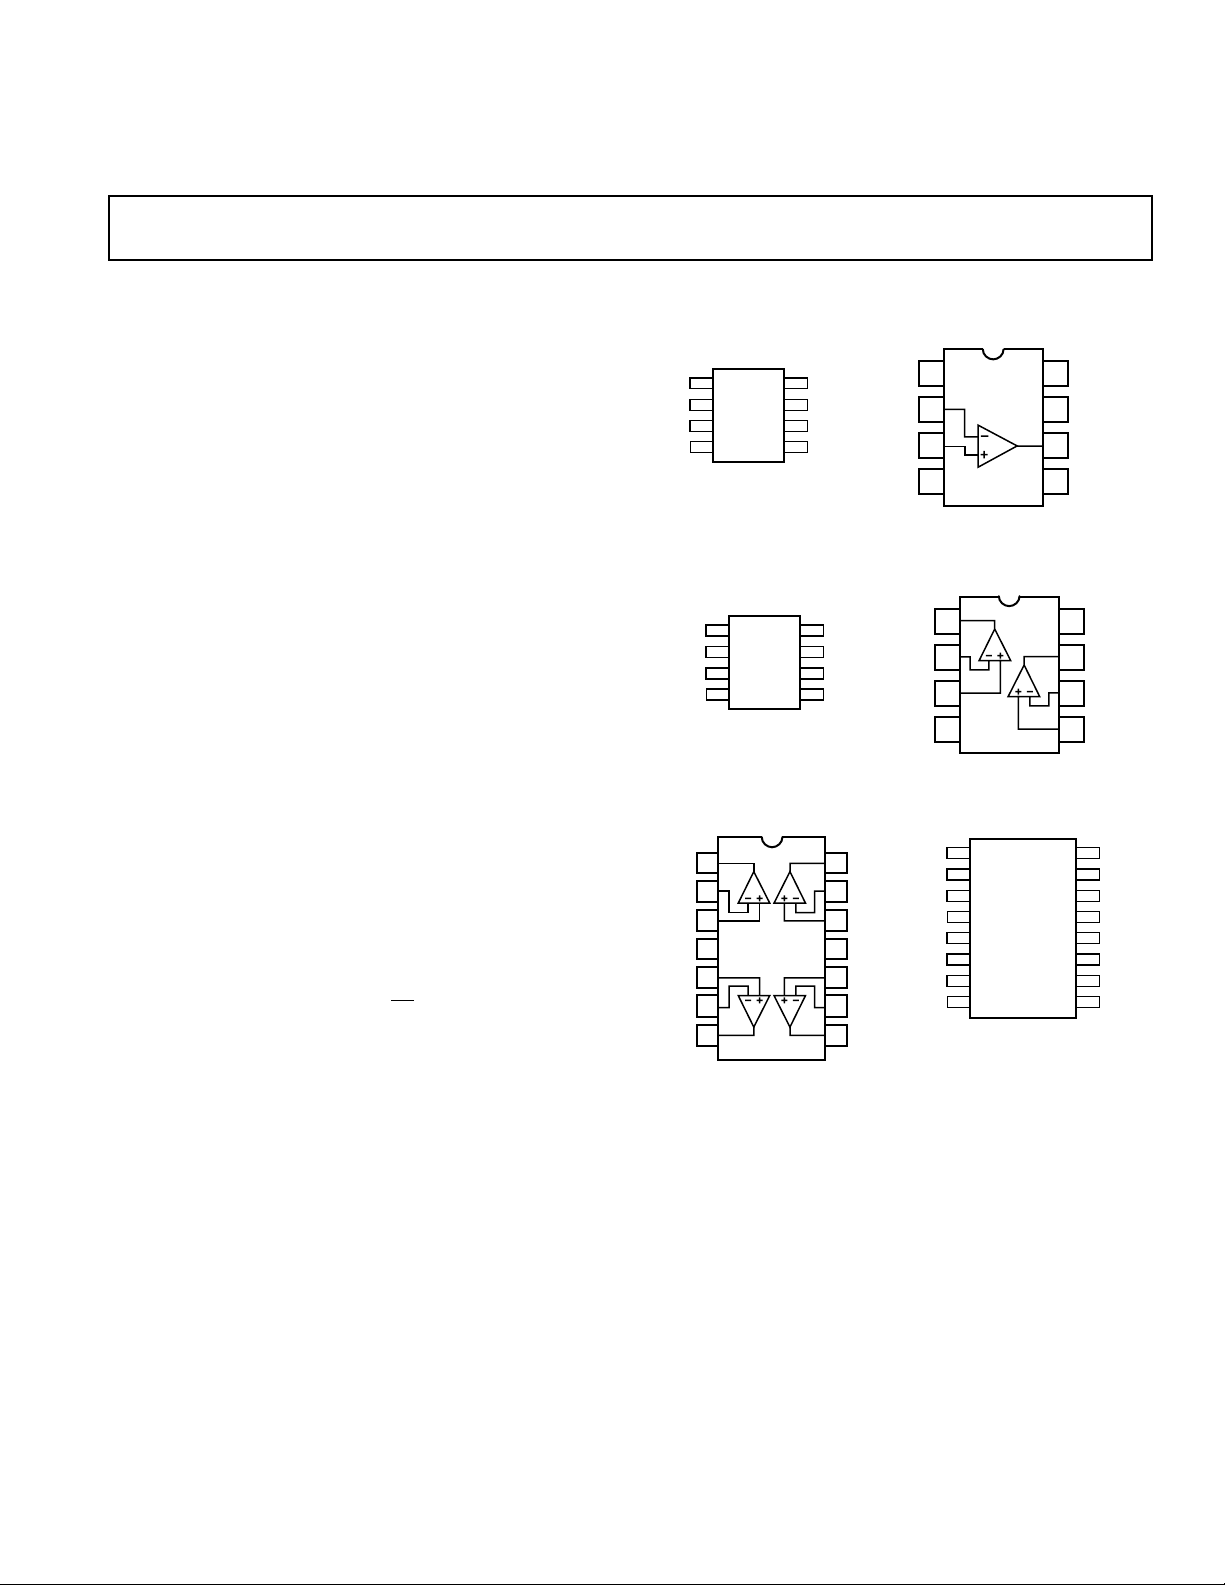
OP113/OP213/OP413
PIN CONNECTIONS
8-Lead Narrow-Body SO
8-Lead Narrow-Body SO
D/A sigma-delta converters. Often these converters have high
resolutions requiring the lowest noise amplifier to utilize their
full potential. Many of these converters operate in either single
supply or low supply voltage systems, and attaining the greater
signal swing possible increases system performance.
The OP113 family is specified for single +5 volt and dual ±15
volt operation over the XIND—extended industrial (–40°C to
+85°C) temperature range. They are available in plastic and
SOIC surface mount packages.
8-Lead Plastic DIP
8-Lead Plastic DIP
16-Lead Wide-Body SO14-Lead Plastic DIP
REV. C
Information furnished by Analog Devices is believed to be accurate and
reliable. However, no responsibility is assumed by Analog Devices for its
use, nor for any infringements of patents or other rights of third parties
which may result from its use. No license is granted by implication or
otherwise under any patent or patent rights of Analog Devices.
One Technology Way, P.O. Box 9106, Norwood, MA 02062-9106, U.S.A.
Tel: 781/329-4700 World Wide Web Site: http://www.analog.com
Fax: 781/326-8703 © Analog Devices, Inc., 1998
Page 2

OP113/OP213/OP413–SPECIFICATIONS
ELECTRICAL CHARACTERISTICS
(@ VS = 615.0 V, TA = +258C unless otherwise noted)
“E” Grade “F” Grade
Parameter Symbol Conditions Min Typ Max Min Typ Max Units
INPUT CHARACTERISTICS
Offset Voltage V
OS
OP113 75 150 µV
–40°C ≤ T
≤ +85°C 125 225 µV
A
OP213 100 250 µV
–40°C ≤ T
≤ +85°C 150 325 µV
A
OP413 125 275 µV
–40°C ≤ T
Input Bias Current I
B
VCM = 0 V, 240 600 600 nA
–40°C ≤ T
Input Offset Current I
OS
VCM = 0 V
–40°C ≤ T
Input Voltage Range V
CM
Common-Mode Rejection CMR –15 V ≤ V
–15 V ≤ V
–40°C ≤ T
Large Signal Voltage Gain A
VO
OP113, OP213, RL = 600 Ω,
–40°C ≤ T
OP413, R
–40°C ≤ T
R
= 2 kΩ,
L
–40°C ≤ T
Note 1 150 300 µV
Long-Term Offset Voltage
1
V
OS
≤ +85°C 175 350 µV
A
≤ +85°C 700 700 nA
A
≤ +85°C5050nA
A
–15 +14 –15 +14 V
≤ +14 V 100 116 96 dB
CM
≤ +14 V,
CM
≤ +85°C 97 116 94 dB
A
≤ +85°C 1 2.4 1 V/µV
A
= 1 kΩ,
L
≤ +85°C 1 2.4 1 V/µV
A
≤ +85°C28 2 V/µV
A
Offset Voltage Drift ∆VOS/∆T Note 2 0.2 0.8 1.5 µV/°C
O
UTPUT CHARACTERISTICS
Output Voltage Swing High V
Output Voltage Swing Low V
Short Circuit Limit I
OH
OL
SC
RL = 2 kΩ +14 +14 V
R
= 2 kΩ,
L
–40°C ≤ T
≤ +85°C +13.9 +13.9 V
A
RL = 2 kΩ –14.5 –14.5 V
R
= 2 kΩ,
L
–40°C ≤ T
≤ +85°C –14.5 –14.5 V
A
±40 ±40 mA
POWER SUPPLY
Power Supply Rejection Ratio PSRR V
Supply Current/Amplifier I
Supply Voltage Range V
SY
S
= ± 2 V to ±18 V 103 120 100 dB
S
V
= ± 2 V to ±18 V
S
–40°C ≤ T
V
OUT
V
= ± 18 V 3 3 mA
S
–40°C ≤ T
≤ +85°C 100 120 97 dB
A
= 0 V, RL = ∞,
≤ +85°C 3.8 3.8 mA
A
+4 ±18 +4 ±18 V
AUDIO PERFORMANCE
THD + Noise VIN = 3 V rms, RL = 2 kΩ
f = 1 kHz, 0.0009 0.0009 %
Voltage Noise Density e
n
f = 10 Hz 9 9 nV/√Hz
f = 1 kHz 4.7 4.7 nV/√
Current Noise Density i
n
f = 1 kHz 0.4 0.4 pA/√Hz
Voltage Noise en p-p 0.1 Hz to 10 Hz 120 120 nV p-p
DYNAMIC PERFORMANCE
Slew Rate SR RL = 2 kΩ 0.8 1.2 0.8 1.2 V/µs
Gain Bandwidth Product GBP 3.4 3.4 MHz
Channel Separation V
Settling Time t
NOTES
1
Long-term offset voltage is guaranteed by a 1000-hour life test performed on three independent lots at 125°C, with an LTPD of 1.3.
2
Guaranteed specifications, based on characterization data.
Specifications subject to change without notice.
S
= 10 V p-p
OUT
R
= 2 kΩ, f = 1 kHz 105 105 dB
L
to 0.01%, 0 V to 10 V Step 9 9 µs
Hz
–2–
REV. C
Page 3

OP113/OP213/OP413
ELECTRICAL CHARACTERISTICS
(@ VS = +5.0 V, TA = +258C unless otherwise noted)
“E” Grade “F” Grade
Parameter Symbol Conditions Min Typ Max Min Typ Max Units
INPUT CHARACTERISTICS
Offset Voltage V
OS
OP113 125 175 µV
–40°C ≤ T
≤ +85°C 175 250 µV
A
OP213 150 300 µV
–40°C ≤ T
≤ +85°C 225 375 µV
A
OP413 175 325 µV
–40°C ≤ T
Input Bias Current I
B
VCM = 0 V, V
–40°C ≤ T
Input Offset Current I
OS
VCM = 0 V, V
–40°C ≤ T
Input Voltage Range V
CM
Common-Mode Rejection CMR 0 V ≤ V
0 V ≤ V
–40°C ≤ T
Large Signal Voltage Gain A
VO
OP113, OP213, RL = 600 Ω, 2 kΩ
0.01 V ≤ V
OP413, R
0.01 V ≤ V
Note 1 200 350 µV
Long-Term Offset Voltage
1
V
OS
≤ +85°C 250 400 µV
A
= 2 300 650 650 nA
OUT
≤ +85°C 750 750 nA
A
= 2
OUT
≤ +85°C5050nA
A
0+4 +4V
≤ 4 V 93 106 90 dB
CM
≤ 4 V,
CM
≤ +85°C90 87 dB
A
≤ 3.9 V 2 2 V/µV
OUT
= 600, 2 kΩ,
L
≤ 3.9 V 1 1 V/µV
OUT
Offset Voltage Drift ∆VOS/∆T Note 2 0.2 1.0 1.5 µV/°C
O
UTPUT CHARACTERISTICS
Output Voltage Swing High V
Output Voltage Swing Low V
Short Circuit Limit I
OH
OL
SC
RL = 600 kΩ 4.0 4.0 V
R
= 100 kΩ, –40°C ≤ TA ≤ +85°C 4.1 4.1 V
L
R
= 600 Ω, –40°C ≤ TA ≤ +85°C 3.9 3.9 V
L
RL = 600 Ω, –40°C ≤ TA ≤ +85°C8 8mV
R
= 100 kΩ, –40°C ≤ TA ≤ +85°C8 8mV
L
±30 ± 30 mA
POWER SUPPLY
Supply Current I
Supply Current I
SY
SY
V
= 2.0 V, No Load 1.6 2.7 2.7 mA
OUT
–40°C ≤ TA ≤ +85°C 3.0 3.0 mA
AUDIO PERFORMANCE
THD + Noise V
Voltage Noise Density e
n
= 0 dBu, f = 1 kHz 0.001 0.001 %
OUT
f = 10 Hz 9 9 nV/√Hz
f = 1 kHz 4.7 4.7 nV/√
Current Noise Density i
n
f = 1 kHz 0.45 0.45 pA/√Hz
Voltage Noise en p-p 0.1 Hz to 10 Hz 120 120 nV p-p
DYNAMIC PERFORMANCE
Slew Rate SR R
= 2 kΩ 0.6 0.9 0.6 V/µs
L
Gain Bandwidth Product GBP 3.5 3.5 MHz
Settling Time t
NOTES
1
Long-term offset voltage is guaranteed by a 1000 hour life test performed on three independent lots at 125° C, with an LTPD of 1.3.
2
Guaranteed specifications, based on characterization data.
Specifications subject to change without notice.
S
to 0.01%, 2 V Step 5.8 5.8 µs
Hz
REV. C
–3–
Page 4
OP113/OP213/OP413
ABSOLUTE MAXIMUM RATINGS
1
Supply Voltage . . . . . . . . . . . . . . . . . . . . . . . . . . . . . . . . .±18 V
Input Voltage . . . . . . . . . . . . . . . . . . . . . . . . . . . . . . . . . .±18 V
Differential Input Voltage . . . . . . . . . . . . . . . . . . . . . . . .±10 V
Output Short-Circuit Duration to GND . . . . . . . . . . Indefinite
Storage Temperature Range
P, S Package . . . . . . . . . . . . . . . . . . . . . . . . –65°C to +150°C
Operating Temperature Range
OP113/OP213/OP413E, F . . . . . . . . . . . . . . –40°C to +85°C
Junction Temperature Range
P, S Package . . . . . . . . . . . . . . . . . . . . . . . . –65°C to +150°C
Lead Temperature Range (Soldering, 60 sec) . . . . . . . +300°C
Package Type u
2
JA
u
JC
Units
8-Lead Plastic DIP (P) 103 43 °C/W
8-Lead SOIC (S) 158 43 °C/W
14-Lead Plastic DIP (P) 83 39 °C/W
16-Lead SOIC (S) 92 27 °C/W
NOTES
1
Absolute maximum ratings apply to both DICE and packaged parts, unless
otherwise noted.
2
θJA is specified for the worst case conditions, i.e., θJA is specified for device in socket
for cerdip, P-DIP, and LCC packages; θJA is specified for device soldered in circuit
board for SOIC package.
ORDERING GUIDE
Temperature Package Package
Model Range Description Options
OP113EP –40°C to +85°C 8-Lead Plastic DIP N-8
OP113ES –40°C to +85°C 8-Lead SOIC SO-8
OP113FP –40°C to +85°C 8-Lead Plastic DIP N-8
OP113FS –40 °C to +85°C 8-Lead SOIC SO-8
OP213EP –40 °C to +85°C 8-Lead Plastic DIP N-8
OP213ES –40°C to +85°C 8-Lead SOIC SO-8
OP213FP –40°C to +85°C 8-Lead Plastic DIP N-8
OP213FS –40 °C to +85°C 8-Lead SOIC SO-8
OP413EP –40 °C to +85°C 14-Lead Plastic DIP N-14
OP413ES –40°C to +85°C 16-Lead Wide SOIC R-16
OP413FP –40°C to +85°C 14-Lead Plastic DIP N-14
OP413FS –40 °C to +85°C 16-Lead Wide SOIC R-16
–4–
REV. C
Page 5
OP113/OP213/OP413
16
2
136711 12
4
14
15
9
1
3
AD588BD
8
10
3
2
8
1
R5
1kV
A2
2N2219A
+10.000V
+15V
–15V
10mF
1/2
OP213
+10.000V
6
5
4
7
1/2
OP213
A1
R3
17.2kV
0.1%R4500V
CMRR TRIM
10-TURN
T.C. LESS THAN 50ppm/8C
OUTPUT
0 10V
F.S.
–15V
350V
LOAD
CELL
100mV
F.S.
R1
17.2kV
0.1%
R2
301V
0.1%
3
2
8
1
2N2222A
2.500V
1/2
OP295
4
2
4
6
IN
OUT
GND
REF43
R8
12.0kV
R7
20.0kV
4.000V
350V
35mV
F.S.
+5V
1/2
OP213
1
3
2
8
6
5
4
7
R4
100kV
R3
20kV
R6
27.4V
R5
2.10kV
R2
20kV
R1
100kV
1/2
OP295
R
G
= 2,127.4V
+5V
OUTPUT
0V 3.5V
APPLICATIONS
The OP113, OP213 and OP413 form a new family of high
performance amplifiers that feature precision performance in
standard dual supply configurations and, more importantly,
maintain precision performance when a single power supply is
used. In addition to accurate dc specifications, it is the lowest
noise single supply amplifier available with only 4.7 nV/
typical noise density.
Single supply applications have special requirements due to the
generally reduced dynamic range of the output signal. Single
supply applications are often operated at voltages of +5 volts or
+12 volts, compared to dual supply applications with supplies of
±12 volts or ±15 volts. This results in reduced output swings.
Where a dual supply application may often have 20 volts of
signal output swing, single supply applications are limited to, at
most, the supply range and, more commonly, several volts below the supply. In order to attain the greatest swing the single
supply output stage must swing closer to the supply rails than in
dual supply applications.
The OP113 family has a new patented output stage that allows
the output to swing closer to ground, or the negative supply,
than previous bipolar output stages. Previous op amps had
outputs that could swing to within about ten millivolts of the
negative supply in single supply applications. However, the
OP113 family combines both a bipolar and a CMOS device in
the output stage, enabling it to swing to within a few hundred
microvolts of ground.
When operating with reduced supply voltages, the input range is
also reduced. This reduction in signal range results in reduced
signal-to-noise ratio, for any given amplifier. There are only two
ways to improve this: increase the signal range or reduce the
noise. The OP113 family addresses both of these parameters.
Input signal range is from the negative supply to within one
volt of the positive supply over the full supply range. Competitive parts have input ranges that are a half a volt to five
volts less than this. Noise has also been optimized in the OP113
family. At 4.7 nV/√
Hz, it is less than one fourth that of competi-
tive devices.
Phase Reversal
The OP113 family is protected against phase reversal as long as
both of the inputs are within the supply ranges. However, if there
is a possibility of either input going below the negative supply
(or ground in the single supply case), the inputs should be protected with a series resistor to limit input current to 2 mA.
OP113 Offset Adjust
The OP113 has the facility for external offset adjustment, using
the industry standard arrangement. Pins 1 and 5 are used in
conjunction with a potentiometer of 10 kΩ total resistance,
connected with the wiper to V– (or ground in single supply
applications). The total adjustment range is about ±2 mV using
this configuration.
Adjusting the offset to zero has minimal effect on offset
drift (assuming the potentiometer has a tempco of less than
1000 ppm/°C). Adjustment away from zero, however, (like all
bipolar amplifiers) will result in a TCV
3.3 µV/°C for every millivolt of induced offset.
It is therefore not generally recommended that this trim be used
to compensate for system errors originating outside of the
OP113. The initial offset of the OP113 is low enough that
external trimming is almost never required but, if necessary, the
REV. C –5–
of approximately
OS
√
2 mV trim range may be somewhat excessive. Reducing the
trimming potentiometer to a 2 kΩ value will give a more reasonable range of ±400 µV.
Hz
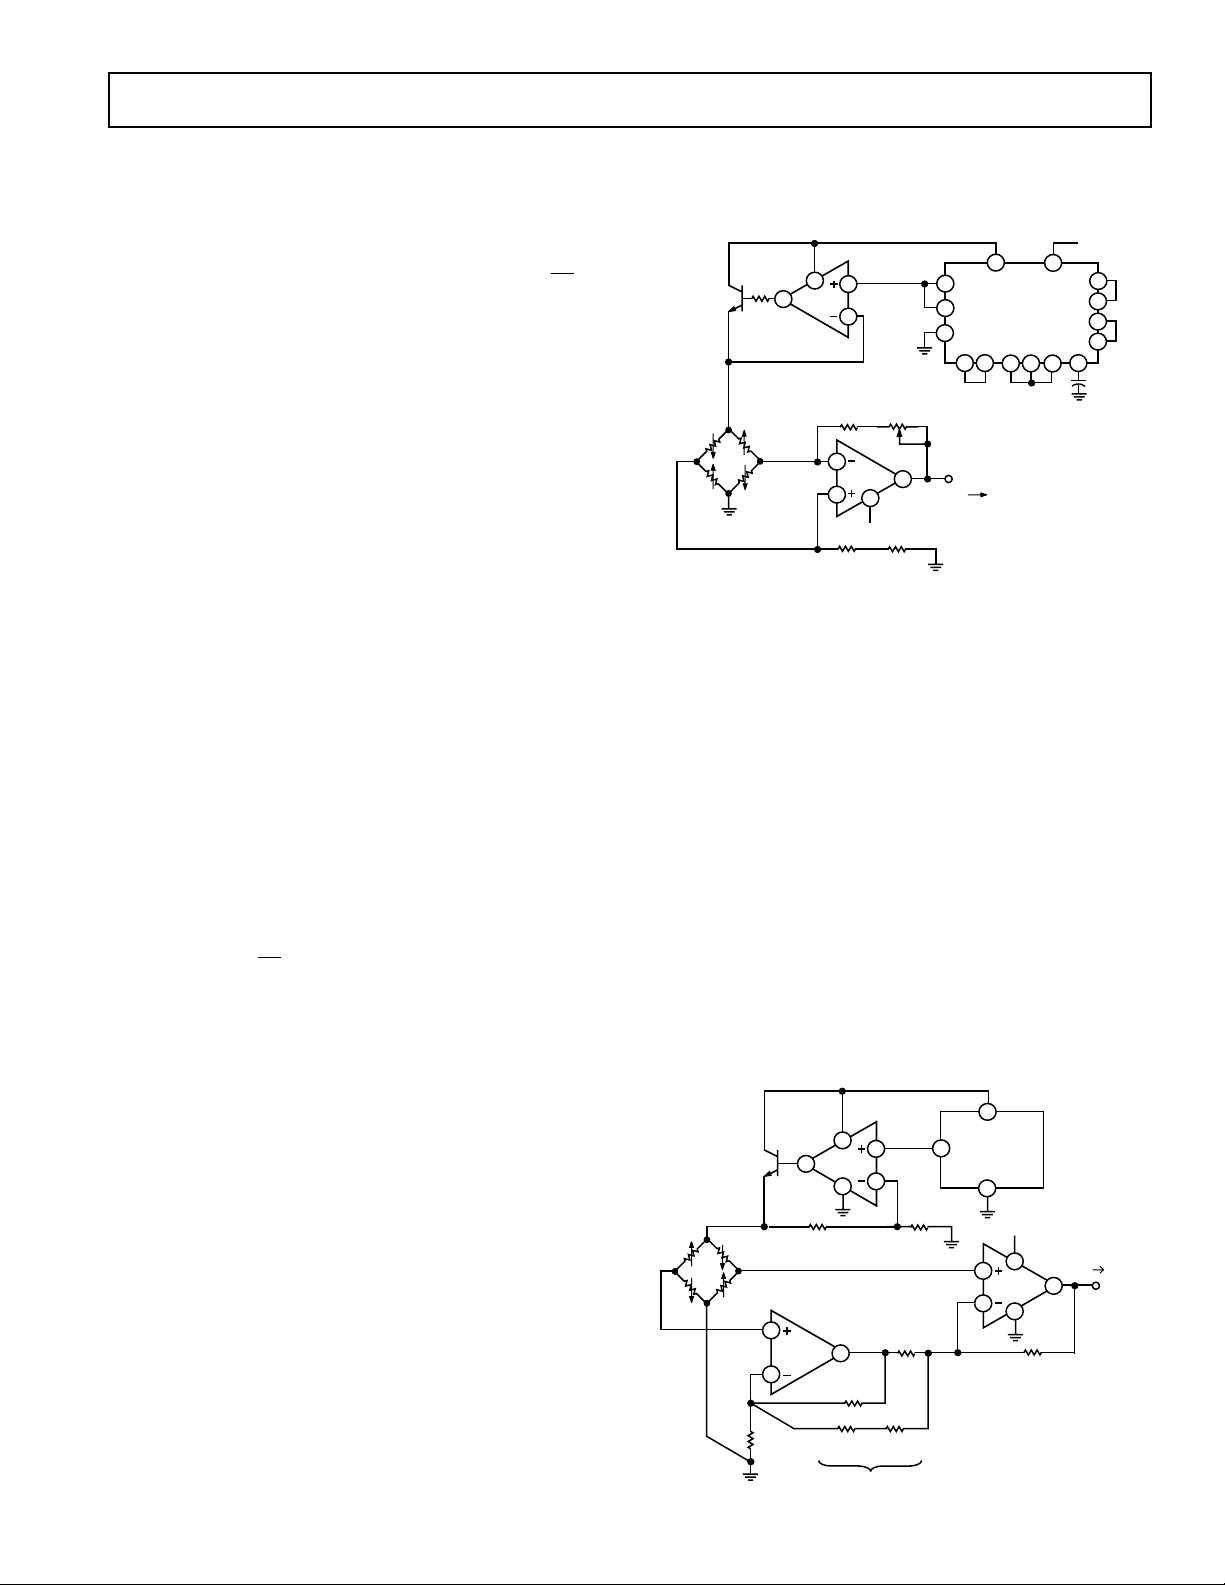
Figure 1. Precision Load Cell Scale Amplifier
APPLICATION CIRCUITS
A High Precision Industrial Load-Cell Scale Amplifier
The OP113 family makes an excellent amplifier for conditioning
a load-cell bridge. Its low noise greatly improves the signal resolution, allowing the load cell to operate with a smaller output
range, thus reducing its nonlinearity. Figure 1 shows one half of
the OP113 family used to generate a very stable 10.000 V bridge
excitation voltage while the second amplifier provides a differential gain. R4 should be trimmed for maximum common-mode
rejection.
A Low Voltage Single Supply, Strain-Gage Amplifier
The true zero swing capability of the OP113 family allows the
amplifier in Figure 2 to amplify the strain-gage bridge accurately
even with no signal input while being powered by a single +5
volt supply. A stable 4.000 V bridge voltage is made possible by
the rail-to-rail OP295 amplifier, whose output can swing to
within a millivolt of either rail. This high voltage swing greatly
increases the bridge output signal without a corresponding increase in bridge input.
Figure 2. Single Supply Strain-Gage Amplifier
Page 6

OP113/OP213/OP413
1/2
OP213
1
3
2
8
4
0V TO 10.00V
(08C TO 10008C)
+12V
0.1mF
+
10mF
R9
124kV
R8
453V
R5
40.2kV
R1
10.7kV
R2
2.74kV
REF02EZ
0.1mF
+12V
2 6
4
++
––
D1
1N4148
R3
53.6V
R4
5.62kV
+5.000V
K-TYPE
THERMOCOUPLE
40.7mV/8C
R6
200V
V
IN
+
–
*R1
10kV
1/2
OP213
1/2
OP213
*R2
10kV
*R3
10kV
*R4
10kV
V
OUT
+5V TO +36V
*R
G
(200V + 12.7V)
*ALL RESISTORS 60.1%, 625ppm/8C
GAIN = + 6
20kV
R
G
A High Accuracy Linearized RTD Thermometer Amplifier
Zero suppressing the bridge facilitates simple linearization of the
RTD by feeding back a small amount of the output signal to the
RTD (Resistor Temperature Device). In Figure 3 the left leg of
the bridge is servoed to a virtual ground voltage by amplifier
A1, while the right leg of the bridge is also servoed to zero-volt
by amplifier A2. This eliminates any error resulting from
common-mode voltage change in the amplifier. A three-wire
RTD is used to balance the wire resistance on both legs of the
bridge, thereby reducing temperature mismatch errors. The
5.000 V bridge excitation is derived from the extremely stable
AD588 reference device with 1.5 ppm/°C drift performance.
Linearization of the RTD is done by feeding a fraction of the
output voltage back to the RTD in the form of a current. With
just the right amount of positive feedback, the amplifier output
will be linearly proportional to the temperature of the RTD.
+15V–15V
2
16
11
12
13
AD588BD
4
6
8
7
9
10mF
100V
RTD
Figure 3. Ultraprecision RTD Amplifier
To calibrate the circuit, first immerse the RTD in a zero-degree
ice bath or substitute an exact 100 Ω resistor in place of the
RTD. Adjust the ZERO ADJUST potentiometer for a 0.000 V
output, then set R9 LINEARITY ADJUST potentiometer to
the middle of its adjustment range. Substitute a 280.9 Ω resistor
(equivalent to 500°C) in place of the RTD, and adjust the
FULL-SCALE ADJUST potentiometer for a full-scale voltage
of 5.000 V.
To calibrate out the nonlinearity, substitute a 194.07 Ω resistor
(equivalent to 250°C) in place of the RTD, then adjust the
LINEARITY ADJUST potentiometer for a 2.500 V output.
Check and readjust the full-scale and half-scale as needed.
Once calibrated, the amplifier outputs a 10 mV/°C temperature
coefficient with an accuracy better than ±0.5°C over an RTD
measurement range of –150°C to +500°C. Indeed the amplifier
can be calibrated to a higher temperature range, up to 850°C.
A High Accuracy Thermocouple Amplifier
Figure 4 shows a popular K-type thermocouple amplifier with
cold-junction compensation. Operating from a single +12 volt
supply, the OP113 family’s low noise allows temperature measurement to better than 0.02°C resolution from 0°C to 1000°C
range. The cold-junction error is corrected by using an inexpensive silicon diode as a temperature measuring device. It should
be placed as close to the two terminating junctions as physically
possible. An aluminum block might serve well as an isothermal
system.
14
15
1
R3
3
50V
10
R1
8.25kV
R
W1
R
W2
R
W3
RG FULL SCALE ADJUST
R2
8.25kV
R4
100V
2
3
A1
OP213
1
1/2
R5
4.02kV
6
A2
5
+15V
8
4
–15V
R7
100V
1/2
OP213
R8
49.9kV
7
V
(10mV/8C)
OUT
–1.50V = –1508C
+5.00V = +5008C
R9
5kV
LINEARITY
ADJUST
@1/2 F.S.
Figure 4. Accurate K-Type Thermocouple Amplifier
R6 should be adjusted for a zero-volt output with the thermocouple measuring tip immersed in a zero-degree ice bath. When
calibrating, be sure to adjust R6 initially to cause the output to
swing in the positive direction first. Then back off in the negative direction until the output just stops changing.
An Ultralow Noise, Single Supply Instrumentation Amplifier
Extremely low noise instrumentation amplifiers can be built
using the OP113 family. Such an amplifier that operates off a
single supply is shown in Figure 5. Resistors R1–R5 should be
of high precision and low drift type to maximize CMRR performance. Although the two inputs are capable of operating to zero
volt, the gain of –100 configuration will limit the amplifier input
common mode to not less than 0.33 V.
Figure 5. Ultralow Noise, Single Supply Instrumentation
Amplifier
–6–
REV. C
Page 7

OP113/OP213/OP413
8
1
4
3
2
1/2 OP113
10mF
C2
10mF
+5V
–
+
OUTPUT
+2.500V
3mV p-p NOISE
+
10kV
10kV
6
2
+5V
IN
OUT
4
GND
REF43
Supply Splitter Circuit
The OP113 family has excellent frequency response characteristic that makes it an ideal pseudo-ground reference generator as
shown in Figure 6. The OP113 family serves as a voltage follower buffer. In addition, it drives a large capacitor that serves
as a charge reservoir to minimize transient load changes, as well
as a low impedance output device at high frequencies. The
circuit easily supplies 25 mA load current with good settling
characteristics.
+
V
= +5V +12V
S
R3
2.5kV
C1
0.1mF
8
4
R4
100V
1
+
V
S
2
OUTPUT
+
C2
1mF
5kV
5kV
R1
2
1/2 OP113
3
R2
Figure 6. False Ground Generator
Low Noise Voltage Reference
Few reference devices combine low noise and high output drive
capabilities. Figure 7 shows the OP113 family used as a twopole active filter that band limits the noise of the 2.500 V reference. Total noise measures 3 µV p-p.
Figure 7. Low Noise Voltage Reference
+5 V Only Stereo DAC for Multimedia
The OP113 family’s low noise and single supply capability are
ideally suited for stereo DAC audio reproduction or sound
synthesis applications such as multimedia systems. Figure 8
shows an 18-bit stereo DAC output setup that is powered from a
single +5 volt supply. The low noise preserves the 18-bit dynamic
range of the AD1868. For DACs that operate on dual supplies,
the OP113 family can also be powered from the same supplies.
1
2
3
4
5
6
7
8
V
L
LL
DL
CK
DR
LR
DGND
VBR
18-BIT
DAC
18-BIT
SERIAL
REG.
18-BIT
SERIAL
REG.
18-BIT
DAC
+5V SUPPLY
AD1868
VBL
16
15
7.68kV
14
VOL
V
REF
AGND
V
REF
VOR
330pF
13
12
11
10
9
V
S
330pF
7.68kV
9.76kV
9.76kV
Figure 8. +5 V Only 18-Bit Stereo DAC
1/2 OP213
7.68kV
7.68kV
6
1/2 OP213
5
8
100pF
100pF
220mF
1
+
220mF
7
+
LEFT
CHANNEL
–
OUTPUT
47kV
RIGHT
CHANNEL
–
OUTPUT
47kV
SoundPort is a registered trademark of Analog Devices, Inc.
REV. C –7–
Page 8

OP113/OP213/OP413
Low Voltage Headphone Amplifiers
Figure 9 shows a stereo headphone output amplifier for the
AD1849 16-bit SoundPort
®
Stereo Codec device. The pseudoreference voltage is derived from the common-mode voltage
generated internally by the AD1849, thus providing a convenient bias for the headphone output amplifiers.
OPTIONAL
GAIN
LOUT1L
AD1849
CMOUT
LOUT1R
1kV
V
REF
10mF
31
V
19
29
REF
10mF
10kV
10kV
L VOLUME
CONTROL
R VOLUME
CONTROL
1kV
OPTIONAL
GAIN
V
REF
5kV
+5V
1/2
OP213
+5V
OP213
1/2
OP213
5kV
1/2
16V
16V
220mF
+
47kV
220mF
+
47kV
HEADPHONE
LEFT
HEADPHONE
RIGHT
Figure 9. Headphone Output Amplifier for Multimedia
Sound Codec
Low Noise Microphone Amplifier for Multimedia
The OP113 family is ideally suited as a low noise microphone
preamp for low voltage audio applications. Figure 10 shows a
gain of 100 stereo preamp for the AD1849 16-bit SoundPort
Stereo Codec chip. The common-mode output buffer serves as
a “phantom power” driver for the microphones.
10kV
+5V
LEFT
ELECTRET
CONDENSER
MIC
INPUT
RIGHT
ELECTRET
CONDENSER
MIC
INPUT
20V
20V
10mF
10mF
+5V
1/2
OP213
50V
50V
10kV
100V
OP213
100V10kV
1/2
10kV
1/2
OP213
17
MINL
AD1849
19
CMOUT
15
MINR
Precision Voltage Comparator
With its PNP inputs and zero volt common-mode capability, the
OP113 family can make useful voltage comparators. There is
only a slight penalty in speed in comparison to IC comparators.
However, the significant advantage is its voltage accuracy. For
example, V
can be a few hundred microvolts or less, combined
OS
with CMRR and PSRR exceeding 100 dB, while operating on
5 V supply. Standard comparators like the 111/311 family operate on 5 volts, but not with common-mode at ground, nor with
offset below 3 mV. Indeed, no commercially available single
supply comparator has a V
less than 200 µV.
OS
Figure 11 shows the OP113 family response to a 10 mV overdrive signal when operating in open loop. The top trace shows
the output rising edge has a 15 µs propagation delay, while the
bottom trace shows a 7 µs delay on the output falling edge. This
ac response is quite acceptable in many applications.
0V
+2.5V
–2.5V
t
= tf = 5ms
r
100
90
10
0%
610mV OVERDRIVE
25kV
100V
2V
2V
5ms
+5V
1/2
OP113
Figure 11. Precision Comparator
The low noise and 250 µV (maximum) offset voltage enhance
the overall dc accuracy of this type of comparator. Note that
zero crossing detectors and similar ground referred comparisons
can be implemented even if the input swings to –0.3 volts below
ground.
Figure 10. Low Noise Stereo Microphone Amplifier for
Multimedia Sound Codec
SoundPort is a registered trademark of Analog Device, Inc.
–8–
REV. C
Page 9

150
0
1.0
90
30
0.1
60
0
120
0.90.80.70.60.50.40.30.2
TCVOS – mV
UNITS
VS = 615V
–40
8C T
A
+858C
400 3 OP AMPS
PLASTIC PKG
500
0
1.0
300
100
0.1
200
0
400
0.90.80.70.60.50.40.30.2
TCVOS – mV
UNITS
VS = 615V
–40
8C T
A
+858C
896 (PLASTIC) 3 OP AMPS
TCVOS – mV
UNITS
600
0
1.0
300
100
0.1
200
0
500
400
0.90.70.60.5 0.80.40.30.2
VS = 615V
–40
8C T
A
+858C
1220 3 OP AMPS
PLASTIC PKG
100
80
60
UNITS
40
20
VS = 615V
= +258C
T
A
400 3 OP AMPS
PLASTIC PKG
OP113/OP213/OP413
0
–50
–40
INPUT OFFSET VOLTAGE, VOS – mV
50
403020100–10–20–30
Figure 12a. OP113 Input Offset (VOS) Distribution
@
±
15 V
500
VS = 615V
= +258C
T
400
300
UNITS
200
100
–100
0
–80
INPUT OFFSET VOLTAGE, VOS – mV
A
896 (PLASTIC) 3 OP AMPS
100
806040200–20–40–60
Figure 12b. OP213 Input Offset (VOS) Distribution
@
±
15 V
Figure 13a. OP113 Temperature Drift (TCVOS)
Distribution @
±
15 V
Figure 13b. OP213 Temperature Drift (TCVOS)
Distribution @
±
15 V
500
VS = 615V
T
= +258C
A
400
1220 3 OP AMPS
PLASTIC PKG
300
UNITS
200
100
0
–60
Figure 12c. OP413 Input Offset (VOS) Distribution
@
±
15 V
REV. C –9–
–40
INPUT OFFSET VOLTAGE, VOS – mV
140
120100806040200–20
Figure 13c. OP413 Temperature Drift (TCVOS)
Distribution @
±
15 V
Page 10

OP113/OP213/OP413
500
0
125
300
100
–50
200
400
100755025
0–25
TEMPERATURE – C
INPUT BIAS CURRENT – nA
–75
VS = 615V
VS = +5.0V
15.0
–15.0
125
–13.5
–14.5
–50
–14.0
–75
13.0
12.5
13.5
14.0
14.5
1007550250–25
TEMPERATURE – 8C
POSITIVE OUTPUT SWING – Volts
VS = 615V
+SWING
R
L
= 2kV
+SWING
RL = 600V
–SWING
R
L
= 600V
–SWING
R
L
= 2kV
1000
800
600
400
INPUT BIAS CURRENT – nA
200
0
–75
–50
VS = 5.0V
VCM = 2.5V
VS = 615V
VCM = 0V
TEMPERATURE – 8C
VCM = 0V
1007550250–25
Figure 14. OP113 Input Bias Current vs. Temperature
5.0
4.5
4.0
3.5
POSITIVE OUTPUT SWING – Volts
3.0
–75
+SWING
= 2kV
R
L
+SWING
= 600V
R
L
–50
TEMPERATURE – 8C
–SWING
= 2kV
R
L
–SWING
R
L
VS = +5.0V
= 600V
75 10050250–25
125
Figure 17. OP213 Input Bias Current vs. Temperature
2.0
1.5
1.0
0.5
NEGATIVE OUTPUT SWING – mV
0
125
Figure 15. Output Swing vs. Temperature and RL @ +5 V
60
VS = 615V
40
T
A
20
0
–20
–40
–60
–80
CHANNEL SEPARATION – dB
–100
–120
10 100 10M1M100k10k1k
= +258C
105
Figure 16. Channel Separation
FREQUENCY – Hz
Figure 18. Output Swing vs. Temperature and RL @ ±15 V
20
18
16
14
12
10
8
6
OPEN-LOOP GAIN – V/mV
4
2
0
–50
–75
RL = 2kV
RL = 600V
0–25
TEMPERATURE – 8C
VS = +5.0V
V
= 3.9V
O
Figure 19. Open-Loop Gain vs. Temperature @ +5 V
–10–
100755025
125
REV. C
Page 11

12.5
10
0
125
3
1
–50
2
6
4
5
7
8
9
100755025
0–25
TEMPERATURE – 8C
OPEN LOOP GAIN – V/mV
–75
RL = 2kV
RL = 600V
VS = 615V
V
O
= 610V
100
40
–20
10k 10M1M100k1k
20
0
60
80
FREQUENCY – Hz
OPEN-LOOP GAIN – dB
90
225
135
180
45
0
PHASE – Degrees
TA= +258C
V
S
= 615V
GAIN
PHASE
um = 728
50
30
–20
10k 10M1M100k1k
40
10
20
–10
0
FREQUENCY – Hz
CLOSED-LOOP GAIN – dB
AV = +100
AV = +10
AV = +1
TA= +258C
V
S
= 615V
10.0
RL = 2kV
VS = 615V
V
= 610V
D
OP113/OP213/OP413
7.5
5.0
OPEN-LOOP GAIN – V/mV
2.5
0
–75
RL = 1kV
RL = 600V
1007550250–25
TEMPERATURE – 8C
Figure 20. OP413 Open-Loop Gain vs. Temperature
100
OPEN-LOOP GAIN – dB
V+ = 5V
V– = 0V
= +258C
T
80
60
40
20
A
GAIN
PHASE
um = 578
0
125–50
0
45
90
135
PHASE – Degrees
180
Figure 23. OP213 Open-Loop Gain vs. Temperature
Figure 21. Open-Loop Gain, Phase vs. Frequency @ +5 V
Figure 22. Closed-Loop Gain vs. Frequency @ +5 V
REV. C –11–
–20
50
40
30
20
10
0
CLOSED-LOOP GAIN – dB
–10
–20
10k 10M1M100k1k
AV = +100
AV = +10
AV = +1
10k 10M1M100k1k
FREQUENCY – Hz
FREQUENCY – Hz
V+ = 5V
V– = 0V
= +258C
T
A
225
Figure 24. Open-Loop Gain, Phase vs. Frequency @ ±15 V
Figure 25. Closed-Loop Gain vs. Frequency @ ±15 V
Page 12

OP113/OP213/OP413
3.0
1.5
0
110 1k100
1.0
0.5
2.0
2.5
FREQUENCY – Hz
CURRENT NOISE DENSITY – pA/!Hz
TA = +258C
V
S
= 615V
140
100
0
1k 1M100k10k100
120
60
80
20
40
FREQUENCY – Hz
COMMON-MODE REJECTION – dB
TA= +258C
V
S
= 615V
70
65
60
55
PHASE MARGIN – Degrees
50
–75
V+ = 5V
V– = 0V
–50
GBW
um
75 10050250–25
TEMPERATURE – 8C
5
4
3
2
GAIN-BANDWIDTH PRODUCT – MHz
1
125
Figure 26. Gain Bandwidth Product and Phase Margin vs.
Temperature @ +5 V
30
25
20
TA = +258C
V
= 615V
S
70
65
60
55
PHASE MARGIN – Degrees
50
–75
VS = 615V
–50
GBW
um
TEMPERATURE – 8C
75 10050250–25
5
4
3
2
GAIN-BANDWIDTH PRODUCT – MHz
1
125
Figure 29. Gain Bandwidth Product and Phase Margin vs.
Temperature @
±
15 V
15
10
5
VOLTAGE NOISE DENSITY – nV/!Hz
0
110 1k100
Figure 27. Voltage Noise Density vs. Frequency
140
120
100
80
60
40
COMMON-MODE REJECTION – dB
Figure 28. Common-Mode Rejection vs. Frequency @ +5 V
20
0
1k 1M100k10k100
FREQUENCY – Hz
FREQUENCY – Hz
V+ = 5V
V– = 0V
= +258C
T
A
–12–
Figure 30. Current Noise Density vs. Frequency
Figure 31. Common-Mode Rejection vs. Frequency
@
±
15 V
REV. C
Page 13

OP113/OP213/OP413
140
120
100
80
60
40
POWER SUPPLY REJECTION – dB
20
0
–PSRR
1k 1M100k10k100
FREQUENCY – Hz
+PSRR
TA = +258C
V
= 615V
S
Figure 32. Power Supply Rejection vs. Frequency
@
±
15 V
6
VS = +5V
R
= 2kV
5
4
L
T
A
A
VCL
= +258C
= +1
40
30
20
IMPEDANCE – V
10
0
1k 1M100k10k100
AV = +100
AV = +10
FREQUENCY – Hz
TA = +258C
V
= 615V
S
AV = +1
Figure 35. Closed-Loop Output Impedance vs. Frequency
@
±
15 V
30
25
20
VS = 615V
R
= 2kV
L
TA = +258C
A
= +1
VOL
3
2
MAXIMUM OUTPUT SWING – Volts
1
0
10k 10M1M100k1k
FREQUENCY – Hz
Figure 33. Maximum Output Swing vs. Frequency @ +5 V
50
VS = +5V
45
R
= 2kV
L
VIN = 100mV p-p
40
T
= +258C
A
35
A
= +1
VCL
30
NEGATIVE
EDGE
100
LOAD CAPACITANCE – pF
POSITIVE
EDGE
400300200
500
OVERSHOOT – %
25
20
15
10
5
0
0
Figure 34. Small Signal Overshoot vs. Load Capacitance
@ +5 V
15
10
MAXIMUM OUTPUT SWING – Volts
5
0
10k 10M1M100k1k
FREQUENCY – Hz
Figure 36. Maximum Output Swing vs. Frequency
@
±
15 V
20
VS = 615V
18
R
= 2kV
L
VIN = 100mV p-p
16
TA = +258C
A
= +1
VCL
14
12
10
8
OVERSHOOT – %
6
4
2
0
0
100
LOAD CAPACITANCE – pF
POSITIVE
EDGE
NEGATIVE
EDGE
400300200
500
Figure 37. Small Signal Overshoot vs. Load Capacitance
@
±
15 V
REV. C –13–
Page 14

OP113/OP213/OP413
2.0
0
125
1.5
0.5
–50
1.0
75 10050250–25
TEMPERATURE – 8C
SLEW RATE – V/ms
–75
VS = 615V
V
OUT
= 610V
+SLEW RATE
–SLEW RATE
0%
100
20mV
1s
90
10
2.0
VS = +5, 0
V
OUT
+4.0V
+SLEW RATE
+0.5V
1.5
1.0
SLEW RATE – V/ms
0.5
–SLEW RATE
0
–75
–50
TEMPERATURE – 8C
75 10050250–25
125
Figure 38. Slew Rate vs. Temperature @ +5 V
(0.5 V
≤
V
≤ +4.0 V)
OUT
1s
100
90
10
0%
20mV
Figure 39. Input Voltage Noise @ ±15 V
(20 nV/div)
Figure 41. Slew Rate vs. Temperature @ ±15 V
(–10 V
≤
V
OUT
≤ +10.0 V)
Figure 42. Input Voltage Noise @ +5 V
(20 nV/ div)
909V
100V
0.1 – 10Hz
= 1000
A
V
Figure 40. Noise Test Diagram
AV = 100
t
OUT
–14–
5
4
VS = 618V
3
2
SUPPLY CURRENT – mA
1
0
–50
–75
0–25
TEMPERATURE – 8C
VS = 615V
VS = +5.0V
100755025
Figure 43. Supply Current vs. Temperature
125
REV. C
Page 15

+IN
9V 9V
–IN
Figure 44. OP213 Simplified Schematic
*OP113 Family SPICE Macro-Model
*
*Copyright 1992 by Analog Devices, Inc.
*
*Node Assignments
*
* Noninverting Input
* Inverting Input
* Positive Supply
* Negative Supply
* Output
*
.SUBCKT OP113 Family 3 2746
*
* INPUT STAGE
R3 4 19 1.5E3
R4 4 20 1.5E3
C1 19 20 5.31E–12
I1 7 18 106E–6
IOS 2 3 25E–09
EOS 12 5 POLY(1) 51 4 25E–06 1
Q1 19 3 18 PNP1
Q2 20 12 18 PNP1
CIN 3 2 3E–12
D1 3 1 DY
D2 2 1 DY
EN 5 2 22 0 1
GN1 0 2 25 0 1E–5
GN2 0 3 28 0 1E–5
*
* VOLTAGE NOISE SOURCE WITH FLICKER NOISE
DN1 21 22 DEN
DN2 22 23 DEN
VN1 21 0 DC 2
VN2 0 23 DC 2
*
* CURRENT NOISE SOURCE WITH FLICKER NOISE
DN3 24 25 DIN
DN4 25 26 DIN
VN3 24 0 DC 2
VN4 0 26 DC 2
*
OUT
OP113/OP213/OP413
* SECOND CURRENT NOISE SOURCE
DN5 27 28 DIN
DN6 28 29 DIN
VN5 27 0 DC 2
VN6 0 29 DC 2
*
* GAIN STAGE & DOMINANT POLE AT .2000E+01 HZ
G2 34 36 19 20 2.65E–04
R7 34 36 39E+06
V3 35 4 DC 6
D4 36 35 DX
VB2 34 4 1.6
*
* SUPPLY/2 GENERATOR
ISY 7 4 0.2E–3
R10 7 60 40E+3
R11 60 4 40E+3
C3 60 0 1E–9
*
* CMRR STAGE & POLE AT 6 kHZ
ECM 50 4 POLY(2) 3 60 2 60 0 1.6 0 1.6
CCM 50 51 26.5E–12
RCM1 50 51 1E6
RCM2 51 4 1
*
*
OUTPUT STAGE
R12 37 36 1E3
R13 38 36 500
C4 37 6 20E–12
C5 38 39 20E–12
M1 39 36 4 4 MN L=9E–6 W=1000E–6 AD=15E–9 AS=15E–9
M2 45 36 4 4 MN L=9E–6 W=1000E–6 AD=15E–9 AS=15E–9
D5 39 47 DX
D6 47 45 DX
Q3 39 40 41 QPA 8
VB 7 40 DC 0.861
R14 7 41 375
Q4 41 7 43 QNA 1
R17 7 43 15
Q5 43 39 6 QNA 20
Q6 46 45 6 QPA 20
R18 46 4 15
Q7 36 46 4 QNA 1
M3 6 36 4 4 MN L = 9E–6 W=2000E–6 AD=30E–9 AS=30E–9
*
* NONLINEAR MODELS USED
*
.MODEL DX D (IS=1E–15)
.MODEL DY D (IS=1E–15 BV=7)
.MODEL PNP1 PNP (BF=220)
.MODEL DEN D(IS=1E–12 RS=1016 KF=3.278E–15 AF=1)
.MODEL DIN D(IS=1E–12 RS=100019 KF=4.173E–15 AF=1)
.MODEL QNA NPN(IS=1.19E–16 BF=253 VAF=193 VAR=15 RB=2.0E3
+ IRB=7.73E–6 RBM=132.8 RE=4 RC=209 CJE=2.1E–13 VJE=0.573
+ MJE=0.364 CJC=1.64E–13 VJC=0.534 MJC=0.5 CJS=1.37E–12
+ VJS=0.59 MJS=0.5 TF=0.43E–9 PTF=30)
.MODEL QPA PNP(IS=5.21E–17 BF=131 VAF=62 VAR= 15 RB=1.52E3
+ IRB=1.67E–5 RBM=368.5 RE=6.31 RC=354.4 CJE=1.1E–13
+ VJE=0.745 MJE=0.33 CJC=2.37E–13 VJC=0.762 MJC=0.4
+ CJS=7.11E–13 VJS=0.45 MJS=0.412 TF=1.0E–9 PTF=30)
.MODEL MN NMOS(LEVEL=3 VTO=1.3 RS=0.3 RD=0.3 TOX=8.5E–8
+ LD=1.48E–6 WD=1E–6 NSUB=1.53E16 UO=650 DELTA=10 VMAX=2E5
+ XJ=1.75E–6 KAPPA=0.8 ETA=0.066 THETA=0.01 TPG=1 CJ=2.9E–4
+ PB=0.837 MJ=0.407 CJSW=0.5E–9 MJSW=0.33)
*
.ENDS OP113 Family
REV. C –15–
Page 16

OP113/OP213/OP413
14
17
8
0.795 (20.19)
0.725 (18.41)
0.280 (7.11)
0.240 (6.10)
PIN 1
0.325 (8.25)
0.300 (7.62)
0.015 (0.38)
0.008 (0.20)
0.195 (4.95)
0.115 (2.93)
SEATING
PLANE
0.022 (0.558)
0.014 (0.36)
0.060 (1.52)
0.015 (0.38)
0.210 (5.33)
MAX
0.130
(3.30)
MIN
0.070 (1.77)
0.045 (1.15)
0.100
(2.54)
BSC
0.160 (4.06)
0.115 (2.92)
0.2992 (7.60)
0.2914 (7.40)
16 9
81
0.4133 (10.50)
0.3977 (10.00)
0.4193 (10.65)
0.3937 (10.00)
PIN 1
SEATING
PLANE
0.0118 (0.30)
0.0040 (0.10)
0.0192 (0.49)
0.0138 (0.35)
0.1043 (2.65)
0.0926 (2.35)
0.0500
(1.27)
BSC
0.0125 (0.32)
0.0091 (0.23)
0.0500 (1.27)
0.0157 (0.40)
0.0291 (0.74)
0.0098 (0.25)
x 458
88
08
OUTLINE DIMENSIONS
Dimensions shown in inches and (mm).
0.210 (5.33)
MAX
0.160 (4.06)
0.115 (2.93)
0.022 (0.558)
0.014 (0.356)
0.1574 (4.00)
0.1497 (3.80)
8-Lead Plastic DIP
(N-8)
0.430 (10.92)
0.348 (8.84)
8
14
PIN 1
0.100
(2.54)
BSC
5
0.280 (7.11)
0.240 (6.10)
0.060 (1.52)
0.015 (0.38)
0.070 (1.77)
0.045 (1.15)
0.130
(3.30)
MIN
SEATING
PLANE
0.325 (8.25)
0.300 (7.62)
0.015 (0.381)
0.008 (0.204)
8-Lead Narrow-Body Plastic DIP
(SO-8)
0.1968 (5.00)
0.1890 (4.80)
8
5
0.2440 (6.20)
41
0.2284 (5.80)
14-Lead Plastic DIP
(N-14)
C1805a–0–2/98
0.195 (4.95)
0.115 (2.93)
16-Lead Wide Body SOIC
(R-16)
PIN 1
0.0098 (0.25)
0.0040 (0.10)
0.0500
SEATING
PLANE
(1.27)
BSC
0.0688 (1.75)
0.0532 (1.35)
0.0192 (0.49)
0.0138 (0.35)
0.0098 (0.25)
0.0075 (0.19)
0.0196 (0.50)
0.0099 (0.25)
8°
0°
0.0500 (1.27)
0.0160 (0.41)
x 45°
–16–
PRINTED IN U.S.A.
REV. C
 Loading...