

Page 1
MC44603A
Enhanced Mixed Frequency
Mode GreenLinet PWM
Controller:
Fixed Frequency, Variable Frequency,
Standby Mode
The MC44603A is an enhanced high performance controller that is
specifically designed for off−line and dc−to−dc converter applications.
This device has the unique ability of automatically changing operating
modes if the converter output is overloaded, unloaded, or shorted,
offering the designer additional protection for increased system
reliability. The MC44603A has several distinguishing features when
compared to conventional SMPS controllers. These features consist of
a foldback facility for overload protection, a standby mode when the
converter output is slightly loaded, a demagnetization detection for
reduced switching stresses on transistor and diodes, and a high current
totem pole output ideally suited for driving a power MOSFET. It can
also be used for driving a bipolar transistor in low power converters
(< 150 W). It is optimized to operate in discontinuous mode but can
also operate in continuous mode. Its advanced design allows use in
current mode or voltage mode control applications.
Features
• Pb−Free Packages are Available*
Current or Voltage Mode Controller
• Operation up to 250 kHz Output Switching Frequency
• Inherent Feed Forward Compensation
• Latching PWM for Cycle−by−Cycle Current Limiting
• Oscillator with Precise Frequency Control
High Flexibility
• Externally Programmable Reference Current
• Secondary or Primary Sensing7
• Synchronization Facility
• High Current Totem Pole Output
• Undervoltage Lockout with Hysteresis
Safety/Protection Features
• Overvoltage Protection Against Open Current and Open Voltage Loop
• Protection Against Short Circuit on Oscillator Pin
• Fully Programmable Foldback
• Soft−Start Feature
• Accurate Maximum Duty Cycle Setting
• Demagnetization (Zero Current Detection) Protection
• Internally Trimmed Reference
• Enhanced Output Drive
GreenLine Controller: Low Power Consumption in Standby Mode
• Low Startup and Operating Current
• Fully Programmable Standby Mode
• Controlled Frequency Reduction in Standby Mode
• Low dV/dT for Low EMI Radiations
*For additional information on our Pb−Free strategy and soldering details, please download the ON Semiconductor Soldering and Mounting
Techniques Reference Manual, SOLDERRM/D.
16
1
16
Foldback Input
Protection (OVP)
Current Sense Input
Demag Detection
See detailed ordering and shipping information in the package
dimensions section on page 21 of this data sheet.
http://onsemi.com
16
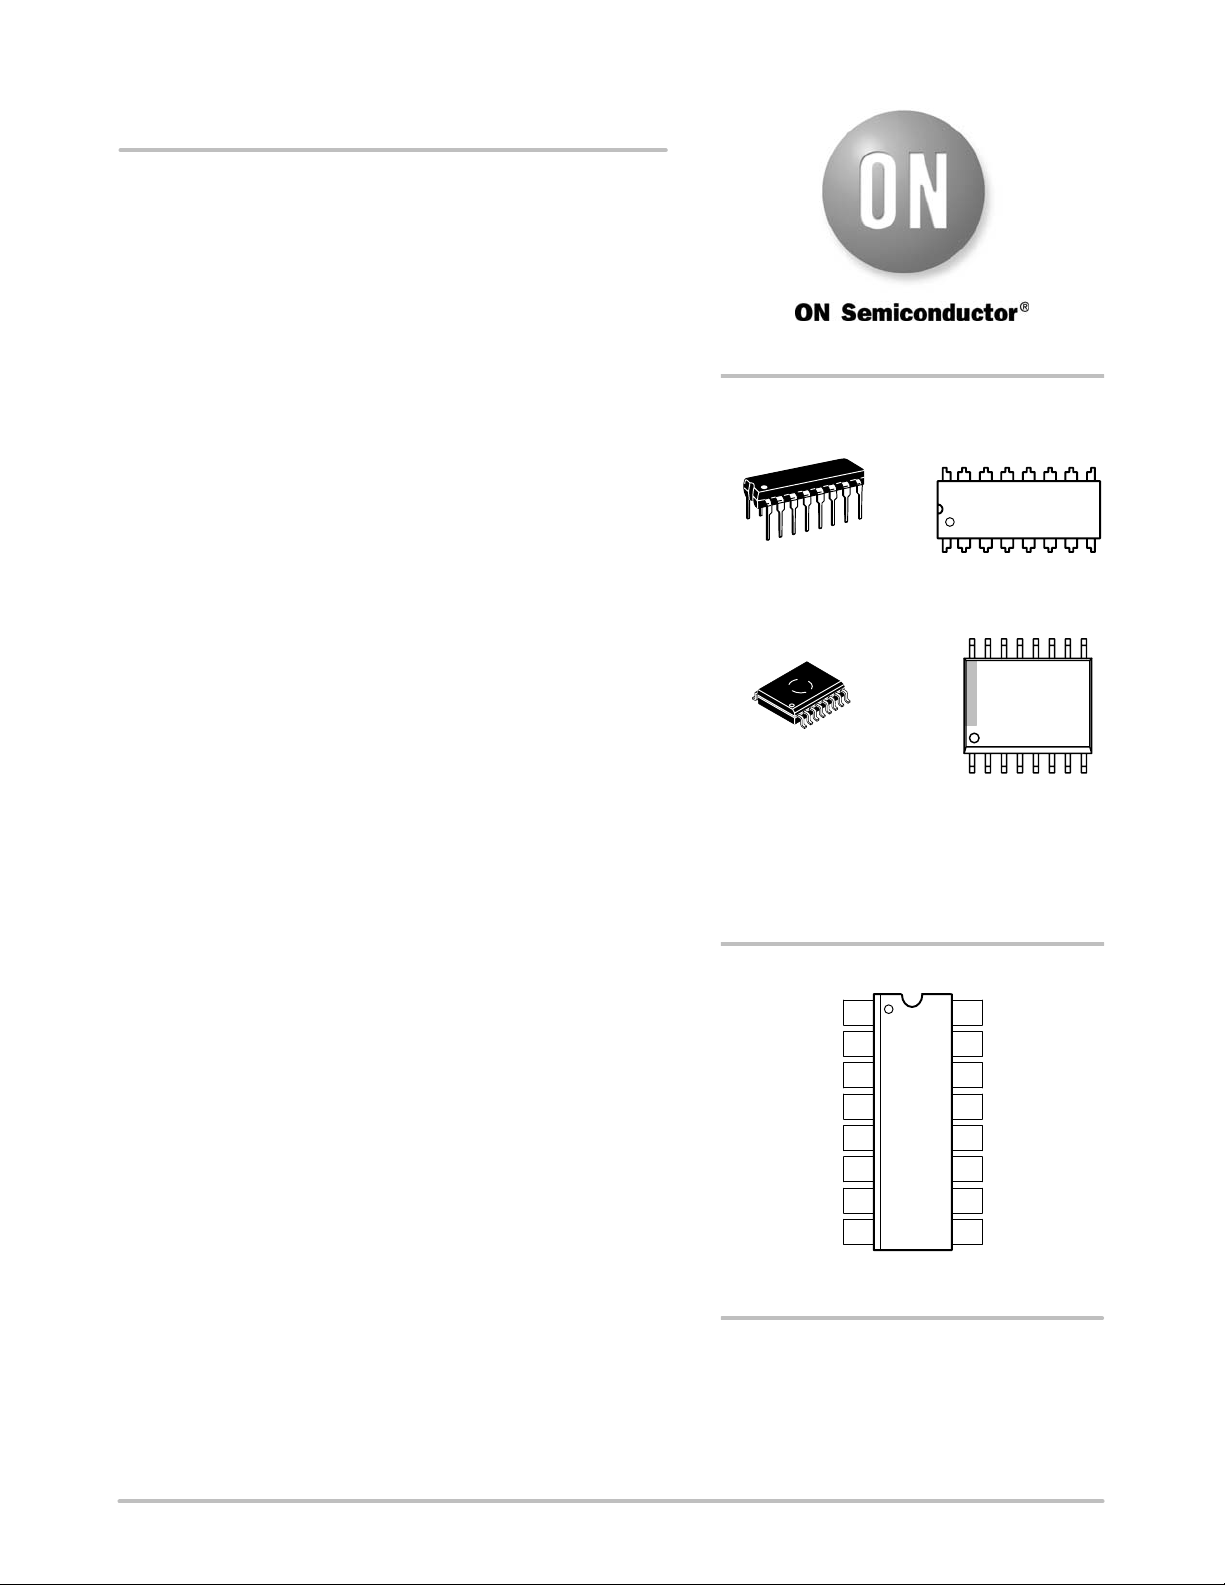
PDIP−16
P SUFFIX
CASE 648
SOIC−16
1
DW SUFFIX
CASE 751G
A = Assembly Location
WL = Wafer Lot
YY = Year
WW = Work Week
G = Pb−Free Package
1
16
1
PIN CONNECTIONS
1 16
V
CC
Output
GND
Overvoltage
2
V
C
3
4
5
6
7
8
(Top View)
15
14
13
12
11
10
9
ORDERING INFORMATION
MARKING
DIAGRAMS
MC44603AP
AWLYYWWG
MC44603ADW
AWLYYWWG
R
ref
R
Frequency
Standby
Voltage Feedback
Input
Error Amp Output
R
Power Standby
Soft−Start/D
Voltage Mode
C
Sync Input
max
T
/
© Semiconductor Components Industries, LLC, 2005
November, 2005 − Rev. 4
1 Publication Order Number:
MC44603A/D
Page 2

MC44603A
MAXIMUM RATINGS
Rating Symbol Value Unit
Total Power Supply and Zener Current (ICC + IZ) 30 mA
Supply Voltage with Respect to Ground (Pin 4) V
C
V
CC
Output Current (Note 1) mA
Source I
Sink I
O(Source)
O(Sink)
Output Energy (Capacitive Load per Cycle) W 5.0
R
, CT, Soft−Start, R
F Stby
Foldback Input, Current Sense Input,
, R
ref
Inputs V
P Stby
in
V
in
E/A Output, Voltage Feedback Input,
Overvoltage Protection, Synchronization Input
Synchronization Input
High State Voltage V
Low State Reverse Current V
IH
IL
Demagnetization Detection Input Current mA
Source I
Sink I
Error Amplifier Output Sink Current I
demag−ib (Source)
demag−ib (Sink)
E/A (Sink)
Power Dissipation and Thermal Characteristics
P Suffix, Dual−In−Line, Case 648
Maximum Power Dissipation at TA = 85°C P
Thermal Resistance, Junction−to−Air
D
R
JA
DW Suffix, Surface Mount, Case 751G
Maximum Power Dissipation at TA = 85°C P
Thermal Resistance, Junction−to−Air
Operating Junction Temperature T
Operating Ambient Temperature T
D
R
JA
J
A
Maximum ratings are those values beyond which device damage can occur. Maximum ratings applied to the device are individual stress limit
values (not normal operating conditions) and are not valid simultaneously. If these limits are exceeded, device functional operation is not implied,
damage may occur and reliability may be affected.
1. ESD data available upon request.
18 V
−750
750
−0.3 to 5.5 V
−0.3 to V
CC
+ 0.3
VCC + 0.3 V
−20 mA
−4.0
10
20 mA
0.6 W
100 °C/W
0.45 W
145 °C/W
150 °C
−25 to +85 °C
J
V
http://onsemi.com
2
Page 3
MC44603A
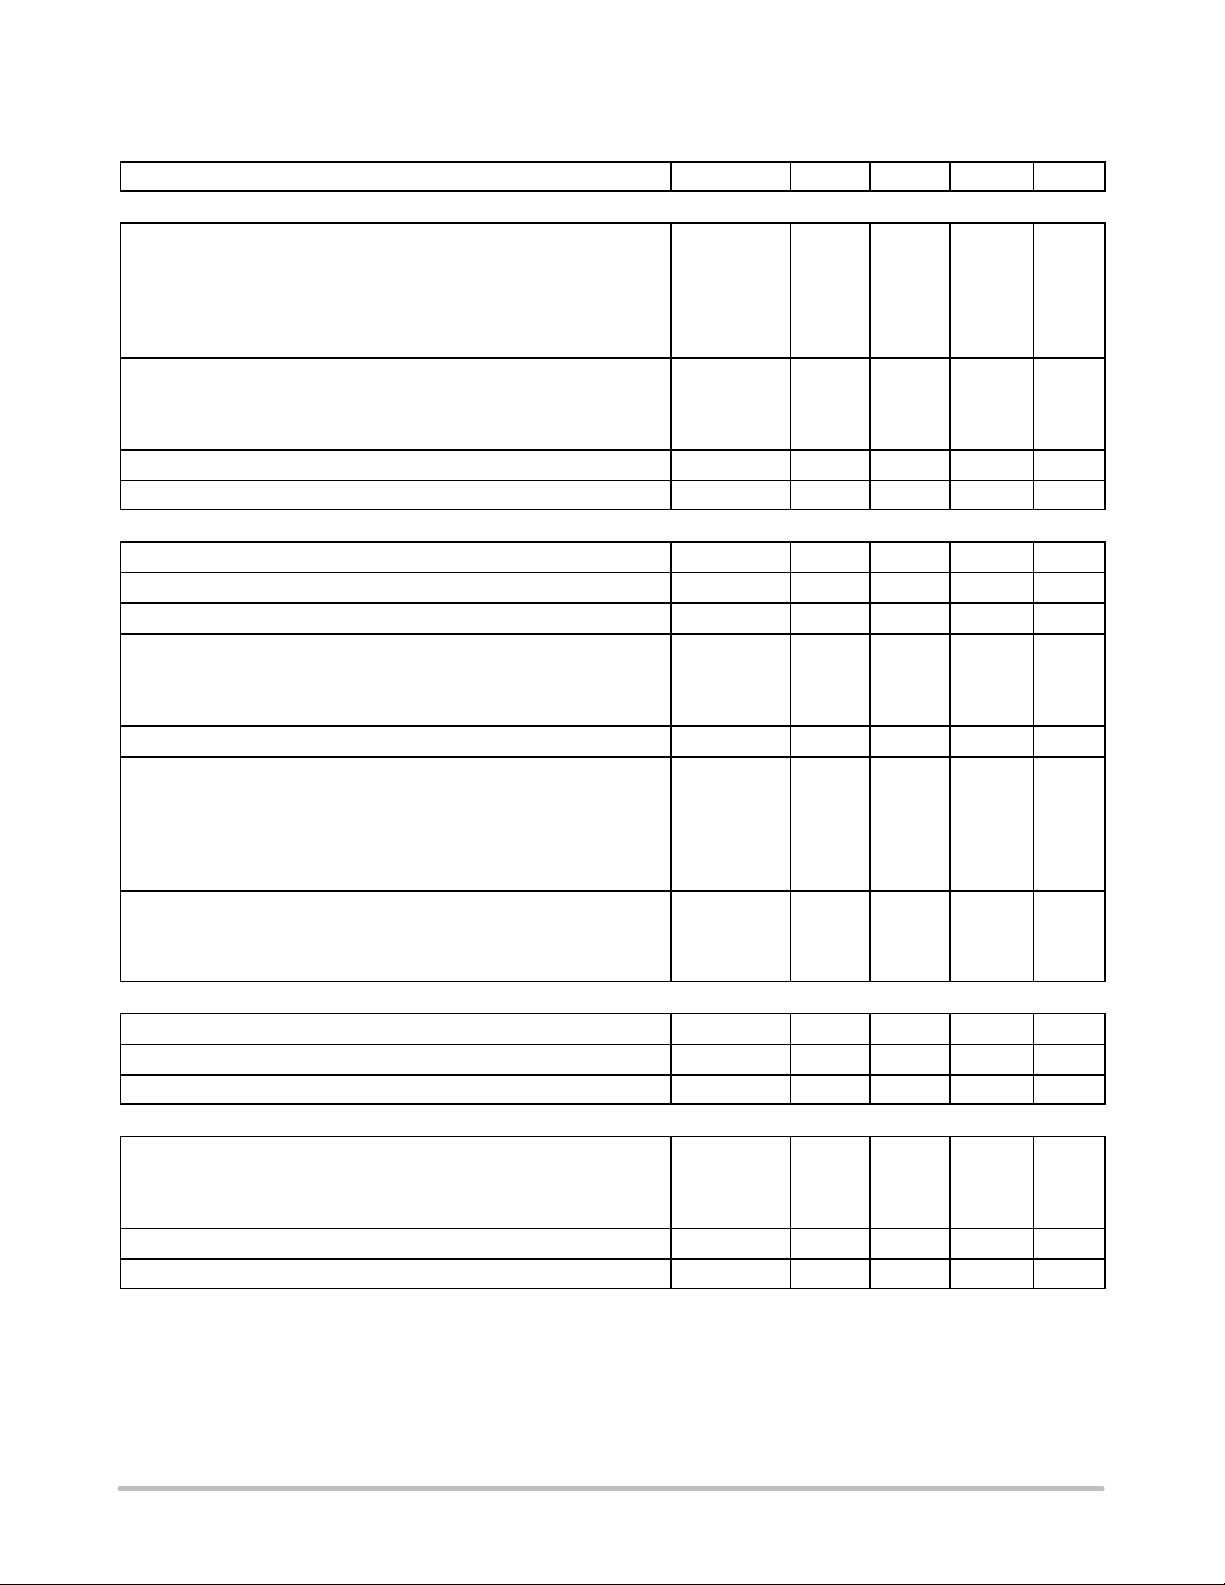
ELECTRICAL CHARACTERISTICS (V
and VC = 12 V, (Note 2), R
CC
= 10 k, CT = 820 pF, for typical values TA =
ref
25°C, for min/max values TA = −25° to +85°C (Note 3), unless otherwise noted.)
Characteristic Symbol Min Typ Max Unit
OUTPUT SECTION
Output Voltage (Note 4) V
Low State (I
Low State (I
High State (I
High State (I
Output Voltage During Initialization Phase
VCC = 0 to 1.0 V, I
VCC = 1.0 to 5.0 V, I
VCC = 5.0 to 13 V, I
Output Voltage Rising Edge Slew−Rate (CL = 1.0 nF, TJ = 25°C) dVo/dT − 300 −
Output Voltage Falling Edge Slew−Rate (CL = 1.0 nF, TJ = 25°C) dVo/dT − −300 −
= 100 mA)
Sink
= 500 mA)
Sink
Source
Source
= 200 mA)
= 500 mA)
= 10 A
Sink
= 100 A
Sink
= 1.0 mA
Sink
V
OL
V
OH
V
OL
−
−
−
−
−
−
−
1.0
1.4
1.5
2.0
0.1
0.1
1.2
2.0
2.0
2.7
−
1.0
1.0
1.0
V/s
V/s
ERROR AMPLIFIER SECTION
Voltage Feedback Input (V
Input Bias Current (VFB = 2.5 V) I
Open Loop Voltage Gain (V
= 2.5 V) V
E/A out
= 2.0 to 4.0 V) A
E/A out
FB
FB−ib
VOL
2.42 2.5 2.58 V
−2.0 −0.6 −
65 70 − dB
Unity Gain Bandwidth BW MHz
TJ = 25°C − 4.0 −
TJ = −25° to +85°C − − 5.5
Voltage Feedback Input Line Regulation (VCC = 10 to 15 V) V
FBline−reg
−10 − 10 mV
Output Current mA
Sink (V
= 1.5 V, VFB = 2.7 V)
E/A out
I
Sink
2.0 12 −
TA = −25° to +85°C
Source (V
= 5.0 V, VFB = 2.3 V)
E/A out
I
Source
−2.0 − −0.2
TA = −25° to +85°C
Output Voltage Swing V
High State (I
Low State (I
E/A out (source)
E/A out (sink)
= 0.5 mA, VFB = 2.3 V) V
= 0.33 mA, VFB = 2.7 V) V
OH
OL
5.5 6.5 7.5
− 1.0 1.1
REFERENCE SECTION
Reference Output Voltage (VCC = 10 to 15 V) V
Reference Current Range (I
Reference Voltage Over I
ref
Range
ref
= V
, R = 5.0 k to 25 k)
ref/Rref
V
ref
I
ref
ref
2.4 2.5 2.6 V
−500 − −100
−40 − 40 mV
OSCILLATOR AND SYNCHRONIZATION SECTION
Frequency f
OSC
TA = 0° to +70°C 44.5 48 51.5
TA = −25° to +85°C 44 − 52
Frequency Change with Voltage (VCC = 10 to 15 V)
Frequency Change with Temperature (TA = −25° to +85°C)
f
/V
OSC
f
/T
OSC
− 0.05 − %/V
− 0.05 − %/°C
2. Adjust VCC above the startup threshold before setting to 12 V.
3. Low duty cycle pulse techniques are used during test to maintain junction temperature as close to ambient as possible.
4. VC must be greater than 5.0 V.
5. Standby is disabled for V
6. If not used, Synchronization input must be connected to Ground.
7. Synchronization Pulse Width must be shorter than t
8. This function can be inhibited by connecting Pin 8 to GND. This allows a continuous current mode operation.
< 25 mV typical.
R P Stby
OSC
= 1/f
OSC
.
9. This function can be inhibited by connecting Pin 5 to VCC.
10.The MC44603A can be shut down by connecting the Soft−Start pin (Pin 11) to Ground.
V
A
A
kHz
http://onsemi.com
3
Page 4
MC44603A
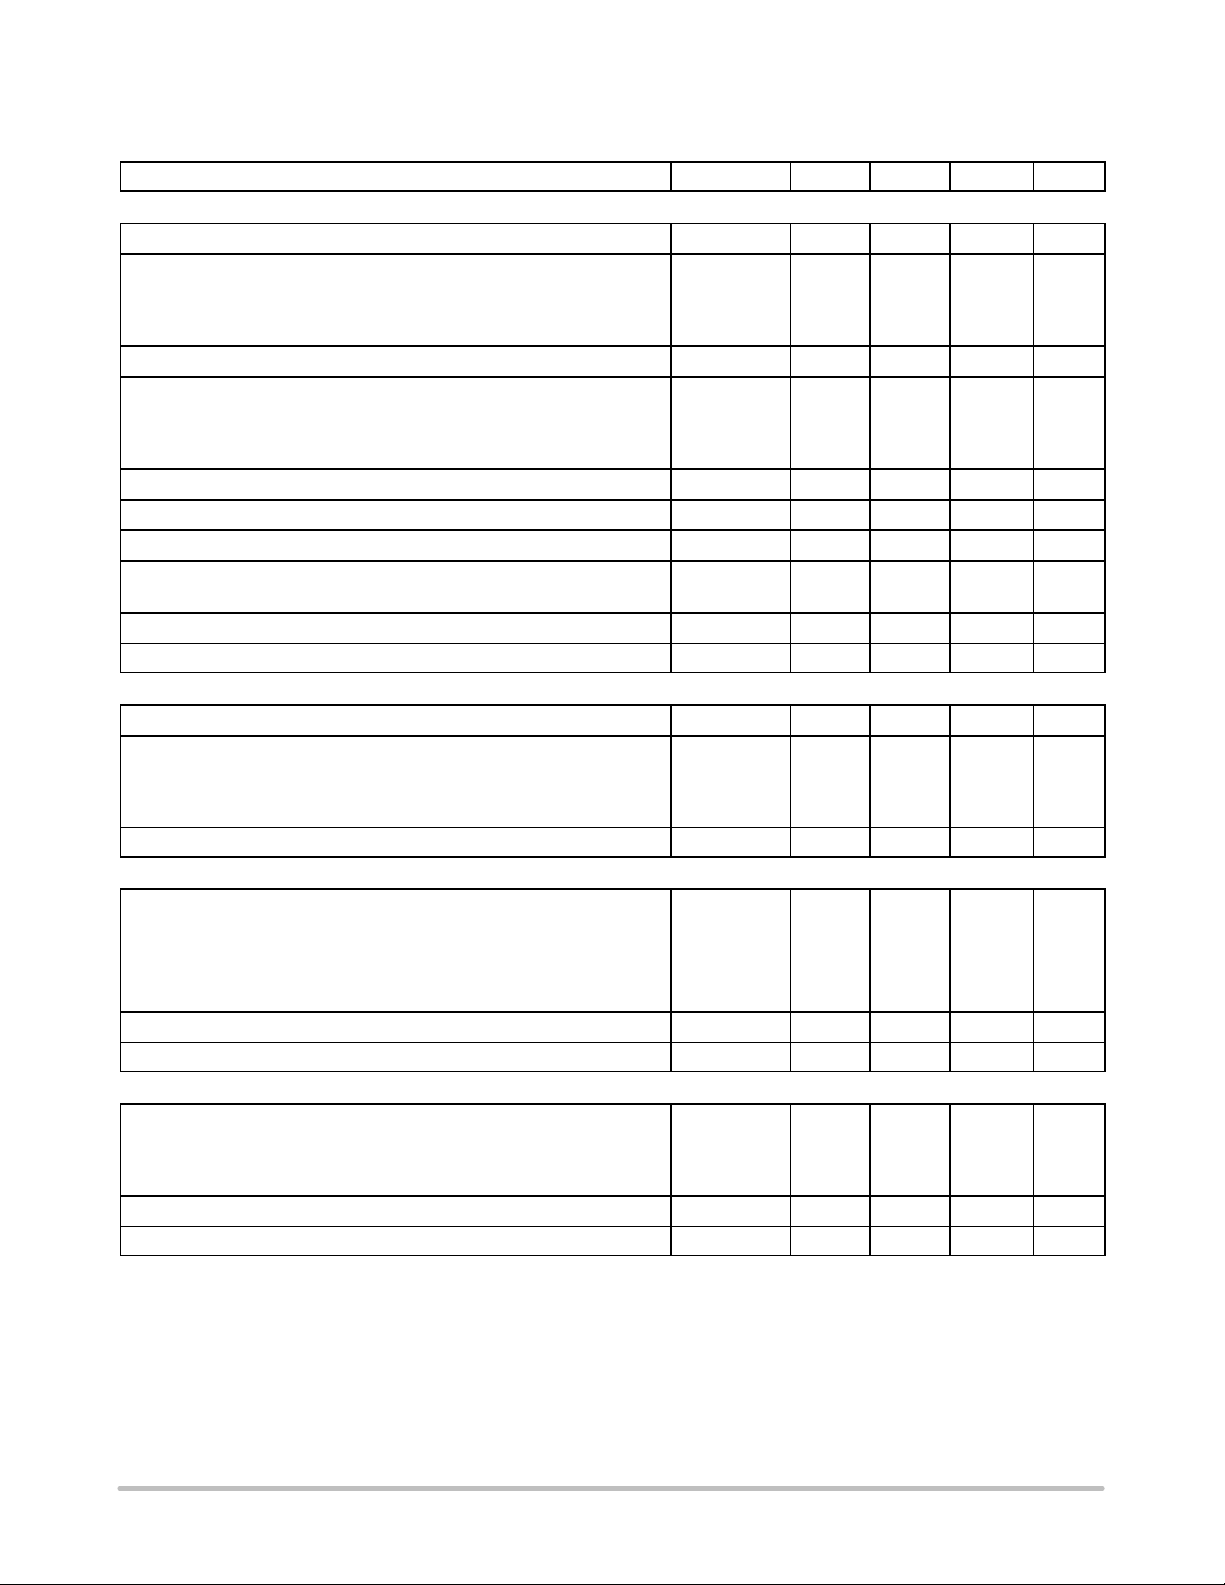
ELECTRICAL CHARACTERISTICS (continued) (V
and VC = 12 V, (Note 2), R
CC
= 10 k, CT = 820 pF, for typical values TA =
ref
25°C, for min/max values TA = −25° to +85°C (Note 3), unless otherwise noted.)
Characteristic UnitMaxTypMinSymbol
OSCILLATOR AND SYNCHRONIZATION SECTION
Oscillator Voltage Swing (Peak−to−Peak) V
Ratio Charge Current/Reference Current I
OSC(pp)
charge/Iref
1.65 1.8 1.95 V
TA = 0° to +70°C (VCT = 2.0 V) 0.375 0.4 0.425
TA = −25° to +85°C 0.37 − 0.43
Fixed Maximum Duty Cycle = I
Ratio Standby Discharge Current versus I
TA = 0° to +70°C I
discharge
/(I
discharge
R F Stby
+ I
) D 78 80 82 %
charge
(Note 5) I
disch−Stby
R F Stby
/ −
0.46 0.53 0.6
TA = −25° to +85°C (Note 8) 0.43 − 0.63
V
R F Stby
(I
R F Stby
= 100 A)
Frequency in Standby Mode (R
(Pin 15) = 25 k)
F Stby
V
Current Range I
Synchronization Input Threshold Voltage (Note 6) V
Synchronization Input Current I
Minimum Synchronization Pulse Width (Note 7) t
R F Stby
F
Stby
R F Stby
inthH
V
inthL
Sync−in
Sync
2.4 2.5 2.6 V
18 21 24 kHz
−200 − −50
3.2
0.45
3.7
0.7
4.3
0.9
−5.0 − 0
− − 0.5
UNDERVOLTAGE LOCKOUT SECTION
Startup Threshold V
Output Disable Voltage After Threshold Turn−On (UVLO 1) V
stup−th
disable1
13.6 14.5 15.4 V
TA = 0° to +70°C 8.6 9.0 9.4
TA = −25° to +85°C 8.3 − 9.6
Reference Disable Voltage After Threshold Turn−On (UVLO 2) V
disable2
7.0 7.5 8.0 V
DEMAGNETIZATION DETECTION SECTION (Note 8)
Demagnetization Detect Input
Demagnetization Comparator Threshold (V
Decreasing) V
Pin 9
demag−th
50 65 80 mV
Propagation Delay (Input to Output, Low to High) − − 0.25 −
Input Bias Current (V
Negative Clamp Level (I
Positive Clamp Level (I
= 65 mV) I
demag
= −2.0 mA) C
demag
= 2.0 mA) C
demag
demag−lb
L(neg)
L(pos)
−0.5 − −
− −0.38 − V
− 0.72 − V
SOFT−START SECTION (Note 10)
Ratio Charge Current/I
ref
I
ss(ch)/Iref
TA = 0° to +70°C 0.37 0.4 0.43
TA = −25° to +85°C 0.36 − 0.44
Discharge Current (V
Clamp Level V
= 1.0 V) I
soft−start
discharge
ss(CL)
1.5 5.0 − mA
2.2 2.4 2.6 V
2. Adjust VCC above the startup threshold before setting to 12 V.
3. Low duty cycle pulse techniques are used during test to maintain junction temperature as close to ambient as possible.
4. VC must be greater than 5.0 V.
5. Standby is disabled for V
6. If not used, Synchronization input must be connected to Ground.
7. Synchronization Pulse Width must be shorter than t
8. This function can be inhibited by connecting Pin 8 to GND. This allows a continuous current mode operation.
< 25 mV typical.
R P Stby
OSC
= 1/f
OSC
.
9. This function can be inhibited by connecting Pin 5 to VCC.
10.The MC44603A can be shut down by connecting the Soft−Start pin (Pin 11) to Ground.
−
A
V
A
s
V
s
A
−
http://onsemi.com
4
Page 5

MC44603A
ELECTRICAL CHARACTERISTICS (continued) (V
and VC = 12 V, (Note 2), R
CC
= 10 k, CT = 820 pF, for typical values TA =
ref
25°C, for min/max values TA = −25° to +85°C (Note 3), unless otherwise noted.)
Characteristic UnitMaxTypMinSymbol
SOFT−START SECTION (Note 10)
Duty Cycle (R
Duty Cycle (V
= 12 k)
soft−start
soft−start (Pin 11)
= 0.1 V)
D
soft−start 12k
D
soft−start
36
−
−
42
49
0
OVERVOLTAGE SECTION
Protection Threshold Level on V
Propagation Delay (V
Protection Level on V
> 2.58 V to V
OVP
CC
OVP
Low) 1.0 − 3.0
out
V
OVP−th
V
CC prot
2.42 2.5 2.58 V
TA = 0° to +70°C 16.1 17 17.9
TA = −25° to +85°C 15.9 − 18.1
Input Resistance −
TA = 0° to +70°C 1.5 2.0 3.0
TA = −25° to +85°C 1.4 − 3.4
FOLDBACK SECTION (Note 9)
Current Sense Voltage Threshold (V
Foldback Input Bias Current (V
foldback (Pin 5)
foldback (Pin 5)
= 0.9 V) V
= 0 V) I
CS−th
foldback−lb
0.86 0.89 0.9 V
−6.0 −2.0 −
STANDBY SECTION
Ratio I
R P Stby/Iref
I
R P Stby/Iref
TA = 0° to +70°C 0.37 0.4 0.43
TA = −25° to +85°C 0.36 − 0.44
Ratio Hysteresis (Vh Required to Return to Normal Operation from
Vh/V
R P Stby
Standby Operation)
TA = 0° to +70°C 1.42 1.5 1.58
TA = −25° to +85°C 1.4 − 1.6
Current Sense Voltage Threshold (V
R P Stby (Pin 12)
= 1.0 V) V
CS−Stby
0.28 0.31 0.34 V
CURRENT SENSE SECTION
Maximum Current Sense Input Threshold
(V
feedback (Pin 14)
= 2.3 V and V
foldback (Pin 6)
= 1.2 V)
Input Bias Current I
Propagation Delay (Current Sense Input to Output at VTH of
V
CS−ib
CS−th
0.96 1.0 1.04 V
−10 −2.0 −
− − 120 200 ns
MOS transistor = 3.0 V)
TOTAL DEVICE
Power Supply Current I
CC
Startup (VCC = 13 V with VCC Increasing) − 0.3 0.45
Operating TA = −25° to +85°C (Note 2) 13 17 20
Power Supply Zener Voltage (ICC = 25 mA) V
Z
18.5 − − V
Thermal Shutdown − − 155 − °C
2. Adjust VCC above the startup threshold before setting to 12 V.
3. Low duty cycle pulse techniques are used during test to maintain junction temperature as close to ambient as possible.
4. VC must be greater than 5.0 V.
5. Standby is disabled for V
6. If not used, Synchronization input must be connected to Ground.
7. Synchronization Pulse Width must be shorter than t
8. This function can be inhibited by connecting Pin 8 to GND. This allows a continuous current mode operation.
< 25 mV typical.
R P Stby
OSC
= 1/f
OSC
.
9. This function can be inhibited by connecting Pin 5 to VCC.
10.The MC44603A can be shut down by connecting the Soft−Start pin (Pin 11) to Ground.
%
s
V
k
A
−
−
A
mA
http://onsemi.com
5
Page 6
MC44603A
Demag
Detect
Sync
Input
C
R
Pwr Stby
Feed−
back
Compensation
Foldback
Input
8
9
Negative
0.4 I
Active
Clamp
V
ref
+
65 mV
ref
3.7 V
Q
+
0.7 V
R
F Stby
R
15 16
F Stby
R
S
V
Demag Out
Synchro
+
V
OSC prot
Reference
V
refIref
Block
R
ref
V
ref
UVLO2
V
CC
V
1
+
V
CC
18.0 V
aux
14.5 V/7.5 V
To Power
I
F Stby
Transformer
1.0 V
R
0.8 I
2R
S
V
ref
I
Discharge/2
R
Q
I
refVref
1.0 V
Discharge
0.25
IF
Stby
Current Mirror X2
V
OSC
S
Q
R
Thermal
Shutdown
V
ref
0.2 I
ref
0.4 I
V
ref
ref
2.0 s
Delay
V
ref
5.0 s
V
Out
V
OVP
ref
11.6 k
Delay
2.0 k
+
+
1.6 V
2.5 V
UVLO1
V
2.4 V
5.0 mA
+
CC
9.0 V
1.6 V
C
T
10
T
0.4 I
ref
+
3.6 V
0.4 I
V
refVref
ref
0.6 I
R
Q
S
ref
12
V
CC
1.0 mA
14
+
2.5 V
Error Amplifier
13
5
V
C
2
Output
3
4
GND
V
CC
OVP
6
R
OVP
Current
Sense Input
7
= Sink only
= Positive True Logic
SS/D
11
R
SS
/VM
max
C
SS
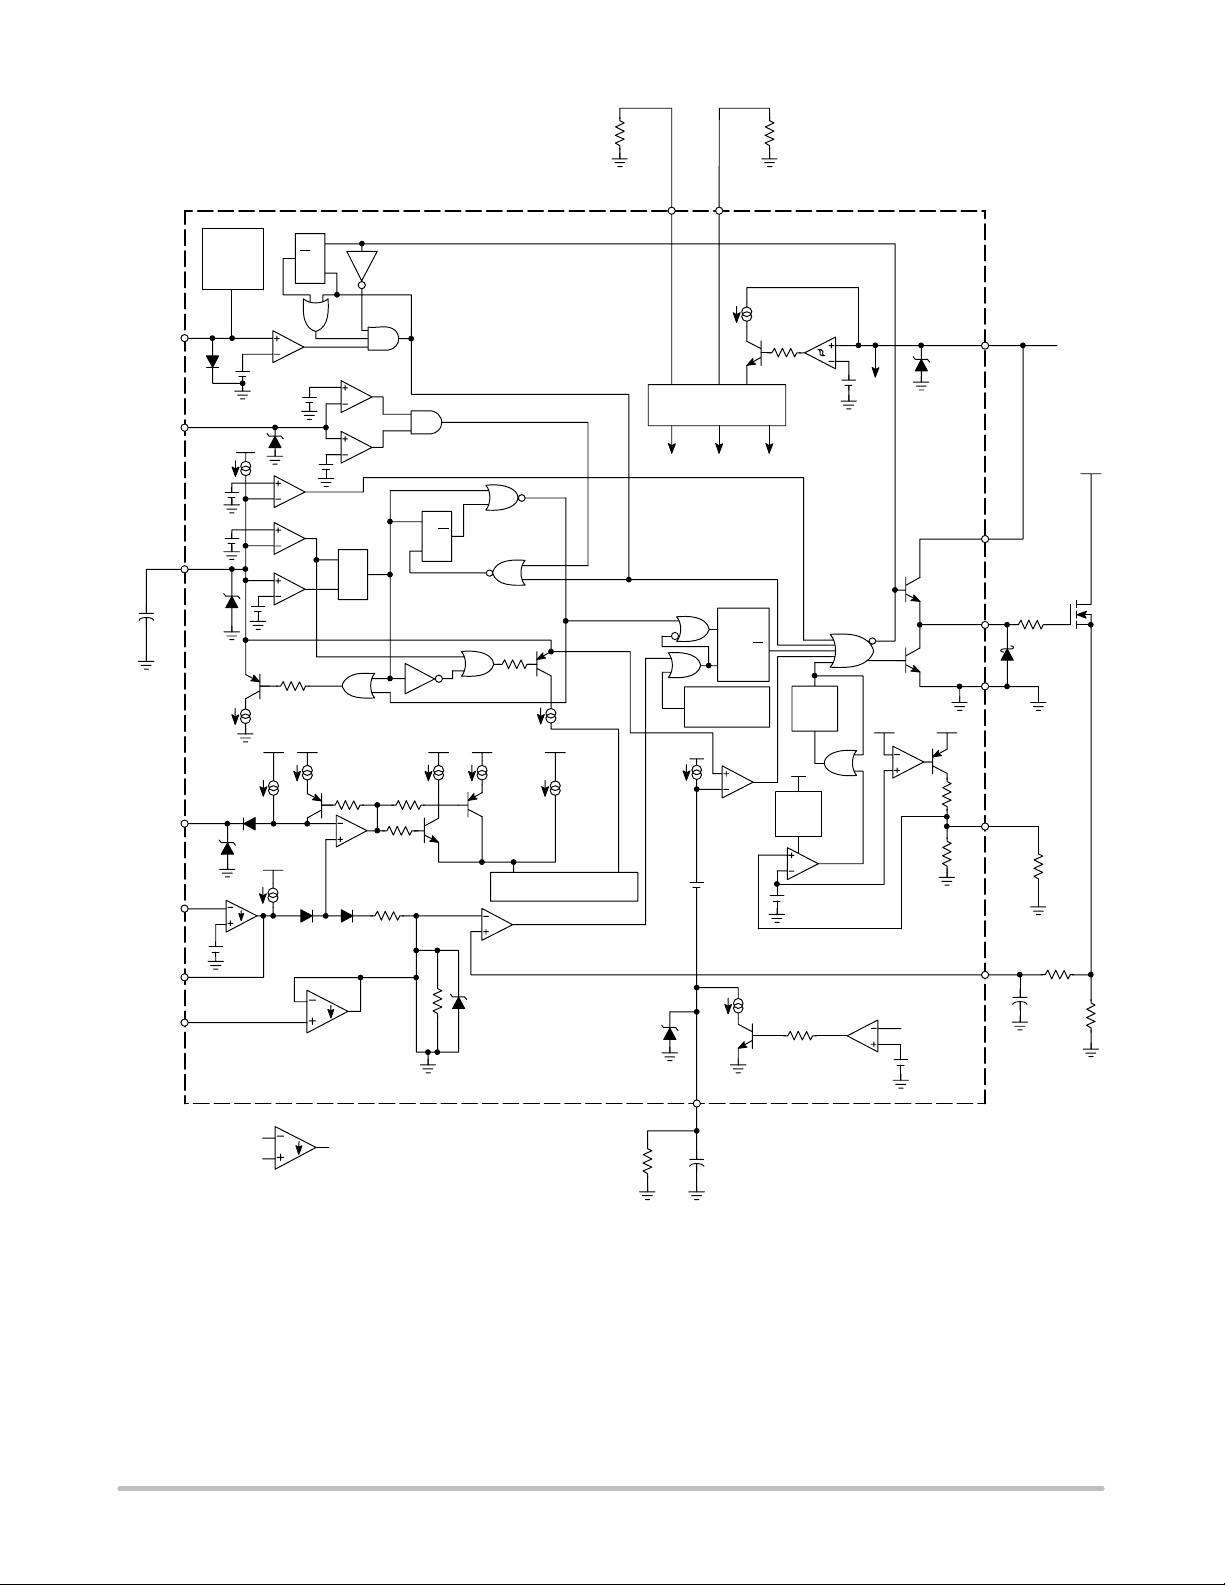
This device contains 243 active transistors.
Figure 1. Representative Block Diagram
http://onsemi.com
6
Page 7
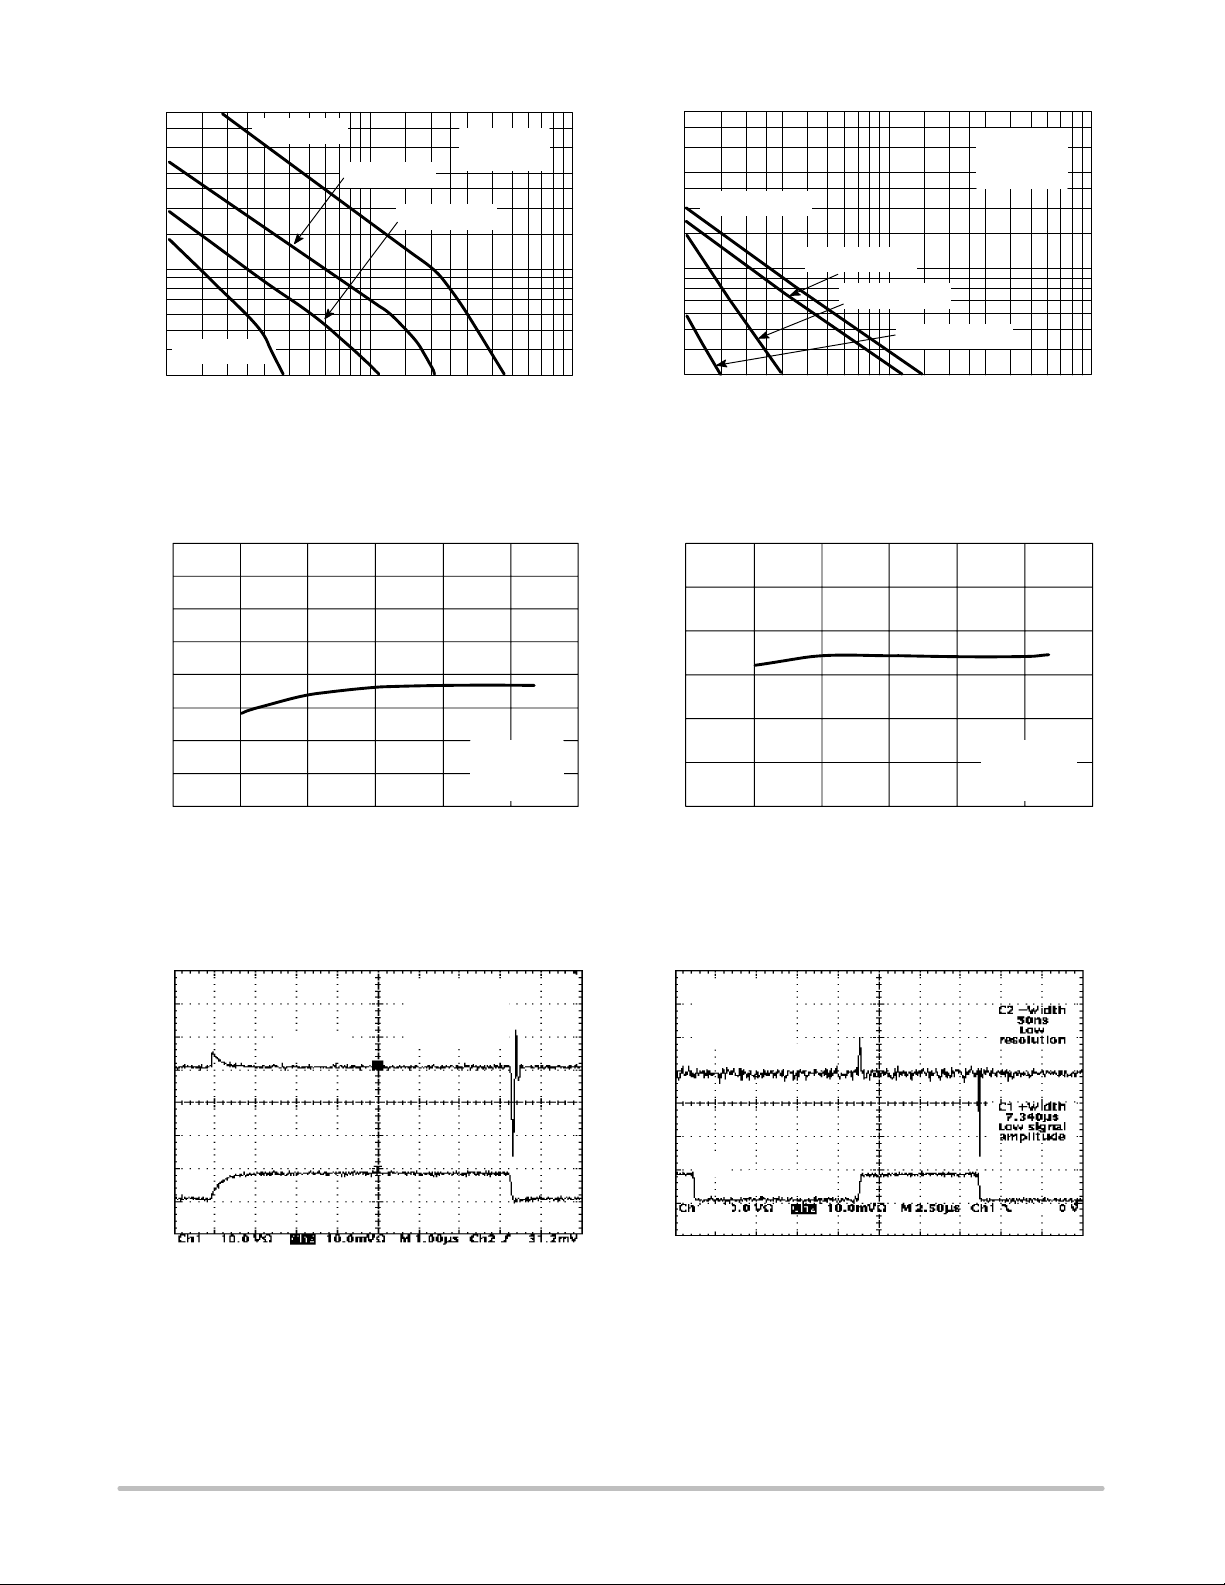
MC44603A
0
0
2
3
4
5
0
, TIMING RESISTANCE (k )Ω
R
100
ref
CT = 2200 pF
10 k
52
51
50
49
48
CT = 100 pF
VCC = 16 V
TA = 25°C
CT = 500 pF
CT = 1000 pF
f
, Oscillator Frequency (Hz)
OSC
Figure 2. Timing Resistor versus
Oscillator Frequency
10000
100010
, TIMING CAPACITOR (pF)
T
C
3003.0
0.43
0.42
0.41
0.40
R
= 2.0 k
F Stby
R
= 5.0 k
F Stby
R
= 27 k
F Stby
R
= 100 k
F Stby
10 k
f
OSC
100 k100 k 1.0 M1.0 M
, Oscillator Frequency (Hz)
Figure 3. Standby Mode Timing Capacitor
versus Oscillator Frequency
VCC = 16 V
TA = 25°C
R
= 10 k
ref
47
, OSCILLATOR FREQUENCY (kHz)
OSC
f
46
45
44
VCC = 12 V
R
= 10 k
ref
CT = 820 pF
−50 −25 0 25 50 75 100
TA, AMBIENT TEMPERATURE (°C)
Figure 4. Oscillator Frequency
versus Temperature
600
400
200
Current
VCC = 12 V
CL = 2200 pF
TA = 25°C
0
−200
−400
, OUTPUT CURRENT (mA)
−600
O
I
Voltage
−800
−1000
Figure 6. Output Waveform Figure 7. Output Cross Conduction
0.39
= RATIO CHARGE CURRENT/I
REFERENCE CURRENT
ref
/I
0.38
charge
0.37
, OUTPUT DRIVE VOLTAGE (V)
O
V
−10
70
60
50
40
30
20
10
, OUTPUT DRIVE VOLTAGE (V)
O
V
0
70
60
50
40
30
20
10
0
−10
VCC = 12 V
R
= 10 k
ref
CT = 820 pF
−50 −25 0 25 50 75 100
TA, AMBIENT TEMPERATURE (°C)
Figure 5. Ratio Charge Current/Reference
Current versus Temperature
VCC = 12 V
CL = 2200 pF
TA = 25°C
Current
V
O
Voltage
I
CC
1.0 s/Div1.0 s/Div
3
2
1
0
−1
−
−
−
−
http://onsemi.com
7
Page 8
MC44603A
500
475
450
425
400
375
350
, DISCHARGE CURRENT (μA)
325
disch
I
300
−50 −25 0 25 50 75 100
VCC = 12 V
R
= 10 k
ref
CT = 820 pF
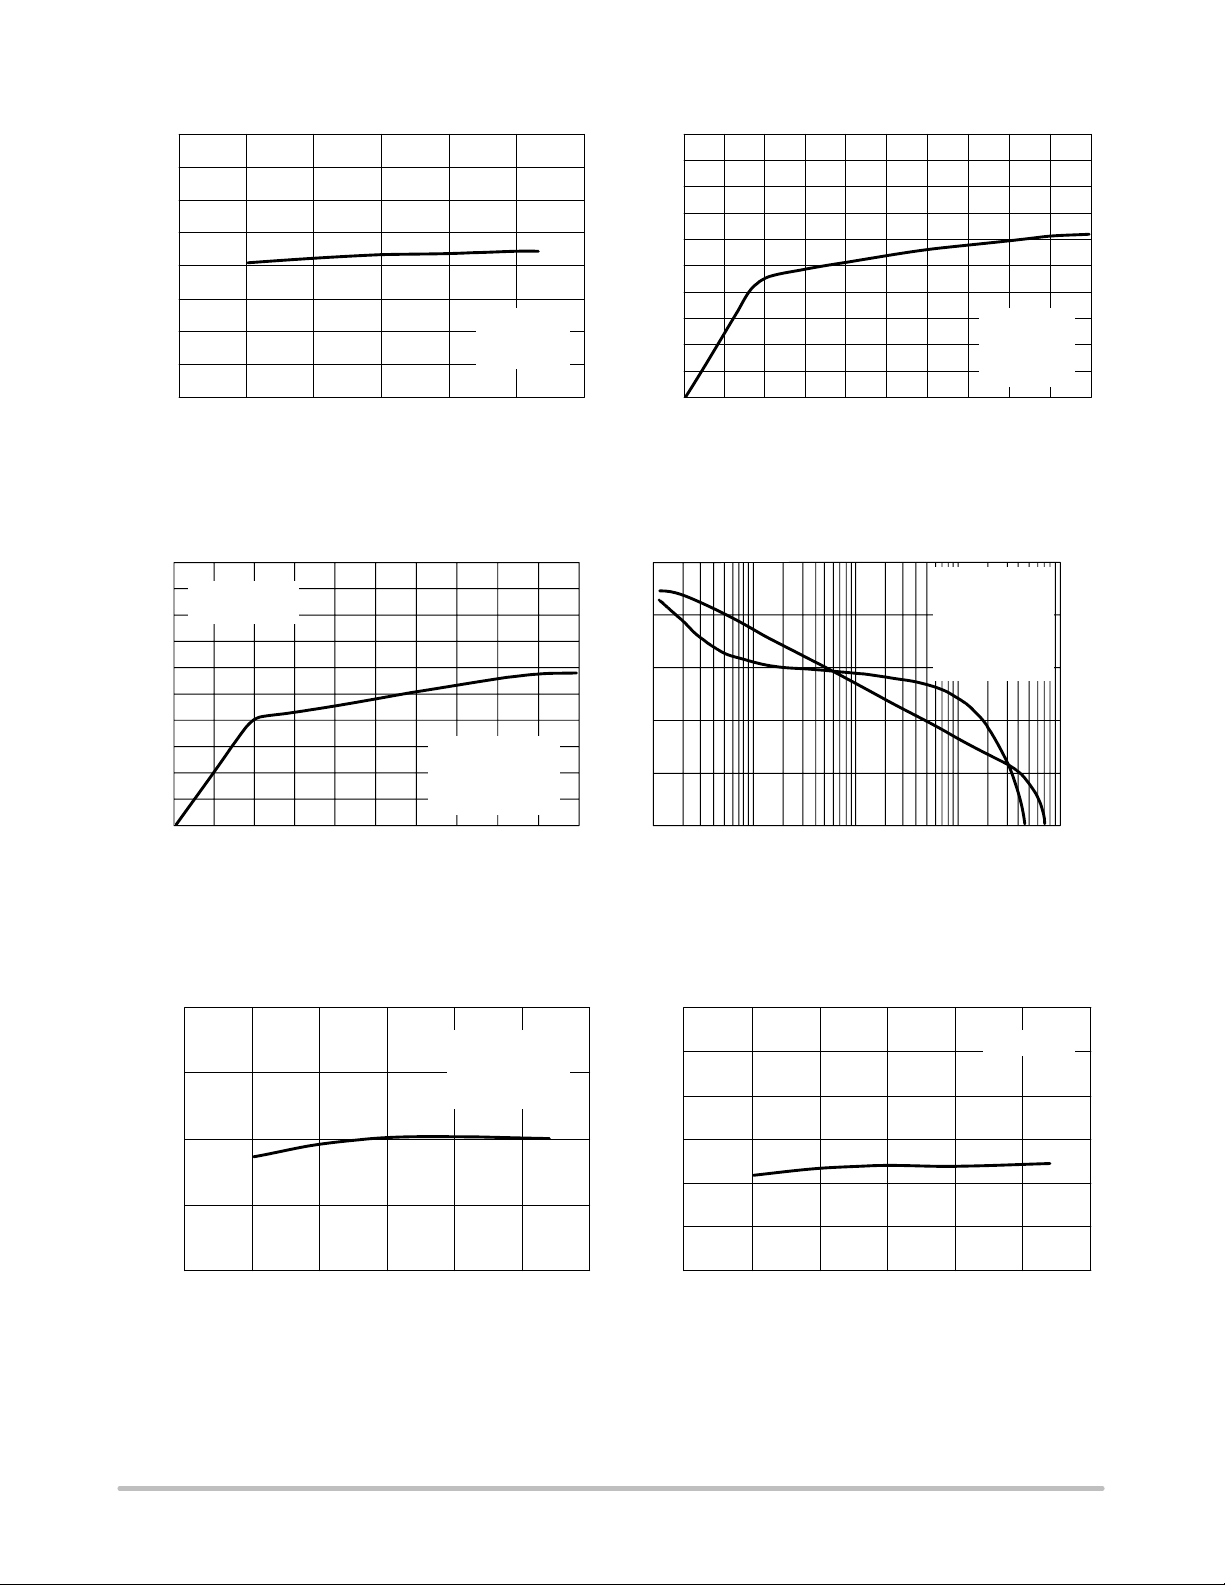
Figure 8. Oscillator Discharge Current
versus Temperature
Sink Saturation
(Load to VCC)
1.6
1.2
2.5
2.0
1.5
1.0
, SOURCE OUTPUT SATURATION VOLTAGE (V)
OH
0 100 200 300 400 500
V
I
, OUTPUT SOURCE CURRENT (mA)TA, AMBIENT TEMPERATURE (°C)
source
Figure 9. Source Output Saturation Voltage
versus Load Current
802.0
60
40
VCC = 12 V
G = 10
Vin = 30 mV
VO = 2.0 to 4.0 V
RL = 100 k
TA = 25°C
VCC = 12 V
R
= 10 k
ref
CT = 820 pF
TA = 25°C
140
0.8
TA = 25°C
0.4
, SINK OUTPUT SATURATION VOLTAGE (V)
0
OL
V
0 100
200 300 400 500
I
, SINK OUTPUT CURRENT (mA)
sink
VCC = 12 V
80 s Pulsed Load
120 Hz Rate
Figure 10. Sink Output Saturation Voltage
versus Sink Current
2.60
VCC = 12 V
2.55
2.50
2.45
, VOLTAGE FEEDBACK INPUT (V)
FB
V
2.40
−50 −25 0 25 50 75 100
TA, AMBIENT TEMPERATURE (°C)
G = 10
VO = 2.0 to 4.0 V
RL = 100 k
Figure 12. Voltage Feedback Input
versus Temperature
GAIN (dB)
20
0
−20
01234
1010 10 10
f, FREQUENCY (kHz)
10
Figure 11. Error Amplifier Gain and Phase
versus Frequency
80
75
70
65
60
55
, DEMAG COMPARATOR THRESHOLD (mV)
50
−50 −25 0 25 50 75 100
demag−th
V
TA, AMBIENT TEMPERATURE (°C)
VCC = 12 V
Figure 13. Demag Comparator Threshold
versus Temperature
50
PHASE (DEGREES)
−40
http://onsemi.com
8
Page 9
3.2
MC44603A
°
100
Printed circuit board heatsink example
5.0
3.1
3.0
, CURRENT SENSE GAIN
2.9
VCS
A
VCC = 12 V
R
= 10 k
ref
CT = 820 pF
2.8
−50 −25 0 25 50 75 100
TA, AMBIENT TEMPERATURE (°C)
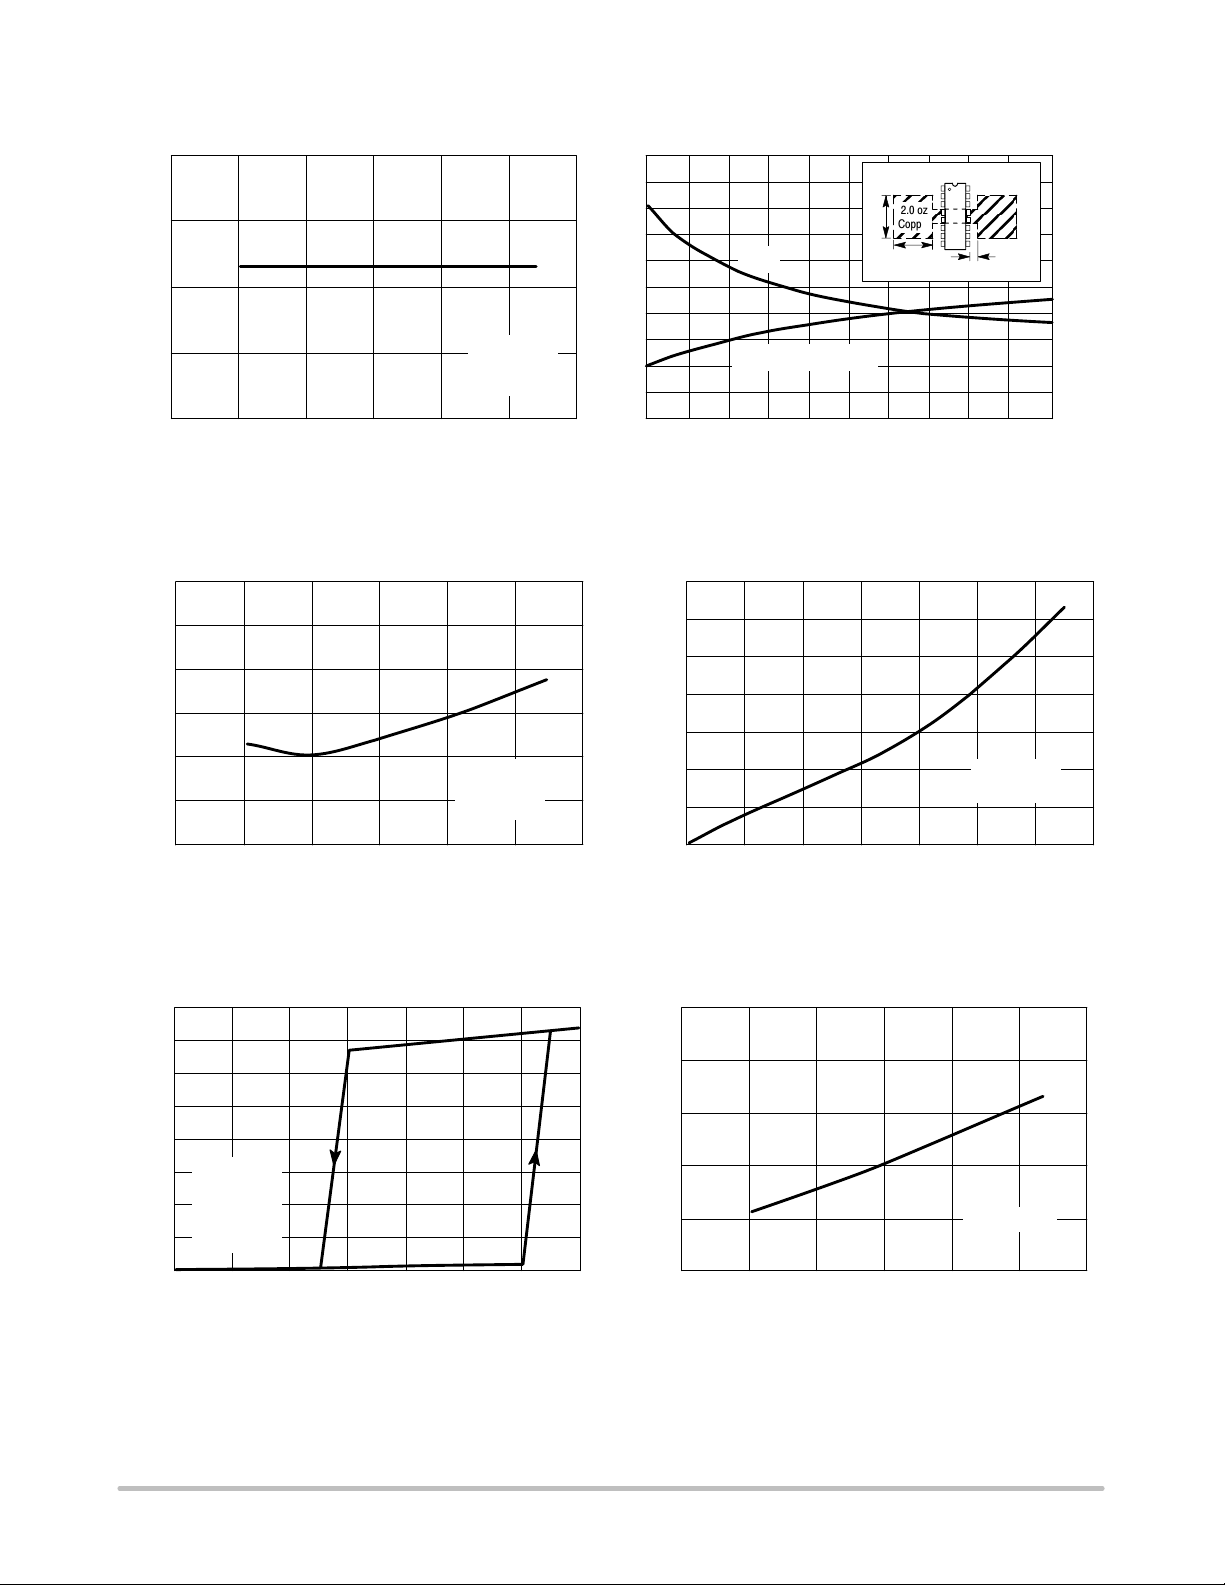
Figure 14. Current Sense Gain
versus Temperature
140
120
100
PROPAGATION DELAY (ns)
VCC = 12 V
R
= 10 k
ref
CT = 820 pF
80
60
R
JA
2.0 oz
L
Copper
L
Graphs represent symmetrical layout
40
P
for TA = 70°C
20
0
, THERMAL RESISTANCE JUNCTION−TO−AIR ( C/W)
0
JA
θ
R
D(max)
10 20 30 40 50
L, LENGTH OF COPPER (mm)
Figure 15. Thermal Resistance and Maximum
Power Dissipation versus P.C.B. Copper Length
0.35
0.30
0.25
0.20
0.15
0.10
STARTUP CURRENT (mA)
0.05
3.0 mm
R
= 10 k
ref
CT = 820 pF
4.0
3.0
2.0
1.0
0
, MAXIMUM POWER DISSIPATION (W)
D
P
80
−50 −25 0 25 50 75 100
TA, AMBIENT TEMPERATURE (°C)
Figure 16. Propagation Delay Current Sense
Input to Output versus Temperature
16
14
12
10
8.0
TA = 25°C
6.0
R
= 10 k
, SUPPLY CURRENT (mA)
CC
I
4.0
2.0
ref
CT = 820 pF
VFB = 0 V
VCS = 0 V
0
2.0 4.0 6.0 8.0 10 12 14 16
VCC, SUPPLY VOLTAGE (V)
Figure 18. Supply Current versus
Supply Voltage
0
4.00 2.0 6.0
8.0 10 12 14
VCC, SUPPLY VOLTAGE (V)
Figure 17. Startup Current versus V
21.5
21.0
20.5
20.0
, ZENER VOLTAGE (V)
Z
V
19.5
ICC = 25 mA
19.0
−50 −25 0 25 50 75 100
TA, AMBIENT TEMPERATURE (°C)
Figure 19. Power Supply Zener Voltage
versus Temperature
CC
http://onsemi.com
9
Page 10
MC44603A
OVP
)
out
15.5
15.0
14.5
VCC Increasing VCC Decreasing
14.0
, STARTUP THRESHOLD VOLTAGE (V)
stup−th
13.5
V
−50 −25 0 25 50 75 100
TA, AMBIENT TEMPERATURE (°C)
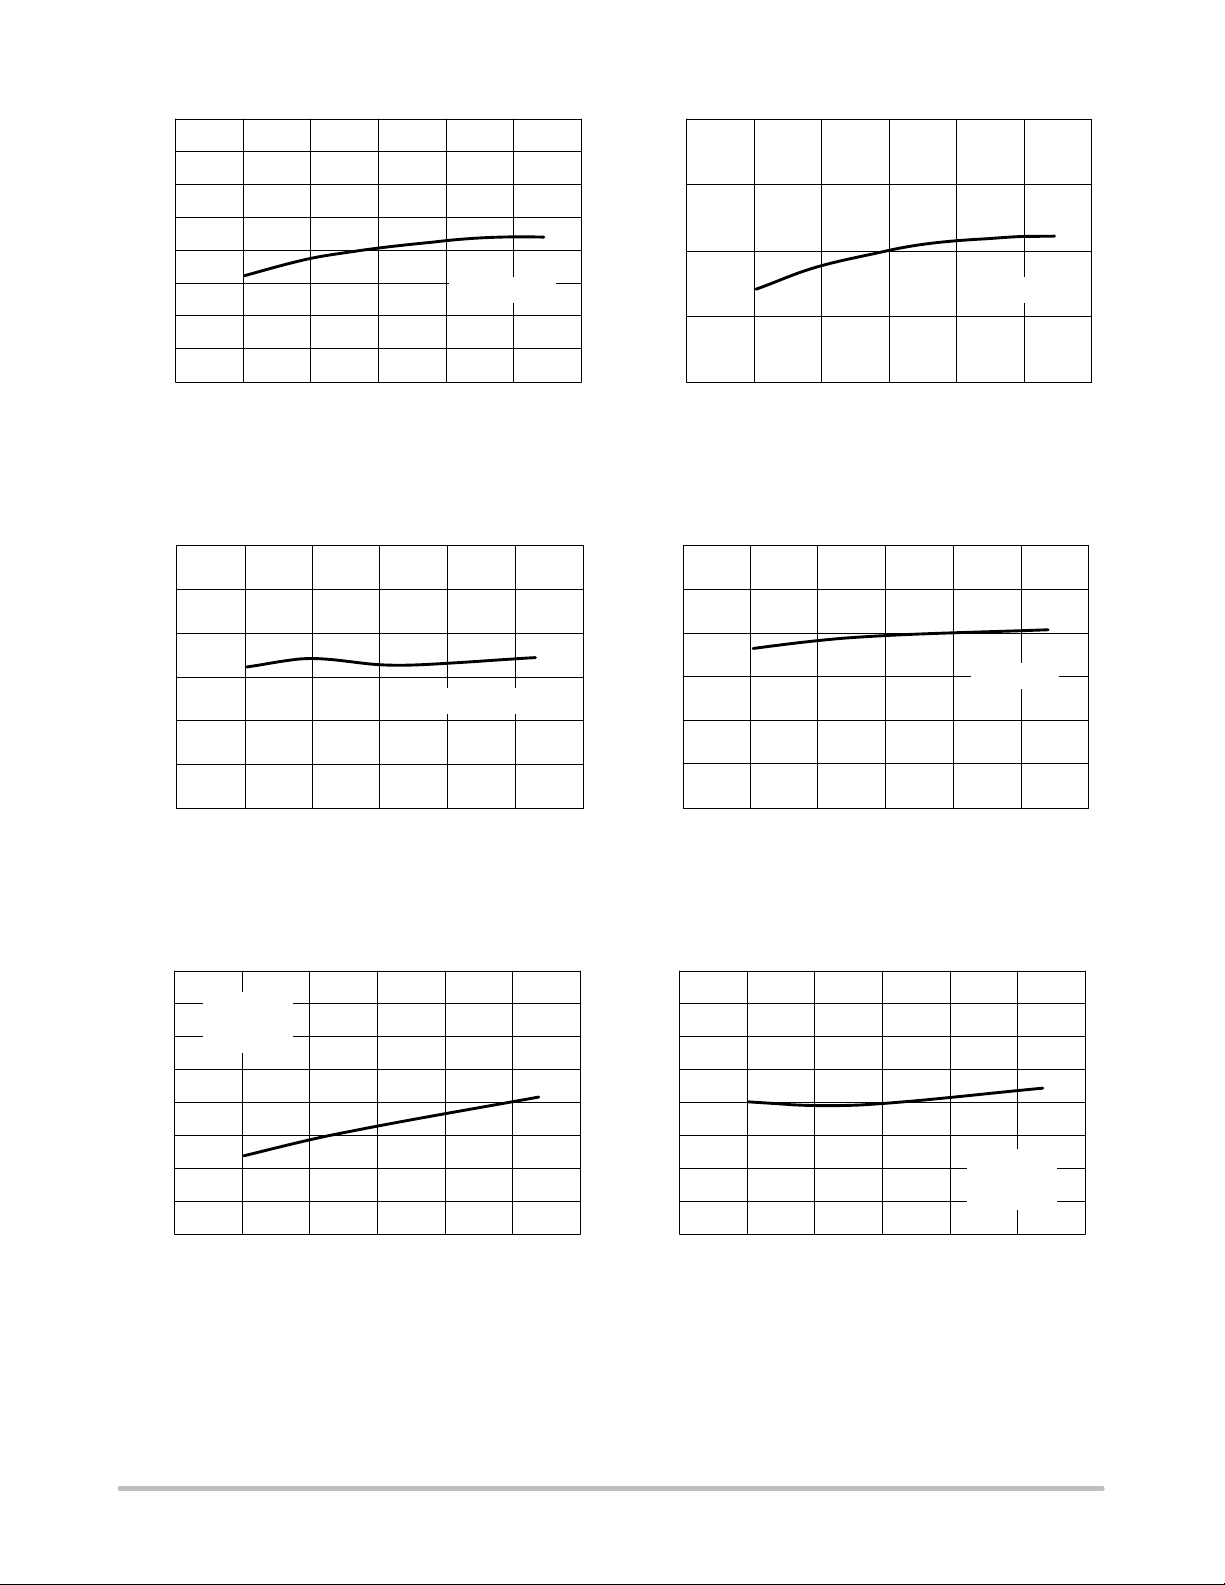
Figure 20. Startup Threshold Voltage
versus Temperature
7.8
7.6
, UVLO2 (V)
7.4
VCC Decreasing
7.2
disable2
V
7.0
6.8
−50 −25 0 25 50 75 100
TA, AMBIENT TEMPERATURE (°C)
Figure 22. Disable Voltage After Threshold
Turn−On (UVLO2) versus Temperature
9.50
9.25
, UVLO1 (V)
9.00
disable1
V
8.55
8.50
−50 −25 0 25 50 75 100
TA, AMBIENT TEMPERATURE (°C)
Figure 21. Disable Voltage After Threshold
Turn−On (UVLO1) versus Temperature
2.608.0
2.55
2.50
2.45
2.40
2.35
, PROTECTION THRESHOLD LEVEL (V
2.30
OVP−th
−50 −25 0 25 50 75 100
V
TA, AMBIENT TEMPERATURE (°C)
VCC = 12 V
Figure 23. Protection Threshold Level on
V
versus Temperature
18
R
= 10 k
ref
CT = 820 pF
Pin 6 Open
17
, PROTECTION LEVEL (V)
16.5
CC prot
V
16
−50 −25 0 25 50 75 100
TA, AMBIENT TEMPERATURE (°C)
Figure 24. Protection Level on V
CC
versus Temperature
3.0
μPROPAGATION DELAY ( s)
2.517.5
2.0
1.5
1.0
−50 −25 0 25 50 75 100
http://onsemi.com
10
TA, AMBIENT TEMPERATURE (°C)
Figure 25. Propagation Delay (V
to V
Low) versus Temperature
VCC = 12 V
R
= 10 k
ref
CT = 820 pF
> 2.58 V
OVP
Page 11
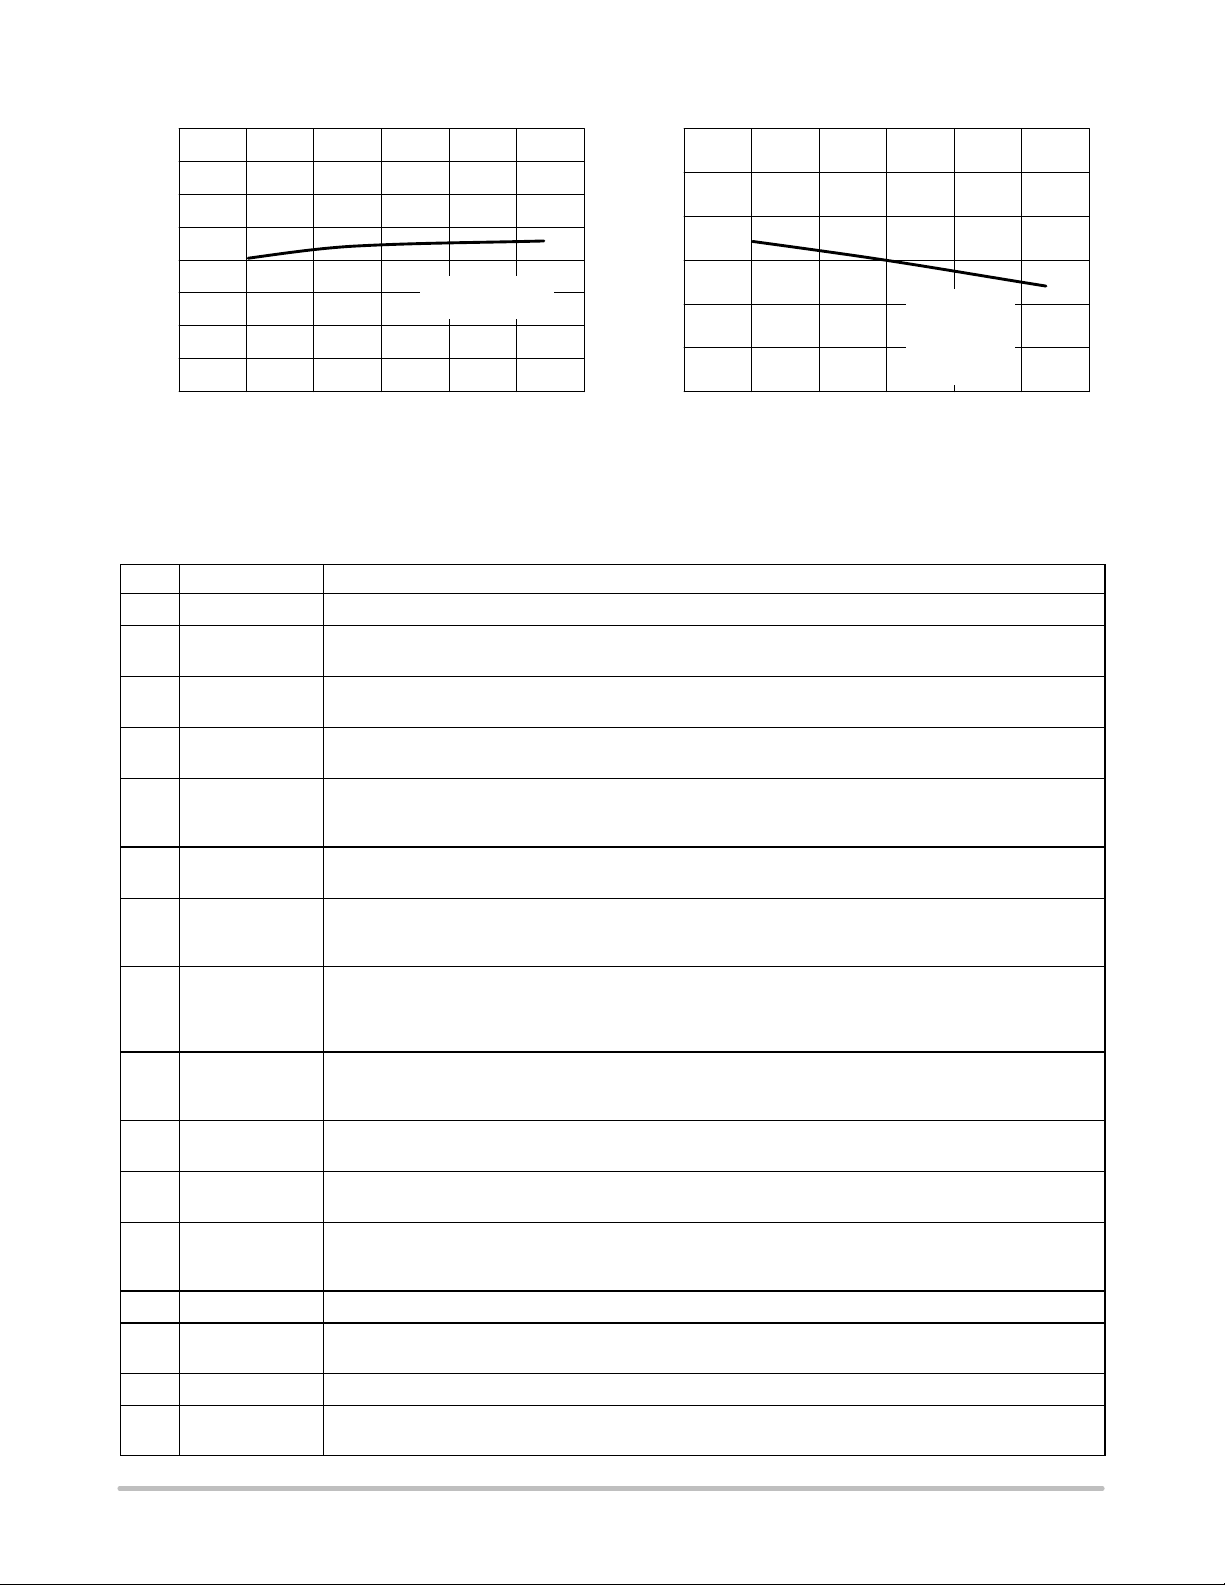
μIA)
270
265
260
255
250
V
245
R P Stdby (Pin 12)
Voltage Increasing
240
, STANDBY REFERENCE CURRENT (
235
230
R P Stby
−50 −25 0 25 50 75 100
TA, AMBIENT TEMPERATURE (°C)
MC44603A
0.33
0.32
0.31
STANDBY MODE (V)
, CURRENT SENSE THRESHOLD
CS−stby
V
0.30
VCC = 12 V
R
= 10 k
ref
CT = 820 pF
Pin 12 Clamped
at 1.0 V
−50 −25 0 25 50 75 100
TA, AMBIENT TEMPERATURE (°C)
Figure 26. Standby Reference Current
versus Temperature
Figure 27. Current Sense Voltage Threshold
Standby Mode versus Temperature
PIN FUNCTION DESCRIPTION
Pin Name Description
1 V
2 V
CC
C
3 Output Peak currents up to 750 mA can be sourced or sunk, suitable for driving either MOSFET or Bipolar
4 GND The ground pin is a single return, typically connected back to the power source; it is used as control and
5 Foldback Input The foldback function provides overload protection. Feeding the foldback input with a portion of the V
6 Overvoltage
Protection
7 Current Sense
Input
8 Demagnetization
Detection
9 Synchronization
Input
10 C
T
11 Soft−Start/D
Voltage−Mode
12 R
P Standby
13 E/A Out The error amplifier output is made available for loop compensation.
14 Voltage
Feedback
15 R
16 R
F Standby
ref
This pin is the positive supply of the IC. The operating voltage range after startup is 9.0 to 14.5 V.
The output high state (VOH) is set by the voltage applied to this pin. With a separate connection to the power
source, it can reduce the effects of switching noise on the control circuitry.
transistors. This output pin must be shunted by a Schottky diode, 1N5819 or equivalent.
power ground.
voltage (1.0 V max) establishes on the system control loop a foldback characteristic allowing a smoother
startup and sharper overload protection. Above 1.0 V the foldback input is inactive.
When the overvoltage protection pin receives a voltage greater than 17 V, the device is disabled and
requires a complete restart sequence. The overvoltage level is programmable.
A voltage proportional to the current flowing into the power switch is connected to this input. The PWM latch
uses this information to terminate the conduction of the output buffer when working in a current mode of
operation. A maximum level of 1.0 V allows either current or voltage mode operation.
A voltage delivered by an auxiliary transformer winding provides to the demagnetization pin an indication of
the magnetization state of the flyback transformer. A zero voltage detection corresponds to complete core
saturation. The demagnetization detection ensures a discontinuous mode of operation. This function can be
inhibited by connecting Pin 8 to GND.
The synchronization input pin can be activated with either a negative pulse going from a level between 0.7 V
and 3.7 V to GND or a positive pulse going from a level between 0.7 V and 3.7 V up to a level higher than
3.7 V. The oscillator runs free when Pin 9 is connected to GND.
The normal mode oscillator frequency is programmed by the capacitor CT choice together with the R
resistance value. CT, connected between Pin 10 and GND, generates the oscillator sawtooth.
/
A capacitor, resistor or a voltage source connected to this pin limits the switching duty−cycle. This pin can
max
be used as a voltage mode control input. By connecting Pin 11 to Ground, the MC44603A can be shutdown.
A voltage level applied to the R
turn into the reduced frequency mode of operation (i.e. standby mode). An internal hysteresis comparator
pin determines the output power level at which the oscillator will
P Standby
allows to return in the normal mode at a higher output power level.
This is the inverting input of the Error Amplifier. It can be connected to the switching power supply output
through an optical (or other) feedback loop.
The reduced frequency or standby frequency programming is made by the R
R
sets the internal reference current. The internal reference current ranges from 100 A to 500 A. This
ref
requires that 5.0 k ≤ R
≤ 25 k.
ref
resistance choice.
F Standby
CC
ref
http://onsemi.com
11
Page 12
MC44603A
V
V
CC prot
V
stup−th
V
disable1
V
disable2
V
UVLO1
V
Pin 11
(Soft−Start)
V
OVP Out
Output
No−Take Over Loop Failure
CC
Startup Restart
>2.0 s
Normal Mode
ref
I
CC
17 mA
0.3 mA
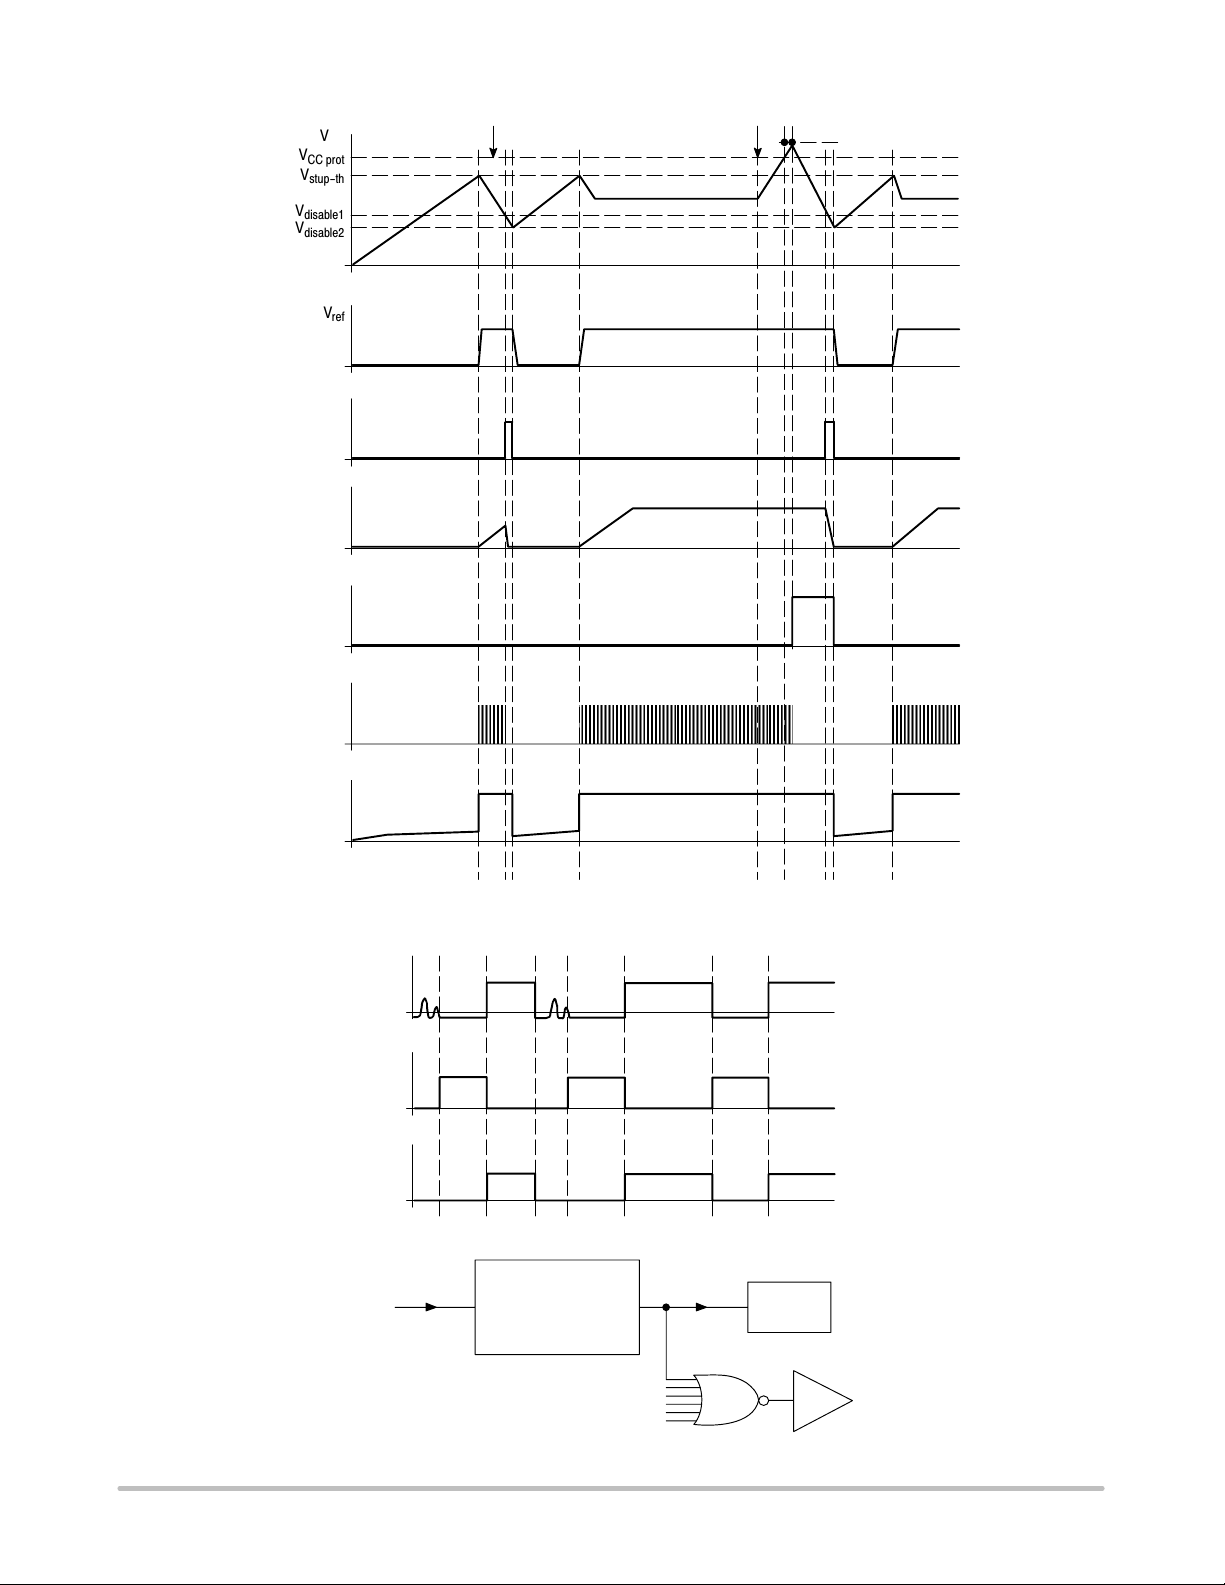
Figure 28. Starting Behavior and Overvoltage Management
V
Demag In
Output
(Pin 3)
V
Demag Out
V
V
Demag In
Demagnetization
Management
Demag Out
Oscillator
Figure 29. Demagnetization
http://onsemi.com
12
Buffer Output
Page 13
V
V
stup−th
V
disable1
V
disable2
V
UVLO1
V
Pin 11
(Soft−Start)
Output
(Pin 3)
MC44603A
CC
ref
V
Demag Out
V
OSC prot
0.3 mA
V
1.0 V
V
Stby
V
OSC
I
CC
17 mA
CT
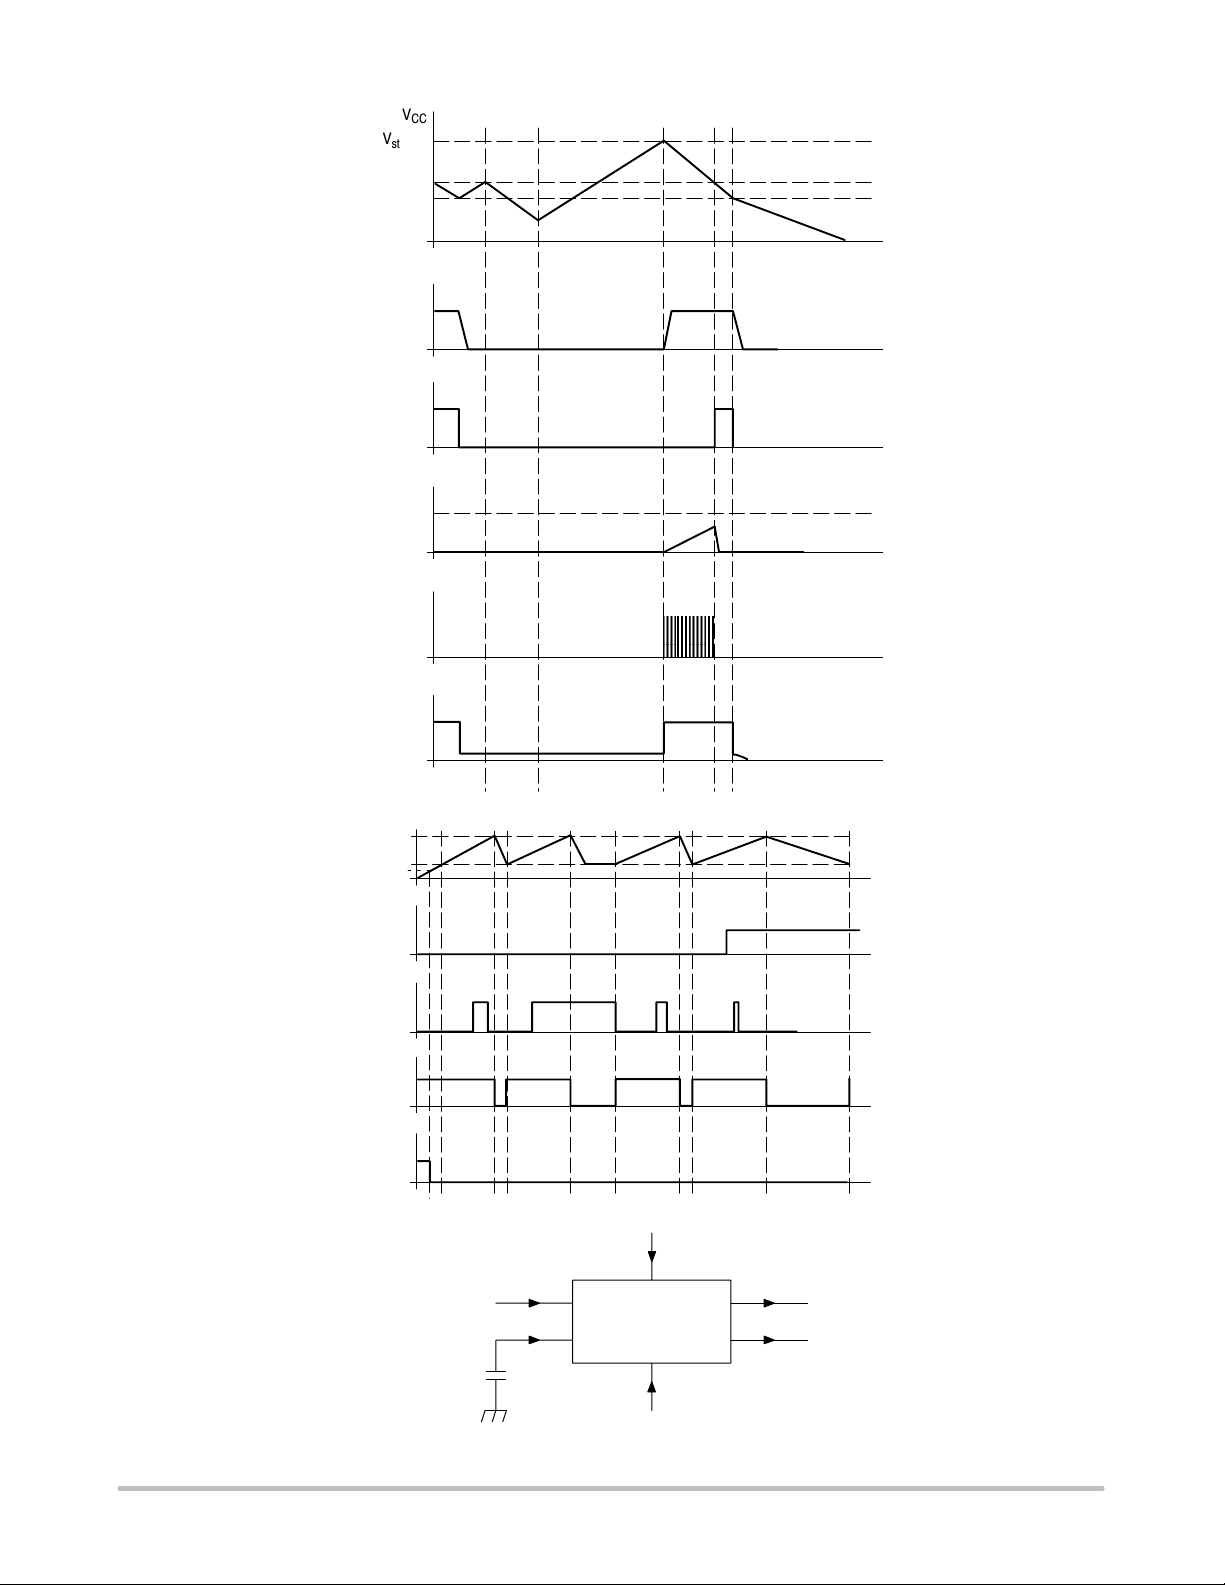
Figure 30. Switching Off Behavior
V
Demag Out
3.6 V
1.6 V
Synchronization
Input
C
T
Oscillator
V
Stby
Figure 31. Oscillator
http://onsemi.com
13
V
OSC prot
V
OSC
Page 14
max
V
VCT low
Output
(Pin 3)
MC44603A
V
ref
V
+ 1.6 V
CSS
3.6 V
CT
1.6 V
V
OSC
Soft−Start
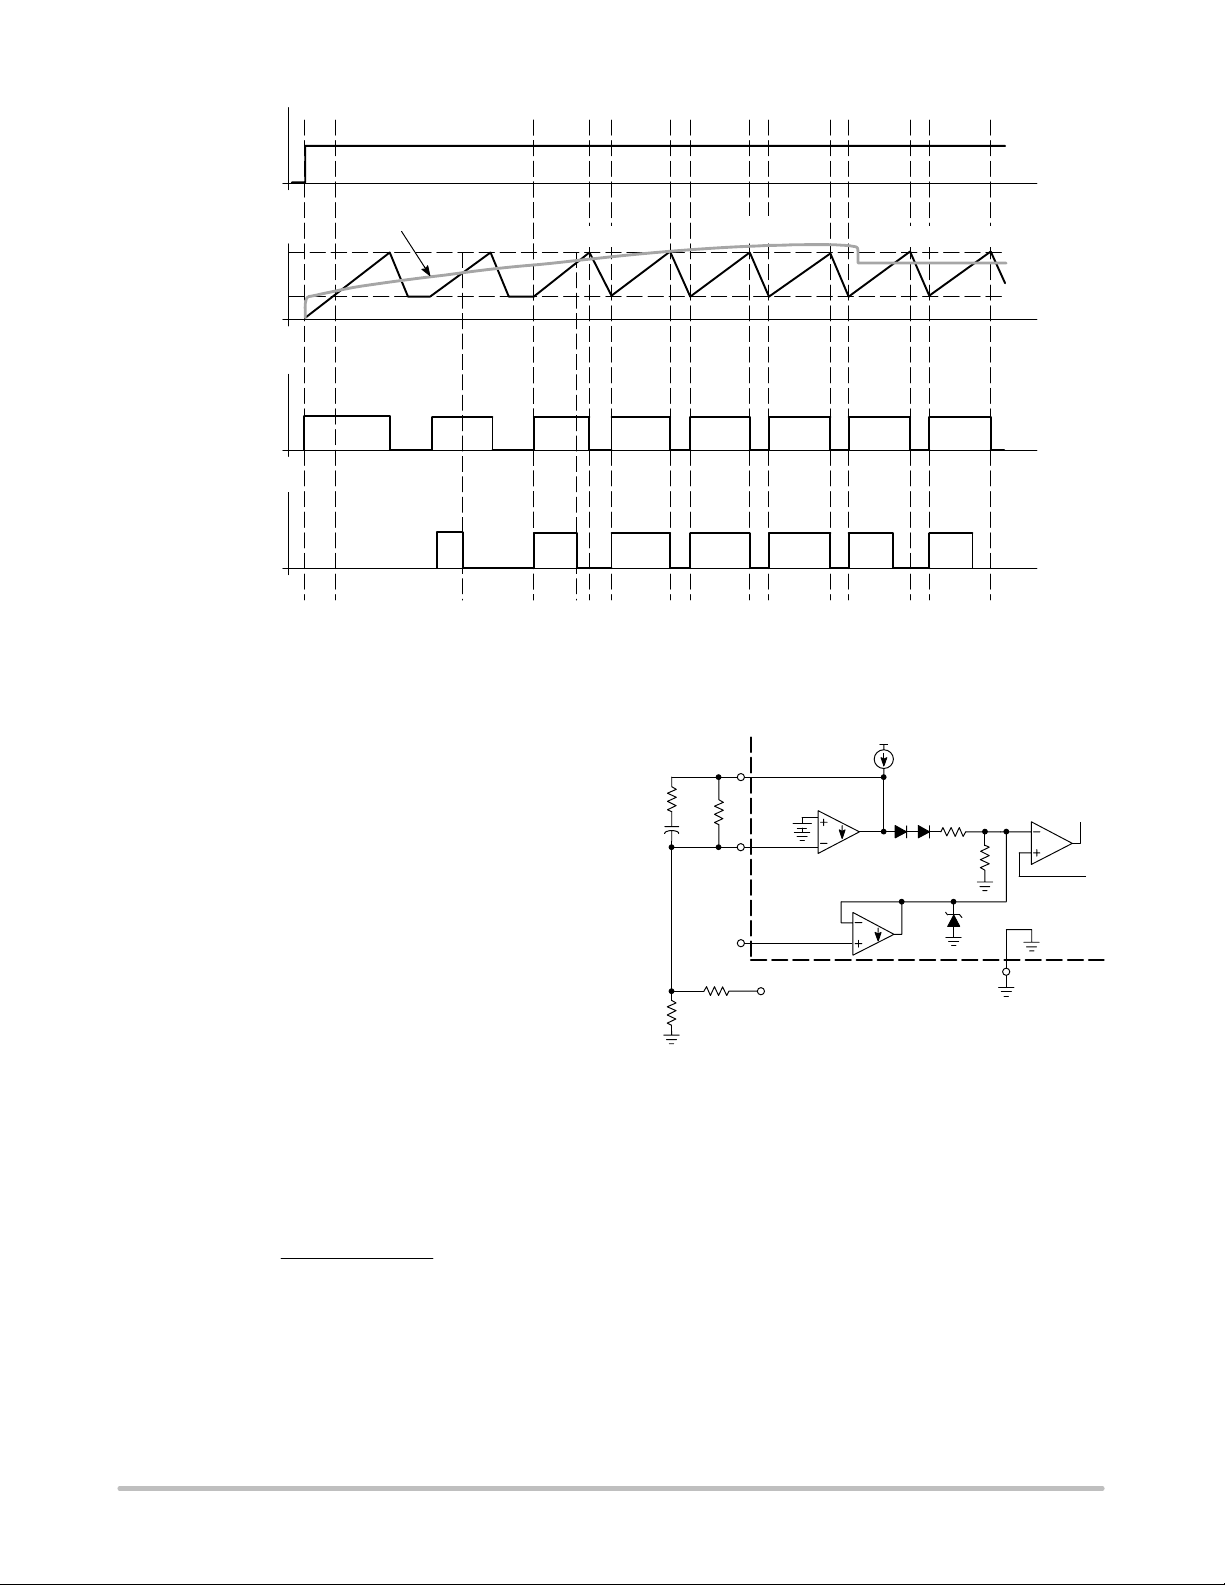
Figure 32. Soft−Start & D
Internal Clamp
External Clamp
OPERATING DESCRIPTION
Error Amplifier
A fully compensated Error Amplifier with access to the
inverting input and output is provided. It features a typical
DC voltage gain of 70 dB. The noninverting input is
internally biased at 2.5 V and is not pinned out. The
converter output voltage is typically divided down and
monitored by the inverting input. The maximum input bias
current with the inverting input at 2.5 V is −2.0 A. This can
cause an output voltage error that is equal to the product of
the input bias current and the equivalent input divider source
resistance.
The Error Amp output (Pin 13) is provided for external
loop compensation. The output voltage is offset by two
diode drops (≈ 1.4 V) and divided by three before it connects
to the inverting input of the Current Sense Comparator. This
guarantees that no drive pulses appear at the Output (Pin 3)
when Pin 13 is at its lowest state (VOL). The Error Amp
minimum feedback resistance is limited by the amplifier’s
minimum source current (0.2 mA) and the required output
voltage (VOH) to reach the current sense comparator’s 1.0 V
clamp level:
R
f(min)
3.0 (1.0V) ) 1.4 V
[
0.2 mA
+ 22 k
+
Compensation
R
FB
C
f
R1
R
f
Voltage
Feedback
Input
Foldback
Input
R2
13
2.5 V
14
5
Amplifier
From Power Supply Output
Error
1.0 mA
2R
R
Current Sense
Comparator
1.0 V
GND 4
Figure 33. Error Amplifier Compensation
Current Sense Comparator and PWM Latch
The MC44603A can operate as a current mode controller
or as a voltage mode controller. In current mode operation,
the MC44603A uses the current sense comparator. The
output switch conduction is initiated by the oscillator and
terminated when the peak inductor current reaches the
http://onsemi.com
14
Page 15
MC44603A
threshold level established by the Error Amplifier output
(Pin 13). Thus, the error signal controls the peak inductor
current on a cycle−by−cycle basis. The Current Sense
Comparator PWM Latch ensures that only a single pulse
appears at the Source Output during the appropriate
oscillator cycle.
The inductor current is converted to a voltage by inserting
the ground referenced sense resistor RS in series with the
power switch Q1.
This voltage is monitored by the Current Sense Input
(Pin 7) and compared to a level derived from the Error Amp
output. The peak inductor current under normal operating
conditions is controlled by the voltage at Pin 13 where:
V
I
pk
(Pin 13) – 1.4V
[
3R
S
The Current Sense Comparator threshold is internally
clamped to 1.0 V. Therefore, the maximum peak switch
current is:
1.0 V
[
Substrate
R
S
V
in
V
C
14
3
1N5819
Current
Sense
7
R2
D
R3
C
Q1
R
R
S
V
Demag Out
Thermal
Protection
Current Sense
Comparator
I
pk(max)
V
OSC prot
UVLO
RSQ
R
PWM
Latch
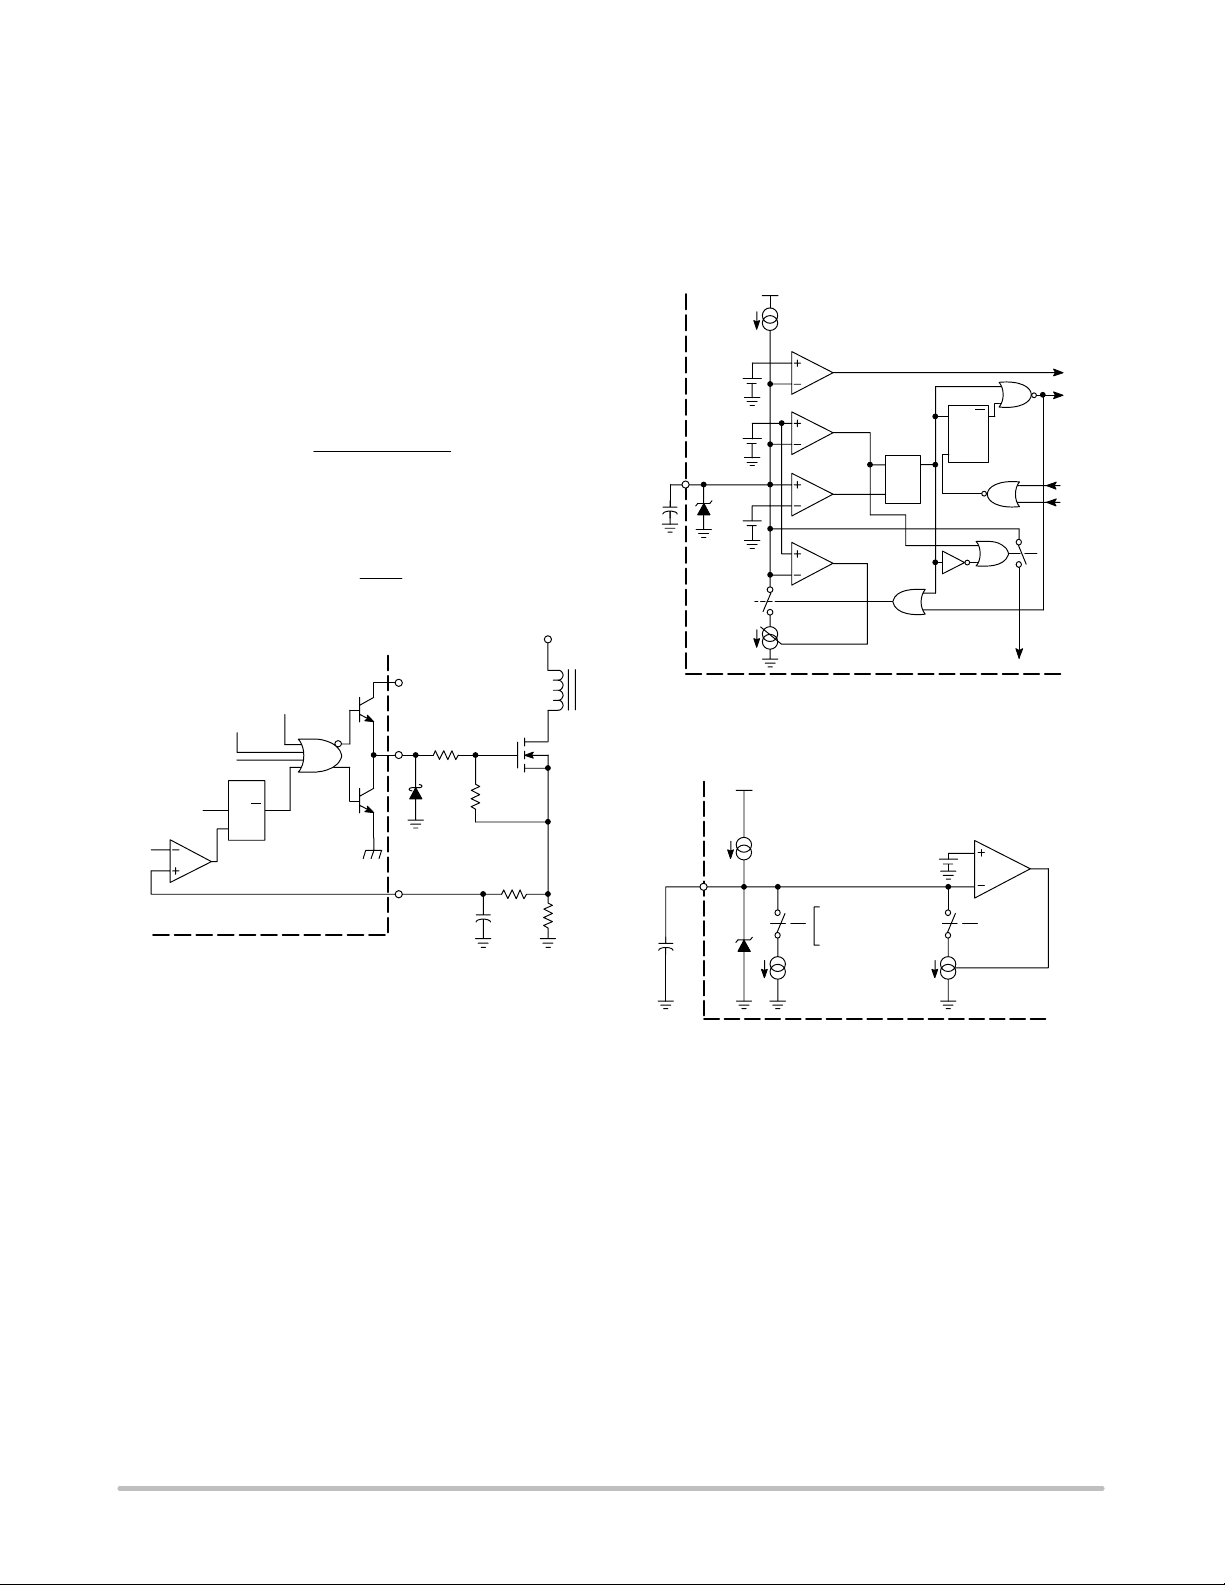
Figure 34. Output Totem Pole
connected to the c harging current source ( 0.4 I
) and so,
ref
the discharge current source has to be higher than the
charge current to be able to decrease t he CT voltage (refer
to Figure 36).
This condition is performed, its value being (2.0 I
normal working and (0.4 I
V
ref
0.4 I
C
1.0 V
C
1.6 V
10
C
T
3.6 V
V
10
C
T
C
C
10
I
Regul
Figure 35. Oscillator
ref
I
Charge
0.4 I
ref
01
I
Discharge
+ 0.5 I
ref
ref
VOS prot
OSC Low
CT < 1.6 V
Discharge
OSC High
OSC Regul
0: Discharge Phase
1: Charge Phase
R
Disch
S
in standby mode).
F Stby
V
OSC prot
R
Q
L
OSC
S
Q
1.6 V
I
Regul
C
OSC Regul
01
Synchro
V
Demag
Out
I
Discharge
ref
) in
V
OSC
Series gate resistor, R2, will dampen any high frequency
oscillations caused by the MOSFET input capacitance and
any series wiring inductance in the gate−source circuit.
Diode D is required if the negative current into the output
drive pin exceeds 15 mA.
Oscillator
The oscillator is a very accurate sawtooth generator that
can work either in free mode or in synchronization mode. In
this second mode, the oscillator stops in the low state and
waits for a demagnetization or a synchronization pulse to
start a new charging cycle.
• The Sawtooth Generation:
In the steady state, the oscillator voltage varies between
about 1.6 V and 3.6 V.
The s awtooth is o btained b y charging a nd d ischarging a n
external capacitor CT (Pin 10), using two distinct current
sources = I
charge
and I
discharge
. In fact, CT is permanently
http://onsemi.com
Figure 36. Simplified Block Oscillator
Two comparators are used to generate the sawtooth. They
compare the CT voltage to the oscillator valley (1.6 V) and
peak reference (3.6 V) values. A latch (L
) memorizes
disch
the oscillator state.
In addition to the charge and discharge cycles, a third state
can exist. This phase can be produced when, at the end of the
discharge phase, the oscillator has to wait for a
synchronization or demagnetization pulse before restarting.
During this delay, the CT voltage must remain equal to the
oscillator valley value (]1.6 V). So, a third regulated
current source I
to CT in order to perfectly compensate the (0.4 I
controlled by C
Regul
OSC Regul
, is connected
ref
source that permanently supplies CT.
The maximum duty cycle is 80%. Indeed, the on−time is
allowed only during the oscillator capacitor charge.
15
) current
Page 16
MC44603A
Consequently:
T
= CT x V/I
charge
T
discharge
= CT x V/I
charge
discharge
where:
T
is the oscillator charge time
charge
V is the oscillator peak−to−peak value
I
is the oscillator charge current
charge
and
T
discharge
I
discharge
So, as fS = 1 /(T
is the oscillator discharge time
is the oscillator discharge current
charge
+ T
discharge
) when the Regul
arrangement is not activated, the operating frequency can be
obtained from the graph in Figure 2.
NOTE: The output is disabled by the signal V
OSC prot
when
VCT is lower than 1.0 V (refer to Figure 31).
Synchronization and Demagnetization Blocks
To enable the output, the L
output must be low. Reset is activated by the L
during the discharge phase. T o restart, the L
latch complementary
OSC
disch
has to be set
OSC
output
(refer to Figure 35). To perform this, the demagnetization
signal and the synchronization must be low.
• Synchronization:
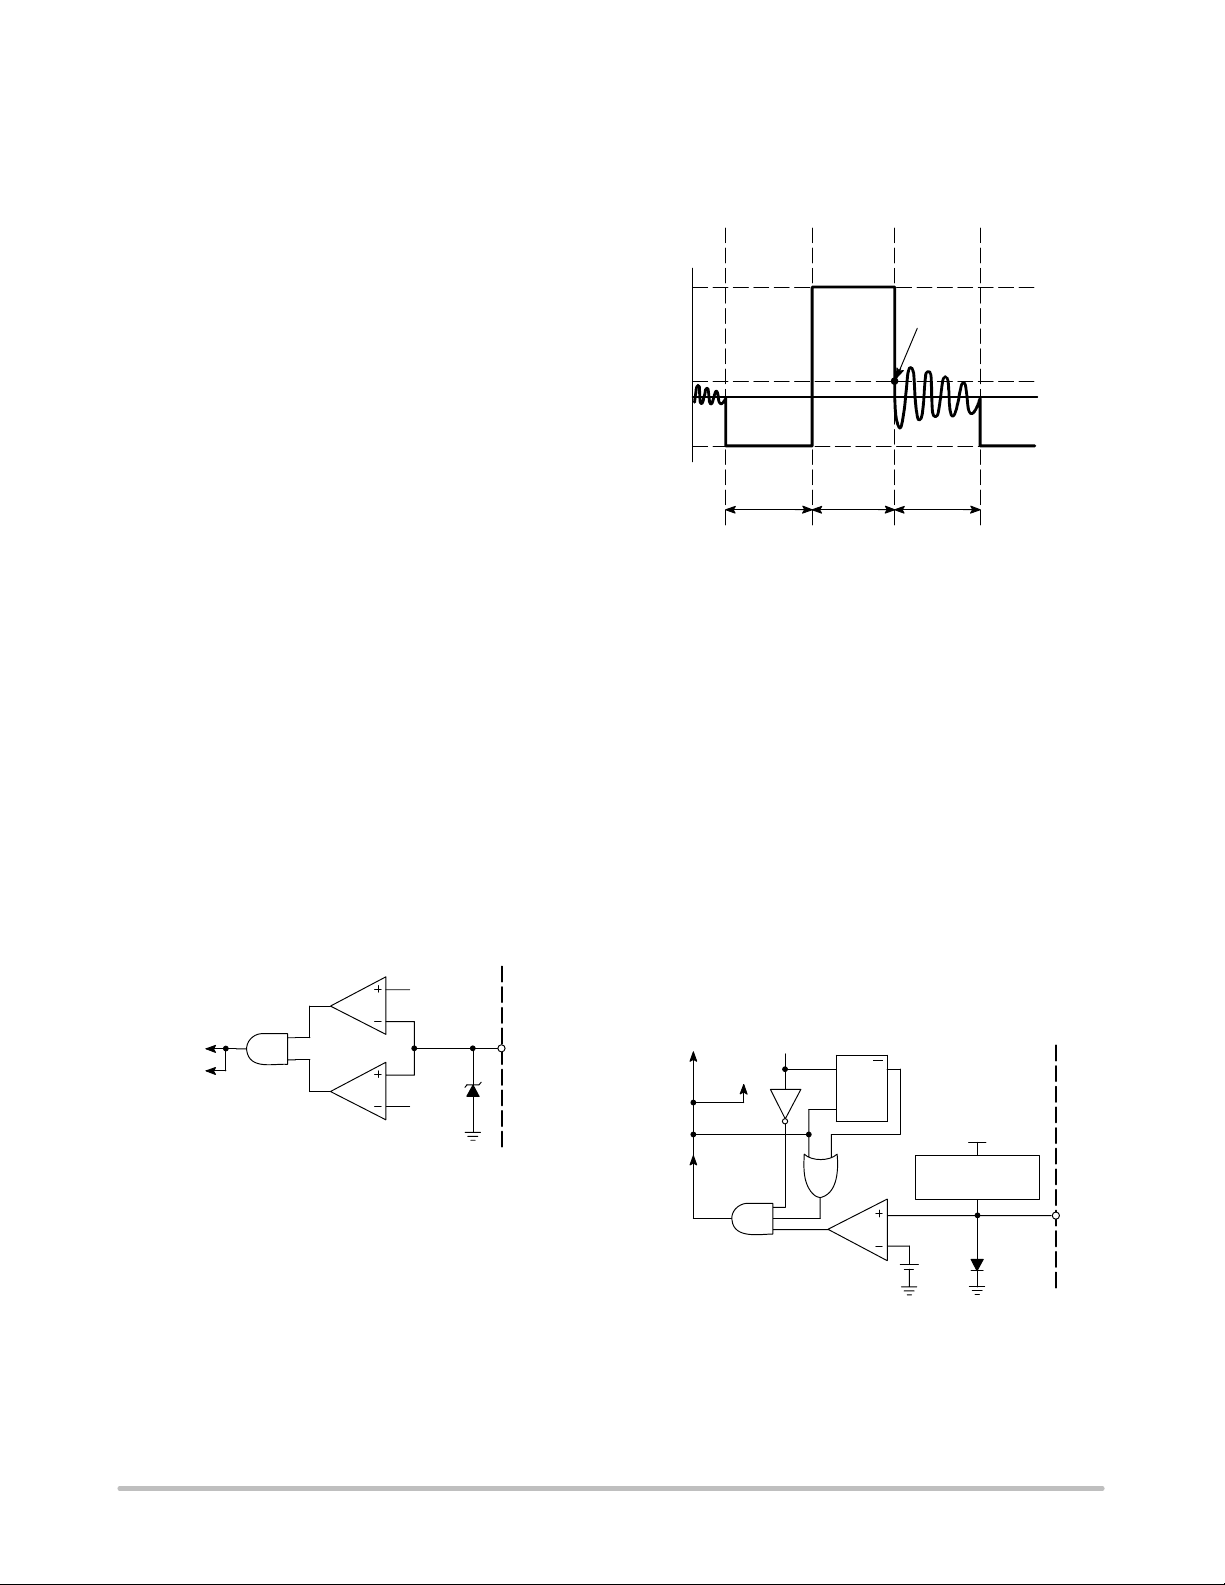
The synchronization block consists of two comparators
that compare the synchronization signal (external) to 0.7 and
3.7 V (typical values). The comparators’ outputs are
connected to the input of an AND gate so that the final output
of the block should be:
− high when 0.7 < SYNC < 3.7 V
− low in the other cases.
As a low level is necessary to enable the output,
synchronized low level pulses have to be generated on the
output of the synchronization block. If synchronization is
not required, the Pin 9 must be connected to the ground.
3.7 V
That is why, the MC44603A demagnetization detection
consists of a comparator that can compare the auxiliary
winding voltage to a reference that is typically equal to
65 mV.
Zero Current
V
Pin 8
On−Time Off−Time Dead−Time
Figure 38. Demagnetization Detection
Detection
0.75 V
65 mV
−0.33 V
A diode D has been incorporated to clamp the positive
applied voltages while an active clamping system limits the
negative voltages to typically −0.33 V. This negative clamp
level is sufficient to avoid the substrate diode switching on.
In addition to the comparator, a latch system has been
incorporated in order to keep the demagnetization block
output level low as soon as a voltage lower than 65 mV is
detected and as long as a new restart is produced (high level
on the output) (refer to Figure 39). This process prevents
ringing on the signal at Pin 8 from disrupting the
demagnetization detection. This results in a very accurate
demagnetization detection.
The demagnetization block output is also directly
connected to the output, disabling it during the
demagnetization phase (refer to Figure 34).
NOTE: The demagnetization detection can be inhibited by
connecting Pin 8 to the ground.
Oscillator
Output Buffer
0.7 V
Figure 37. Synchronization
Sync
9
• Demagnetization:
In flyback applications, a good means to detect magnetic
saturation of the transformer core, or demagnetization,
consists in using the auxiliary winding voltage. This voltage
is:
− negative during the on−time,
− positive during the off−time,
− equal to zero for the dead−time with generally some
− ringing (refer to Figure 38).
http://onsemi.com
Oscillator Output
RSQ
Demag
V
Negative Active
Clamping System
C Dem
65 mV
Standby
Buffer
V
Demag Out
Figure 39. Demagnetization Block
• Power Losses in a Classical Flyback Structure
16
CC
8
D
Page 17
MC44603A
Clamping
Network
R
S
Snubber
+
AC Line
V
R
ICL
in
+
R
startup
V
CC
MC44603A
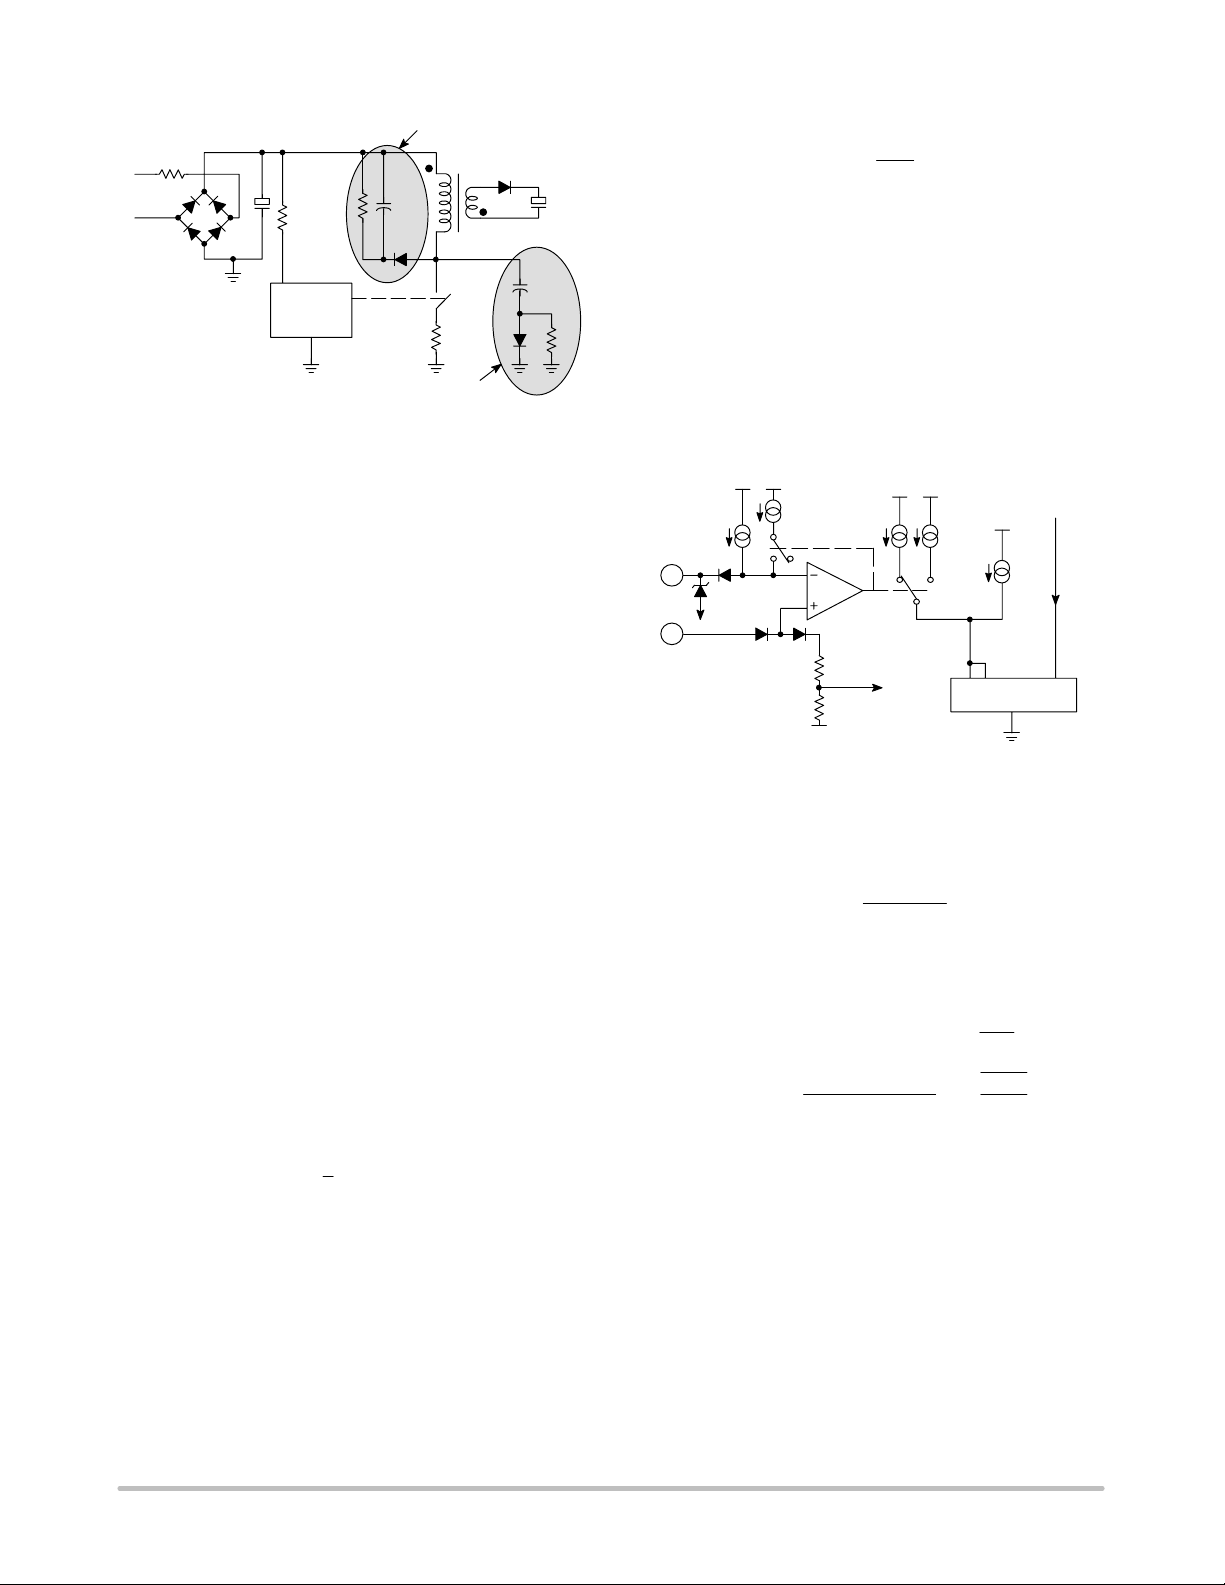
Figure 40. Power Losses in a Classical
Flyback Structure
In a classical flyback (as depicted in Figure 40), the
standby losses mainly consist of the energy waste due to:
− the startup resistor R
startup
→ P
startup
− the consumption of the IC and the power
− switch control → P
− the inrush current limitation resistor R
ICL
− the switching losses in the power switch → P
− the snubber and clamping network → P
P
is nearly constant and is equal to:
startup
ǒ
(Vin–VCC)2ńR
P
only depends on the current drawn from the mains.
ICL
startup
Ǔ
→ P
control
ICL
SW
SN−CLN
Losses can be considered constant. This waste of energy
decreases when the standby losses are reduced.
P
increases when the oscillator frequency is
control
increased (each switching requires some energy to turn on
the power switch).
PSW and P
SN−CLN
are proportional to the switching
frequency.
Consequently, standby losses can be minimized by
decreasing the switching frequency as much as possible.
The MC44603A was designed to operate at a standby
frequency lower than the normal working one.
• Standby Power Calculations with MC44603A
During a switching period, the energy drawn by the
transformer during the on−time to be transferred to the
output during the off−time, is equal to:
1
E +
xLxI
2
where:
− L is the transformer primary inductor,
− lpk is the inductor peak current.
Input power is labelled Pin:
Pin+ 0.5xLxI
where fS is the normal working switching frequency.
pk
pk
2
2
xf
S
Also,
V
pk
+
R
CS
S
I
where RS is the resistor used to measure the power switch
current.
Thus, the input power is proportional to V
2
(VCS being
CS
the internal current sense comparator input).
That is why the standby detection is performed by creating
threshold. An internal current source (0.4 x I
a V
CS
ref
) sets
the threshold level by connecting a resistor to Pin 12.
As depicted in Figure 41, the standby comparator
noninverting input voltage is typically equal to (3.0 x VCS +
VF) while the inverter input value is (V
V
ER
R
P Stby
12
13
AmpOut
0.4 I
refVref
ref
0.6 I
ref
01
C
Stby
2R
1R
Figure 41. Standby
V
refVref
0.8 I
ref
10
I
Discharge/2IDischarge
C. S. Comparator
0.25
I
F Stby
+ VF).
R P Stby
V
ref
0.2 I
Current Mirror X2
Oscillator
Discharge
Current
ref
The VCS threshold level is typically equal to
[(V
labelled P
)/3] and if t he corresponding powe r threshol d i s
R P Stby
:
thL
P
thL
+ 0.5 x L x
V
RPStby
ǒ
3.0 R
2
Ǔ
S
xf
S
And as:
V
R
PStby
RPStby
+ R
+ R
RPStby
10.6 x RSxR
+
PStby
V
ref
x0.4xI
x0.4x
ref
Ǹ
x
ref
V
R
P
Lxf
ref
ref
thL
S
Thus, when the power drawn by the converter decreases,
VCS decreases and when VCS becomes lower than [V
x (V
)/3], the s t andby m ode i s a ctivated. T his r esult s i n
R P Stby
CS−th
an oscillator discharge current reduction in order to increase
the oscillator period and to diminish the switching
frequency. As it is represented in Figure 41, the (0.8 x I
ref
current source is disconnected and is replaced by a lower
value one (0.25 x I
Where: I
F Stby
= V
).
F Stby
ref/RF Stby
)
http://onsemi.com
17
Page 18
MC44603A
max
In order to prevent undesired mode switching when power
is close to the threshold value, a hysteresis that is
proportional to V
VCS threshold level that is equal to [2.5 x (V
is incorporated creating a second
R P Stby
R P Stby
)/3].
When the standby comparator output is high, a second
current source (0.6 x I
) is connected to Pin 12.
ref
Finally, the standby mode function can be shown
graphically in Figure 42.
P
in
f
S
Normal
Working
P
thH
P
thL
[(V
)/3] 2.5 x [(V
R P Stby
Standby
R P Stby
)/3]
f
Stby
V
CS
1
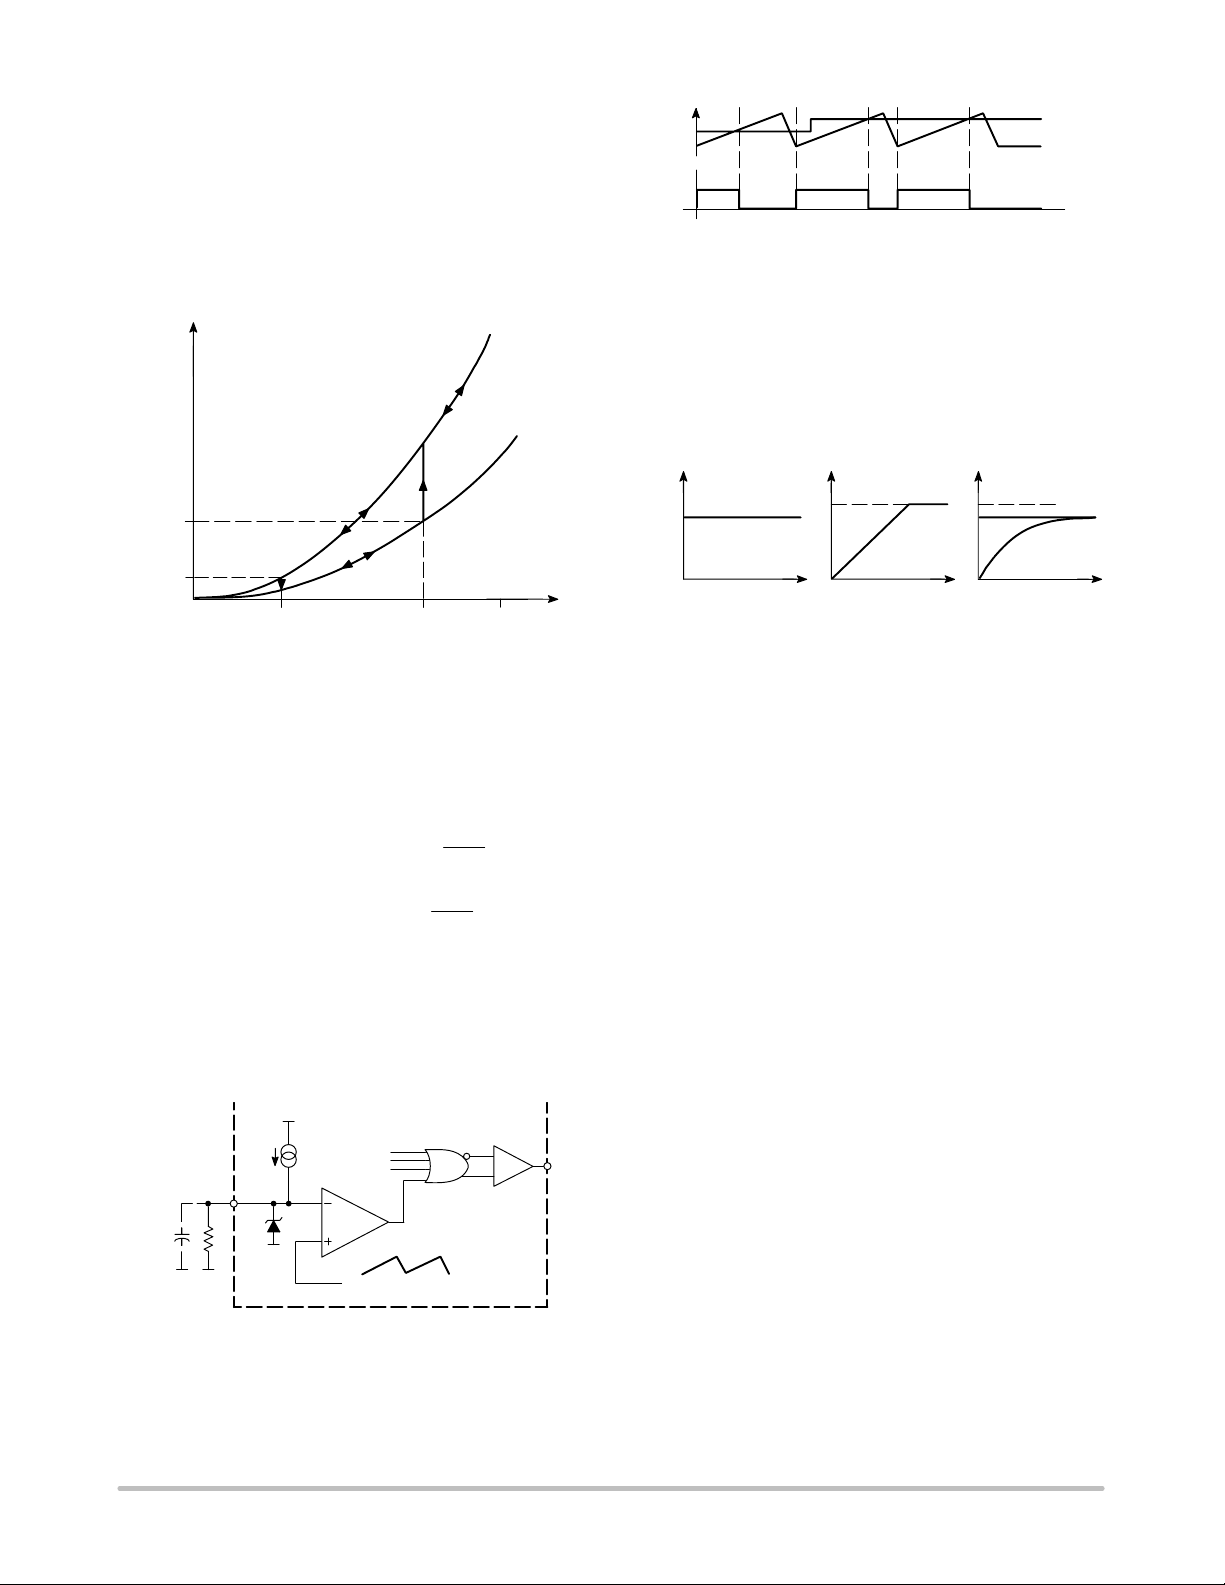
Figure 42. Dynamic Mode Change
This curve shows that there are two power threshold
levels:
− the low one:
P
fixed by V
thL
R P Stby
− the high one:
f
P
P
thH
thH
+ (2.5)2xP
+ 6.25 x P
thL
thL
Stby
x
f
S
f
Stby
x
f
S
Maximum Duty Cycle and Soft−Start Control
Maximum duty cycle can be limited to values less than
80% by utilizing the D
and soft−start control. As
max
depicted in Figure 43, the Pin 11 voltage is compared to the
oscillator sawtooth.
V
ref
0.4 I
ref
11
C
Dmax
2.4 VD
Z
Output
Control
D
max
Output
Drive
Voltage
D
max
Pin 11
V
CT
(Pin 10)
Figure 44. Maximum Duty Cycle Control
Using the internal current source (0.4 I
), the Pin 11
ref
voltage can easily be set by connecting a resistor to this pin.
If a capacitor is connected to Pin 11, the voltage increases
from 0 to its maximum value progressively (refer to
Figure 45), thereby, implementing a soft−start. The
soft−start capacitor is discharged internally when the V
CC
(Pin 1) voltage drops below 9.0 V.
Pin 11
R Connected to Pin 11
I = 0.4 I
RI
ref
V
Z
C C // R
V
Z
RI
= RC
Figure 45. Different Possible Uses of Pin 11
If no external component is connected to Pin 11, an
internal zener diode clamps the Pin 11 voltage to a value V
that is higher than the oscillator peak value, disabling
soft−start and maximum duty cycle limitation.
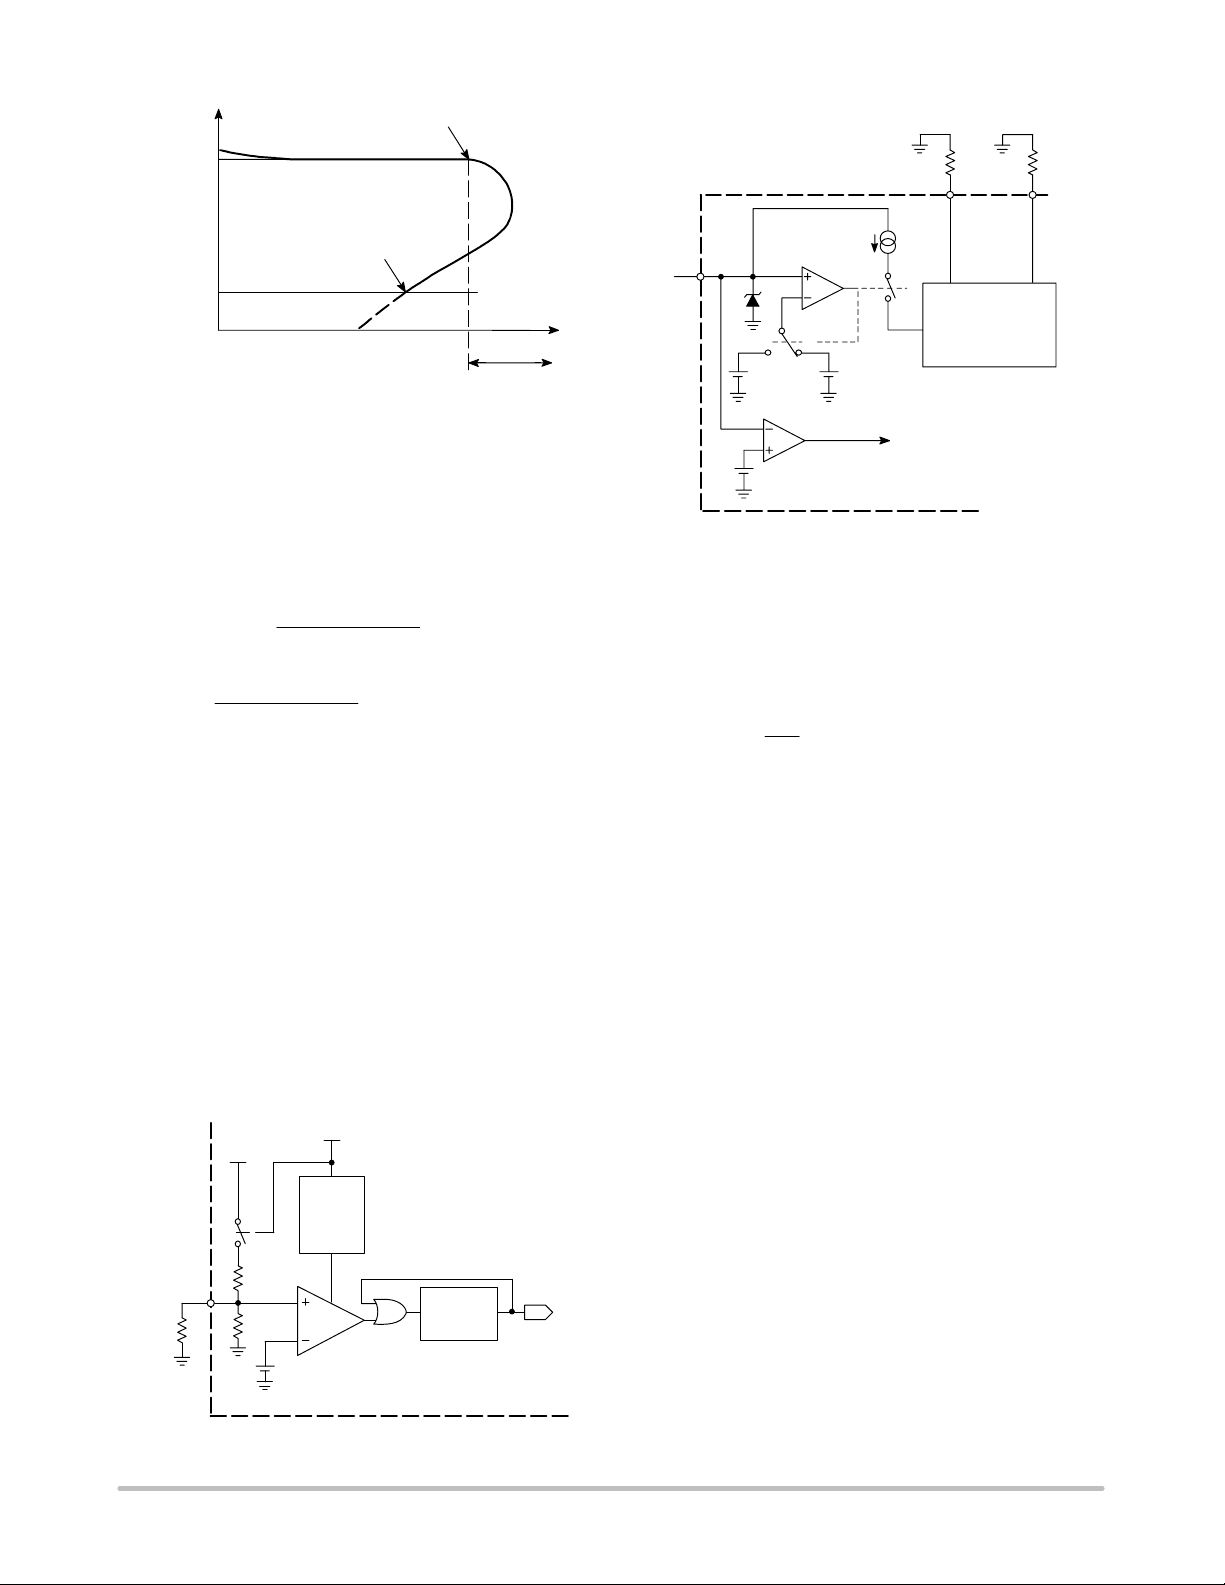
Foldback
As depicted in Figures 33 and 49, the foldback input
(Pin 5) can be used to reduce the maximum VCS value,
providing foldback protection. The foldback arrangement is
a programmable peak current limitation.
If the output load is increased, the required converter peak
current becomes higher and VCS increases until it reaches its
maximum value (normally, VCS
= 1.0 V).
max
Then, if the output load keeps on increasing, the system is
unable to supply enough energy to maintain the output
voltages in regulation. Consequently, the decreasing output
can be applied to Pin 5, in order to limit the maximum peak
current. In this way, the well known foldback characteristic
can be obtained (refer to Figure 46).
Z
Soft−Start
Capacitor
Figure 43. D
V
OSC
and Soft−Start
Oscillator
http://onsemi.com
18
Page 19
MC44603A
V
V
Nominal
V
CC
V
disable2
out
O
New Startup
Sequence Initiated
I
pk max
Overload
I
out
Figure 46. Foldback Characteristic
NOTE: Foldback is disabled by connecting Pin 5 to VCC.
Overvoltage Protection
The overvoltage arrangement consists of a comparator
that compares the Pin 6 voltage to V
(2.5 V) (refer to
ref
Figure 47).
If no external component is connected to Pin 6, the
comparator noninverting input voltage is nearly equal to:
2.0 k
ǒ
11.6 k ) 2.0 k
Ǔ
xV
CC
The comparator output is high when:
2.0 k
ǒ
11.6 k ) 2.0 k
Ǔ
xVCCw 2.5 V
à VCCw 17 V
A delay latch (2.0 s) is incorporated in order to sense
overvoltages that last at least 2.0 s.
If this condition is achieved, V
OVP out
, the delay latch
output, becomes high. As this level is brought back to the
input through an OR gate, V
the IC output) until V
is disabled.
ref
remains high (disabling
OVP out
Consequently, when an overvoltage longer than 2.0 s is
detected, the output is disabled until VCC is removed and
then re−applied.
The VCC is connected after V
has reached steady state
ref
in order to limit the circuit startup consumption.
The overvoltage section is enabled 5.0 s after the
regulator has started to allow the reference V
to stabilize.
ref
By connecting an external resistor to Pin 6, the threshold
VCC level can be changed.
V
V
CC
ref
Undervoltage Lockout Section
R
F Stby
V
ref enable
V
CC
1
C
startup
1
0
V
disable2
7.5 V
C
UVLO1
V
disable1
9.0 V
Figure 48. V
10
Startup
14.5 V
UVLO1
(to Soft−Start)
Management
CC
Reference Block:
Voltage and Current
Sources Generator
R
ref
Pin 15 Pin 16
(V
, I
, ...)
ref
ref
As depicted in Figure 48, an undervoltage lockout has
been incorporated to guarantee that the IC is fully functional
before allowing system operation.
This block particularly, produces V
I
that is determined by the resistor R
ref
(Pin 16 voltage) and
ref
connected between
ref
Pin 16 and the ground:
V
+
R
ref
ref
where V
+ 2.5 V (typically)
ref
I
ref
Another resistor is connected to the Reference Block:
R
that is used to fix the standby frequency.
F Stby
In addition to this, VCC is compared to a second threshold
level that is nearly equal to 9.0 V (V
disable1
). UVLO1 is
generated to reset the maximum duty cycle and soft−start
block disabling the output stage as soon as VCC becomes
lower than V
. In this way, the circuit is reset and made
disable1
ready for the next startup, before the reference block is
disabled (refer to Figure 30). Finally, the upper limit for the
minimum normal operating voltage is 9.4 V (maximum
value of V
((V
stup−th) min
) and so the minimum hysteresis is 4.2 V.
disable1
= 13.6 V).
The large hysteresis and the low startup current of the
MC44603A make it ideally suited for off−line converter
applications where efficient bootstrap startup techniques are
required.
External
Resistor
Out
2.5 V
Enable
2.5 V
(V
ref
Delay
C
)
T
0
V
OVP
11.6 k
6
2.0 k
In
OVLO
5.0 s
τ
the Output is Disabled)
Figure 47. Overvoltage Protection
τ
In Out
Delay
2.0 s
(If V
OVP out
V
OVP out
= 1.0,
http://onsemi.com
19
Page 20
R15
5.6 k
R15
22 k
R17
22 k
R25
1.0 k
185 VAC
to
270 VAC
RFI
Filter
C8 2.2 nF
C9 1.0 nF
C10 1.0 F
R18
27 k
1.0/5.0 W
C11
1.0 nF
R1
Sync
C12
6.8 nF
D1 ... D4
1N4007
9
10
11
12
13
14
15
16
R19
10 k
1.0 nF/1000 V
R2
68 k/2.0 W
MC44603AP
C4 ... C7
100 pF
8
7
6
5
4
3
2
1
C1
220 F
220 F
R12
C16
27 k
C15
1.0 nF
R7 180 k
R8
15 k
*D15 1N5819
R10 10
R11 39
C13
100 nF
C2
R9 1.0 k
R12 22
MC44603A
R20
22 k
5.0 W
D5
1N4934
L1
1.0 H
D6
1N4148
C14
4.7 nF
MTP6N60E
R26
1.0 k
C17
47 nF
D7
M856
R5
1.2 k
R6
150
R14
0.2
L
aux
MR856
C18
2.2 nF
D12
R13
1.0 k
C3
1.0 nF/1.0 kV
R3
4.7 M
L
p
MOC8101
TL431
C32 220 pF
D8
MR856
100 F
C29 220 pF
D9
MR852
C26 220 pF
D10
MR852
C23 220 pF
D11
MR852
1000 F
R21
10 k
33 nF
C30
1000 F
1000 F
C21
C20
22.5 H
100 F
C27
C25
R24
270
C19
100 nF
L2
C33
150 V/0.6 A
C31
0.1 F
30 V/2.0 A
C28
0.1 F
14 V/2.0 A
C24
0.1 F
7.0 V/2.0 A
C22
0.1 F
R23
147.5 k
D14
1N4733
R22
2.5 k
* Diode D15 is required if the negative current into the output pin exceeds 15 mA.
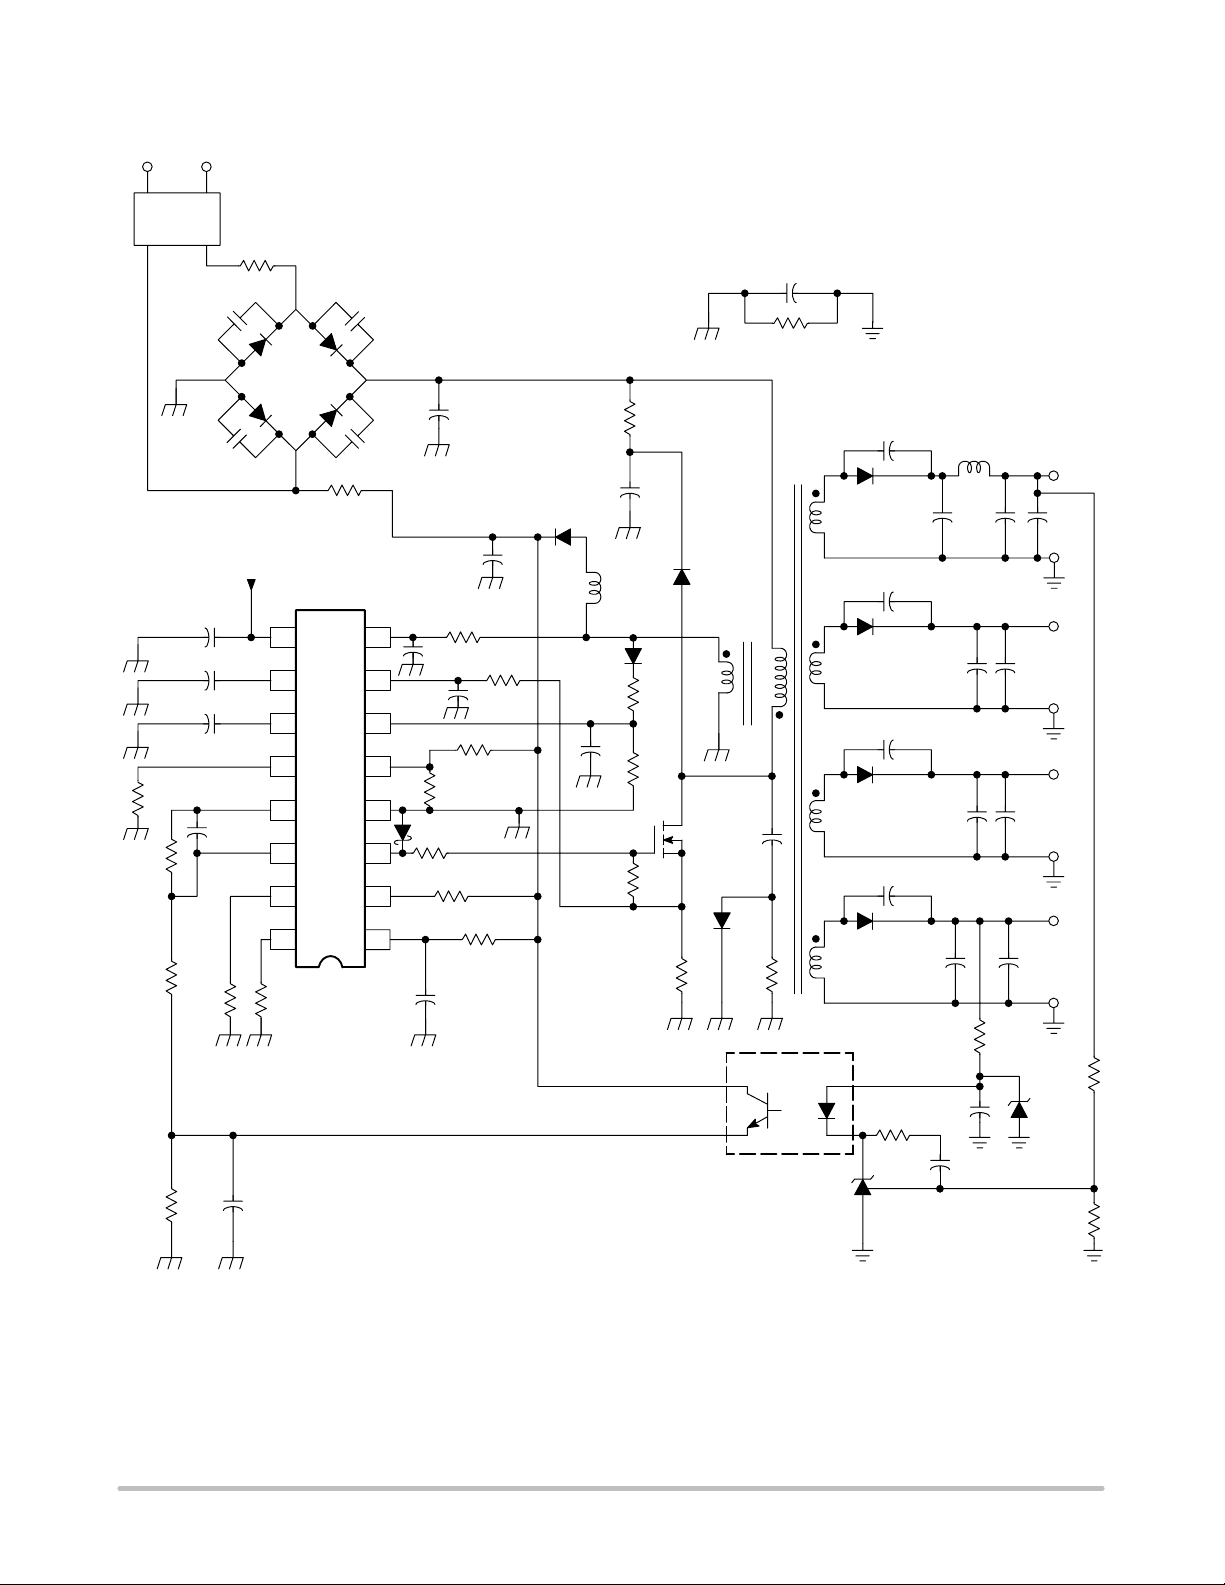
Figure 49. 250 W Input Power Off−Line Flyback Converter with MOSFET Switch
http://onsemi.com
20
Page 21
MC44603A
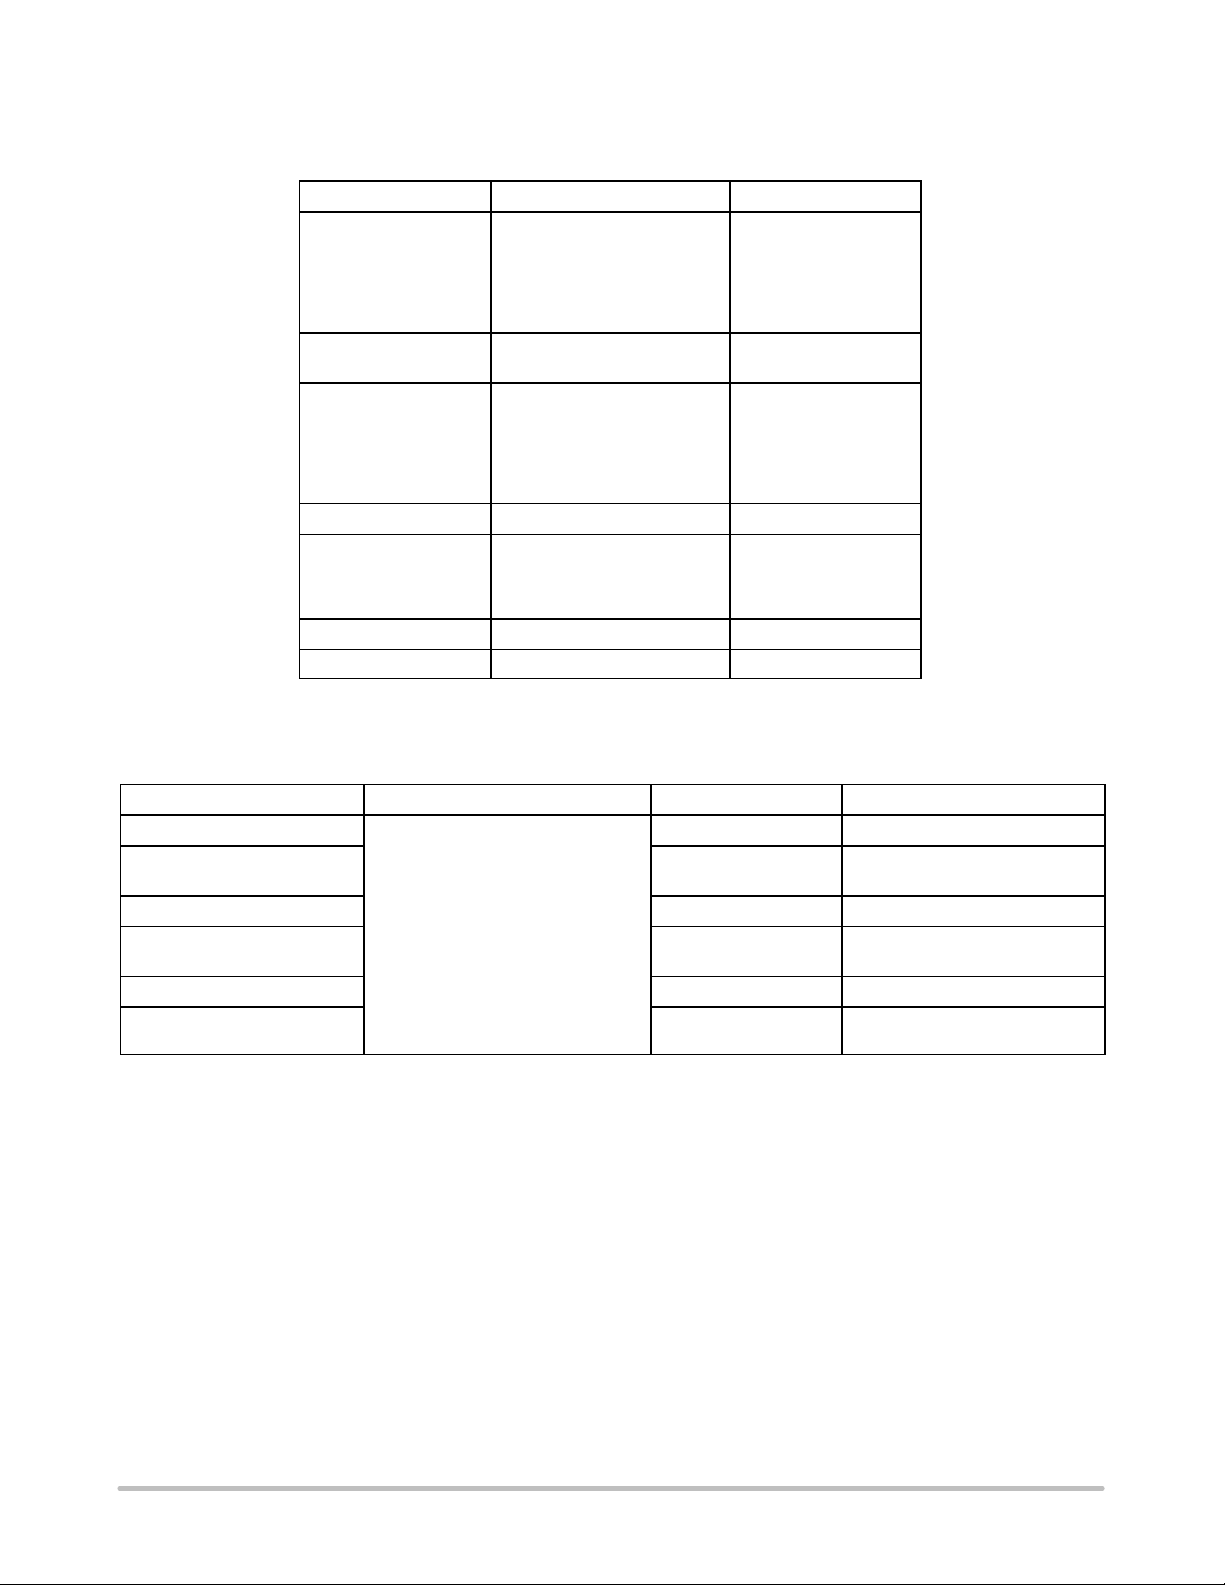
250 W Input Power Fly−Back Converter
185 V − 270 V Mains Range
MC44603AP & MTP6N60E
Tests Conditions Results
Line Regulation
150 V
130 V
114 V
7.0 V
Load Regulation
150 V
Cross Regulation
150 V
Efficiency Vin = 220 VAC, Pin = 250 W 81%
Standby Mode
P input
Switching Frequency
Output Short Circuit P
Startup Pin = 250 W VAC = 160 V
Vin = 185 VAC to 270 VAC
F
= 50 Hz
mains
= 0.6 A
I
out
I
= 2.0 A
out
I
= 2.0 A
out
I
= 2.0 A
out
Vin = 220 VAC
I
= 0.3 A to 0.6 A 50 mV
out
Vin = 220 VAC
I
(150 V) = 0.6 A
out
I
(30 V) = 0 A to 2.0 A
out
I
(14 V) = 2.0 A
out
I
(7.0 V) = 2.0 A
out
Vin = 220 VAC, P
= 270 W Safe on all outputs
out (max)
= 0 W 3.3 W
out
10 mV
10 mV
10 mV
20 mV
< 1.0 mV
20 kHz fully stable
DEVICE ORDERING INFORMATION
Device Operating Temperature Range Package Shipping
MC44603AP
MC44603APG PDIP−16
PDIP−16 25 Units / Rail
25 Units / Rail
(Pb−Free)
MC44603ADW SOIC−16 47 Units / Rail
MC44603ADWG SOIC−16
TA = −25°C to +85°C
47 Units / Rail
(Pb−Free)
MC44603ADWR2 SOIC−16 1000 / Tape & Reel
MC44603ADWR2G SOIC−16
1000 / Tape & Reel
(Pb−Free)
†For information on tape and reel specifications, including part orientation and tape sizes, please refer to our Tape and Reel Packaging
Specifications Brochure, BRD8011/D.
†
http://onsemi.com
21
Page 22
MC44603A
PACKAGE DIMENSIONS
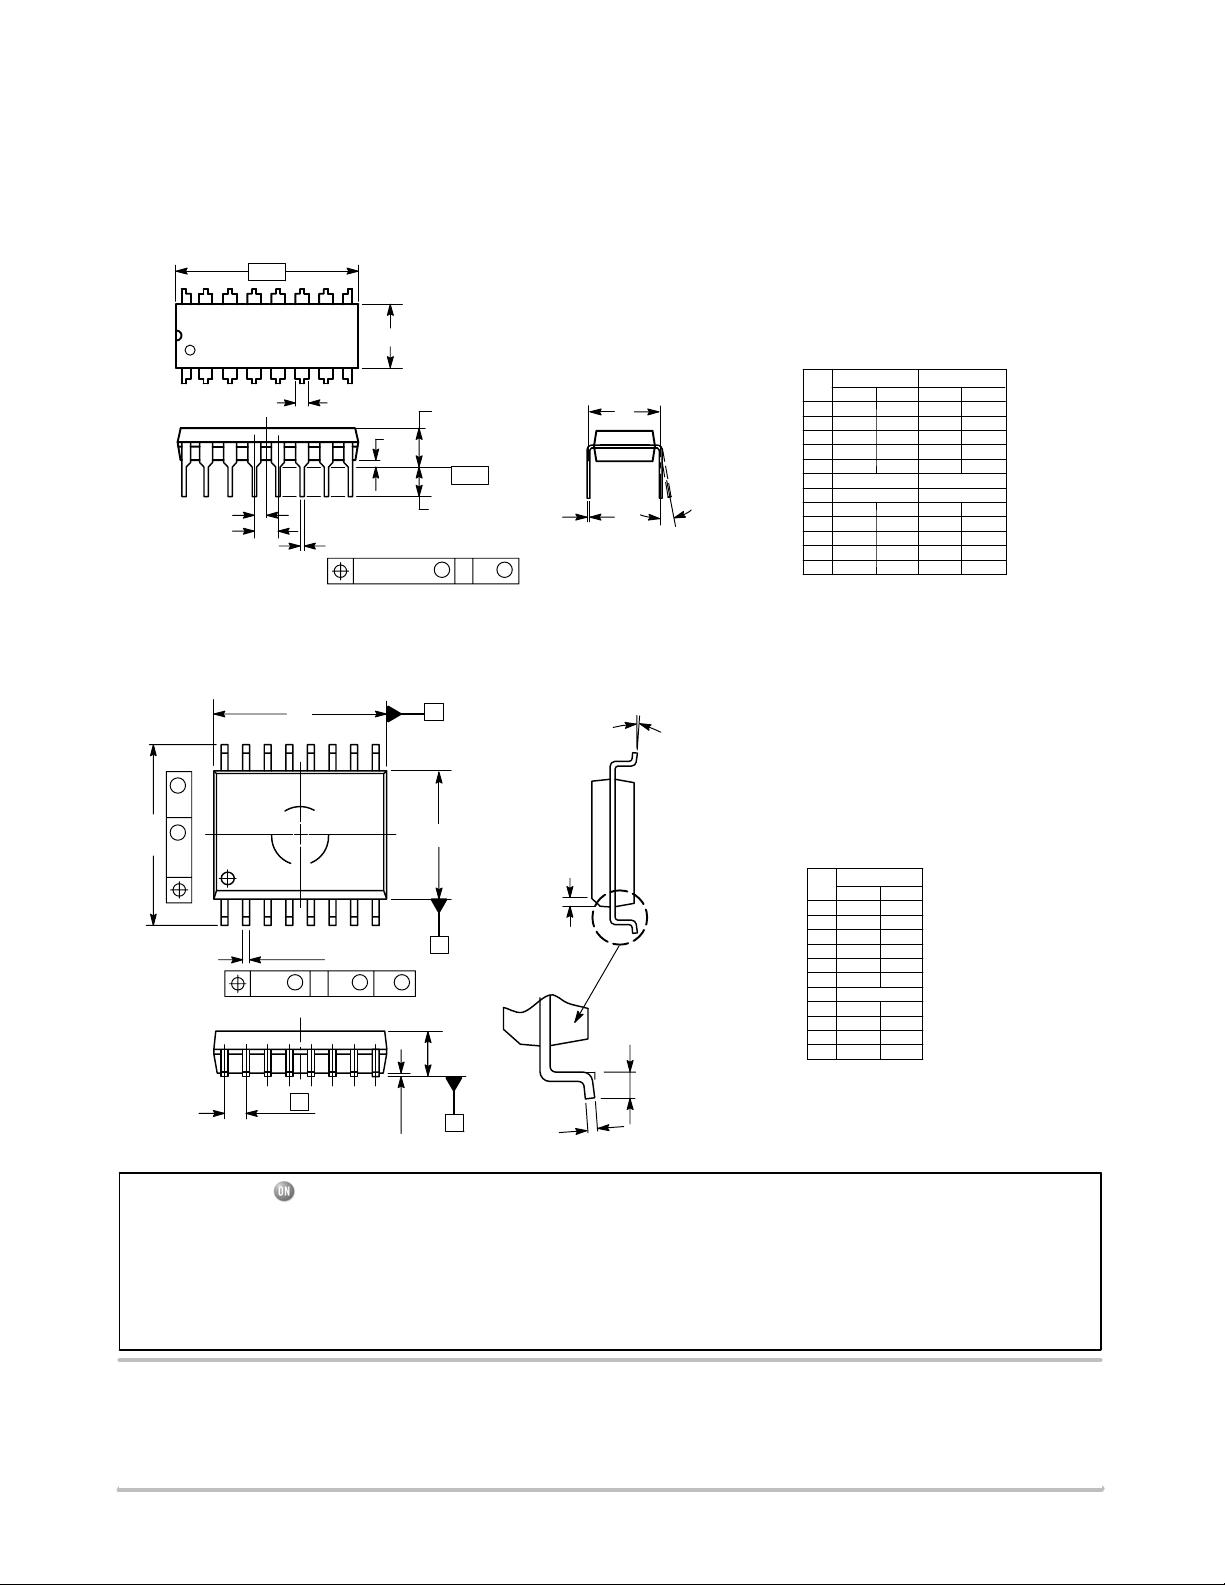
PDIP−16
CASE 648−08
ISSUE T
−A−
916
18
F
H
G
D
16 PL
0.25 (0.010) T
D
16 9
M
B
H8X
M
0.25
B16X
M
0.25 B
14X
e
GreenLine is a trademark of Motorola, Inc.
S
A
T
NOTES:
1. DIMENSIONING AND TOLERANCING PER ANSI
Y14.5M, 1982.
2. CONTROLLING DIMENSION: INCH.
3. DIMENSION L TO CENTER OF LEADS WHEN
B
C
L
S
SEATING
−T−
PLANE
K
M
A
J
M
M
FORMED PARALLEL.
4. DIMENSION B DOES NOT INCLUDE MOLD FLASH.
5. ROUNDED CORNERS OPTIONAL.
DIM MIN MAX MIN MAX
A 0.740 0.770 18.80 19.55
B 0.250 0.270 6.35 6.85
C 0.145 0.175 3.69 4.44
D 0.015 0.021 0.39 0.53
F 0.040 0.70 1.02 1.77
G 0.100 BSC 2.54 BSC
H 0.050 BSC 1.27 BSC
J 0.008 0.015 0.21 0.38
K 0.110 0.130 2.80 3.30
L 0.295 0.305 7.50 7.74
M 0 10 0 10
S 0.020 0.040 0.51 1.01
MILLIMETERSINCHES
____
SOIC−16WB
CASE 751G−03
ISSUE C
A
q
E
_
h X 45
81
B
S
A
L
A1
SEATING
PLANE
T
C
NOTES:
1. DIMENSIONS ARE IN MILLIMETERS.
2. INTERPRET DIMENSIONS AND TOLERANCES
PER ASME Y14.5M, 1994.
3. DIMENSIONS D AND E DO NOT INLCUDE
MOLD PROTRUSION.
4. MAXIMUM MOLD PROTRUSION 0.15 PER SIDE.
5. DIMENSION B DOES NOT INCLUDE DAMBAR
PROTRUSION. ALLOWABLE DAMBAR
PROTRUSION SHALL BE 0.13 TOTAL IN
EXCESS OF THE B DIMENSION AT MAXIMUM
MATERIAL CONDITION.
MILLIMETERS
DIM MIN MAX
A 2.35 2.65
A1 0.10 0.25
B 0.35 0.49
C 0.23 0.32
D 10.15 10.45
E 7.40 7.60
e 1.27 BSC
H 10.05 10.55
h 0.25 0.75
L 0.50 0.90
q 0 7
__
ON Semiconductor and are registered trademarks of Semiconductor Components Industries, LLC (SCILLC). SCILLC reserves the right to make changes without further notice
to any products herein. SCILLC makes no warranty, representation or guarantee regarding the suitability of its products for any particular purpose, nor does SCILLC assume any liability
arising out of the application or use of any product or circuit, and specifically disclaims any and all liability, including without limitation special, consequential or incidental damages.
“Typical” parameters which may be provided in SCILLC data sheets and/or specifications can and do vary in different applications and actual performance may vary over time. All
operating parameters, including “Typicals” must be validated for each customer application by customer’s technical experts. SCILLC does not convey any license under its patent rights
nor the rights of others. SCILLC products are not designed, intended, or authorized for use as components in systems intended for surgical implant into the body, or other applications
intended to support or sustain life, or for any other application in which the failure of the SCILLC product could create a situation where personal injury or death may occur. Should
Buyer purchase or use SCILLC products for any such unintended or unauthorized application, Buyer shall indemnify and hold SCILLC and its officers, employees, subsidiaries, affiliates,
and distributors harmless against all claims, costs, damages, and expenses, and reasonable attorney fees arising out of, directly or indirectly, any claim of personal injury or death
associated with such unintended or unauthorized use, even if such claim alleges that SCILLC was negligent regarding the design or manufacture of the part. SCILLC is an Equal
Opportunity/Affirmative Action Employer. This literature is subject to all applicable copyright laws and is not for resale in any manner.
PUBLICATION ORDERING INFORMATION
LITERATURE FULFILLMENT:
Literature Distribution Center for ON Semiconductor
P.O. Box 61312, Phoenix, Arizona 85082−1312 USA
Phone: 480−829−7710 or 800−344−3860 Toll Free USA/Canada
Fax: 480−829−7709 or 800−344−3867 Toll Free USA/Canada
Email: [email protected]
N. American Technical Support: 800−282−9855 Toll Free
USA/Canada
Japan: ON Semiconductor, Japan Customer Focus Center
2−9−1 Kamimeguro, Meguro−ku, Tokyo, Japan 153−0051
Phone: 81−3−5773−3850
http://onsemi.com
ON Semiconductor Website: http://onsemi.com
Order Literature: http://www.onsemi.com/litorder
For additional information, please contact your
local Sales Representative.
MC44603A/D
22
 Loading...