

Page 1
FEATURES
■
Single Gain Set Resistor: G = 1 to 10,000
■
Gain Error: G = 10, 0.08% Max
■
Gain Nonlinearity: G = 10, 10ppm Max
■
Input Offset Voltage: G = 10, 60µV Max
■
Input Offset Voltage Drift: 0.3µV/°C Max
■
Input Bias Current: 350pA Max
■
PSRR at G = 1: 105dB Min
■
CMRR at G = 1: 90dB Min
■
Supply Current: 1.3mA Max
■
Wide Supply Range: ±2.3V to ±18V
■
1kHz Voltage Noise: 7.5nV/√Hz
■
0.1Hz to 10Hz Noise: 0.28µV
■
Available in 8-Pin PDIP and SO Packages
■
Meets IEC 1000-4-2 Level 4 ESD Tests with
P-P
Two External 5k Resistors
U
APPLICATIONS
■
Bridge Amplifiers
■
Strain Gauge Amplifiers
■
Thermocouple Amplifiers
■
Differential to Single-Ended Converters
■
Medical Instrumentation
LT1167
Single Resistor Gain
Programmable, Precision
Instrumentation Amplifier
U
DESCRIPTION
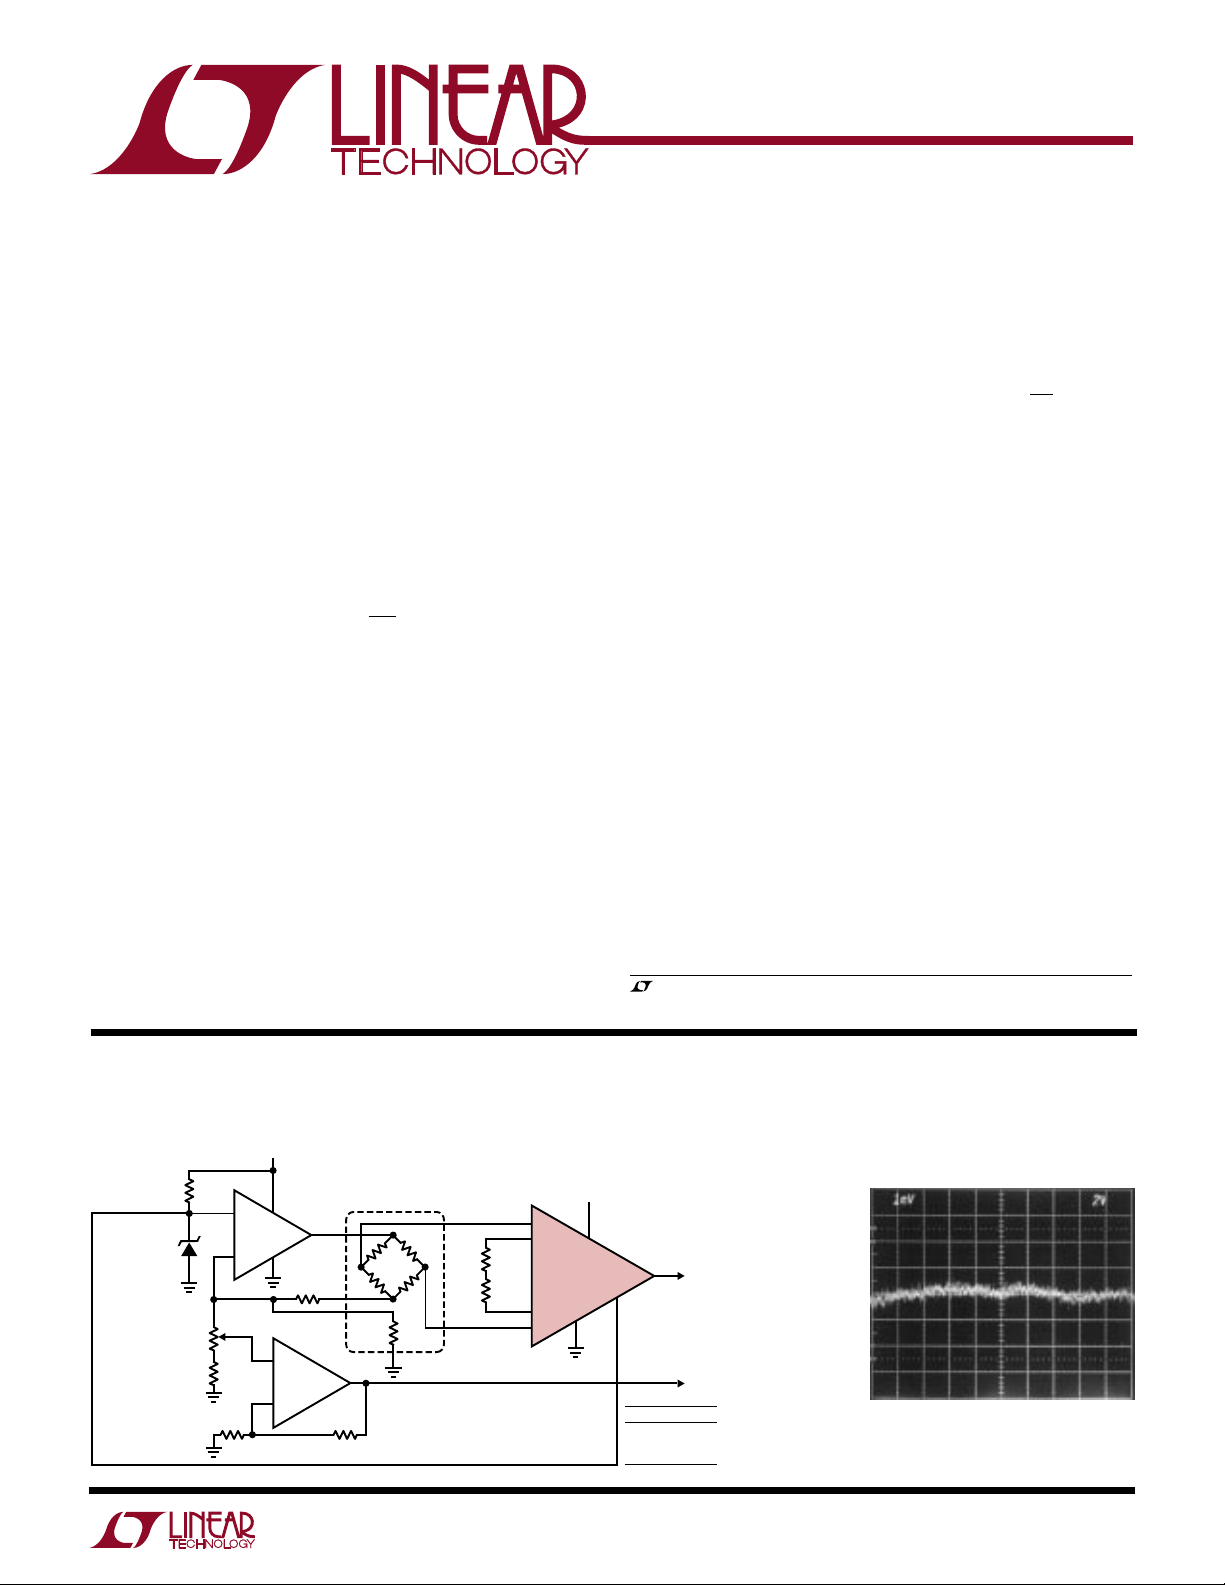
The LT®1167 is a low power, precision instrumentation
amplifier that requires only one external resistor to set gains
of 1 to 10,000. The low voltage noise of 7.5nV/√Hz (at 1kHz)
is not compromised by low power dissipation (0.9mA typical
for ±2.3V to ±15V supplies).
The high accuracy of 10ppm maximum nonlinearity and
0.08% max gain error (G = 10) is not degraded even for load
resistors as low as 2k (previous monolithic instrumentation
amps used 10k for their nonlinearity specifications). The
LT1167 is laser trimmed for very low input offset voltage
(40µV max), drift (0.3µ V/°C), high CMRR (90dB, G = 1) and
PSRR (105dB, G = 1). Low input bias currents of 350pA max
are achieved with the use of superbeta processing. The
output can handle capacitive loads up to 1000pF in any gain
configuration while the inputs are ESD protected up to 13kV
(human body). The LT1167 with two external 5k resistors
passes the IEC 1000-4-2 level 4 specification.
The LT1167, offered in 8-pin PDIP and SO packages, requires
significantly less PC board area than discrete multi op amp
and resistor designs. These advantages make the LT1167 the
most cost effective solution for precision instrumentation
amplifier applications.
, LTC and LT are registered trademarks of Linear Technology Corporation.
TYPICAL APPLICATION
Single Supply Barometer
V
S
LT1634CCZ-1.25
392k
R5
3
8
+
2
R8
100k
–
1/2
LT1490
5
6
4
+
LT1490
–
50k
50k
1
2
R4
R3
1
R6
1k
1/2
LUCAS NOVA SENOR
NPC-1220-015-A-3L
4
5k
5k
2
6
R
SET
5
7
R7
50k
U
1
–
5k
5k
+
R1
825Ω
R2
12Ω
3
0.2% ACCURACY AT 25°C
1.2% ACCURACY AT 0°C TO 60°C
= 8V TO 30V
V
S
Gain Nonlinearity
V
S
–
2
1
8
3
7
5
VOLTS
2.800
3.000
3.200
6
INCHES Hg
TO
4-DIGIT
DVM
28.00
30.00
32.00
1167 TA01
NONLINEARITY (100ppm/DIV)
G = 1000
R
= 1k
L
V
OUT
OUTPUT VOLTAGE (2V/DIV)
= ±10V
1167 TA02
LT1167
G = 60
+
4
1
Page 2
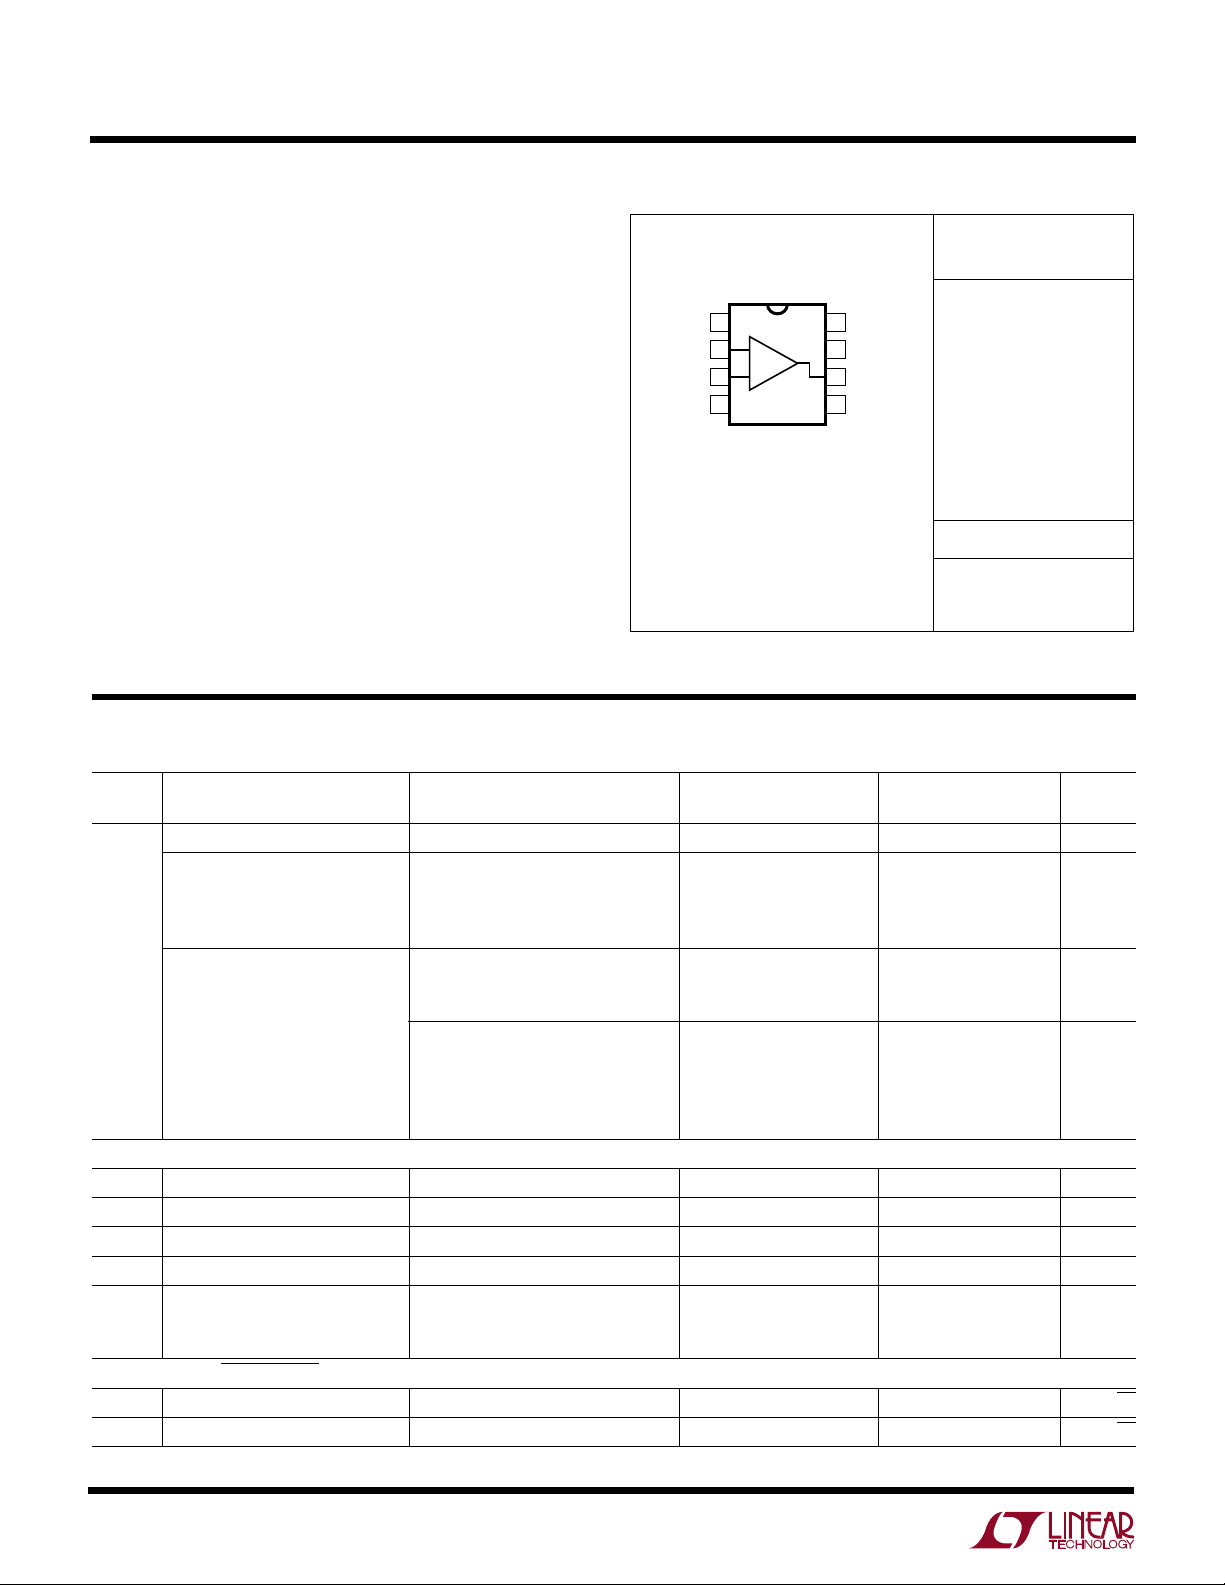
LT1167
1
2
3
4
8
7
6
5
TOP VIEW
R
G
–IN
+IN
–V
S
RG
+V
S
OUTPUT
REF
N8 PACKAGE
8-LEAD PDIP
S8 PACKAGE
8-LEAD PLASTIC SO
+
–
WW
W
U
ABSOLUTE MAXIMUM RATINGS
(Note 1)
Supply Voltage ...................................................... ±20V
Differential Input Voltage (Within the
Supply Voltage) ..................................................... ±40V
Input Voltage (Equal to Supply Voltage) ................ ±20V
Input Current (Note 3) ........................................ ±20mA
Output Short-Circuit Duration ..........................Indefinite
Operating Temperature Range ................ – 40°C to 85°C
Specified Temperature Range
LT1167AC/LT1167C (Note 4) .................. 0°C to 70°C
LT1167AI/LT1167I ............................. –40°C to 85°C
Storage Temperature Range ................. –65°C to 150°C
Lead Temperature (Soldering, 10 sec).................. 300°C
U
W
PACKAGE/ORDER INFORMATION
ORDER PART
NUMBER
LT1167ACN8
LT1167ACS8
LT1167AIN8
LT1167AIS8
LT1167CN8
LT1167CS8
LT1167IN8
LT1167IS8
T
= 150°C, θJA = 130°C/ W (N8)
JMAX
= 150°C, θJA = 190°C/ W (S8)
T
JMAX
Consult factory for Military grade parts.
S8 PART MARKING
1167A
1167AI
1167
1167I
U
ELECTRICAL CHARACTERISTICS
SYMBOL PARAMETER CONDITIONS (Note 7) MIN TYP MAX MIN TYP MAX UNITS
G Gain Range G = 1 + (49.4k/RG) 1 10k 1 10k
Gain Error G = 1 0.008 0.02 0.015 0.03 %
G = 10 (Note 2) 0.010 0.08 0.020 0.10 %
G = 100 (Note 2) 0.025 0.08 0.030 0.10 %
G = 1000 (Note 2) 0.040 0.10 0.040 0.10 %
Gain Nonlinearity (Note 5) VO = ±10V, G = 1 1 6 1.5 10 ppm
= ±10V, G = 10 and 100 2 10 3 15 ppm
V
O
VO = ±10V, G = 1000 15 40 20 60 ppm
VO = ±10V, G = 1, RL = 600 5 12 6 15 ppm
VO = ±10V, G = 10 and 100, 6 15 7 20 ppm
= 600
R
L
= ±10V, G = 1000, 20 65 25 80 ppm
V
O
= 600
R
L
V
OST
V
OSI
V
OSO
I
OS
I
B
e
n
Total RTI Noise = √e
e
ni
e
no
2
Total Input Referred Offset Voltage V
Input Offset Voltage G = 1000, VS = ±5V to ±15V 15 40 20 60 µV
Output Offset Voltage G = 1, VS = ±5V to ±15V 40 200 50 300 µV
Input Offset Current 90 320 100 450 pA
Input Bias Current 50 350 80 500 pA
Input Noise Voltage, RTI 0.1Hz to 10Hz, G = 1 2.00 2.00 µV
2
+ (eno/G)
ni
Input Noise Voltage Density, RTI fO = 1kHz 7.5 12 7.5 12 nV/√Hz
Output Noise Voltage Density, RTI fO = 1kHz (Note 3) 67 90 67 90 nV/√Hz
2
= V
OST
OSI
0.1Hz to 10Hz, G = 10 0.50 0.50 µV
0.1Hz to 10Hz, G = 100 and 1000 0.28 0.28 µV
VS = ±15V, VCM = 0V, TA = 25°C, RL = 2k, unless otherwise noted.
LT1167C/LT1167I
+ V
OSO
LT1167AC/LT1167AI
/G
P-P
P-P
P-P
Page 3

LT1167
ELECTRICAL CHARACTERISTICS
SYMBOL PARAMETER CONDITIONS (Note 7) MIN TYP MAX MIN TYP MAX UNITS
i
n
R
IN
C
IN(DIFF)
C
IN(CM)
V
CM
CMRR Common Mode 1k Source Imbalance,
PSRR Power Supply VS = ±2.3 to ±18V
I
S
V
OUT
I
OUT
BW Bandwidth G = 1 1000 1000 kHz
SR Slew Rate G = 1, V
R
REFIN
I
REFIN
V
REF
A
VREF
Input Noise Current fO = 0.1Hz to 10Hz 10 10 pA
Input Noise Current Density fO = 10Hz 124 124 fA/√Hz
Input Resistance VIN = ±10V 200 1000 200 1000 GΩ
Differential Input Capacitance fO = 100kHz 1.6 1.6 pF
Common Mode Input fO = 100kHz 1.6 1.6 pF
Capacitance
Input Voltage Range G = 1, Other Input Grounded
= ±2.3V to ±5V –VS + 1.9 +VS – 1.2 – VS + 1.9 +VS – 1.2 V
V
S
= ±5V to ±18V –VS + 1.9 +VS – 1.4 – VS + 1.9 +VS – 1.4 V
V
S
Rejection Ratio V
Rejection Ratio G = 1 105 120 100 120 dB
Supply Current VS = ±2.3V to ±18V 0.9 1.3 0.9 1.3 mA
Output Voltage Swing RL = 10k
Output Current 20 27 20 27 mA
Settling Time to 0.01% 10V Step
Reference Input Resistance 20 20 kΩ
Reference Input Current V
Reference Voltage Range –VS + 1.6 +VS – 1.6 – VS + 1.6 +VS – 1.6 V
Reference Gain to Output 1 ± 0.0001 1 ± 0.0001
= 0V to ±10V
CM
G = 1 90 95 85 95 dB
G = 10 106 115 100 115 dB
G = 100 120 125 110 125 dB
G = 1000 126 140 120 140 dB
G = 10 125 135 120 135 dB
G = 100 131 140 126 140 dB
G = 1000 135 150 130 150 dB
= ±2.3V to ±5V –VS + 1.1 +VS – 1.2 – VS + 1.1 +VS – 1.2 V
V
S
= ±5V to ±18V –VS + 1.2 +VS – 1.3 – VS + 1.2 +VS – 1.3 V
V
S
G = 10 800 800 kHz
G = 100 120 120 kHz
G = 1000 12 12 kHz
= ±10V 0.75 1.2 0.75 1.2 V/µs
OUT
G = 1 to 100 14 14 µs
G = 1000 130 130 µs
= 0V 50 50 µA
REF
VS = ±15V, VCM = 0V, TA = 25°C, RL = 2k, unless otherwise noted.
LT1167AC/LT1167AI LT1167C/LT1167I
P-P
3
Page 4

LT1167
ELECTRICAL CHARACTERISTICS
VS = ±15V, VCM = 0V, 0°C ≤ TA ≤ 70°C, RL = 2k, unless otherwise noted.
LT1167AC LT1167C
SYMBOL PARAMETER CONDITIONS (Note 7) MIN TYP MAX MIN TYP MAX UNITS
Gain Error G = 1 ● 0.01 0.03 0.012 0.04 %
● 0.08 0.30 0.100 0.33 %
● 0.09 0.30 0.120 0.33 %
● 0.14 0.33 0.140 0.35 %
Gain Nonlinearity V
G = 10 (Note 2)
G = 100 (Note 2)
G = 1000 (Note 2)
= ±10V, G = 1 ● 1.5 10 2 15 ppm
OUT
V
= ±10V, G = 10 and 100 ● 3 15 4 20 ppm
OUT
= ±10V, G = 1000 ● 20 60 25 80 ppm
V
OUT
G/T Gain vs Temperature G < 1000 (Note 2) ● 20 50 20 50 ppm/°C
V
OST
Total Input Referred V
OST
= V
OSI
+ V
OSO
/G
Offset Voltage
V
V
V
V
V
V
I
OS
OSI
OSIH
OSO
OSOH
OSI
OSO
Input Offset Voltage VS = ±5V to ±15V ● 18 60 23 80 µV
Input Offset Voltage Hysteresis (Notes 3, 6) 3.0 3.0 µV
Output Offset Voltage VS = ±5V to ±15V ● 60 380 70 500 µV
Output Offset Voltage Hysteresis (Notes 3, 6) 30 30 µV
/T Input Offset Drift (RTI) (Note 3) ● 0.05 0.3 0.06 0.4 µV/°C
/T Output Offset Drift (Note 3) ● 0.7 3 0.8 4 µV/°C
Input Offset Current ● 100 400 120 550 pA
IOS/T Input Offset Current Drift ● 0.3 0.4 pA /°C
I
B
Input Bias Current ● 75 450 105 600 pA
IB/T Input Bias Current Drift ● 0.4 0.4 pA/°C
V
CM
Input Voltage Range G = 1, Other Input Grounded
VS = ±2.3V to ±5V ● –VS+2.1 + VS–1.3 –VS+2.1 + VS–1.3 V
= ±5V to ±18V ● –VS+2.1 + VS–1.4 –VS+2.1 + VS–1.4 V
V
S
CMRR Common Mode 1k Source Imbalance,
Rejection Ratio V
= 0V to ±10V
CM
G = 1
G = 10
G = 100
● 88 92 83 92 dB
● 100 110 97 110 dB
● 115 120 113 120 dB
G = 1000 ● 117 135 114 135 dB
PSRR Power Supply Rejection Ratio VS = ±2.3V to ±18V
G = 1
G = 10
G = 100
G = 1000
I
V
I
S
OUT
OUT
Supply Current VS = ±2.3V to ±18V ● 1.0 1.5 1.0 1.5 mA
Output Voltage Swing RL = 10k
= ±2.3V to ±5V ● –VS+1.4 + VS–1.3 –VS+1.4 +VS–1.3 V
V
S
= ±5V to ±18V ● –VS+1.6 + VS–1.5 –VS+1.6 + VS–1.5 V
V
S
Output Current ● 16 21 16 21 mA
SR Slew Rate G = 1, V
V
REF
REF Voltage Range (Note 3) ● –VS+1.6 + VS–1.6 –VS+1.6 + VS–1.6 V
= ±10V ● 0.65 1.1 0.65 1.1 V/µs
OUT
● 103 115 98 115 dB
● 123 130 118 130 dB
● 127 135 124 135 dB
● 129 145 126 145 dB
4
Page 5
ELECTRICAL CHARACTERISTICS
VS = ±15V, VCM = 0V, –40°C ≤ TA ≤ 85°C, RL = 2k, unless otherwise noted. (Note 4)
LT1167
SYMBOL PARAMETER CONDITIONS (Note 7) MIN TYP MAX MIN TYP MAX UNITS
LT1167AI LT1167I
Gain Error G = 1 ● 0.014 0.04 0.015 0.05 %
G = 10 (Note 2) ● 0.130 0.40 0.140 0.42 %
G = 100 (Note 2)
● 0.140 0.40 0.150 0.42 %
G = 1000 (Note 2) ● 0.160 0.40 0.180 0.45 %
G
N
Gain Nonlinearity (Notes 2, 4) VO = ±10V, G = 1 ● 2 15 3 20 ppm
= ±10V, G = 10 and 100 ● 5 20 6 30 ppm
V
O
VO = ±10V, G = 1000 ● 26 70 30 100 ppm
G/T Gain vs Temperature G < 1000 (Note 2) ● 20 50 20 50 ppm/°C
V
V
V
V
V
V
V
I
OS
OST
OSI
OSIH
OSO
OSOH
OSI
OSO
Total Input Referred V
Offset Voltage
OST
= V
OSI
+ V
OSO
/G
Input Offset Voltage ● 20 75 25 100 µV
Input Offset Voltage Hysteresis (Notes 3, 6) 3.0 3.0 µV
Output Offset Voltage ● 180 500 200 600 µV
Output Offset Voltage Hysteresis (Notes 3, 6) 30 30 µV
/T Input Offset Drift (RTI) (Note 3) ● 0.05 0.3 0.06 0.4 µV/°C
/T Output Offset Drift (Note 3) ● 0.8 5 1 6 µV/°C
Input Offset Current ● 110 550 120 700 pA
IOS/T Input Offset Current Drift ● 0.3 0.3 pA/°C
I
B
Input Bias Current ● 180 600 220 800 pA
IB/T Input Bias Current Drift ● 0.5 0.6 pA/°C
V
CM
Input Voltage Range VS = ±2.3V to ±5V ● –VS + 2.1 +VS – 1.3 – VS + 2.1 +VS – 1.3 V
= ±5V to ±18V ● –VS + 2.1 +VS – 1.4 – VS + 2.1 +VS – 1.4 V
V
S
CMRR Common Mode Rejection Ratio 1k Source Imbalance,
VCM = 0V to ±10V
G = 1
G = 10
● 86 90 81 90 dB
● 98 105 95 105 dB
G = 100 ● 114 118 112 118 dB
G = 1000
● 116 133 112 133 dB
PSRR Power Supply Rejection Ratio VS = ±2.3V to ±18V
G = 1 ● 100 112 95 112 dB
G = 10
● 120 125 115 125 dB
G = 100 ● 125 132 120 132 dB
G = 1000
I
V
I
S
OUT
OUT
Supply Current ● 1.1 1.6 1.1 1.6 mA
Output Voltage Swing VS = ±2.3V to ±5V ● –VS + 1.4 +VS – 1.3 – VS + 1.4 +VS – 1.3 V
VS = ±5V to ±18V ● –VS + 1.6 +VS – 1.5 – VS + 1.6 +VS – 1.5 V
Output Current ● 15 20 15 20 mA
SR Slew Rate G = 1, V
V
REF
REF Voltage Range (Note 3) ● –VS + 1.6 +VS – 1.6 – VS + 1.6 +VS – 1.6 V
= ±10V ● 0.55 0.95 0.55 0.95 V/µs
OUT
● 128 140 125 140 dB
The ● denotes specifications that apply over the full specified
temperature range.
Note 1: Absolute Maximum Ratings are those values beyond which the life
of a device may be imparied.
Note 2: Does not include the effect of the external gain resistor R
.
G
Note 3: This parameter is not 100% tested.
Note 4: The LT1167AC/LT1167C are designed, characterized and expected
to meet the industrial temperature limits, but are not tested at –40°C and
85°C. I-grade parts are guaranteed.
Note 5: This parameter is measured in a high speed automatic tester that
does not measure the thermal effects with longer time constants. The
magnitude of these thermal effects are dependent on the package used,
heat sinking and air flow conditions.
Note 6: Hysteresis in offset voltage is created by package stress that
differs depending on whether the IC was previously at a higher or lower
temperature. Offset voltage hysteresis is always measured at 25°C, but
the IC is cycled to 85°C I-grade (or 70°C C-grade) or –40°C I-grade
(0°C C-grade) before successive measurement. 60% of the parts will
pass the typical limit on the data sheet.
Note 7: Typical parameters are defined as the 60% of the yield parameter
distribution.
5
Page 6
LT1167
TEMPERATURE (°C)
–50
GAIN ERROR (%)
–0.20
–0.10
–0.05
0
50
0.20
1167 G06
–0.15
0
–25
75
G = 1
25 100
0.05
0.10
0.15
VS = ±15V
V
OUT
= ±10V
R
L
= 2k
*DOES NOT INCLUDE
TEMPERATURE EFFECTS
OF R
G
G = 10*
G = 1000*
G = 100*
UW
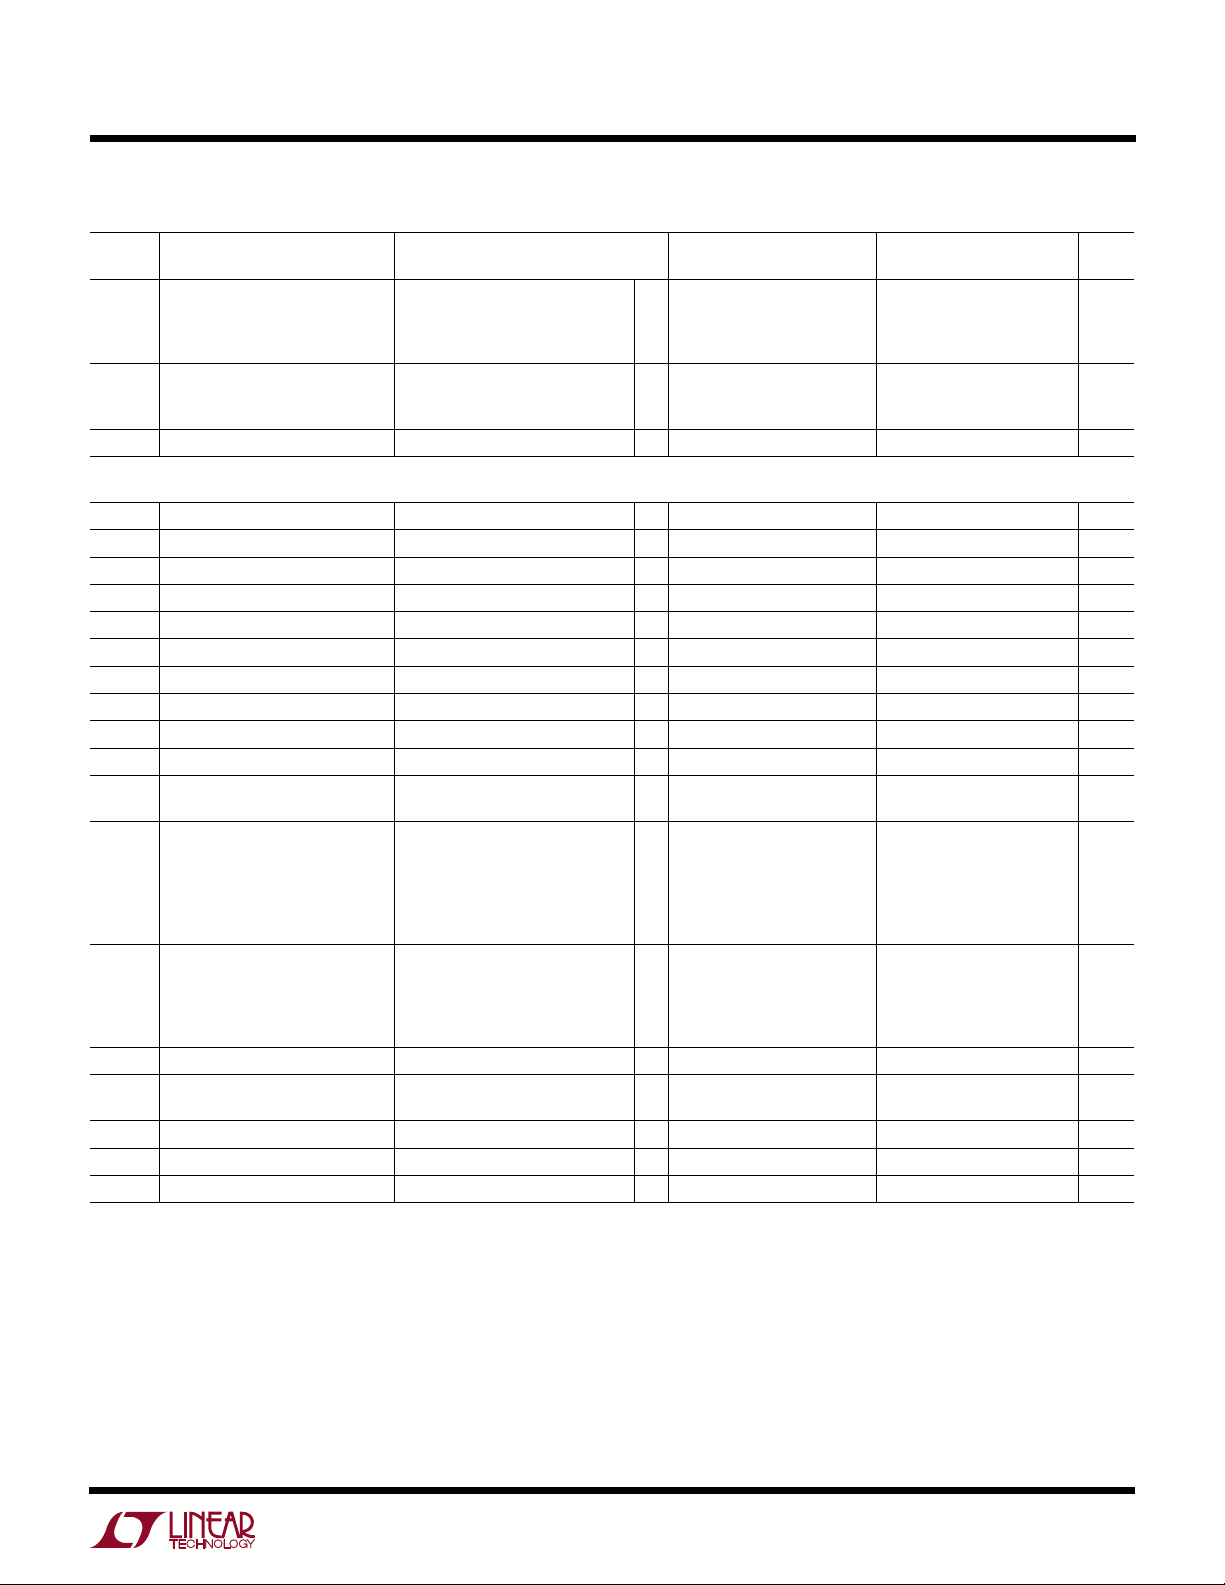
TYPICAL PERFOR A CE CHARACTERISTICS
Gain Nonlinearity, G = 1
NONLINEARITY (1ppm/DIV)
G = 1
R
V
OUTPUT VOLTAGE (2V/DIV)
= 2k
L
= ±10V
OUT
Gain Nonlinearity, G = 1000
NONLINEARITY (100ppm/DIV)
G = 1000
RL = 2k
V
OUTPUT VOLTAGE (2V/DIV)
= ±10V
OUT
1167 G01
1167 G04
Gain Nonlinearity, G = 10
NONLINEARITY (10ppm/DIV)
G = 10
RL = 2k
V
OUTPUT VOLTAGE (2V/DIV)
= ±10V
OUT
Gain Nonlinearity vs Temperature
80
VS = ±15V
= –10V TO 10V
V
OUT
70
= 2k
R
L
60
50
40
30
NONLINEARITY (ppm)
20
10
0
–25 0 50
–50
G = 1000
G = 100
25
TEMPERATURE (°C)
G = 1, 10
75 100 150
1167 G02
1167 G05
Gain Nonlinearity, G = 100
NONLINEARITY (10ppm/DIV)
G = 100
RL = 2k
V
OUTPUT VOLTAGE (2V/DIV)
= ±10V
OUT
Gain Error vs Temperature
1167 G03
6
Distribution of Input
Offset Voltage, TA = –40°C
40
VS = ±15V
G = 1000
35
30
25
20
15
PERCENT OF UNITS (%)
10
5
0
–80
–60 –40 –20 20 40 60
INPUT OFFSET VOLTAGE (µV)
137 N8 (2 LOTS)
165 S8 (3 LOTS)
302 TOTAL PARTS
0
1167 G40
Distribution of Input
Offset Voltage, TA = 25°C
30
VS = ±15V
G = 1000
25
20
15
10
PERCENT OF UNITS (%)
5
0
–60 – 40 –20 0 20 40 60
INPUT OFFSET VOLTAGE (µV)
137 N8 (2 LOTS)
165 S8 (3 LOTS)
302 TOTAL PARTS
1167 G41
Distribution of Input
Offset Voltage, TA = 85°C
40
VS = ±15V
G = 1000
35
30
25
20
15
PERCENT OF UNITS (%)
10
5
0
–80
–60 –40 –20 20 40 60
INPUT OFFSET VOLTAGE (µV)
137 N8 (2 LOTS)
165 S8 (3 LOTS)
302 TOTAL PARTS
0
1167 G42
Page 7

UW
TIME AFTER POWER ON (MINUTES)
0
10
12
S8
N8
14
34
1167 G09
8
6
12 5
4
2
0
CHANGE IN OFFSET VOLTAGE (µV)
VS = ±15V
T
A
= 25°C
G = 1
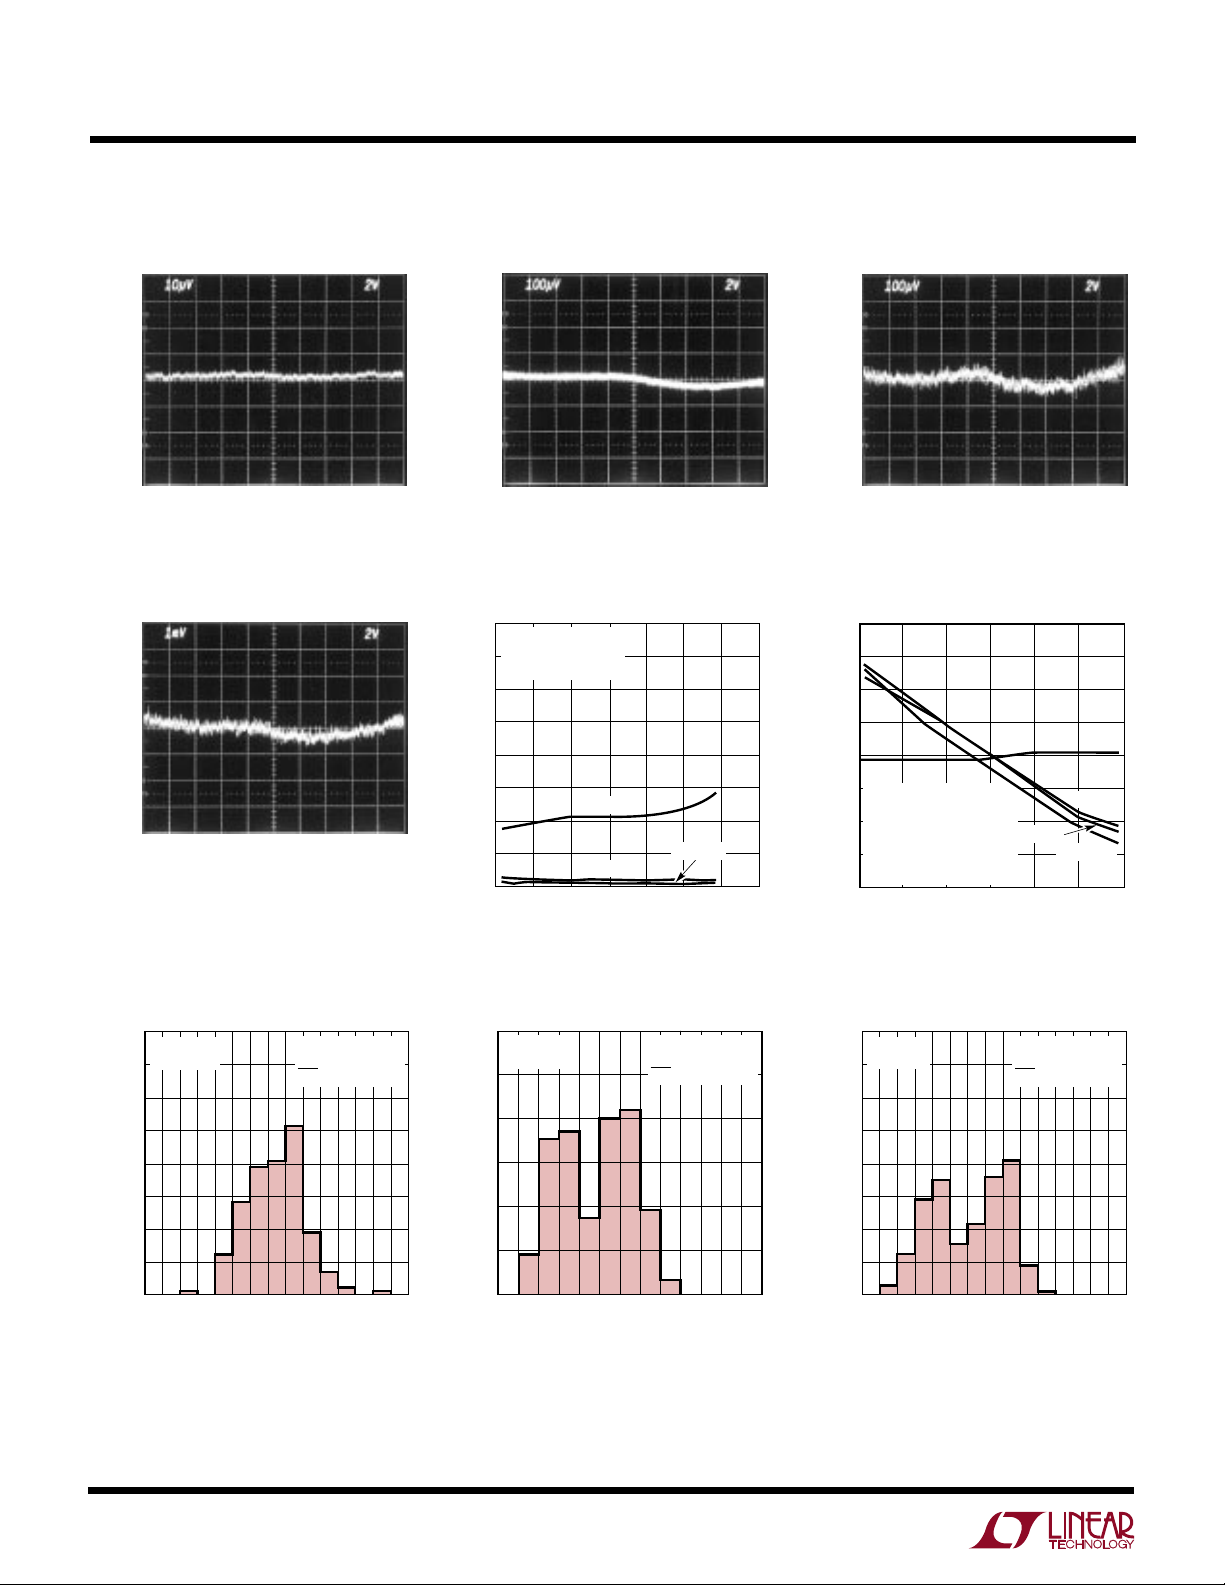
TYPICAL PERFOR A CE CHARACTERISTICS
LT1167
Distribution of Output
Offset Voltage, TA = –40°C
40
137 N8 (2 LOTS)
165 S8 (3 LOTS)
35
302 TOTAL PARTS
30
25
20
15
PERCENT OF UNITS (%)
10
5
0
–400 –300 – 200 –100 0 100 200 300 400
OUTPUT OFFSET VOLTAGE (µV)
Distribution of Input Offset
Voltage Drift
30
VS = ±15V
= –40°C TO 85°C
T
A
25
G = 1000
20
15
10
PERCENT OF UNITS (%)
5
0
–0.4
–0.2 –0.1 0
–0.3
INPUT OFFSET VOLTAGE (µV)
137 N8 (2 LOTS)
165 S8 (3 LOTS)
302 TOTAL PARTS
0.1 0.2 0.3
VS = ±15V
G = 1
1167 G43
1167 G46
Distribution of Output
Offset Voltage, TA = 25°C
30
137 N8 (2 LOTS)
165 S8 (3 LOTS)
25
302 TOTAL PARTS
20
15
10
PERCENT OF UNITS (%)
5
0
– 200–150 – 100 –50 0 50 100 150 200
OUTPUT OFFSET VOLTAGE (µV)
Distribution of Output Offset
Voltage Drift
40
VS = ±15V
= –40°C TO 85°C
T
A
35
G = 1
30
25
20
15
PERCENT OF UNITS (%)
10
5
0
OUTPUT OFFSET VOLTAGE (µV)
137 N8 (2 LOTS)
165 S8 (3 LOTS)
302 TOTAL PARTS
012345–1–2–3–4–5
VS = ±15V
G = 1
1167 G44
1167 G47
Distribution of Output
Offset Voltage, TA = 85°C
40
137 N8 (2 LOTS)
165 S8 (3 LOTS)
35
302 TOTAL PARTS
30
25
20
15
PERCENT OF UNITS (%)
10
5
0
–400 –300 – 200 –100 0 100 200 300 400
OUTPUT OFFSET VOLTAGE (µV)
Warm-Up Drift
VS = ±15V
G = 1
1167 G45
Input Bias Current
50
VS = ±15V
= 25°C
T
A
40
30
20
PERCENT OF UNITS (%)
10
0
–100
270 S8
122 N8
392 TOTAL PARTS
–60
INPUT BIAS CURRENT (pA)
–20
20
Input Bias and Offset Current
Input Offset Current
50
VS = ±15V
= 25°C
T
A
40
30
20
PERCENT OF UNITS (%)
10
0
–60
60
100
1167 G10
–100
–20
INPUT OFFSET CURRENT (pA)
270 S8
122 N8
392 TOTAL PARTS
20
60
1167 G11
100
vs Temperature
500
VS = ±15V
400
300
200
100
–100
–200
–300
–400
INPUT BIAS AND OFFSET CURRENT (pA)
–500
= 0V
V
CM
0
–50–75
–25 25
0
TEMPERATURE (°C)
50
I
OS
I
B
125
100
75
1167 G12
7
Page 8

LT1167
FREQUENCY (Hz)
0.1
NEGATIVE POWER SUPPLY REJECTION RATIO (dB)
60
80
100
100
10k
1167 G15
40
20
0
110 1k
120
140
160
100k
G = 1000
G = 100
G = 10
G = 1
V+ = 15V
T
A
= 25°C
TIME (SEC)
0
NOISE VOLTAGE (0.2µV/DIV)
8
1167 G21
2
4
5
10
6
1
3
9
7
VS = ±15V
T
A
= 25°C
UW
TYPICAL PERFOR A CE CHARACTERISTICS
Input Bias Current
vs Common Mode Input Voltage
500
400
300
200
100
0
–100
–200
INPUT BIAS CURRENT (pA)
–300
–400
–500
–12 12
–15
COMMON MODE INPUT VOLTAGE (V)
–9
–6
85°C
0°C
–40°C
–3
0
3
70°C
25°C
6
9
15
1167 G13
Common Mode Rejection Ratio
vs Frequency
160
G = 1000
140
G = 100
G = 10
120
G = 1
100
80
60
40
20
COMMON MODE REJECTION RATIO (dB)
0
110 1k
0.1
Positive Power Supply Rejection
Ratio vs Frequency Gain vs Frequency
160
140
G = 10
120
G = 1
100
80
60
40
20
0
POSITIVE POWER SUPPLY REJECTION RATIO (dB)
0.1
G = 100
110 1k
100
FREQUENCY (Hz)
V– = –15V
= 25°C
T
A
G = 1000
10k
100k
1167 G16
60
50
40
30
20
GAIN (dB)
10
0
VS = ±15V
–10
= 25°C
T
A
–20
0.1
0.01 1 10 1000
100
FREQUENCY (Hz)
G = 1000
G = 100
G = 10
G = 1
FREQUENCY (kHz)
VS = ±15V
= 25°C
T
A
1k SOURCE
IMBALANCE
10k
1167 G14
100
1167 G17
100k
Negative Power Supply Rejection
Ratio vs Frequency
Supply Current vs Supply Voltage
1.50
1.25
1.00
SUPPLY CURRENT (mA)
0.75
0.50
0
5
10
SUPPLY VOLTAGE (±V)
15
85°C
25°C
–40°C
20
1167 G18
Voltage Noise Density
vs Frequency
1000
VS = ±15V
= 25°C
T
A
1/f
= 10Hz
100
10
VOLTAGE NOISE DENSITY (nV√Hz)
0
1
8
CORNER
1/f
= 9Hz
CORNER
1/f
= 7Hz
CORNER
10 100 1k 100k10k
FREQUENCY (Hz)
GAIN = 1
GAIN = 10
GAIN = 100, 1000
BW LIMIT
GAIN = 1000
1167 G19
0.1Hz to 10Hz Noise Voltage,
G = 1
VS = ±15V
= 25°C
T
A
NOISE VOLTAGE (2µV/DIV)
2
1
0
3
5
4
TIME (SEC)
6
7
0.1Hz to 10Hz Noise Voltage, RTI
G = 1000
8
10
9
1167 G20
Page 9

UW
TIME FROM OUTPUT SHORT TO GROUND (MINUTES)
0
–50
(SINK) (SOURCE)
OUTPUT CURRENT (mA)
–40
–20
–10
0
50
20
1
2
1167 G24
–30
30
40
10
3
TA = –40°C
VS = ±15V
TA = –40°C
T
A
= 25°C
T
A
= 85°C
TA = 85°C
TA = 25°C
TYPICAL PERFOR A CE CHARACTERISTICS
Current Noise Density
vs Frequency
1000
100
CURRENT NOISE DENSITY (fA/√Hz)
VS = ±15V
= 25°C
T
A
R
S
0.1Hz to 10Hz Current Noise
VS = ±15V
= 25°C
T
A
CURRENT NOISE (5pA/DIV)
LT1167
Short-Circuit Current vs Time
10
1
10 100 1000
FREQUENCY (Hz)
Overshoot vs Capacitive Load
100
VS = ±15V
90
80
70
60
40
OVERSHOOT (%)
30
20
10
= ±50mV
V
OUT
=
∞
R
L
50
AV = 1
AV = 10
AV ≥ 100
0
10
100 1000 10000
CAPACITIVE LOAD (pF)
Output Impedance vs Frequency
1000
VS = ±15V
= 25°C
T
A
G = 1 TO 1000
100
1167 G22
1167 G25
2
1
0
3
5
4
TIME (SEC)
6
7
8
Large-Signal Transient Response
5V/DIV
G = 1
= ±15V
V
S
R
= 2k
L
C
= 60pF
L
10µs/DIV
Large-Signal Transient Response
9
1167 G23
10
1167 G28
Small-Signal Transient Response
20mV/DIV
G = 1
VS = ±15V
R
= 2k
L
C
= 60pF
L
10µ s/DIV
Small-Signal Transient Response
1167 G29
10
1
OUTPUT IMPEDANCE (Ω)
0.1
1
10 100 1000
FREQUENCY (kHz)
1167 G26
5V/DIV
G = 10
V
S
R
L
C
L
= ±15V
= 2k
= 60pF
10µs/DIV
1167 G31
20mV/DIV
G = 10
V
= ±15V
S
= 2k
R
L
C
= 60pF
L
10µs/DIV
1167 G32
9
Page 10

LT1167
OUTPUT CURRENT (mA)
OUTPUT VOLTAGE SWING (V)
(REFERRED TO SUPPLY VOLTAGE)
+V
S
+VS – 0.5
+V
S
– 1.0
+V
S
– 1.5
+V
S
– 2.0
–V
S
+ 2.0
–V
S
+ 1.5
–V
S
+ 1.0
–V
S
+ 0.5
–V
S
0.01 1 10 100
1167 G39
0.1
VS = ±15V
85°C
25°C
–40°C
SOURCE
SINK
UW
TYPICAL PERFOR A CE CHARACTERISTICS
Undistorted Output Swing
vs Frequency
35
G = 10, 100, 1000
30
G = 1
25
VS = ±15V
= 25°C
T
A
Large-Signal Transient Response
Small-Signal Transient Response
20
15
10
5
PEAK-TO-PEAK OUTPUT SWING (V)
0
1
Settling Time vs Gain
1000
VS = ±15V
= 25°C
T
A
∆V
OUT
1mV = 0.01%
100
10
SETTLING TIME (µs)
1
1
Settling Time vs Step Size
10
VS = ±15
8
G = 1
= 25°C
T
A
6
= 30pF
C
L
= 1k
R
4
L
2
0
–2
OUTPUT STEP (V)
–4
–6
–8
–10
311
2
10
10 100 1000
FREQUENCY (kHz)
= 10V
10 100 1000
GAIN (dB)
TO 0.1%
TO 0.01%
0V
0V
TO 0.01%
TO 0.1%
4
5
SETTLING TIME (µs)
8
6
9
7
1167 G27
1167 G30
5V/DIV
G = 100
V
= ±15V
S
= 2k
R
L
C
= 60pF
L
10µs/DIV
Large-Signal Transient Response
5V/DIV
G = 1000
V
= ±15V
S
R
= 2k
L
= 60pF
C
L
50µ s/DIV
1167 G34
1167 G37
20mV/DIV
G = 100
VS = ±15V
R
= 2k
L
= 60pF
C
L
10µs/DIV
Small-Signal Transient Response
20mV/DIV
G = 1000
V
= ±15V
S
R
= 2k
L
= 60pF
C
L
50µs/DIV
1167 G35
1167 G38
Output Voltage Swing
Slew Rate vs Temperature
1.8
VS = ±15V
= ±10V
V
OUT
G = 1
1.6
V
OUT
V
OUT
10
1167 G33
1.4
+SLEW
1.2
SLEW RATE (V/µs)
1.0
0.8
12
–50 –25
–SLEW
0
TEMPERATURE (°C)
50
25
100
125
1167 G36
75
vs Load Current
Page 11

BLOCK DIAGRAM
LT1167
W
–IN
+IN
+
V
R3
400Ω
2
–
V
1
R
G
8
R
G
3
V
–
R4
400Ω
+
V
Q1
Q2
VB
+
A1
–
C1
R1
24.7k
VB
+
A2
–
C2
R2
24.7k
R5
10k
R7
10k
R6
10k
–
A3
+
–
V
R8
10k
–
V
DIFFERENCE AMPLIFIER STAGEPREAMP STAGE
6
5
7
4
OUTPUT
REF
+
V
–
V
1167 F01
Figure 1. Block Diagram
U
THEORY OF OPERATIO
The LT1167 is a modified version of the three op amp
instrumentation amplifier. Laser trimming and monolithic
construction allow tight matching and tracking of circuit
parameters over the specified temperature range. Refer to
the block diagram (Figure 1) to understand the following
circuit description. The collector currents in Q1 and Q2 are
trimmed to minimize offset voltage drift, thus assuring a
high level of performance. R1 and R2 are trimmed to an
absolute value of 24.7k to assure that the gain can be set
accurately (0.05% at G = 100) with only one external
resistor RG. The value of RG in parallel with R1 (R2)
determines the transconductance of the preamp stage. As
RG is reduced for larger programmed gains, the transconductance of the input preamp stage increases to that of the
input transistors Q1 and Q2. This increases the open-loop
gain when the programmed gain is increased, reducing
the input referred gain related errors and noise. The input
voltage noise at gains greater than 50 is determined only
by Q1 and Q2. At lower gains the noise of the difference
amplifier and preamp gain setting resistors increase the
noise. The gain bandwidth product is determined by C1,
C2 and the preamp transconductance which increases
with programmed gain. Therefore, the bandwidth does not
drop proportional to gain.
The input transistors Q1 and Q2 offer excellent matching,
which is inherent in NPN bipolar transistors, as well as
picoampere input bias current due to superbeta processing. The collector currents in Q1 and Q2 are held constant
due to the feedback through the Q1-A1-R1 loop and
Q2-A2-R2 loop which in turn impresses the differential
input voltage across the external gain set resistor RG.
Since the current that flows through RG also flows through
R
1 and R2, the ratios provide a gained-up differential volt-
age, G = (R1 + R2)/RG, to the unity-gain difference
amplifier
A3. The common mode voltage is removed by A3, resulting in a single-ended output voltage referenced to the
voltage on the REF pin. The resulting gain equation is:
V
OUT
– V
REF
= G(V
IN
+
– V
IN
–
)
where:
G = (49.4kΩ/RG) + 1
solving for the gain set resistor gives:
RG = 49.4kΩ/(G – 1)
11
Page 12

LT1167
THEORY OF OPERATIO
U
Input and Output Offset Voltage
The offset voltage of the LT1167 has two components: the
output offset and the input offset. The total offset voltage
referred to the input (RTI) is found by dividing the output
offset by the programmed gain (G) and adding it to the
input offset. At high gains the input offset voltage dominates, whereas at low gains the output offset voltage
dominates. The total offset voltage is:
Total input offset voltage (RTI)
= input offset + (output offset/G)
Total output offset voltage (RTO)
= (input offset • G) + output offset
Reference Terminal
The reference terminal is one end of one of the four 10k
resistors around the difference amplifier. The output voltage of the LT1167 (Pin 6) is referenced to the voltage on
the reference terminal (Pin 5). Resistance in series with
the REF pin must be minimized for best common mode
rejection. For example, a 2Ω resistance from the REF pin
to ground will not only increase the gain error by 0.02%
but will lower the CMRR to 80dB.
Output Offset Trimming
The LT1167 is laser trimmed for low offset voltage so that
no external offset trimming is required for most applications. In the event that the offset needs to be adjusted, the
circuit in Figure 2 is an example of an optional offset adjust
circuit. The op amp buffer provides a low impedance to the
REF pin where resistance must be kept to minimum for
best CMRR and lowest gain error.
–
–IN
+IN
2
1
R
Figure 2. Optional Trimming of Output Offset Voltage
G
8
+
3
LT1167
REF
5
±10mV
ADJUSTMENT RANGE
6
OUTPUT
–
2
1
1/2
LT1112
3
+
10k
+
V
–
V
10mV
100Ω
100Ω
–10mV
1167 F02
Single Supply Operation
For single supply operation, the REF pin can be at the same
potential as the negative supply (Pin 4) provided the
output of the instrumentation amplifier remains inside the
specified operating range and that one of the inputs is at
least 2.5V above ground. The barometer application on the
front page of this data sheet is an example that satisfies
these conditions. The resistance Rb from the bridge transducer to ground sets the operating current for the bridge
and also has the effect of raising the input common mode
voltage. The output of the LT1167 is always inside the
specified range since the barometric pressure rarely goes
low enough to cause the output to rail (30.00 inches of Hg
corresponds to 3.000V). For applications that require the
output to swing at or below the REF potential, the voltage
on the REF pin can be level shifted. An op amp is used to
buffer the voltage on the REF pin since a parasitic series
resistance will degrade the CMRR. The application in the
back of this data sheet, Four Digit Pressure Sensor, is an
example.
Input Bias Current Return Path
The low input bias current of the LT1167 (350pA) and the
high input impedance (200GΩ) allow the use of high
impedance sources without introducing additional offset
voltage errors, even when the full common mode range is
required. However, a path must be provided for the input
bias currents of both inputs when a purely differential
signal is being amplified. Without this path the inputs will
float to either rail and exceed the input common mode
range of the LT1167, resulting in a saturated input stage.
Figure 3 shows three examples of an input bias current
path. The first example is of a purely differential signal
source with a 10kΩ input current path to ground. Since the
impedance of the signal source is low, only one resistor is
needed. Two matching resistors are needed for higher
impedance signal sources as shown in the second
example. Balancing the input impedance improves both
common mode rejection and DC offset. The need for input
resistors is eliminated if a center tap is present as shown
in the third example.
12
Page 13

THEORY OF OPERATIO
LT1167
U
–
MICROPHONE,
THERMOCOUPLE
10k
R
G
LT1167
+
Figure 3. Providing an Input Common Mode Current Path
U
HYDROPHONE,
ETC
200k
WUU
APPLICATIONS INFORMATION
The LT1167 is a low power precision instrumentation
amplifier that requires only one external resistor to accurately set the gain anywhere from 1 to 1000. The output
can handle capacitive loads up to 1000pF in any gain
configuration and the inputs are protected against ESD
strikes up to 13kV (human body).
Input Protection
The LT1167 can safely handle up to ±20mA of input
current in an overload condition. Adding an external 5k
input resistor in series with each input allows DC input
fault voltages up to ±100V and improves the ESD immunity to 8kV (contact) and 15kV (air discharge), which is the
IEC 1000-4-2 level 4 specification. If lower value input
resistors are needed, a clamp diode from the positive
supply to each input will maintain the IEC 1000-4-2
specification to level 4 for both air and contact discharge.
V
CC
J1
2N4393
R
IN
R
IN
V
CC
Figure 4. Input Protection
OPTIONAL FOR HIGHEST
ESD PROTECTION
J2
2N4393
R
G
V
CC
+
LT1167
–
V
EE
OUT
REF
1167 F04
R
200k
–
LT1167
G
+
CENTER-TAP PROVIDES
BIAS CURRENT RETURN
–
R
LT1167
G
+
1167 F03
A 2N4393 drain/source to gate is a good low leakage diode
for use with 1k resistors, see Figure 4. The input resistors
should be carbon and not metal film or carbon film.
RFI Reduction
In many industrial and data acquisition applications,
instrumentation amplifiers are used to accurately amplify
small signals in the presence of large common mode
voltages or high levels of noise. Typically, the sources of
these very small signals (on the order of microvolts or
millivolts) are sensors that can be a significant distance
from the signal conditioning circuit. Although these sensors may be connected to signal conditioning circuitry,
using shielded or unshielded twisted-pair cabling, the cabling may act as antennae, conveying very high frequency
interference directly into the input stage of the LT1167.
The amplitude and frequency of the interference can have
an adverse effect on an instrumentation amplifier’s input
stage by causing an unwanted DC shift in the amplifier’s
input offset voltage. This well known effect is called RFI
rectification and is produced when out-of-band interference is coupled (inductively, capacitively or via radiation)
and rectified by the instrumentation amplifier’s input transistors. These transistors act as high frequency signal
detectors, in the same way diodes were used as RF
envelope detectors in early radio designs. Regardless of
the type of interference or the method by which it is
coupled into the circuit, an out-of-band error signal appears in series with the instrumentation amplifier’s inputs.
13
Page 14
LT1167
U
WUU
APPLICATIONS INFORMATION
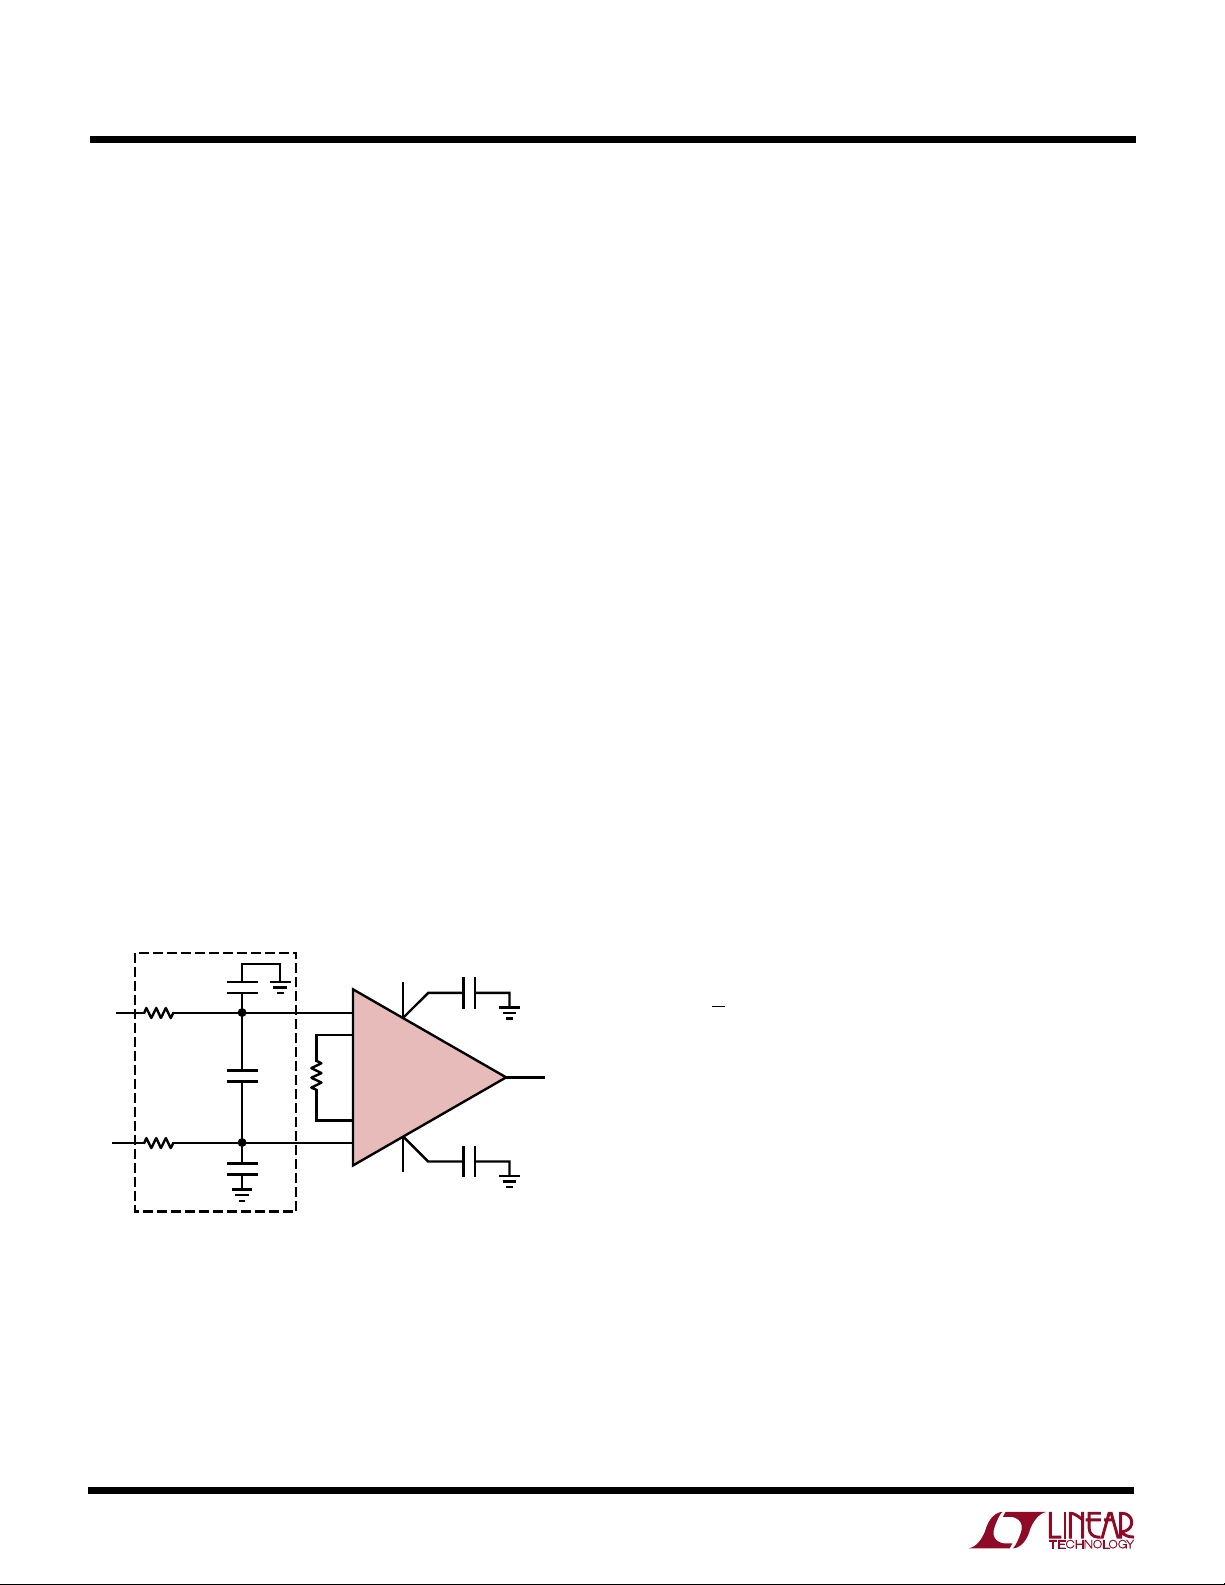
To significantly reduce the effect of these out-of-band
signals on the input offset voltage of instrumentation
amplifiers, simple lowpass filters can be used at the
inputs. This filter should be located very close to the input
pins of the circuit. An effective filter configuration is
illustrated in Figure 5, where three capacitors have been
added to the inputs of the LT1167. Capacitors C
C
form lowpass filters with the external series resis-
XCM2
tors R
to any out-of-band signal appearing on each of
S1, 2
the input traces. Capacitor CXD forms a filter to reduce any
unwanted signal that would appear across the input traces.
An added benefit to using CXD is that the circuit’s AC
common mode rejection is not degraded due to common
mode capacitive imbalance. The differential mode and
common mode time constants associated with the capacitors are:
t
DM(LPF)
t
CM(LPF)
= (2)(RS)(CXD)
= (R
S1, 2
)(C
XCM1, 2
)
Setting the time constants requires a knowledge of the
frequency, or frequencies of the interference. Once this
frequency is known, the common mode time constants
can be set followed by the differential mode time constant.
To avoid any possibility of inadvertently affecting the
+
C
R
XCM1
S1
100pF
1.6k
+
IN
C
XD
10pF
R
S2
1.6k
–
IN
C
XCM2
100pF
EXTERNAL RFI
FILTER
Figure 5. Adding a Simple RC Filter at the Inputs to an
Instrumentation Amplifier is Effective in Reducing Rectification
of High Frequency Out-of-Band Signals
R
G
V
+
LT1167
–
–
V
XCM1
and
V
OUT
1167 F05
signal to be processed, set the common mode time
constant an order of magnitude (or more) larger than the
differential mode time constant. To avoid any possibility of
common mode to differential mode signal conversion,
match the common mode time constants to 1% or better.
If the sensor is an RTD or a resistive strain gauge, then the
series resistors R
can be omitted, if the sensor is in
S1, 2
proximity to the instrumentation amplifier.
“Roll Your Own”—Discrete vs Monolithic LT1167
Error Budget Analysis
The LT1167 offers performance superior to that of “roll
your own” three op amp discrete designs. A typical application that amplifies and buffers a bridge transducer’s
differential output is shown in Figure 6. The amplifier, with
its gain set to 100, amplifies a differential, full-scale output
voltage of 20mV over the industrial range. To make the
comparison challenging, the low cost version of the LT1167
will be compared to a discrete instrumentation amp made
with the A grade of one of the best precision quad op amps,
the LT1114A. The LT1167C outperforms the discrete
amplifier that has lower VOS, lower IB and comparable V
OS
drift. The error budget comparison in Table 1 shows how
various errors are calculated and how each error affects
the total error budget. The table shows the greatest
differences between the discrete solution and the LT1167
are input offset voltage and CMRR. Note that for the
discrete solution, the noise voltage specification is multiplied by √2 which is the RMS sum of the uncorelated noise
of the two input amplifiers. Each of the amplifier errors is
referenced to a full-scale bridge differential voltage of
20mV. The common mode range of the bridge is 5V. The
LT1114 data sheet provides offset voltage, offset voltage
drift and offset current specifications for the matched op
amp pairs used in the error-budget table. Even with an
excellent matching op amp like the LT1114, the discrete
solution’s total error is significantly higher than the
LT1167’s total error. The LT1167 has additional advantages over the discrete design, including lower component cost and smaller size.
14
Page 15

LT1167
U
WUU
APPLICATIONS INFORMATION
10V
350Ω
350Ω
PRECISION BRIDGE TRANSDUCER
350Ω
350Ω
+
RG
499Ω
LT1167C
–
LT1167 MONOLITHIC
INSTRUMENTATION AMPLIFIER
G = 100, R
SUPPLY CURRENT = 1.3mA MAX
= ±10ppm TC
G
REF
+
1/4
LT1114A
–
10k**
100Ω**
10k**
–
1/4
LT1114A
+
“ROLL YOUR OWN” INST AMP, G = 100
* 0.02 RESISTOR MATCH, 3ppm/°C TRACKING
** DISCRETE 1% RESISTOR, ±100ppm/°C TC
100ppm TRACKING
SUPPLY CURRENT = 1.35mA FOR 3 AMPLIFIERS
10k*
10k*
Figure 6. “Roll Your Own” vs LT1167
Table 1. “Roll Your Own” vs LT1167 Error Budget
“ROLL YOUR OWN”’ CIRCUIT
ERROR SOURCE LT1167C CIRCUIT CALCULATION CALCULATION LT1167C “ROLL YOUR OWN”
Absolute Accuracy at TA = 25°C
Input Offset Voltage, µV60µV/20mV 100µV/20mV 3000 5000
Output Offset Voltage, µV (300µV/100)/20mV [(60µV)(2)/100]/20mV 150 60
Input Offset Current, nA [(450pA)(350/2)Ω]/20mV [(450pA)(350Ω)/2]/20mV 4 4
CMR, dB 110dB→[(3.16ppm)(5V)]/20mV [(0.02% Match)(5V)]/20mV 790 500
Total Absolute Error 3944 5564
ERROR, ppm OF FULL SCALE
–
1/4
LT1114A
+
10k*
10k*
1167 F06
Drift to 85
Gain Drift, ppm/°C (50ppm + 10ppm)(60°C) (100ppm/°C Track)(60°C) 3600 6000
Input Offset Voltage Drift, µV/°C [(0.4µV/°C)(60°C)]/20mV [(1.6µV/°C)(60°C)]/20mV 1200 4800
Output Offset Voltage Drift, µV/°C[6µV/°C)(60°C)]/100/20mV [(1.1µV/°C)(2)(60°C)]/100/20mV 180 66
Resolution
Gain Nonlinearity, ppm of Full Scale 15ppm 10ppm 15 10
Typ 0.1Hz to 10Hz Voltage Noise, µV
G = 100, VS = ±15V
All errors are min/max and referred to input.
Current Source
Figure 7 shows a simple, accurate, low power programmable current source. The differential voltage across Pins
2 and 3 is mirrored across RG. The voltage across RG is
amplified and applied across RX, defining the output
°
C
Total Drift Error 4980 10866
P-P
0.28µV
/20mV (0.3µV
P-P
)(√2)/20mV 14 21
P-P
Total Resolution Error 29 31
Grand Total Error 8953 16461
current. The 50µA bias current flowing from Pin 5 is
buffered by the LT1464 JFET operational amplifier. This
has the effect of improving the resolution of the current
source to 3pA, which is the maximum IB of the LT1464A.
Replacing RG with a programmable resistor greatly
increases the range of available output currents.
15
Page 16

LT1167
U
WUU
APPLICATIONS INFORMATION
V
LT1167
4
–V
S
R
X
S
7
R
1/2
LT1464
X
V
X
I
2
–
3
+
L
LOAD
1167 F07
6
REF
5
1
3
+IN
–IN
+
8
R
G
1
2
–
[(+IN) – (–IN)]G
VX
= =
I
L
R
X
49.4kΩ
G = + 1
R
G
Figure 7. Precision Voltage-to-Current Converter
Nerve Impulse Amplifier
The LT1167’s low current noise makes it ideal for high
source impedance EMG monitors. Demonstrating the
LT1167’s ability to amplify low level signals, the circuit in
Figure 8 takes advantage of the amplifier’s high gain and
low noise operation. This circuit amplifies the low level
nerve impulse signals received from a patient at Pins 2
and 3. RG and the parallel combination of R3 and R4 set
a gain of ten. The potential on LT1112’s Pin 1 creates a
ground for the common mode signal. C1 was chosen to
maintain the stability of the patient ground. The LT1167’s
high CMRR ensures that the desired differential signal is
amplified and unwanted common mode signals are attenuated. Since the DC portion of the signal is not
important, R6 and C2 make up a 0.3Hz highpass filter.
The AC signal at LT1112’s Pin 5 is amplified by a gain of
101 set by (R7/R8) +1. The parallel combination of C3
and R7 form a lowpass filter that decreases this gain at
frequencies above 1kHz. The ability to operate at ±3V on
0.9mA of supply current makes the LT1167 ideal for
battery-powered applications. Total supply current for
this application is 1.7mA. Proper safeguards, such as
isolation, must be added to this circuit to protect the
patient from possible harm.
Low IB Favors High Impedance Bridges,
Lowers Dissipation
The LT1167’s low supply current, low supply voltage
operation and low input bias currents optimize it for
battery-powered applications. Low overall power dissipation necessitates using higher impedance bridges. The
single supply pressure monitor application (Figure 9)
shows the LT1167 connected to the differential output of
a 3.5k bridge. The bridge’s impedance is almost an order
of magnitude higher than that of the bridge used in the
error-budget table. The picoampere input bias currents
keep the error caused by offset current to a negligible
level. The LT1112 level shifts the LT1167’s reference pin
and the ADC’s analog ground pins above ground. The
LT1167’s and LT1112’s combined power dissipation is
still less than the bridge’s. This circuit’s total supply
current is just 2.8mA.
16
+IN
PATIENT
GROUND
–IN
PATIENT/CIRCUIT
PROTECTION/ISOLATION
C1
0.01µF
R2
1M
R1
12k
–
1
1/2
LT1112
+
3V
3
8
R3
30k
R
G
6k
R4
30k
2
3
1
2
AV = 101
POLE AT 1kHz
+
–
LT1167
G = 10
4
–3V
7
6
5
C2
0.47µF
0.3Hz
HIGHPASS
R6
1M
R8
100Ω
3V
5
6
+
LT1112
–
1/2
–3V
C3
15nF
8
7
4
R7
10k
OUTPUT
1V/mV
1167 F08
Figure 8. Nerve Impulse Amplifier
Page 17

LT1167
U
WUU
APPLICATIONS INFORMATION
5V
3.5k
3.5k
1
3.5k
G = 200
249Ω
3.5k
3
+
8
LT1167
1
2
–
4
Figure 9. Single Supply Pressure Monitor
BI TECHNOLOGIES
67-8-3 R40KQ
(0.02% RATIO MATCH)
7
6
5
40k
20k
40k
3
+
1/2
LT1112
2
–
1
REF
IN
LTC
AGND
ADC
®
1286
DIGITAL
DATA
OUTPUT
1167 F09
TYPICAL APPLICATION
–IN
+IN
U
AC Coupled Instrumentation Amplifier
2
–
1
R
G
LT1167
8
3
+
REF
5
1
6
C1
0.3µF
1/2
LT1112
–
2
+
3
R1
500k
OUTPUT
f
–3dB
=
(2π)(R1)(C1)
= 1.06Hz
1
1167 TA04
17
Page 18

LT1167
PACKAGE DESCRIPTION
U
Dimensions in inches (millimeters) unless otherwise noted.
N8 Package
8-Lead PDIP (Narrow 0.300)
(LTC DWG # 05-08-1510)
0.400*
(10.160)
MAX
0.255 ± 0.015*
(6.477 ± 0.381)
876
5
12
0.300 – 0.325
(7.620 – 8.255)
0.065
(1.651)
0.009 – 0.015
(0.229 – 0.381)
+0.035
0.325
–0.015
+0.889
8.255
()
–0.381
*THESE DIMENSIONS DO NOT INCLUDE MOLD FLASH OR PROTRUSIONS.
MOLD FLASH OR PROTRUSIONS SHALL NOT EXCEED 0.010 INCH (0.254mm)
TYP
0.100 ± 0.010
(2.540 ± 0.254)
0.045 – 0.065
(1.143 – 1.651)
3
4
0.130 ± 0.005
(3.302 ± 0.127)
0.125
(3.175)
MIN
0.018 ± 0.003
(0.457 ± 0.076)
0.020
(0.508)
MIN
N8 1197
18
Page 19

PACKAGE DESCRIPTION
U
Dimensions in inches (millimeters) unless otherwise noted.
S8 Package
8-Lead Plastic Small Outline (Narrow 0.150)
(LTC DWG # 05-08-1610)
0.189 – 0.197*
(4.801 – 5.004)
7
8
5
6
LT1167
0.228 – 0.244
(5.791 – 6.197)
0.010 – 0.020
(0.254 – 0.508)
0.008 – 0.010
(0.203 – 0.254)
*
DIMENSION DOES NOT INCLUDE MOLD FLASH. MOLD FLASH
SHALL NOT EXCEED 0.006" (0.152mm) PER SIDE
**
DIMENSION DOES NOT INCLUDE INTERLEAD FLASH. INTERLEAD
FLASH SHALL NOT EXCEED 0.010" (0.254mm) PER SIDE
× 45°
0°– 8° TYP
0.016 – 0.050
0.406 – 1.270
0.053 – 0.069
(1.346 – 1.752)
0.014 – 0.019
(0.355 – 0.483)
0.150 – 0.157**
(3.810 – 3.988)
1
3
2
4
0.004 – 0.010
(0.101 – 0.254)
0.050
(1.270)
TYP
SO8 0996
Information furnished by Linear Technology Corporation is believed to be accurate and reliable.
However, no responsibility is assumed for its use. Linear Technology Corporation makes no representation that the interconnection of its circuits as described herein will not infringe on existing patent rights.
19
Page 20

LT1167
TYPICAL APPLICATION
9V
U
4-Digit Pressure Sensor
392k
LT1634CCZ-1.25
R8
3
+
1
2
1/4
LT1114
2
–
0.2% ACCURACY AT ROOM TEMP
1.2% ACCURACY AT 0°C TO 60°C
VOLTS
INCHES Hg
2.800
3.000
3.200
4
11
28.00
30.00
32.00
1
4
R9
1k
2
6
LUCAS NOVA SENOR
NPC-1220-015A-3L
–
5k
5k
R
5k
5k
SET
5
9V
1
825Ω
12Ω
3
+
2
–
1
R1
R2
8
3
+
12
+
1/4
LT1114
13
–
R3
51k
LT1167
G = 60
4
R4
100k
7
6
5
10
+
1/4
LT1114
9
–
14
R7
R5
100k
R6
50k
C1
1µF
180k
TO
4-DIGIT
DVM
8
1167 TA03
RELATED PARTS
PART NUMBER DESCRIPTION COMMENTS
LTC1100 Precision Chopper-Stabilized Instrumentation Amplifier Best DC Accuracy
LT1101 Precision, Micropower, Single Supply Instrumentation Amplifier Fixed Gain of 10 or 100, IS < 105µA
LT1102 High Speed, JFET Instrumentation Amplifier Fixed Gain of 10 or 100, 30V/µs Slew Rate
LTC®1418 14-Bit, Low Power, 200ksps ADC with Serial and Parallel I/O Single Supply 5V or ±5V Operation, ±1.5LSB INL
and ±1LSB DNL Max
LT1460 Precision Series Reference Micropower; 2.5V, 5V, 10V Versions; High Precision
LT1468 16-Bit Accurate Op Amp, Low Noise Fast Settling 16-Bit Accuracy at Low and High Frequencies, 90MHz GBW,
22V/µs, 900ns Settling
LTC1562 Active RC Filter Lowpass, Bandpass, Highpass Responses; Low Noise,
Low Distortion, Four 2nd Order Filter Sections
LTC1605 16-Bit, 100ksps, Sampling ADC Single 5V Supply, Bipolar Input Range: ±10V,
Power Dissipation: 55mW Typ
1167f LT/GP 1298 4K • PRINTED IN USA
LINEAR TECHNOLOGY CORPORATION 1998
20
Linear Technology Corporation
1630 McCarthy Blvd., Milpitas, CA 95035-7417
(408) 432-1900 ● FAX: (408) 434-0507
●
www.linear-tech.com
 Loading...