

Page 1
PROJECT INFORMATION SUPPLIED BY
Text and illustrations courtesy of Silicon Chip
I
T’S HARD TO BELIEVE that it’s
already eight years since my first ESR
(equivalent series resistance) meter was
described – in the January 1996 edition
of “Electronics Australia”. It was
designed on a 386 PC!
The ESR meter allowed service technicians to quickly and easily identify
defective electrolytic capacitors while
they were still in circuit. It measures a
characteristic of electrolytic capacitors
which is very important: the “equivalent
series resistance” or ESR.
Back then, no-one (including myself)
expected that a meter designed to measure a capacitor characteristic hardly anyone had ever heard of would become
popular in Australia, let alone overseas.
However, we didn’t consider the explosive growth of the Internet. Thanks to
people discussing it on various newsgroups and by email, about 12,000 ESR
meter kits have now been sold and sales
(mainly outside Australia) continue to be
strong.
Over those eight years, both Dick
Smith Electronics (which sells the kit)
and the author have received many suggestions from constructors on improving
the ESR meter kit – particularly on making the construction easier. This upgraded version is the result and incorporates
many of those ideas. As before, it will be
available as a complete kit from DSE.
What’s ESR?
Before taking a look at what’s changed
in this “Mk2” version of the ESR meter,
let’s take a look at what an ESR meter
does. First, we need to get into a bit of
boring theory to understand how electrolytic capacitors (which I’ll refer to
simply as “electrolytics” from here on)
are constructed and work. This is neces-
sary to understand why they cause so
many electronic faults.
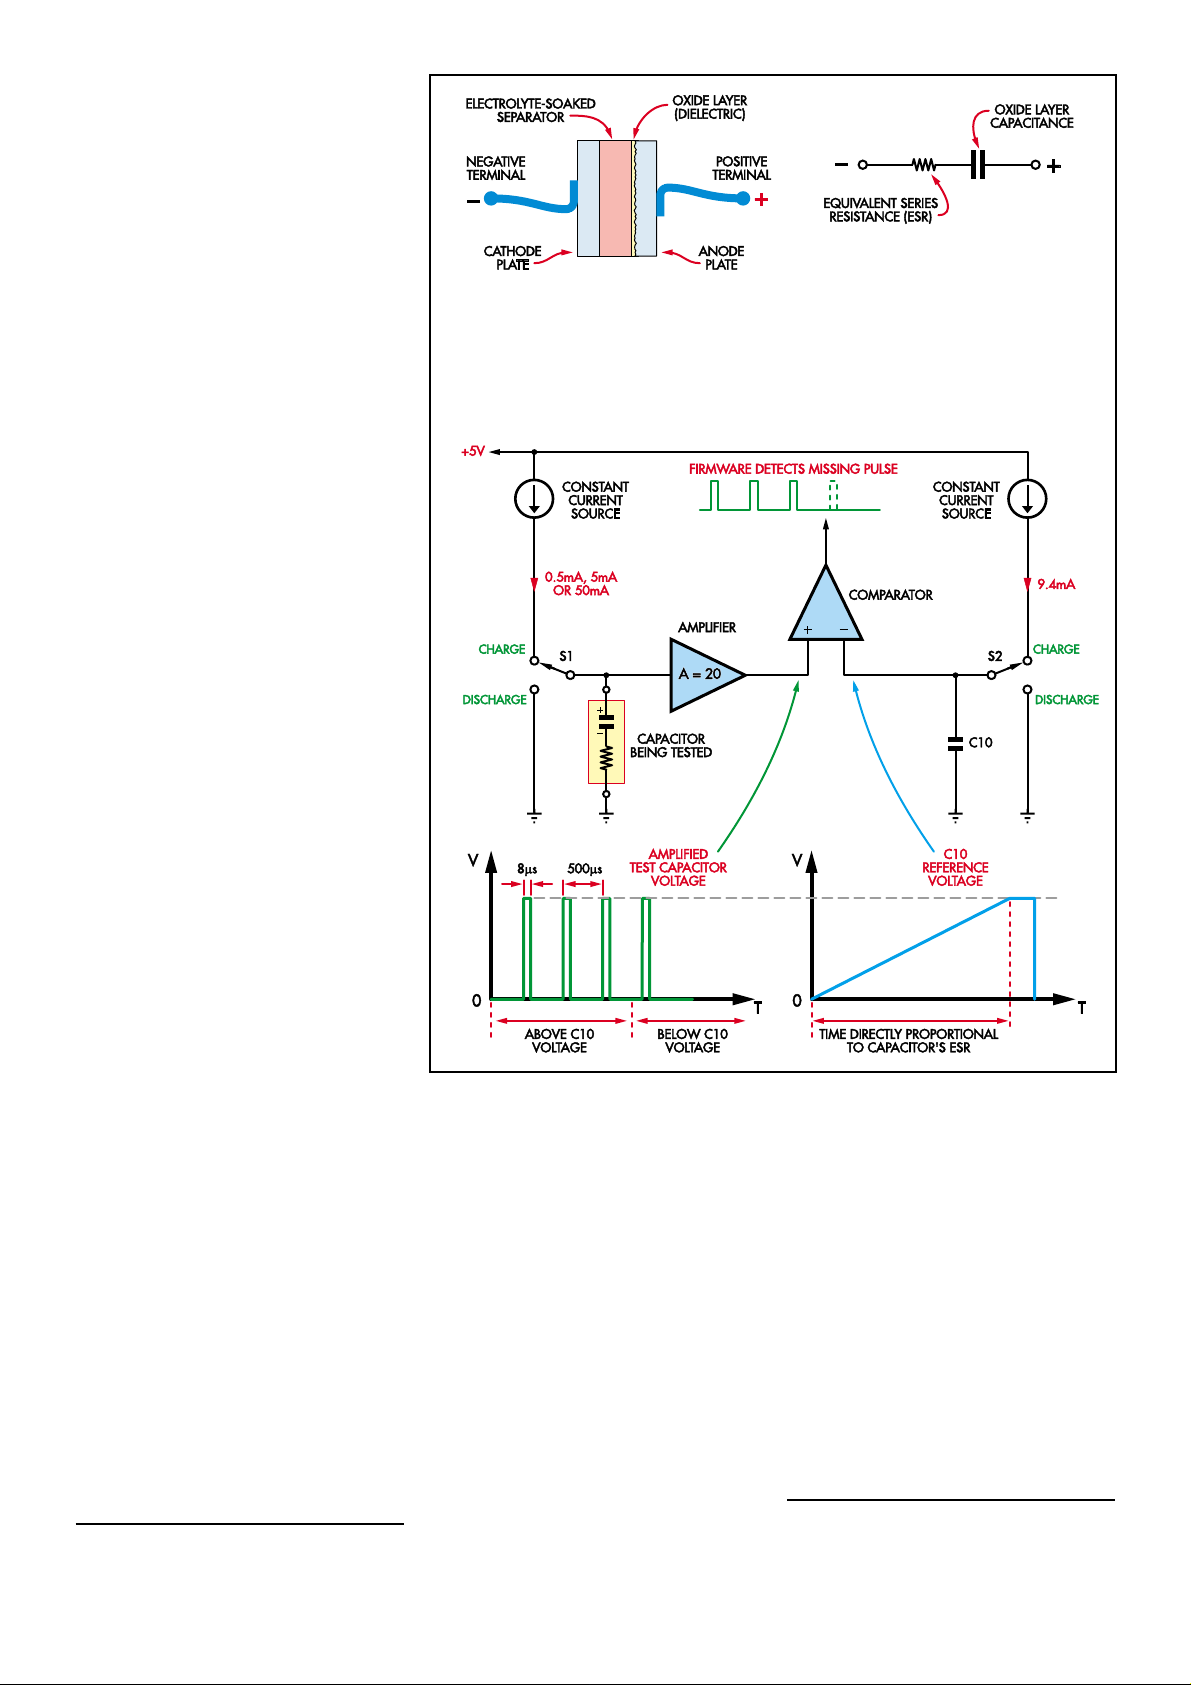
Fig.1 is a simplified cross-section
drawing which shows the basics. As with
many other kinds of capacitors, the
plates of an electrolytic consist of two
long aluminium foil strips wound into a
cylinder. The big difference is that the
Assembly Manual
KK II TT
ESR Meter Mk.2
K 7214
Please read Disclaimer carefully as we
can only guarantee parts and not the
labour content you provide.
Cat No.
Forget about capacitance meters - an ESR meter is the way to go when it comes to identifying
faulty electrolytics. This well-proven design is autoranging, low in cost and simple to build.
by Bob Parker
SILICON CHIP - March/April 2004 Issue
A.B.N. 34 000 908 716
• In-circuit testing, made possible by using <100mV test voltage which won’t
forward bias diodes or transistors.
• Auto-ranging to cover 0.01-99Ω.
• Non-polarized test leads due to no DC component in the test signal.
• Single pushbutton to easily control all functions.
• Test lead resistance zeroing.
• Automatic switch-off after three minutes when the meter is idle.
• Low battery voltage warning – “b” blinks on the display.
• 13mm LED displays for easy viewing from a distance.
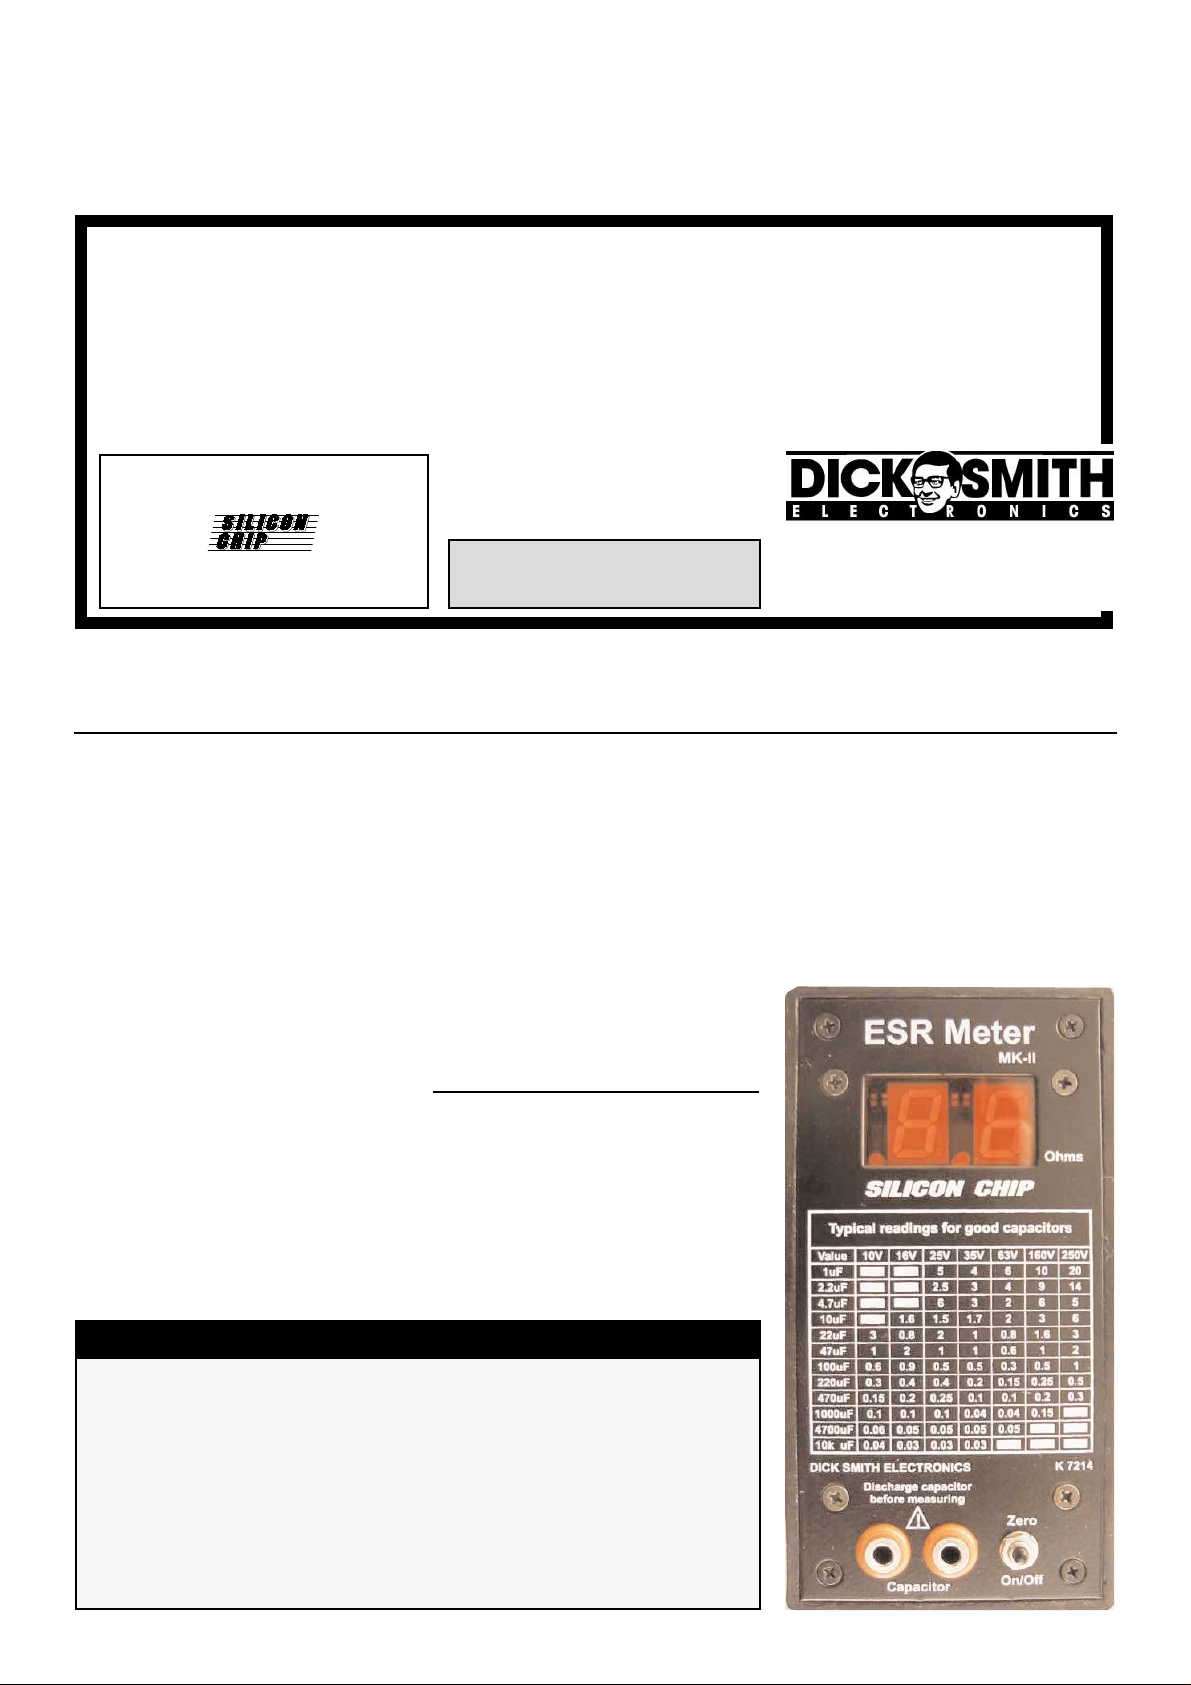
• Chart of typical electrolytic capacitor ESR figures on the front panel.
ESR Meter: Main Features
Page 2
dielectric isn’t a strip of plastic or other
insulating material separating these
plates, but an extremely thin layer of aluminium oxide which is formed directly
onto the anode foil itself during the manufacturing process.
As part of an electrolytic’s electrochemical operation and to achieve the
closest possible electrical contact with
the cathode side of the oxide layer, a separating strip of porous material (generally paper) is sandwiched between the
plates. This separator is soaked with a
highly conductive liquid called the “electrolyte”, which effectively connects the
negative plate to the oxide layer and
gives the capacitor its name. In very old
electrolytics, the electrolyte was waterbased but they now use water-free formulas.
Because electrolytics make use of a
conductive liquid to complete the electrical circuit between the cathode plate and
one side of the dielectric, the electrolyte’s electrical resistance is critical. It
is the major component of the capacitor’s
“equivalent series resistance” or “ESR”.
Other components of ESR are the inductance of the wound capacitor element,
the resistances of the internal connections and the impedance of the capacitance itself.
In operation, electrolytic capacitors
can function perfectly for decades.
However, there are some conditions
which will cause the electrolyte’s resistance (ESR) to increase. This can eventually reach a point where it causes problems for the circuit.
Normally, a flexible rubber seal keeps
the electrolyte contained inside the aluminium case of the capacitor. If the seal
fails (as it regularly does in surfacemount electrolytics), the electrolyte will
leak and/or dry out.
The two other big killers are: (1) high
temperatures where the electrolytic is
located; and (2) high levels of ripple current through the capacitor, which cause
elevated temperatures inside it. These
conditions cause chemical changes to the
electrolyte, increasing its resistance.
This is why time after time, repair
technicians find electrolytics failing in
switchmode power supplies, the deflection stages of CRT TVs and monitors,
and other power circuitry such as electronically-commutated motors where
both of those conditions are common.
Why high ESR causes trouble
The function of an electrolytic capacitor is to block DC while acting as a low
impedance to any AC voltage across it.
As a power supply filter, an electrolytic
smooths rectified voltage and so has to
pass the AC ripple voltage on it. This
causes “ripple” current through the
capacitor.
In a perfect capacitor, such ripple current causes no internal heating or other
problems but real world capacitors have
ESR. The ripple voltage across this
“equivalent series resistance” causes circuit losses as well as heating within the
capacitor, if it becomes excessive.
For example, in switchmode power
supplies, high ESR can cause starting
failure, loss of regulation and excessive
high-frequency noise on the outputs.
Similarly, deflection circuits can suffer
from distorted and reduced scanning
waveforms. In fact, high electrolytic
capacitor ESR often causes strange problems which are hard to make sense of.
It’s worth noting that ESR increases
rapidly as the temperature drops. As a
result, defective electrolytics are often
indicated by faults which are worst in
winter and when the equipment is first
switched on, with the symptoms gradually diminishing as the temperature rises.
Capacitance vs ESR meters
In the past, technicians didn’t have
much choice but to check suspect electrolytics using a capacitance meter.
Unfortunately, capacitance meters are
Text and illustrations courtesy of Silicon Chip
Page 2
Fig.3: this block diagram shows the basic scheme for the ESR meter. S1 is an
electronic switch and it allows the test capacitor to be alternately charged for
8
µµ
s from a constant current source and then discharged for 492µµs. The resulting voltage waveform is then amplified and fed to a comparator, where it is compared with a reference voltage ramp.
Fig.1: simplified cross-section of an
electrolytic capacitor. The dielectric
consists of a thin layer of aluminium
oxide on the anode plate and this is
connected to the cathode plate via an
electrolyte-soaked separator.
Fig.2: as shown in this diagram,
the electrical resistance of the
electrolyte is in series with the
capacitance of the oxide dielectric. It is the major component of
the “equivalent series resistance” or “ESR” of an electrolytic
capacitor.
Page 3
generally useless for weeding out electrolytics which are causing trouble.
They’re generally designed to ignore the
ESR and show only the actual capacitance which usually stays close to its correct value, even when the ESR has gone
through the roof! In addition, the capacitor must be disconnected from the circuit
before making capacitance measurements.
Now you can see why ESR meters
have become so popular with technicians. They’re designed to directly measure the very characteristic which is causing the fault.
What’s more, this measurement can be
made with the capacitor still in circuit
(while the equipment is safely disconnected from power). This avoids the
inconvenience of having to unsolder it,
which incidentally also heats it up and
makes the ESR drop, thereby masking
the problem.
Microcontroller-based meter
Unlike most other ESR meters, this
design is based on a microcontroller IC.
This custom-programmed chip makes
possible the extensive range of features
offered (see panel). It also greatly contributes to the small size, low cost and
simplicity of the ESR meter.
The microcontroller drives two 7-segment LED displays to give a direct readout of ESR measurement.
How it works
An ESR meter’s job is to measure the
resistance of an electrolytic capacitor’s
electrolyte while (as far as possible)
ignoring the capacitive reactance. Fig.3
shows a simplified diagram of how this
is done in the ESR meter described here.
As shown, switch “S1” (in reality, an
electronic switch driven by the microcontroller) alternately connects and disconnects the capacitor being tested to a
constant current source of either 0.5mA,
5mA or 50mA (depending on the range).
In practice, the capacitor is alternately
charged for 8ms (S1 in the “Charge”
position) and discharged for 492µs (S1 in
the Discharge” position).
Because the test current pulses are so
short, the voltage pulses developed
across the capacitor are essentially proportional to its ESR. That’s because
capacitors with values above about 1µF
don’t have time to charge enough to significantly affect the reading.
The voltage pulses across the capacitor
are fed to a non-inverting wideband
amplifier with a gain of 20. The resulting
signal is then applied to the non-inverting input of an op amp comparator
(inside the microcontroller) and compared against a reference voltage which
increases linearly with time.
Analog-to-digital conversion
In operation, the test current pulses are
applied to the capacitor at a constant rate
of one every 500µs (ie, 8µs charge,
492µs discharge). At the same time,
capacitor C10 is charged via another
constant current source, so that its voltage increases linearly at a rate of
10mV/500µs. The resulting linearly
increasing voltage on C10 is applied to
the inverting input of the comparator.
As a result, the comparator’s output
will go high during each ESR measurement pulse, until C10’s voltage exceeds
the pulse amplitude. When that happens,
the comparator’s output stays low and
the missing output pulses are detected by
the firmware in the microcontroller.
Fairly obviously, the number of pulses
that occur up until this point is directly
proportional to the capacitor’s ESR. It’s
simply a matter of using the microcontroller to count these pulses to obtain a
reading on the display (and microcontrollers are very good at counting).
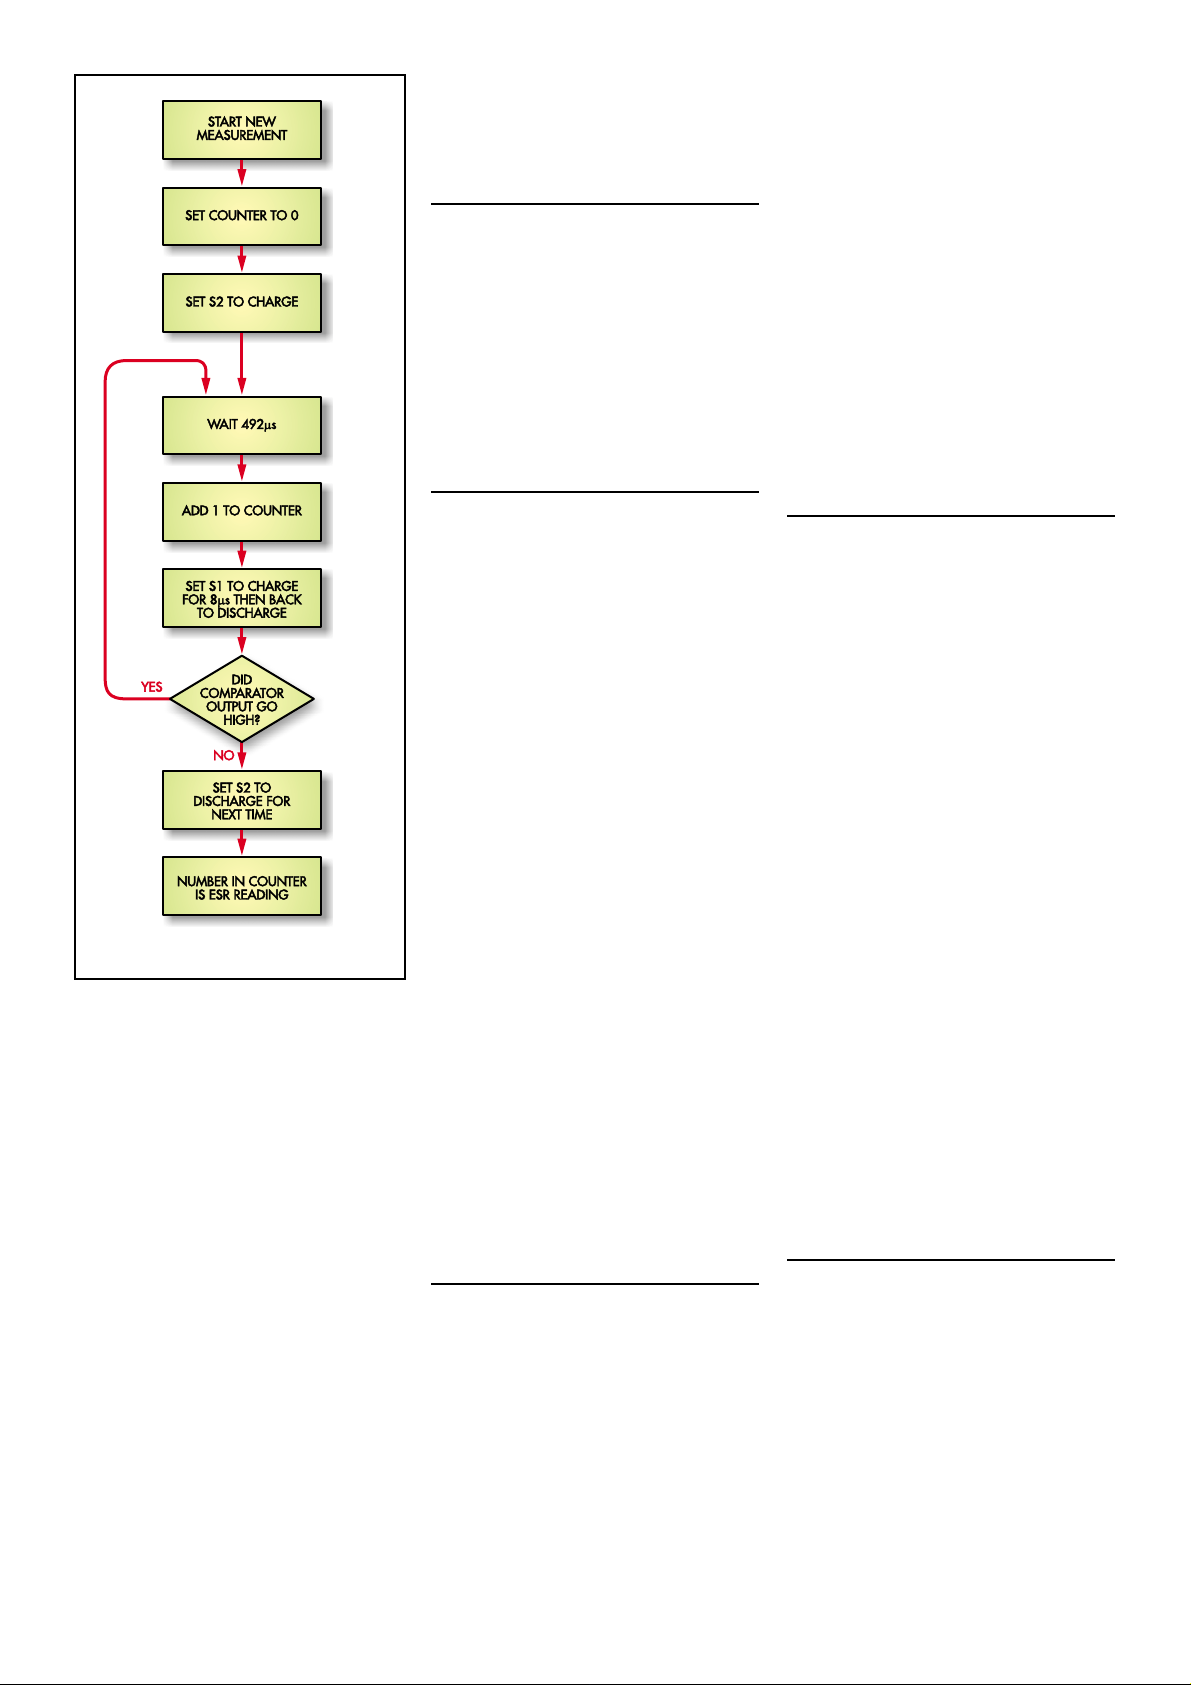
Fig.4 shows the simplified flow chart
of how the microcontroller takes an ESR
measurement. It simply counts the number of measurement pulses until the comparator output no longer goes high during one of them.
General operation
With the basics out of the way, let’s
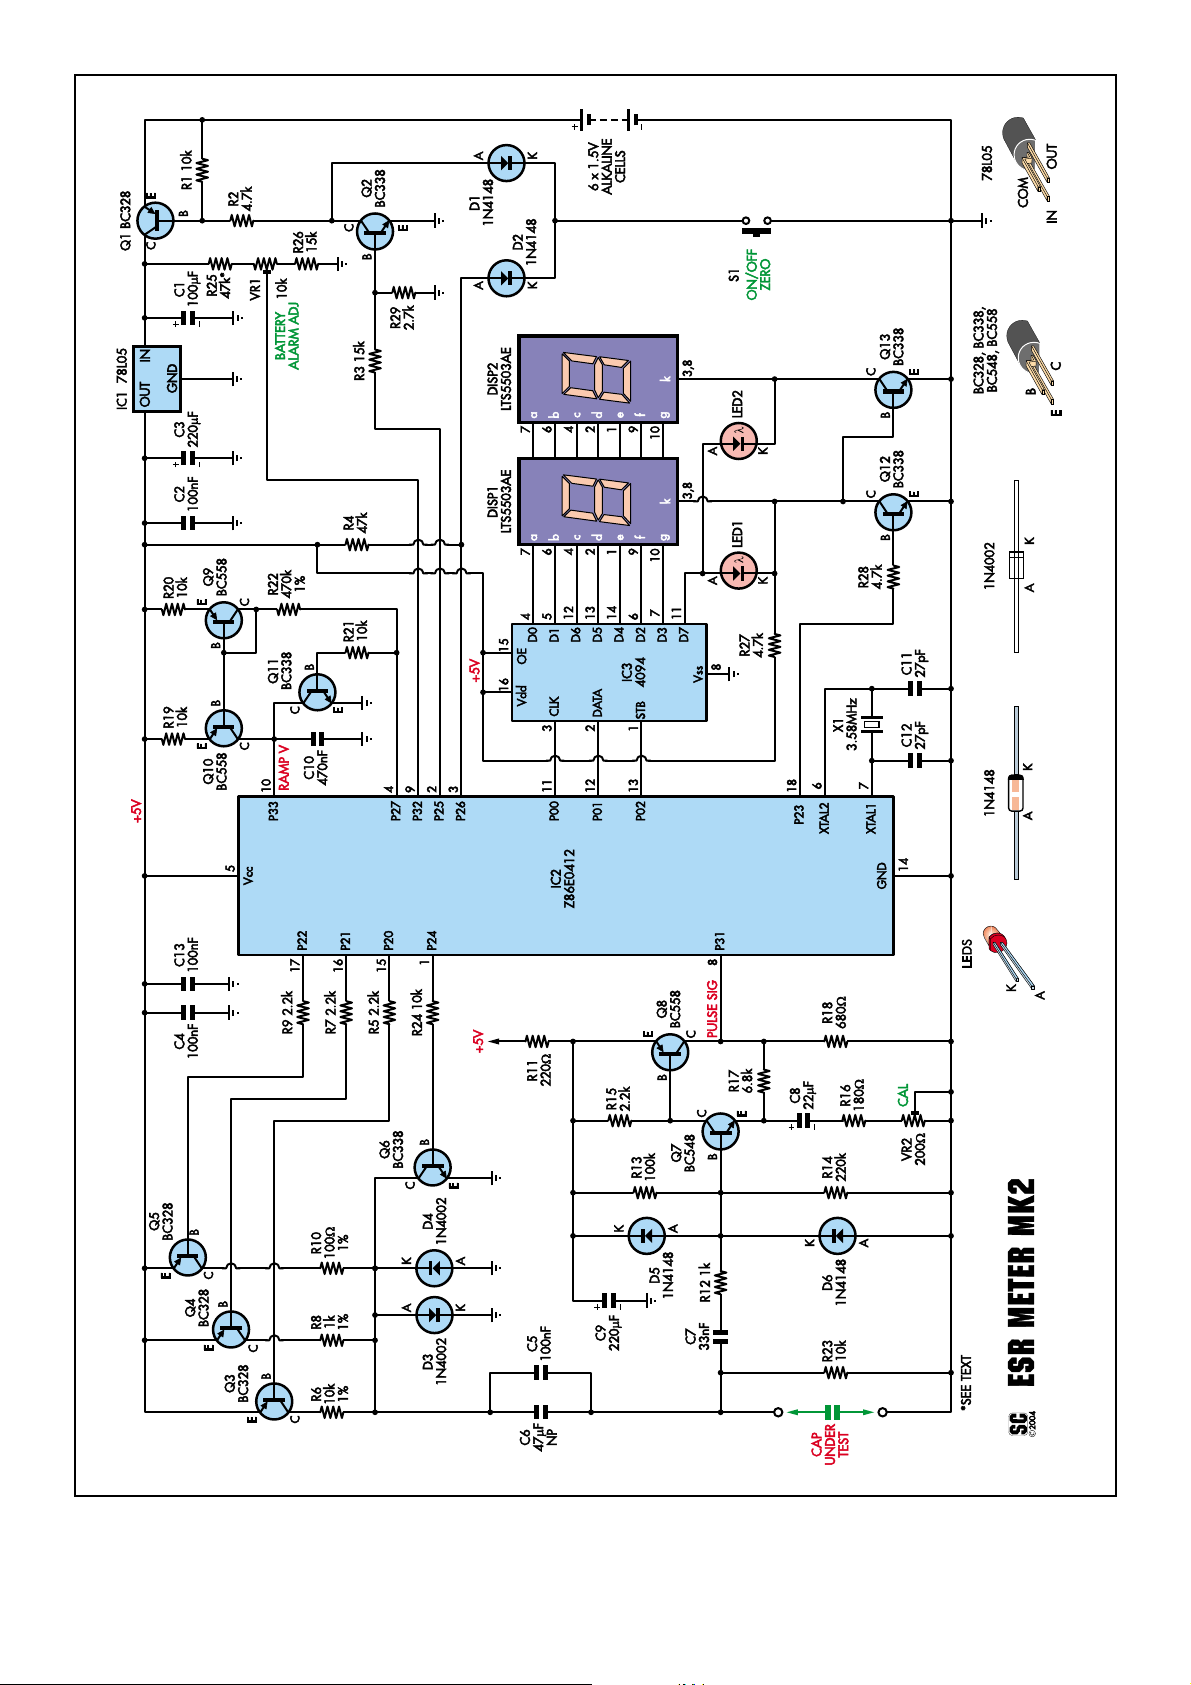
now take a look at the complete circuit.
Fig.5 shows the details. As can be seen,
it’s based on a Z86E0412 microcontroller.
Starting with the power supply, Q1 is
the main power switching transistor. In
the meter’s “off” state, Q1 has no forward bias and so no significant current
flows from the battery.
Conversely, when switch S1 is pushed,
base current flows from Q1 and through
resistor R2 and diode D1 to ground. Q1
thus switches on and effectively connects
the battery’s positive terminal to the
input of 5V regulator IC1. This in turn
provides a +5V rail to power microcontroller IC2 and the rest of the circuit.
As soon as power is applied, IC2’s
crystal oscillator (based on 3.58MHz
crystal X1) starts and IC2 begins executing the instructions in its firmware. The
first “external” thing it does is drive pin
2 to +5V and this turns on transistor Q2
via resistor R3 (15kΩ). As a result, Q2
takes over from pushbutton switch S1 in
maintaining Q1’s base current through
R2, thus ensuring that the power remains
on when S1 is released.
Pulsed current sources
Transistors Q3, Q4 and Q5 are driven
by pins 15-17 of IC2 (via 2.2k
Ω
resistors) and function as switches.
Depending on the range chosen, the Z86
pulses one of these transistors on for 8µs
every 500µs, to apply short current pulses via C5 & C6 to the capacitor being
tested.
Resistors R6, R8 & R10 set the pulse
current to either 0.5mA, 5.0mA or
50mA, while capacitors C5 and C6 block
any DC component from reaching the
test leads. Note that bipolar electrolytic
capacitor C6 is in series with the current
Text and illustrations courtesy of Silicon Chip
Page 3
Fig.4: this simplified flow chart shows
how the microcontroller takes an ESR
measurement. It simply counts the
measurement pulses until the comparator output no longer goes high
during one of them.
Page 4
Text and illustrations courtesy of Silicon Chip
Page 4
LEDS
Fig.5: a Zilog Z86E0412 programmed microcontroller (IC2) forms the heart of the circuit. This IC automatically switches
transistors Q3-Q5 to set the pulse current level, while Q7 & Q8 amplify the resultant voltage pulses across the test capacitor for comparison with a reference voltage ramp (across C10).
K
A
Page 5
source resistors, so its own ESR is effectively “swamped” by the relatively high
resistor values. C5 is included to preserve the high-frequency response of the
pulse waveform and to further reduce the
effect of C6’s ESR.
Between the 8µs pulses, IC2 drives its
pin 1 port to +5V. This turns Q6 on and
discharges the series combination of
C5/C6 and the capacitor under test.
Pulse amplifier
The current pulses developed across
the test capacitor are fed via C7 and R12
to a fast non-inverting pulse amplifier
based on transistors Q7 and Q8.
These two transistors are wired
as common-emitter stages, with
feedback applied via R17 to give
an overall gain of about 20,
depending on the setting of
VR2. The amplified signal out-
put from this stage is then fed
to the non-inverting input of
one of IC2’s comparators via
pin 8, so that it can be com-
pared with the reference
voltage.
Reference voltage
generator
Transistors Q9 and
Q10 form a current mir-
ror circuit which works
with capacitor C10 to
provide the reference
voltage (see Fig.3). It
works like this: when
Q9 is on (ie, when
pin 4 of IC2 is low),
approximately
9.4µA flows through
this transistor and R22. This cur-
rent is “mirrored” by Q10, so
the same amount of current
also charges C10 (470nF)
at a linear rate towards
the +5V supply for as long
as pin 4 of IC2 is held low.
The ramp voltage developed across
C10 is applied to pin 10 of IC2. This pin
is the common inverting input of the two
voltage comparators inside the Z86. Q11
discharges C10 when IC2 switches its
pin 4 port to +5V at the end of each
measurement cycle.
Range changing
While ever the power is switched on,
the Z86 goes through a regular measurement routine in which it starts C10’s
voltage ramping up and then drives
either Q3, Q4 or Q5 with 8ms pulses that
are 500ms apart. This produces measure-
ment ranges of 0.00-0.99Ω, 1.0-9.9Ω and
10-99Ω.
If a reading is offscale, the unit automatically drops to the next lowest test
pulse current and checks again.
However, if it’s already on the 10-99Ω
range and the reading is offscale, it will
display “-” to indicate a reading above
99Ω.
Conversely, if it gets a very low reading, it will keep going to the next highest
test current, until it’s found the highest
on-scale reading. The reading is then
shown on the 7-segment LED displays.
Driving the displays
To display the reading, the Z86 microcontroller sends out eight bits of data (in
sequence) every 5ms to IC3, a 4094 serial-to-parallel shift register. These data
bits correspond to the LED display segments and to the decimal points which
are formed using LEDs 1 & 2.
In operation, the LED displays
(DISP1, DISP2 and LEDs 1 & 2) are
switched at a 100Hz rate by transistors
Q12 and Q13. Q12 is driven (via R28)
from the P23 output (pin 18) of IC2,
while Q13 is biased on via R27, which
connects directly to the +5V rail. Q13
toggles off when Q12 turns on and turns
back on again when Q12 turns off.
Due to the slow response of the human
eye, the displays all appear to be constantly illuminated. This technique is
called “multiplexing” and it allows the
two displays to share a common drive
circuit.
Test lead resistance zeroing
The resistance of the test leads can be
compensated for by again pressing
switch S1 (ie, after the unit has been
powered up) while the test lead probes
are held tightly together (to minimise
contact resistance). When this is done,
pin 3 of IC2 is pulled low via D2 and S1
and the microcontroller goes into its test
lead zeroing routine.
If the reading is less than 1
Ω (as all test
leads are), it saves this value for as long
as the meter is switched on. It then subtracts it from all subsequent readings, so
that only the ESR of the capacitor being
tested is displayed (ie, so that the reading
is unaffected by the test lead resistance).
Switching off
Pressing S1 while the test leads are
separated (or connected to a resistance of
1
Ω or higher) initiates the “switch-off”
routine (assuming, of course, that the
unit is already on).
What happens is that the Z86 stops
Text and illustrations courtesy of Silicon Chip
Page 5
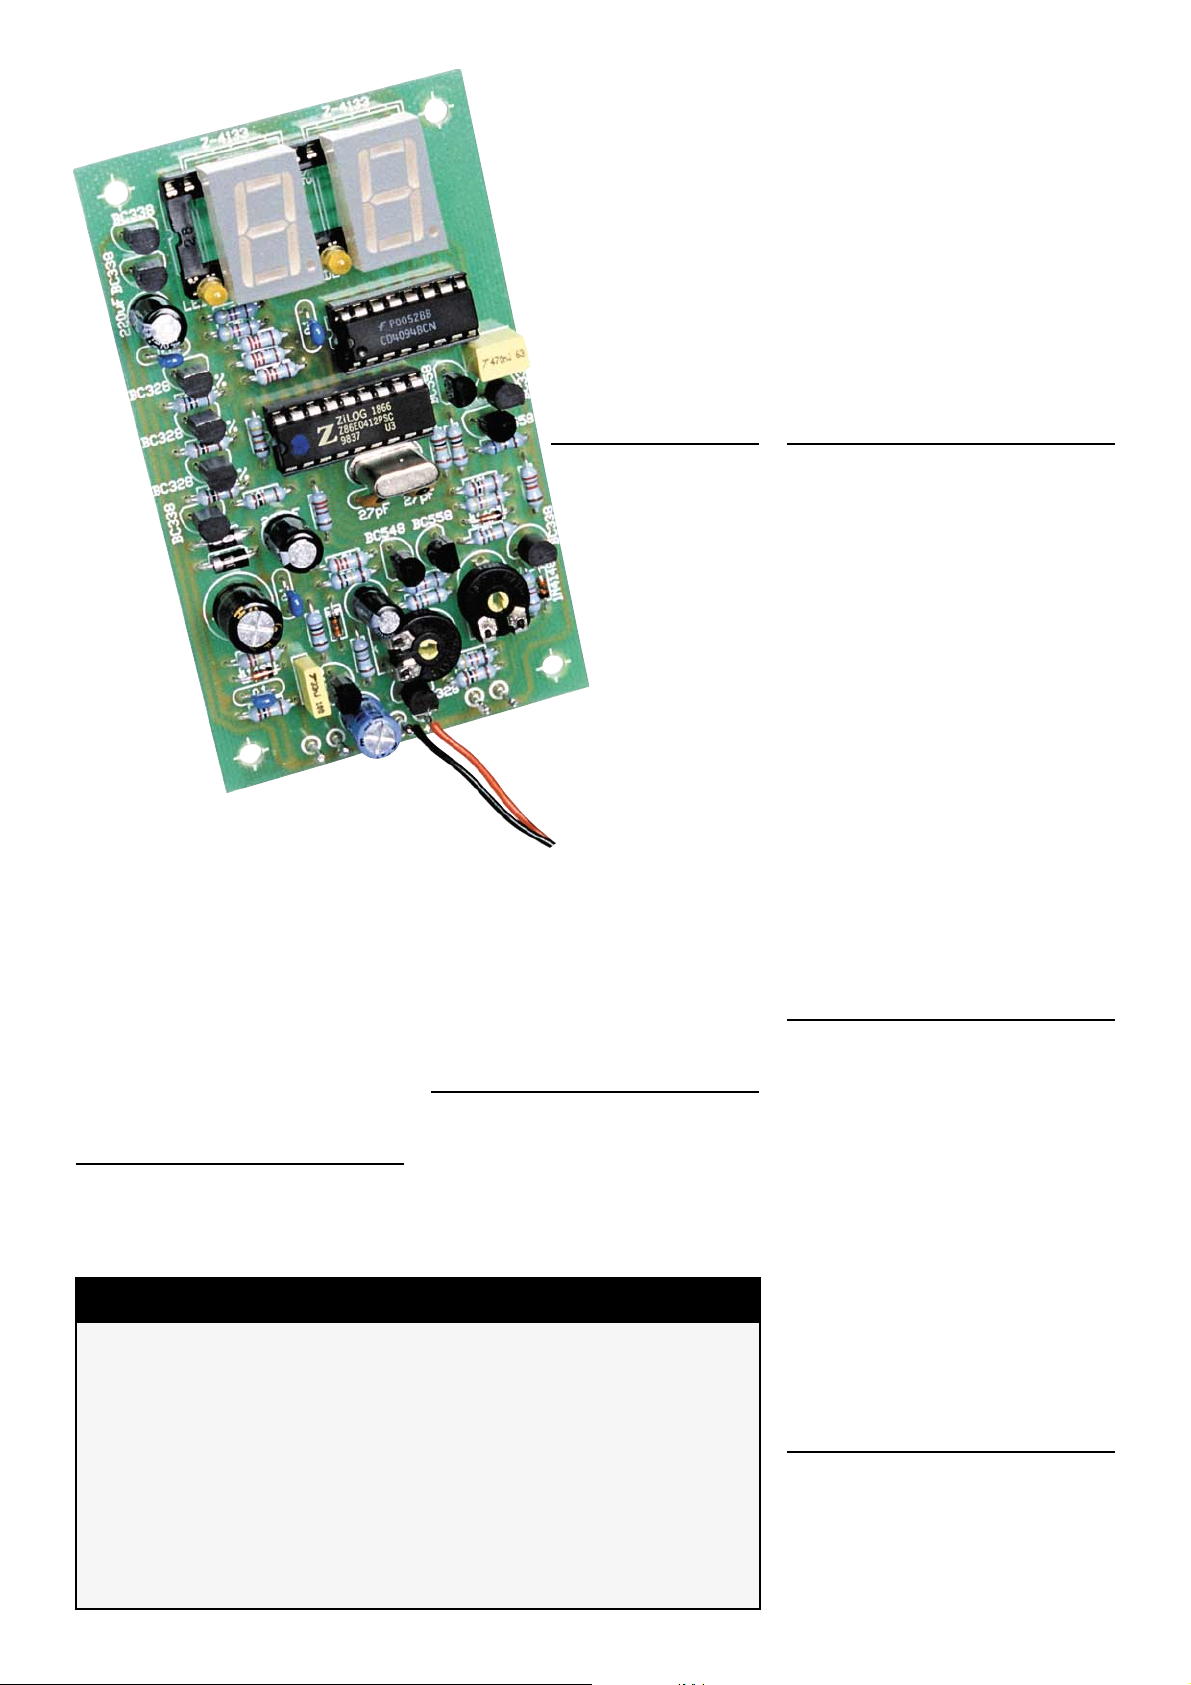
Here’s a preview of the assembled PC board.
• Front panel chart figures updated to reflect current-generation electrolytic capacitors.
• PC board now has silk-screened component overlay, solder masking and holes
under the trimpots for adjustment after final assembly.
• Improved appearance, with countersunk screws, etc.
• Automatic switch-off time increased from two minutes to three minutes.
• Holder for 6 AAA cells instead of a 9V alkaline battery for longer times between
battery replacements (and to finally end constructor confusion about how to keep
the battery in place).
• Smaller more reliable pushbutton switch which is harder to accidentally bump in a
toolbox.
• Automatic self-testing of the meter ’s circuitry added to the microcontroller firmware,
to simplify fault-finding if a newly-built meter doesn’t work properly.
What’s Changed In The Mk.2 Version
Page 6

making measurements and switches its
pin 2 port to 0V, in turn switching off
transistor Q2. Then, when you release
S1, Q1 switches off and the meter shuts
down.
In addition, the ESR Meter includes an
automatic power-off function. This shuts
the meter down if it has been idle for
more than three minutes.
It works like this: as long as the meter
is actively taking readings, it keeps resetting a 3-minute timer function in the Z86
microcontroller. However, if the unit is
left idle (even with the test leads touching), the Z86 automatically switches its
pin 2 port low after three minutes, thus
turning off the power.
This automatic switch-off function
may be a nuisance in some situations,
however. Hence, it can be easily disabled
if necessary (see the “Optional
Modifications” panel on page 12.
Battery voltage warning
A simple voltage divider consisting of
trimpot VR1 and series resistors R25 &
R26 makes up the battery warning circuit. This divider is connected across the
switched battery voltage and VR1 is
adjusted so that it applies 2V to pin 9 of
IC2 when the battery voltage is at 7V (ie,
the minimum at which the regulator will
continue to regulate).
Pin 9 of IC2 is the non-inverting input
of IC2’s second internal comparator. In
operation, IC2 switches its pin 4 port to
0V for a period of 100ms several times
per second, to allow C10 to charge up to
a predictable 2V. The second comparator
inside IC2 then compares this 2V reference against the voltage on VR1’s wiper.
If the battery voltage is down to 7V,
IC2 reduces the time each LED display is
switched on by 50%. This reduces the
load, which allows the battery voltage to
slightly rise again and provide a bit more
operating time. It also flashes a “b” on
the righthand digit at a 1Hz rate until the
power is turned off.
Protection circuitry
Last but not least, the meter needs to
be protected against being connected to
charged capacitors. This protection is
partially provided by back-to-back
diodes D3 and D4. If an external DC
voltage (ie, a charged capacitor) is connected, one of these diodes conducts and
forces non-polarised capacitors C5 and
C6 to charge up to that voltage.
Additional protection is provided by
C7, R12, D5 & D6 which stop excessive
input voltages from damaging transistors
Q7 and Q8 in the pulse amplifier circuit.
In particular, diodes D5 & D6 acts as
voltage clamps – D5 ensures that the
voltage on Q7’s base cannot go above
5.6V, while D6 ensures that this voltage
cannot go below -0.6V.
Finally, extra “heavy-duty” protection
can be added by connecting a pair of
back-to-back high-power diodes (not
shown on the circuit) between the test
terminals. The “Optional Modifications”
panel on page 12.
Construction
Even if the ESR Meter’s operation
seems complicated, at least it’s easy to
build. As you can see in the photos, all
the components except for the battery
holder, test sockets and the pushbutton
switch are mounted on a single PC
board. This in turn is attached to the front
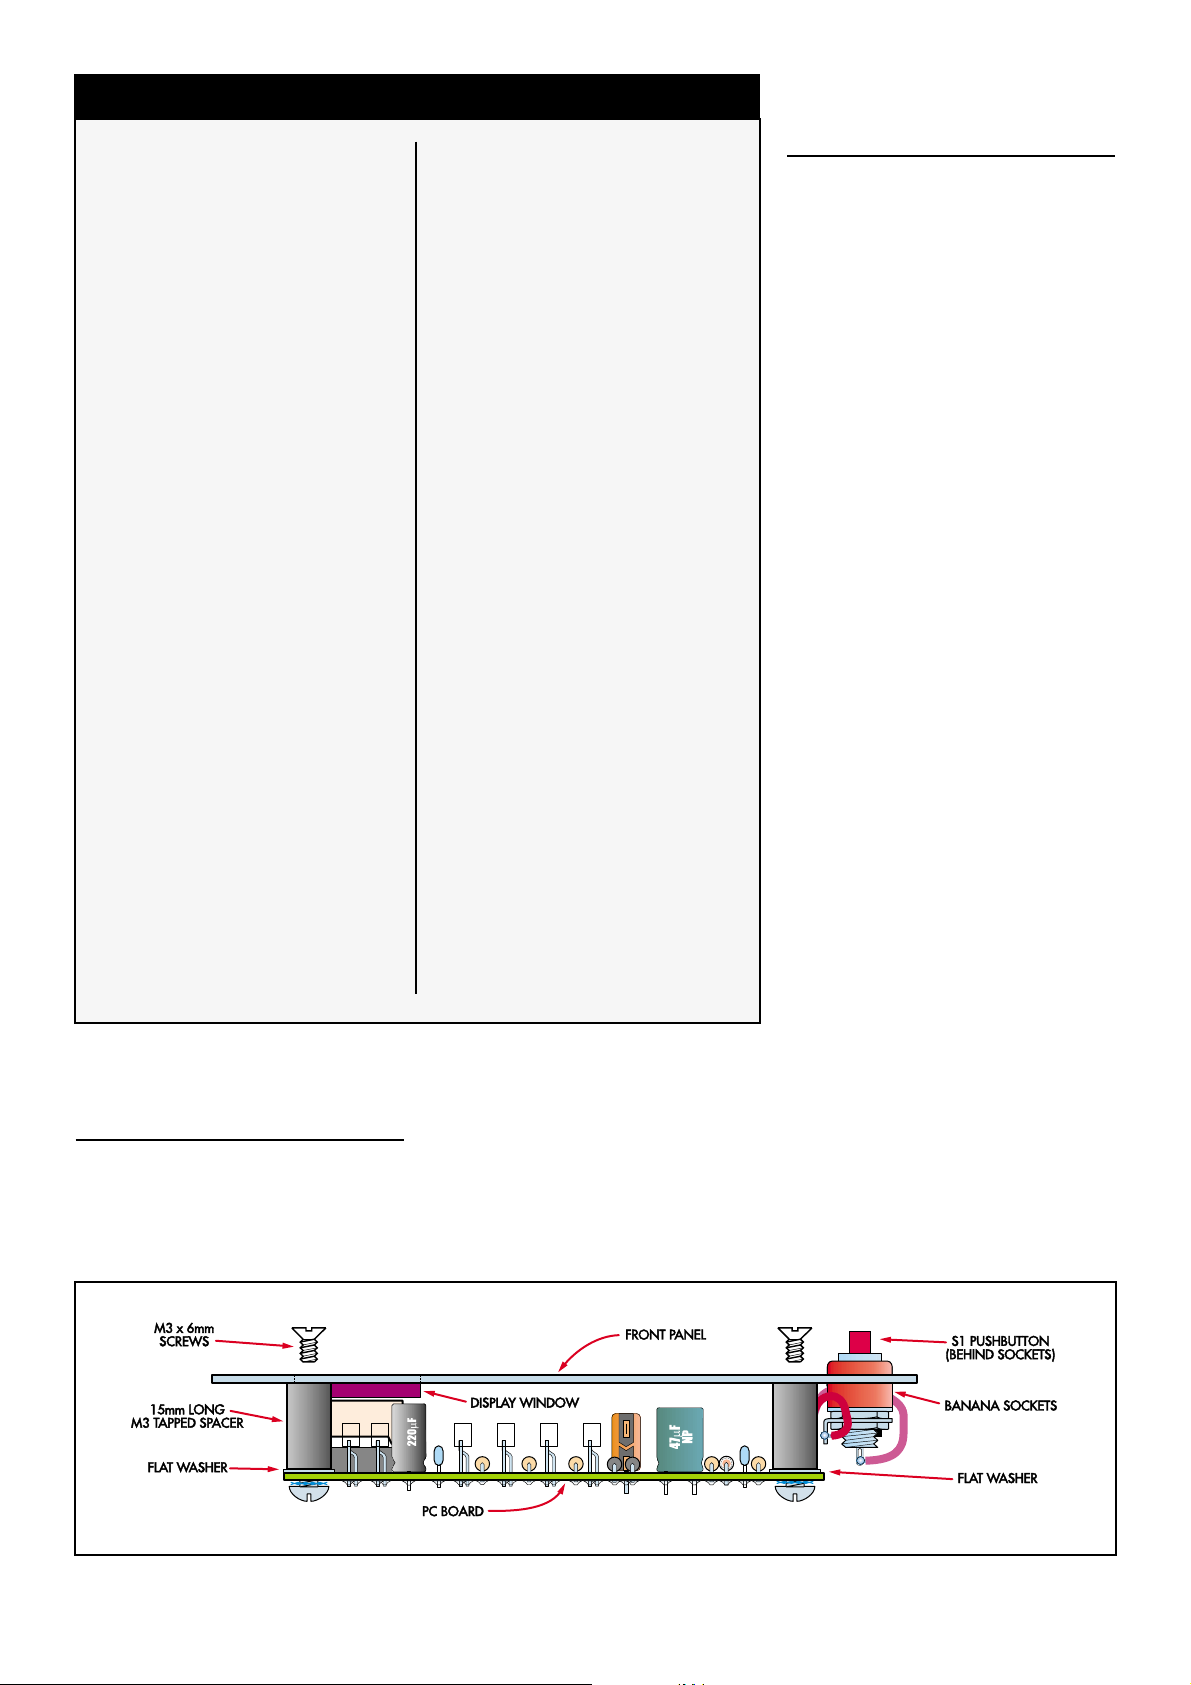
panel using spacers and machine screws.
The very first thing to do is glue the
display window to the inside of the front
panel, using a few drops of an adhesive
such as contact cement around its edges.
This can then be put aside to dry while
you assemble the PC board.
Although a high-quality, soldermasked PC board is supplied, it’s still
wise to check it for defects. To do this,
illuminate the component side with a
bright light and examine the copper side
very carefully – preferably with a magnifier – for any hairline fractures in the
tracks. Check also for any solder
“whiskers” or bridges and pay particular
attention to any tracks which pass
between IC socket pads, where such
defects tend to congregate and hide.
Because of the need to make it fit into
a compact plastic case, the PC board is
tightly packed and the solder pads are
quite small. The last thing this circuit
needs is solder bridges and bad joints, so
be very careful with your soldering.
Always lift the iron vertically from a
just-soldered joint and never wipe it sideways as so many constructors seem to
do!
Construction is easiest if you begin by
installing the resistors and diodes first.
Note that the kit for the Mk.2 version
contains 1% resistors. It’s notoriously
difficult to correctly identify the colour
bands on these, so check each one’s
value with an ohmmeter before soldering
it to the board. Table 1 will help you
select the resistor values prior to checking.
The larger components can now all be
installed. These parts include crystal
XTAL1, the electrolytic capacitors, trimpots VR1 & VR2, the transistors, and the
sockets for the LED displays and IC2 &
IC3.
Note particularly that the 7-segment
LED displays and LEDs are mounted on
a 28-pin IC socket. Make sure that this
socket is flat on the PC board before soldering its pins, otherwise the displays
will foul the Perspex window when you
later attempt to fit the front panel.
As usual, take care with the orientation
of the polarised components; ie, the electrolytic capacitors, diodes and transistors. You should also make sure that the
different transistor types all go in their
correct places. Don’t install the socketed
parts just yet, though.
Once everything’s on the PC board,
hold the component side up to a bright
light and carefully check for any solder
bridges or other problems. In particular,
check for light shining through the holes
of unsoldered joints (this has been another common cause of problems with this
kit).
LED displays
Now for the LEDs and the 7-segment
LED displays. First, cut the leads of the
two decimal point LEDs down to about
8mm-long, then gently push them into
their places in the 28-pin socket. Make
sure that they are correctly oriented; ie,
the flat side of each LED must go to the
right – see Fig.6.
Next, insert the two 7-segment displays, ensuring that their decimal points
are at the bottom and that they are prop-
Text and illustrations courtesy of Silicon Chip
Page 6
So what are typical ESR readings for various electrolytic capacitors? Unlike other
electrical characteristics, there’s no such thing as a “normal” ESR value for an electrolytic of a given capacitance and operating voltage. The ESR to a large extent
depends on the physical size of the capacitor and whether it’s a low-ESR or high
temperature-rated type. It also varies between manufacturers. In addition, ESR
increases rapidly as the temperature drops and vice versa.
The chart on the front of the meter contains sample ESR values for a range of
common electrolytic capacitor values and voltage ratings. These have been
derived both from physical measurements on a range of capacitors and from
manufacturer’s data sheets. It’s only intended as a rough guide, to give an idea of
what to expect until you become familiar with using the ESR meter.
What Are Typical ESR Readings?
Page 7
erly seated. It might be necessary to snip
a bit off their leads to get them to sit flat
on the socket.
External wiring
When all the components are on the
board, solder two 150mm lengths of
hookup wire to the battery pads on the
PC board - red to “+” and black to “-”.
The pushbutton switch terminals and
test lead sockets are quite close to the PC
board once everything has been mounted
on the front panel. As a result, you can
connect them to the PC board using the
tin copper wire supplied. Alternatively,
you can use short lengths of the supplied
hookup wire.
Solder these leads to the PC board now
but don’t connect them to the switch or
test sockets for the time being.
Initial checks
With IC2 and IC3 still out of their
sockets, connect the supply leads to the
batteries (or a 9V DC power supply),
with a milliammeter in series with one of
the supply leads.
Initially, you shouldn’t see any current
being drawn. Now short the pushbutton
switch wires (the righthand ones when
looking at the front) and check that the
current drawn is now about 6mA. If it’s
significantly higher or lower, start looking for assembly errors (component
placement errors, missed solder joints
and solder splashes).
Assuming the current checks OK, connect the negative lead of a voltmeter to
the negative battery lead, then check that
there’s +5V on pin 5 of IC2’s socket and
on pin 16 of IC3’s socket.
If everything’s OK to here, disconnect
the 9V supply and the milliammeter.
That done, discharge any static electricity you may have accumulated by touching something earthed, then install IC2
(Z86E0412PSC) and IC3 (4094) in their
sockets. Double-check to ensure that
these are both oriented correctly – their
indented pin 1 ends are to the left.
Next, set both VR1 and VR2 to their
mid-range positions, then separate the
pushbutton switch leads and reconnect
the 9V supply. Now short the pushbutton
leads again and keep them shorted.
At this point, you should see something on the 7-segment LED displays,
preferably “-” on the lefthand one. After
five seconds, the displays should blank
for a moment as the microcontroller does
a basic check of the circuitry. If the next
thing you see is “.8.8” for two seconds, it
means that the board has passed the tests
and is probably OK.
However, if you see an “F” on the lefthand display and a digit or “A” on the
righthand one, the microcontroller has
Text and illustrations courtesy of Silicon Chip
Page 7
1 PC board, code ZA1044, 95 x 57mm
1 3.58MHz crystal
1 16-pin IC socket
1 18-pin IC socket
1 28-pin IC socket
1 4 x AAAcell holder
1 2 x AAAcell holder
1 plastic utility box
1 miniature momentary-contact push
button switch
2 4mm banana sockets
1 pre-punched silk-screened front
panel
1 red perspex display filter
4 15mm spacers
6 PC pins
1 10kΩ PC-mount trimpot (VR1)
1 200Ω PC-mount trimpot (VR2)
Semiconductors
4 1N4148 or 1N914 signal diodes
(D1,D2,D5,D6)
2 1N4004 power diodes (D3,D4)
4 BC328 PNP transistors (Q1,
Q3,Q4,Q5)
5 BC338 NPN transistors (Q2,
Q6,Q11,Q12,Q13)
1 BC548 NPN transistor (Q7)
3 BC558 PNP transistors (Q8,
Q9,Q10)
1 78L05 3-terminal regulator (IC1)
1 Z86E0408 or Z86E0412
programmed microcontroller (IC2)
1 4094 / MC14094 CMOS shift
register (IC3)
2 LSD5114 or LTS5503AE 7-segment
LED displays (DISP1, DISP2)
2 3mm orange LEDs (LED1,LED2)
Capacitors
2 220µF 16V RB electrolytic (C3,C9)
1 100µF 16V RB electrolytic (C1)
1 47µF 50V bipolar RB electrolytic
(C6)
1 22µF 16/25V RB electrolytic (C8)
1 470nF 63V MKT (C10)
4 100nF 50V disc or monolithic
(C2,C4,C5,C13)
1 33nF 63V MKT (C7)
2 27pF 50V NPO disc ceramic
(C11,C12)
Resistors (0.25W, 1%
unless specified)
1 470kΩ 4 2.2kΩ
1 220kΩ 2 1kΩ
1 100kΩ 1 680Ωσ
2 47kΩ 1 220Ω
2 15kΩ 1 180Ω
7 10kΩ 1 100Ω
1 6.8kΩ 1 68Ω
(for calibration)
3 4.7kΩ 1 5.6Ω 5%
(for calibration)
1 2.7kΩ
Miscellaneous
Hookup wire, tinned copper wire,
solder, flat washers, black countersunk selftap screws (No.4 x 6mm),
black counter-sunk pan head screws
(M3 x 6mm), double sided tape, heatshrink tubing, test leads & instructions.
Parts List
Fig.7: the PC board is attached to the underside of the front panel using 15mm-long tapped spacers, flat washers and M3
x 6mm machine screws.
 Loading...