

Page 1
PD-2.443
d
Next Data SheetIndex
Previous Datasheet
To Order
HFA105NH60R
Features
TM
LUG
TERMI NAL
CATHODE
Ultrafast, Soft Recovery DiodeHEXFRED
• Reduced RFI and EMI
• Reduced Snubbing
• Extensive Characterization of Recovery Parameters
a
BASE ANODE
Description
HEXFREDTM diodes are optimized to reduce losses and EMI/RFI in high frequency
power conditioning systems. An extensive characterization of the recovery
behavior for different values of current, temperature and di/dt simplifies the
calculations of losses in the operating conditions. The softness of the recovery
eliminates the need for a snubber in most applications. These devices are
ideally suited for power converters, motors drives and other applications where
switching losses are significant portion of the total losses.
Absolute Maximum Ratings
Parameter Max. Units
V
R
IF @ TC = 25°C Continuous Forward Current 147
IF @ TC = 100°C Continuous Forward Current 72
I
FSM
I
AS
E
AS
PD @ TC = 25°C Maximum Power Dissipation 379
PD @ TC = 100°C Maximum Power Dissipation 152
T
J
T
STG
Cathode-to-Anode Voltage 600 V
Single Pulse Forward Current 600
Maximum Single Pulse Avalanche Current 2.0
Non-Repetitive Avalanche Energy 220 µJ
Operating Junction and
Storage Temperature Range
-55 to +150
VR = 600V
VF = 1.5V
Qrr * = 1200nC
di
/dt * = 240A/µs
(rec)M
* 125°C
HALF-PAK
A
W
°C
Thermal - Mechanical Characteristics
R
θJC
R
θCS
Wt Weight –––– 26 (0.9) –––– g (oz)
Note: Limited by junction temperature
L = 100µH, duty cycle limited by max T
Parameter Min. Typ. Max. Units
Junction-to-Case, Single –––– –––– 0.33
Case-to-Sink, Flat , Greased Surface –––– 0.15 ––––
Mounting Torque 15 (1.7) –––– 25 (2.8) lbf•in
Terminal Torque 20 (2.2) –––– 40 (4.4) (N•m)
J
°C/W
K/W
Page 2
HFA105NH60R
Next Data SheetIndex
Previous Datasheet
To Order
Electrical Characteristics @ TJ = 25°C (unless otherwise specified)
Parameter Min. Typ. Max. Units Test Conditions
V
BR
V
FM
I
RM
C
T
L
S
Dynamic Recovery Characteristics @ TJ = 25°C (unless otherwise specified)
t
rr
t
rr1
t
rr2
I
RRM1
I
RRM2
Q
rr1
Q
rr2
di
(rec)M
di
(rec)M
Cathode Anode Breakdown Voltage 600 ––– ––– V IR = 100µA
Max Forward Voltage 1.3 1.5 IF = 105A
––– 1.5 1.7 V IF = 210A
1.2 1.4 IF = 105A, TJ = 125°C
Max Reverse Leakage Current 6.0 30 µA VR = VR Rated
1.5 6.0 mA TJ = 125°C, VR = 480V
Junction Capacitance ––– 200 300 pF VR = 200V
Series Inductance ––– 6.0 ––– nH
From top of terminal hole to mounting
plane
Parameter Min. Typ. Max. Units Test Conditions
Reverse Recovery Time ––– 35 ––– IF = 1.0A, dif/dt = 200A/µs, VR = 30V
––– 90 140 ns TJ = 25°C
––– 160 240 TJ = 125°C IF = 105A
Peak Recovery Current ––– 10 18 TJ = 25°C
––– 15 30 TJ = 125°C VR = 200V
Reverse Recovery Charge ––– 450 1300 TJ = 25°C
––– 1200 3600 TJ = 125°C dif/dt = 200A/µs
/dt1 Peak Rate of Fall of Recovery Current ––– 310 ––– TJ = 25°C
/dt2 During t
b
––– 240 ––– TJ = 125°C
A
nC
A/µs
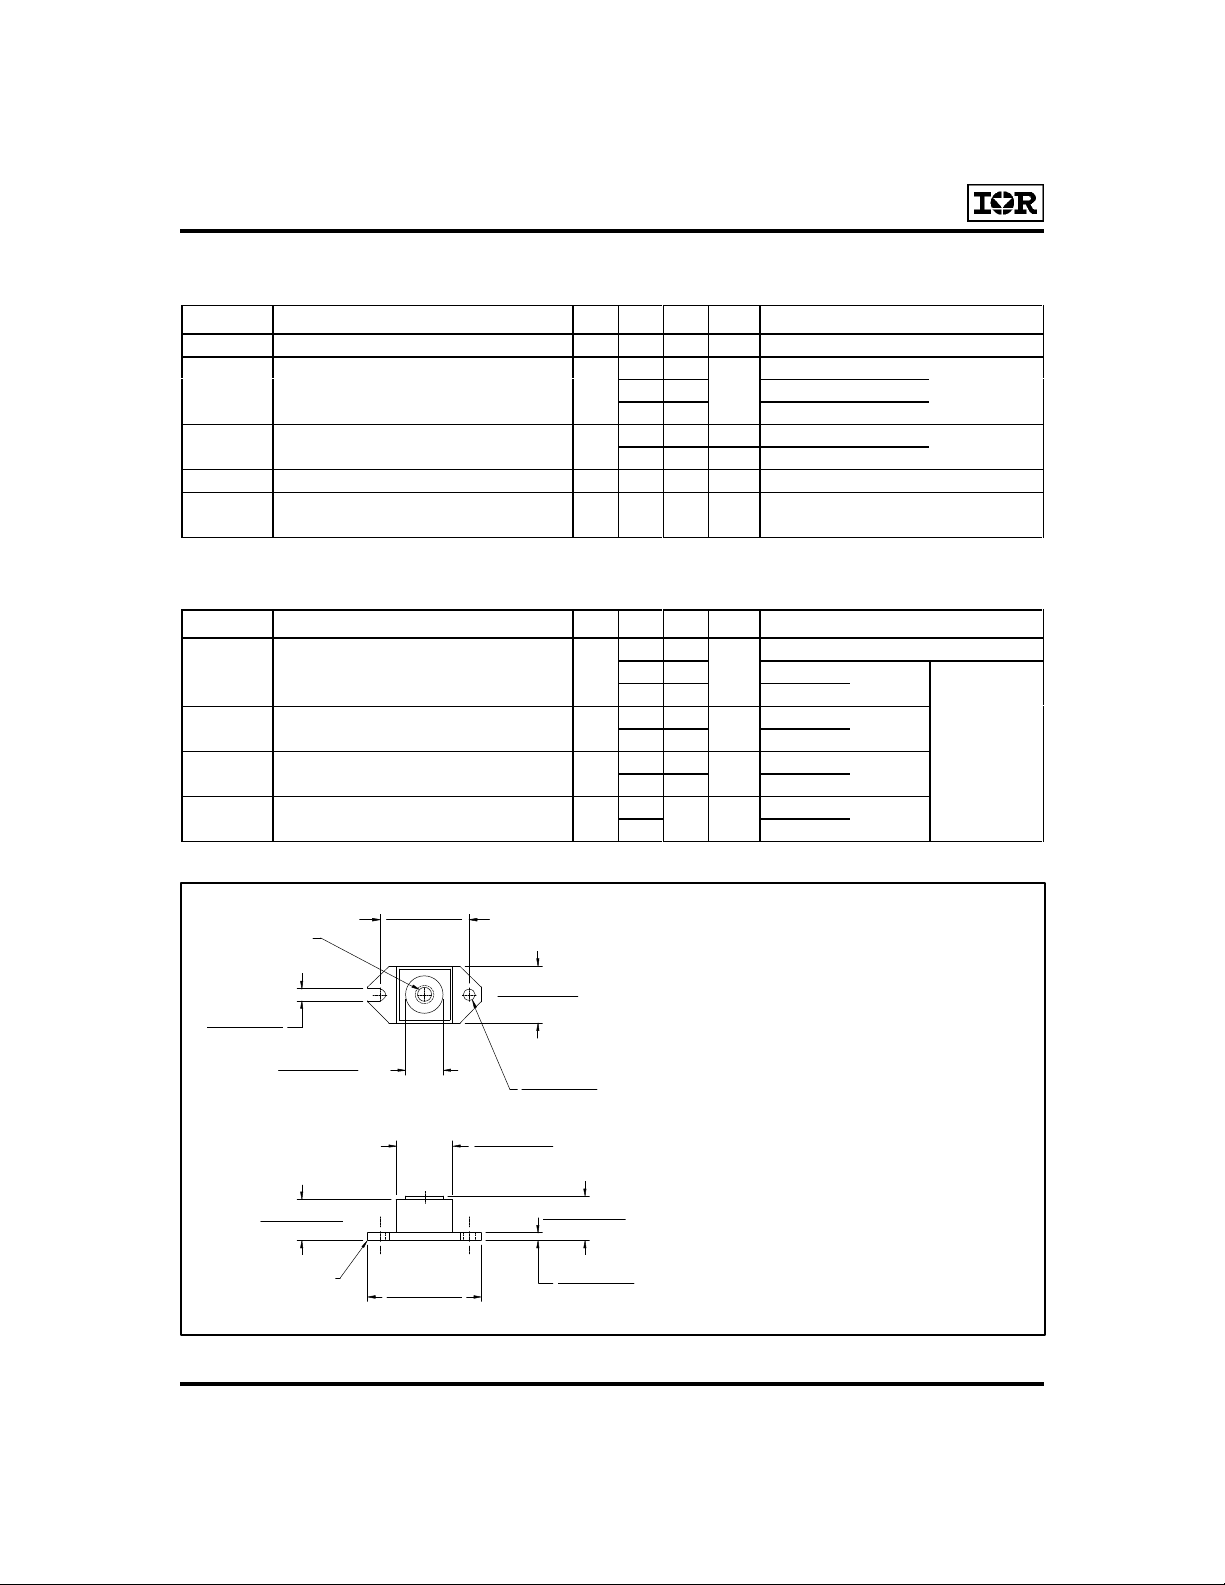
1/4-20 UNC-2B
4.11 (0.162)
3.86 (0.152)
14.10 (0.555)
13.59 (0.535)
12.83 (0.505)
12.57 (0.495)
2
30.40 (1.197)
29.90 (1.177)
DIA.
39.62 (1.560)
38.61 (1.520)
1
19.69 (0.775)
18.42 (0.725)
4.11 (0.162)
3.86 (0.152)
19.18 (0.755)
18.92 (0.745)
DIA.
SQ.
15.75 (0.620)
14.99 (0.590)
3.30 (0.130)
3.05 (0.120)
LEAD ASSIGNMENTS
1 - CATHODE
2 - ANODE
Dimensions in millimeters and inches
ALF- AK
H P
Page 3

1000
To Order
Next Data SheetIndex
Previous Datasheet
10000
R
1000
100
HFA105NH60R
T = 150°C
J
T = 125°C
J
F
100
T = 150°C
J
T = 125°C
J
T = 25°C
J
10
Instantaneous Forward Current - I (A)
1
0.0 1.0 2.0 3.0 4.0
Forward Volt age Drop - V (V)
FM
Fig. 1 - Maximum Forward Voltage Drop
vs. Instantaneous Forward Current
1
10
1
Reverse Current - I (µA)
0.1
T = 25°C
J
0 200 400 600
Reverse Voltage - V (V)
R
Fig. 2 - Typical Reverse Current vs. Reverse
A
10000
T
1000
100
Junction Capacitance - C (pF)
1 10 100 1000
Voltage
T = 25°C
J
Reverse Voltage - V (V)
R
Fig. 3 - Typical Junction Capacitance vs.
Reverse Voltage
thJC
0.1
0.01
Thermal Impedance - Z (K/W)
0.001
0.00001 0.0001 0.001 0.01 0.1 1 10 100
D = 0.50
D = 0.33
D = 0.25
D = 0.17
D = 0.08
Single Pul se
(Thermal Resistance)
t , Rectangular Pulse Duration (Seconds)
1
Fig. 4 - Maximum Thermal Impedance Z
Notes:
1. Duty fac tor D = t / t
2. Pea k T = P x Z + T
Characteristics
thjc
P
DM
t
1
t
2
J DM
21
thJC C
Page 4

HFA105NH60R
To Order
Next Data SheetIndex
Previous Datasheet
240
V = 200V
R
T = 125°C
J
T = 25°C
f
J
I = 200A
F
200
160
rr
t - (ns)
120
80
40
100 1000
I = 40A
F
I = 105A
F
di /dt - (A/µs)
100
V = 200V
R
T = 125°C
J
T = 25°C
J
I = 200A
F
I = 105A
F
I = 40A
F
10
IRRM
I - (A)
1
100 1000
di /dt - (A/µs)
f
Fig. 5 - Typical Reverse Recovery vs. dif/dt Fig. 6 - Typical Recovery Current vs. dif/dt
4000
10000
V = 200V
R
T = 125°C
J
T = 25°C
J
3000
I = 200A
F
I = 105A
2000
RR
Q - (nC)
1000
0
100 1000
F
I = 40A
F
di /dt - (A/µs)
f
Fig. 7 - Typical Stored Charge vs. dif/dt
V = 200V
R
T = 125°C
J
T = 25°C
J
I = 200A
1000
I = 105A
F
di(rec)M/dt - (A/µs)
I = 40A
F
100
100 1000
Fig. 8 - Typical di
F
di /dt - (A/µs)
f
/dt vs. dif/dt
(rec)M
Page 5

REVERSE RECOVERY CIRC UIT
To Order
Next Data SheetIndex
Previous Datasheet
V = 200V
R
Ω
0.01
L = 70µH
D.U.T.
dif/dt
ADJUST
G
D
IRFP250
S
HFA105NH60R
I
F
0
1
1. dif/dt - Rate of change of current
through zero crossing
2. I
- Peak reverse recovery current
RRM
3. trr - Reverse recovery time measured
from zero crossing point of negative
going IF to point where a line passing
through 0.75 I
extrapolated to zero current
and 0.50 I
RRM
di /dt
f
RRM
t
a
3
t
rr
t
b
4
Q
2
I
RRM I
0.75
4. Qrr - Area under curve defined by t
and I
RRM
t
Qrr =
2
5. di
(rec)M
current during tb portion of t
rr
0.5
RRM
di(rec)M/dt
I
RRM
X I
rr
RRM
/dt - Peak rate of change of
5
rr
rr
Fig. 9 - Reverse Recovery Parameter Test
Circuit
L = 100µH
HIGH-SPEED
DUT
Rg = 25 ohm
SWITCH
FREE-WHEEL
DIODE
CURRENT
MONITOR
Fig. 11 - Avalanche Test Circuit and Waveforms
Vd = 50V
Fig. 10 - Reverse Recovery Waveform and
Definitions
I
L(PK)
+
DECAY
TIME
V
(AVAL)
V
R(RATED)
 Loading...