

Page 1
High Accuracy
Instrumentation Amplifier
AMP02
FEATURES
Low Offset Voltage: 100 V max
Low Drift: 2 V/ⴗC max
Wide Gain Range: 1 to 10,000
High Common-Mode Rejection: 115 dB min
High Bandwidth (G = 1000): 200 kHz typ
Gain Equation Accuracy: 0.5% max
Single Resistor Gain Set
Input Overvoltage Protection
Low Cost
Available in Die Form
APPLICATIONS
Differential Amplifier
Strain Gage Amplifier
Thermocouple Amplifier
RTD Amplifier
Programmable Gain Instrumentation Amplifier
Medical Instrumentation
Data Acquisition Systems
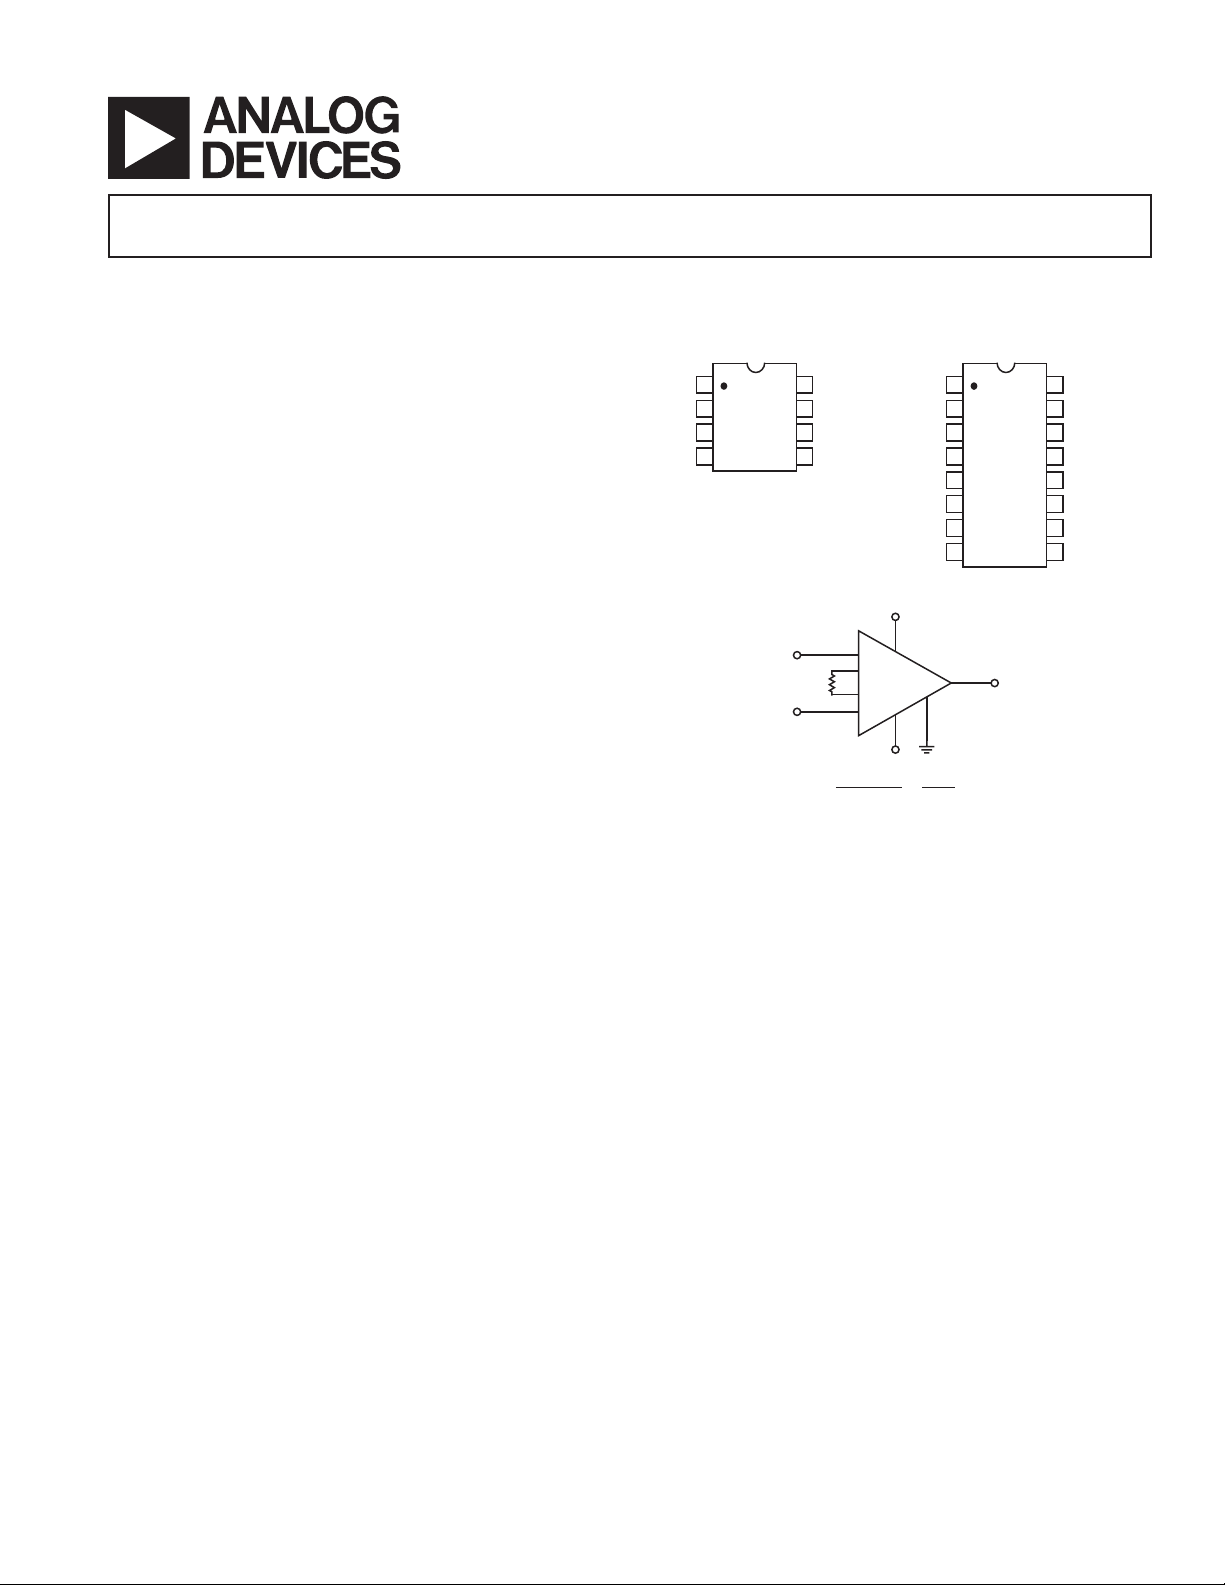
FUNCTIONAL BLOCK DIAGRAM
8-Lead PDIP and CERDIP
RG
–IN
+IN
1
1
2
3
4
V–
8
RG
2
7
V+
6
OUT
5
REFERENCE
3
+IN
–IN
FOR SOL CONNECT SENSE TO OUTPUT
–
1
RG
R
G
G = = + 1
1
8
RG
2
2
+
V
OUT
(+IN) – (–IN)
Figure 1. Basic Circuit Connections
NC
RG
NC
–IN
+IN
NC
V–
NC
V+
7
4
V–
50k⍀
()
16-Lead SOIC
1
2
1
3
4
5
6
7
8
NC = NO CONNECT
6
5
REFERENCE
R
G
OUT
16
NC
15
RG
2
14
NC
13
V+
12
SENSE
11
OUT
10
REFERENCE
9
NC
GENERAL DESCRIPTION
The AMP02 is the first precision instrumentation amplifier
available in an 8-lead package. Gain of the AMP02 is set by a
single external resistor and can range from 1 to 10,000. No
gain set resistor is required for unity gain. The AMP02 includes
an input protection network that allows the inputs to be taken
60 V beyond either supply rail without damaging the device.
Laser trimming reduces the input offset voltage to under 100 µV.
Output offset voltage is below 4 mV, and gain accuracy is better
than 0.5% for a gain of 1000. ADI’s proprietary thin-film resistor process keeps the gain temperature coefficient under 50 ppm/°C.
REV. E
Information furnished by Analog Devices is believed to be accurate and
reliable. However, no responsibility is assumed by Analog Devices for its
use, nor for any infringements of patents or other rights of third parties that
may result from its use. No license is granted by implication or otherwise
under any patent or patent rights of Analog Devices. Trademarks and
registered trademarks are the property of their respective companies.
Due to the AMP02’s design, its bandwidth remains very high
over a wide range of gain. Slew rate is over 4 V/µs, making the
AMP02 ideal for fast data acquisition systems.
A reference pin is provided to allow the output to be referenced
to an external dc level. This pin may be used for offset correction or level shifting as required. In the 8-lead package, sense is
internally connected to the output.
For an instrumentation amplifier with the highest precision,
consult the AMP01 data sheet.
One Technology Way, P.O. Box 9106, Norwood, MA 02062-9106, U.S.A.
Tel: 781/329-4700 www.analog.com
Fax: 781/326-8703 © Analog Devices, Inc., 2002. All rights reserved.
Page 2

AMP02–SPECIFICATIONS
ELECTRICAL CHARACTERISTICS
(@ VS = ⴞ15 V, VCM = 0 V, TA = 25ⴗC, unless otherwise noted.)
AMP02E AMP02F
Parameter Symbol Conditions Min Typ Max Min Typ Max Unit
OFFSET VOLTAGE
Input Offset Voltage V
Input Offset Voltage Drift TCV
Output Offset Voltage V
Output Offset Voltage Drift TCV
Power Supply Rejection PSR VS = ±4.8 V to ±18 V
IOS
IOS
OOS
OOS
TA = 25°C20100 40 200 µV
–40°C ≤ TA ≤ +85°C50200 100 350 µV
–40°C ≤ TA ≤ +85°C 0.5 2 1 4 µV/°C
TA = 25°C1428mV
–40°C ≤ T
–40°C ≤ TA ≤ +85°C50100 100 200 µV/°C
≤ +85°C410920mV
A
G = 100, 1000 115 125 110 115 dB
G = 10 100 110 95 100 dB
G = 1 80 90 75 80 dB
= ±4.8 V to ±18 V
V
S
–40°C ≤ T
G = 1000, 100 110 120 105 110 dB
≤ +85°C
A
G = 10 95 110 90 95 dB
G = 1 75 90 70 75 dB
INPUT CURRENT
Input Bias Current I
Input Bias Current Drift TCI
Input Offset Current I
Input Offset Current Drift TCI
B
OS
B
OS
TA = 25°C210420nA
–40°C ≤ TA ≤ +85°C 150 250 pA/°C
TA = 25°C 1.2 5 2 10 nA
–40°C ≤ TA ≤ +85°C9 15pA/°C
INPUT
Input Resistance R
IN
Input Voltage Range IVR TA = 25°C
Common-Mode Rejection CMR V
Differential, G ≤ 1000 10 10 GΩ
Common Mode, G = 1000 16.5 16.5 GΩ
CM
1
±11 ±11 V
= ±11 V
G = 1000, 100 115 120 110 115 dB
G = 10 100 115 95 110 dB
G = 1 80 95 75 90 dB
VCM = ±11 V
–40°C ≤ TA ≤ +85°C
G = 100, 1000 110 120 105 115 dB
G = 10 95 110 90 105 dB
G = 1 75 90 70 85 dB
GAIN
Gain Equation G = 1000 0.50 0.70 %
Accuracy G =
50 kΩ
+1 G = 100 0.30 0.50 %
R
G
G = 10 0.25 0.40 %
G = 1 0.02 0.05 %
Gain Range G 1 10k 1 10k V/V
Nonlinearity G = 1 to 1000 0.006 0.006 %
Temperature Coefficient G
TC
1 ≤ G ≤ 1000
2, 3
20 50 20 50 ppm/°C
OUTPUT RATING
Output Voltage Swing V
OUT
TA = 25°C, RL = 1 kΩ±12 ±13 ±12 ±13 V
RL = 1 kΩ, –40°C ≤ TA ≤ +85°C ±11 ±12 ±11 ±12 V
Positive Current Limit Output-to-Ground Short 22 22 mA
Negative Current Limit Output-to-Ground Short 32 32 mA
NOISE
Voltage Density, RTI e
n
fO = 1 kHz
G = 1000 9 9 nV/√Hz
G = 100 10 10 nV/√Hz
G = 10 18 18 nV/√Hz
G = 1 120 120 nV/√Hz
Noise Current Density, RTI i
Input Noise Voltage en p-p 0.1 Hz to 10 Hz
n
fO = 1 kHz, G = 1000 0.4 0.4 pA/√Hz
G = 1000 0.4 0.4 µV p-p
G = 100 0.5 0.5 µV p-p
G = 10 1.2 1.2 µV p-p
DYNAMIC RESPONSE
Small-Signal Bandwidth BW G = 1 1200 1200 kHz
(–3 dB) G = 10 300 300 kHz
G = 100, 1000 200 200 kHz
Slew Rate SR G = 10, RL = 1 kΩ 46 4 6 V/µs
Settling Time t
S
To 0.01% ±10 V Step
G = 1 to 1000 10 10 µs
SENSE INPUT
Input Resistance R
Voltage Range ±11 ±11 V
IN
25 25 kΩ
REFERENCE INPUT
Input Resistance R
Voltage Range ±11 ±11 V
IN
50 50 kΩ
Gain to Output 11V/V
REV. E–2–
Page 3
AMP02
AMP02E AMP02F
Parameter Symbol Conditions Min Typ Max Min Typ Max Unit
POWER SUPPLY
Supply Voltage Range V
Supply Current I
NOTES
1
Input voltage range guaranteed by common-mode rejection test.
2
Guaranteed by design.
3
Gain tempco does not include the effects of external component drift.
Specifications subject to change without notice.
S
SY
TA = 25°C5656mA
–40°C ≤ TA ≤ +85°C5656mA
±4.5 ±18 ± 4.5 ±18 V
ABSOLUTE MAXIMUM RATINGS
1, 2
Supply Voltage ±18 V
Common-Mode Input Voltage [(V–) – 60 V] to [(V+) + 60 V]
Differential Input Voltage [(V–) – 60 V] to [(V+) + 60 V]
Output Short-Circuit Duration Continuous
Operating Temperature Range –40°C to +85°C
Storage Temperature Range –65°C to +150°C
Function Temperature Range –65°C to +150°C
Lead Temperature (Soldering, 10 sec) 300°C
Package Type
3
JA
JC
Unit
8-Lead Plastic DIP (P) 96 37 °C/W
16-Lead SOIC (S) 92 27 °C/W
ORDERING GUIDE
V
max @ V
IOS
Model TA = 25ⴗCTA = 25ⴗC Range Description
AMP02EP 100 µV4 mV –40°C to +85°C 8-Lead Plastic DIP
AMP02FP 200 µV8 mV –40°C to +85°C 8-Lead Plastic DIP
AMP02AZ/883C 200 µV 10 mV –55°C to +125°C 8-Lead CERDIP
AMP02FS 200 µV8 mV –40°C to +85°C 16-Lead SOIC
AMP02GBC Die
AMP02FS-REEL 200 µV8 mV –40°C to +85°C 16-Lead SOIC
max @ Temperature Package
OOS
NOTES
1
Stresses above those listed under Absolute Maximum Ratings may cause permanent damage to the device. This is a stress rating only; functional operation of the
device at these or any other conditions above those listed in the operational sections
of this specifications is not implied. Exposure to absolute maximum rating
conditions for extended periods may affect device reliability.
2
Absolute maximum ratings apply to both DICE and packaged parts, unless
otherwise noted.
3
θJA is specified for worst case mounting conditions, i.e., θJA is specified for
device in socket for P-DIP package; θJA is specified for device soldered to
printed circuit board for SOIC package.
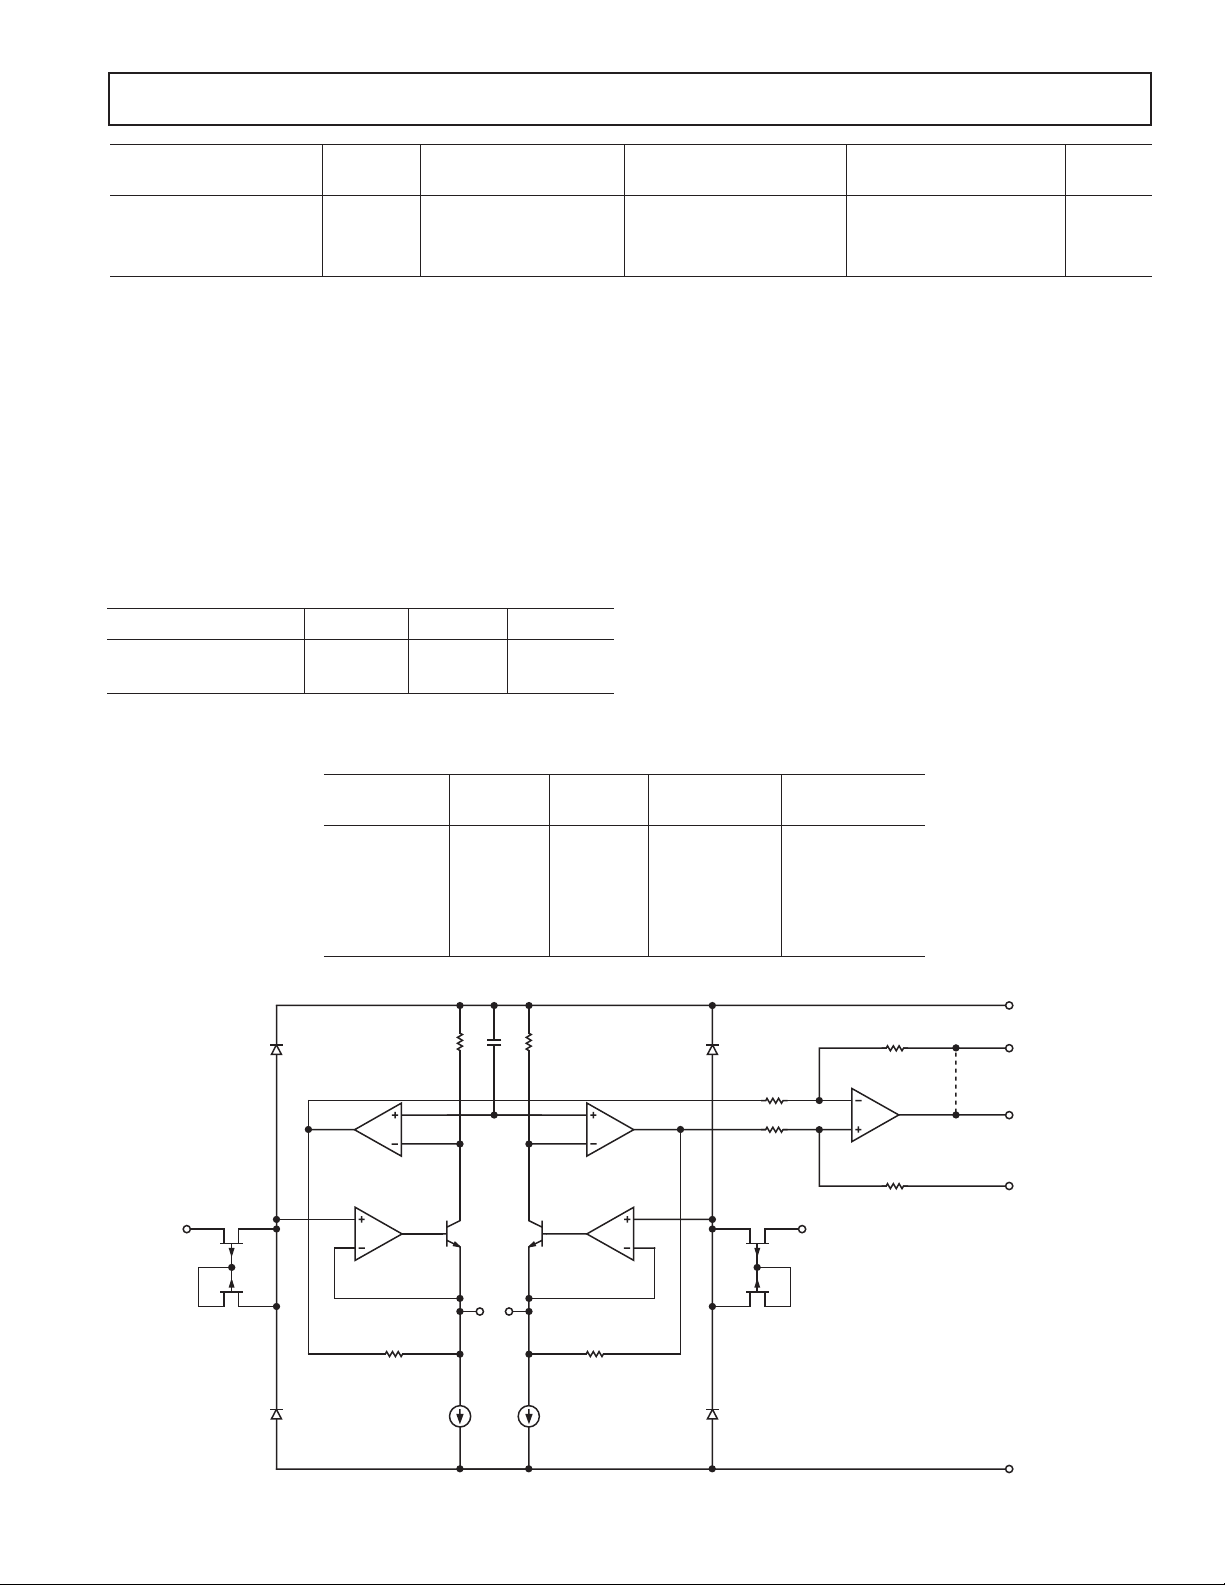
–IN +IN
RG1R
G2
Figure 2. Simplified Schematic
REV. E
–3–
25k⍀
25k⍀
25k⍀
25k⍀
V+
SENSE
OUT
REFERENCE
V–
Page 4
AMP02
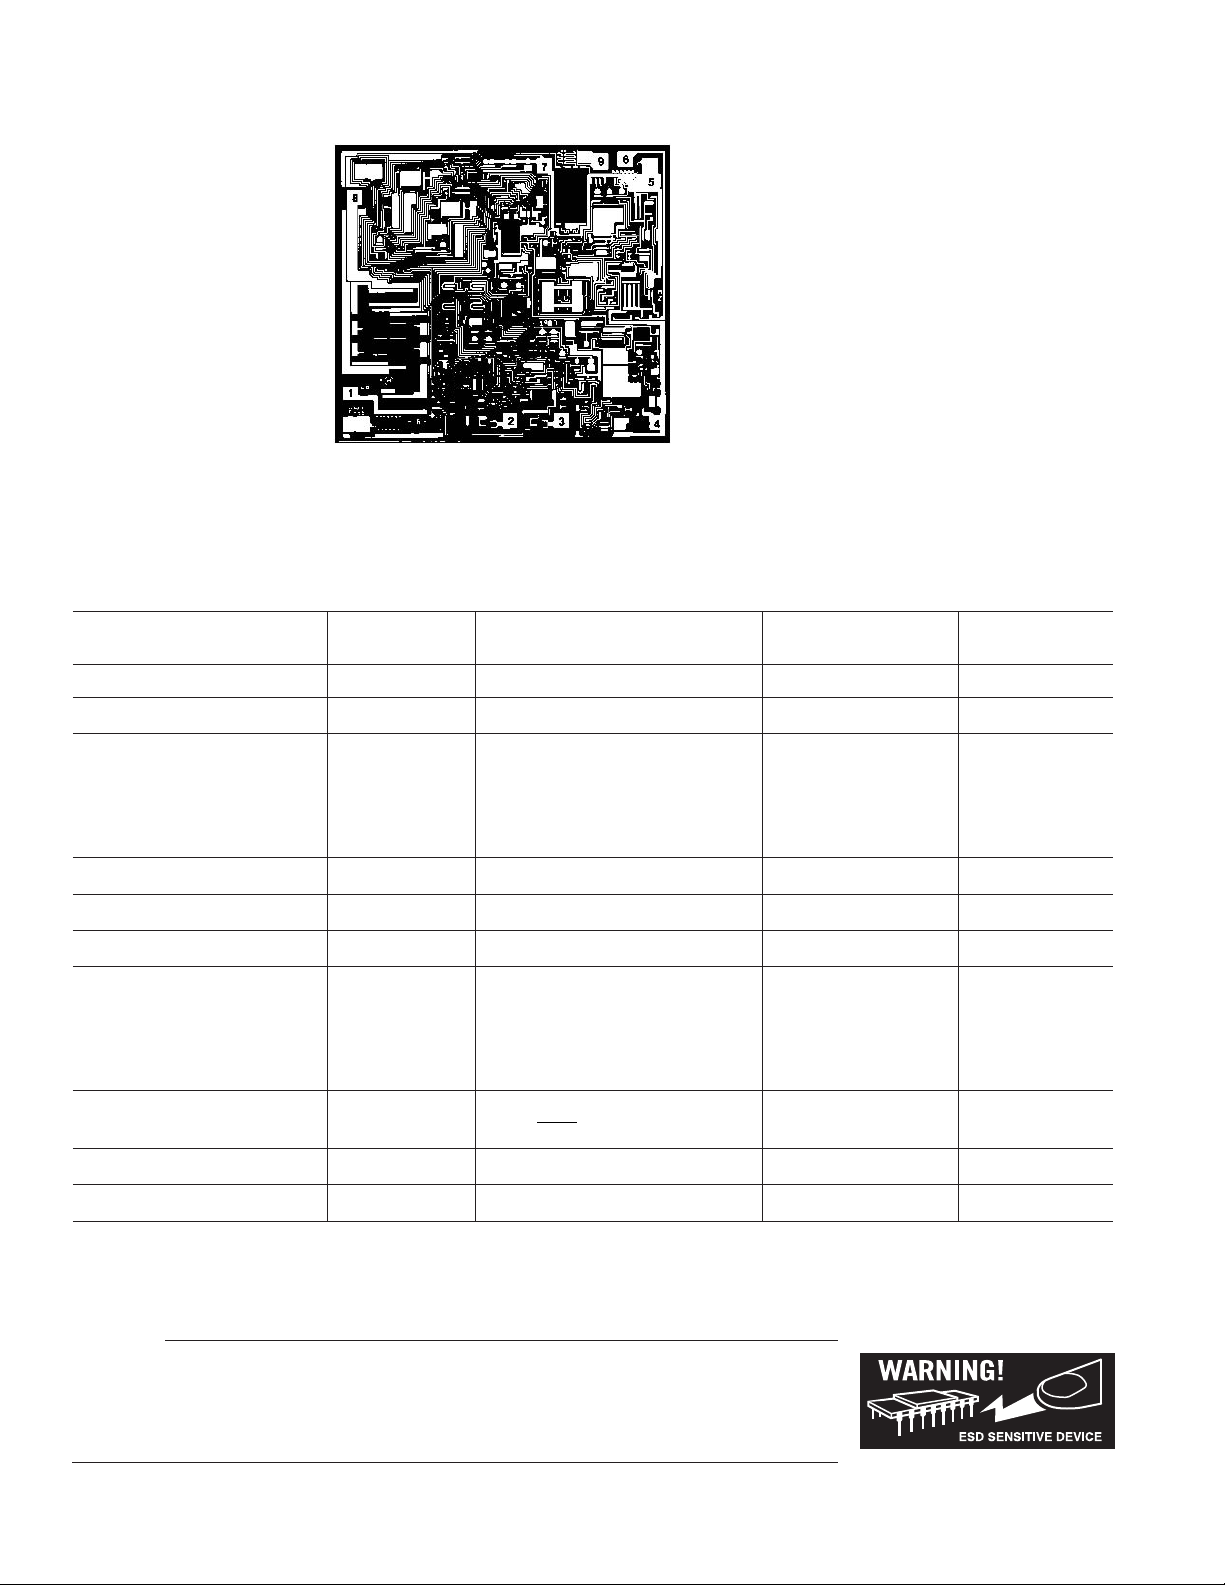
8
1
DIE SIZE 0.103 inch ⴛ 0.116 inch, 11,948 sq. mils
(2.62 mm ⴛ 2.95 mm, 7.73 sq. mm)
NOTE: PINS 1 and 8 are KELVIN CONNECTED
Die Characteristics
1. RG
1
2. –IN
3. +IN
4. V–
5. REFERENCE
6. OUT
7. V+
8. RG
2
9. SENSE
CONNECT SUBSTRATE TO V–
WAFER TEST LIMITS*
(@ VS = ⴞ15 V, VCM = 0 V, TA = 25ⴗC, unless otherwise noted.)
AMP02 GBC
Parameter Symbol Conditions Limits Unit
Input Offset Voltage V
Output Offset Voltage V
IOS
OOS
= ±4.8 V to ±18 V
V
S
200 µV max
8 mV max
G = 1000 110
Power Supply PSR G = 100 110 dB
Rejection G = 10 95
G = 1 75
Input Bias Current I
Input Offset Current I
B
OS
20 nA max
10 nA max
Input Voltage Range IVR Guaranteed by CMR Tests ± 11 V min
= ±11 V
V
CM
G = 1000 110
Common-Mode CMR G = 100 110 dB
Rejection G = 10 95
G = 1 75
50 kΩ
Gain Equation Accuracy
Output Voltage Swing V
Supply Current I
*Electrical tests are performed at wafer probe to the limits shown. Due to variations in assembly methods and normal yield loss, yield after packaging is not
guaranteed for standard product dice. Consult factory to negotiate specifications based on dice lot qualifications through sample lot assembly and testing.
OUT
SY
G =
RL = 1 kΩ±12 V min
+1, G =1000
R
G
0.7 % max
6 mA max
CAUTION
ESD (electrostatic discharge) sensitive device. Electrostatic charges as high as 4000 V readily
accumulate on the human body and test equipment and can discharge without detection. Although the
AMP02 features proprietary ESD protection circuitry, permanent damage may occur on devices
subjected to high energy electrostatic discharges. Therefore, proper ESD precautions are recommended
to avoid performance degradation or loss of functionality.
REV. E–4–
Page 5

Typical Performance Characteristics–AMP02
1100
TA = 25ⴗC
1000
= ⴞ15V
V
S
900
800
700
600
500
400
NUMBER OF UNITS
300
200
100
0
–80 –60 –40 –30 0 20 40 60 80 100
–100
INPUT OFFSET VOLTAGE – V
3000 UNITS
FROM 3 RUNS
TPC 1. Typical Distribution of
Input Offset Voltage
1100
TA = 25ⴗC
1000
= ⴞ15V
V
S
900
800
700
600
500
400
NUMBER OF UNITS
300
200
100
0
–4 –3 –2 –1 012345
–5
OUTPUT OFFSET VOLTAGE – mV
3000 UNITS
FROM 3 RUNS
TPC 4. Typical Distribution of
Output Offset Voltage
160
140
120
100
80
60
NUMBER OF UNITS
40
20
0
0.2 0.4 0.6 0.8 1.0 1.2 1.4 1.6 1.8 2.0
0
TCV
IOS
– V/ⴗC
400 UNITS
FROM 3 RUNS
= ⴞ15V
V
S
TPC 2. Typical Distribution
of TCV
IOS
200
175
150
125
100
75
NUMBER OF UNITS
50
25
0
20 40 60 80 100 120 140 160
0
TCV
OOS
– V/ⴗC
400 UNITS
FROM 3 RUNS
= ⴞ15V
V
S
TPC 5. Typical Distribution
of TCV
OOS
20
15
10
5
0
INPUT OFFSET VOLTAGE – V
–5
–10
ⴞ5 ⴞ10 ⴞ15 ⴞ20
0
POWER SUPPLY VOLTAGE – V
TA = 25ⴗC
TPC 3. Input Offset Voltage
Change vs. Supply Voltage
1.5
1.0
0.5
0
–0.5
INPUT OFFSET VOLTAGE – mV
–1.0
–1.5
0
ⴞ5 ⴞ10 ⴞ15 ⴞ20
POWER SUPPLY VOLTAGE – V
TA = 25ⴗC
TPC 6. Output Offset Voltage
Change vs. Supply Voltage
3.0
2.5
2.0
1.5
1.0
0.5
INPUT OFFSET CURRENT – nA
0
–25 25
–50
05075100
TEMPERATURE – ⴗC
TPC 7. Input Offset Current
vs. Temperature
REV. E
VS = ⴞ15V
= 0V
V
CM
32
28
24
20
16
12
8
INPUT BIAS CURRENT – nA
4
0
–50
05075100
–25 25
TEMPERATURE – ⴗC
TPC 8. Input Bias Current
vs. Temperature
–5–
VS = ⴞ15V
= 0V
V
CM
6
5
4
3
2
INPUT BIAS CURRENT – nA
1
0
ⴞ5
0
POWER SUPPLY VOLTAGE – V
VS = ⴞ15V
V
CM
ⴞ10 ⴞ15 ⴞ20
TPC 9. Input Bias Current
vs. Supply Voltage
= 0V
Page 6

AMP02
80
G = 1000
60
G = 100
40
G = 10
20
G = 1
0
VOLTA GE GAIN – dB
–20
–40
10k
1k
FREQUENCY – Hz
TA = 25ⴗC
= ⴞ15V
V
S
100k 1M 10M
TPC 10. Closed-Loop Voltage
Gain vs. Frequency
140
G = 1000
120
G = 10
100
G = 1
80
60
40
TA = 25ⴗC
20
POWER SUPPLY REJECTION – dB
= ⴞ15V
V
S
= ⴞ1V
⌬V
S
0
1 10k 100k
100
FREQUENCY – Hz
G = 100
1k10
TPC 13. Positive PSR vs. Frequency
140
TA = 25ⴗC
= ⴞ15V
V
S
= 2V p-p
V
CM
10
G = 1000
G = 100
G = 10
G = 1
10k
FREQUENCY – Hz
120
100
80
60
40
20
COMMON-MODE REJECTION – dB
0
1 100 1k 100k
TPC 11. Common-Mode Rejection
vs. Frequency
140
G = 1000
120
G = 10
100
G = 1
80
60
40
TA = 25ⴗC
20
POWER SUPPLY REJECTION – dB
= ⴞ15V
V
S
= ⴞ1V
⌬V
S
0
1 10k 100k
100
FREQUENCY – Hz
G = 100
1k10
TPC 14. Negative PSR vs. Frequency
140
130
120
110
100
90
80
COMMON-MODE REJECTION – dB
70
1 100 1k
10
VOLTA GE GAIN – G
TA = 25ⴗC
= ⴞ15V
V
S
TPC 12. Common-Mode Rejection
vs. Voltage Gain
1.000
T
= 25ⴗC
A
= ⴞ15V
V
S
= 600⍀
R
L
= 20V p-p
V
OUT
0.100
0.010
TOTA L HARMONIC DISTORTION – %
0.01
10 1k 10k
G = 100
G = 1
G = 10
100
FREQUENCY – Hz
TPC 15. Total Harmonic Distortion
vs. Frequency
70
TA = 25ⴗC
= ⴞ15V
V
S
60
G = 1000
50
40
30
20
10
VOLTA G E NOISE DENSITY – nV/ Hz
0
1 10k 100k
FREQUENCY – Hz
100
1k10
TPC 16. Voltage Noise Density
vs. Frequency
1k
TA = 25ⴗC
= ⴞ15V
V
S
f = 1kHz
100
10
VOLTA G E NOISE – nV/ Hz
1
1 100 1k
10
VOLTA GE GAIN – G
TPC 17. RTI Voltage Noise
Density vs. Gain
NOISE VOLTAGE – 200nV/DIV
TIME – S
TPC 18. 0.1 Hz to 10 Hz Noise
= 1000
A
V
1s100mV
REV. E–6–
Page 7

AMP02
FREQUENCY – Hz
OUTPUT IMPEDANCE –
⍀
100 1M 10M
–20
TA = 25ⴗC
V
S
= ⴞ15V
I
OUT
= 20mA p-p
10k
0
20
40
60
80
100
120
100k1k
30
25
20
15
10
5
PEAK- TO-PEAK AMPLITUDE – V
0
100
1k
10k 100k 1M
FREQUENCY – Hz
TA = 25ⴗC
= ⴞ15V
V
S
= 1k⍀
R
L
TPC 19. Maximum Output Swing
vs. Frequency
8
7
6
5
4
SUPPLY CURRENT – mA
3
TA = –25ⴗC, +25ⴗC, +85ⴗC
16
TA = 25ⴗC
= ⴞ15V
V
S
14
12
10
8
6
OUTPUT VOLTAGE – V
4
2
0
10
100
LOAD RESISTANCE – ⍀
1k 10k 100k
TPC 20. Maximum Output Voltage
vs. Load Resistance
8
VS = ⴞ15V
7
6
s
5
4
SLEW RATE – V
3
2
TA = –40ⴗC, +25ⴗC, +85ⴗC
TPC 21. Closed Loop Output
Impedance vs. Frequency
1
0 ⴞ20
ⴞ10
SUPPLY VOLTAGE – V
ⴞ15ⴞ5
TPC 22. Supply Current
vs. Supply Voltage
1
1 100 1k
10
VOLTA GE GAIN – G
TPC 23. Slew Rate vs.
Voltage Gain
REV. E
–7–
Page 8

AMP02
APPLICATIONS INFORMATION
Input and Output Offset Voltages
Instrumentation amplifiers have independent offset voltages
associated with the input and output stages. The input offset
component is directly multiplied by the amplifier gain, whereas
output offset is independent of gain. Therefore at low gain,
output-offset errors dominate while at high gain, input-offset
errors dominate. Overall offset voltage, V
, referred to the
OS
output (RTO) is calculated as follows:
where V
IOS
V RTO V G V
OS IOS OOS
and V
OOS
=×
()
()
+
are the input and output offset voltage
specifications and G is the amplifier gain.
The overall offset voltage drift TCV
, referred to the output, is
OS
a combination of input and output drift specifications. Input
offset voltage drift is multiplied by the amplifier gain, G, and
summed with the output offset drift:
where TCV
TCV RTO TCV G TCV
()
OS IOS OOS
is the input offset voltage drift, and TCV
IOS
=×
()
+
is
OOS
the output offset voltage drift. Frequently, the amplifier drift is
referred back to the input (RTI), which is then equivalent to an
input signal change:
TCV
TCV RTI TCV
OS IOS
=+
()
OOS
G
For example, the maximum input-referred drift of an
AMP02EP set to G = 1000 becomes:
o
VC
100
TCV RTI V C
OS
=+ =2
()
o
µ
1000
21µ
.
VC
µ
o
Input Bias and Offset Currents
Input transistor bias currents are additional error sources that
can degrade the input signal. Bias currents flowing through the
signal source resistance appear as an additional offset voltage.
Equal source resistance on both inputs of an IA will minimize
offset changes due to bias current variations with signal voltage
and temperature; however, the difference between the two bias
currents (the input offset current) produces an error. The magnitude of the error is the offset current times the source resistance.
A current path must always be provided between the differential
inputs and analog ground to ensure correct amplifier operation.
Floating inputs such as thermocouples should be grounded
close to the signal source for best common-mode rejection.
Gain
The AMP02 only requires a single external resistor to set the
voltage gain. The voltage gain, G, is:
50 kΩ
G =
+1
R
G
and
50 kΩ
RG =
G –1
The voltage gain can range from 1 to 10,000. A gain set resistor is
not required for unity-gain applications. Metal-film or wirewound
resistors are recommended for best results.
The total gain accuracy of the AMP02 is determined by the
tolerance of the external gain set resistor, R
, combined with the
G
gain equation accuracy of the AMP02. Total gain drift combines
the mismatch of the external gain set resistor drift with that of the
internal resistors (20 ppm/°C typ). Maximum gain drift of the
AMP02 independent of the external gain set resistor is 50 ppm/°C.
All instrumentation amplifiers require attention to layout so
thermocouple effects are minimized. Thermocouples formed
between copper and dissimilar metals can easily destroy the
TCV
performance of the AMP02, which is typically 0.5 µV/°C.
OS
Resistors themselves can generate thermoelectric EMFs when
mounted parallel to a thermal gradient.
The AMP02 uses the triple op amp instrumentation amplifier
configuration with the input stage consisting of two transimpedance amplifiers followed by a unity-gain differential amplifier.
The input stage and output buffer are laser-trimmed to increase
gain accuracy. The AMP02 maintains wide bandwidth at all
gains as shown in Figure 3. For voltage gains greater than 10,
the bandwidth is over 200 kHz. At unity gain, the bandwidth of
the AMP02 exceeds 1 MHz.
80
G = 1000
60
G = 100
40
G = 10
20
G = 1
0
VOLTA GE GAIN – dB
–20
–40
1k 100k 1M 10M
10k
FREQUENCY – Hz
TA = 25ⴗC
= ⴞ15V
V
S
Figure 3. The AMP02 Keeps Its Bandwidth at
High Gains
Common-Mode Rejection
Ideally, an instrumentation amplifier responds only to the difference between the two input signals and rejects common-mode
voltages and noise. In practice, there is a small change in output
voltage when both inputs experience the same common-mode
voltage change; the ratio of these voltages is called the
common-mode gain. Common-mode rejection (CMR) is the
logarithm of the ratio of differential-mode gain to common-mode
gain, expressed in dB. Laser trimming is used to achieve the
high CMR of the AMP02.
REV. E–8–
Page 9

AMP02
3
+IN
–IN
8
G2
R
G
1
G1
2
R
R
Figure 4. Triple Op Amp Topology
R
25k⍀
R
25k⍀
V
1
25k⍀
25k⍀
V
2
25k⍀
25k⍀
6
5
SENSE
(SOIC-16 ONLY)
OUT
REFERENCE
Figure 4 shows the triple op amp configuration of the AMP02.
With all instrumentation amplifiers of this type, it is critical not
to exceed the dynamic range of the input amplifiers. The amplified differential input signal and the input common-mode voltage must not force the amplifier’s output voltage beyond ±12 V
= ±15 V) or nonlinear operation will result.
(V
S
The input stage amplifier’s output voltages at V1 and V2 equal:
V
=+
–
1
G
=+
–
V
1
=+
2
G
=+
RRV
2
D
V
CM
CM
2
V
+
CM
2
D
V
+
CM
1
G
V
D
2
RRV
2
G
V
D
V
2
where:
V
= Differential input voltage
D
= (+IN) – (–IN)
V
= Common-mode input voltage
CM
G = Gain of instrumentation amplifier
If V
and V2 can equal ±12 V maximum, the common-mode
1
input voltage range is:
CMVR V
=± −
12
GV
D
2
Grounding
The majority of instruments and data acquisition systems have
separate grounds for analog and digital signals. Analog ground may
also be divided into two or more grounds that will be tied together
at one point, usually at the analog power supply ground. In
addition, the digital and analog grounds may be joined—normally
at the analog ground pin on the A/D converter. Following this
basic practice is essential for good circuit performance.
Mixing grounds causes interactions between digital circuits and the
analog signals. Since the ground returns have finite resistance
and inductance, hundreds of millivolts can be developed between
the system ground and the data acquisition components. Using
separate ground returns minimizes the current flow in the sensitive
analog return path to the system ground point. Consequently, noisy
ground currents from logic gates interact with the analog signals.
Inevitably, two or more circuits will be joined together with
their grounds at differential potentials. In these situations, the
differential input of an instrumentation amplifier, with its high
CMR, can accurately transfer analog information from one
circuit to another.
Sense and Reference Terminals
The sense terminal completes the feedback path for the instrumentation amplifier output stage and is internally connected directly
to the output. For SOIC devices, connect the sense terminal to
the output. The output signal is specified with respect to the reference terminal, which is normally connected to analog ground.
The reference may also be used for offset correction level shifting. A reference source resistance will reduce the common-mode
rejection by the ratio of 25 kΩ/R
. If the reference source resis-
REF
tance is 1 Ω, the CMR will be reduced 88 dB (25 kΩ/1 Ω = 88 dB).
REV. E
–9–
Page 10

AMP02
Overvoltage Protection
Instrumentation amplifiers invariably sit at the front end of
instrumentation systems where there is a high probability of
exposure to overloads. Voltage transients, failure of a transducer,
or removal of the amplifier power supply while the signal source is
connected may destroy or degrade the performance of an unprotected device. A common technique is to place limiting resistors in
series with each input, but this adds noise. The AMP02 includes
internal protection circuitry that limits the input current to ±4 mA
for a 60 V differential overload (see Figure 5) with power off,
±2.5 mA with power on.
4
TA = 25ⴗC
= ⴞ15V
V
S
3
2
1
0
–1
LEAKAGE CURRENT – mA
–2
–3
–4
–100
–80 –60 –40 –20 0 20 40 60 80 100
DIFFERENTIAL INPUT VOLTAGE
POWER OFF
POWER ON
Figure 5. AMP02’s Input Protection Circuitry Limits Input
Current During Overvoltage Conditions
Power Supply Considerations
Achieving the rated performance of precision amplifiers in a
practical circuit requires careful attention to external influences.
For example, supply noise and changes in the nominal voltage
directly affect the input offset voltage. A PSR of 80 dB means
that a change of 100 mV on the supply (not an uncommon
value) will produce a 10 µV input offset change. Consequently,
care should be taken in choosing a power unit that has a low
output noise level, good line and load regulation, and good
temperature stability. In addition, each power supply should be
properly bypassed.
REV. E–10–
Page 11

OUTLINE DIMENSIONS
1
4
85
0.310 (7.87)
0.220 (5.59)
PIN 1
0.005 (0.13)
MIN
0.055 (1.40)
MAX
0.100 (2.54) BSC
15
0
0.320 (8.13)
0.290 (7.37)
0.015 (0.38)
0.008 (0.20)
SEATING
PLANE
0.200 (5.08)
MAX
0.405 (10.29) MAX
0.150 (3.81)
MIN
0.200 (5.08)
0.125 (3.18)
0.023 (0.58)
0.014 (0.36)
0.070 (1.78)
0.030 (0.76)
0.060 (1.52)
0.015 (0.38)
CONTROLLING DIMENSIONS ARE IN INCHES; MILLIMETERS DIMENSIONS
(IN PARENTHESES) ARE ROUNDED-OFF INCH EQUIVALENTS FOR
REFERENCE ONLY AND ARE NOT APPROPRIATE FOR USE IN DESIGN
AMP02
8-Lead Plastic Dual-in-Line Package [PDIP]
(N-8)
Dimensions shown in inches and (millimeters)
0.375 (9.53)
0.365 (9.27)
0.355 (9.02)
8
1
0.100 (2.54)
0.180
(4.57)
MAX
0.150 (3.81)
0.130 (3.30)
0.110 (2.79)
0.022 (0.56)
0.018 (0.46)
0.014 (0.36)
CONTROLLING DIMENSIONS ARE IN INCHES; MILLIMETER DIMENSIONS
(IN PARENTHESES) ARE ROUNDED-OFF INCH EQUIVALENTS FOR
REFERENCE ONLY AND ARE NOT APPROPRIATE FOR USE IN DESIGN
COMPLIANT TO JEDEC STANDARDS MO-095AA
BSC
5
4
0.295 (7.49)
0.285 (7.24)
0.275 (6.98)
0.015
(0.38)
MIN
SEATING
PLANE
0.060 (1.52)
0.050 (1.27)
0.045 (1.14)
0.325 (8.26)
0.310 (7.87)
0.300 (7.62)
0.150 (3.81)
0.135 (3.43)
0.120 (3.05)
0.015 (0.38)
0.010 (0.25)
0.008 (0.20)
8-Lead Ceramic DIP - Glass Hermetic Seal [CERDIP]
(Q-8)
Dimensions shown in inches and (millimeters)
0.30 (0.0118)
0.10 (0.0039)
REV. E
COPLANARITY
CONTROLLING DIMENSIONS ARE IN MILLIMETERS; INCH DIMENSIONS
(IN PARENTHESES) ARE ROUNDED-OFF MILLIMETER EQUIVALENTS FOR
REFERENCE ONLY AND ARE NOT APPROPRIATE FOR USE IN DESIGN
16-Lead Standard Small Outline Package [SOIC]
Wide Body
(R-16)
Dimensions shown in millimeters and (inches)
10.50 (0.4134)
10.10 (0.3976)
16
1
1.27 (0.0500)
BSC
0.51 (0.0201)
0.10
0.33 (0.0130)
COMPLIANT TO JEDEC STANDARDS MS-013AA
9
7.60 (0.2992)
7.40 (0.2913)
8
2.65 (0.1043)
2.35 (0.0925)
SEATING
PLANE
10.65 (0.4193)
10.00 (0.3937)
0.32 (0.0126)
0.23 (0.0091)
0.75 (0.0295)
0.25 (0.0098)
8ⴗ
0ⴗ
ⴛ 45ⴗ
1.27 (0.0500)
0.40 (0.0157)
–11–
Page 12

AMP02
Revision History
Location Page
1/03—Data Sheet changed from REV. D to REV. E.
Edits to Figure 2 .............................................................................................................................................................................3
Edits to Die Characteristics .............................................................................................................................................................4
Updated OUTLINE DIMENSIONS.............................................................................................................................................11
C00248–0–1/03(E)
–12–
PRINTED IN U.S.A.
REV. E
 Loading...