

Page 1
3.6 V, 500 mA Logic Controlled
Data Sheet
FEATURES
Constant low RDSON of 40 mΩ over input voltage range
Low input voltage range: 0.9 V to 3.6 V
500 mA continuous operating current at 85°C
1.2 V logic compatible enable input
Low 6 μA quiescent current, independent of load current
Ultralow shutdown current: <100 nA
Ultrasmall 0.8 mm × 0.8 mm × 0.5 mm, 4-ball,
0.4 mm pitch WLCSP
APPLICATIONS
Low operating voltage processors
Mobile phones
Digital cameras and audio devices
Portable and battery-powered equipment
Optical XMT/RCVR modules
High-Side Load Switch
ADP199
GENERAL DESCRIPTION
The ADP199 is a high-side load switch designed for operation between 0.9 V to 3.6 V. A load switch provides power
domain isolation, thereby helping to keep subsystems isolated
and powered independently, and enabling reduced power
consumption.
The ADP199 contains a low on-resistance, N-channel MOSFET
to minimize power loss, and supports over 500 mA of continuous
load current. The low 6 µA quiescent current and ultralow
shutdown current make the ADP199 ideal for battery-operated
portable equipment. The built-in level shifter for enable logic
makes the ADP199 compatible with many processors and GPIO
controllers.
In addition to high performance, the ADP199 occupies minimal printed circuit board (PCB) space with an area of less than
0.64 mm
The ADP199 is available in an ultra-small, 0.8 mm × 0.8 mm ×
0.5 mm, 4-ball, 0.4 mm pitch WLCSP.
2
and a height of 0.50 mm.
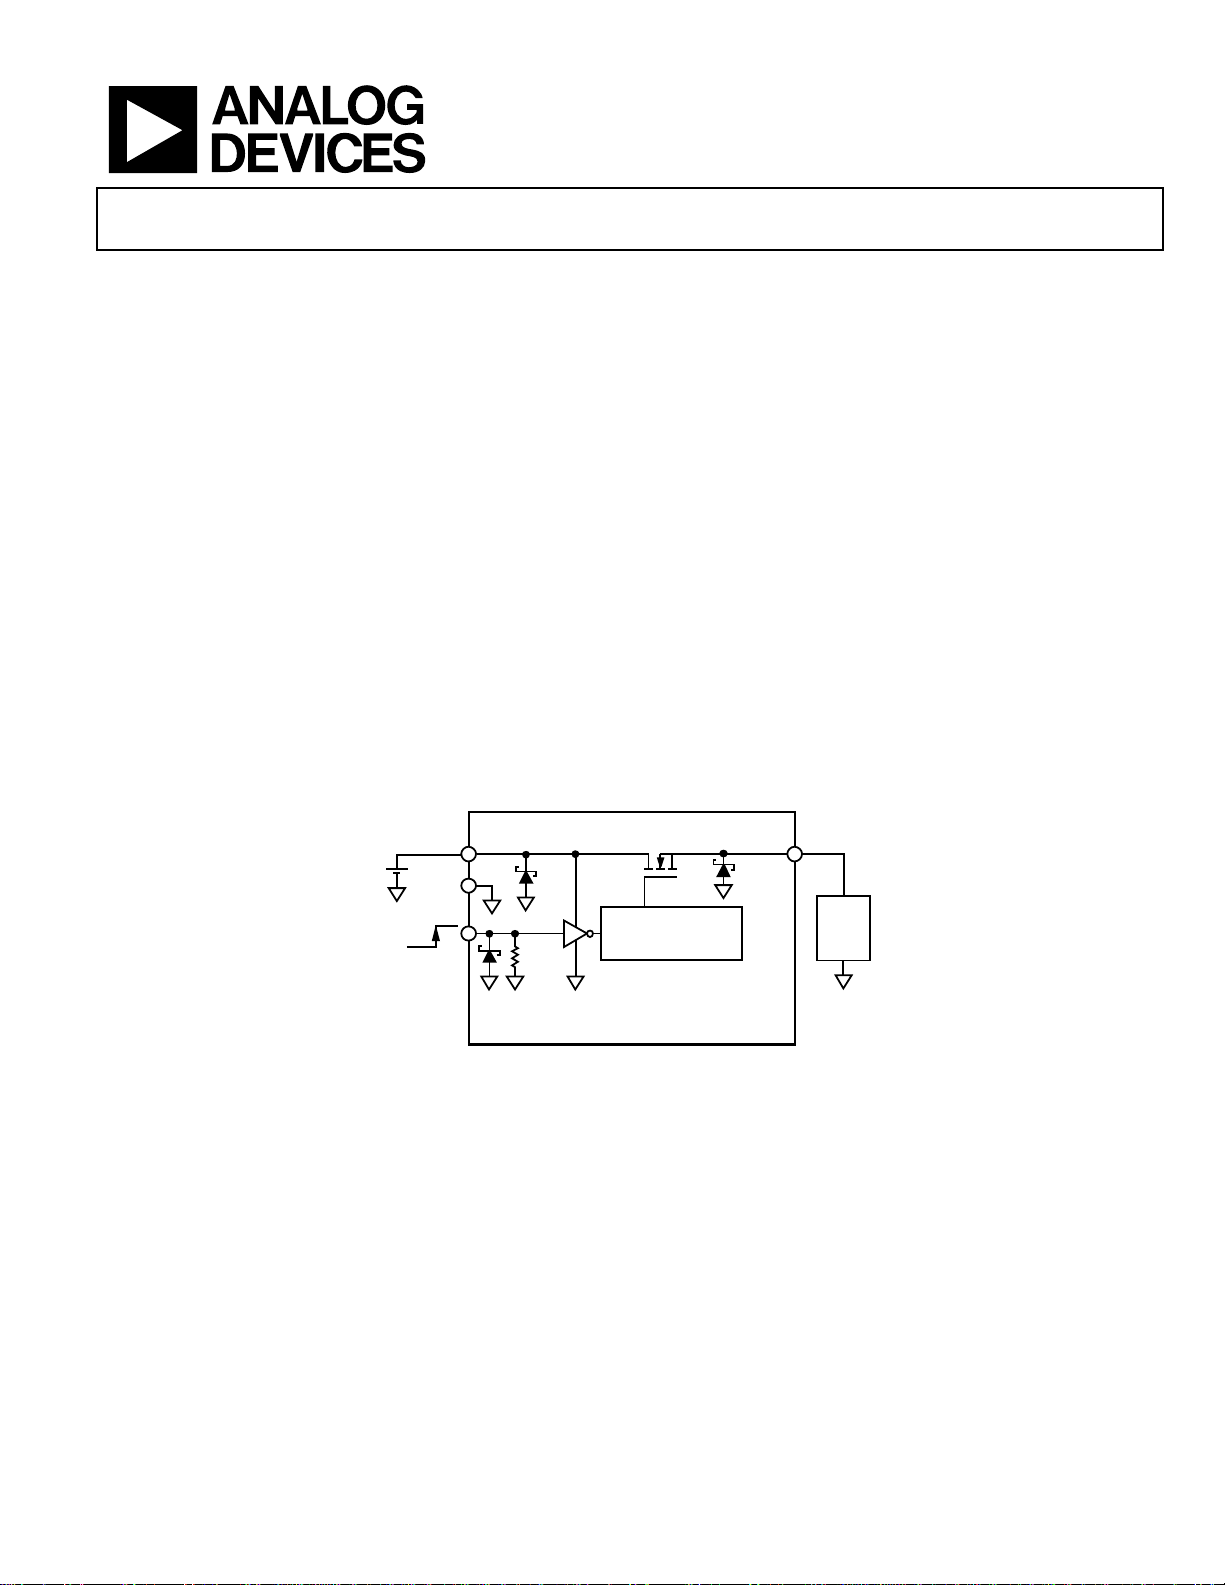
TYPICAL APPLICATIONS CIRCUIT
VIN
+
–
GND
EN
ON
OFF
4Ω
CHARGE PUMP
AND SLEW RATE
CONTROL
ADP199
Figure 1.
VOUT
LOAD
09672-001
Rev. 0
Information furnished by Analog Devices is believed to be accurate and reliable. However, no
responsibility is assumed by Anal og Devices for its use, nor for any infringements of patents or ot her
rights of third parties that may result from its use. Specifications subject to change without notice. No
license is granted by implication or otherwise under any patent or patent rights of Analog Devices.
Trademarks and registered trademarks are the property of their respective owners.
One Technology Way, P.O. Box 9106, Norwood, MA 02062-9106, U.S.A.
Tel: 781.329.4700 www.analog.com
Fax: 781.461.3113 ©2011 Analog Devices, Inc. All rights reserved.
Page 2

ADP199 Data Sheet
TABLE OF CONTENTS
Features.............................................................................................. 1
Applications....................................................................................... 1
General Description ......................................................................... 1
Typical Applications Circuit............................................................ 1
Revision History ............................................................................... 2
Specifications..................................................................................... 3
Timing Diagram........................................................................... 3
Absolute Maximum Ratings............................................................ 4
ESD Caution.................................................................................. 4
Pin Configuration and Function Descriptions............................. 5
REVISION HISTORY
/11—Revision 0: Initial Version
Typical Performance Characteristics..............................................6
Theory of Operation ...................................................................... 11
Applications Information.............................................................. 12
Ground Current.......................................................................... 12
Enable Feature ............................................................................ 12
Timing ......................................................................................... 12
Outline Dimensions....................................................................... 14
Ordering Guide .......................................................................... 14
Rev. 0 | Page 2 of 16
Page 3
Data Sheet ADP199
V
SPECIFICATIONS
VIN = 1.8 V, VEN = VIN, I
Table 1.
Parameter Symbol Test Conditions/Comments Min Typ Max Unit
INPUT VOLTAGE RANGE VIN T
EN INPUT
EN Input Threshold VIH % of VIN, VIN = 0.9 V to 3.6 V, TJ = −40°C to +85°C 65 %
V
EN Input Pull-Down Current IEN V
CURRENT
Ground Current I
V
V
V
Off State Current I
V
V
Continuous Operating Current I
VIN to V
RESISTANCE RDSON
OUT
V
V
V
V
V
TURN-ON DELAY TIME See Figure 2
OUT
Turn-On Delay Time t
V
TURN-OFF DELAY TIME See Figure 2
OUT
Turn-Off Delay Time t
= 200 mA, TA = 25°C, unless otherwise noted.
OUT
= −40°C to +85°C 0.9 3.6 V
J
% of VIN, VIN = 0.9 V to 3.6 V, TJ = −40°C to +85°C 25 %
IL
= 1.8 V 450 nA
IN
V
GND
VEN = GND, V
OFF-IN
V
OUT
VIN = 1.8 V, C
ON_DLY
VIN = 1.8 V, I
OFF_DLY
= 0.9 V 3 µA
IN
= 1.2 V 4 µA
IN
= 1.8 V, TJ = −40°C to +85°C 6 20 µA
IN
= 3.6 V 35 µA
IN
= 0 V 90 nA
OUT
= 0 V, VIN = 3.6 V, V
EN
= GND, TJ = −40°C to +85°C, V
EN
= 0.9 V to 3.6 V, TJ = −40°C to +85°C 500 mA
IN
= 0.9 V 0.04 Ω
IN
= 1.2 V 0.04 Ω
IN
= 1.8 V, TJ = −40°C to +85°C 0.04 0.09 Ω
IN
= 3.6 V 0.04 Ω
IN
= 4.7 µF 20 s
LOAD
= 10 mA, C
LOAD
= 0 V 165 nA
OUT
= 0 V 3 µA
OUT
= 4.7 µF 60 s
LOAD
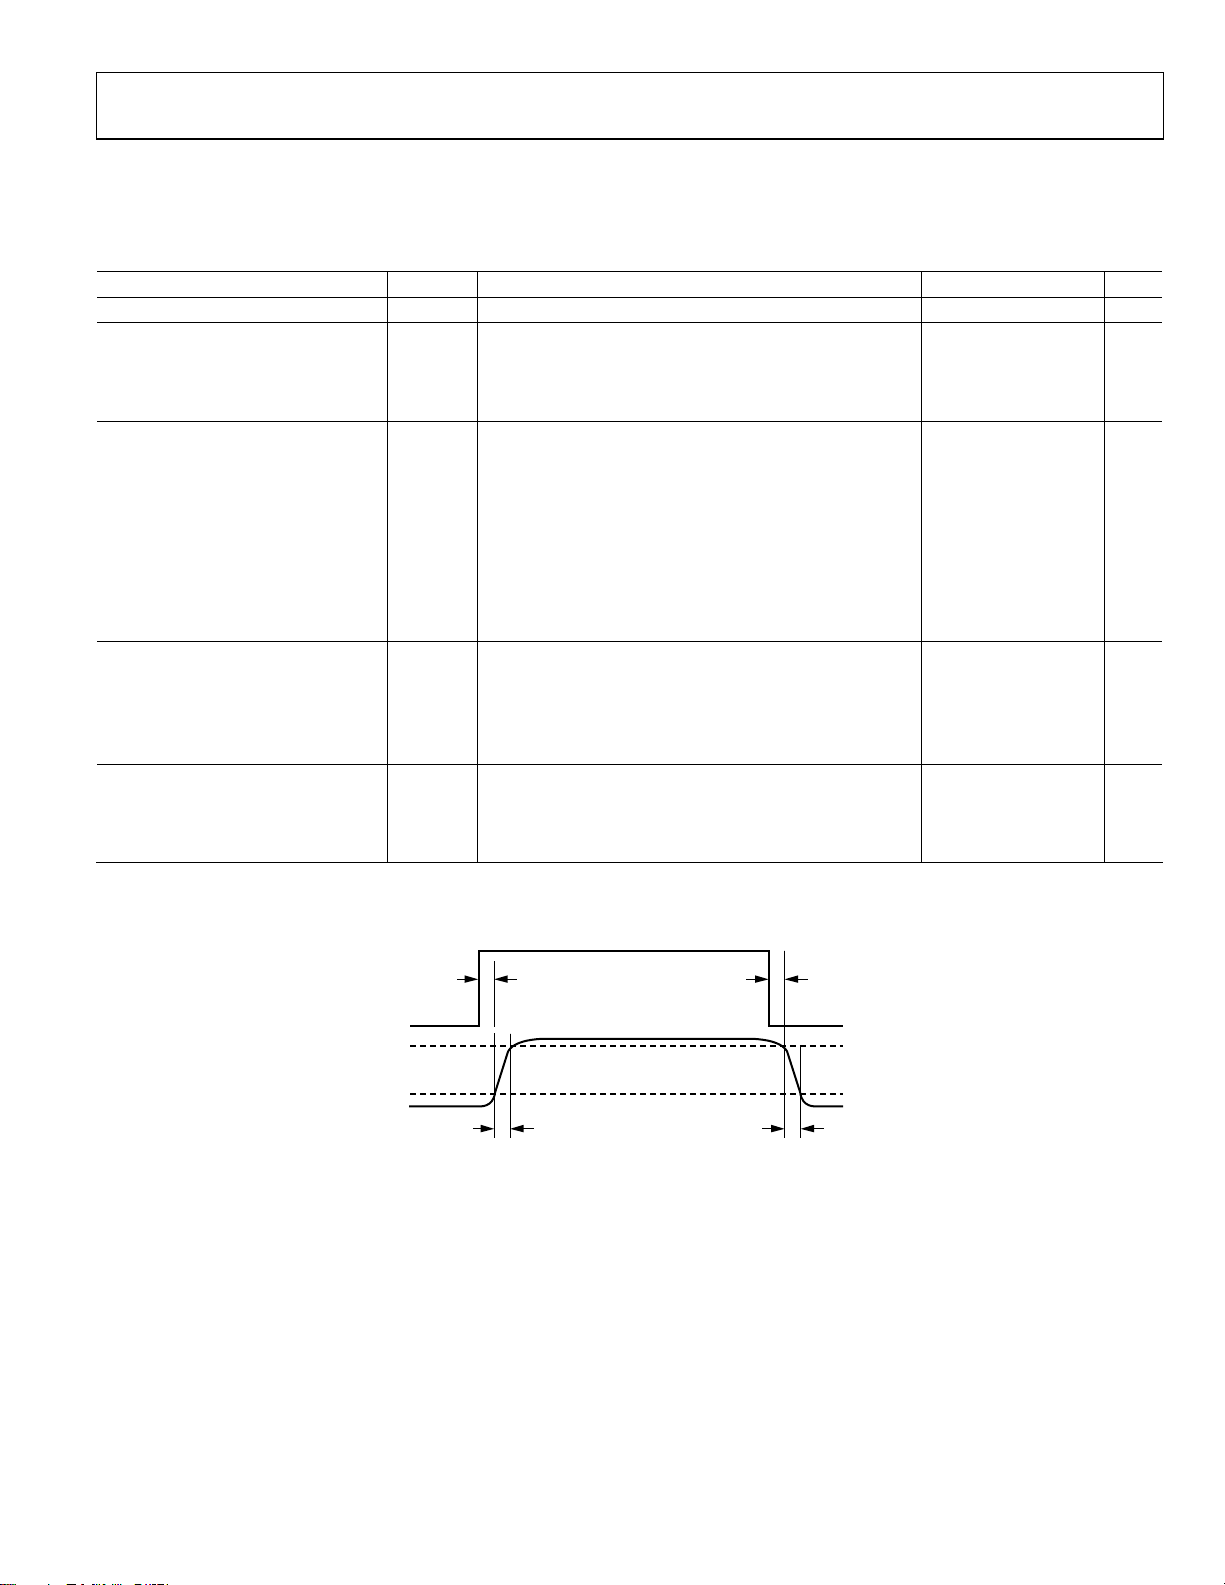
TIMING DIAGRAM
TURN-ON
DELAY
90%
10%
TURN-ON
RISE
EN
TURN-OFF
V
OUT
TURN-OFF
Figure 2. Timing Diagram
DELAY
FALL
09672-002
Rev. 0 | Page 3 of 16
Page 4
ADP199 Data Sheet
ABSOLUTE MAXIMUM RATINGS
Table 2.
Parameter Rating
VIN to GND −0.3 V to +4.0 V
VOUT to GND −0.3 V to VIN
EN to GND −0.3 V to +4.0 V
Continuous Drain Current
TA = 25°C ±1000 mA
TA = 85°C ±700 mA
Continuous Diode Current −50 mA
Storage Temperature Range −65°C to +150°C
Operating Junction Temperature Range −40°C to +85°C
Soldering Conditions JEDEC J-STD-020
Stresses above those listed under Absolute Maximum Ratings
may cause permanent damage to the device. This is a stress
rating only; functional operation of the device at these or any
other conditions above those indicated in the operational
section of this specification is not implied. Exposure to absolute
maximum rating conditions for extended periods may affect
device reliability.
Table 3. Typical θ
Package Type θJA ΨJB Unit
4-Ball, 0.4 mm Pitch WLCSP 260 58 °C/W
ESD CAUTION
and ΨJB Values
JA
Rev. 0 | Page 4 of 16
Page 5
Data Sheet ADP199
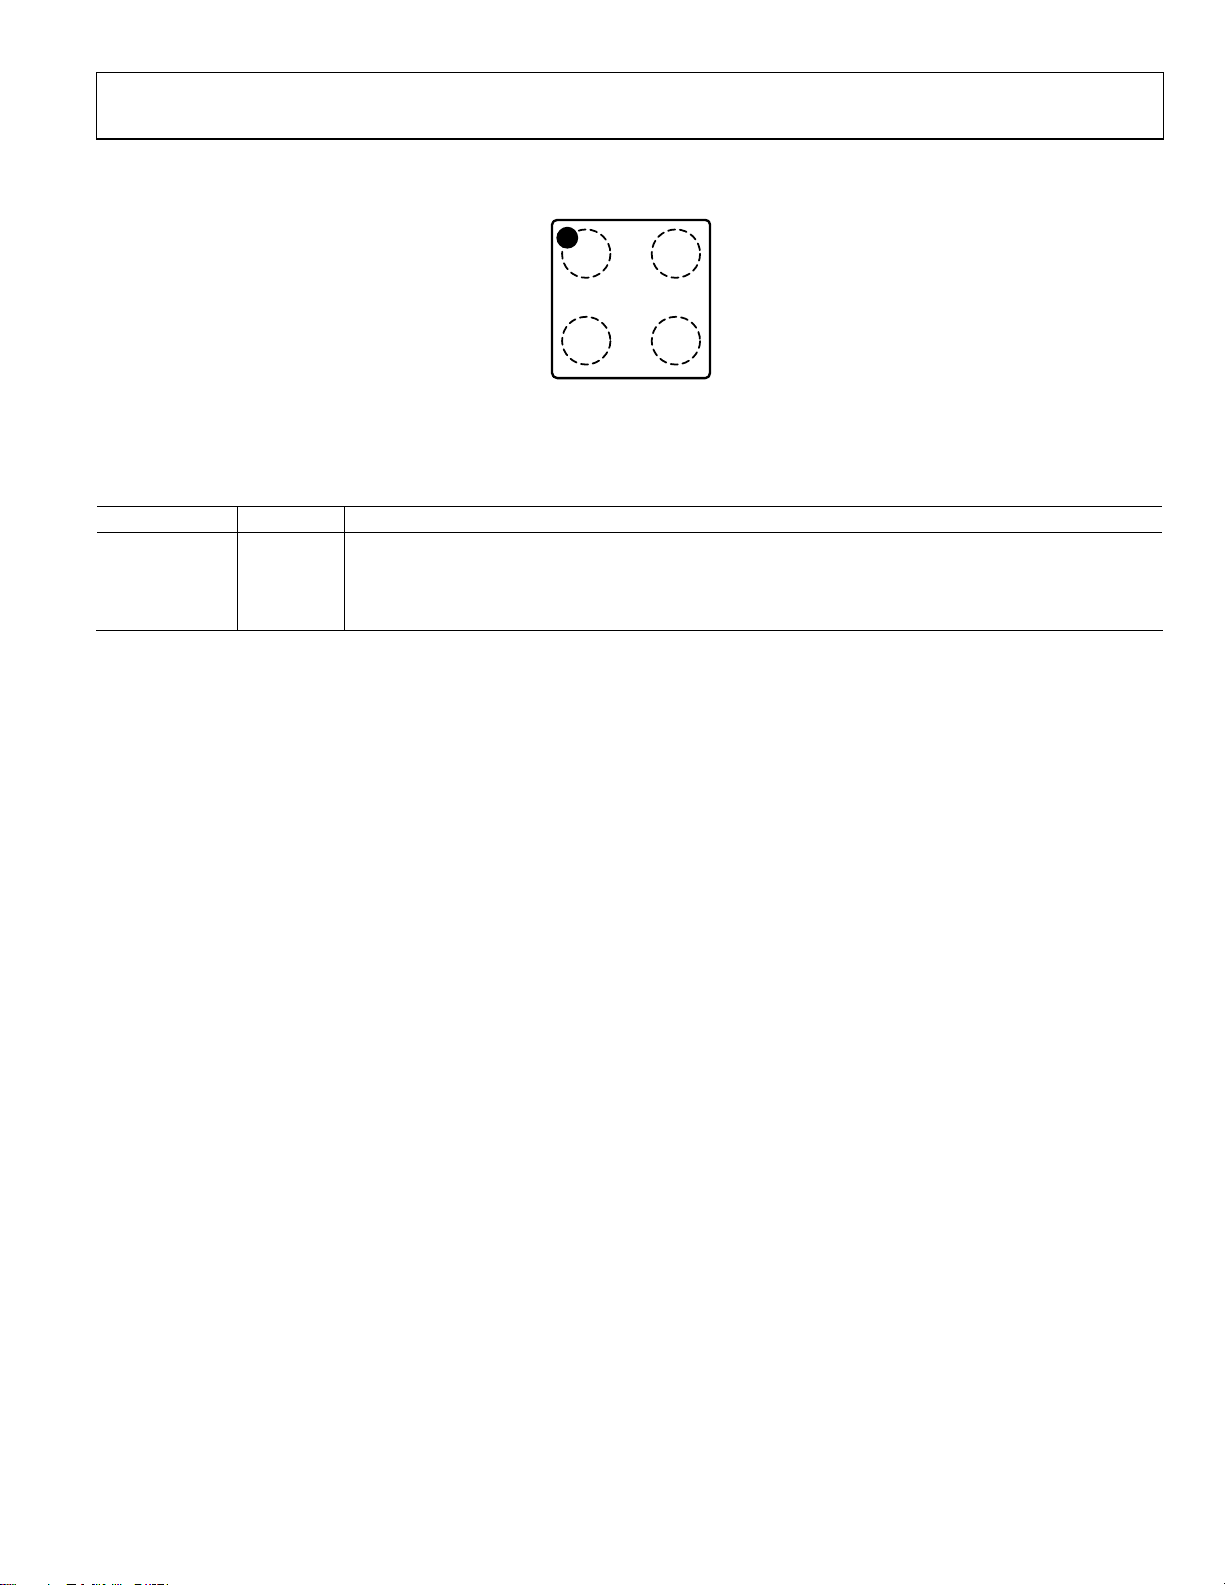
PIN CONFIGURATION AND FUNCTION DESCRIPTIONS
12
VIN VOUT
A
EN
B GND
ADP199
TOP VIEW
(Not to Scale)
Figure 3. Pin Configuration
Table 4. Pin Function Descriptions
Pin No. Mnemonic Description
A1 VIN Input Voltage.
A2 VOUT Output Voltage.
B1 EN Enable Input. Drive EN high to turn the switch on and drive EN low to turn the switch off.
B2 GND Ground.
09672-003
Rev. 0 | Page 5 of 16
Page 6

ADP199 Data Sheet
(
(
TYPICAL PERFORMANCE CHARACTERISTICS
VIN = 1.2 V, VEN = VIN, CIN = C
0.07
0.9V
1.0V
1.5V
0.06
2.6V
0.05
Ω)
0.04
ON
0.03
RDS
0.02
0.01
0
–60 –40 –20 0 20 40 60 80 100
= 1 µF, TA = 25°C, unless otherwise noted.
OUT
TEMPERATURE (° C)
0.10
0.90V
0.95V
0.09
1.00V
1.20V
1.50V
0.08
1.80V
2.20V
0.07
2.60V
3.20V
0.06
3.60V
(Ω)
0.05
ON
RDS
0.04
0.03
0.02
0.01
0
1 10 100 1000
09672-004
LOAD (mA)
09672-007
Figure 4. RDS
0.07
0.06
0.05
Ω)
0.04
ON
0.03
RDS
0.02
0.01
0
–60–40–200 20406080100
Figure 5. RDS
0.10
0.09
0.08
0.07
0.06
(Ω)
ON
0.05
RDS
0.04
0.03
0.02
0.01
0
0.8 1.2 1. 6 2.0 2. 4 2. 8 3.2 3. 6
vs. Temperature, 50 mA, Different Input Voltage (VIN)
ON
0.9V
1.0V
1.5V
2.6V
TEMPERATURE (°C)
vs. Temperature, 500 mA, Different Input Voltage (VIN)
ON
5mA
10mA
50mA
100mA
200mA
500mA
V
(V)
IN
Figure 7. RDS
0.040
0.035
0.030
0.025
0.020
0.015
DIFFE RENCE (V)
0.010
0.005
0
0.8 1.2 1.6 2.0 2.4 2. 8
09672-005
vs. Load Current, Different Input Voltage (VIN)
ON
5mA
10mA
50mA
100mA
200mA
500mA
VIN (V)
3.2
3.6
09672-008
Figure 8. Voltage Drop vs. Temperature, Different Load Currents
40
35
30
25
20
15
GROUND CURRENT (µ A)
10
10mA
50mA
05
100mA
200mA
500mA
0
–40 –5 25 65 85
09672-006
TEMPERATURE (°C)
09672-009
Figure 6. RDS
vs. Input Voltage (VIN), Different Load Currents
ON
Figure 9. Ground Current vs. Temperature,
Different Load Currents, V
= 0.9 V
IN
Rev. 0 | Page 6 of 16
Page 7

Data Sheet ADP199
(
(
4.5
4.0
3.5
3.0
2.5
2.0
1.5
GROUND CURRENT (µ A)
1.0
10mA
50mA
100mA
0.5
200mA
500mA
0
–40 –5 25 65 85
TEMPERATURE (°C)
09672-010
Figure 10. Ground Current vs. Temperature,
Different Load Currents, V
60
50
40
= 1.2 V
IN
50
5mA
10mA
45
50mA
100mA
40
200mA
500mA
35
30
25
20
15
GROUND CURRENT (µ A)
10
5
0
0.8 1.2 1.6 2. 0 2.4 2.8 3.2 3.6
TEMPERATURE (°C)
Figure 13. Ground Current vs. Input Voltage,
Different Load Current
1
0.90V
1.80V
0.95V
2.20V
1.00V
2.60V
1.20V
3.20V
1.50V
µA)
3.60V
09672-013
30
20
GROUND CURRE NT ( µA)
10mA
10
50mA
100mA
200mA
500mA
0
–40–5256585
TEMPERATURE (°C)
Figure 11. Ground Current vs. Temperature,
Different Load Currents, V
50
0.90
0.95
45
1.00
1.20
40
1.50
1.80
2.20
35
2.60
3.20
30
3.60
25
20
15
GROUND CURRENT (µA)
10
5
0
1 10 100 1000
LOAD (mA)
= 3.6 V
IN
0.1
SHUTDOWN CURRENT
GND
I
0.01
–40–200 20406080100
09672-011
TEMPERATURE (°C)
09672-014
Figure 14. Ground Shutdown Current vs. Temperature, Output Open,
Different Input Voltage (V
1
0.90V
1.80V
0.95V
2.20V
1.00V
2.60V
1.20V
3.20V
1.50V
µA)
0.1
SHUTDOWN CURRENT
GND
I
0.01
–40–200 20406080100
09672-012
3.60V
TEMPERATURE (°C)
)
IN
09672-015
Figure 12. Ground Current vs. Load Current,
Different Input Voltage (V
)
IN
Figure 15. Ground Shutdown Current vs. Temperature, V
Different Input Voltage (V
)
IN
OUT
= 0 V,
Rev. 0 | Page 7 of 16
Page 8

ADP199 Data Sheet
10
1
V
EN
1
0.8V
0.1
SHUTDOWN CURRENT (µA)
OUT
I
0.01
–40–200 20406080100
1.0V
1.2V
1.5V
1.8V
2.2V
2.6V
3.0V
3.3V
3.6V
TEMPERATURE (°C)
Figure 16. Output Shutdown Current vs. Temperature,
= 0 V, Different Input Voltage (VIN)
V
OUT
V
EN
1
OUTPUT VOLTAGE
2
INPUT CURRE NT
3
OUTPUT VOLTAGE
2
INPUT CURRENT
3
B
W
09672-016
CH3 50mA Ω
B
W
B
CH2 1VCH1 1V
M10µs A CH1 100mV
W
T 10%
09672-019
Figure 19. Typical Turn-On Time and Inrush Current,
= 1.8 V, 10 mA Load, C
V
IN
1
2
3
= 1 F
OUT
OUTPUT VOLTAGE
INPUT CURREN T
V
EN
CH3 20mA Ω
B
CH2 500mVCH1 1V
W
B
W
B
M10µs A CH1 100mV
W
T 10%
Figure 17. Typical Turn-On Time and Inrush Current,
V
= 1.2 V, 10 mA Load, C
IN
1
OUT
= 1 F
OUTPUT VOLTAGE
INPUT CURREN T
2
3
CH3 200mA Ω
B
CH2 500mVCH1 1V
W
B
W
B
M10µs A CH1 100mV
W
T 10%
Figure 18. Typical Turn-On Time and Inrush Current,
V
= 1.2 V, 500 mA Load, C
IN
OUT
= 1 F
B
W
09672-017
CH3 200m A Ω
B
W
B
CH2 1VCH1 1V
M10µs A CH1 100mV
W
T 10%
09672-020
Figure 20. Typical Turn-On Time and Inrush Current,
V
= 1.8 V, 500 mA Load, C
IN
V
EN
1
2
= 1 F
OUT
OUTPUT VOLTAGE
V
EN
INPUT CURRENT
3
B
W
09672-018
CH3 200mA Ω
B
W
B
CH2 1VCH1 2V
M4µs A CH1 1.28mV
W
T 10%
09672-021
Figure 21. Typical Turn-On Time and Inrush Current,
= 3.6 V, 10 mA Load, C
V
IN
OUT
= 1 F
Rev. 0 | Page 8 of 16
Page 9

Data Sheet ADP199
V
V
EN
EN
1
2
3
CH3 200mA Ω
B
W
B
W
B
CH2 1VCH1 2V
W
OUTPUT VOLTAGE
INPUT CURRENT
M4µs A CH1 1.28V
T 10%
Figure 22. Typical Turn-On Time and Inrush Current,
= 3.6 V, 500 mA Load, C
V
IN
1
2
3
= 1 F
OUT
OUTPUT V OLTAGE
INPUT CURRENT
1
2
3
B
W
09672-022
CH3 200mA Ω
B
W
B
CH2 1VCH1 1V
OUTPUT VOLTAGE
INPUT CURRENT
M10µs A CH1 700mV
W
T 10.4%
09672-025
Figure 25. Typical Turn-On Time and Inrush Current,
= 1.8 V, 10 mA Load, C
V
IN
V
EN
1
2
3
= 4.7 F
OUT
OUTPUT VOLTAGE
INPUT CURREN T
V
EN
B
CH3 100mA Ω
W
CH2 500mVCH1 1V
B
W
B
M10µs A CH1 700mV
W
T 10.4%
Figure 23. Typical Turn-On Time and Inrush Current,
1
2
3
CH3 200mA Ω
= 1.2 V, 10 mA Load, C
V
IN
B
CH2 500mVCH1 1V
W
B
W
= 4.7 F
OUT
OU T PU T VO LTAG E
INPUT CURRENT
B
M20µs A CH1 700V
W
T 10.4%
Figure 24. Typical Turn-On Time and Inrush Current,
= 1.2 V, 500 mA Load, C
V
IN
= 4.7 F
OUT
B
W
09672-023
CH3 200mA Ω
B
W
B
CH2 1VCH1 1V
M10µs A CH1 700mV
W
T 10.4%
09672-026
Figure 26. Typical Turn-On Time and Inrush Current,
V
= 1.8 V, 500 mA Load, C
IN
V
EN
1
2
3
B
W
09672-024
CH3 500m A Ω
B
W
B
CH2 2VCH1 2V
W
= 4.7 F
OUT
V
EN
OUTPUT VOLTAGE
INPUT CURRENT
M4µs A CH1 720mV
T 10.4%
09672-027
Figure 27. Typical Turn-On Time and Inrush Current,
= 3.6 V, 10 mA Load, C
V
IN
= 4.7 F
OUT
Rev. 0 | Page 9 of 16
Page 10

ADP199 Data Sheet
V
EN
1
2
3
CH3 500m A Ω
B
W
B
W
B
CH2 2VCH1 2V
W
OUTPUT VOLTAGE
INPUT CURRENT
M4µs A CH1 720mV
T 10.4%
Figure 28. Typical Turn-On Time and Inrush Current,
= 3.6 V, 500 mA Load, C
V
IN
= 4.7 F
OUT
09672-028
Rev. 0 | Page 10 of 16
Page 11

Data Sheet ADP199
THEORY OF OPERATION
The ADP199 is a high-side NMOS load switch controlled by
an internal charge pump. The ADP199 is designed to operate
with power supply voltages between 0.9 V and 3.6 V.
An internal charge pump biases the NMOS switch to achieve a
relatively constant, ultralow on resistance of 40 mΩ across the
entire input voltage range. The use of the internal charge pump also
allows for controlled turn-on times. The switch is controlled on/off
by the enable (EN) input and is capable of interfacing directly with
1.2 V logic signals.
VIN VOUT
GND
EN
4Ω
CHARGE PUMP
AND SLEW RATE
The ADP199 is capable of 500 mA of continuous load current
as long as T
is less than 85°C.
J
ESD protection structures are shown in the block diagram (see
Figure 29) as Zener diodes.
The ADP199 is a low quiescent current device with a nominal
4 MΩ pull-down resistor on its enable pin (EN). The package is a
space-saving 0.8 mm × 0.8 mm, 4-ball WLCSP.
CONTROL
ADP199
Figure 29. Functional Block Diagram
09672-029
Rev. 0 | Page 11 of 16
Page 12

ADP199 Data Sheet
T
APPLICATIONS INFORMATION
GROUND CURRENT
The major source for ground current in the ADP199 is the internal
charge pump for the FET drive circuitry. Figure 30 shows the
typical ground current when V
to 3.6 V.
50
5mA
10mA
45
50mA
100mA
200mA
40
500mA
35
30
25
20
15
GROUND CURRENT (µA)
10
5
0
0.8 1. 2 1.6 2.0 2.4 2. 8 3.2 3.6
Figure 30. Ground Current vs. Input Voltage, Different Load Current
ENABLE FEATURE
The ADP199 uses the EN input to enable and disable the V
output. As shown in Figure 31, when a rising voltage (V
the EN pin crosses the active threshold, V
a falling voltage (V
threshold, V
OUT
3.5
3.0
2.5
2.0
) on the EN pin crosses the inactive
EN
turns off.
= VIN, and varies from 1.1 V
EN
VIN (V)
turns on. When
OUT
V
AT 3.3V
OUT
EN
OUT
) on
09672-030
1.4
V
AT 1 . 2V
1.2
1.0
AGE (V)
0.8
0.6
OUTPUT VOL
0.4
0.2
0
0.30 0.35 0. 40 0.45 0.50 0.55 0.60 0. 65 0.70
ENABLE VOLTAGE (V)
OUT
09672-032
Figure 32. Typical EN Operation, VIN = 1.2 V
As shown in Figure 31, the EN pin has hysteresis built into it.
This prevents on/off oscillations that can occur due to noise on
the EN pin as it passes through the threshold points.
The EN pin active/inactive thresholds derive from the V
voltage;
IN
therefore, these thresholds vary with the changing input voltage.
Figure 33 shows the typical EN active/inactive thresholds when
the input voltage varies from 1.1 V to 3.6 V.
2.5
EN RISE
EN FALL
2.0
1.5
1.0
THRESHOLDS
0.5
1.5
OUTPUT VOLTAGE (V)
1.0
0.5
0
1.21.31.41.51.61.71.81.92.02.1
ENABLE VOLTAGE (V)
Figure 31. Typical EN Operation, V
= 3.3 V
IN
TIMING
Turn-on delay is defined as the interval between the time that
09672-031
V
~10% of its final value. The ADP199 includes circuitry that has a
typical 1 ms turn-on delay, and a controlled rise time to limit the
V
0
1.0 1.5 2.0 2.5 3.0 3.5
INPUT VOLTAGE (V)
Figure 33. Typical EN Thresholds vs. Input Voltage (V
exceeds the rising threshold voltage and when V
EN
inrush current. As shown in Figure 34 and Figure 35, the turn-
IN
IN
OUT
)
rises to
09672-033
on delay is nearly independent of the input voltage.
Rev. 0 | Page 12 of 16
Page 13

Data Sheet ADP199
V
EN
1
OUTPUT VOLTAGE
2
1
2
OUTPUT VOLTAGE
V
EN
INPUT CURREN T
3
B
CH2 500mVCH1 1V
W
CH3 20mA Ω
B
W
Figure 34. Typical Turn-On Delay Time with V
I
LOAD
1
2
3
B
CH3 200mA Ω
CH2 1VCH1 2V
W
B
W
Figure 35. Typical Turn-On Delay Time with V
I
LOAD
B
= 10 mA, C
B
W
= 10 mA, C
M10µs A CH1 100mV
W
T 10%
= 1.2 V,
= 1 µF
LOAD
M4µs A CH1 1.28mV
T 10%
= 1 µF
LOAD
IN
V
OUTPUT VOLTAGE
INPUT CURRENT
= 3.6 V,
IN
09672-034
EN
09672-035
The rise time is defined as the time it takes the output voltage to
rise from 10% to 90% of V
dent on the rise time of the internal charge pump.
r very large values of output capacitance, the RC time constant
Fo
(where C is the load capacitance (C
reaching its final value. It is depen-
OUT
) and R is the RDSON||R
LOAD
LOAD
can become a factor in the rise time of the output voltage. Because
RDS
is much smaller than R
ON
for RC is RDS
ON
× C
. An input or load capacitor is not required
LOAD
, an adequate approximation
LOAD
for the ADP199 although capacitors can be used to suppress
noise on the board.
INPUT CURREN T
3
B
W
CH3 500m A Ω
CH2 500mVCH1 1V
B
W
B
M40µs A CH1 700mV
W
T 10.4%
09672-036
Figure 36. Typical Rise Time and Inrush Current,
C
= 100 µF, VIN = 1.2 V, I
LOAD
1
2
3
CH3 2A Ω
B
W
B
W
B
CH2 1VCH1 2V
W
= 100 mA
LOAD
V
EN
OUTPUT VOLTAGE
INPUT CURRENT
M40µs A CH1 720mV
T 10.4%
09672-037
Figure 37. Typical Rise Time and Inrush Current,
C
= 100 µF, VIN = 3.6 V, I
LOAD
=100 mA
LOAD
The turn-off time is defined as the time it takes for the output
voltage to fall from 90% to 10% of V
reaching its final value.
OUT
The turn-off time is also dependent on the RC time constant of
the output capacitance and load resistance. Figure 38 shows the
)
typical turn-off time with V
= 1.8 V, C
IN
= 1 F, and R
OUT
LOAD
=
18 .
2
ENABLE VOLTAGE V
EN
1
B
W
B
CH2 1VCH1 500mV
W
INPUT CURRENT
M20µs A CH2 660mV
T 10.2%
09672-038
Figure 38. Typical Turn-Off Time
Rev. 0 | Page 13 of 16
Page 14

ADP199 Data Sheet
OUTLINE DIMENSIONS
0.800
0.740 SQ
0.720
12
BALL A1
IDENTIFIER
0.560
0.500
0.440
SEATING
PLANE
TOP VIEW
(BALL SIDE DOWN)
END VIEW
0.300
0.260
0.220
0.330
0.300
0.270
0.40
REF
BOTTOM VIEW
(BALL SIDE UP)
COPLANARITY
0.03
0.230
0.200
0.170
A
B
10-08-2010-A
Figure 39. 4-Ball Wafer Level Chip Scale Package [WLCSP]
(CB-4-5)
Dimensions shown in millimeters
ORDERING GUIDE
Model1 Temperature Range Package Description Package Option Branding
ADP199ACBZ-R7 −40°C to +85°C 4-Ball Wafer Level Chip Scale Package [WLCSP] CB-4-5 8P
ADP199CB-EVALZ Evaluation Board
1
Z = RoHS Compliant Part.
Rev. 0 | Page 14 of 16
Page 15

Data Sheet ADP199
NOTES
Rev. 0 | Page 15 of 16
Page 16

ADP199 Data Sheet
NOTES
©2011 Analog Devices, Inc. All rights reserved. Trademarks and
©2011 Analog Devices, Inc. All rights reserved. Trademarks and
registered trademarks are the property of their respective owners.
registered trademarks are the property of their respective owners.
D09672-0-11/11(0)
Rev. 0 | Page 16 of 16
 Loading...