

Page 1
Logic Controlled,
FEATURES
Low RDSON of 105 mΩ at 1.8 V
Internal output discharge resistor (ADP191)
Turn-on slew rate limiting (ADP191)
Low input voltage range: 1.1 V to 3.6 V
500 mA continuous operating current
Built-in level shift for control logic that can be operated
by 1.2 V logic
Low 2 μA (maximum) ground current
Ultralow shutdown current: <1 μA
Ultrasmall 0.8 mm × 0.8 mm, 4-ball, 0.4 mm pitch WLCSP
APPLICATIONS
Mobile phones
Digital cameras and audio devices
Portable and battery-powered equipment
High-Side Power Switches
ADP190/ADP191
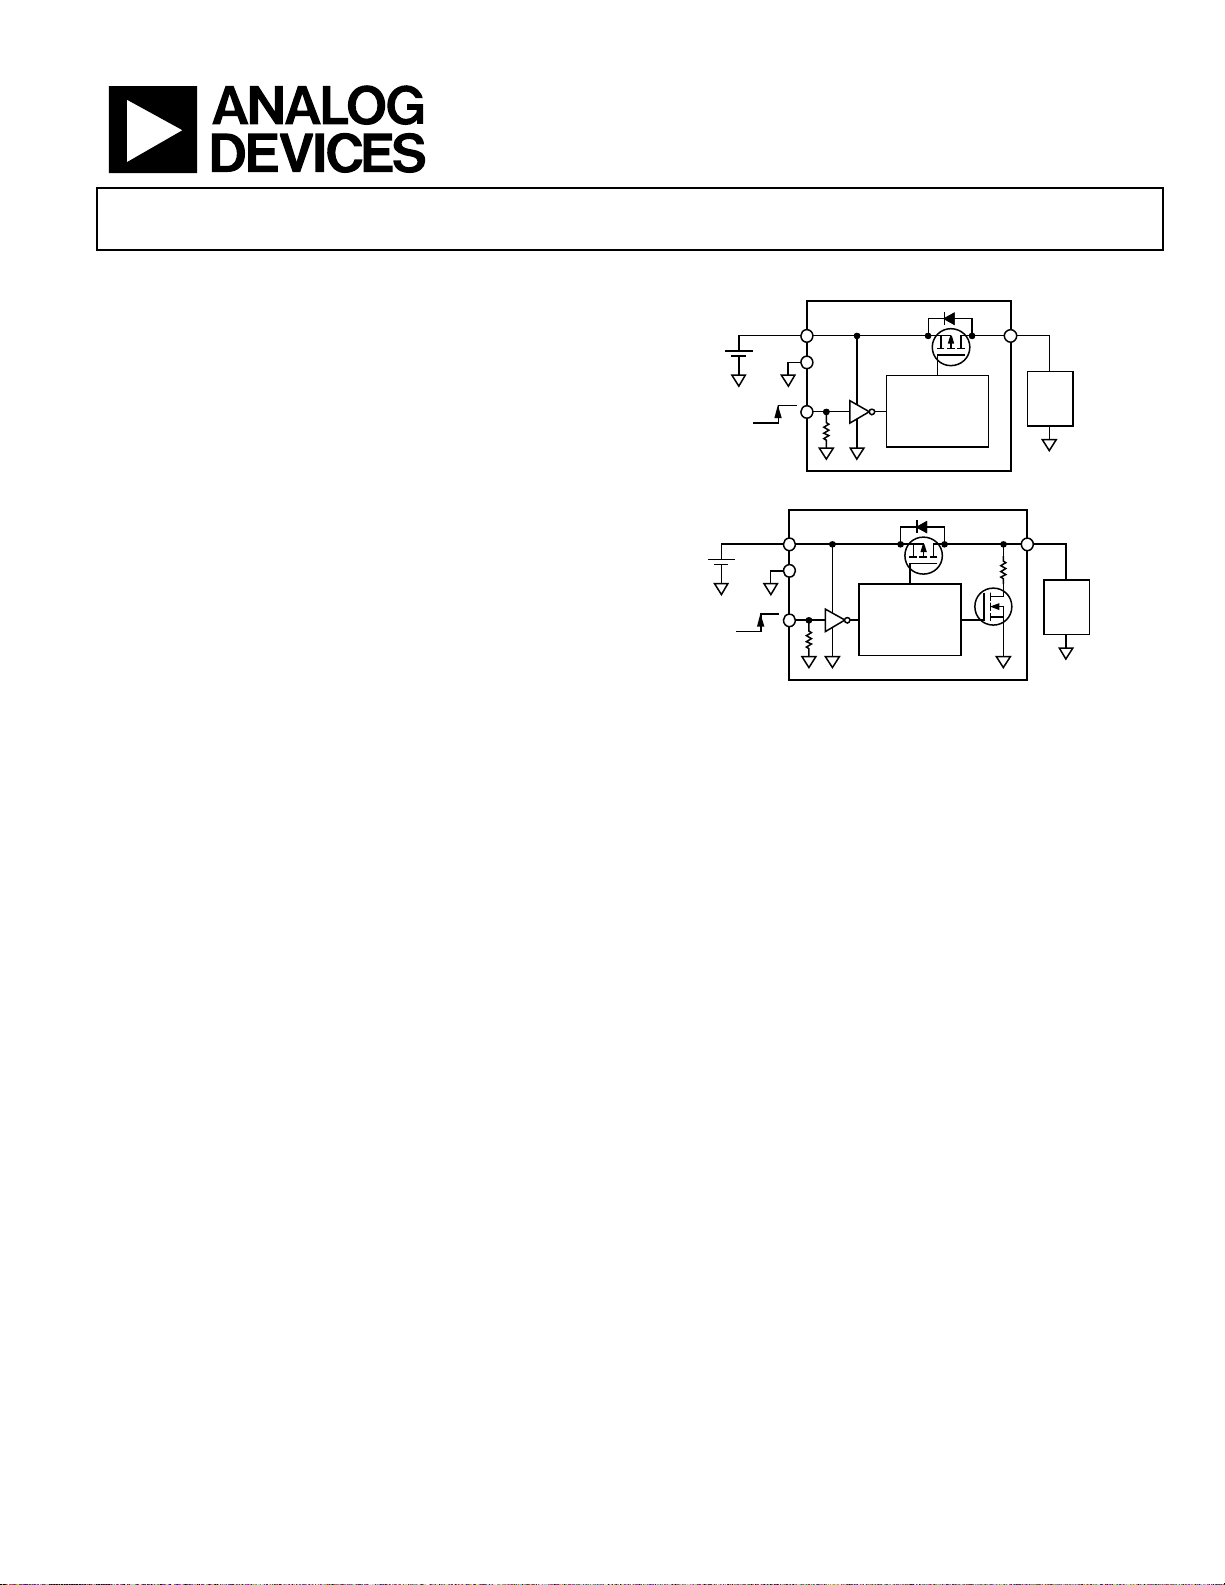
TYPICAL APPLICATIONS CIRCUIT
ADP190
VIN VOUT
+
GND
–
ON
EN
OFF
ADP191
VIN VOUT
+
GND
–
ON
EN
OFF
LEVEL SHIFT
AND SLEW
RATE CONTROL
Figure 1.
LEVEL SHIFT
AND SLEW
RATE CONTROL
AND LOAD
DISCHARGE
Figure 2.
LOAD
LOAD
07874-001
07874-102
GENERAL DESCRIPTION
The ADP190/ADP191 are high-side load switches designed for
operation from 1.1 V to 3.6 V. These load switchs provide power
domain isolation for extended power battery life. The devices
contain a low on-resistance P-channel MOSFET that supports
more than 500 mA of continuous current and minimizes power
loss. The low 2 A (maximum) of ground current and ultralow
shutdown current make the ADP190/ADP191 ideal for batteryoperated portable equipment. The built-in level shifter for enable
logic makes the ADP190/ADP191 compatible with modern
processors and GPIO controllers.
The ADP191 controls the turn-on slew rate of the switch to
reduce the input inrush current. The ADP191 also incorporates
an internal output discharge resistor to discharge the output
capacitance when the ADP191 output is disabled.
Beyond operating performance, the ADP190/ADP191 occupy
minimal printed circuit board (PCB) space with an area less than
0.64 mm
2
and a height of 0.60 mm. It is available in an ultrasmall
0.8 mm × 0.8 mm, 4-ball, 0.4 mm pitch WLCSP.
Rev. D
Information furnished by Analog Devices is believed to be accurate and reliable. However, no
responsibility is assumed by Anal og Devices for its use, nor for any infringements of patents or ot her
rights of third parties that may result from its use. Specifications subject to change without notice. No
license is granted by implication or otherwise under any patent or patent rights of Analog Devices.
Trademarks and registered trademarks are the property of their respective owners.
One Technology Way, P.O. Box 9106, Norwood, MA 02062-9106, U.S.A.
Tel: 781.329.4700 www.analog.com
Fax: 781.461.3113 ©2009-2010 Analog Devices, Inc. All rights reserved.
Page 2

ADP190/ADP191
TABLE OF CONTENTS
Features.............................................................................................. 1
Applications....................................................................................... 1
Typical Applications Circuit............................................................ 1
General Description ......................................................................... 1
Revision History ............................................................................... 2
Specifications..................................................................................... 3
Timing Diagram........................................................................... 4
Absolute Maximum Ratings............................................................ 5
Thermal Data ................................................................................ 5
Thermal Resistance ...................................................................... 5
ESD Caution.................................................................................. 5
REVISION HISTORY
11/10—Rev. C to Rev. D
Changed 4 m to 4 M in Theory of Operation Section .......... 9
3/10—Rev. B to Rev. C
Change to Low Input Voltage Range Value................ Throughout
1/10—Rev. A to Rev. B
Added ADP191.............................................................. Throughout
Changes to Table 1............................................................................ 3
Changes to Table 3............................................................................ 5
Changes to Ordering Guide.......................................................... 15
9/09—Rev. 0 to Rev. A
Changes to Ordering Guide.......................................................... 13
1/09—Revision 0: Initial Version
Pin Configuration and Function Descriptions..............................6
Typical Performance Characteristics..............................................7
Theory of Operation .........................................................................9
Applications Information.............................................................. 10
Ground Current.......................................................................... 10
Enable Feature ............................................................................ 10
Timing ......................................................................................... 10
Thermal Considerations............................................................ 12
PCB Layout Considerations...................................................... 14
Outline Dimensions....................................................................... 15
Ordering Guide .......................................................................... 15
Rev. D | Page 2 of 16
Page 3

ADP190/ADP191
SPECIFICATIONS
VIN = 1.8 V, VEN = VIN, I
Table 1. ADP190
Parameter Symbol Test Conditions Min Typ Max Unit
INPUT VOLTAGE RANGE VIN T
EN INPUT
EN Input Threshold V
1.3 V < VIN < 1.8 V, TJ = −40°C to +85°C 0.4 1.2 V
1.8 V ≤ VIN ≤ 3.6 V, TJ = −40°C to +85°C 0.45 1.2 V
Logic High Voltage VIH 1.1 V ≤ VIN ≤ 3.6 V 1.1 V
Logic Low Voltage VIL 1.1 V ≤ VIN ≤ 3.6 V 0.3 V
EN Input Pull-Down Resistance REN 4 MΩ
CURRENT
Ground Current1 I
Shutdown Current I
EN = GND, TJ = −40°C to +85°C 2 µA
VIN to VOUT RESISTANCE RDSON
V
V
V
V
V
VOUT TIME
Turn-On Delay Time t
Turn-On Delay Time t
1
Ground current includes EN pull-down current.
= 200 mA, TA = 25°C, unless otherwise noted.
LOAD
= −40°C to +85°C 1.1 3.6 V
J
1.1 V ≤ VIN ≤ 1.3 V, TJ = −40°C to +85°C 0.3 1.0 V
EN_TH
V
GND
EN = GND 0.1 µA
OFF
ON_DLY
ON_DLY
= 3.6 V, VOUT open, TJ = −40°C to +85°C 2 µA
IN
= 3.6 V, I
IN
= 2.5 V, I
IN
= 1.8 V, I
IN
= 1.5 V, I
IN
= 1.2 V, I
IN
I
= 200 mA, EN = 1.5 V, C
LOAD
VIN = 3.6 V, I
= 200 mA, EN = 1.5 V 80 mΩ
LOAD
= 200 mA, EN = 1.5 V 90 mΩ
LOAD
= 200 mA, EN = 1.5 V 105 130 mΩ
LOAD
= 200 mA, EN = 1.5 V 125 mΩ
LOAD
= 200 mA, EN = 1 V 160 mΩ
LOAD
= 200 mA, EN = 1.5 V, C
LOAD
= 1 F 5 s
LOAD
= 1 F 1.5 s
LOAD
Table 2. ADP191
Parameter Symbol Test Conditions Min Typ Max Unit
INPUT VOLTAGE RANGE VIN T
= −40°C to +85°C 1.1 3.6 V
J
EN INPUT
EN Input Threshold V
1.1 V ≤ VIN ≤ 1.3 V, TJ = −40°C to +85°C 0.3 1.0 V
EN_TH
1.3 V < VIN < 1.8 V, TJ = −40°C to +85°C 0.4 1.2 V
1.8 V ≤ VIN ≤ 3.6 V, TJ = −40°C to +85°C 0.45 1.2 V
Logic High Voltage VIH 1.1 V ≤ VIN ≤ 3.6 V 1.1 V
Logic Low Voltage VIL 1.1 V ≤ VIN ≤ 3.6 V 0.3 V
EN Input Pull-Down Resistance REN 4 MΩ
CURRENT
Ground Current1 I
Shutdown Current I
V
GND
EN = GND 0.1 µA
OFF
= 3.6 V, VOUT open, TJ = −40°C to +85°C 2 µA
IN
EN = GND, TJ = −40°C to +85°C 2 µA
VIN to VOUT RESISTANCE RDSON
V
V
V
V
V
VOUT DISCHARGE RESISTANCE R
215 Ω
DIS
= 3.6 V, I
IN
= 2.5 V, I
IN
= 1.8 V, I
IN
= 1.5 V, I
IN
= 1.2 V, I
IN
= 200 mA, EN = 1.5 V 80 mΩ
LOAD
= 200 mA, EN = 1.5 V 90 mΩ
LOAD
= 200 mA, EN = 1.5 V 105 130 mΩ
LOAD
= 200 mA, EN = 1.5 V 125 mΩ
LOAD
= 200 mA, EN = 1 V 160 mΩ
LOAD
VOUT TIME
Turn-On Delay Time t
Turn-On Delay Time t
1
Ground current includes EN pull-down current.
I
ON_DLY
VIN = 3.6 V, I
ON_DLY
= 200 mA, EN = 1.5 V, C
LOAD
= 200 mA, EN = 1.5 V, C
LOAD
= 1 F 80 s
LOAD
= 1 F 50 s
LOAD
Rev. D | Page 3 of 16
Page 4

ADP190/ADP191
V
TIMING DIAGRAM
TURN-ON
DELAY
90%
10%
EN
TURN-OFF
DELAY
V
OUT
TURN-ON
RISE
TURN-OFF
Figure 3. Timing Diagram
FALL
07874-003
Rev. D | Page 4 of 16
Page 5

ADP190/ADP191
ABSOLUTE MAXIMUM RATINGS
Table 3.
Parameter Rating
VIN to GND Pins −0.3 V to +4.0 V
VOUT to GND Pins −0.3 V to VIN
EN to GND Pins −0.3 V to +4.0 V
Continuous Drain Current
TA = 25°C ±1 A
TA = 85°C ±500 mA
Continuous Diode Current −50 mA
Storage Temperature Range −65°C to +150°C
Operating Junction Temperature Range −40°C to +125°C
Soldering Conditions JEDEC J-STD-020
Stresses above those listed under Absolute Maximum Ratings
may cause permanent damage to the device. This is a stress
rating only; functional operation of the device at these or any
other conditions above those indicated in the operational
section of this specification is not implied. Exposure to absolute
maximum rating conditions for extended periods may affect
device reliability.
THERMAL DATA
Absolute maximum ratings apply individually only, not in
combination. The ADP190/ADP191can be damaged when the
junction temperature limits are exceeded. Monitoring ambient
temperature does not guarantee that T
temperature limits. In applications with high power dissipation
and poor PCB thermal resistance, the maximum ambient
is within the specified
J
Junction-to-ambient thermal resistance (θ
based on modeling and calculation using a 4-layer board. The
junction-to-ambient thermal resistance is highly dependent on
the application and board layout. In applications where high
maximum power dissipation exists, close attention to thermal
board design is required. The value of θ
PCB material, layout, and environmental conditions. The specified values of θ
See JESD51-7 and JESD51-9 for detailed information regarding
board construction. For additional information, see the AN-617
application note, MicroCSP
Ψ
is the junction-to-board thermal characterization parameter
JB
with units of °C/W. Ψ
calculation using a 4-layer board. The JESD51-12 document,
Guidelines for Reporting and Using Electronic Package Thermal
Information, states that thermal characterization parameters are
not the same as thermal resistances. Ψ
power flowing through multiple thermal paths rather than through
a single path, as in thermal resistance (θ
paths include convection from the top of the package as well as
radiation from the package, factors that make Ψ
in real-world applications. Maximum junction temperature (T
is calculated from the board temperature (T
dissipation (P
T
= TB + (PD × ΨJB)
J
See JESD51-8, JESD51-9, and JESD51-12 for more detailed
information about Ψ
temperature may need to be derated.
In applications with moderate power dissipation and low PCB
thermal resistance, the maximum ambient temperature can
exceed the maximum limit as long as the junction temperature
is within specification limits. The junction temperature (T
the device is dependent on the ambient temperature (T
power dissipation of the device (P
thermal resistance of the package (θ
Maximum junction temperature (T
ambient temperature (T
) and power dissipation (PD) using the
A
), and the junction-to-ambient
D
).
JA
) is calculated from the
J
), the
A
) of
J
THERMAL RESISTANCE
and ΨJB are specified for the worst-case conditions, that is, a
θ
JA
device soldered in a circuit board for surface-mount packages.
Table 4. Thermal Resistance
Package Type θJA ΨJB Unit
4-Ball, 0.4 mm Pitch WLCSP 260 58.4 °C/W
ESD CAUTION
formula
= TA + (PD × θJA)
T
J
are based on a 4-layer, 4 inch × 3 inch PCB.
JA
TM
Waf er L e vel Ch i p Scal e Pa ckage.
of the package is based on modeling and
JB
) using the formula
D
.
JB
) of the package is
JA
may vary, depending on
JA
measures the component
JB
). Therefore, ΨJB thermal
JB
more useful
JB
) and the power
B
)
J
Rev. D | Page 5 of 16
Page 6

ADP190/ADP191
PIN CONFIGURATION AND FUNCTION DESCRIPTIONS
12
VIN VOUT
A
TOP VIEW
(Not to Scale)
EN
B GND
07874-002
Figure 4. Pin Configuration
Table 5. Pin Function Descriptions
Pin No. Mnemonic Description
A1 VIN Input Voltage.
B1 EN Enable Input. Drive EN high to turn on the switch; drive EN low to turn off the switch.
A2 VOUT Output Voltage.
B2 GND Ground.
Rev. D | Page 6 of 16
Page 7

ADP190/ADP191
TYPICAL PERFORMANCE CHARACTERISTICS
VIN = 1.8 V, VEN = VIN > VIH, I
200
180
160
140
(mΩ)
ON
120
RDS
100
80
= 100 mA, TA = 25°C, unless otherwise noted.
LOAD
VIN = 1.2V
V
= 1.8V
IN
VIN = 3.6V
V
T
V
EN
1
2
V
OUT
OUT
I
LOAD
C
LOAD
V
EN
= 3.6V
= 200mA
= 1µF
= 1.5V
60
JUNCTION TEMPERATURE, T
Figure 5. RDS
200
180
160
(mΩ)
140
ON
RDS
120
100
80
1.2 2.01.6 2.4 2.8 3.2 3.6
Figure 6. RDS
100
80
60
vs. Temperature (Includes ~15 mΩ Trace Resistance)
ON
V
(V)
IN
vs. Input Voltage, VIN (Includes ~15 mΩ Trace Resistance)
ON
J
(°C)
I
I
I
I
I
LOAD
LOAD
LOAD
LOAD
LOAD
1258525–5–40
= 10mA
= 100mA
= 250mA
= 350mA
= 500mA
VIN = 1.2V
VIN = 1.8V
VIN = 2.5V
VIN = 3.6V
CH1 500mV CH2 2V M1. 0 0µ s A CH1 990mV
07874-004
T 3.0µs
07874-007
Figure 8. ADP190 Turn-On Delay, Input Voltage = 3.6 V
V
T
V
EN
V
1
2
CH1 500mV CH2 1V M4µ s A CH1 990mV
07874-005
OUT
T 12µs
OUT
I
LOAD
C
LOAD
V
EN
= 1.8V
= 200mA
= 1µF
= 1.5V
07874-008
Figure 9. ADP190 Turn-On Delay, Input Voltage = 1.8 V
T
1
V
EN
I
IN
40
20
DIFFERENCE ( mV )
0
–20
0 10050 150 200 250 300 350
LOAD (mA)
07874-006
Figure 7. Voltage Drop vs. Load Current (Includes ~15 mΩ Trace Resistance)
Rev. D | Page 7 of 16
2
3
CH1 2.00V CH2 100mA
CH3 2.00V
V
OUT
M20.0µs A CH1 1.24V
T 10.20%
Figure 10. ADP191 Turn-On Delay and Inrush Current
vs. Input Voltage = 3.6 V
07874-110
Page 8

ADP190/ADP191
T
1
2
3
V
EN
I
IN
V
OUT
1.3
I
= 10mA
LOAD
I
= 100mA
LOAD
I
= 250mA
LOAD
1.2
I
= 350mA
LOAD
I
= 500mA
LOAD
1.1
1.0
0.9
GROUND CURRENT (µA)
0.8
CH1 2.00V CH2 50.0mA
CH3 1.00V
M40.0µs A CH1 1.24V
T 10.20%
Figure 11. ADP191 Turn-On Delay and Inrush Current
vs. Input Voltage = 1.8 V
T
1
3
CH1 2.00V CH2 50.0mA
CH3 1.00V
V
EN
V
OUT
M200µs A CH1 600mV
T 10.20%
Figure 12. ADP191 Turn-Off Delay, Input Voltage = 3.6 V
T
1
V
EN
0.7
07874-111
JUNCTION TEMPERATURE, T
J
(°C)
1258525–5–40
07874-009
Figure 14. Ground Current vs. Temperature
2.0
I
= 10mA
LOAD
I
= 100mA
LOAD
1.8
I
= 250mA
LOAD
I
= 350mA
LOAD
I
= 500mA
LOAD
1.6
1.4
1.2
1.0
GROUND CURRENT (µA)
0.8
0.6
07874-112
V
(V)
IN
Figure 15. Ground Current vs. Input Voltage, V
0.7
0.6
0.5
VIN = 1.2V
VIN = 1.8V
VIN = 2.5V
VIN = 3.6V
3.2 3.61.2 1.7 2.2 2.7
07874-010
IN
0.4
0.3
0.2
V
3
CH1 2.00V CH2 50.0mA
CH3 500mV
OUT
M200µs A CH1 600mV
T 10.20%
Figure 13. ADP191 Turn-Off Delay, Input Voltage = 1.8 V
07874-113
SHUTDOWN CURRENT (µ A)
0.1
0
JUNCTION TEMPERATURE, T
Figure 16. Shutdown Current vs. Temperature
J
(°C)
1251007550250–25–50
07874-011
Rev. D | Page 8 of 16
Page 9

ADP190/ADP191
THEORY OF OPERATION
The ADP190/ADP191are high-side PMOS load switches. They
are designed for supply operation from 1.1 V to 3.6 V. The PMOS
load switch is designed for low on resistance, 105 mΩ at V
=
IN
1.8 V, and supports 500 mA of continuous current. It is a low
ground current device with a nominal 4 MΩ pull-down resistor
on its enable pin. The package is a space-saving 0.8 mm ×
0.8 mm, 4-ball WLCSP.
The ADP191 incorporates an internal output discharge resistor
to discharge the output capacitance when the ADP191 output is
disabled. The ADP191 also contains circuitry to limit the switch
turn-on slew rate to limit the inrush current.
VIN VOUT
GND
EN
ADP190
VIN VOUT
GND
LEVEL SHIFT
EN
Figure 17. ADP190 Functional Block Diagram
AND SLEW
RATE CONTROL
ADP191
LEVEL SHIFT
AND SLEW
RATE CONTRO L
AND LOAD
DISCHARGE
Figure 18. ADP191 Functional Block Diagram
07874-030
07874-118
Rev. D | Page 9 of 16
Page 10

ADP190/ADP191
APPLICATIONS INFORMATION
GROUND CURRENT
The major source for ground current in the ADP190/ADP191 is
the 4 MΩ pull-down on the enable (EN) pin. Figure 19 shows
typical ground current when V
to 3.6 V.
2.0
1.8
1.6
1.4
1.2
1.0
GROUND CURRENT (µA)
0.8
0.6
Figure 19. Ground Current vs. Load Current
As shown in Figure 20, an increase in ground current can occur
when V
≠ VIN. This is caused by the CMOS logic nature of the
EN
level shift circuitry as it translates an EN signal ≥ 1.1 V to
a logic high. This increase is a function of the V
14
12
10
8
(µA)
GND
6
I
4
2
0
V
OUT
Figure 20. Typical Ground Current when V
ENABLE FEATURE
The ADP190/ADP191 use the EN pin to enable and disable the
VOUT pin under normal operating conditions. As shown in
Figure 21, when a rising voltage on EN crosses the active
threshold, VOUT turns on. When a falling voltage on EN
crosses the inactive threshold, VOUT turns off.
= VIN and VIN varies from 1.1 V
EN
V
= 3.6V
IN
V
= 2.5V
IN
= 1.8V
V
IN
VIN = 1.2V
LOAD (mA)
IN
V
= 3.6V
OUT
= 1.8V
(V)
V
EN
≠ VIN
EN
350300250200150100500
07874-013
− VEN delta.
3.50.1 0.3 0.5 0.7 0.9 1.1 1.3 1.5 1.7 1.9 2.1 2.3 2.5 2.7 3.33.12.9
07874-014
2.0
1.8
1.6
1.4
1.2
(V)
1.0
OUT
V
0.8
0.6
0.4
0.2
0
V
(V)
EN
1.200.40.50.60.70.1 0.2 0.3 0.8 0.9 1.0 1.1
07874-015
Figure 21. Typical EN Operation
As shown in Figure 21, the EN pin has built-in hysteresis. This
prevents on/off oscillations that can occur due to noise on the
EN pin as it passes through the threshold points.
The EN pin active/inactive thresholds derive from the VIN
voltage; therefore, these thresholds vary with changing input
voltage. Figure 22 shows typical EN active/inactive thresholds
when the input voltage varies from 1.1 V to 3.6 V.
1.15
1.05
0.95
0.85
0.75
0.65
0.55
TYPICAL EN THRESHOLDS ( V )
0.45
0.35
1.20
1.35
1.50
1.65
Figure 22. Typical EN Pin Thresholds vs. Input Voltage, V
EN ACTIVE
EN INACTIVE
1.80
1.95
2.10
2.25
2.55
2.70
2.85
3.00
2.40
VIN (V)
3.15
3.60
3.30
3.45
07874-016
IN
TIMING
Turn-on delay is defined as the delta between the time that EN
reaches >1.1 V until VOUT rises to ~10% of its final value. The
ADP190/ADP191 include circuitry to set the typical 1.5 s turnon delay at 3.6 V V
Figure 23, the turn-on delay is dependent on the input voltage.
to limit the VIN inrush current. As shown in
IN
Rev. D | Page 10 of 16
Page 11

ADP190/ADP191
I
T
V
EN
1
2
CH1 1V CH2 1V M4µs A CH1 2.34V
T 15.96µs
Figure 23. ADP190 Typical Turn-On Delay Time with Varying Input Voltage
4.0
3.5
= 100mA
LOAD
= 1µF
C
LOAD
= 3.6V
V
EN
V
= 2.5V
OUT
V
= 1.8V
OUT
V
= 1.2V
OUT
07874-017
Figure 25. ADP190 Typical Rise Time and Inrush Current with C
= 3.6V
V
OUT
T
1
2
3
CH1 2V
CH3 2.00mA Ω
T
1
V
EN
V
OUT
I
IN
V
= 1.8V
OUT
= 200mA
I
LOAD
= 1µF
C
LOAD
= 3.6V
V
EN
CH2 2V M10µs A CH1 2.32V
T 40.16µs
V
EN
LOAD
07874-029
= 1 F
3.0
2.5
2.0
1.5
INPUT VOLTAGE (V)
1.0
0.5
0
TIME (µs)
= 1.8V
V
OUT
VEN = 1.8V
= 1.2V
V
OUT
5000 100 200 300 400
07874-124
Figure 24. ADP191 Typical Turn-On Delay Time with Varying Input Voltage
The rise time is defined as the delta between the time from 10%
to 90% of VOUT reaching its final value. It is dependent on the
RC time constant where C = load capacitance (C
RDS
||R
ON
adequate approximation for RC is RDS
. Because RDSON is usually smaller than R
LOAD
× C
ON
) and R =
LOAD
. The ADP190/
LOAD
LOAD
, an
ADP191 do not need any input or load capacitor, but capacitors
can be used to suppress noise on the board. If significant load
capacitance is connected, inrush current is a concern.
The ADP191 contains circuitry to limit the slew rate of the
switch turn to reduce the turn on inrush current. See Figure 25
and Figure 26 for a comparison of rise time and inrush current.
I
IN
2
3
CH1 2.00V CH2 100mA
CH3 2.00V
V
OUT
M20.0µs A CH1 1.24V
T 10.20%
Figure 26. ADP191 Typical Rise Time and Inrush Current with C
T
1
2
3
CH1 2V
CH3 2.00mA Ω
CH2 2V M10µs A CH1 1.00V
V
EN
V
OUT
I
IN
T 39.8µs
V
OUT
I
LOAD
C
V
EN
LOAD
= 3.6V
= 1.8V
= 200mA
= 4.7µF
Figure 27. ADP190 Typical Rise Time and Inrush Current with C
LOAD
LOAD
07874-126
= 1 F
07874-019
= 4.7 µF
Rev. D | Page 11 of 16
Page 12

ADP190/ADP191
The turn-off time is defined as the delta between the time from
90% to 10% of VOUT reaching its final value. It is also dependent
on the RC time constant.
The ADP191 incorporates an internal output discharge resistor
to discharge the output capacitance when the ADP191 output is
disabled. See Figure 28 and Figure 29 for a comparison of turnoff times.
V
= 1.8V
I
LOAD
C
LOAD
= 100mA,
EN
= 1µF
OUT
= 3.6V
V
EN
= 100mA,
= 4.7µF
07874-020
T
I
= 200mA,
LOAD
= 1µF
C
LOAD
I
LOAD
C
LOAD
1
2
V
EN
CH1 1V CH2 500mV M10µs A CH1 1V
T 30.36µs
Figure 28. ADP190 Typical Turn-Off Time, Various Load Currents
T
1
V
To guarantee reliable operation, the junction temperature of
the ADP190/ADP191must not exceed 125°C. To ensure that the
junction temperature stays below this maximum value, the user
must be aware of the parameters that contribute to junction
temperature changes. These parameters include ambient temperature, power dissipation in the power device, and thermal
resistances between the junction and ambient air (θ
). The θJA
JA
value is dependent on the package assembly compounds that
are used and the amount of copper used to solder the package
GND pin to the PCB. Tabl e 6 shows typical θ
values of the 4-ball
JA
WLCSP for various PCB copper sizes. Tab l e 7 shows the typical
Ψ
value of the 4-ball WLCSP.
JB
Table 6. Typical θ
Values for WLCSP
JA
Copper Size (mm2) θJA (°C/W)
01 260
50 159
100 157
300 153
500 151
1
Device soldered to minimum size pin traces.
Table 7. Typical ΨJB Values
Package ΨJB Unit
4-Ball WLCSP 58.4 °C/W
V
3
CH1 2.00V
CH3 500mV
OUT
M200µs A CH1 600mV
T 10.20%
07874-129
Figure 29. ADP191 Typical Turn-Off Time, Load Current = 0 mA
THERMAL CONSIDERATIONS
In most applications, the ADP190/ADP191 do not dissipate
much heat due to their low on-channel resistance. However, in
applications with high ambient temperature and load current,
the heat dissipated in the package can be large enough to cause
the junction temperature of the die to exceed the maximum
junction temperature of 125°C.
The junction temperature of the die is the sum of the ambient
temperature of the environment and the temperature rise of the
package due to the power dissipation, as shown in Equation 1.
The junction temperature of the ADP190/ADP191can be
calculated from the following equation:
T
= TA + (PD × θJA) (1)
J
where:
T
is the ambient temperature.
A
P
is the power dissipation in the die, given by
D
= [(VIN − V
P
D
OUT
) × I
] + (VIN × I
LOAD
) (2)
GND
where:
I
is the load current.
LOAD
is the ground current.
I
GND
V
and V
IN
are the input and output voltages, respectively.
OUT
Power dissipation due to ground current is quite small and
can be ignored. Therefore, the junction temperature equation
simplifies to the following:
T
= TA + {[(VIN − V
J
OUT
) × I
] × θJA} (3)
LOAD
As shown in Equation 3, for a given ambient temperature, inputto-output voltage differential, and continuous load current, there
exists a minimum copper size requirement for the PCB to ensure
that the junction temperature does not rise above 125°C. Figure 30
to Figure 35 show junction temperature calculations for different
ambient temperatures, load currents, V
IN
to V
differentials,
OUT
and areas of PCB copper.
Rev. D | Page 12 of 16
Page 13

ADP190/ADP191
T
T
T
140
MAX JUNCTION TEMPERATURE
120
LOAD CURRENT = 1mA
(°C)
LOAD CURRENT = 10mA
J
LOAD CURRENT = 25mA
100
LOAD CURRENT = 50mA
LOAD CURRENT = 75mA
80
140
MAX JUNCTION TEMPERATURE
120
(°C)
J
100
80
60
40
JUNCTION TEMPERATURE,
20
LOAD CURRENT = 100mA
LOAD CURRENT = 150mA
0
0.5 1.0 1.5 2.0 2.5 3.0 3.5 4.0 4.5
Figure 30. 500 mm
140
MAX JUNCTION TEMPERATURE
120
LOAD CURRENT = 1mA
(°C)
JUNCTION TEM P E RATURE,
LOAD CURRENT = 10mA
J
LOAD CURRENT = 25mA
100
LOAD CURRENT = 50mA
LOAD CURRENT = 75mA
80
60
40
20
LOAD CURRENT = 100mA
LOAD CURRENT = 150mA
0
0.5 1.0 1.5 2.0 2.5 3.0 3.5 4.0 4.5
Figure 31. 100 mm
140
MAX JUNCTION
TEMPERATURE
LOAD CURRENT = 1mA
120
J
100
LOAD CURRENT =
10mA
(°C)
V
– V
(V)
IN
OUT
2
of PCB Copper, TA = 25°C
V
– V
(V)
IN
OUT
2
of PCB Copper, TA = 25°C
60
40
LOAD CURRENT = 1mA
LOAD CURRENT = 10mA
JUNCTION TE M P E RATURE, T
20
LOAD CURRENT = 25mA
LOAD CURRENT = 50mA
0
0.5 1.0 1.5 2.0 2.5 3.0 3.5 4.0 4.5
07874-021
V
Figure 33. 500 mm
140
MAX JUNCTION TEMPERATURE
120
(°C)
J
100
80
60
40
LOAD CURRENT = 1mA
LOAD CURRENT = 10mA
JUNCTION TE M P E RATURE, T
20
LOAD CURRENT = 25mA
LOAD CURRENT = 50mA
0
0.5 1.0 1.5 2.0 2.5 3.0 3.5 4.0 4.5
07874-022
V
Figure 34. 100 mm
140
MAX JUNCTION
TEMPERATURE
120
(°C)
J
100
LOAD CURRENT = 75mA
LOAD CURRENT = 100mA
LOAD CURRENT = 150mA
– V
(V)
IN
OUT
2
of PCB Copper, TA = 50°C
LOAD CURRENT = 75mA
LOAD CURRENT = 100mA
LOAD CURRENT = 150mA
– V
(V)
IN
OUT
2
of PCB Copper, TA = 50°C
07874-024
07874-025
80
60
40
JUNCTION TEMPERATURE,
20
LOAD CURRENT = 25mA
LOAD CURRENT = 50mA
LOAD CURRENT = 75mA
0
0.5 1.0 1.5 2.0 2.5 3.0 3.5 4.0 4.5
Figure 32. 0 mm
V
2
LOAD CURRENT = 100mA
LOAD CURRENT = 150mA
– V
(V)
IN
OUT
of PCB Copper, TA = 25°C
07874-023
80
60
40
LOAD CURRENT = 1mA
LOAD CURRENT = 10mA
JUNCTION TE M P E RATURE, T
20
LOAD CURRENT = 25mA
LOAD CURRENT = 50mA
0
0.5 1.0 1.5 2.0 2.5 3.0 3.5 4.0 4.5
Figure 35. 0 mm
V
2
LOAD CURRENT = 75mA
LOAD CURRENT = 100mA
LOAD CURRENT = 150mA
– V
(V)
IN
OUT
of PCB Copper, TA = 50°C
07874-026
Rev. D | Page 13 of 16
Page 14

ADP190/ADP191
In cases where the board temperature is known, use the thermal
characterization parameter, Ψ
ature rise. Maximum junction temperature (T
from the board temperature (T
using the formula
T
= TB + (PD × ΨJB) (4)
J
140
120
(°C)
J
100
80
LOAD CURRENT = 1mA
60
LOAD CURRENT = 10mA
LOAD CURRENT = 25mA
LOAD CURRENT = 50mA
40
LOAD CURRENT = 75mA
JUNCTION TE M P E RATURE, T
LOAD CURRENT = 100mA
LOAD CURRENT = 150mA
20
MAX JUNCTION TEMPERATURE
0
0.5 1.0 1.5 2.0 2.5 3.0 3.5 4.0 4.5
, to estimate the junction temper-
JB
) is calculated
J
) and power dissipation (PD)
B
V
– V
(V)
IN
OUT
Figure 36. T
= 85°C
B
07874-027
Figure 37. ADP190 PCB Layout
07874-028
PCB LAYOUT CONSIDERATIONS
Improve heat dissipation from the package by increasing the
amount of copper attached to the pins of the ADP190/ADP191.
However, as listed in Tab l e 6 , a point of diminishing returns is
eventually reached, beyond which an increase in the copper size
does not yield significant heat dissipation benefits.
It is critical to keep the input and output traces as wide and as
short as possible to minimize the circuit board trace resistance.
07874-200
Figure 38. ADP191 PCB Layout
Rev. D | Page 14 of 16
Page 15

ADP190/ADP191
R
OUTLINE DIMENSIONS
0.660
0.800
0.760 SQ
0.720
0.430
0.400
0.370
0.600
0.540
SEATING
PLANE
12
BALL A1
IDENTIFIE
TOP VIEW
(BALL SI DE DO W N)
0.230
0.200
0.170
0.40
BALL PITCH
0.050 NOM
COPLANARITY
0.280
0.260
0.240
BOTTOM VIEW
(BALL SIDE UP)
A
B
11509-A
Figure 39. 4-Ball Wafer Level Chip Scale Package [WLCSP]
(CB-4-3)
Dimensions shown in millimeters
ORDERING GUIDE
Model1 Temperature Range Package Description Package Option Branding
ADP190ACBZ-R7 −40°C to +85°C 4-Ball Wafer Level Chip Scale Package [WLCSP] CB-4-3 4D
ADP191ACBZ-R7 −40°C to +85°C 4-Ball Wafer Level Chip Scale Package [WLCSP] CB-4-3 4G
ADP190CB-EVALZ Evaluation Board
ADP191CB-EVALZ Evaluation Board
1
Z = RoHS Compliant Part.
Rev. D | Page 15 of 16
Page 16

ADP190/ADP191
NOTES
©2009-2010 Analog Devices, Inc. All rights reserved. Trademarks and
registered trademarks are the property of their respective owners.
D07874-0-11/10(D)
Rev. D | Page 16 of 16
 Loading...