

Page 1
1700 MHz to 2400 MHz GaAs
–
FEATURES
Internally matched to 50 Ω input and output
Internally biased
Operating frequency: 1700 MHz to 2400 MHz
Gain: 20 dB
OIP3: 43 dBm
P1 dB: 28 dBm
Noise figure: 5 dB
3 mm × 3 mm LFCSP
Power supply: 5 V
APPLICATIONS
CDMA2000, WCDMA, and GSM base station transceivers and
high power amplifiers
GENERAL DESCRIPTION
The ADL5323 is a high linearity GaAs driver amplifier that is
internally matched to 50 Ω for operation in the 1700 MHz to
2400 MHz frequency range. The amplifier, which has a gain of
20 dB, has been specially designed for use in the output stage of
a cellular base station radio or as an input preamplifier in a
multicarrier base station power amplifier. Matching and biasing
are all on-chip. The ADL5323 is available in a Pb-free, 3 mm ×
3 mm, 8-lead LFCSP with an operating temperature of
−40°C to +85°C.
Matched RF PA Predriver
ADL5323
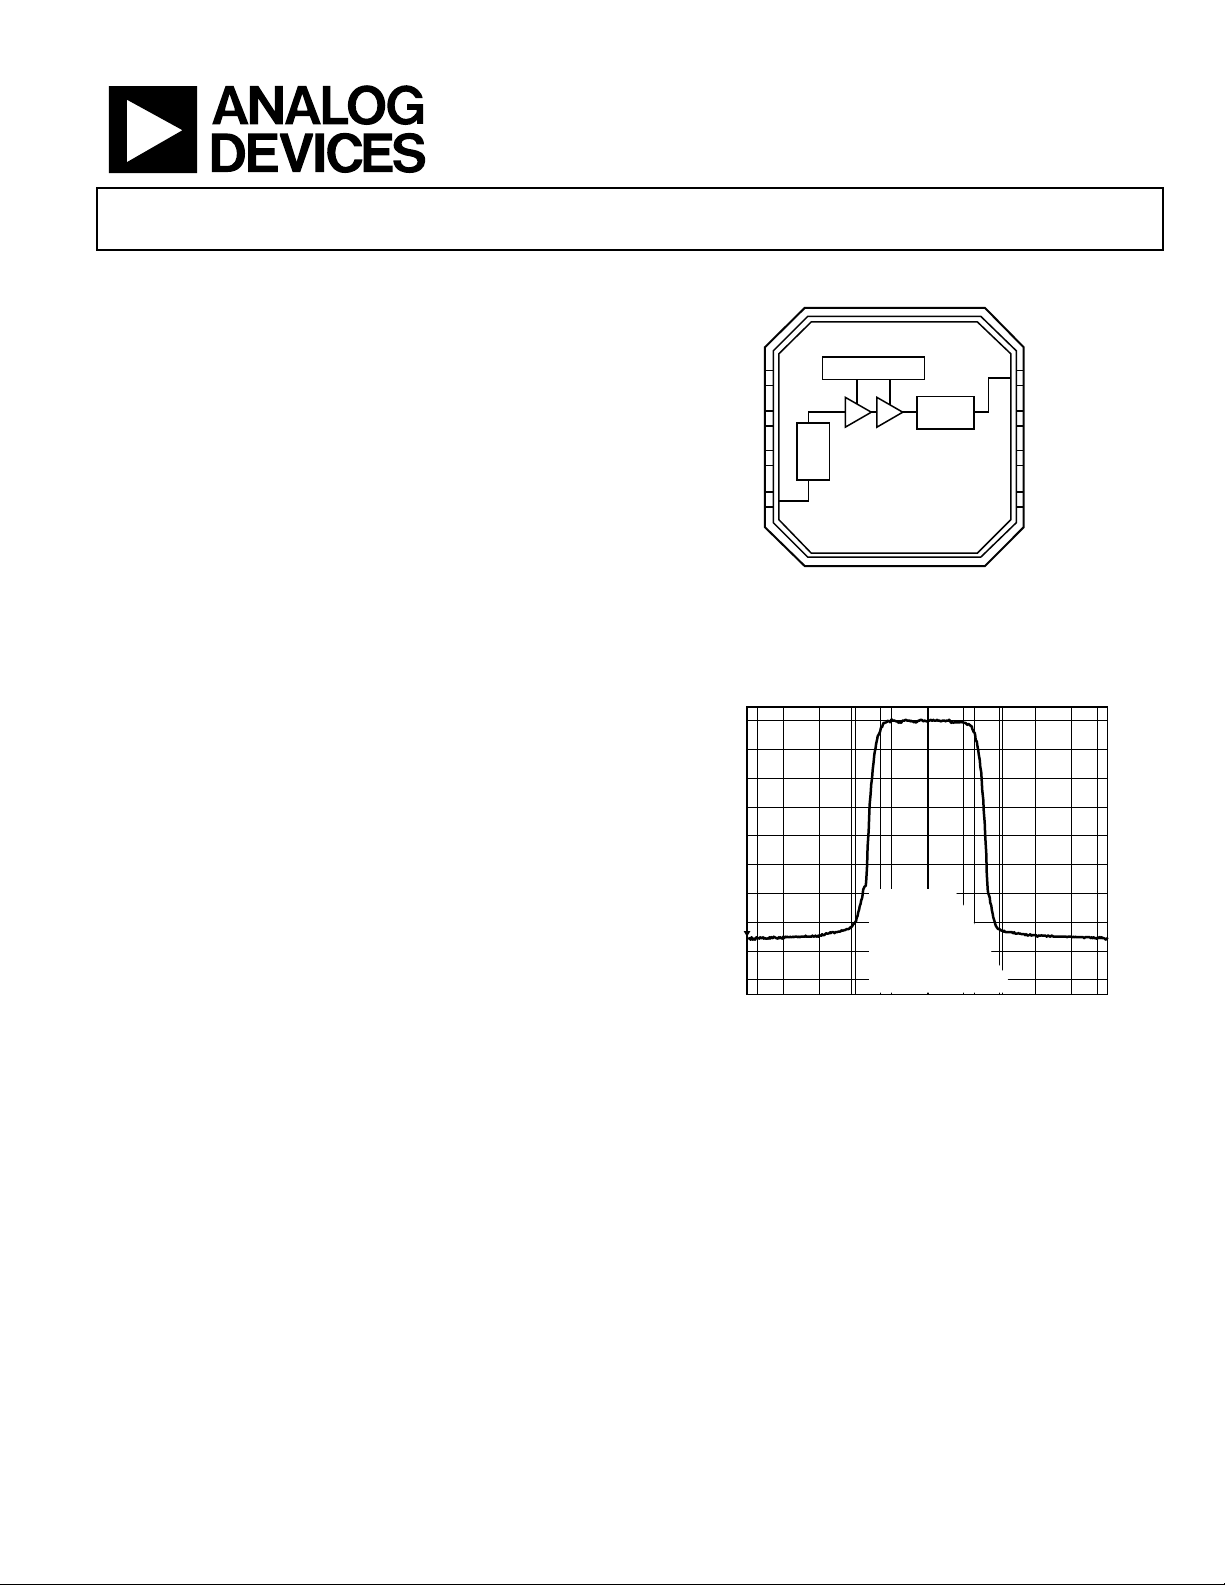
FUNCTIONAL BLOCK DIAGRAM
VCC 5
GND 6
GND 7
RFIN 8
15
–20
–30
–40
–50
–60
(dBm)
–70
–80
–90
–100
–110
–115
CENTER 2.14G Hz SPAN 14.6848MHz
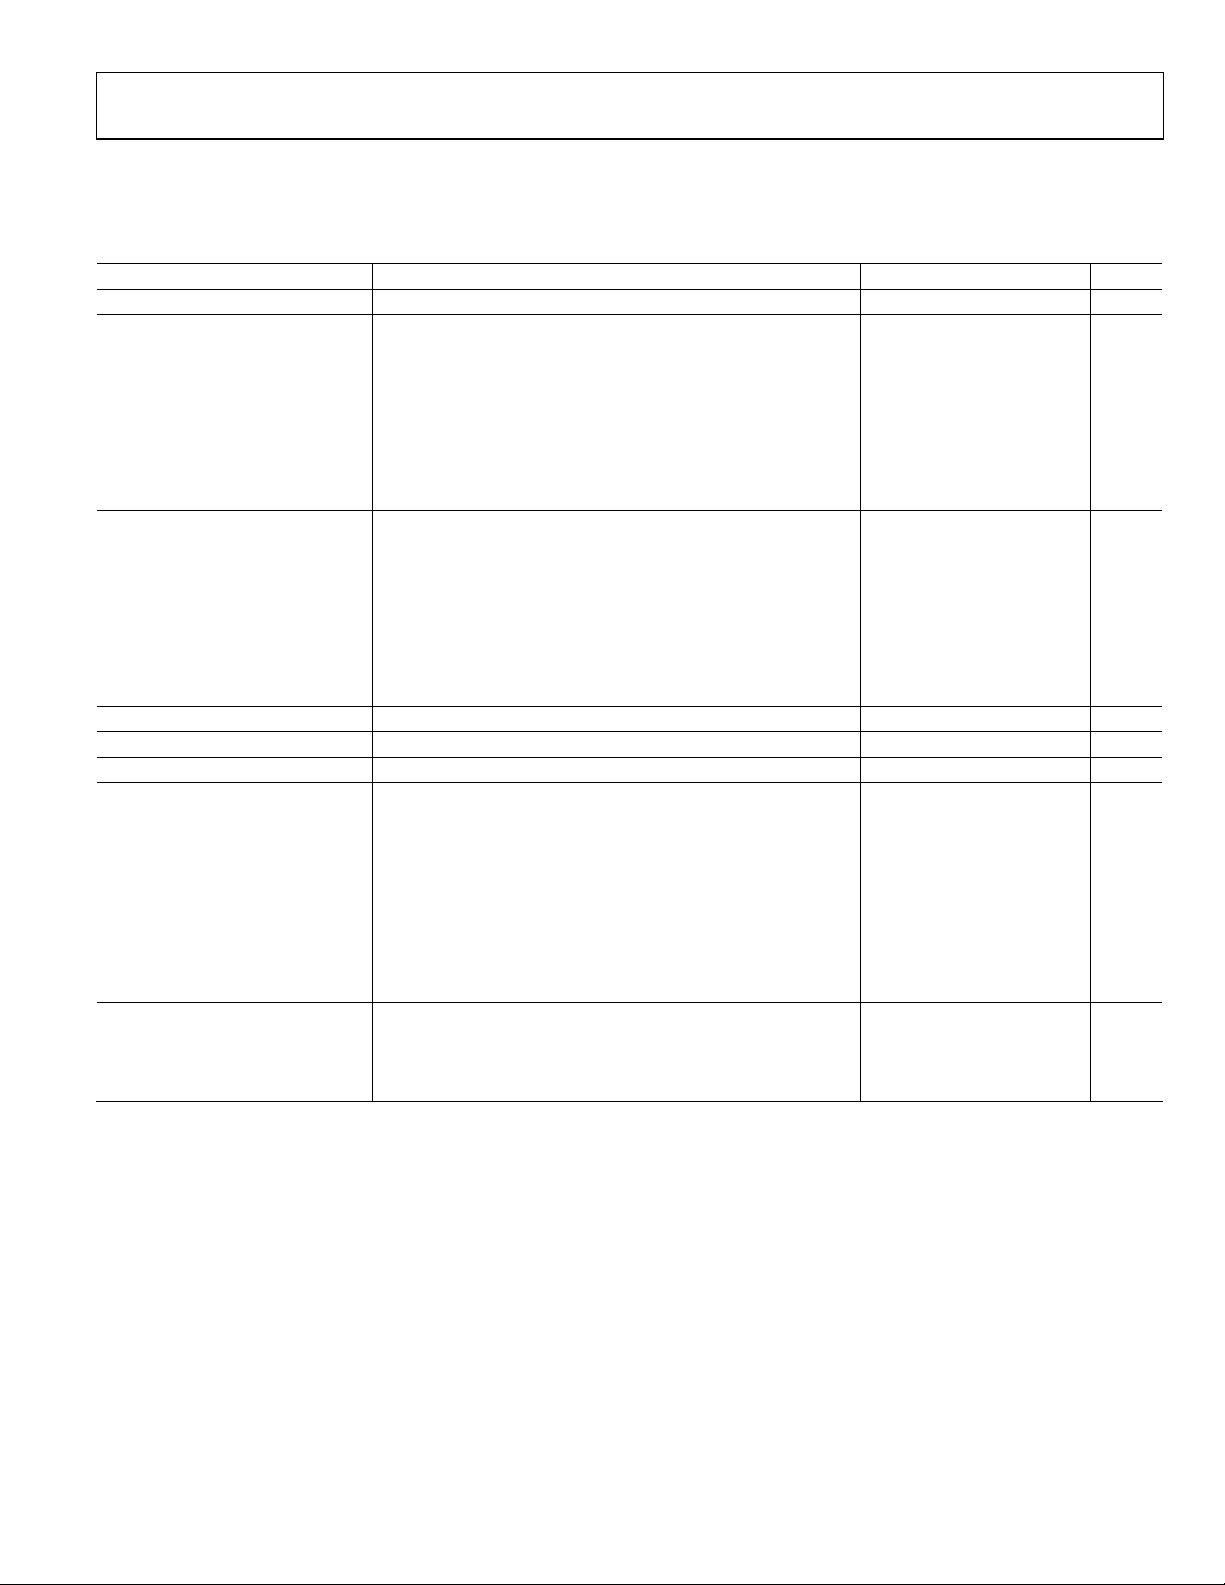
Figure 2. Single-Carrier WCDMA Spectral Plot @ 2140 MHz
BIAS CONTROL
OUTPUT
MATCH
INPUT
MATCH
ADL5323
Figure 1.
RBW = 30kHz
VBW = 300kHz
SWT = 2s
RF ATT = 10dB
CH PWR = 0dBm
ACP UP = –74.2dBc
ACP LOW = –73.9dBc
1.46848MHz/
(No Noise Floor Correction, Test Model 1-64)
4 RFOUT
3 GND
2 VCC
1 VCC
06058-001
06058-014
Rev. 0
Information furnished by Analog Devices is believed to be accurate and reliable. However, no
responsibility is assumed by Anal og Devices for its use, nor for any infringements of patents or ot her
rights of third parties that may result from its use. Specifications subject to change without notice. No
license is granted by implication or otherwise under any patent or patent rights of Analog Devices.
Trademarks and registered trademarks are the property of their respective owners.
One Technology Way, P.O. Box 9106, Norwood, MA 02062-9106, U.S.A.
Tel: 781.329.4700 www.analog.com
Fax: 781.461.3113 ©2006 Analog Devices, Inc. All rights reserved.
Page 2

ADL5323
TABLE OF CONTENTS
Features .............................................................................................. 1
Pin Configuration and Function Descriptions..............................5
Applications....................................................................................... 1
Functional Block Diagram .............................................................. 1
General Description......................................................................... 1
Revision History ............................................................................... 2
Specifications..................................................................................... 3
Absolute Maximum Ratings............................................................ 4
ESD Caution.................................................................................. 4
REVISION HISTORY
7/06—Revision 0: Initial Version
Typical Perf or m an c e Charac t e r istics ..............................................6
Basic Connections.............................................................................8
WCDMA Driving Application ....................................................8
Evaluation Board ...............................................................................9
Outline Dimensions ....................................................................... 10
Ordering Guide .......................................................................... 10
Rev. 0 | Page 2 of 12
Page 3
ADL5323
SPECIFICATIONS
VCC = 5 V, TA = 25°C.
Table 1.
Parameter Conditions Min Typ Max Unit
FREQUENCY RANGE 1700 2400 MHz
GAIN Frequency = 1960 MHz 18 20.5 24 dB
vs. Frequency 1930 MHz to 1990 MHz ±0.2 dB
vs. Temperature −40°C to +85°C ±1.25 dB
vs. Voltage 4.75 V to 5.25 V ±0.1 dB
Frequency = 2140 MHz 17.5 19.5 21.8 dB
vs. Frequency 2110 MHz to 2170 MHz ±0.25 dB
vs. Temperature −40°C to +85°C ±1.5 dB
vs. Voltage 4.75 V to 5.25 V ±0.1 dB
P1 dB Frequency = 1960 MHz 27.3 28 dBm
vs. Frequency 1930 MHz to 1990 MHz ±0.1 dBm
vs. Temperature −40°C to +85°C ±0.8 dBm
vs. Voltage 5 V, @ 5% (4.75 V to 5.25 V) ±0.5 dBm
Frequency = 2140 MHz 27.3 28 dBm
vs. Frequency 2110 MHz to 2170 MHz ±0.15 dBm
vs. Temperature −40°C to +85°C ±1.1 dBm
vs. Voltage 5 V, @ 5% (4.75 V to 5.25 V) ±0.5 dBm
NOISE FIGURE Frequency = 1700 MHz to 2300 MHz 5 dB
INPUT RETURN LOSS S
OUTPUT RETURN LOSS S
OIP3 Carrier spacing = 1 MHz, P
Frequency = 1960 MHz 42.5 dBm
vs. Frequency 1930 MHz to 1990 MHz ±0.5 dBm
vs. Temperature −40°C to +85°C ±1 dBm
vs. Voltage 4.75 V to 5.25 V ±2 dBm
Frequency = 2140 MHz 43.5 dBm
vs. Frequency 2110 MHz to 2170 MHz ±0.15 dBm
vs. Temperature −40°C to +85°C ±0.75 dBm
vs. Voltage 4.75 V to 5.25 V ±1.8 dBm
POWER SUPPLY
Supply Voltage 4.75 5 5.25 V
Supply Current P
Operating Temperature −40 +85 °C
11
22
Frequency = 1930 MHz to 2170 MHz −15 dB
Frequency = 1930 MHz to 2170 MHz −15 dB
= 5 dBm per carrier
OUT
= 5 dBm 320 mA
OUT
Rev. 0 | Page 3 of 12
Page 4
ADL5323
ABSOLUTE MAXIMUM RATINGS
Table 2.
Parameter Rating
Supply Voltage, VPOS 6 V
Input Power (re: 50 Ω) 18 dBm
Equivalent Voltage 1.8 V rms
θ
(Paddle Soldered) 28.5°C/W
JC
Maximum Junction Temperature 150°C
Operating Temperature Range −40°C to +85°C
Storage Temperature Range −65°C to +150°C
Soldering Temperature 260°C
ESD CAUTION
ESD (electrostatic discharge) sensitive device. Electrostatic charges as high as 4000 V readily accumulate on
the human body and test equipment and can discharge without detection. Although this product features
proprietary ESD protection circuitry, permanent damage may occur on devices subjected to high energy
electrostatic discharges. Therefore, proper ESD precautions are recommended to avoid performance
degradation or loss of functionality.
Stresses above those listed under Absolute Maximum Ratings
may cause permanent damage to the device. This is a stress
rating only; functional operation of the device at these or any
other conditions above those indicated in the operational
section of this specification is not implied. Exposure to absolute
maximum rating conditions for extended periods may affect
device reliability.
Rev. 0 | Page 4 of 12
Page 5

ADL5323
PIN CONFIGURATION AND FUNCTION DESCRIPTIONS
PIN 1
VCC 1
VCC 2
GND 3
RFOUT 4
Figure 3. Pin Configuration
Table 3. Pin Function Descriptions
Pin No. Mnemonic Description
1, 2, 5 VCC
Positive 5 V Supply Voltage. Bypass these three pins with independent power supply decoupling networks
(100 pF, 10 nF, and 10 μF).
3, 6, 7 GND Device Ground.
4 RFOUT RF Output. Internally matched to 50 Ω.
8 RFIN RF Input. Internally matched to 50 Ω.
N/A EP Exposed Paddle. Connect to ground plane via a low impedance path.
INDICATOR
ADL5323
TOP VIEW
(Not to S cale)
8 RFIN
7 GND
6 GND
5 VCC
06058-002
Table 4. S-Parameters
Frequency (GHz) ADL5323 (1, 1) ADL5323 (1, 2) ADL5323 (2, 1) ADL5323 (2, 2)
1.700 +0.223/−117.296 0.001/46.748 11.970/81.811 0.329/131.623
1.750 +0.221/−121.479 0.001/42.216 11.841/70.891 0.284/126.121
1.800 +0.213/−125.661 8.631E-4/20.038 11.719/59.628 0.237/119.974
1.850 +0.199/−125.955 7.410E-4/8.703 11.579/48.044 0.187/112.389
1.900 +0.178/−134.553 +6.610E-4/−15.411 11.430/36.098 0.138/101.953
1.950 +0.148/−139.939 +6.107E-4/−49.029 11.233/23.696 0.092/85.095
2.000 +0.109/−143.147 +7.862E-4/−93.510 10.994/10.837 0.058/47.650
2.050 +0.062/−144.310 +9.845E-4/−106.413 +10.677/−2.467 +0.064/−8.136
2.100 +0.013/−85.228 +0.001/−137.342 +10.282/−16.244 +0.103/−38.076
2.150 +0.065/−1.170 +0.002/−152.839 +9.786/−30.382 +0.151/−52.943
2.200 +0.137/−3.193 +0.002/−165.020 +9.178/−44.797 +0.201/−62.896
2.250 +0.213/−9.279 0.002/178.599 +8.460/−59.375 +0.250/−70.697
2.300 +0.288/−16.416 0.003/168.309 +7.657/−73.707 +0.298/−77.549
2.350 +0.359/−23.757 0.003/156.456 +6.820/−87.516 +0.343/−83.655
2.400 +0.423/−31.004 0.003/145.888 +6.002/−100.610 +0.386/−89.478
Rev. 0 | Page 5 of 12
Page 6

ADL5323
TYPICAL PERFORMANCE CHARACTERISTICS
23
TEMP = –40°C
22
TEMP = +25°C
21
TEMP = +85°C
20
19
18
GAIN (dB)
17
16
15
14
13
1700 2400
1800 1900 2000 2100 2200 2300
FREQUENCY (MHz)
Figure 4. Gain vs. Frequency, V
= 5 V, TA = −40°C, +25°C, and +85°C
CC
29
TEMP = –40°C
28
27
26
P1dB (dBm)
25
24
23
1700 2400
1800 1900 2000 2100 2200 2300
TEMP = +25°C
TEMP = +85°C
FREQUENCY (MHz)
Figure 5. P1 dB vs. Frequency, VCC = 5 V, TA = −40°C, +25°C, and +85°C
44
43
42
TEMP = +25°C
TEMP = +85°C
TEMP = –40°C
06058-003
06058-004
6.0
5.8
5.6
5.4
5.2
5.0
NF (dBm)
4.8
4.6
4.4
4.2
4.0
1700 2400
1800 1900 2000 2100 2200 2300
FREQUENCY (MHz)
Figure 7. Noise Figure vs. Frequency, V
= 5 V, TA = 25°C
CC
29.0
= 5.25V
V
28.5
28.0
27.5
27.0
26.5
P1dB (dBm)
26.0
25.5
25.0
24.5
1700 2400
1800 1900 2000 2100 2200 2300
Figure 8. P
vs. Frequency, VCC = 4.75 V, 5 V, and 5.25 V, TA = 25°C
1 dB
CC
= 5V
V
CC
VCC = 4.75V
FREQUENCY (MHz)
44
V
= 5.25V
43
42
CC
= 5V
V
CC
06058-006
06058-007
41
OIP3 (dBm)
40
39
38
1700 2400
1800 1900 2000 2100 2200 2300
FREQUENCY (MHz)
Figure 6. OIP3 vs. Frequency, V
= 5 V, TA = −40°C, +25°C, and +85°C
CC
06058-005
Rev. 0 | Page 6 of 12
41
OIP3 (dBm)
40
39
38
1700 2400
1800 1900 2000 2100 2200 2300
FREQUENCY (MHz)
Figure 9. OIP3 vs. Frequency, V
VCC = 4.75V
= 4. 75 V, 5 V, and 5.25 V, TA = 25°C
CC
06058-008
Page 7

ADL5323
–
10
9
8
7
6
5
4
FREQUENCY
3
2
1
0
40
41 42
OIP3 (dBm)
43
44 45 46
06058-009
Figure 10. Distribution of OIP3 at 1990 MHz
5
–10
–15
–20
–25
ADL5323 [1, 1] (dB)
ADL5323 [2, 2] (dB)
–30
S22
S11
FREQUENCY
12
10
8
6
4
2
0
40
41 42 43 44
OIP3 (dBm)
Figure 12. Distribution of OIP3 at 2170 MHz
46
45
06058-011
–35
–40
1700 2400
1800 1900 2000 2100 2200 2300
FREQUENCY (MHz)
Figure 11. Input S11 and Output S22 Return Loss vs. Frequency
06058-010
Rev. 0 | Page 7 of 12
Page 8

ADL5323
–
–
BASIC CONNECTIONS
Figure 16 shows the basic connections for operating the
ADL5323. Each of the three power supply lines should be
decoupled with 10 μF, 10 nF, and 100 pF capacitors. Pin 3, Pin 6,
Pin 7, and the exposed paddle under the device should all be
connected to a low impedance ground plane. If multiple ground
planes are being used, these should be stitched together with
vias under the device to optimize thermal conduction. See the
recommended land pattern in
Figure 13. Recommended Land Pattern
Figure 13 for more information.
06058-013
WCDMA DRIVING APPLICATION
Figure 14 shows a plot of the spectrum of an ADL5323 driving a
single carrier WCDMA signal (Test Model 1-64) at 0 dBm,
centered at 2140 MHz. At 5 MHz offset, an adjacent channel
power ratio of −74 was measured.
Figure 15 shows how ACP varies with output power level. Note
that in this plot, the noise floor of the spectrum analyzer was
factored out.
15
–20
–30
–40
–50
–60
(dBm)
–70
–80
–90
–100
–110
–115
CENTER 2.14G Hz SPAN 14.6848MHz
RBW = 30kHz
VBW = 300kHz
SWT = 2s
RF ATT = 10dB
CH PWR = 0dBm
ACP UP = –74.2dBc
ACP LOW = –73.9dBc
1.46848MHz/
Figure 14. Spectrum of Single WCDMA Carrier Centered at 2140 MHz;
Carrier Power = 0 dBm, ACPR = −74 dBc
55
–60
–65
–70
06058-014
–75
ACP @ 5 MHz CARRIER OFFSET ( dBc)
–80
–15
–10 –5 0 5 10 15
OUTPUT POWER (dBm)
20
06058-015
Figure 15. WCDMA ACP vs. Output Power, Single Carrier, Test Model 1-64
C5
VCC
RFIN
C1
10µFC310nF
C4
100pF
C2
100pF
AGNDAGNDAGND
AGND
ADL5323
5
VCC
6
GND
7
GND
8
RFIN VCC
EP
RFOUT
GND
VCC
4
3
2
1
Figure 16. Basic Connections
100pF
AGND
C6
100pFC710nF
C9
100pF
C10
10nF
C8
10µF
AGNDAGNDAGND
C11
10µF
AGNDAGNDAGND
RFOUT
VCC
VCC
6058-012
Rev. 0 | Page 8 of 12
Page 9

ADL5323
EVALUATION BOARD
Figure 18 shows the schematic of the ADL5323 evaluation
board. The board is powered by a single supply in the 4.75 V to
5.25 V range. The power supply is decoupled on each of the
three power supply pins by 10 μF, 10 nF, and 100 pF capacitors.
See
Tabl e 5 for the exact evaluation board component values.
Note that all three VCC pins (Pin 1, Pin 2, and Pin 5) should be
independently bypassed as shown in
operation.
Table 5. Evaluation Board Components
Component Function Default Value
DUT1 Driver amplifier ADL5323
C1, C12, C16 Low frequency bypass capacitors 10 μF, 0603
C3, C11, C17 Low frequency bypass capacitors 10 nF, 0402
C2, C10, C18 High frequency bypass capacitors 100 pF, 0402
C8, C9, C13, C14, R3 Open Open , 0402
R2, R4 AC coupling capacitors 100 pF, 0402
VCC
RFIN
C1
10µFC310nF
Figure 18 for proper
C2
100pF
AGNDAGNDAGND
R2
100pF
C8
OPENC9OPEN
AGND
AGNDAGND
ADL5322/
ADL5323
5
VCC
6
GND
7
GND
8
RFIN VCC
DUT1
GND
RFOUT
GND
VCC
06058-016
Figure 17. Evaluation Board Component Side View
R4
100pF
C13
OPEN
R3
OPEN
AGND
C10
100pF
C18
100pF
4
3
2
1
VCCVCC
C11
10nF
C17
10nF
C14
OPEN
AGNDAGND
C12
10µF
AGNDAGNDAGND
C16
10µF
AGNDAGNDAGND
SNS1
RFOUT
TP2
VCC
TP1
VCC
AGND
VCC
W1
AGND
06058-017
Figure 18. Evaluation Board Schematic
Rev. 0 | Page 9 of 12
Page 10

ADL5323
R
OUTLINE DIMENSIONS
0.50
0.40
4
0.30
1
1.50
REF
PIN 1
INDICATO
1.89
1.74
1.59
PIN 1
INDICATOR
3.00
BSC SQ
TOP
VIEW
2.75
BSC SQ
0.50
BSC
0.60 MAX
8
5
1.60
1.45
1.30
0.90 MAX
0.85 NOM
SEATING
PLANE
12° MAX
0.30
0.23
0.18
0.70 MAX
0.65 TYP
0.05 MAX
0.01 NOM
0.20 REF
Figure 19. 8-Lead Lead Frame Chip Scale Package [LFCSP_VD]
3 mm × 3 mm Body, Very Thin, Dual Lead
(CP-8-2)
Dimensions shown in millimeters
ORDERING GUIDE
Model Temperature Range Package Description Package Option Branding Ordering Quantity
ADL5323ACPZ-R71−40°C to +85°C 8-Lead LFCSP_VD, 7" Tape and Reel CP-8-2 OR 1500
ADL5323ACPZ-WP1−40°C to +85°C 8-Lead LFCSP_VD, Waffle Pack CP-8-2 OR 50
ADL5323-EVAL Evaluation Board 1
1
Z = Pb-free part.
Rev. 0 | Page 10 of 12
Page 11

ADL5323
NOTES
Rev. 0 | Page 11 of 12
Page 12

ADL5323
NOTES
©2006 Analog Devices, Inc. All rights reserved. Trademarks and
registered trademarks are the property of their respective owners.
D06058-0-7/06(0)
Rev. 0 | Page 12 of 12
 Loading...