

Page 1
Polyphase Multifunction
Energy Metering IC with Serial Port
FEATURES
High Accuracy, Supports IEC 687/61036
Compatible with 3-Phase/3-Wire, 3-Phase/4-Wire
and any Type of 3-Phase Services
Less than 0.1% Error in Active Power Measurement over a
Dynamic Range of 1000 to 1
Supplies Active Energy, Apparent Energy, Voltage RMS,
Current RMS, and Sampled Waveform Data
Digital Power, Phase, and Input Offset Calibration
On-Chip Temperature Sensor (4C Typical after Calibration)
On-Chip User Programmable Thresholds for Line Voltage
SAG and Overdrive Detections
SPI Compatible Serial Interface with Interrupt
Request Line (IRQ)
Pulse Output with Programmable Frequency
Proprietary ADCs and DSP Provide High Accuracy over
Large Variations in Environmental Conditions and Time
Single 5 V Supply
GENERAL DESCRIPTION
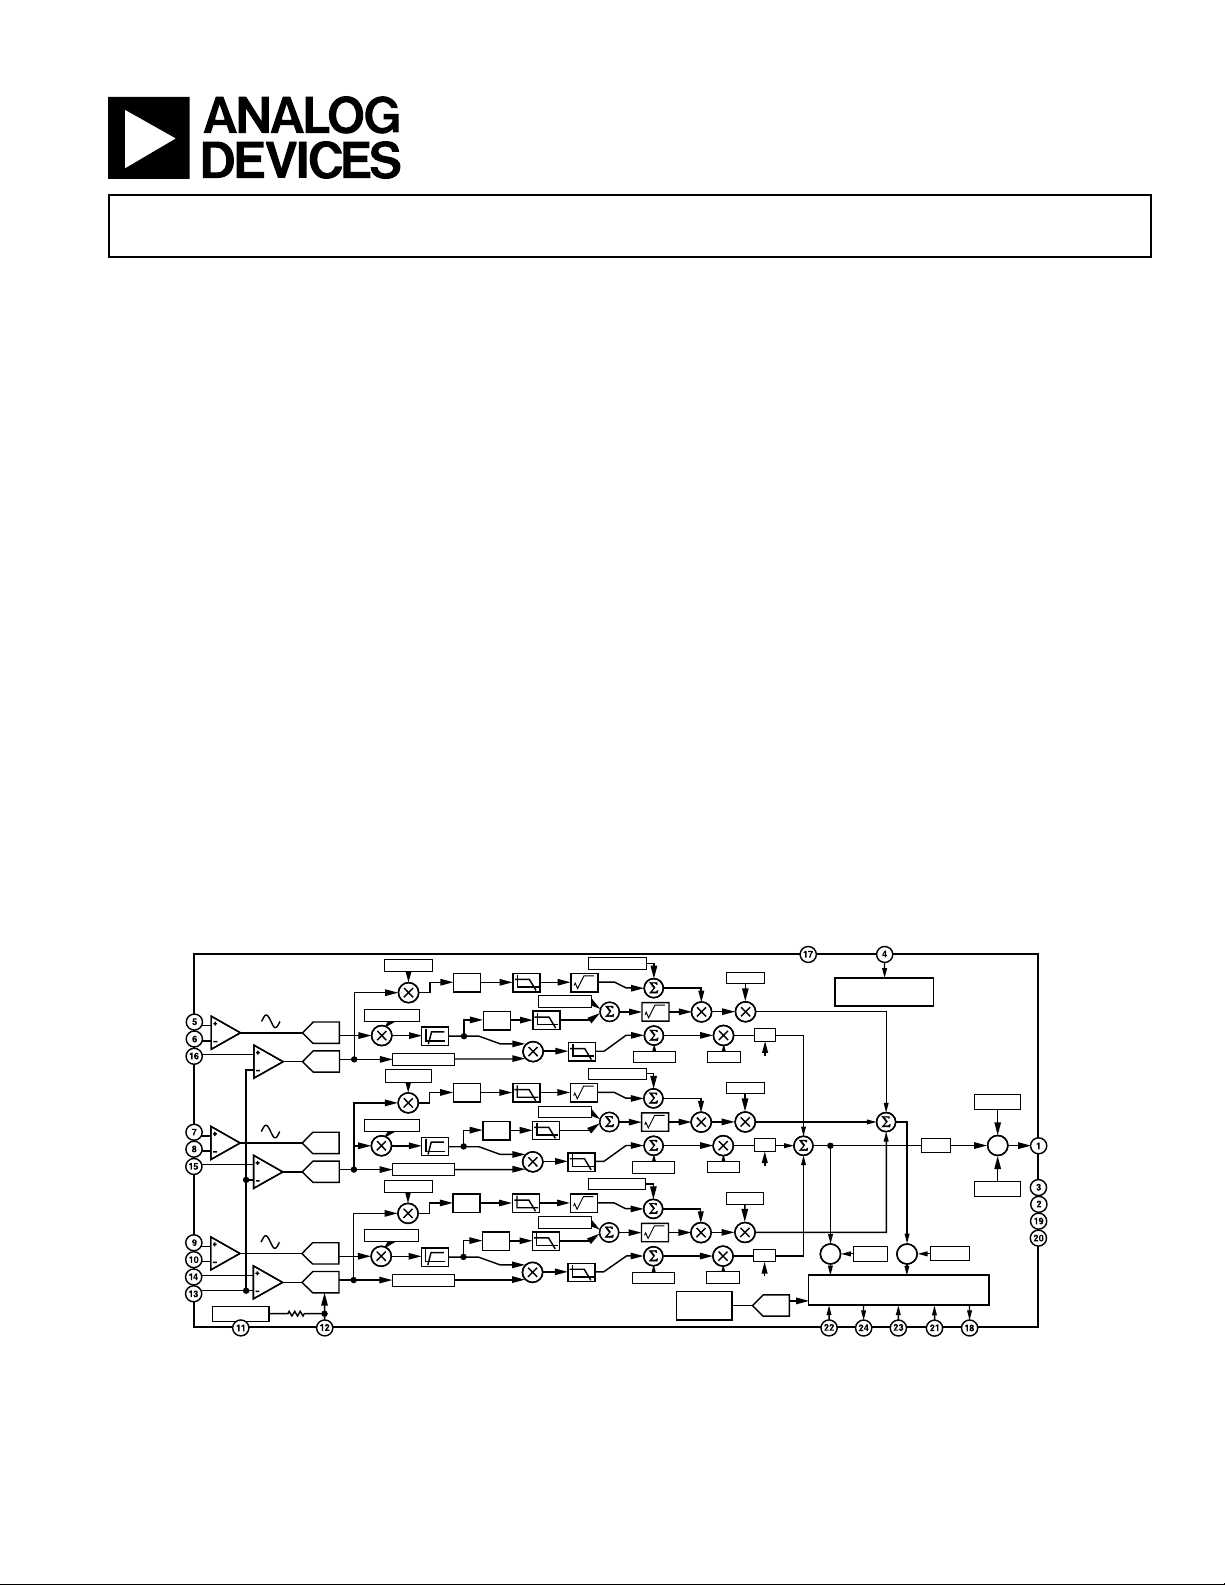
The ADE7754 is a high accuracy polyphase electrical energy
measurement IC with a serial interface and a pulse output. The
ADE7754 incorporates second order Σ-∆ ADCs, reference
circuitry, temperature sensor, and all the signal processing
required to perform active, apparent energy measurements, and
rms calculation.
The ADE7754 provides different solutions for measuring active
and apparent energy from the six analog inputs, thus enabling
ADE7754
*
the use of the ADE7754 in various power meter services such as
3-phase/4-wire, 3-phase/3-wire, and 4-wire delta.
In addition to rms calculation, active and apparent power information, the ADE7754 provides system calibration features for
each phase (i.e., channel offset correction, phase calibration,
and gain calibration). The CF logic output provides instantaneous active power information.
The ADE7754 has a waveform sample register that enables
access to ADC outputs. The part also incorporates a detection
circuit for short duration low or high voltage variations. The
voltage threshold levels and the duration (number of half line
cycles) of the variation are user programmable.
A zero-crossing detection is synchronized with the zero-crossing
point of the line voltage of each of the three phases. The information collected is used to measure each line’s period. It is also
used internally to the chip in the line active energy and line
apparent energy accumulation modes. This permits faster and
more accurate calibration of the power calculations. This signal
is also useful for synchronization of relay switching.
Data is read from the ADE7754 via the SPI serial interface. The
interrupt request output (IRQ) is an open-drain, active low
logic output. The IRQ output goes active low when one or more
interrupt events have occurred in the ADE7754. A status register indicates the nature of the interrupt.
The ADE7754 is available in a 24-lead SOIC package.
FUNCTIONAL BLOCK DIAGRAM
AVGAIN
PGA1
I
AP
I
AN
V
AP
I
BP
I
BN
V
BP
I
CP
I
CN
V
CP
V
N
PGA1
PGA1
2.4V REF
AGND
PGA2
PGA2
PGA2
4k
REF
ADC
ADC
ADC
ADC
ADC
ADC
AAPGAIN
APHCAL
BVGAIN
BAPGAIN
BPHCAL
CVGAIN
CAPGAIN
CPHCAL
IN/OUT
HPF
HPF
HPF
2
X
2
X
2
X
2
X
2
X
2
X
AVRMSOS
AIRMSOS
LPF2
BVRMSOS
BIRMSOS
LPF2
CVRMSOS
CIRMSOS
LPF2
REV. 0 *Patents pending.
Information furnished by Analog Devices is believed to be accurate and
reliable. However, no responsibility is assumed by Analog Devices for its
use, nor for any infringements of patents or other rights of third parties that
may result from its use. No license is granted by implication or otherwise
under any patent or patent rights of Analog Devices. Trademarks and
registered trademarks are the property of their respective companies.
AV
DD
POWER SUPPLY
MONITOR
DFC
SCLK
VADIV
%
CS
WDIV
%
ADE7754 REGISTERS AND
SERIAL INTERFACE
DOUT
DIN
ADE7754
CFNUM
CFDEN
IRQ
CF
DV
DD
DGND
CLKIN
CLKOUT
AAPOS
BAPOS
CAPOS
AWG
BWG
CWG
TEMP
SENSOR
RESET
AVAG
|X|
ABS
BVAG
|X|
ABS
CVAG
|X|
ABS
ADC
One Technology Way, P.O. Box 9106, Norwood, MA 02062-9106, U.S.A.
Tel: 781/329-4700 www.analog.com
Fax: 781/326-8703 © 2003 Analog Devices, Inc. All rights reserved.
Page 2

ADE7754
Contents
GENERAL DESCRIPTION . . . . . . . . . . . . . . . . . . . . . . . . . 1
FEATURES . . . . . . . . . . . . . . . . . . . . . . . . . . . . . . . . . . . . . 1
SPECIFICATIONS . . . . . . . . . . . . . . . . . . . . . . . . . . . . . . . 3
TIMING CHARACTERISTICS . . . . . . . . . . . . . . . . . . . . . 4
ABSOLUTE MAXIMUM RATINGS . . . . . . . . . . . . . . . . . 5
ORDERING GUIDE . . . . . . . . . . . . . . . . . . . . . . . . . . . . . . 5
PIN CONFIGURATION . . . . . . . . . . . . . . . . . . . . . . . . . . . 5
PIN FUNCTION DESCRIPTIONS . . . . . . . . . . . . . . . . . . 5
TYPICAL PERFORMANCE CHARACTERISTICS . . . . . 7
TERMINOLOGY . . . . . . . . . . . . . . . . . . . . . . . . . . . . . . . . . 9
Measurement Error . . . . . . . . . . . . . . . . . . . . . . . . . . . . . . 9
Phase Error Between Channels . . . . . . . . . . . . . . . . . . . . . 9
Power Supply Rejection . . . . . . . . . . . . . . . . . . . . . . . . . . . 9
ADC Offset Error . . . . . . . . . . . . . . . . . . . . . . . . . . . . . . . 9
Gain Error . . . . . . . . . . . . . . . . . . . . . . . . . . . . . . . . . . . . . 9
Gain Error Match . . . . . . . . . . . . . . . . . . . . . . . . . . . . . . . 9
POWER SUPPLY MONITOR . . . . . . . . . . . . . . . . . . . . . . . 9
ANALOG INPUTS . . . . . . . . . . . . . . . . . . . . . . . . . . . . . . . 9
ANALOG-TO-DIGITAL CONVERSION . . . . . . . . . . . . . 10
Antialias Filter . . . . . . . . . . . . . . . . . . . . . . . . . . . . . . . . . 10
CURRENT CHANNEL ADC . . . . . . . . . . . . . . . . . . . . . . 11
Current Channel ADC Gain Adjust . . . . . . . . . . . . . . . . . 11
Current Channel Sampling . . . . . . . . . . . . . . . . . . . . . . . 11
VOLTAGE CHANNEL ADC . . . . . . . . . . . . . . . . . . . . . . 12
ZERO-CROSSING DETECTION . . . . . . . . . . . . . . . . . . . 12
Zero-Crossing Timeout . . . . . . . . . . . . . . . . . . . . . . . . . . 13
PERIOD MEASUREMENT . . . . . . . . . . . . . . . . . . . . . . . 13
LINE VOLTAGE SAG DETECTION . . . . . . . . . . . . . . . . 13
PEAK DETECTION . . . . . . . . . . . . . . . . . . . . . . . . . . . . . 13
Peak Level Set . . . . . . . . . . . . . . . . . . . . . . . . . . . . . . . . . 14
TEMPERATURE MEASUREMENT . . . . . . . . . . . . . . . . 14
PHASE COMPENSATION . . . . . . . . . . . . . . . . . . . . . . . . 14
ROOT MEAN SQUARE MEASUREMENT . . . . . . . . . . . 15
Current RMS Calculation . . . . . . . . . . . . . . . . . . . . . . . . 15
Current RMS Gain Adjust . . . . . . . . . . . . . . . . . . . . . . 16
Current RMS Offset Compensation . . . . . . . . . . . . . . . 16
Voltage RMS Calculation . . . . . . . . . . . . . . . . . . . . . . . . . 16
Voltage RMS Gain Adjust . . . . . . . . . . . . . . . . . . . . . . 16
Voltage RMS Offset Compensation . . . . . . . . . . . . . . . 17
ACTIVE POWER CALCULATION . . . . . . . . . . . . . . . . . 17
Power Offset Calibration . . . . . . . . . . . . . . . . . . . . . . . . . 18
Reverse Power Information . . . . . . . . . . . . . . . . . . . . . . . 18
TOTAL ACTIVE POWER CALCULATION . . . . . . . . . . 18
ENERGY CALCULATION . . . . . . . . . . . . . . . . . . . . . . . . 19
Integration Times Under Steady Load . . . . . . . . . . . . . . . 20
Energy to Frequency Conversion . . . . . . . . . . . . . . . . . . . 20
No Load Threshold . . . . . . . . . . . . . . . . . . . . . . . . . . . . . 21
Mode Selection of the Sum of the Three Active Energies . 22
LINE ENERGY ACCUMULATION . . . . . . . . . . . . . . . . . 22
REACTIVE POWER CALCULATION . . . . . . . . . . . . . . . 23
TOTAL REACTIVE POWER CALCULATION . . . . . . . . 24
Reactive Energy Accumulation Selection . . . . . . . . . . . . . 24
APPARENT POWER CALCULATION . . . . . . . . . . . . . . 24
Apparent Power Offset Calibration . . . . . . . . . . . . . . . . . 25
TOTAL APPARENT POWER CALCULATION . . . . . . . 25
APPARENT ENERGY CALCULATION . . . . . . . . . . . . . 26
Integration Times under Steady Load . . . . . . . . . . . . . . . 26
LINE APPARENT ENERGY ACCUMULATION . . . . . . 26
ENERGIES SCALING . . . . . . . . . . . . . . . . . . . . . . . . . . . . 27
CHECK SUM REGISTER . . . . . . . . . . . . . . . . . . . . . . . . . 27
SERIAL INTERFACE . . . . . . . . . . . . . . . . . . . . . . . . . . . . 28
Serial Write Operation . . . . . . . . . . . . . . . . . . . . . . . . . . . 28
Serial Read Operation . . . . . . . . . . . . . . . . . . . . . . . . . . . 29
INTERRUPTS . . . . . . . . . . . . . . . . . . . . . . . . . . . . . . . . . . 30
Using Interrupts with an MCU . . . . . . . . . . . . . . . . . . . . 30
Interrupt Timing . . . . . . . . . . . . . . . . . . . . . . . . . . . . . . . 30
ACCESSING THE ADE7754 ON-CHIP REGISTERS . . 31
Communications Register . . . . . . . . . . . . . . . . . . . . . . . . 31
Operational Mode Register (0Ah) . . . . . . . . . . . . . . . . . . 35
Gain Register (18h) . . . . . . . . . . . . . . . . . . . . . . . . . . . . . 36
CFNUM Register (25h) . . . . . . . . . . . . . . . . . . . . . . . . . . 36
Measurement Mode Register (0Bh) . . . . . . . . . . . . . . . . . 37
Waveform Mode Register (0Ch) . . . . . . . . . . . . . . . . . . . 37
Watt Mode Register (0Dh) . . . . . . . . . . . . . . . . . . . . . . . 38
VA Mode Register (0Eh) . . . . . . . . . . . . . . . . . . . . . . . . . 38
Interrupt Enable Register(0Fh) . . . . . . . . . . . . . . . . . . . . 39
Interrupt Status Register (10h)/Reset Interrupt Status
Register (11h) . . . . . . . . . . . . . . . . . . . . . . . . . . . . . . . . . 40
OUTLINE DIMENSIONS . . . . . . . . . . . . . . . . . . . . . . . . . 41
REV. 0–2–
Page 3

(AVDD = DVDD = 5 V 5%, AGND = DGND = 0 V, On-Chip Reference, CLKIN = 10 MHz,
ADE7754–SPECIFICATIONS
T
to T
MIN
= –40C to +85C, unless otherwise noted.)
MAX
Parameters Spec Unit Test Conditions/Comments
ACCURACY
Active Power Measurement Error 0.1 % typ Over a dynamic range 1000 to 1
Phase Error between Channels
(PF = 0.8 Capacitive) ±0.05 º max Phase lead 37º
(PF = 0.5 Inductive) ±0.05 º max Phase lag 60º
AC Power Supply Rejection
Output Frequency Variation 0.01 % typ IAP/N = IBP/N = ICP/N = ±100 mV rms
DC Power Supply Rejection
1
1
Output Frequency Variation 0.01 % typ IAP/N = IBP/N = ICP/N = ±100 mV rms
Active Power Measurement Bandwidth 14 kHz typ
Measurement Error 0.5 % typ Over dynamic range of 20 to 1
V
rms
V
Measurement Bandwidth 260 Hz typ
rms
Measurement Error 2 % typ Over dynamic range of 100 to 1
I
rms
Measurement Bandwidth 14 kHz
I
rms
ANALOG INPUTS
Maximum Signal Levels ±500 mV peak max Differential input: V
, IBP–IBN, ICP–I
I
AP–IAN
AP–VN, VBP–VN, VCP–VN
CN
Input Impedance (DC) 370 kΩ min
Bandwidth (–3 dB) 14 kHz typ
ADC Offset Error
Gain Error
Gain Error Match
1
1
1
25 mV max Uncalibrated error; See Terminology for details.
±8% typ External 2.5 V reference
±3% typ External 2.5 V reference
REFERENCE INPUT
REF
Input Voltage Range 2.6 V max 2.4 V + 8%
IN/OUT
2.2 V min 2.4 V – 8%
Input Impedance 3.7 k max
Input Capacitance 10 pF max
TEMPERATURE SENSOR ±4ºCCalibrated dc offset
ON-CHIP REFERENCE
Reference Error ±200 mV max
Temperature Coefficient 30 ppm/ºC typ
CLKIN
Input Clock Frequency 10 MHz typ
LOGIC INPUTS
RESET, DIN, SCLK, CLKIN, and CS
Input High Voltage, V
Input Low Voltage, V
Input Current, I
Input Capacitance, C
INL
IN
IN
INH
2.4 V min DVDD = 5 V ± 5%
0.8 V max DVDD = 5 V ± 5%
±3 A max Typical 10 nA, VIN = 0 V to DV
10 pF max
LOGIC OUTPUTS
CF, IRQ, DOUT, and CLKOUT
Output High Voltage, V
Output Low Voltage, V
OL
OH
4V min DV
1V max DV
= 5 V ± 5%
DD
= 5 V ± 5%
DD
POWER SUPPLY For specified performance
AV
DD
4.75 V min 5 V – 5%
5.25 V max 5 V + 5%
DV
DD
4.75 V min 5 V – 5%
5.25 V max 5 V + 5%
AI
DD
DI
DD
NOTES
1
See Terminology section for explanation of specifications.
2
See plots in the Typical Performance Characteristics section.
Specifications subject to change without notice.
7 mA max At 5.25 V
18 mA max At 5.25 V
,
DD
REV. 0 –3–
Page 4
ADE7754
(AVDD = DVDD = 5 V 5%, AGND = DGND = 0 V, On-Chip Reference, CLKIN = 10 MHz XTAL,
TIMING CHARACTERISTICS
Parameter Spec Unit Test Conditions/Comments
Write Timing
t
1
t
2
t
3
t
4
t
5
t
6
t
7
t
8
Read Timing
3
t
9
t
10
4
t
11
5
t
12
5
t
13
NOTES
1
Sample tested during initial release and after any redesign or process change
that may affect this parameter. All input signals are specified with tr = tf = 5 ns
(10% to 90%) and timed from a voltage level of 1.6 V.
2
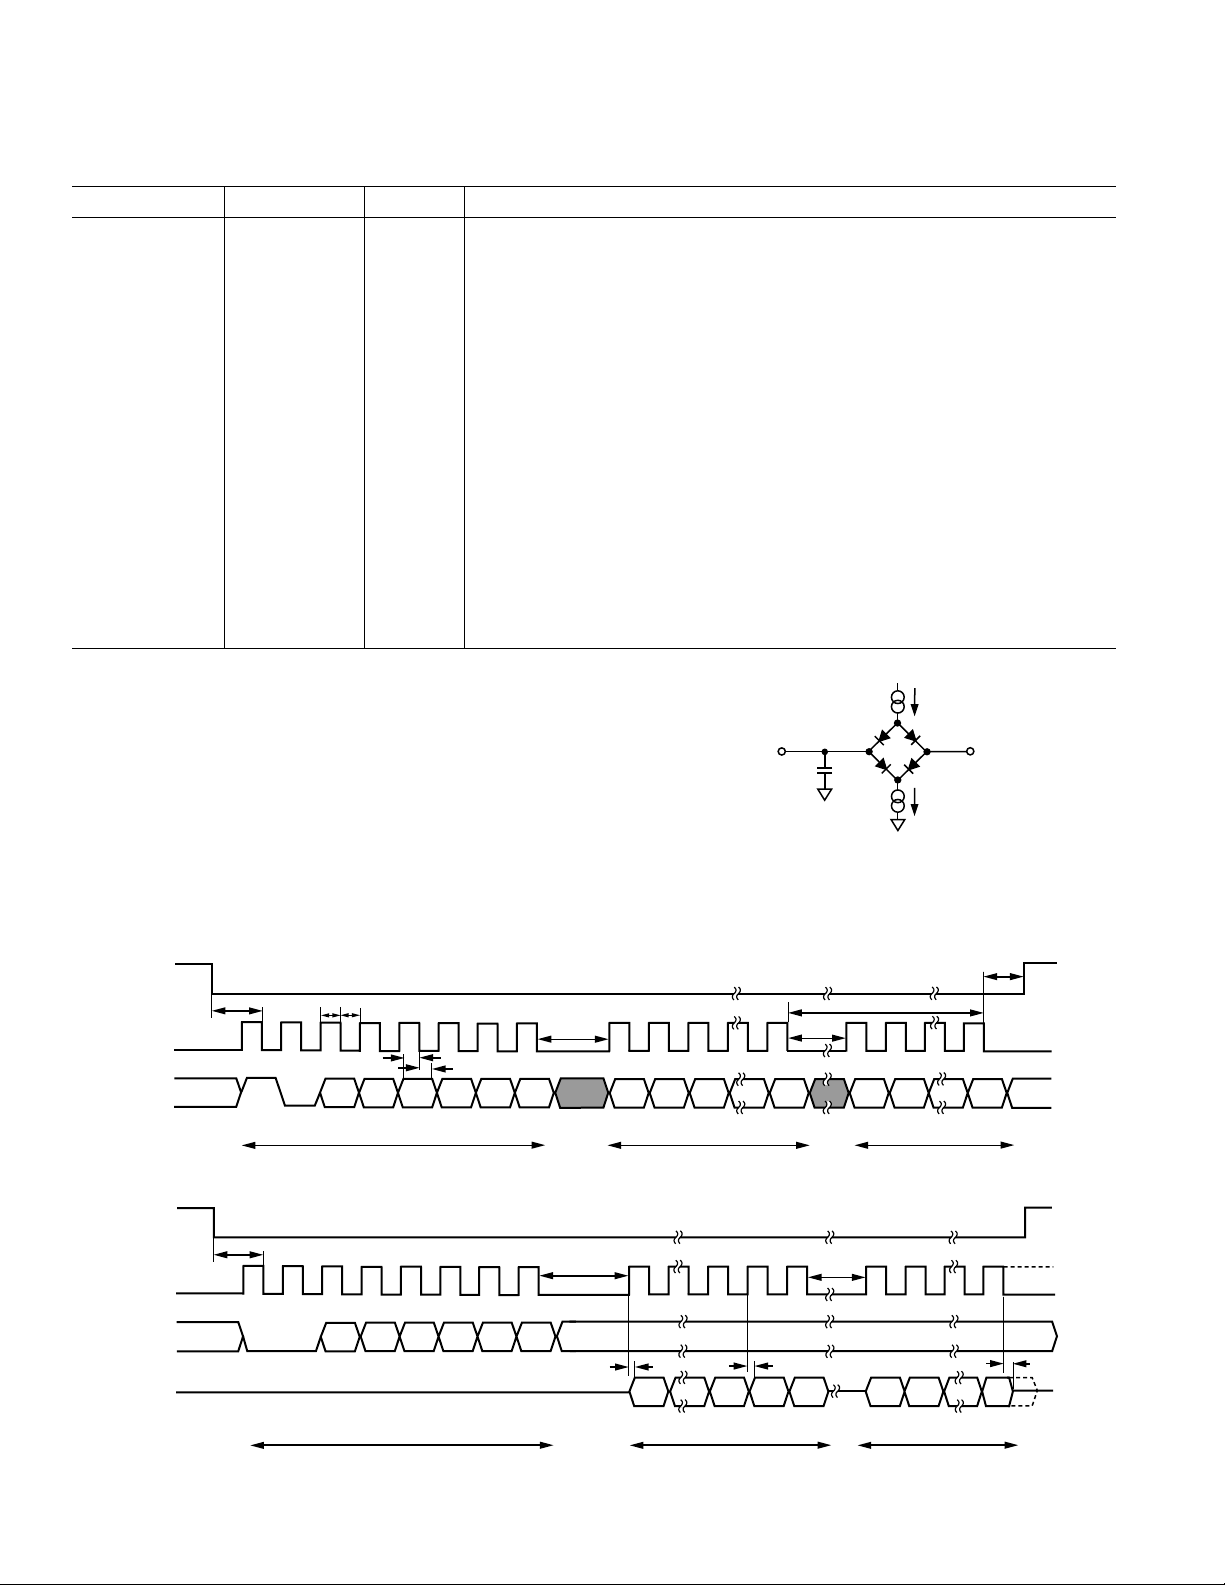
See timing diagrams below and Serial Interface section of this data sheet.
3
Minimum time between read command and data read for all registers except
wavmode register, which is t9 = 500 ns min.
4
Measured with the load circuit in Figure 1 and defined as the time required for
the output to cross 0.8 V or 2.4 V.
5
Derived from the measured time taken by the data outputs to change 0.5 V
when loaded with the circuit in Figure 1. The measured number is then
extrapolated back to remove the effects of charging or discharging the 50 pF
capacitor. The time quoted in the timing characteristics is the true bus relinquish time of the part and is independent of the bus loading.
50 ns (min) CS Falling Edge to First SCLK Falling Edge
50 ns (min) SCLK Logic High Pulsewidth
50 ns (min) SCLK Logic Low Pulsewidth
10 ns (min) Valid Data Setup Time before Falling Edge of SCLK
5 ns (min) Data Hold Time after SCLK Falling Edge
400 ns (min) Minimum Time between the End of Data Byte Transfers
50 ns (min) Minimum Time between Byte Transfers during a Serial Write
100 ns (min) CS Hold Time after SCLK Falling Edge
4 µs (min) Minimum Time between Read Command (i.e., a Write to Communication
50 ns (min) Minimum Time between Data Byte Transfers during a Multibyte Read
30 ns (min) Data Access Time after SCLK Rising Edge following a Write to the
100 ns (max) Bus Relinquish Time after Falling Edge of SCLK
10 ns (min)
100 ns (max) Bus Relinquish Time after Rising Edge of CS
10 ns (min)
1, 2
T
to T
MIN
= –40C to +85C, unless otherwise noted.)
MAX
Register) and Data Read
Communications Register
TO
OUTPUT
PIN
Figure 1. Load Circuit for Timing Specifications
50pF
I
200A
C
L
1.6mA
OL
2.1V
I
OH
CS
SCLK
DIN
CS
SCLK
DIN
DOUT
t
8
t
1
1
t
2
0
t
3
t
4
A5
A4
COMMAND BYTE
A3 A2
t
7
t
5
A1
A0
DB7
MOST SIGNIFICANT BYTE
t
7
DB0 DB7
t
6
DB0
LEAST SIGNIFICANT BYTE
Figure 2. Serial Write Timing
t
1
A4
A5
0
0
COMMAND BYTE
A2
A3
A1
t
9
A0
t
11
DB7
MOST SIGNIFICANT BYTE
t
10
t
t
12
DB0
DB7
LEAST SIGNIFICANT BYTE
13
DB0
Figure 3. Serial Read Timing
REV. 0–4–
Page 5
ADE7754
ABSOLUTE MAXIMUM RATINGS*
(TA = +25°C, unless otherwise noted.)
AVDD to AGND . . . . . . . . . . . . . . . . . . . . . . . –0.3 V to +7 V
to DGND . . . . . . . . . . . . . . . . . . . . . . . –0.3 V to +7 V
DV
DD
to AVDD . . . . . . . . . . . . . . . . . . . . . . . –0.3 V to +0.3 V
DV
DD
Analog Input Voltage to AGND
, IAN, IBP, IBN, ICP, ICN, VAP, VBP, VCP, VN . . –6 V to +6 V
I
AP
Reference Input Voltage to AGND . –0.3 V to AV
Digital Input Voltage to DGND . . . –0.3 V to DV
+ 0.3 V
DD
+ 0.3 V
DD
Digital Output Voltage to DGND . . –0.3 V to DVDD + 0.3 V
Operating Temperature Range
Industrial . . . . . . . . . . . . . . . . . . . . . . . . . . –40°C to +85°C
Storage Temperature Range . . . . . . . . . . . . –65°C to +150°C
Junction Temperature . . . . . . . . . . . . . . . . . . . . . . . . . . 150°C
24-Lead SOIC, Power Dissipation . . . . . . . . . . . . . . . 88 mW
Thermal Impedance . . . . . . . . . . . . . . . . . . . . . . . . 53°C/W
JA
Lead Temperature, Soldering
Vapor Phase (60 sec) . . . . . . . . . . . . . . . . . . . . . . . . . 215°C
Infrared (15 sec) . . . . . . . . . . . . . . . . . . . . . . . . . . . . 220°C
*Stresses above those listed under Absolute Maximum Ratings may cause perma-
nent damage to the device. This is a stress rating only; functional operation of the
device at these or any other conditions above those listed in the operational
sections of this specification is not implied. Exposure to absolute maximum rating
conditions for extended periods may affect device reliability.
ORDERING GUIDE
Model Package Description Package Option*
ADE7754AR 24-Lead SOIC RW-24
ADE7754ARRL 24-Lead SOIC RW-24 in Reel
EVAL-ADE7754EB ADE7754 Evaluation Board
*RW = Small Outline (Wide Body Package in Tubes)
CAUTION
ESD (electrostatic discharge) sensitive device. Electrostatic charges as high as 4000 V readily
accumulate on the human body and test equipment and can discharge without detection. Although the
ADE7754 features proprietary ESD protection circuitry, permanent damage may occur on devices
subjected to high energy electrostatic discharges. Therefore, proper ESD precautions are recommended
to avoid performance degradation or loss of functionality.
PIN CONFIGURATION
REF
CF
DGND
DV
AV
I
I
I
I
I
I
AGND
IN/OUT
DD
DD
AP
AN
BP
BN
CP
CN
1
2
3
4
5
ADE7754
6
TOP VIEW
(Not to Scale)
7
8
9
10
11
12
24
23
22
21
20
19
18
17
16
15
14
13
DOUT
SCLK
DIN
CS
CLKOUT
CLKIN
IRQ
RESET
V
AP
V
BP
V
CP
V
N
PIN FUNCTION DESCRIPTIONS
Pin No. Mnemonic Description
1CFCalibration Frequency Logic Output. This pin provides active power information. This output
is intended to be used for operational and calibration purposes. The full-scale output frequency
can be scaled by writing to the CFNUM and CFDEN registers. See the Energy to Frequency
Conversion section.
2 DGND This pin provides the ground reference for the digital circuitry in the ADE7754 (i.e. multiplier, filters,
and a digital-to-frequency converter). Because the digital return currents in the ADE7754 are small,
this pin can be connected to the analog ground plane of the whole system. However high bus
capacitance on the DOUT pin may result in noisy digital current, which could affect performance.
REV. 0
–5–
Page 6

ADE7754
PIN FUNCTION DESCRIPTIONS (continued)
Pin No. Mnemonic Description
3DV
DD
Digital Power Supply. The supply voltage should be maintained at 5 V ± 5% for specified operation.
This pin should be decoupled to DGND with a 10 µF capacitor in parallel with a ceramic
100 nF capacitor.
4AV
DD
Analog Power Supply. The supply should be maintained at 5 V ± 5% for specified operation. Every
effort should be made to minimize power supply ripple and noise at this pin through the use of
proper decoupling. The TPCs chart the power supply rejection performance. This pin should be to
decoupled AGND with a 10 µF capacitor in parallel with a ceramic 100 nF capacitor.
5, 6; I
, IAN;Analog Inputs for Current Channel. This channel is intended for use with the current transducer
AP
7, 8; IBP, IBN; is referenced in this document as the current channel. These inputs are fully differential voltage
9, 10 I
CP
, I
CN
inputs with maximum differential input signal levels of ±0.5 V, ± 0.25 V, and ±0.125 V, depending
on the gain selections of the internal PGA. See the Analog Inputs section.
All inputs have internal ESD protection circuitry. An overvoltage of ±6 V can be sustained on these
inputs without risk of permanent damage.
11 AGND Analog Ground Reference. Used for ADCs, temperature sensor, and reference. This pin should be
tied to the analog ground plane or the quiet
ground reference should be used for all analog
and voltage transducers. To keep ground noise
est ground reference in the system. This quiet
circuitry such as anti-aliasing filters and current
around the ADE7754 to a minimum, the quiet
ground plane should be connected only to the digital ground plane at one point. It is acceptable to
place the entire device on the analog ground plane.
12 REF
IN/OUT
This pin provides access to the on-chip voltage reference, which has a nominal value of 2.4 V ± 8%
and a typical temperature coefficient of 30 ppm/°C. An external reference source may also be connected
at this pin. In either case, this pin should be decoupled to AGND with a 1 µF ceramic capacitor.
13, 14; V
15, 16 VBP, V
, VCP;
N
AP
Analog Inputs for the Voltage Channel. This channel is intended for use with the voltage transducer
and is referenced as the voltage channel in this document. These inputs are single-ended voltage
inputs with maximum signal level of ±0.5 V with respect to VN for specified operation. These
inputs are voltage inputs with maximum differential input signal levels of ±0.5 V, ±0.25 V, and
±0.125 V, depending on the gain selections of the internal PGA. See the Analog Inputs section.
All inputs have internal ESD protection circuitry. An overvoltage of ±6 V can be sustained on these
inputs without risk of permanent damage.
17 RESET Reset. A logic low on this pin holds the ADCs and digital circuitry (including the serial interface) in
a reset condition.
18 IRQ Interrupt Request Output. This is an active low, open-drain logic output. Maskable interrupts
include active energy register at half level, apparent energy register at half level, and waveform
sampling at up to 26 kSPS. See the Interrupts section.
19 CLKIN Master Clock for ADCs and Digital Signal Processing. An external clock can be provided at this logic
input. Alternatively, a parallel resonant AT crystal can be connected across CLKIN and CLKOUT
to provide a clock source for the ADE7754. The clock frequency for specified operation is 10 MHz.
Ceramic load capacitors of 22 pF to 33 pF should be used with the gate oscillator circuit. Refer to
the crystal manufacturer’s data sheet for load capacitance requirements.
20 CLKOUT A crystal can be connected across this pin and CLKIN as described above to provide a clock source
for the ADE7754. The CLKOUT pin can drive one CMOS load when an external clock is supplied
at CLKIN, or a crystal is used.
21 CS Chip Select. Part of the 4-wire serial interface. This active low logic input allows the ADE7754
to share the serial bus with several other devices. See the Serial Interface section.
22 DIN Data Input for the Serial Interface. Data is shifted in at this pin on the falling edge of SCLK. See
the Serial Interface section.
23 SCLK Serial Clock Input for the Synchronous Serial Interface. All serial data transfers are synchronized to
this clock. See the Serial Interface section. The SCLK has a Schmidt-trigger input for use with a
clock source that has a slow edge transition time (e.g., opto-isolator outputs).
24 DOUT Data Output for the Serial Interface. Data is shifted out at this pin on the rising edge of SCLK.
This logic output is normally in a high impedance state unless it is driving data onto the serial
data bus. See the Serial Interface section.
REV. 0–6–
Page 7
Typical Performance Characteristics–ADE7754
0.50
WYE CONNECTION
GAIN = 1
0.40
PF = 1
INTERNAL REFERENCE
0.30
PHASE A
PHASE B
PHASE A + B + C
PHASE C
CURRENT (% fs)
0.20
0.10
0.00
–0.10
PERCENT ERROR
–0.20
–0.30
–0.40
–0.50
0.01 0.1 1 10 100
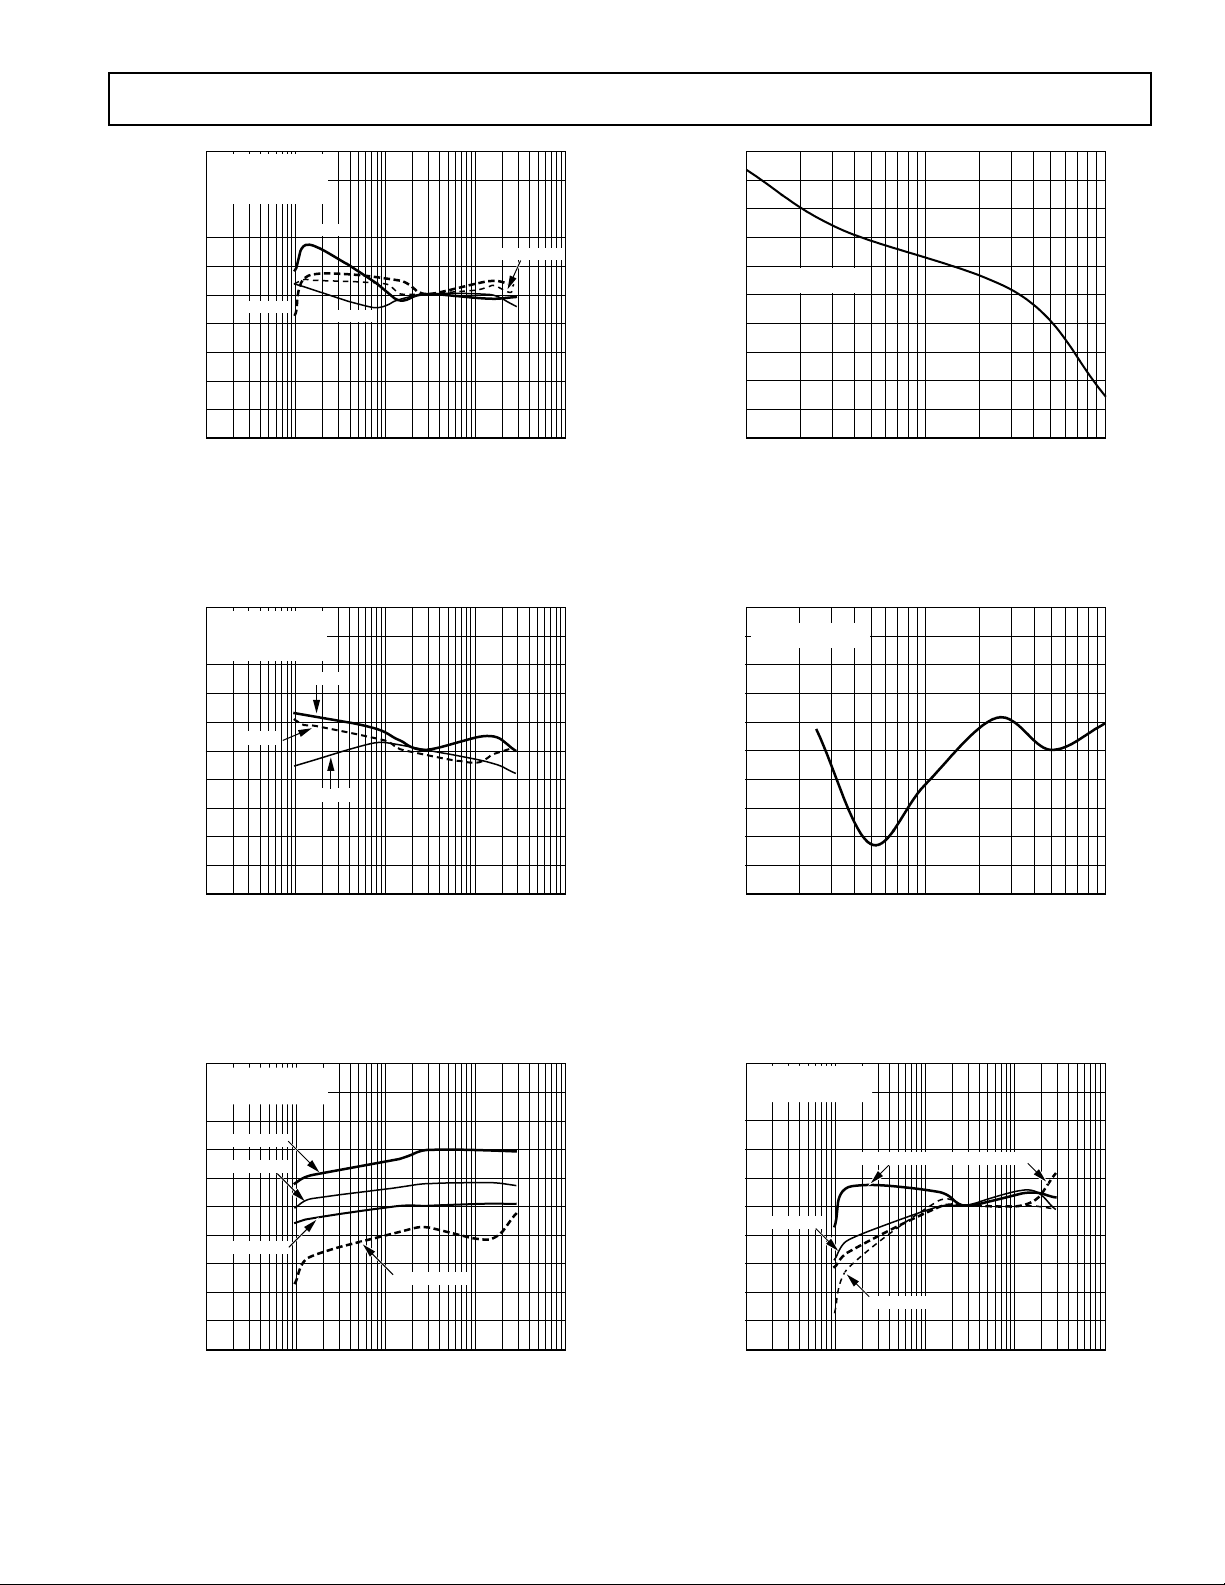
TPC 1. Real Power Error as a Percentage of
Reading with Gain = 1 and Internal Reference
(WYE Connection)
0.50
DELTA CONNECTION
GAIN = 1
0.40
PF = 0.5
INTERNAL REFERENCE
0.30
0.20
0.10
0.00
–0.10
PERCENT ERROR
–0.20
–0.30
–0.40
–0.50
0.01 0.1 1 10 100
PF = –0.5
PF = +1
PF = +0.5
CURRENT (% fs)
TPC 2. Real Power Error as a Percentage of
Reading over Power Factor with Internal
Reference (DELTA Connection)
1.00
0.80
0.60
0.40
0.20
GAIN = 1
INTERNAL REFERENCE
0.00
–0.20
PERCENT ERROR
–0.40
–0.60
–0.80
–1.00
110100
TPC 4.
Current RMS Error as a Percentage of
CURRENT INPUT (% fs)
Reading with Internal Reference (Gain = 1)
0.50
GAIN = 1
0.40
INTERNAL REFERENCE
0.30
0.20
0.10
0.00
–0.10
PERCENT ERROR
–0.20
–0.30
–0.40
–0.50
110100
VOLTAGE INPUT (% fs)
TPC 5. Voltage RMS Error as a Percentage of
Reading with Internal Reference (Gain = 1)
1.00
GAIN = 1
PF = 0.5
0.80
INTERNAL REFERENCE
0.60
+85∞C PF = +0.5
0.40
+25∞C PF = –0.5
0.20
0.00
–0.20
+25∞C PF = +1.0
PERCENT ERROR
–0.40
–0.60
–0.80
–1.00
0.01 0.1 1 10 100
TPC 3. Real Power Error as a
–40∞C PF = +0.5
CURRENT (% fs)
Percentage
over Power Factor with Internal Reference (Gain = 1)
REV. 0
of Reading
–7–
0.50
GAIN = 1
PF = 0.5
0.40
EXTERNAL REFERENCE
0.30
0.20
0.10
0.00
+25∞C PF = –0.5
–0.10
PERCENT ERROR
–0.20
–0.30
–0.40
–0.50
0.01 0.1 1 10 100
–40∞C PF = +0.5
VOLTAGE INPUT (% fs)
+85∞C PF = +0.5+25∞C PF = +1
TPC 6. Real Power Error as a Percentage of Reading
over Power Factor with External Reference (Gain = 1)
Page 8
ADE7754
1.00
0.80
0.60
0.40
0.20
0.00
–0.20
PERCENT ERROR
–0.40
–0.60
–0.80
–1.00
45 50 55 60 65
GAIN = 1
INTERNAL REFERENCE
PF = 1
PF = 0.5
FREQUENCY (Hz)
220V
1M
1k
I
33nF
10F
33nF
RB
33nF
SAME AS
IAP, I
AN
SAME AS
IAP, I
AN
SAME AS V
SAME AS V
1k
1k
100nF
I
I
I
I
I
9
10
I
16
V
15
V
AP
V
14
AP
1k
33nF
V
DD
AVDD DVDD RESET
AP
ADE7754
AN
BP
BN
CP
CN
AP
BP
CP
VN AGND DGND
13
REF
17
CLKOUT
CLKIN
IN/OUT
DOUT
SCLK
CF
CS
DIN
IRQ
825
1
20
10MHz
19
21
22
18
12
PS2501-1
22pF
22pF
TO SPI BUS
ONLY USED FOR
CALIBRATION
100nF 10F
TO FREQ.
COUNTER
TPC 7. Real Power Error as a Percentage of Reading over Input Frequency with Internal Reference
0.20
GAIN = 1
PF = 1
0.16
EXTERNAL REFERENCE
0.12
0.08
0.04
4.75V
0.00
–0.04
PERCENT ERROR
–0.08
–0.12
5.25V
5V
–0.16
–0.20
0.01 0.1 1 10 100
CURRENT INPUT (% fs)
TPC 8. Real Power Error as a Percentage of Reading over Power Supply with External Reference
(Gain = 1)
0.20
GAIN = 1
PF = 1
INTERNAL REFERENCE
0.15
TPC 10. Test Circuit for Performance Curves
24
N = 116
MEAN = 4.33955
21
SD = 3.13475
LIMITS: LOW = –19, HIGH = +19
MIN = –2.21937
18
MAX = +14.7485
RANGE = 16.9669
15
12
9
PERCENT ERROR
6
3
0
–20
–15 –10 –5 0 5 10 15 20
CH_I PhA OFFSET (mV)
TPC 11. Current Channel Offset Distribution (Gain = 1)
0.10
0.05
0.00
–0.05
PERCENT ERROR
–0.10
4.75V
5.25V
5V
–0.15
–0.20
0.01 0.1 1
10 100
CURRENT INPUT (% fs)
TPC 9. Real Power Error as a Percentage of Reading
over Power Supply with Internal Reference (Gain = 1)
REV. 0–8–
Page 9
ADE7754
TERMINOLOGY
Measurement Error
The error associated with the energy measurement made by the
ADE7754 is defined by the formula
Percentage Error
Energy gistered by ADE True Energy
=
Re 7754
True Energy
−
×
100%
Phase Error Between Channels
The HPF (high-pass filter) in the current channel has a phase
lead response. To offset this phase response and equalize the
phase response between channels, a phase correction network is
placed in the current channel. The phase correction network
ensures a phase match between the current channels and voltage
channels to within ±0.1° over a range of 45 Hz to 65 Hz and
±0.2° over a range of 40 Hz to 1 kHz. This phase mismatch
between the voltage and the current channels can be reduced
further with the phase calibration register in each phase.
Power Supply Rejection
This quantifies the ADE7754 measurement error as a percentage
of reading when power supplies are varied. For the ac PSR measurement, a reading at nominal supplies (5 V) is taken. A second
reading is obtained using the same input signal levels when an ac
(175 mV rms/100 Hz) signal is introduced onto the supplies. Any
error introduced by this ac signal is expressed as a percentage of
reading. See the Measurement Error definition above.
For the dc PSR measurement, a reading at nominal supplies
(5 V) is taken. A second reading is obtained using the same
input signal levels when the power supplies are varied ±5%. Any
error introduced is again expressed as a percentage of reading.
ADC Offset Error
This refers to the dc offset associated with the analog inputs to
the ADCs. It means that with the analog inputs connected to
AGND, the ADCs still see a dc analog input signal. The magnitude of the offset depends on the gain and input range selection
(see the TPCs). However, when HPFs are switched on, the
offset is removed from the current channels and the power
calculation is unaffected by this offset.
Gain Error
The gain error in the ADE7754 ADCs is defined as the difference between the measured ADC output code (minus the
offset) and the ideal output code. See the Current Channel
ADC and the Voltage Channel ADC sections. The difference is
expressed as a percentage of the ideal code.
Gain Error Match
Gain error match is defined as the gain error (minus the offset)
obtained when switching between a gain of 1, 2, or 4. It is
expressed as a percentage of the output ADC code obtained
under a gain of 1.
POWER SUPPLY MONITOR
The ADE7754 contains an on-chip power supply monitor. The
analog supply (AVDD) is continuously monitored by the ADE7754.
If the supply is less than 4 V ± 5%, the ADE7754 goes into an
inactive state (i.e., no energy is accumulated when the supply
voltage is below 4 V). This is useful to ensure correct device
operation at power-up and during power-down. The power supply monitor has built-in hysteresis and filtering, providing a high
degree of immunity to false triggering due to noisy supplies.
AV
DD
5V
4V
POWER-ON
RESET FLAG IN
THE INTERRUPT
STATUS REGISTER
READ RSTATUS
REGISTER
0V
INACTIVE
TIME
ACTIVE
INACTIVE
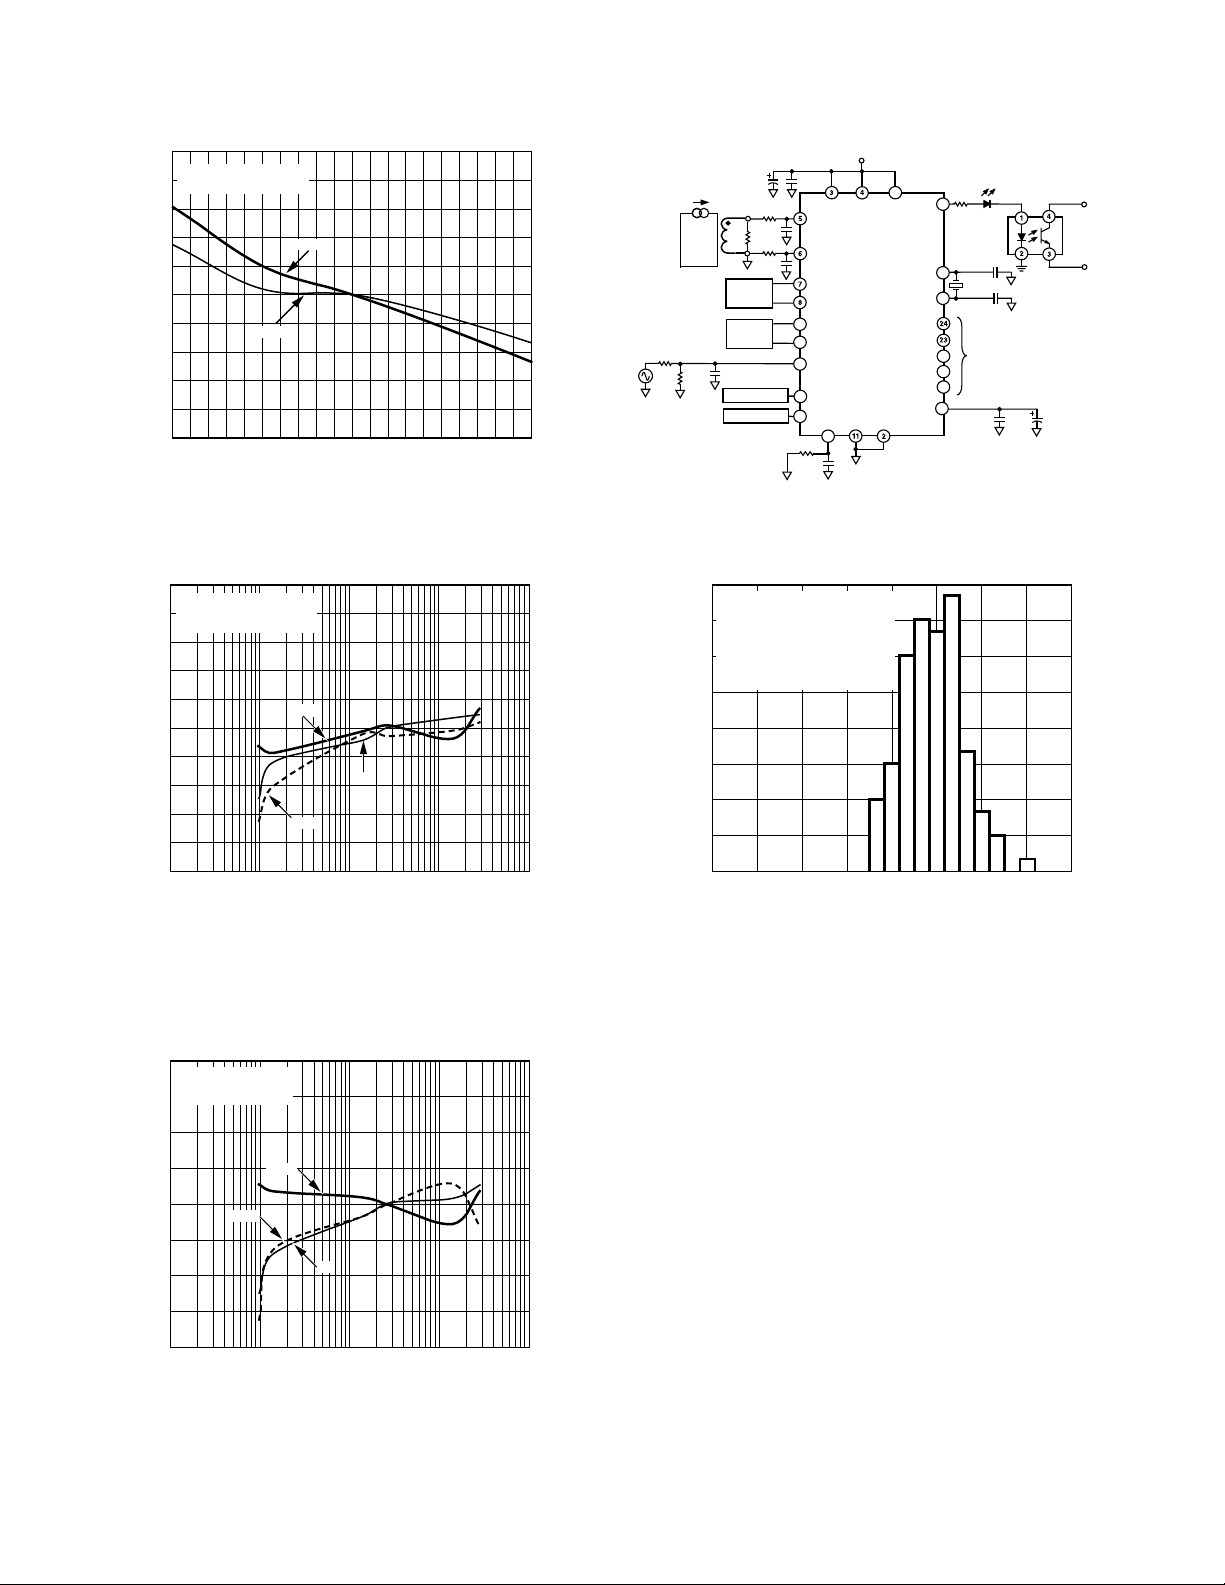
Figure 4. On-Chip Power Supply Monitoring
The RESET bit in the interrupt status register is set to Logic 1
when AV
drops below 4 V ± 5%. The RESET flag is always
DD
masked by the interrupt enable register and cannot cause the
IRQ pin to go low. The power supply and decoupling for the
part should ensure that the ripple at AV
does not exceed 5 V
DD
± 5% as specified for normal operation.
ANALOG INPUTS
The ADE7754 has six analog inputs, divisible into two channels: current and voltage. The current channel consists of three
pairs of fully differential voltage inputs: I
, ICN. The fully differential voltage input pairs have a maxi-
I
CP
, IAN; IBP, IBN; and
AP
mum differential voltage of ±0.5 V. The voltage channel has
three single-ended voltage inputs: V
, VBP, and VCP. These
AP
single-ended voltage inputs have a maximum input voltage of
±0.5 V with respect to V
. Both the current channel and the
N
voltage channel have a PGA (programmable gain amplifier) with
possible gain selections of 1, 2, or 4. The same gain is applied to
all the inputs of each channel.
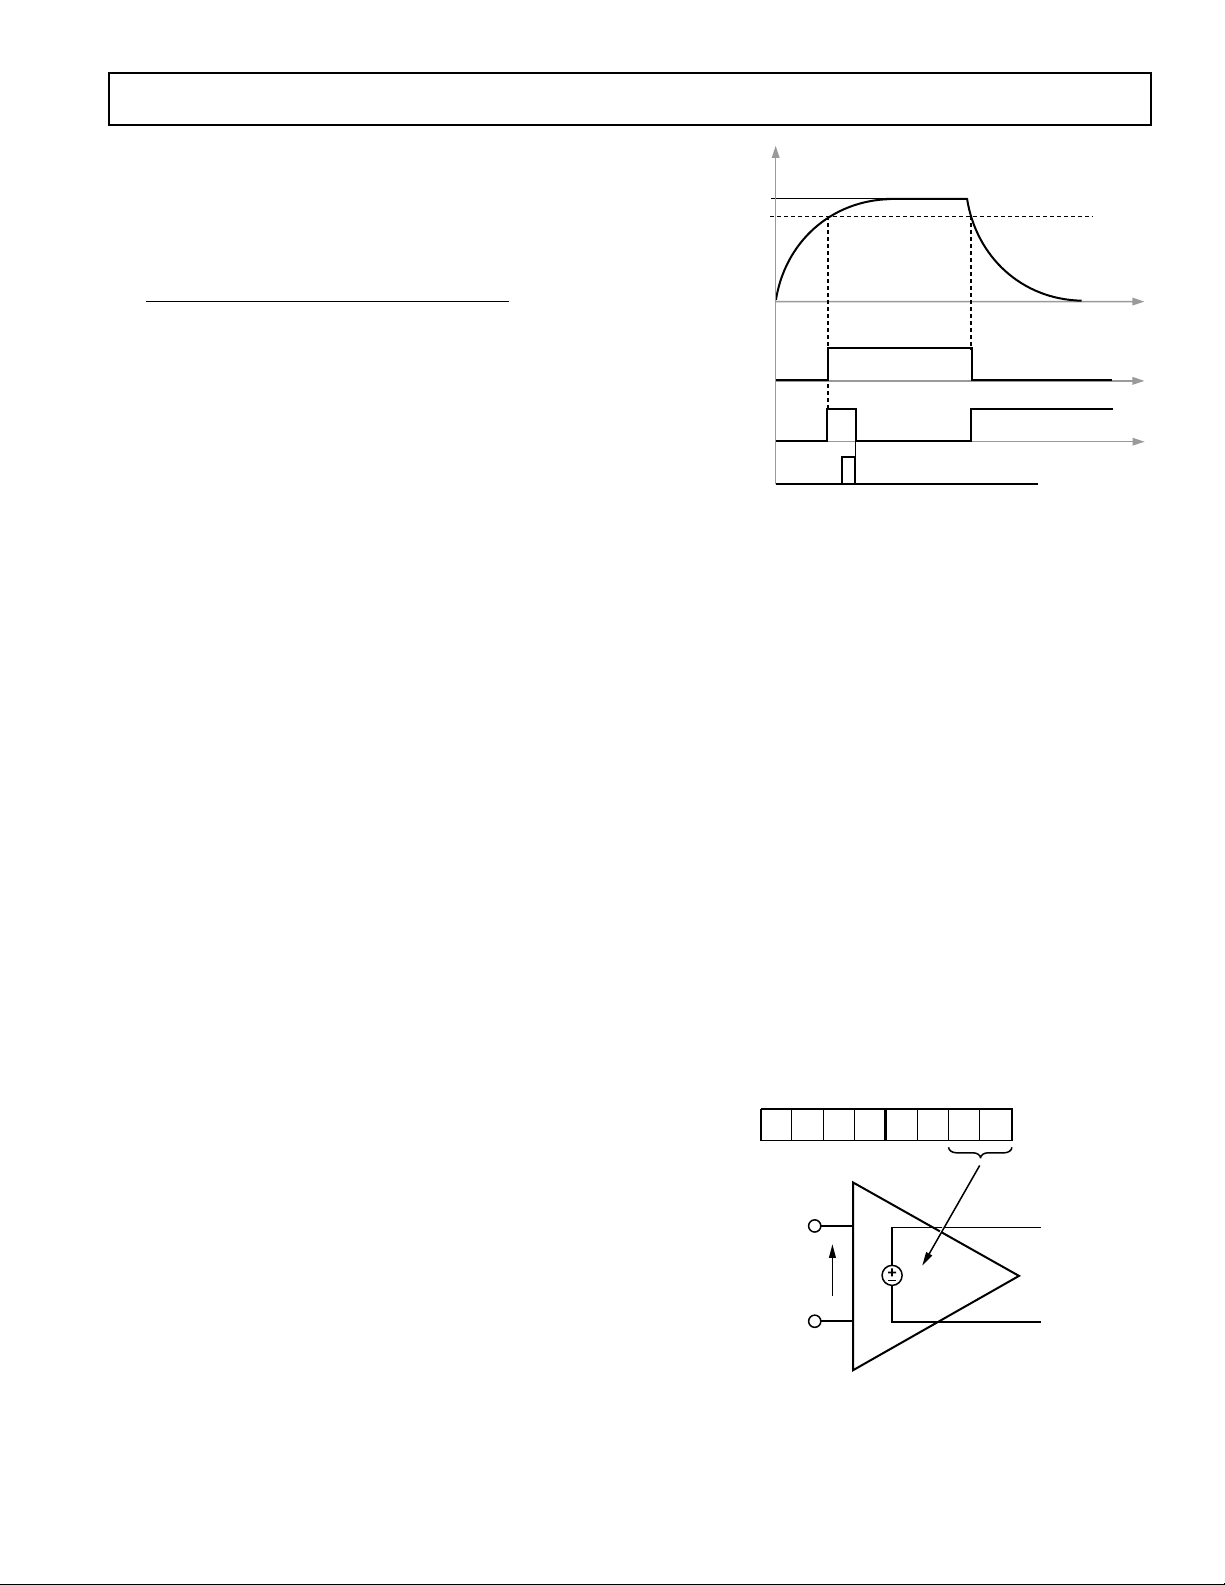
The gain selections are made by writing to the gain register. Bits 0
and 1 select the gain for the PGA in the fully differential current
channel. The gain selection for the PGA in the single-ended voltage channel is made via Bits 5 and 6. Figure 5 shows how a gain
selection for the current channel is made using the gain register.
GAIN[7:0]
GAIN (k)
IAP, IBP, I
IAN, IBN, I
CP
V
IN
CN
k V
SELECTION
IN
Figure 5. PGA in Current Channel
REV. 0
–9–
Page 10
ADE7754
Figure 6 shows how the gain settings in PGA 1 (current channel)
and PGA 2 (voltage channel) are selected by various bits in the
gain register. The no-load threshold and sum of the absolute
value can also be selected in the gain register. See Table X.
CURRENT AND VOLTAGE CHANNEL PGA CONTROL
7
0
RESERVED = 0
PGA 2 GAIN SELECT
00 = 1
01 = 2
10 = 4
*REGISTER CONTENTS SHOW POWER-ON DEFAULTS
GAIN REGISTER*
6
5
0
0
RESERVED = 0
4
0
2
3
0
0
ABS
NO LOAD
0
1
0
0
ADDR: 18h
PGA 1 GAIN SELECT
00 = 1
01 = 2
10 = 4
Figure 6. Analog Gain Register
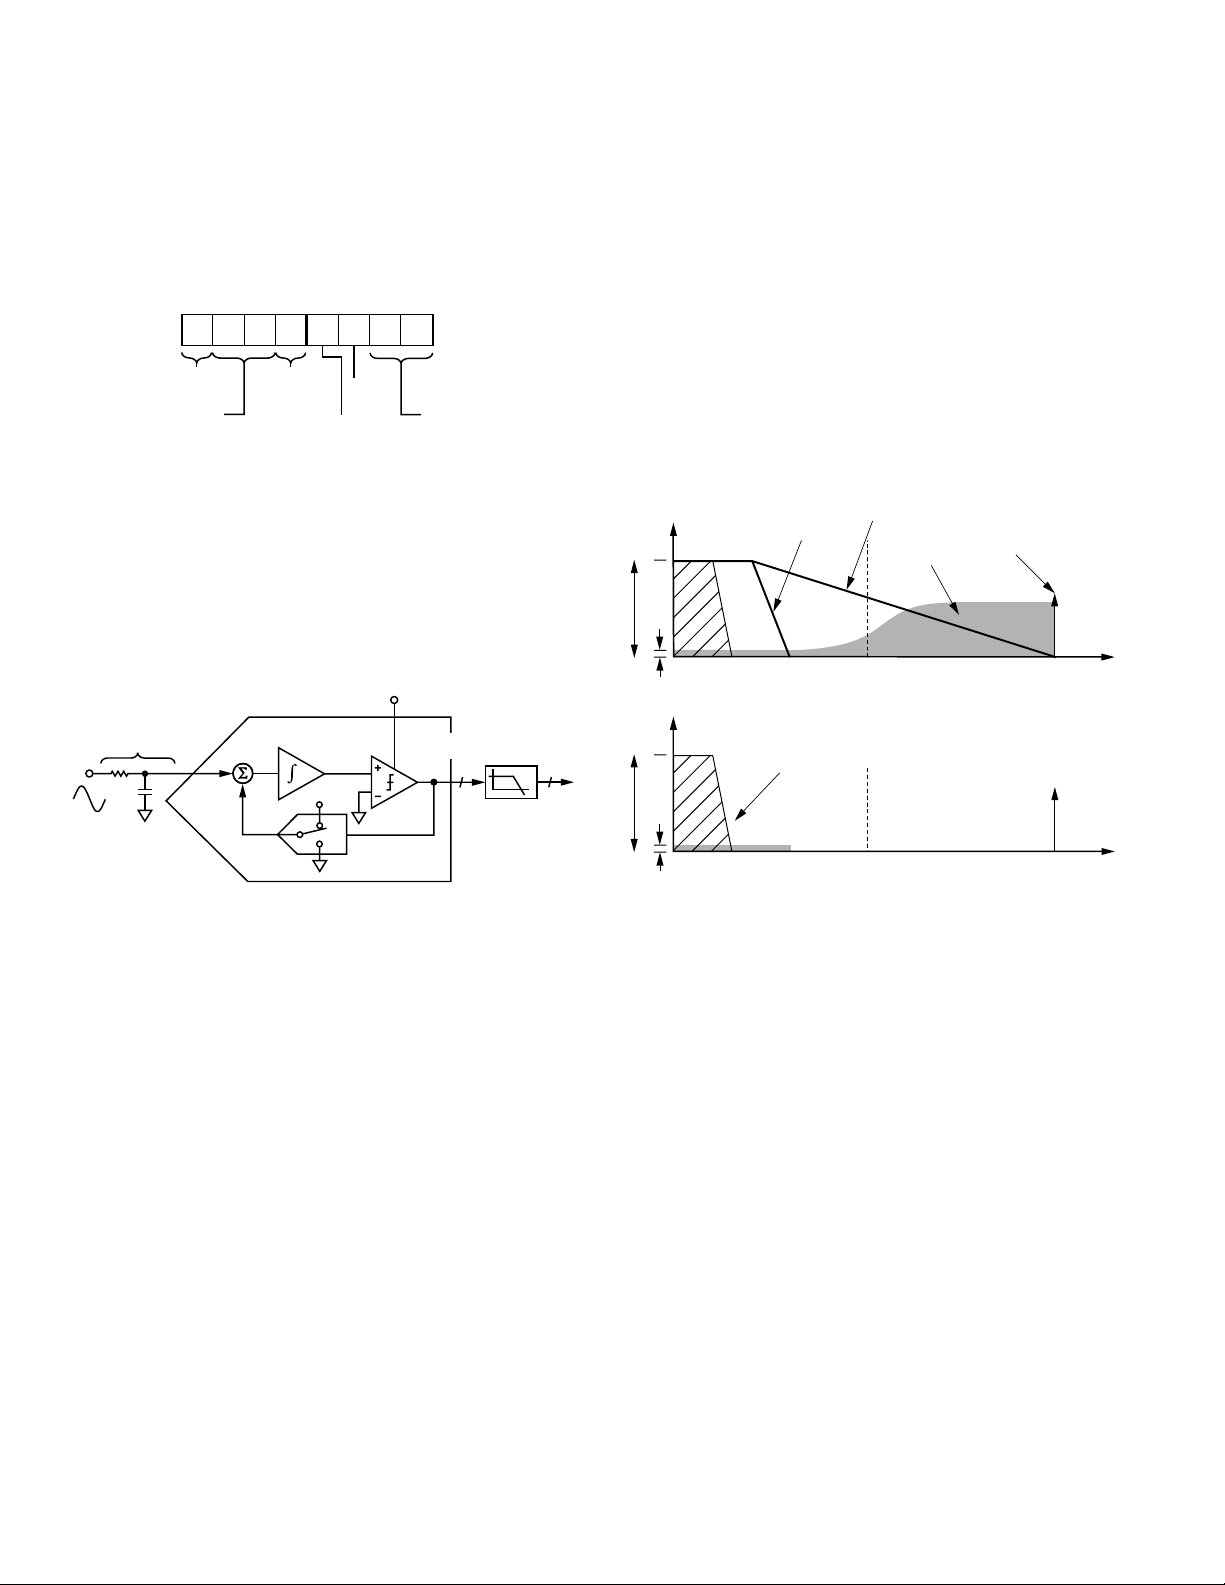
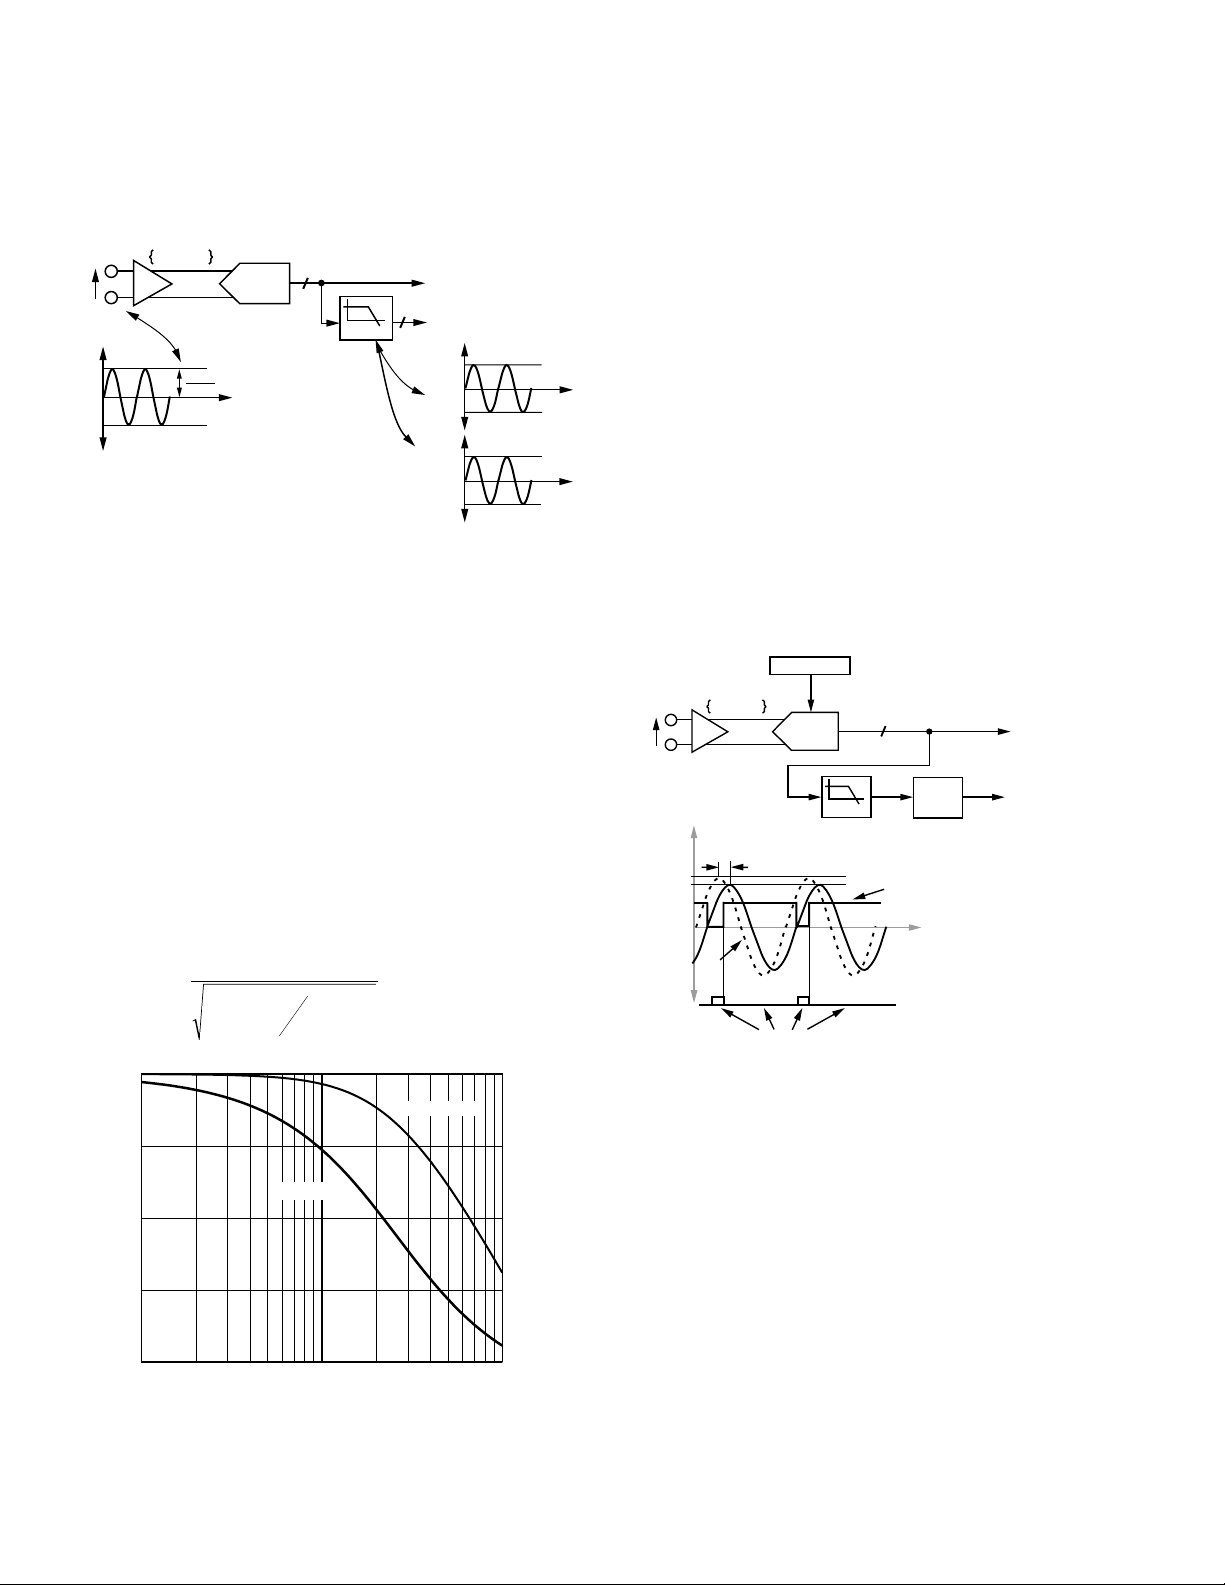
ANALOG-TO-DIGITAL CONVERSION
The ADE7754 carries out analog-to-digital conversion using
second order Σ-∆ ADCs. The block diagram in Figure 7 shows a
first order (for simplicity) Σ-∆ ADC. The converter is made up of
two parts, the Σ-∆ modulator and the digital low-pass filter.
MCLK/12
ANALOG
LOW-PASS FILTER
R
C
+
INTEGRATOR
–
V
REF
1-BIT DAC
LATCHED
COMPARATOR
....10100101......
1
DIGITAL
LOW-PASS
FILTER
24
Figure 7. First Order (-) ADC
A Σ-∆ modulator converts the input signal into a continuous
serial stream of 1s and 0s at a rate determined by the sampling
clock. In the ADE7754, the sampling clock is equal to CLKIN/12.
The 1-bit DAC in the feedback loop is driven by the serial data
stream. The DAC output is subtracted from the input signal.
If the loop gain is high enough, the average value of the DAC
output (and therefore the bit stream) will approach that of the
input signal level. For any given input value in a single sam
interval, the data from the 1-bit ADC is virtually meaningless.
pling
Only
when a large number of samples are averaged will a meaningful
result be obtained. This averaging is carried out in the second part
of the ADC, the digital low-pass filter. Averaging a large number of
bits from the modulator, the low-pass filter can produce 24-bit
data-words that are proportional to the input signal level.
The Σ-∆ converter uses two techniques to achieve high resolution from what is essentially a 1-bit conversion technique. The
first is oversampling; the signal is sampled at a rate (frequency)
many times higher than the bandwidth of interest. For
the sampling rate in the ADE7754 is CLKIN/12
example,
(833 kHz),
and the band of interest is 40 Hz to 2 kHz. Oversampling
spreads the quantization noise (noise due to sampling) over a
wider bandwidth. With the noise spread more thinly over a
wider bandwidth, the quantization noise in the band of interest
is lowered. See Figure 8.
Oversampling alone is not an efficient enough method to
improve
the signal to noise ratio (SNR) in the band of interest.
For example, an oversampling ratio of 4 is required to increase
the SNR by only 6 dB (1 bit). To keep the oversampling ratio at
a reasonable level, the quantization noise can be shaped so that
most of the noise lies at the higher frequencies. In the Σ-∆
modulator, the noise is shaped by the integrator, which has a
high-pass type of response for the quantization noise. The result
is that most of the noise is at the higher frequencies, where it
can be removed by the digital low-pass filter. This noise shaping
is shown in Figure 8.
ANTIALIAS FILTER (RC)
SIGNAL
NOISE
SIGNAL
NOISE
DIGITAL FILTER
0
2
FREQUENCY (kHz)
HIGH RESOLUTION
OUTPUT FROM DIGITAL
LPF
0
2
FREQUENCY (kHz)
417
417
SHAPED
NOISE
SAMPLING
FREQUENCY
833
833
Figure 8. Noise Reduction Due to Oversampling
and Noise Shaping in the Analog Modulator
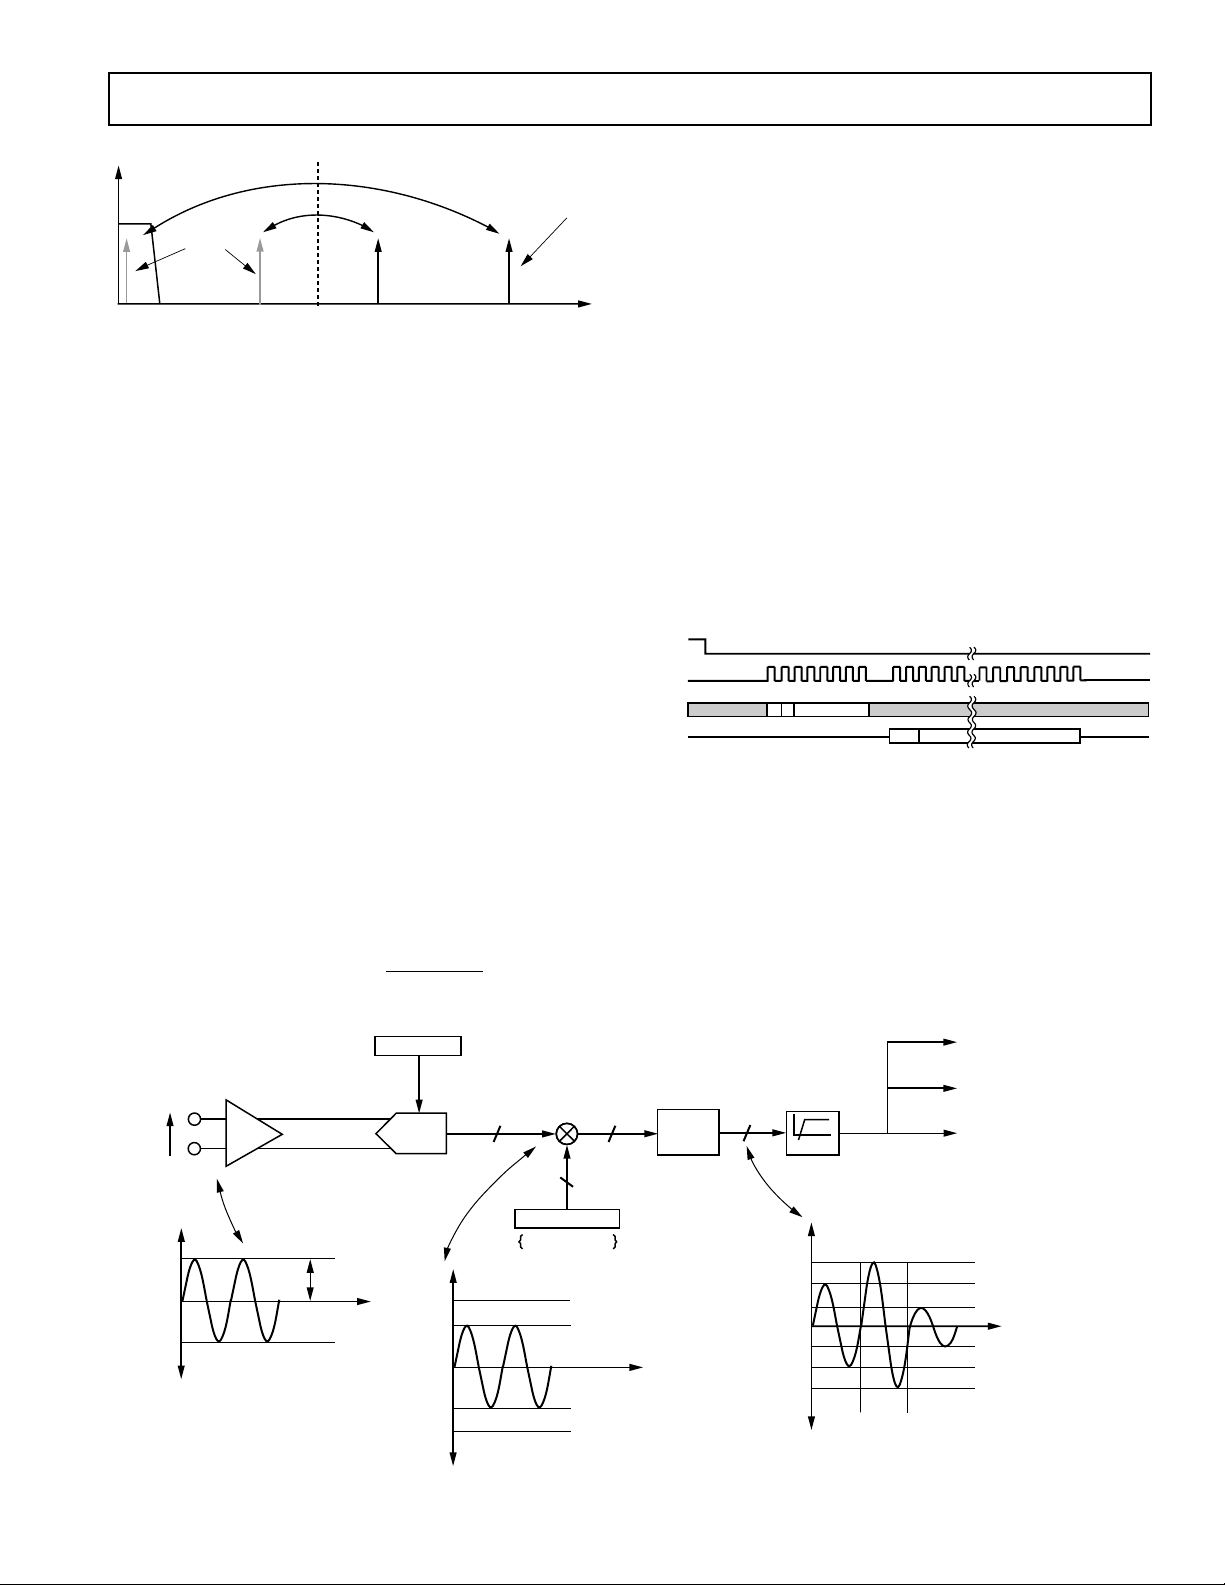
Antialias Filter
Figure 7 shows an analog low-pass filter (RC) on the input to
the modulator. This filter is used to prevent aliasing, an artifact
of all sampled systems. Frequency components in the input
signal to the ADC that are higher than half the sampling rate of
the ADC appear in the sampled signal at a frequency below half
the sampling rate. Figure 9 illustrates the effect; frequency components (arrows shown in black) above half the sampling
frequency (also known as the Nyquist frequency), i.e., 417 kHz,
get imaged or folded back down below 417 kHz (arrows shown
in gray). This happens with all ADCs, regardless of the architecture. In the example shown, only frequencies near the sampling
frequency, i.e., 833 kHz, will move into the band of interest for
metering, i.e., 40 Hz to 2 kHz. This allows use of a very simple
LPF (low-pass filter) to attenuate these high frequencies (near
900 kHz) and thus prevent distortion in the band of interest. A
simple RC filter (single pole) with a corner frequency of 10 kHz
produces an attenuation of approximately 40 dBs at 833 kHz.
See Figure 9. This is sufficient to eliminate the effects of aliasing.
REV. 0–10–
Page 11
ADE7754
ALIASING EFFECTS
SAMPLING
FREQUENCY
833
0
IMAGE
FREQUENCIES
2
417
FREQUENCY (kHz)
Figure 9. ADC and Signal Processing in Current
Channel or Voltage Channel
CURRENT CHANNEL ADC
Figure 10 shows the ADC and signal processing chain for the
input IA of the current channels (which are the same for IB and
IC). In waveform sampling mode, the ADC outputs are signed
twos complement 24-bit data-word at a maximum of 26 kSPS
(kilo samples per second). The output of the ADC can be
scaled by ±50% by using the APGAINs register. While the
ADC outputs are 24-bit twos complement value, the maximum
full-scale positive value from the ADC is limited to 400000h
(+4,194,304d). The maximum full-scale negative value is limited to C00000h (–4,194,304d). If the analog inputs are
overranged, the ADC output code clamps at these values. With
the specified full-scale analog input signal of ±0.5 V, the ADC
produces an output code between D70A3Eh (–2,684,354) and
28F5C2h (+2,684,354), as illustrated in Figure 10, which also
shows a full-scale voltage signal being applied to the differential
inputs I
and IAN.
AP
Current Channel ADC Gain Adjust
The ADC gain in each phase of the current channel can be
adjusted using the multiplier and active power gain register
(AAPGAIN[11:0], BAPGAIN, and CAPGAIN). The gain of the
ADC is adjusted by writing a twos complement 12-bit word to
the active power gain register. The following expression shows
how the gain adjustment is related to the contents of that register:
For example, when 7FFh is written to the active power gain
register, the ADC output is scaled up by 50%: 7FFh = 2047d,
2047/212 = 0.5. Similarly, 800h = –2047d (signed twos complement) and ADC output is scaled by –50%. These two examples
are illustrated in Figure 10.
Current Channel Sampling
The waveform samples of the current channel inputs may also
be routed to the waveform register (wavmode register to select
the speed and the phase) to be read by the system master
(MCU). The active energy and apparent energy calculation remains
uninterrupted during waveform sampling.
When in waveform sample mode, one of four output sample
rates may be chosen using Bits 3 and 4 of the WAVMODE
register (DTRT[1:0] mnemonic). The output sample rate
may be 26.0 kSPS, 13.0 kSPS, 6.5 kSPS, or 3.3 kSPS. See the
Waveform Mode Register section. By setting the WSMP bit in
the interrupt enable register to Logic 1, the interrupt request
IRQ
output
will go active low when a sample is available. The
timing is shown in Figure 11. The 24-bit waveform samples are
transferred from the ADE7754 one byte (eight bits) at a time,
with the most significant byte shifted out first.
IRQ
SCLK
DIN
DOUT
READ FROM WAVEFORM
0
0
09h
CURRENT CHANNEL DATA – 24 BITS
SGN
Figure 11. Waveform Sampling Current Channel
The interrupt request output IRQ stays low until the interrupt
routine reads the reset status register. See the Interrupt section.
Note that if the WSMP bit in the interrupt enable register is not
set to Logic 1, no data is available in the waveform register.
V
IN
REV. 0
0V
V
IN
I
AP
I
AN
ANALOG
INPUT
RANGE
Code ADC
=×+
ⴛ1, ⴛ2, ⴛ4
GAIN[1:0]
PGA1
100% FS
0.5V/GAIN1
1
AAPGAIN
12
2
REFERENCE
ADC
400000h
28F5C2h
000000h
D70A3Eh
C00000h
MULTIPLIER
1
800h–7FFh
AAPGAIN[11:0]
ADC OUTPUT
WORD RANGE
12
1
+100% FS
–100% FS
DIGITAL LPF
3
SINC
24
3D70A3h
28F5C2h
147AE1h
00000h
EB851Fh
D70A3Eh
C28F5Dh
Figure 10. ADC and Signal Processing in Current Channel
–11–
HPF
CHANNEL 1
000h
7FFh
CURRENT RMS
CALCULATION
WAVEFORM SAMPLE
REGISTER
ACTIVE AND REACTIVE
POWER CALCULATION
+ 150% FS
+ 100% FS
+ 50% FS
– 50% FS
– 100% FS
800h
– 150% FS
AAPGAIN[11:0]
Page 12
ADE7754
VOLTAGE CHANNEL ADC
Figure 12 shows the ADC and signal processing chain for the
input VA in voltage channel (which is the same for VB and VC).
1, 2, 4
V
GAIN[6:5]
AP
VA
V
VA
0V
ANALOG
INPUT RANGE
ADC
N
0.5V
GAIN
60Hz
1
–100% TO +100% FS
LPF1
LPF OUTPUT
WORD RANGE
TO ACTIVE AND
REACTIVE ENERGY
CALCULATION
16
TO VOLTAGE RMS AND
WAVEFORM SAMPLING
27E9h
D817h
2838h
D7C8h
60Hz
50Hz
Figure 12. ADC and Signal Processing in Voltage Channel
For energy measurements, the output of the ADC (one bit) is
passed directly to the multiplier and is not filtered. This solution
avoids a wide-bits multiplier and does not affect the accuracy of
the measurement. An HPF is not required to remove any dc
offset since it is only required to remove the offset from one
channel to eliminate errors in the power calculation.
In the voltage channel, the samples may also be routed to the
WFORM register (WAVMODE to select VA, VB, or VC and
sampling frequency). However, before being passed to the waveform register, the ADC output is passed through a single-pole,
low-pass filter with a cutoff frequency of 260 Hz. The plots in
Figure 13 show the magnitude and phase response of this filter.
The filter output code of any inputs of the voltage channel
swings between D70Bh (–10,485d) and 28F5h (+10,485d) for
full-scale sine wave inputs. This has the effect of attenuating the
signal. For example, if the line frequency is 60 Hz, the signal at
the output of LPF1 will be attenuated by 3%.
|()| . –.Hf
0
–20
–40
PHASE (Degrees)
–60
–80
1
10
1
60
Hz
+
1
260
Hz
(60Hz; –13)
2
10
FREQUENCY (Hz)
0 974 0 2
==
2
(60Hz; –0.2dB)
dBs=
0
–10
–20
GAIN (dB)
–30
–40
3
10
Figure 13. Magnitude and Phase Response of LPF1
Note that LPF1 does not affect the power calculation because it
is used only in the waveform sample mode and rms calculation.
In waveform sample mode, one of four output sample rates
can be chosen by using Bits 3 and 4 of the WAVMODE register. The available output sample rates are 26 kSPS, 13.5 kSPS,
6.5 kSPS, or 3.3 kSPS. The interrupt request output IRQ
signals a new sample availability by going active low. The
voltage waveform register is a twos complement 16-bit register.
Because the waveform register is a 24-bit signed register, the
waveform data from the voltage input is located in the 16 LSB of
the waveform register. The sign of the 16-bit voltage input value
is not extended to the upper byte of the waveform register. The
upper byte is instead filled with zeros. 24-bit waveform samples
are transferred from the ADE7754 one byte (eight bits) at a time,
with the most significant byte shifted out first. The timing is the
same as that for the current channels and is shown in Figure 11.
ZERO-CROSSING DETECTION
The ADE7754 has rising edge zero-crossing detection circuits
for each of voltage channels (V
, VBP, and VCP). Figure 14
AP
shows how the zero-cross signal is generated from the output of
the ADC of the voltage channel.
REFERENCE
VAP, VBP, VCP,
V
V
N
1.0
0.95
1, 2, 4
GAIN[6:5]
13 DEGREES AT 60Hz
V
READ RSTATUS
ADC
f
–3dB
1
LPF1
= 260Hz
IRQ
TO
MULTIPLIER
–100% TO +100% FS
ZERO
CROSS
ZERO-CROSSING
DETECTION
Figure 14. Zero-Crossing Detection on Voltage Channel
The zero-crossing interrupt is generated from the output of
LPF1, which has a single pole at 260 Hz (CLKIN = 10 MHz).
As a result, there is a phase lag between the analog input signal
of the voltage channel and the output of LPF1. The phase
response of this filter is shown in the Voltage Channel ADC
section. The phase lag response of LPF1 results in a time delay
of approximately 0.6 ms (@ 60 Hz) between the zero crossing
on the analog inputs of voltage channel and the falling of IRQ.
When one phase crosses zero from negative to positive values
(rising edge), the corresponding flag in the interrupt status
register (Bits 7 to 9) is set Logic 1. An active low in the IRQ
output also appears if the corresponding ZX bit in the interrupt
enable register is set to Logic 1.
The flag in the interrupt status register is reset to 0 when the interrupt status register with reset (RSTATUS) is read. Each phase has
its own interrupt flag and enable bit in the interrupt register.
REV. 0–12–
Page 13
ADE7754
In addition to the enable bits, the zero-crossing detection interrupt
of each phase is enabled/disabled by setting the ZXSEL bits of the
MMODE register (Address 0Bh) to Logic 1 or 0, respectively.
Zero-Crossing Timeout
Each zero-crossing detection has an associated internal timeout
register (not accessible to the user). This unsigned, 16-bit register is decremented (1 LSB) every 384/CLKIN seconds. The
registers are reset to a common user programmed value (i.e.,
zero cross timeout register—ZXTOUT, Address 12h) every
time a zero crossing is detected on its associated input. The
default value of ZXTOUT is FFFFh. If the internal register
decrements to zero before a zero crossing at the corresponding
input is detected, it indicates an absence of a zero crossing in
the time determined by the ZXTOUT. The ZXTO detection
bit of the corresponding phase in the interrupt status register is
then switched on (Bits 4 to 6). An active low on the IRQ output
also appears if the SAG enable bit for the corresponding phase
in the interrupt enable register is set to Logic 1.
In addition to the enable bits, the zero-crossing timeout detection interrupt of each phase is enabled/disabled by setting the
ZXSEL bits of the MMODE register (Address 0Bh) to Logic 1
or Logic 0, respectively. When the zero-crossing timeout detection
is disabled by this method, the ZXTO flag of the corresponding
phase is switched on all the time.
Figure 15 shows the mechanism of the zero-crossing timeout
detection when the line voltage A stays at a fixed dc level for
more than CLKIN/384 ZXTOUT seconds.
16-BIT INTERNAL
REGISTER VALUE
ZXTOUT
VOLTAGE
CHANNEL A
ZXTOA
DETECTION BIT
Figure 15. Zero-Crossing Timeout Detection
PERIOD MEASUREMENT
The ADE7754 also provides the period measurement of the
line voltage. The period is measured on the phase specified by
Bits 0 to 1 of the MMODE register. The period register is an
unsigned 15-bit register and is updated every period of the
selected phase. Bits 0 and 1 and Bits 4 to 6 of the MMODE
register select the phase for the period measurement; both
selections should indicate the same phase. The ZXSEL bits of
the MMODE register (Bits 4 to 6) enable the phases on which
the period measurement can be done. The PERDSEL bits
select the phase for period measurement within the phases
selected by the ZXSEL bits.
The resolution of this register is 2.4 µs/LSB when CLKIN =
10 MHz
, which is 0.014% when the line frequency is 60 Hz.
When the line frequency is 60 Hz, the value of the period register is approximately 6944d. The length of the register enables
the measurement of line frequencies as low as 12.7 Hz.
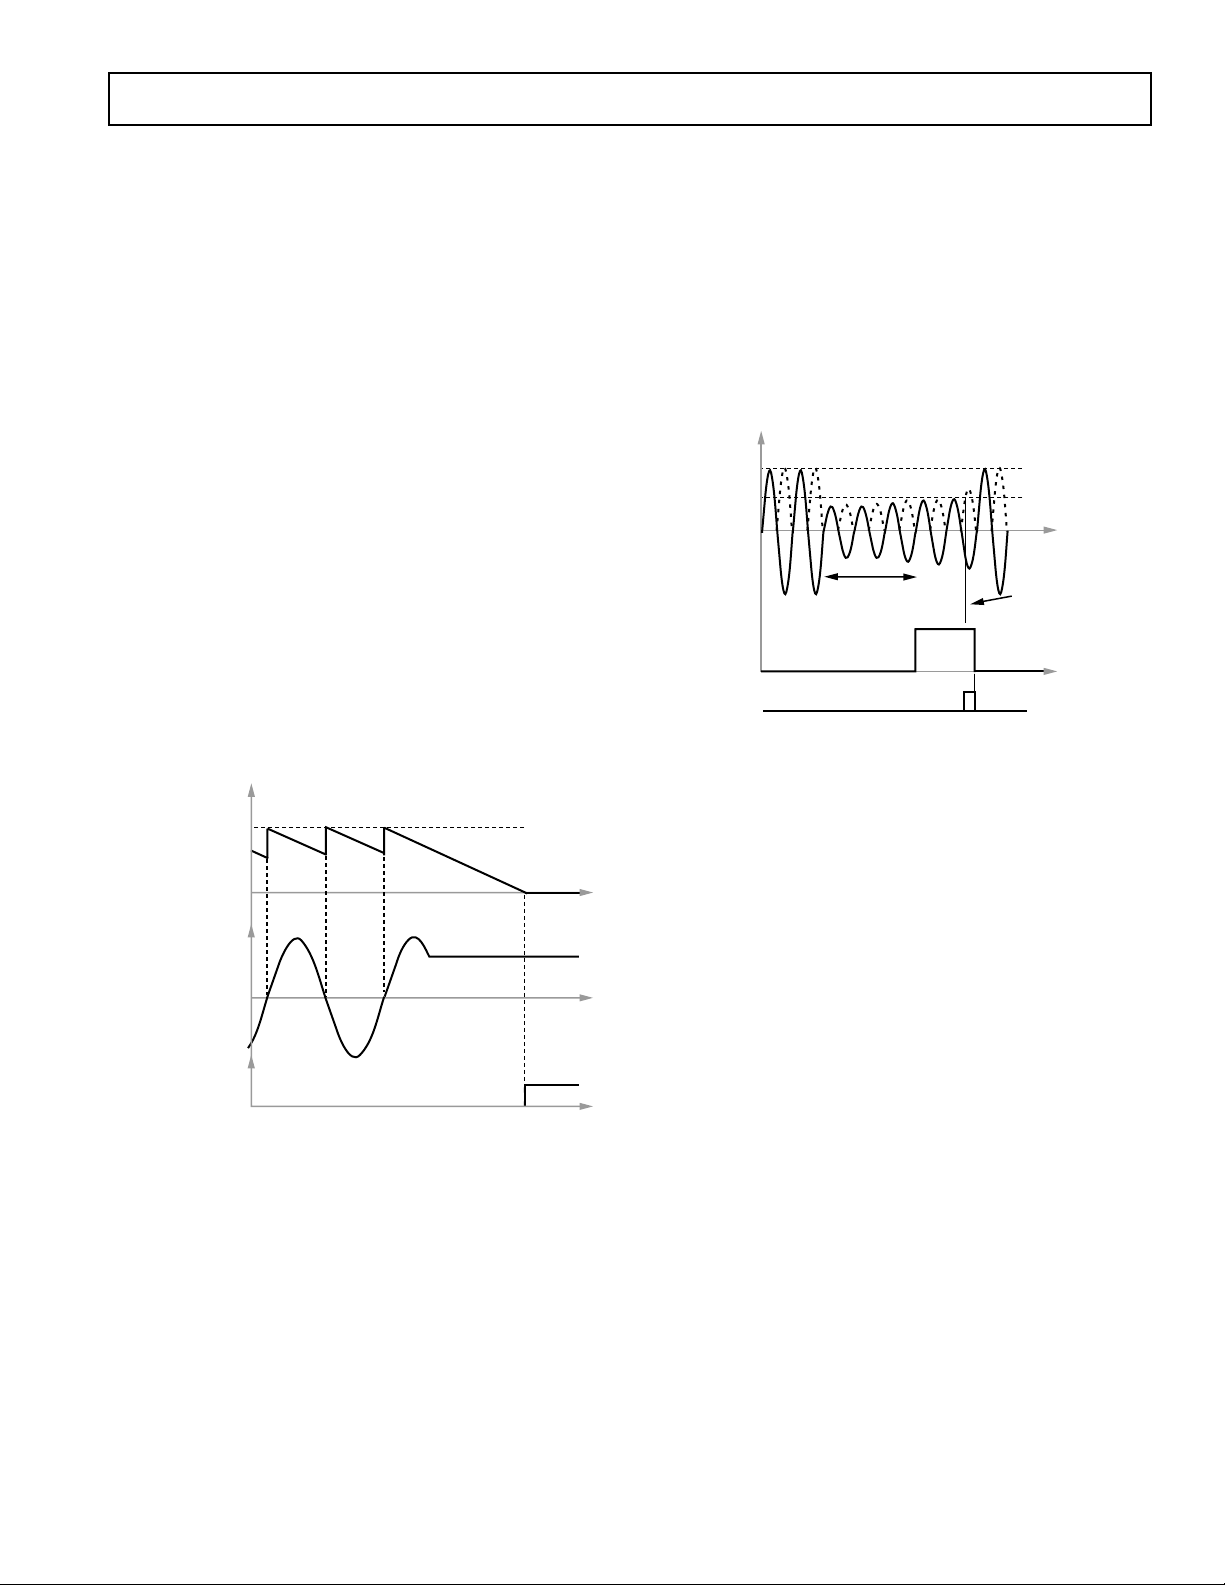
LINE VOLTAGE SAG DETECTION
The ADE7754 can be programmed to detect when the absolute
value of the line voltage of any phase drops below a certain peak
value for a number of half cycles. All phases of the voltage channel are controlled simultaneously. This condition is illustrated
in Figure 16.
FULL SCALE
SAGLVL[7:0]
SAG INTERRUPT
(BIT 1 TO
FLAG
BIT 3 OF STATUS
REGISTER)
READ
RSTATUS
REGISTER
VAP, VBP, OR V
SAGCYC[7:0] = 06h
6 HALF CYCLES
CP
SAG EVENT RESET
LOW WHEN VOLTAGE
CHANNEL EXCEEDS
SAGLVL[7:0]
Figure 16. SAG Detection
Figure 16 shows a line voltage falling below a threshold set in
the SAG level register (SAGLVL[7:0]) for nine half cycles.
the SAG cycle register indicates a six half-cycle thresh-
Since
old (SAGCYC[7:0]=06h),
the SAG event is recorded at the
end of the sixth half-cycle by setting the SAG flag of the corresponding phase in the interrupt status register (Bits 1 to 3 in the
interrupt status register). If the SAG enable bit is set to Logic 1
for this phase (Bits 1 to 3 in the interrupt enable register), the
IRQ logic output goes active low. See the Interrupts section. All
the phases are compared to the same parameters defined in the
SAGLVL and SAGCYC registers.
SAG Level Set
The content of the SAG level register (one byte) is compared to
the absolute value of the most significant byte output from the
voltage channel ADC. Thus, for example, the nominal maximum
code from the voltage channel ADC with a full-scale signal is
28F5h. See the Voltage Channel ADC section.
Therefore, writing 28h to the SAG level register puts the SAG
detection level at full scale and sets the SAG detection to its
most sensitive value.
Writing 00h puts the SAG detection level at 0. The detection of
a decrease of an input voltage is in this case hardly possible.
The detection is made when the content of the SAGLVL
register is greater than the incoming sample.
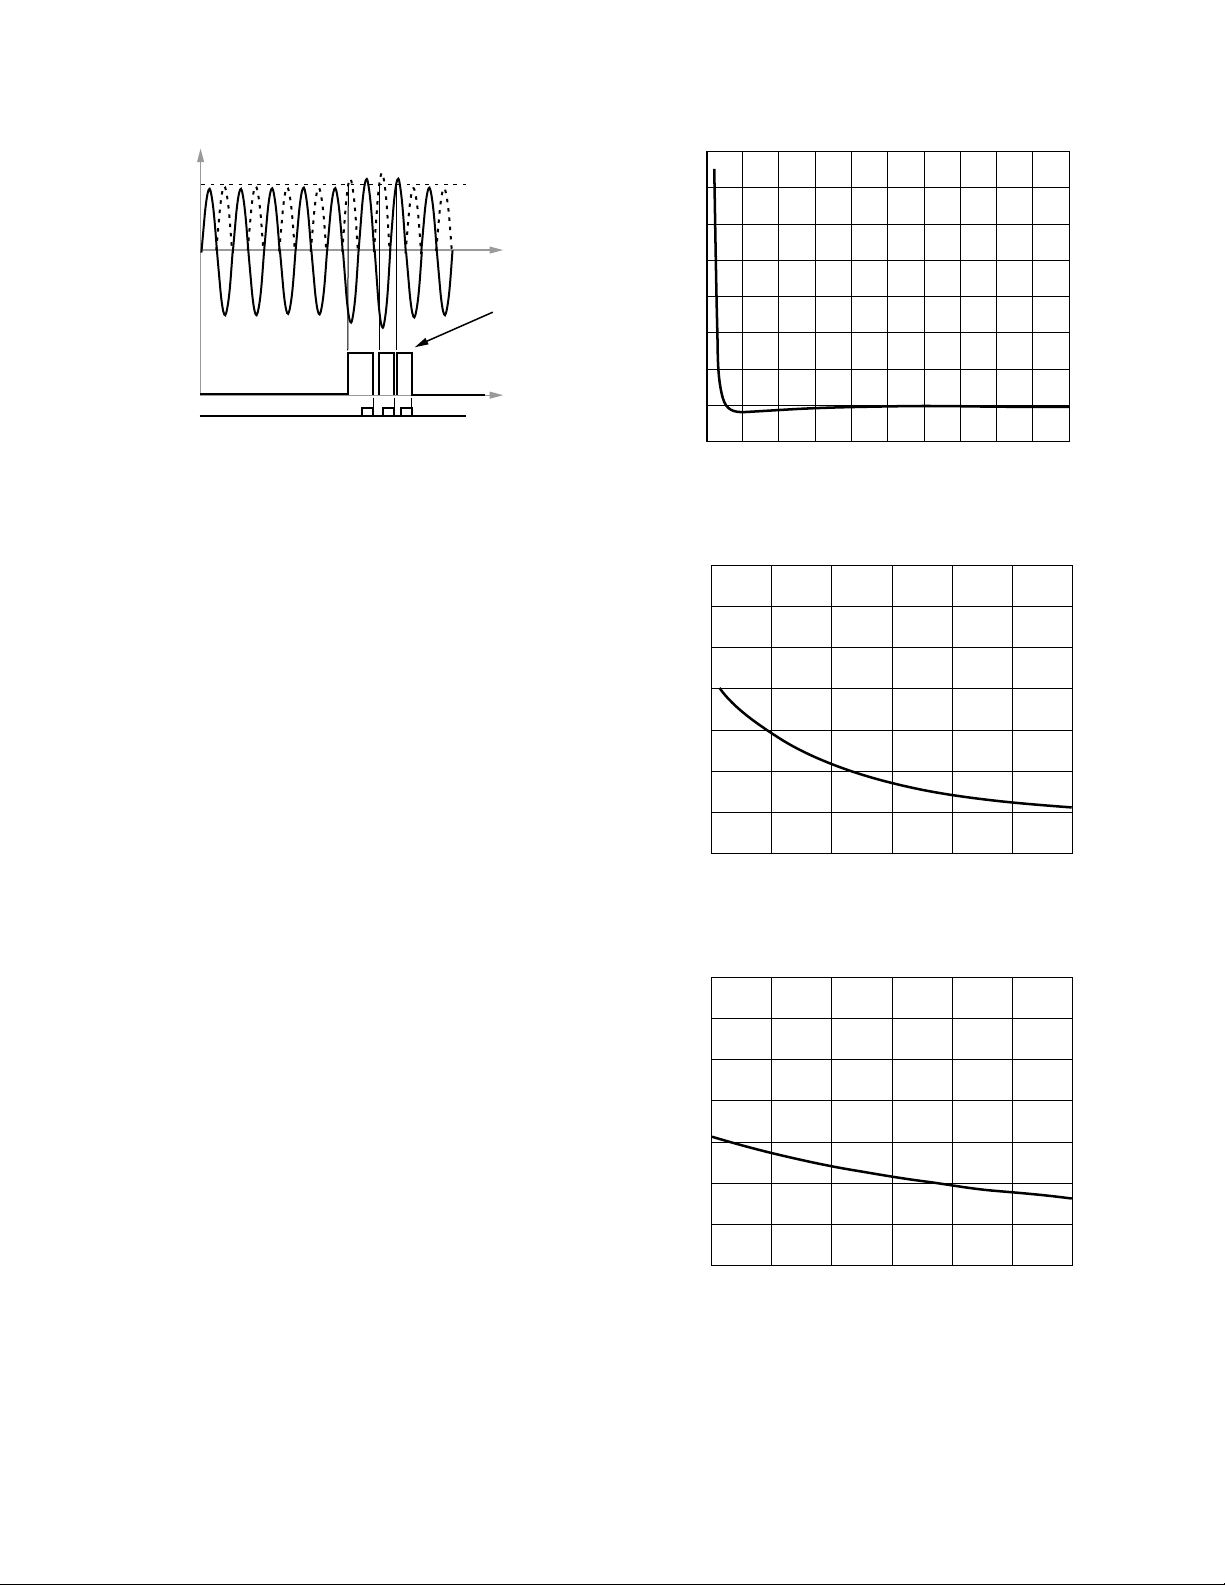
PEAK DETECTION
The ADE7754 also can be programmed to detect when the
absolute value of the voltage or the current channel of one phase
exceeds a certain peak value. Figure 17 illustrates the behavior
of the peak detection for the voltage channel.
REV. 0
–13–
Page 14
ADE7754
k
VPEAK[7:0]
PKV INTERRUPT
FLAG (BIT C OF
STATUS REGISTER)
READ
RSTATUS
REGISTER
VAP, VBP, OR V
CP
PKV RESET
LOW WHEN
RSTATUS
REGISTER
IS READ
Figure 17. Peak Detection
Bits 2 and 3 of the measurement mode register define the phase
supporting the peak detection. Current and voltage of this phase
can be monitored at the same time. Figure 17 shows a line
voltage exceeding a threshold set in the voltage peak register
(VPEAK[7:0]). The voltage peak event is recorded by setting
the PKV flag in the interrupt status register. If the PKV enable
bit is set to Logic 1 in the interrupt enable register, the IRQ
logic output goes active low. See the Interrupts section.
Peak Level Set
The contents of the VPEAK and IPEAK registers compare to
the absolute value of the most significant byte output of the
selected voltage and current channels, respectively. Thus, for
example, the nominal maximum code from the current channel
ADC with a full-scale signal is 28F5C2h. See the Current
Channel Sampling section. Therefore, writing 28h to the
IPEAK register will put the current channel peak detection level
at full scale and set the current peak detection to its least sensitive value. Writing 00h puts the current channel detection level at
zero. The detection is done when the content of the IPEAK
register is smaller than the incoming current channel sample.
TEMPERATURE MEASUREMENT
The ADE7754 also includes an on-chip temperature sensor. A
temperature measurement is made every 4/CLKIN seconds.
The output from the temperature sensing circuit is connected
to an ADC for digitizing. The resulting code is processed and
placed into the temperature register (TEMP[7:0]) which can
be read by the user and has an address of 08h. See the Serial
Interface section. The contents of the temperature register are
signed (twos complement) with a resolution of 4°C/LSB. The
temperature register produces a code of 00h when the ambient
temperature is approximately 129°C. The value of the register is
temperature register = (temperature (°C) – 129)/4. The temperature in the ADE7754 has an offset tolerance of approximately
±5°C. The error can be easily calibrated out by an MCU.
PHASE COMPENSATION
When the HPFs are disabled, the phase difference between the
current channel (IA, IB, and IC) and the voltage channel (VA,
VB, and VC) is zero from dc to 3.3 kHz. When the HPFs are
enabled, the current channels have a phase response as shown in
Figure 18a and 18b. The magnitude response of the filter is
shown in Figure 18c. As seen from in the plots, the phase response
is almost zero from 45 Hz to 1 kHz. This is all that is required
in typical energy measurement applications.
0.07
0.06
0.05
0.04
0.03
0.02
PHASE (Degrees)
0.01
0
–0.01
0 200 400 600 800
100 300 500 700
FREQUENCY (Hz)
900
1
Figure 18a. Phase Response of the HPF and
Phase Compensation (10 Hz to 1 kHz)
0.010
0.008
0.006
0.004
0.002
PHASE (Degrees)
0
–0.002
–0.004
40 45 50 55 60
FREQUENCY (Hz)
65 70
Figure 18b. Phase Response of the HPF and
Phase Compensation (40 Hz to 70 Hz)
0.010
0.008
0.006
0.004
0.002
PHASE (Degrees)
0
–0.002
–0.004
44 46 48 50 52
FREQUENCY (Hz)
54 56
Figure 18c. Gain Response of HPF and Phase Compensation (Deviation of Gain as % of Gain at 54 Hz)
Despite being internally phase compensated, the ADE7754 must
work with transducers that may have inherent phase errors. For
example, a phase error of 0.1° to 0.3° is not uncommon for a CT
(current transformer). These phase errors can vary from part to
part, and they must be corrected in order to perform accurate
power calculations. The errors associated with phase mismatch
REV. 0–14–
Page 15

ADE7754
are particularly noticeable at low power factors. The ADE7754
provides a means of digitally calibrating these small phase
errors. The ADE7754 allows a small time delay or time advance
to be introduced into the signal processing chain to compensate
for small phase errors. Because the compensation is in time, this
technique should be used only for small phase errors in the
range of 0.1° to 0.5°. Correcting large phase errors using a
time shift technique can introduce significant phase errors at
higher harmonics.
The phase calibration registers (APHCAL, BPHCAL, and
CPHCAL) are twos complement, 5-bit signed registers that
can vary the time delay in the voltage channel signal path from
–19.2 µs to +19.2 µs (CLKIN = 10 MHz). One LSB is equiva-
lent to 1.2 µs. With a line frequency of 50 Hz, this gives a
phase resolution of 0.022° at the fundamental (i.e., 360°
1.2 µs 50 Hz).
Figure 19 illustrates how the phase compensation is used to
remove a 0.091° phase lead in IA of the current channel caused
by an external transducer. In order to cancel the lead (0.091°)
in IA of the current channel, a phase lead must also be introduced into VA of the voltage channel. The resolution of the
phase adjustment allows the introduction of a phase lead of
0.086°. The phase lead is achieved by introducing a time advance
into VA. A time advance of 4.8 µs is made by writing –4 (1Ch)
to the time delay block (APHCAL[4:0]), thus reducing the
amount of time delay by 4.8 µs. See the Calibration of a 3-Phase
Meter Based on the ADE7754 Application Note AN-624.
I
VA
AP
0.1
ADC
ADC
1
7
0
0
IA
PGA1
I
AN
V
AP
PGA2
V
N
V1
V2
24
HPF
0.69 AT 50Hz, 0.022
0.83 AT 60Hz, 0.024
0
–19.2s TO +19.2s
1
1
APHCAL[4:0]
VA
IA
1
24
LPF2
0
0
0
VA DELAYED BY 4.8s
(–0.0868 AT 50Hz) 1CH
For time sampling signals, rms calculation involves squaring the
signal, taking the average, and obtaining the square root:
N
rms
1
=
N
F
2
fi
×
∑
i
()
1
=
(2)
The method used to calculate the rms value in the ADE7754 is
to low-pass filter the square of the input signal (LPF3) and take
the square root of the result.
With
Vt V t
() sin( )=××2 ω
rms
then
Vt Vt V V t
() () cos( )×= − ×
22
rms rms
2ω
The rms calculation is simultaneously processed on the six analog
input channels. Each result is available on separate registers.
Current RMS Calculation
Figure 20 shows the detail of the signal processing chain for the
rms calculation on one of the phases of the current channel.
The current channel rms value is processed from the samples
used in the current channel waveform sampling mode. Note
that the APGAIN adjustment affects the result of the rms calculation. See the Current RMS Gain Adjust section. The current
rms values are stored in unsigned 24-bit registers (AIRMS,
BIRMS, and CIRMS). One LSB of the current rms register is
equivalent to 1 LSB of a current waveform sample. The update
rate of the current rms measurement is CLKIN/12. With the
specified full-scale analog input signal of 0.5 V, the ADC produces
an output code which is approximately ±2,684,354d. See the
Current Channel ADC section. The equivalent rms values of a
full-scale ac signal is 1,898,124d. With offset calibration, the
current rms measurement provided in the ADE7754 is accurate
within ±2% for signal input between full scale and full scale/100.
I
(t)
rms
–100% to +100% FS
IRMSOS[11:0]
11
10
2
LPF3
9
2
SGN
2
IA
AAPGAIN
HPF
1CF68Ch
1
0
2
2
+
00h
2
2
2424
IRMS
50Hz
50Hz
Figure 19. Phase Calibration
ROOT MEAN SQUARE MEASUREMENT
Root Mean Square (rms) is a fundamental measurement of the
magnitude of an ac signal. Its definition can be practical or
mathematical. Defined practically, the rms value assigned to an
ac signal is the amount of dc required to produce an equivalent
amount of heat in the same load. Mathematically the rms value
of a continuous signal f(t) is defined as
1
F
REV. 0
rmsT=
T
×
∫
0
2
ftdt
()
(1)
–15–
CURRENT
SIGNAL – i(t)
400000h
28F5C2h
00000h
D70A3Eh
C00000h
FS
ADC OUTPUT
WORD RANGE
+ FS
– FS
CURRENT
CHANNEL (rms)
2378EDh
1CF68Ch
147AE0h
0000h
EB852Fh
E30974h
DC8713h
000h
7FFh 800h
+ 122.5% FS
+ 100% FS
+ 70.7% FS
AAPGAIN[11:0]
– 70.7% FS
– 100% FS
– 122.5% FS
Figure 20. Current RMS Signal Processing
Note that a crosstalk between phases can appear in the ADE7754
current rms measurements. This crosstalk follows a specific
Page 16

ADE7754
pattern. Current rms measurements of Phase A are corrupted by
the signal on the Phase C current input, current rms measurements of Phase B are corrupted by the signal on the Phase A
current input, and current rms measurements of Phase C are
corrupted by the signal on the Phase B current input. This
crosstalk is present only on the current rms measurements and
does not affect the regular active power measurements. The
level of the crosstalk is dependent on the level of the noise
source and the phase angle between the noise source and the
corrupted signal. The level of the crosstalk can be reduced by
writing 01F7h to the address 3Dh. This 16-bit register is
reserved for factory operation and should not be written to any
other value. When the current inputs are 120° out of phase and
the register 3Dh is set to 01F7h, the level of the current rms
crosstalk is below 2%.
Current RMS Gain Adjust
The active power gain registers (AAPGAIN[11:0], BAPGAIN,
and CAPGAIN) affect the active power and current rms values.
Calibrating the current rms measurements with these registers is
not recommended. The conversion of the current rms registers
values to amperes has to be done in an external microcontroller
with a specific ampere/LSB constant for each phase. See the Calibration of a 3-Phase Meter Based on the ADE7754 Application
Note AN-624. Due to gain mismatches between phases, the calibration of the ampere/LSB constant has to be done separately for
each phase. One-point calibration is sufficient for this calibration.
The active power gain registers ease the calibration of the active
energy calculation in MODE 1 and 2 of the WATMODE register.
If the APGAIN registers are used for active power calibration
(WATMOD bits in WATMode register = 1 or 2), the current
rms values are changed by the active power gain register value
as described in the expression
Current rms register Phase A rms
=×+
AAPGAIN
1
2
12
For example, when 7FFh is written to the active power gain
register, the ADC output is scaled up by 22.5%. Similarly, 800h
= –2047d (signed twos complement) and ADC output is scaled
by 29.3%. These two examples are illustrated in Figure 20.
Current RMS Offset Compensation
The ADE7754 incorporates a current rms offset compensation
for each phase (AIRMSOS, BIRMSOS, and CIRMSOS). These
are 12-bit twos complement signed registers that can be used to
remove offsets in the current rms calculations. An offset may
exist in the rms calculation due to input noises that are integrated in the dc component of V
allow the contents of the I
2
(t). The offset calibration will
registers to be maintained at zero
RMS
when no current is being consumed.
n LSB of the current rms offset are equivalent to 32768 n LSB
of the square of the current rms register. Assuming that the
maximum value from the current rms calculation is 1,898,124
decimal with full-scale ac inputs, then 1 LSB of the current rms
offset represents 0.0058% of measurement error at –40 dB
below full scale.
2
0
32768
where I
IIIRMSOS
=+ ×
rms rms
is the rms measurement without offset correction.
rmso
The current rms offset compensation should be done by testing the
rms results at two non-zero input levels. One measurement can be
done close to full scale and the other at approximately full scale/
100. The current offset compensation can then be derived using
these measurements. See the Calibration of a 3-Phase Meter Based
on the ADE7754 Application Note AN-624.
Voltage RMS Calculation
Figure 21 shows the details of the signal processing chain for the
rms calculation on one of the phases of the voltage channel. The
voltage channel rms value is processed from the samples used in
the voltage channel waveform sampling mode. The output of
the voltage channel ADC can be scaled by ±50% by changing
VGAIN registers to perform an overall apparent power calibration. See the Apparent Power Calculation section. The VGAIN
adjustment affects the rms calculation because it is done before
the rms signal processing. The voltage rms values are stored in
unsigned 24-bit registers (AVRMS, BVRMS, and CVRMS).
256 LSB of the voltage rms register is approximately equivalent
to one LSB of a voltage waveform sample. The update rate of
the voltage rms measurement is CLKIN/12.
With the specified full-scale ac analog input signal of 0.5 V, the
LPF1 produces an output code that is approximately ±10,217
decimal at 60 Hz. See the Voltage Channel ADC section. The
equivalent rms value of a full-scale ac signal is approximately
(1C35h), which gives a voltage rms value of 1,848,772d
7,221d
(1C35C4h)
in the V
register. With offset calibration, the
RMS
voltage rms measurement provided in the ADE7754 is accurate
within ±0.5% for signal input between full scale and full scale/20.
VOLTAGE SIGNAL – V(t)
VA
LPF1
VOLTAGE
SIGNAL – v(t)
4000h
28F5h
00000h
D70Ah
C000h
ADC OUTPUT
WORD RANGE
0.5/GAIN2
12
800h–7FFh
AVGAIN[11:0]
+ FS
– FS
LPF3
VOLTAGE
CHANNEL (rms)
2A50A6h
1C35C4h
E1AE2h
0000h
F1E51Eh
E3CA3Ch
D5AF5Ah
000h
VRMSOS[11:0]
11
SGN
2
7FFh 800h
2
8
2
2
+
+
+ 150% FS
+ 100% FS
+ 50% FS
AVGAIN[11:0]
– 50% FS
– 100% FS
– 150% FS
1
0
2
2
24
Figure 21. Voltage RMS Signal Processing
Voltage RMS Gain Adjust
The voltage gain registers (AVGAIN[11:0], BVGAIN, and
CVGAIN) affect the apparent power and voltage rms values.
Calibrating the voltage rms measurements with these registers is
not recommended. The conversion of the voltage rms registers
values to volts has to be done in an external microcontroller
with a specific volt/LSB constant for each phase. See the Calibration of a 3-Phase Meter Based on the ADE7754 Application
Note AN-624. Due to gain mismatches between phases, the calibration of the volt/LSB constant has to be done separately for
each phase. One point
calibration is sufficient for this calibration.
The voltage gain registers are aimed to ease the calibration of the
apparent energy calcula
tion in MODE 1 and MODE 2 of the
VAMODE register.
REV. 0–16–
Page 17

ADE7754
If the VGAIN registers are used for apparent power calibration
(WATMOD bits in VAMODE register = 1 or 2), the voltage
rms values are changed by voltage gain register value as described
in the expression
Voltage rms Phase A rms
register =×+
1
AVGAIN
2
12
For example, when 7FFh is written to the voltage gain register,
the ADC output is scaled up by +50%. 7FFh = 2047d, 2047/
12
= 0.5. Similarly, 800h = –2047d (signed twos complement)
2
and ADC output is scaled by –50%. These two examples are
illustrated in Figure 21.
Voltage RMS Offset Compensation
The ADE7754 incorporates a voltage rms offset compensation
for each phase (AVRMSOS, BVRMSOS, and CVRMSOS).
These are 12-bit twos complement signed registers that can be
used to remove offsets in the voltage rms calculations. An offset
may exist in the rms calculation due to input noises and offsets
in the input samples. The offset calibration allows the contents
of the V
registers to be maintained at zero when no voltage
RMS
is applied.
n LSB of the voltage rms offset are equivalent to 64 n LSB of
the voltage rms register. Assuming that the maximum value from
the voltage rms calculation is 1,898,124 decimal with full-scale
ac inputs, then 1 LSB of the voltage rms offset represents 0.07%
of measurement error at –26 dB below full scale.
VV VRMSOS
rms rms
where V
=+ ×
0
is the rms measurement without offset correction.
rmso
64
The voltage rms offset compensation should be done by testing
the rms results at two non-zero input levels. One measurement
can be done close to full scale and the other at approximately
full scale/10. The voltage offset compensation can then be derived
from these measurements. See the Calibration of a 3-Phase
Meter Based on the ADE7754 Application Note AN-624.
ACTIVE POWER CALCULATION
Electrical power is defined as the rate of energy flow from source
to load. It is given by the product of the voltage and current
waveforms. The resulting waveform is called the instantaneous
power signal and it is equal to the rate of energy flow at every
instant of time. The unit of power is the watt or joules/sec. Equation 5 gives an expression for the instantaneous power signal in
an ac system.
where T is the line cycle period.
P is referred to as the active or
real power. Note that the active power is equal to the dc component of the instantaneous power signal p(t) in Equation 5 (i.e.,
VI). This is the relationship used to
calculate active power in the
ADE7754 for each phase. The instantaneous power signal p(t)
is generated by multiplying the
current and voltage signals in
each phase. The dc component of the instantaneous power signal
in each phase (A, B, and C) is then extracted by LPF2 (low-pass
filter) to obtain the active power information on each phase. This
process is illustrated in Figure 22. In a polyphase system, the total
electrical power is simply the sum of the real power in all active
phases. The solutions available to process the total active power
are discussed in the following section.
INSTANTANEOUS
1A36E2Eh
V. I.
D1B717h
00000h
POWER SIGNAL
CURRENT
i(t)
= 2I sin(
VOLTAGE
v(t)
= 2V sin(
t)
p(t) = V
I – V I cos(2t)
ACTIVE REAL POWER
SIGNAL = V
t)
I
Figure 22. Active Power Calculation
Since LPF2 does not have an ideal brick wall frequency
response (see Figure 23), the active power signal has some
ripple due to the instantaneous power signal. This ripple is
sinusoidal and has a frequency equal to twice the line frequency.
Since the ripple is sinusoidal in nature, it is removed when the
active power signal is integrated to calculate the energy. See the
Energy Calculation section.
0
–4
–8
8Hz
vt V t() sin( )= 2 ω
it I t() sin( )= 2 ω
(3)
(4)
where V = rms voltage and I = rms current.
pt vt it
() () ()
=×
pt VI VI t
() cos( )
=− 2ω
(5)
The average power over an integral number of line cycles (n) is
given by the expression in Equation 6.
nT
1
P
==
nT
ptdt VI
∫
()
0
REV. 0
(6)
–17–
–12
DECIBELS
–16
–20
–24
13 1030
FREQUENCY (Hz)
100
Figure 23. Frequency Response of the LPF Used
to Filter Instantaneous Power in Each Phase
Page 18

ADE7754
I
CURRENT SIGNAL – i(t)
–100% TO +100% FS
28F5C2h
00h
D70A3Eh
V
VOLTAGE SIGNAL – v(t)
–100% TO + 100% FS
28F5h
00h
D70Bh
HPF
1
1V/GAIN1
1V/GAIN2
MULTIPLIER
INSTANTANEOUS
POWER SIGNAL – p(t)
Figure 24. Active Power Signal Processing
Figure 24 shows the signal processing in each phase for the
active power in the ADE7754.
Figure 25 shows the maximum code (hexadecimal) output
range of the active power signal (after AWG). Note that the
output range changes depending on the contents of the active
power gain and watt gain registers. See the Current Channel
ADC section. The minimum output range is given when the
active power gain and watt gain registers contents are equal to
800h, and the maximum range is given by writing 7FFh to the
active power gain and watt gain registers. These can be used to
calibrate the active power (or energy) calculation in the
ADE7754 for each phase and the total active energy. See the
Total Active Power Calculation section.
13A92A4h
D1B717h
68DB8Ch
0000000h
972474h
2E48E9h
EC56D5Ch
ACTIVE
POWER
VOLTAGE CHANNEL 0.5V/GAIN2
CURRENT CHANNEL 0.5V/GAIN1
000h
7FFh
800h
+ 150% FS
+ 100% F5
+ 50% FS
AAPGAIN[11:0] OR AWGAIN[11:0]
– 50% FS
– 100% FS
– 150% FS
Figure 25. Active Power Calculation Output Range
Power Offset Calibration
The ADE7754 also incorporates an active offset register on each
phase (AAPOS, BAPOS, and CAPOS). These are signed twos
complement 12-bit registers that can be used to remove offsets
in the active power calculations. An offset may exist in the
power calculation because of crosstalk between channels on the
PCB or in the IC itself. The offset calibration allows the contents of the active power register to be maintained at zero when
no power is being consumed.
One LSB in the active power offset register is equivalent to one
LSB in the 28-bit energy bus displayed in Figure 24. Each
time power is added to the internal active energy register, the
content of the active power offset register is added. See the
Total Active Power Calculation section. Assuming the average
value from LPF2 is 8637BCh (8,796,092d) with full ac scale
inputs on current channel and voltage channel, then one LSB in
the LPF2 output is equivalent to 0.011% of measurement error
at –60 dB down of full scale. See the Calibration of a 3-Phase
Meter Based on the ADE7754 Application Note AN-624.
SGN
24
APOS[11:0]
ACTIVE POWER
1
SGN
LPF2
SGN
SGN
28
SGN
10
2
+
3
4
2
2
2
AWG
0
2
2
2
SIGNAL – P
D1B717h
12
Reverse Power Information
The ADE7754 detects when the current and voltage channels
of any of the three phase inputs have a phase difference greater
than 90° (i.e., |
| or |B| or |C| > 90°). This mechanism
A
can detect wrong connection of the meter or generation of
active energy.
The reverse power information is available for Phase A, Phase B,
and Phase C, respectively, by reading Bits 12 to 14 of the CFNUM
register. See Table XI. The state of these bits represents the
sign of the active power of the corresponding phase. Logic 1
corresponds to negative active power.
The AENERGY phase selection bits (WATSEL bits of the
WATMode register) enable the negative power detection per
phase. If Phase A is enabled in the AENERGY accumulation,
Bit 5 of WATMode register sets to Logic 1 and the negative
power detection for Phase A—Bit 12 of CFNUM register—
indicates the direction of the active energy. If Phase A is
disabled in the AENERGY register, the negative power bit for
Phase A is set to Logic 0.
TOTAL ACTIVE POWER CALCULATION
The sum of the active powers coming from each phase provides
the total active power consumption. Different combinations of
the three phases can be selected in the sum by setting Bits 7 and
6 of the WATMode register (mnemonic WATMOD[1:0]).
Figure 26 demonstrates the calculation of the total active power,
which depends on the configuration of the WATMOD bits in
the WATMode register. Each term of the formula can be disabled
or enabled by setting WATSEL bits respectively to Logic 0 or
Logic 1 in the WATMode register. The different configurations
are described in Table I.
Table I. Total Active Power Calculation
WATMOD WATSEL0 WATSEL1 WATSEL2
0d V
1d V
IA* + VB IB* + VC IC*
A
(IA*–IB*)+ 0 + VC (IC*–IB*)
A
2d VA (IA*–IB*)+ 0 + VC IC*
Note that I
*, IB*, and IC* represent the current channel
A
samples after APGAIN correction and high-pass filtering.
REV. 0–18–
Page 19

PHASE A
PHASE B
PHASE C
ADE7754
0
IB*
I
A
AAPGAIN
V
A
I
B
BAPGAIN
V
B
I
C
CAPGAIN
V
C
HPF
HPF
0
IB*
HPF
Figure 26. Total Active Power Consumption Calculation
–
+
1
IB*
1
–
+
1
AAPOS
+
28
LPF2
AWGAIN
TOTAL INSTANTANEOUS
POWER SIGNAL
2752545h
ACTIVE POWER
SIGNAL – P
BAPOS
+
28
LPF2
BWGAIN
CAPOS
+
28
LPF2
CWGAIN
For example, for WATMOD = 1, when all the gains and offsets
corrections are taken into consideration, the formula that is
used to process the active power is
Total Active Power
1
V
×+
AAB
+×+
V
CCB
=
AAPGAIN
CAPGAIN
1
×−+
12 12 12
2
×−+
12 12
2
BAPGAIN
1
I
2
BAPGAIN
1
I
2
×
+
I AAPOS
×
I CAPOS
+
×+
×+
AWG
1
2
CWG
1
1212
2
Depending on the polyphase meter service, an appropriate formula should be chosen to calculate the active power. The
American ANSI C12.10 standard defines the different configurations of the meter. Table II describes which mode should be
chosen for each configuration.
Table II. Meter Form Configuration
ANSI Meter Form WATMOD WATSEL
5S/13S 3-wire Delta 0 3 or 5 or 6
6S/14S 4-wire Wye 1 5
8S/15S 4-wire Delta 2 5
9S/16S 4-wire Wye 0 7
Different gain calibration parameters are offered in the ADE7754
to cover the calibration of the meter in different configurations.
Note that in Mode 0, the APGAIN and WGAIN registers have
the same effect on the end result. In this case, APGAIN registers should be set at their default value and the gain adjustment
should be made with the WGAIN registers.
ENERGY CALCULATION
As stated earlier, power is defined as the rate of energy flow.
This relationship can be expressed mathematically as
dE
=
P
dt
(7)
where P = power and E = energy.
Conversely energy is given as the integral of power.
E Pdt=
∫
(8)
The ADE7754 achieves the integration of the active power
signal by continuously accumulating the active power signal in
an internal non readable 54-bit energy register. The active
energy register (AENERGY[23:0]) represents the upper 24 bits
of this internal register. This discrete time accumulation or
summation is equivalent to integration in continuous time.
Equation 9 expresses the relationship
∞
EptdtLim p nT T
==
() ( )
∫
Σ
Tn
→=
00
×
(9)
where n is the discrete time sample number and T is the
sample period.
REV. 0
–19–
Page 20

ADE7754
The discrete time sample period (T) for the accumulation
register in the ADE7754 is 0.4 µs (4/10 MHz). In addition to
calculating the energy, this integration removes any sinusoidal
component that may be in the active power signal. Figure 27
shows a graphical representation of this discrete time integration
or accumulation. The active power signal is continuously added
to the internal energy register. Because this addition is a signed
addition, negative energy will be subtracted from the active
energy contents.
AENERGY[23:0]
TOTAL ACTIVE POWER
26667h
00000h
T
T
+
ACTIVE POWER
SIGNAL (P)
TIME (nT)
23
53
WDIV
53
+
TOTAL ACTIVE POWER IS
ACCUMULATED (INTEGRATED) IN
THE ACTIVE ENERGY REGISTER
0
0
%
0
Figure 27. Active Energy Calculation
The 54-bit value of the internal energy register is divided by
WDIV. If the value in the WDIV register is 0, then the internal
active energy register is divided by 1. WDIV is an 8-bit unsigned
register. The upper 24-bits of the result of the division are then
available in the 24-bit active energy register. The AENERGY
and RAENERGY registers read the same internal active energy
register. They differ by the state in which they are leaving the
internal active energy register after a read. Two operations are
held when reading the RAENERGY register: read and reset to 0
the internal active energy register. Only one operation is held
when reading the AENERGY register: read the internal active
energy register.
Figure 28 shows the energy accumulation for full-scale (sinusoidal)
signals on the analog inputs. The three displayed curves illustrate
the minimum time it takes the energy register to roll over when
the individual watt gain registers contents are all equal to 3FFh,
000h, and 800h. The watt gain registers are used to carry out a
power calibration in the ADE7754. As shown, the fastest
integration time occurs when the watt gain registers are set to
maximum full scale, i.e., 3FFh.
AENERGY[23:0]
7F,FFFFh
3F,FFFFh
00,0000h
40,0000h
80,0000h
88
44
132
TIME (sec)
176
220
264
AWG = BWG = CWG = 3FFh
AWG = BWG = CWG = 000h
AWG = BWG = CWG = 800h
Figure 28. Energy Register Roll-Over Time for FullScale Power (Minimum and Maximum Power Gain)
Note that the active energy register contents roll over to fullscale negative (80,0000h) and continue increasing in value
when the power or energy flow is positive. See Figure 28.
Conversely, if the power is negative, the energy register would
underflow to full scale positive (7F,FFFFh) and continue
decreasing in value.
By using the interrupt enable register, the ADE7754 can be
configured to issue an interrupt (IRQ) when the active energy
register is half full (positive or negative).
Integration Times Under Steady Load
As mentioned in the last section, the discrete time sample
period (T) for the accumulation register is 0.4 µs (4/CLKIN).
With full-scale sinusoidal signals on the analog inputs and the
watt gain registers set to 000h, the average word value from
each LPF2 is D1B717h. See Figures 22 and 24. The maximum
value that can be stored in the active energy register before it
overflows is 2
added to the internal register, which can store 2
23
– 1 or 7F,FFFFh. As the average word value is
53
– 1 or
1F,FFFF,FFFF,FFFFh before it overflows, the integration time
under these conditions with WDIV = 0 is calculated as follows:
Time
F FFFF FFFF FFFFh
31717
DB h
×
04 88
. µ
ss=
×=
,,,
1
When WDIV is set to a value different from 0, the integration
time varies as shown in Equation 10.
Time Time WDIV
=×
WDIV
=0
(10)
The WDIV register can be used to increase the time before the
active energy register overflows, thereby reducing the communication needs with the ADE7754.
Energy to Frequency Conversion
The ADE7754 also provides energy-to-frequency conversion
for calibration purposes. After initial calibration at manufacture, the manufacturer or the customer will often verify the
energy meter calibration. One convenient way to verify the
meter calibration is for the manufacturer to provide an output
frequency proportional to the energy or active power under
steady load conditions. This output frequency can provide a
simple single-wire, optically isolated interface to external calibration equipment. Figure 29 illustrates the energy to frequency
conversion in the ADE7754.
REV. 0–20–
Page 21

ADE7754
CFNUM[11:0]
ACTIVE POWER
PHASE A
ACTIVE POWER
PHASE B
ACTIVE POWER
PHASE C
11
+
+
53
TOTAL ACTIVE
POWER
DFC
0
11
CFDEN[11:0]
0
CF
0
Figure 29. ADE7754 Energy to Frequency Conversion
A digital to frequency converter (DFC) is used to generate the
CF pulsed output. The DFC generates a pulse each time one
LSB in the active energy register is accumulated. An output
pulse is generated when CFDEN/CFNUM pulses are generated
at the DFC output. Under steady load conditions, the output
frequency is proportional to the active power. The maximum
output frequency (CFNUM = 00h and CFDEN = 00h) with
full scale ac signals on the three phases (i.e., current channel
and voltage channel is approximately 96 kHz).
The ADE7754 incorporates two registers to set the frequency of
CF (CFNUM[11:0] and CFDEN[11:0]). These are unsigned
12-bit registers that can be used to adjust the frequency of CF
to a wide range of values. These frequency scaling registers are
12-bit registers that can scale the output frequency by 1/2
with a step of 1/2
12
.
12
to 1
If the value 0 is written to any of these registers, the value 1
would be applied to the register. The ratio CFNUM/CFDEN
should be smaller than 1 to ensure proper operation. If the ratio
of the registers CFNUM/CFDEN is greater than 1, the CF
frequency can no longer be guaranteed to be a consistent value.
For example, if the output frequency is 18.744 kHz and the
contents of CFDEN are zero (000h), then the output frequency
can be set to 6.103 Hz by writing BFFh to the CFDEN register.
The output frequency will have a slight ripple at a frequency
equal to twice the line frequency because of imperfect filtering
of the instantaneous power signal used to generate the active
power signal. See the Active Power Calculation section. Equation 5 gives an expression for the instantaneous power signal.
This is filtered by LPF2, which has a magnitude response given
by Equation 11.
|()|Hff=
2
+11
2
8
(11)
The active power signal (output of the LPF2) can be rewritten as
pt VI
() cos=−
VI
1
+
×
2
f
2
l
8
ft
π
4
()
l
(12)
where fl is the line frequency (e.g., 60 Hz).
From Equation 8
Et VIt
() sin=−
VI
f
41
π
+
l
2
f
2
l
8
π
×
ft
4
()
l
(13)
Equation 13 shows that there is a small ripple in the energy
calculation due to a sin(2t) component. This is graphically
displayed in Figure 30. The ripple becomes larger as a percentage
of the frequency at larger loads and higher output frequencies.
Choosing a lower output frequency at CF for calibration can
significantly reduce the ripple. Also, averaging the output frequency by using a longer gate time for the counter achieves the
same results.
E(t)
VIt
VI
–
1
f
4
I
t
4
sin
ft
( )
2
2
f
I
+
(
(
8
I
Figure 30. Output Frequency Ripple
No Load Threshold
The ADE7754 includes a selectable “no load threshold” or
“startup current” feature that eliminates any creep effects in the
active energy measurement of the meter. When enabled, this
function is independently applied on each phase’s active power
calculation. This mode is selected by default and can be disabled
REV. 0
–21–
Page 22

ADE7754
by setting to Logic 1 Bit 3 of the gain register (Address 18h). See
Table X. Any load generating an active power amplitude lower
than the minimum amplitude specified will not be taken into
account when accumulating the active power from this phase.
The minimum instantaneous active power allowed in this mode
is 0.005% of the full-scale amplitude. Because the maximum
active power value is 13,743,895d with full-scale analog input,
the no-load threshold is 687d. For example, an energy meter
with maximum inputs of 220 V and 40 A and Ib = 10 A, the
maximum instantaneous active power is 3,435,974d, assuming
that both inputs represent half of the analog input full scale. As
the no-load threshold represents 687d, the start-up current
represents 8 mA or 0.08% of Ib.
Mode Selection of the Sum of the Three Active Energies
The ADE7754 can be configured to execute the arithmetic sum
of the three active energies, Wh = WhA + WhB + WhC, or the
sum of the absolute value of these energies, Wh = |Wh
| + |WhC|. The selection between the two modes can
|W h
B
A
| +
be made by setting Bit 2 of the gain register (Address 18h). See
Table X. Logic high and logic low of this bit correspond to the
sum of absolute values and the arithmetic sum, respectively.
This selection affects the active energy accumulation in the
AENERGY, RAENERGY, and LAENERGY registers as well
as the CF frequency output.
When the sum of the absolute values is selected, the active
energy from each phase is always counted positive in the total
active energy. It is particularly useful in a 3-phase, 4-wire installation where the sign of the active power should always be the
same. If the meter is misconnected to the power lines (e.g., CT
is connected in the wrong direction), the total active energy
recorded without this solution can be reduced by two thirds. The
sum of the absolute values ensures that the active energy recorded
represents the actual active energy delivered. In this mode, the
reverse power information available in the CFNUM register is
still detecting when negative active power is present on any of
the three phase inputs.
LINE ENERGY ACCUMULATION
The ADE7754 is designed with a special energy accumulation
mode that simplifies the calibration process. By using the onchip zero-crossing detection, the ADE7754 accumulates the
active power signal in the LAENERGY register for an integer
number of half cycles, as shown in Figure 31. The line active
energy accumulation mode is always active.
Using this mode with only one phase selected is recommended.
If several phases are selected, the amount accumulated may be
smaller than it should be.
Each one of three phases zero-crossing detection can contribute
to the accumulation of the half line cycles. Phase A, B, and C
zero crossings, respectively, are taken into account when counting the number of half line cycles by setting Bits 4 to 6 of the
MMODE register to Logic 1. Selecting phases for the zerocrossing counting also has the effect of enabling the zero-crossing detection, zero-crossing timeout and period measurement
for the corresponding phase as described in the zero-crossing
detection paragraph.
The number of half line cycles is specified in the LINCYC
register. LINCYC is an unsigned 16-bit register. The ADE7754
can accumulate active power for up to 65535 combined half
cycles. Because the active power is integrated on an integer
number of line cycles, the sinusoidal component is reduced to
zero. This eliminates any ripple in the energy calculation. Energy
is calculated more accurately because of this precise timing
control. At the end of an energy calibration cycle, the LINCYC
flag in the interrupt status register is set. If the LINCYC enable
bit in the interrupt enable register is set to Logic 1, the IRQ
output also goes active low.
FROM VA
ADC
FROM VB
ADC
FROM VC
ADC
LPF1
LPF1
LPF1
MMODE
REGISTER BIT 4
ZERO-CROSS
DETECT
MMODE
REGISTER BIT 5
ZERO-CROSS
DETECT
MMODE
REGISTER BIT 6
ZERO-CROSS
DETECT
ACCUMULATE ACTIVE POWER
DURING LINCYC ZERO CROSSINGS
CALIBRATION
CONTROL
LINCYC[15:0]
POWER
PHASE A
POWER
PHASE B
POWER
PHASE C
+
Figure 31. Active Energy Calibration
AENERGY[23:0]
23
51
WDIV
+
+
+
51
0
0
%
0
REV. 0–22–
Page 23

ADE7754
Thus the IRQ line can also be used to signal the end of a calibration. Equation 14 is derived from Equations 8 and 12.
nT nT
Et VIdt
() – cos=
∫
0
+
1
VI
×
∫
2
f
8
0
ftdt
π
2
()
(14)
where n is an integer and T is the line cycle period. Since the
sinusoidal component is integrated over an integer number of
line cycles, its value is always zero.
Therefore,
nT
Et VIdt
()=+
∫
0
Et VInT()=
0
(15)
(16)
The total active power calculated by the ADE7754 in the line
accumulation mode depends on the configuration of the
WATMOD bits in the WATMode register. Each term of the
formula can be disabled or enabled by the LWATSEL bits of
the WATMode register. The different configurations are
described in Table III.
Table III. Total Line Active Energy Calculation
WATMOD LWATSEL0 LWATSEL1 LWATSEL2
0V
1V
2V
Note that I
IA* + VB IB* + VC IC*
A
(IA*– IB*)+ 0 + VC (IC*– IB*)
A
(IA*– IB*)+ 0 + VC IC*
A
*, IB*, and IC* represent the current channels
A
samples after APGAIN correction and high-pass filtering.
The line active energy accumulation uses the same signal path
as the active energy accumulation; however, the LSB size of the
two registers is different. If the line active energy register and
active energy register are accumulated at the same time, the line
active energy register will be four times bigger than the active
energy register.
The LAENERGY register is also used to accumulate the reactive energy by setting to Logic 1 Bit 5 of the WAVMode register
(Address 0Ch). See the Reactive Power Calculation section.
When this bit is set to 1, the accumulation of the active energy
over half line cycles in the LAENERGY register is disabled and
is done instead in the LVAENERGY register. Because the
LVAENERGY register is an unsigned value, the accumulation
of the active energy in the LVAENERGY register is unsigned in
this mode. The reactive energy is then accumulated in the
LAENERGY register. See Figure 33. In this mode (reactive energy), selecting the phases accumulated in the LAENERGY
and LVAENERGY registers is done by the LWATSEL selection bits of the WATTMode register.
In normal mode, Bit 5 of the WAVMODE register equals 0,
and the type of active power summation in the LAENERGY
register (sum of absolute active power or arithmetic sum) is
selected by Bit 2 of the gain register.
In the mode where the active powers are accumulated in the
LVAENERGY register, and Bit 5 of the WAVMODE register
equals 1, note that the sum of several active powers is always
done
ignoring the sign of the active powers. This is due to the
unsigned nature of the LVAENERGY register which does not
allow signed addition.
REACTIVE POWER CALCULATION
Reactive power is defined as the product of the voltage and
current waveforms when one of this signals is phase shifted by
90º at each frequency. It is defined mathematically in the IEEE
Standards Dictionary 100 as
∞
Reactive Power sin=××
where Vn and In are the voltage and current rms values of the n
Σ
VI1ϕ
nn n
=
n
()
th
harmonics of the line frequency, respectively, and n is the
phase difference between the voltage and current nth harmonics. The resulting waveform is called the instantaneous reactive
power signal (VAR).
Equation 19 gives an expression for the instantaneous reactive
power signal in an ac system without harmonics when the phase
of the current channel is shifted by –90º.
vt V t() sin( )=−2
22
it I t i t I t() sin( ) ' ( ) sin==−
VAR t v t i t
() () '()
=×
VAR t V I VI t
() sin( ) sin( )
=+ +
ωϕ
11
∏
ωω
11
11 1 11 1
2ϕωϕ
2
(17)
(18)
(19)
The average power over an integral number of line cycles (n) is
given in Equation 20.
nT
VAR
1
VAR t dt V I
==
nT
() sin( )
∫
0
ϕ
11 1
(20)
where T is the line cycle period.
VAR is referred to as the reactive power. Note that the reactive
power is equal to the dc component of the instantaneous reactive
power signal VAR(t) in Equation 19. This is the relationship
used to calculate reactive power in the ADE7754 for each phase.
The instantaneous reactive power signal VAR(t) is generated by
multiplying the current and voltage signals in each phase. In this
case, the phase of the current channel is shifted by –89º. The dc
component of the instantaneous reactive power signal in each
phase (A, B, and C) is then extracted by a low-pass filter to
obtain the reactive power information on each phase. In a
polyphase system, the total reactive power is simply the sum of
the reactive power in all active phases. The different solutions
available to process the total reactive power from the individual
calculation are discussed in the following section.
Figure 32 shows the signal processing in each phase for the
reactive power calculation in the ADE7754.
Since the phase shift applied on the current channel is not –90º
as it should be ideally, the reactive power calculation done in
the ADE7754 cannot be used directly for the reactive power
calculation. Consequently, using the ADE7754 reactive power
measurement only to get the sign of the reactive power is recommended. The reactive power can be processed using the
power triangle method.
REV. 0
–23–
Page 24

ADE7754
REACTIVE POWER
SIGNAL – P
I
HPF
V
–89
1
MULTIPLIER
24
LPF
INSTANTANEOUS REACTIVE
POWER SIGNAL – p(t)
28
Figure 32. Reactive Power Signal Processing
TOTAL REACTIVE POWER CALCULATION
The sum of the reactive powers coming from each phase gives
the total reactive power consumption. Different combinations
of the three phases can be selected in the sum by setting Bits 7
to 6 of the WATMode register (mnemonic WATMOD[1:0]).
Each term of the formula can be disabled or enabled by the
LWATSEL bits of the WATMode register. Note that in this
mode, the LWATSEL bits are also used to select the terms of
the LVAENERGY register. The different configurations are
described in Table III.
The accumulation of the reactive power in the LAENERGY
register is different from the accumulation of the active power in
the LAENERGY register. Under the same signal conditions
(e.g., current and voltage channels at full scale), and if the accumulation of the active power with PF = 1 over one second is
, and the accumulation of the reactive power with PF = 0
Wh
1
during that time is VARh
Note that I
*, IB*, and IC* represent the current channels
A
, then Wh1 = 9.546 VAR1.
1
samples after APGAIN correction, high-pass filtering, and –89º
phase shift in the case of reactive energy accumulation.
Reactive Energy Accumulation Selection
The ADE7754 accumulates the total reactive power signal in
the LAENERGY register for an integer number of half cycles,
as shown in Figure 31. This mode is selected by setting Bit 5 of
the WAVMode register (Address 0Ch) to Logic 1. When this bit
is set, the accumulation of the active energy over half line cycles
in the LAENERGY register is disabled and done instead in the
LVAENERGY register. In this mode, the accumulation of the
apparent energy over half line cycles in the LVAENERGY is no
longer available. See Figure 33.
ACTIVE POWER
REACTIVE POWER
APPARENT POWER
0
1
0
1
BIT 5 WAVMODE
REGISTER
LAENERGY
REGISTER
LVAENERGY
REGISTER
Figure 33. Selection of Reactive Energy Accumulation
The features of the reactive energy accumulation are the same as
for the line active energy accumulation: each one of three phases
zero-crossing detection can contribute to the accumulation of
the half line cycles. Phase A, B, and C zero crossings, respectively, are taken into account when counting the number of half
line cycles by setting to Logic 1 Bits 4 to 6 of the MMODE
register. Selecting phases for the zero-crossing counting also has
the effect of enabling the zero-crossing detection, zero-crossing
timeout, and period measurement for the corresponding phase
as described in the Zero-Crossing Detection section.
The number of half line cycles is specified in the LINCYC
register. LINCYC is an unsigned 16-bit register. The ADE7754
can accumulate active power for up to 65535 combined half
cycles. At the end of an energy calibration cycle, the LINCYC
flag in the interrupt status register is set. If the LINCYC enable
bit in the interrupt enable register is set to Logic 1, the IRQ
output also goes active low. Thus the IRQ line can also be used
to signal the end of a calibration.
As explained in the Reactive Power Calculation section, the
purpose of the reactive energy calculation in the ADE7754 is
not to give an accurate measurement of this value but to provide
the sign of the reactive energy. The ADE7754 provides an accurate measurement of the apparent energy. Because the active
energy is also measured in the ADE7754, a simple mathematical formula can be used to extract the reactive energy. The
evaluation of the sign of the reactive energy makes up the calculation of the reactive energy.
Reactive
sign Power Apparent Energy Active Energy
Energy
Reactive
=
×−()
22
APPARENT POWER CALCULATION
Apparent power is defined as the maximum active power that
can be delivered to a load.
Vrm
s and
s are the effective voltage
Irm
and current delivered to the load; the apparent power (AP) is
× I
defined as V
rms
rms
.
Note that the apparent power is equal to the multiplication of
the rms values of the voltage and current inputs. For a polyphase
system, the rms values of the current and voltage inputs of each
phase (A, B, and C) are multiplied to obtain the apparent power
information of each phase. The total apparent power is the sum
of the apparent powers of all the phases. The different solutions
available to process the total apparent power are discussed below.
Figure 34 illustrates the signal processing in each phase for the
calculation of the apparent power in the ADE7754.
I
rms
CURRENT RMS SIGNAL – i(t)
0.5V/GAIN1
1CF68Ch
00h
V
rms
VOLTAGE RMS SIGNAL –v(t)
0.5V/GAIN2
1CF68Ch
00h
24
MULTIPLIER
24
24
AVAG
APPARENT POWER
SIGNAL – P
D1B71h
12
Figure 34. Apparent Power Signal Processing
The apparent power is calculated with the current and voltage rms
values obtained in the rms blocks of the ADE7754. Figure 3
5
shows the maximum code (hexadecimal) output range of the
apparent power signal for each phase. Note that the output
range changes depending on the contents of the apparent power
gain registers and also on the contents of the active power gain
REV. 0–24–
Page 25

ADE7754
and voltage gain registers. See the Current RMS Calculation
and Voltage RMS Calculation sections. Only the effect of the
apparent power gain is shown on Figure 35. The minimum
output range is given when the apparent power gain register
content is equal to 800h and the maximum range is given by
writing 7FFh to the apparent power gain register. This can be
used to calibrate the apparent power (or energy) calculation
in the ADE7754 for each phase and the total apparent energy.
See the Total Apparent Power Calculation section.
APPARENT
POWER
13A929h
D1B71h
68DB9h
00000h
F97247h
F2E48Fh
EC56D7h
VOLTAGE CHANNEL AND
CURRENT CHANNEL 0.5V/GAIN
+ 150% FS
+ 100% FS
+ 50% FS
– 50% FS
– 100% FS
000h
7FFh
800h
– 150% FS
AVAGAIN[11:0]
Figure 35. Apparent Power Calculation Output Range
Apparent Power Offset Calibration
Each rms measurement includes an offset compensation register
to calibrate and eliminate the dc component in the rms value.
See the Current RMS Calculation and Voltage RMS Calculation
sections. The voltage and current rms values are then multiplied
in the apparent power signal processing. Because no additional
offsets are created in the multiplication of the rms values, there
is no specific offset compensation in the apparent power signal
processing. The offset compensation of the apparent power
measurement in each phase is done by calibrating each individual rms measurement.
TOTAL APPARENT POWER CALCULATION
The sum of the apparent powers coming from each phase gives
the total apparent power consumption. Different combinations
of the three phases can be selected in the sum by setting Bits 7
and 6 of the VAMode register (mnemonic VAMOD[1:0]). Figure 36
demonstrates the calculation of the total apparent power.
PHASE A
+
V
CRMS
+
RMS
RMS
RMS
RMS
RMS
RMS
%
V
2
V
ARMS
CRMS
24
24
AVAGAIN
24
BVAGAIN
CVAGAIN
TOTAL APPARENT
POWER SIGNAL
I
A
V
A
PHASE B
I
B
V
B
PHASE C
I
C
V
C
AAPGAIN
AVGAIN
BAPGAIN
BVGAIN
V
ARMS
CAPGAIN
CVGAIN
The total apparent power calculated by the ADE7754 depends on
the configuration of the VAMOD bits in the VAMode register.
Each term of the formula used can be disabled or enabled by the
setting VASEL bits, respectively, to Logic 0 or Logic 1 in the
VAMod
e
register. The different configurations are described in
Table IV.
Table IV. Total Apparent Power Calculation
VAMOD VASEL0 VASEL1 VASEL2
0d
1d
2d
Note that V
V
ARMS
V
ARMS
V
ARMS
ARMS
, V
× I
× I
× I
ARM
ARM
ARM
BRMS
S
S
S
, V
+
+(V
2 I
/
+
CRMS
V
V
BRMS
ARMS
BRM
ARMS
, I
ARMS
× I
+ V
S
× I
BRM
BRM
, I
S
CRMS
S
BRMS
+
)
+
+
, and I
V
V
V
CRMS
CRMS
CRMS
CRMS
×
I
CRMS
×
I
CRMS
×
I
CRMS
represent
the voltage and current channels RMS values of the corresponding
registers.
For example, for VAMOD = 1, the formula used to process the
apparent power is
AVAG
Total Apparent Power V I
+
+××+
VI
2
CRMS CRMS
+
VV
()
ARMS CRMS
=××+
ARMS ARMS
××+
I
BRMS
CVAG
1
1
12
2
BVAG
12
2
1
12
2
The polyphase meter configuration determines which formula
should be used to calculate the apparent energy. The American
ANSI C12.10 standard defines the different configurations of
the meter. Table V describes which mode should be chosen for
different configurations.
Table V. Meter Form Configuration
ANSI Meter Form VAMOD VASEL
5S/13S 3-wire Delta 0 3 or 5 or 6
6S/14S 4-wire Wye 1 7
8S/15S 4-wire Delta 2 7
9S/16S 4-wire Wye 0 7
Different gain calibration parameters are offered in the ADE7754
to cover the calibration of the meter in different configurations.
The APGAIN, VGAIN, and VAGAIN registers have different
purposes in the signal processing of the ADE7754. APGAIN
registers affect the apparent power calculation but should be
used only for active power calibration. VAGAIN registers are
used to calibrate the apparent power calculation. VGAIN registers have the same effect as VAGAIN registers when VAMOD =
0 or 2. They should be left at their default value in these modes.
VGAIN registers should be used to compensate gain mismatches
between channels in VAMOD = 1.
As mentioned previously, the offset compensation of the phase
apparent power calculation is done in each individual rms measurement signal processing. See the Apparent Power Offset
Calibration section.
REV. 0
Figure 36. Total Apparent Power Calculation
–25–
Page 26

ADE7754
APPARENT ENERGY CALCULATION
The apparent energy is given as the integral of the apparent
power.
Apparent Energy Apparent Power t dt=
∫
()
(21)
The ADE7754 achieves the integration of the apparent power
signal by continuously accumulating the apparent power signal
in an internal nonreadable 49-bit register. The apparent energy
register (VAENERGY[23:0]) represents the upper 24 bits of
this internal register. This discrete time accumulation or summa
tion is equivalent to integration in continuous time. Equation 22
expresses the relationship, where n is the discrete time sample
number and T is the sample period.
∞
Apparent Energy Lim Apparent Power nT T
=×
∑
T
→
0
n
=
0
()
(22)
The discrete time sample period (T) for the accumulation register in the ADE7754 is 1.2 µs (12/10 MHz).
Figure 37 shows a graphical representation of this discrete
time integration or accumulation. The apparent power signal
is continuously added to the internal register. This addition is
a signed addition even if the apparent energy theoretically
always remains positive.
VAENERGY[23:0]
TOTAL APPARENT POWER
T
D1B71h
00000h
APPARENT POWER
SIGNAL – P
TIME (nT)
23
48
VADIV
T
+
48
+
TOTAL APPARENT POWER IS
ACCUMULATED (INTEGRATED) IN
THE APPARENT ENERGY REGISTER
0
0
%
0
Figure 37. Apparent Energy Calculation
The upper 49-bit value of the internal register is divided by
VADIV. If the value in the VADIV register is 0, then the internal
active energy register is divided by 1. VADIV is an 8-bit unsigned
register. The upper 24-bit values are then written in the 24-bit
apparent energy register (VAENERGY[23:0]). RVAENERG
Y
register (24 bits long) is provided to read the apparent energy. This
register is reset to 0 after a read operation.
Figure 38 shows this apparent energy accumulation for full-scale
(sinusoidal) signals on the analog inputs. The three curves illustrate the minimum time it takes the energy register to roll over
when the individual VA gain registers contents all equal 3FFh,
000h, and 800h. The VA gain registers are used to carry out an
apparent power calibration in the ADE7754. The fastest integration time occurs when the VA gain registers are set to maximum
full scale (i.e., 3FFh).
VAENERGY[23:0]
7F,FFFFh
3F,FFFFh
00,0000h
40,0000h
80,0000h
65.5
131
196.5
262
TIME (sec)
327.5
393
AVAG = BVAG = CVAG = 3FFh
AVAG = BVAG = CVAG = 000h
AVAG = BVAG = CVAG = 800h
Figure 38. Energy Register Roll Over Time for FullScale Power (Minimum and Maximum Power Gain)
Note that the apparent energy register contents roll over to fullscale negative (80,0000h) and continue increasing in value when
the power or energy flow is positive, as shown in Figure 38. By
using the interrupt enable register, the ADE7754 can be configured to issue an interrupt (IRQ) when the apparent energy
register is half full (positive or negative).
Integration Times under Steady Load
As described in the preceding section, the discrete time sample
period (T) for the accumulation register is 1.2 µs (12/CLKIN).
With full-scale sinusoidal signals on the analog inputs and the
VA gain registers set to 000h, the average word value from each
apparent power stage is D1B71h. See the Apparent Power
Calculation section. The maximum value that can be stored in
the apparent energy register before it overflows is 22
FF,FFFFh. As the average word value is added to the internal
register that can store 24
8
– 1 or FFFF,FFFF,FFFFh before it
3
– 1 or
overflows, the integration time under these conditions with
VADIV = 0 is calculated as follows:
Time
FFFF FFFF FFFFh
DB h
×
3171
ss s=
×==
. min
12 131 2 11µ
,,
When VADIV is set to a value different from 0, the integration
time varies as shown in Equation 23.
Time Time VADIV
=×
WDIV
=0
(23)
LINE APPARENT ENERGY ACCUMULATION
The ADE7754 is designed with a special apparent energy accumulation mode that simplifies the calibration process. By using
the on-chip zero-crossing detection, the ADE7754 accumulates
the apparent power signal in the LVAENERGY register for an
integral number of half cycles, as shown in Figure 39. The line
apparent energy accumulation mode is always active.
Each of three zero-crossing detection phases can contribute to
the accumulation of the half line cycles. Phase A, B, and C zero
crossings are taken into account when counting the number of
half line cycles by setting Bits 4 to 6 of the MMODE register to
Logic 1. Selecting phases for the zero-crossing counting also has
the effect of enabling the zero-crossing detection, zero-crossing
timeout, and period measurement for the corresponding phase
as described in the zero-crossing detection paragraph.
REV. 0–26–
Page 27

ADE7754
MMODE
REGISTER BIT 4
FROM VA
ADC
FROM VB
ADC
FROM VC
ADC
LPF1
LPF1
LPF1
ZERO-CROSS
DETECT
MMODE
REGISTER BIT 5
ZERO-CROSS
DETECT
MMODE
REGISTER BIT 6
ZERO-CROSS
DETECT
ACCUMULATE APPARENT POWER
DURING LINCYC ZERO CROSSINGS
CALIBRATION
CONTROL
LINCYC[15:0]
Figure 39. Apparent Energy Calibration
The number of half line cycles is specified in the LINCYC unsigned
16-bit register. The ADE7754 can accumulate apparent power
for up to 65535 combined half cycles. Because the apparent
power is integrated on the same integral number of line cycles as
the line active energy register, these two values can be compared
easily. See the Energies Scaling section. The active and apparent
energy are calculated more accurately because of this precise
timing control and provide all the information needed for reactive
power and power factor calculation. At the end of an energy
calibration cycle, the LINCYC flag in the interrupt status register
is set. If the LINCYC enable bit in the interrupt enable register
is set to Logic 1, the IRQ output also goes active low. Thus the
IRQ line can also be used to signal the end of a calibration.
The total apparent power calculated by the ADE7754 in the
line accumulation mode depends on the configuration of the
VAMOD bits in the VAMode register. Each term of the formula
used can be disabled or enabled by the LVASEL bits of the
VAMode register. The different configurations are described in
Table VI.
Table VI. Total Line Apparent Energy Calculation
VAMOD VASEL0 VASEL1 VASEL2
0d
1d
2d
V
V
V
ARMS
ARMS
ARMS
× I
× I
× I
ARM
ARM
ARM
+ V
×
V
BRM
ARMS
I
BRM
ARMS
I
S
BRM
+
V
S
×
I
BRM
S
+(V
S
2 ×
/
+
S
S
CRMS
S
+ V
×
I
CRMS
CRM
S
)
+ V
×
I
CRMS
CRM
S
+ V
×
I
CRMS
CRM
S
The line apparent energy accumulation uses the same signal
path as the apparent energy accumulation. The LSB size of
these two registers is equivalent.
The ADE7754 accumulates the total reactive power signal in
the LAENERGY register. This mode is selected by setting to
Logic 1 Bit 5 of the WAVMode register (Address 0Ch). When
this bit is set, the accumulation of the active energy over half
line cycles in the LAENERGY register is disabled and done
instead in the LVAENERGY register. In this mode, the accu-
LVAENERGY[23:0]
APPARENT
POWER
PHASE A
APPARENT
POWER
PHASE B
APPARENT
POWER
PHASE C
23
48
VADIV
+
+
+
+
48
+
0
0
%
0
mulation of the apparent energy over half line cycles in the
LVAENERGY is no longer available. See Figure 33. Since the
LVAENERGY register is an unsigned value, the accumulation
of the active energy in the LVAENERGY register is unsigned.
In this mode (reactive energy), the selection of the phases
accumulated in the LAENERGY and LVAENERGY registers
done by the LWATSEL selection bits of the WATMode
is
.
register
ENERGIES SCALING
The ADE7754 provides measurements of the active, reactive,
and apparent energies. These measurements do not have the
same scaling and thus cannot be compared directly to each other.
Energy
Type PF = 1 PF = 0.707 PF = 0
ActiveWh Wh
Reactive0 Wh
ⴛ 0.707 0
ⴛ 0.707 / 9.546 Wh / 9.546
ApparentWh / 3.657 Wh / 3.657 Wh / 3.657
CHECK SUM REGISTER
The ADE7754 has a checksum register (CHECKSUM[5:0]) to
ensure that the data bits received in the last serial read operation
are not corrupted. The 6-bit checksum register is reset before
the first bit (MSB of the register to be read) is put on the
DOUT pin. During a serial read operation, when each data bit
becomes available on the rising edge of SCLK, the bit is added
to the checksum register. In the end of the serial read operation,
the content of the checksum register will equal the sum of all
ones in the register previously read. Using the checksum register, the user can determine whether an error has occurred during
the last read operation. Note that a read to the checksum register
also generates a checksum of the checksum register itself.
CONTENT OF REGISTER (n-BYTES)
DOUT
CHECKSUM
REGISTER
ADDR: 3Eh
Figure 40. Checksum Register for Serial Interface Read
REV. 0
–27–
Page 28

ADE7754
SERIAL INTERFACE
ADE7754 has a built-in SPI interface. The serial interface of
the ADE7754 is made of four signals: SCLK, DIN, DOUT,
and CS. The serial clock for a data transfer is applied at the
SCLK logic input, which has a Schmidt-trigger input structure
that allows slow rising (and falling) clock edges to be used. All
data transfer operations are synchronized to the serial clock.
Data is shifted into the ADE7754 at the DIN logic input on the
falling edge of SCLK. Data is shifted out of the ADE7754 at the
DOUT logic output on a rising edge of SCLK. The CS logic
input is the chip-select input. This input is used when multiple
devices share the serial bus. A falling edge on CS also resets the
serial interface and places the ADE7754 into communications
mode. The CS input should be driven low for the entire data
transfer operation. Bringing CS high during a data transfer
operation will abort the transfer and place the serial bus in a
high impedance state. The CS logic input may be tied low if the
ADE7754 is the only device on the serial bus. However, with
CS tied low, all initiated data transfer operations must be fully
completed (i.e., the LSB of each register must be transferred
because there is no other way to bring the ADE7754 back into
communications mode without resetting the entire device,
i.e., setting the RESET pin logic low).
All the ADE7754 functionality is accessible via several on-chip
registers. See Figure 41. The contents of these registers can be
updated or read using the on-chip serial interface. After poweron or toggling the RESET pin low, or a falling edge on CS, the
ADE7754 is placed into communications mode. In communications mode, the ADE7754 expects the first communication to
be a write to the internal communications register. The data
written to the communications register contains the address and
specifies the next data transfer to be a read or a write command.
Therefore all data transfer operations with the ADE7754,
whether read or write types, must begin with a write to the
communications register.
DIN
DOUT
COMMUNICATIONS REGISTER
REGISTER 1
REGISTER 2
REGISTER 3
REGISTER n-1
REGISTER n
OUT
OUT
OUT
OUT
OUT
IN
IN
IN
DECODE
REGISTER ADDRESS
IN
IN
Figure 41. Addressing ADE7754 Registers via the
Communications Register
The communications register is an 8-bit write-only register. The
MSB determines whether the next data transfer operation is a
read or a write. The six LSBs contain the address of the register
to be accessed. See the Communications Register section for a
more detailed description.
Figure 42 and Figure 43 show the data transfer sequences for a
read and write operation, respectively. On completion of a data
transfer (read or write), the ADE7754 once again enters communications mode (i.e., the next instruction followed must be a
write to the communications register).
CS
SCLK
COMMUNICATIONS REGISTER WRITE
DIN
DOUT
0 0
ADDRESS
MULTIBYTE READ DATA
Figure 42. Reading Data from the ADE7754 via the
Serial Interface
CS
SCLK
COMMUNICATIONS REGISTER WRITE
DIN
0
1
ADDRESS
MULTIBYTE WRITE DATA
Figure 43. Writing Data to the ADE7754 via the
Serial Interface
A data transfer is completed when the LSB of the ADE7754
register being addressed (for a write or a read) is transferred to
or from the ADE7754.
Serial Write Operation
The serial write sequence requires the following steps. With the
ADE7754 in communications mode and the CS input logic low,
a write to the communications register takes place. The MSB of
this byte transfer must be set to 1, indicating that the next data
transfer operation is a write to the register. The six LSBs of this
byte contain the address of the register to be written to. The
ADE7754 starts shifting in the register data on the next falling
edge of SCLK. All remaining bits of register data are shifted in
on the falling edge of subsequent SCLK pulses. See Figure 44.
As explained previously, the data write is initiated by a write to
the communications register, followed by the data. During a data
write operation to the ADE7754, data is transferred to all on-chip
registers one byte at a time. After a byte is transferred into the
serial port, there is a finite amount of time before the content of
the serial port buffer is transferred to one of the ADE7754 on-chip
registers. Although another byte transfer to the serial port can
start while the previous byte is being transferred to the destination register, this second byte transfer should not finish until at
least 1 µs after the end of the previous byte transfer. This func-
tionality is expressed in the timing specification t
. See Figure 44.
6
If a write operation is aborted during a byte transfer (CS brought
high), then that byte will not be written to the destination register.
Destination registers may be up to 3 bytes wide. See the Register
Descriptions section. Therefore, the first byte shifted into the
serial port at DIN is transferred to the MSB (most significant
byte) of the destination register. If the destination register is 12 bits
wide, for example, a 2-byte data transfer must take place. The
data is always assumed to be right justified; therefore, in this
case, the four MSBs of the first byte would be ignored and the four
LSBs of the first byte written to the ADE7754 would be the four
MSBs of the 12-bit word. Figure 45 illustrates this example.
REV. 0–28–
Page 29

CS
SCLK
DIN
t
1
SCLK
ADE7754
t
8
t
t
2
3
t
7
t
4
0
1
A5
A4
COMMAND BYTE
A3 A2
t
5
A1
A0
DB7
MOST SIGNIFICANT BYTE
t
7
DB0 DB7
Figure 44. Serial Interface Write Timing Diagram
t
6
DB0
LEAST SIGNIFICANT BYTE
DB10
DB9
DIN
X
MOST SIGNIFICANT BYTE
XX
DB11
X
DB8
Figure 45. 12-Bit Serial Write Operation
Serial Read Operation
During a data read operation from the ADE7754, data is shifted
out at the DOUT logic output on the rising edge of SCLK. As
was the case with the data write operation, a data read must be
preceded by a write to the communications register.
With the ADE7754 in communications mode and CS logic low,
an 8-bit write to the communications register first takes place.
The MSB of this byte transfer must be a 0, indicating that the
next data transfer operation is a read. The six LSBs of this byte
contain the address of the register to be read. The ADE7754
starts shifting out of the register data on the next rising edge of
SCLK. See Figure 46. At this point, the DOUT logic output
switches from high impedance state and starts driving the data
bus. All remaining bits of register data are shifted out on subsequent
SCLK rising edges. The serial interface enters
CS
SCLK
t
1
communications
t
9
DB7
DB5
DB6
DB4
LEAST SIGNIFICANT BYTE
DB3
DB2
DB1
DB0
mode again as soon as the read has been completed. The DOUT
logic output enters a high impedance state on the falling edge of
the last SCLK pulse. The read operation may be aborted by
bringing the CS logic input high before the data transfer is completed. The DOUT output enters a high impedance state on the
rising edge of CS.
When an ADE7754 register is addressed for a read operation,
the entire contents of that register are transferred to the serial
port. This allows the ADE7754 to modify its on-chip registers
without the risk of corrupting data during a multibyte transfer.
Note that when a read operation follows a write operation, the
read command (i.e., write to communications register) should
not happen for at least 1 µs after the end of the write operation.
If the read command is sent within 1 µs of the write operation,
the last byte of the write operation may be lost.
t
10
REV. 0
DIN
DOUT
A4
A5
0
0
COMMAND BYTE
A2
A3
A0
A1
t
t
t
11
DB7
MOST SIGNIFICANT BYTE
12
DB0
DB7
LEAST SIGNIFICANT BYTE
13
DB0
Figure 46. Serial Interface Read Timing Diagram
–29–
Page 30

ADE7754
INTERRUPTS
ADE7754 interrupts are managed through the interrupt status
register (STATUS[15:0], Address 10h) and the interrupt enable
register (IRQEN[15:0], Address 0Fh). When an interrupt event
occurs in the ADE7754, the corresponding flag in the interrupt
status register is set to Logic 1. See the Interrupt Status Register
section. If the enable bit for this interrupt in the interrupt enable
register is Logic 1, then the IRQ logic output goes active low.
The flag bits in the interrupt status register are set irrespective
of the state of the enable bits. In order to determine the source
of the interrupt, the system master (MCU) should perform a
read from the reset interrupt status register with reset. This is
achieved by carrying out a read from Address 11h. The IRQ
output goes logic high on completion of the interrupt status
register read command. See the Interrupt Timing section. When
carrying out a read with reset, the ADE7754 is designed to
ensure that no interrupt events are missed. If an interrupt event
occurs just as the interrupt status register is being read, the
event will not be lost and the IRQ logic output is guaranteed
to
go high for the duration of the interrupt status register data
transfer before going logic low again to indicate the pending
interrupt
.
Using Interrupts with an MCU
The timing diagram in Figure 47 illustrates a suggested implementation of ADE7754 interrupt management using an MCU.
At time t
, the IRQ line goes active low indicating that one or
1
more interrupt events have occurred. The IRQ logic output
should be tied to a negative edge triggered external interrupt on
the MCU. On detection of the negative edge, the MCU should
t
1
t
2
be configured to start executing its interrupt service routine
(ISR). On entering the ISR, all interrupts should be disabled
using the global interrupt enable bit. At this point the MCU
external interrupt flag can be cleared in order to capture interrupt events that occur during the current ISR. When the MCU
interrupt flag is cleared, a read from the reset interrupt status
register with reset is carried out. This causes the IRQ line to be
reset logic high (t
). See the Interrupt Timing section. The reset
2
interrupt status register contents are used to determine the
source of the interrupt(s) and therefore the appropriate action to
be taken. If a subsequent interrupt event occurs during the ISR
), that event will be recorded by the MCU external interrupt
(t
3
flag being set again. On returning from the ISR, the global
interrupt enable bit will be cleared (same instruction cycle) and
the external interrupt flag will cause the MCU to jump to its
ISR once again. This will ensure that the MCU does not miss
any external interrupts.
Interrupt Timing
The Serial Interface section should be reviewed first before
reviewing interrupt timing. As previously described, when the
IRQ output goes low, the MCU ISR must read the interrupt
status register in order to determine the source of the interrupt.
When reading the interrupt status register contents, the IRQ
output is set high on the last falling edge of SCLK of the first
byte transfer (read interrupt status register command). The IRQ
output is held high until the last bit of the next 8-bit transfer is
shifted out (interrupt status register contents). See Figure 48. If
an interrupt is pending at this time, the IRQ output will go low
again. If no interrupt is pending, the IRQ output will remain high.
MCU
INT. FLAG SET
t
3
IRQ
PROGRAM
SEQUENCE
SCLK
DOUT
IRQ
CS
DIN
JUMP TO
ISR
GLOBAL
INTERRUPT
MASK
t
1
0
0
READ STATUS REGISTER COMMAND
CLEAR MCU
INTERRUPT
0
FLAG
1
READ
STATUS WITH
RESET (11h)
ISR ACTION
(BASED ON STATUS CONTENTS)
Figure 47. Interrupt Management
t
9
0
0
0
1
t
11
DB15
STATUS REGISTER CONTENTS
Figure 48. Interrupt Timing
ISR RETURN
GLOBAL INTERRUPT
MASK RESET
t
12
DB8
DB7
DB0
JUMP TO
ISR
REV. 0–30–
Page 31

ADE7754
ACCESSING THE ADE7754 ON-CHIP REGISTERS
All ADE7754 functionality is accessed via the on-chip registers.
Each register is accessed by first writing to the communications
register, then transferring the register data. For a full description
of the serial interface protocol, see the Serial Interface section.
Communications Register
The communications register is an 8-bit, write-only register that
controls the serial data transfer between the ADE7754 and the
host processor. All data transfer operations must begin with a
write to the communications register. The data written to the
communications register determines whether the next operation
is a read or a write and which register is being accessed. Table VII
outlines the bit designations for the communications register.
Table VII. Communications Register
Bit Bit
Location Mnemonic Description
0 to 5 A0 to A5 The six LSBs of the communications register specify the register for the data transfer operation.
Table VIII lists the address of each ADE7754 on-chip register.
6 RESERVED This bit is unused and should be set to 0.
7W/R When this bit is a Logic 1, the data transfer operation immediately following the write to the com-
munications register will be interpreted as a write to the ADE7754. When this bit is a Logic 0, the
data transfer operation immediately following the write to the communications register will be
interpreted as a read operation.
DB0
DB1
DB2
DB3
DB4
DB5
DB6
DB7
A0
A1
A2
A3
A4
A5
W/R
0
REV. 0
–31–
Page 32

ADE7754
Table VIII. Register List
Address Default
[A5:A0] Name R/W* Length Value Description
00h Reserved Reserved.
01h AENERGY R 24 0 Active Energy Register. Active power is accumulated over time in an inter-
nal register. The AENERGY register is a read-only register that reads this
internal register and can hold a minimum of 88 seconds of active energy
information with full-scale analog inputs before it overflows. See the Energy
Calculation section. Bits 7 to 3 of the WATMODE register determine how
the active energy is processed from the six analog inputs. See Table XIV.
02h RAENERGY R 24 0 Same as the AENERGY register, except that the internal register is reset
to 0 following a read operation.
03h LAENERGY R 24 0
04h VAENERGY R 24 0 VA Energy Register. Apparent power is accumulated over time in this
05h RVAENERGY R 24 0 Same as the VAENERGY register except that the register is reset to 0
06h LVAENERGY R 24 0 Apparent Energy Register. The instantaneous apparent power is accu-
07h PERIOD R 15 0 Period of the line input estimated by zero-crossing processing. Data Bit 0
08h TEMP R 8 0 Temperature Register. This register contains the result of the latest
09h WFORM R 24 0 Waveform Register. This register contains the digitized waveform of one
0Ah OPMODE R/W 8 4 Operational Mode Register. This register defines the general configuration
0Bh MMODE R/W 8 70h Measurement Mode Register. This register defines the channel used for
0Ch WAVMODE R/W 8 0 Waveform mode register. This register defines the channel and sampling
0Dh WATMODE R/W 8 3Fh This register configures the formula applied for the active energy and
0Eh VAMODE R/W 8 3Fh This register configures the formula applied for the apparent energy and
0Fh IRQEN R/W 16 0 IRQ Enable Register. It determines whether an interrupt event will
10h STATUS R 16 0 IRQ Status Register. This register contains information regarding the
11h RSTATUS R 16 0 Same as the status register, except that its contents are reset to 0 (all
12h ZXTOUT R/W 16 FFFFh Zero Cross Timeout Register. If no zero crossing is detected within a
Line Accumulation Active Energy Register. The instantaneous active power is
accumulated in this read-only register over the LINCYC number of half line
cycles. Bits 2 to 0 of the WATMODE register determine how the line accumulation active energy is processed from the six analog inputs. See Table XIV.
read-only register. Bits 7 to 3 of the VAMODE register determine how the
apparent energy is processed from the six analog inputs. See Table XV.
following a read operation.
mulated in this read-only register over the LINCYC number of half line
cycles. Bits 2 to 0 of the VAMODE register determine how the apparent
energy is processed from the six analog inputs. See Table XV.
and 1 and 4 to 6 of the MMODE register determine the voltage channel
used for period calculation. See Table XII.
temperature conversion. Refer to the Temperature Measurement section
for details on how to interpret the content of this register.
of the six analog inputs. The source is selected by Data Bits 0 to 2 in the
WAVMode register. See Table XIII.
of the ADE7754. See Table IX.
period and peak detection measurements. See Table XII.
frequency used in waveform sampling mode. See Table XIII.
line active energy measurements. See Table XIV.
line apparent energy measurements. See Table XV.
generate an active low output at IRQ pin. See Table XVI.
source of ADE7754 interrupts. See Table XVII.
flags cleared) after a read operation.
time period specified by this register, the interrupt request line (IRQ)
will go active low for the corresponding line voltage. The maximum
timeout period is 2.3 seconds. See the Zero-Crossing Detection section.
REV. 0–32–
Page 33

ADE7754
Table VIII. Register List (continued)
Address Default
[A5:A0] Name R/W* Length Value Description
13h LINCYC R/W 16 FFFFh
14h SAGCYC R/W 8 FFh SAG Line Cycle Register. This register specifies the number of consecutive half
15h SAGLVL R/W 8 0 SAG Voltage Level. This register specifies the detection threshold for
16h VPEAK R/W 8 FFh Voltage Peak Level. This register sets the level of the voltage peak
17h IPEAK R/W 8 FFh
18h GAIN R/W 8 0 PGA Gain Register. This register is used to adjust the gain selection for
19h AWG R/W 12 0
1Ah BWG R/W 12 0 Phase B Active Power Gain.
1Bh CWG R/W 12 0 Phase C Active Power Gain.
1Ch AVAG R/W 12 0 VA Gain Register. This register calculation can be calibrated by writing
1Dh BVAG R/W 12 0 Phase B VA Gain.
1Eh CVAG R/W 12 0 Phase C VA Gain.
1Fh APHCAL R/W 5 0 Phase A Phase Calibration Register.
20h BPHCAL R/W 5 0 Phase B Phase Calibration Register.
21h CPHCAL R/W 5 0 Phase C Phase Calibration Register.
22h AAPOS R/W 12 0 Phase A Power Offset Calibration Register.
23h BAPOS R/W 12 0 Phase B Power Offset Calibration Register.
24h CAPOS R/W 12 0 Phase C Power Offset Calibration Register.
25h CFNUM R/W 12 0h CF Scaling Numerator Register. The content of this register is used in
26h CFDEN R/W 12 3Fh CF Scaling Denominator Register. The content of this register is used in
27h WDIV R/W 8 0 Active Energy Register Divider.
28h VADIV R/W 8 0 Apparent Energy Register Divider.
29h AIrms R 24 0 Phase A Current Channel RMS Register. The register contains the rms
2Ah BIrms R 24 0 Phase B Current Channel RMS Register.
2Bh CIrms R 24 0 Phase C Current Channel RMS Register.
2Ch AVrms R 24 0 Phase A Voltage Channel RMS Register.
2Dh BVrms R 24 0 Phase B Voltage Channel RMS Register.
2Eh CVrms R 24 0 Phase C Voltage Channel RMS Register.
2Fh AIrmsOS R/W 12 0 Phase A Current RMS Offset Correction Register.
30h BIrmsOS R/W 12 0 Phase B Current RMS Offset Correction Register.
REV. 0
Line Cycle Register. The content of this register sets the number of half line
cycles while the active energy and the apparent energy are accumulated in the
LAENERGY and LVAENERGY registers. See the Energy Calculation section.
l
ine cycles where voltage channel input falls below a threshold level. This regis-
ter is common to the three-line voltage SAG detection. The detection threshold
s specified by SAGLVL register. See the Line Voltage SAG Detection section.
i
SAG event. This register is common to the three-line voltage SAG
detection. See the description of SAGCYC register for details.
detection. If the selected voltage phase exceeds this level, the PKV flag
in the status register is set. See Table XII.
Current Peak Level. This register sets the level of the current peak detection. If the selected current phase exceeds this level, the PKI flag in the
status register is set. See Table XII.
the PGA in current and voltage channels. See the Analog Inputs section
and Table X. This register is also used to configure the active energy
accumulation no-load threshold and sum of absolute values.
Phase A Active Power Gain Register. The active power caluation for Phase A
can be calibrated by writing to this register. The calibration range is 50%
of the nominal full-scale active power. The resolution of the gain adjust is
0.0244%/LSB.
this register. The calibration range is 50% of the nominal full-scale real
power. The resolution of the gain adjust is 0.02444%/LSB.
the numerator of CF output scaling.
the denominator of CF output scaling.
component of one input of the current channel. The source is selected
by data bits in the mode register.
–33–
Page 34

ADE7754
Table VIII. Register List (continued)
Address Default
[A5:A0] Name R/W* Length Value Description
31h CIrmsOS R/W 12 0 Phase C Current RMS Offset Correction Register.
32h AVrmsOS R/W 12 0 Phase A Voltage RMS Offset Correction Register.
33h BVrmsOS R/W 12 0 Phase B Voltage RMS Offset Correction Register.
34h CVrmsOS R/W 12 0 Phase C Voltage RMS Offset Correction Register.
35h AAPGAIN R/W 12 0 Phase A Active Power Gain Adjust. The active power accumulation of the
Phase A can be calibrated by writing to this register. The calibration range
is ±50% of the nominal full scale of the active power. The resolution of the
gain is 0.0244%/LSB. See the Current Channel ADC Gain Adjust section.
36h BAPGAIN R/W 12 0 Phase B Active Power Gain Adjust.
37h CAPGAIN R/W 12 0 Phase C Active Power Gain Adjust.
38h AVGAIN R/W 12 0 Phase A Voltage RMS Gain. The apparent power accumulation of the
Phase A can be calibrated by writing to this register. The calibration
range is ±50% of the nominal full scale of the apparent power. The
resolution of the gain is 0.0244% / LSB. See the Voltage RMS Gain
Adjust section.
39h BVGAIN R/W 12 0 Phase B Voltage RMS Gain.
3Ah CVGAIN R/W 12 0 Phase C Voltage RMS Gain.
3Bh– Reserved.
3Dh
3Eh CHKSUM R 8 Check Sum Register. The content of this register represents the sum of
all 1s of the latest register read from the SPI port.
3Fh VERSION R 8 1 Version of the Die.
*R/W: Read/Write capability of the register.
R: Read-only register.
R/W: Register that can be both read and written.
REV. 0–34–
Page 35

ADE7754
Operational Mode Register (0Ah)
The general configuration of the ADE7754 is defined by writing to the OPMODE register. Table IX summarizes the functionality of
each bit in the OPMODE register.
Table IX. OPMODE Register
Bit Bit Default
Location Mnemonic Value Description
0 DISHPF 0 The HPFs (high-pass filters) in all current channel inputs are disabled when this bit is set.
1 DISLPF 0 The LPFs (low-pass filters) in all current channel inputs are disabled when this bit is set.
2 DISCF 1 The frequency output CF is disabled when this bit is set.
3-5 DISMOD 0 By setting these bits, ADE7754’s A/D converters can be turned off. In normal operation, these
bits should be left at Logic 0.
DISMOD2 DISMOD1 DISMOD0
000Normal operation.
100Normal operation. By setting this bit to Logic 1, the analog
inputs to current channel are connected to the ADC for voltage
channel and the analog inputs to voltage channel are connected
to the ADC for current channel.
001Current channel A/D converters off.
101Current channel A/D converters off + channels swapped.
010Voltage Channel A/D converters off.
110Voltage Channel A/D converters off + channels swapped.
011ADE7754 in sleep mode.
111ADE7754 powered down.
6SWRST 0 Software Chip Reset. A data transfer to the ADE7754 should not take place for at least 18 µs
after a software reset.
7 RESERVED This is intended for factory testing only and should be left at 0.
REV. 0
–35–
Page 36

ADE7754
Gain Register (18h)
The gain of the analog inputs and the mode of accumulation of the active energies in the ADE7754 are defined by writing to the gain
register. Table X summarizes the functionality of each bit in the gain register.
Table X. GAIN Register
Bit Bit Default
Location Mnemonic Value Description
0-1 PGA1 0 These bits are used to select the gain of the current channels inputs.
Bit 1 Bit 0
00PGA1 = 1
01PGA1 = 2
10PGA1 = 4
00Reserved
2 ABS 0 The sum of the absolute active energies is done in the ANERGY and LAENERGY registers
when this bit is set to Logic 1. The regular sum is done when this bit is set to Logic 0—
default mode.
3 NO LOAD 0The active energy of each phase is not accumulated in the total active energy registers if the
instantaneous active power is lower than the no-load threshold when this bit is set to Logic 0;
this mode is selected by default.
4 RESERVED This is intended for factory testing only and should be left at 0.
5-6 PGA2 0 These bits are used to select the gain of the voltage channels inputs.
Bit 6 Bit 5
00PGA2 = 1
01PGA2 = 2
10PGA2 = 4
00Reserved
7 RESERVED This is intended for factory testing only and should be left at 0.
CFNUM Register (25h)
The CF scaling numerator and the sign of the active energy per phase are defined by writing/reading to the CFNUM register.
Table XI summarizes the functionality of each bit in the CFNUM register.
Table XI. CFNUM Register
Bit Bit Default
Location Mnemonic Value Description
0-Bh CFN 0 CF Scaling Numerator Register. The content of this register is used in the numerator of CF
output scaling.
Ch NEGA 0 The sign of the Phase A instantaneous active power is available in this bit. Logic 0 and Logic 1
correspond to positive and negative active power, respectively. The functionality of this bit is
enabled by setting Bit 5 of the WATMode register to Logic 1. When disabled, NEGA is equal
to its default value.
Dh NEGB 0 The sign of the Phase B instantaneous active power is available in this bit. Logic 0 and Logic 1
correspond to positive and negative active power, respectively. The functionality of this bit is
enabled by setting Bit 4 of the WATMode register to Logic 1. When disabled, NEGB is equal
to its default value.
Eh NEGC 0 The sign of the Phase C instantaneous active power is available in this bit. Logic 0 and Logic 1
correspond to positive and negative active power, respectively. The functionality of this bit is
enabled by setting Bit 3 of the WATMode register to Logic 1. When disabled, NEGC is equal
o its default value.
Fh RESERVED
REV. 0–36–
Page 37

ADE7754
Measurement Mode Register (0Bh)
The configuration of the period and peak measurements made by the ADE7754 are defined by writing to the MMODE register.
Table XII summarizes the functionality of each bit in the MMODE register.
Table XII. MMODE Register
Bit Bit Default
Location Mnemonic Value Description
0-1 PERDSEL 0 These bits are used to select the source of the measurement of the voltage line period.
Bit 1 Bit 0 Source
00Phase A
01Phase B
10Phase C
11Reserved
2-3 PEAKSEL 0 These bits select the line voltage and current phase used for the PEAK detection. If the
selected line voltage is above the level defined in the PKVLVL register, the PKV flag in the
interrupt status register is set. If the selected current input is above the level defined in the
PKILVL register, the PKI flag in the interrupt status register is set.
Bit 3 Bit 2 Source
00Phase A
01Phase B
10Phase C
11Reserved
4-6 ZXSEL 7 These bits select the phases used for counting the number of zero crossing in the line active
and apparent accumulation modes as well as enabling these phases for the zero-crossing
timeout detection, zero crossing, period measurement, and SAG detection. Bits 4, 5, and 6
select Phase A, Phase B, and Phase C, respectively.
7 Reserved.
Waveform Mode Register (0Ch)
The waveform sampling mode of the ADE7754 is defined by writing to the WAVMODE register. Table XIII summarizes the functionality of each bit in the WAVMODE register.
Table XIII. WAVMODE Register
Bit Bit Default
Location Mnemonic Value Description
0-2 WAVSEL 0 These bits are used to select the source of the waveform sample.
Bit 2 Bit 1 Bit 0 Source
0 00Voltage Phase A
0 01Voltage Phase B
0 10Voltage Phase C
0 11Current Phase A
1 00Current Phase B
1 01Current Phase C
110 or 1 Reserved
3-4 DTRT 0 These bits are used to select the waveform sampling update rate.
Bit 4 Bit 3 Update Rate
0026.0 kSPS (CLKIN/3/128)
0113.0 kSPS (CLKIN/3/256)
106.5 kSPS (CLKIN/3/512)
113.3 kSPS (CLKIN/3/1024)
5 LVARSEL 0 This bit is used to enable the accumulation of the line VAR energy into the LAENERGY register
and of the line active energy into the LVAENERGY register.
REV. 0
–37–
Page 38

ADE7754
Watt Mode Register (0Dh)
The phases involved in the active energy measurement of the ADE7754 are defined by writing to the WATMODE register. Table XIV
summarizes the functionality of each bit in the WATMODE register.
Table XIV. WATMODE Register
Bit Bit Default
Location Mnemonic Value Description
0-2 LWATSEL 7 These bits are used to select each part of the formula separately, depending on the line active
energy measurement method. The behavior of these bits is the same as WATSEL bits. Bit 2
selects the first term of the formula and so on.
3-5 WATSEL 7 These bits are used to select each part of the formula separately, depending on the active
energy measurement method. These bits are also used to enable the negative power detection
available in Bits 12 to 14 of CFNUM register. See Table XI. Setting Bit 5 to Logic 1 selects
the first term of the formula (VA IA or VA (IA – IB)). Setting Bit 4 to Logic 1 selects the
second term of the formula (VB IB or 0 depending on WATMOD configuration). Setting
Bit 3 to Logic 1 selects the last term of the formula (VC IC or VC (IC – IB)). Any combi-
nation of these bits can address calibration and operational needs.
6-7 WATM 0 These bits are used to select the formula used for active energy calculation.
WATM1 WAVM0 Active Energy Calculation
00VA IA + VB IB + VC IC
01VA (IA – IB) + 0 + VC (IC – IB)
10VA (IA – IB) + 0 + VC IC
11Reserved.
VA Mode Register (0Eh)
The phases involved in the apparent energy measurement of the ADE7754 are defined by writing to the VAMODE register. Table XV
summarizes the functionality of each bit in the VAMODE register.
Table XV. VAMODE Register
Bit Bit Default
Location Mnemonic Value Description
0-2 LVASEL 7 These bits are used to select each part of the formula separately, depending on the line appar-
ent energy measurement method. The behavior of these bits is the same as VASEL bits. Bit 2
selects the first term of the formula, and so on.
3-5 VASEL 7 These bits are used to select separately each part of the formula, depending on the apparent
energy measurement method. Setting Bit 5 to Logic 1 selects the first term of the formula
(VA
IA
rms
or (VA
Bit 3 to Logic 1 selects the first term of the formula (VC
). Setting Bit 4 to Logic 1 selects the second term of the formula (VB
rms
+VC
rms
)/2 IB
rms
or VA
rms
rms
IB
depending on VAMOD configuration). Setting
rms
rms
IC
). Any combination of these
rms
rms
IB
rms
bits can address calibration and operational needs.
6-7 VAMOD 0 These bits are used to select the formula used for active energy calculation.
VAMOD1 VAMOD0 Apparent Energy Calculation
00VA
01VA
10VA
rms
rms
rms
IA
IA
IA
rms
rms
rms
+ VB
+ (VA
+ VA
rms
rms
IB
rms
IB
rms
+ VC
rms
rms
+ VC
)/2 IB
+ VC
rms
rms
IC
rms
IC
rms
+ VC
rms
rms
IC
rms
11Reserved.
REV. 0–38–
Page 39

ADE7754
Interrupt Enable Register (0Fh)
When an interrupt event occurs in the ADE7754, the IRQ logic output goes active low if the enable bit for this event is Logic 1 in this
register. The IRQ logic output is reset to its default collector open state when the RSTATUS register is read. Table XVI describes the
function of each bit in the interrupt enable register.
Table XVI. IRQEN Register
Bit Interrupt Default
Location Flag Value Description
0 AEHF 0 Enables an interrupt when there is a 0 to 1 transition of the MSB of the AENERGY register
(i.e., the AENERGY register is half-full).
1 SAGA 0 Enables an interrupt when there is a SAG on the line voltage of the Phase A.
2 SAGB 0 Enables an interrupt when there is a SAG on the line voltage of the Phase B.
3 SAGC 0 Enables an interrupt when there is a SAG on the line voltage of the Phase C.
4 ZXTOA 0 Enables an interrupt when there is a zero-crossing timeout detection on Phase A.
5 ZXTOB 0 Enables an interrupt when there is a zero-crossing timeout detection on Phase B.
6 ZXTOC 0 Enables an interrupt when there is a zero-crossing timeout detection on Phase C.
7 ZXA 0 Enables an interrupt when there is a rising zero crossing in voltage channel of the Phase A—
zero-crossing detection.
8 ZXB 0 Enables an interrupt when there is a rising zero crossing in voltage channel of the Phase B—
zero-crossing detection.
9 ZXC 0 Enables an interrupt when there is a rising zero crossing in voltage channel of the Phase C—
zero-crossing detection.
Ah LENERGY 0 Enables an interrupt when the LAENERGY and LVAENERGY accumulations over LINCYC
are finished.
Bh Reserved.
Ch PKV 0 Enables an interrupt when the voltage input selected in the MMODE register is above the
value in the PKVLVL register.
Dh PKI 0 Enables an interrupt when the current input selected in the MMODE register is above the
value in the PKILVL register.
Eh WFSM 0 Enables an interrupt when a data is present in the waveform register.
Fh VAEHF 0 Enables an interrupt when there is a 0 to 1 transition of the MSB of the VAENERGY register
(i.e., the VAENERGY register is half full).
F
0
(APPARENT ENERGY REGISTER HALF FULL)
(NEW WAVEFORM SAMPLE READY)
(CURRENT CHANNEL PEAK DETECTION)
(VOLTAGE CHANNEL PEAK DETECTION)
(END OF THE LAENERGY AND LVAENERGY ACCUMULATION)
VAEHF
WFSM
LENERGY
REV. 0
PKI
PKV
INTERRUPT ENABLE REGISTER*
C
D
E
0
0
0
RESERVED
*REGISTER CONTENTS SHOW POWER-ON DEFAULTS
A
B
0
0
0
0
8
9
6
7
0
0
–39–
4
5
0
0
2
3
0
0
0
1
0
0
ADDR: 0Fh
AEHF
(ACTIVE ENERGY REGISTER HALF FULL)
SAG
(SAG EVENT DETECT)
ZX
(ZERO-CROSSING TIMEOUT DETECTION)
ZX
(ZERO-CROSSING DETECTION)
Page 40

ADE7754
Interrupt Status Register (10h)/Reset Interrupt Status Register (11h)
The interrupt status register is used to determine the source of an interrupt event. When an interrupt event occurs in the ADE7754,
the corresponding flag in the interrupt status register is set logic high. The IRQ pin will go active low if the corresponding bit in the
interrupt enable register is set logic high. When the MCU services the interrupt, it must first carry out a read from the interrupt status register to determine the source of the interrupt. All the interrupts in the interrupt status register stay at their logic high state after
an event occurs. The state of the interrupt bit in the interrupt status register is reset to its default value once the reset interrupt status
register is read.
Table XVII. STATUS Register
Bit Interrupt Default Event
Location Flag Value Description
0 AEHF 0 Indicates that an interrupt was caused by the 0 to 1 transition of the MSB of the AENERGY
register (i.e., the AENERGY register is half full).
1 SAGA 0 Indicates that an interrupt was caused by a SAG on the line voltage of the Phase A.
2 SAGB 0 Indicates that an interrupt was caused by a SAG on the line voltage of the Phase B.
3 SAGC 0 Indicates that an interrupt was caused by a SAG on the line voltage of the Phase C.
4 ZXTOA 0 Indicates that an interrupt was caused by a missing zero crossing on the line voltage of the Phase A.
5 ZXTOB 0 Indicates that an interrupt was caused by a missing zero crossing on the line voltage of the Phase B.
6 ZXTOC 0 Indicates that an interrupt was caused by a missing zero crossing on the line voltage of the Phase C.
7 ZXA 0 Indicates a detection of rising zero crossing in the voltage channel of the Phase A.
8 ZXB 0 Indicates a detection of rising zero crossing in the voltage channel of the Phase B.
9 ZXC 0 Indicates a detection of rising zero crossing in the voltage channel of the Phase C.
Ah LENERGY 0 In line energy accumulation, it indicates the end of an integration over an integer number of
half line cycles (LINCYC). See the Energy Calculation section.
Bh RESET 0 Indicates that the ADE7754 has been reset.
Ch PKV 0 Indicates that an interrupt was caused when the selected voltage input is above the value in the
PKVLV register.
Dh PKI 0 Indicates that an interrupt was caused when the selected current input is above the value in the
PKILV register.
Eh WFSM 0 Indicates that new data is present in the waveform register.
Fh VAEHF 0 Indicates that an interrupt was caused by the 0 to 1 transition of the MSB of the VAENERGY
register (i.e., the VAENERGY register is half full).
F
0
(APPARENT ENERGY REGISTER HALF FULL)
(NEW WAVEFORM SAMPLE READY)
(CURRENT CHANNEL PEAK DETECTION)
(VOLTAGE CHANNEL PEAK DETECTION)
(END OF THE LAENERGY AND LVAENERGY ACCUMULATION)
VAEHF
WFSM
PKI
PKV
LENERGY
INTERRUPT STATUS REGISTER*
8
9
C
D
E
0
0
0
RESET
*REGISTER CONTENTS SHOW POWER-ON DEFAULTS
A
B
0
0
0
7
0
0
4
5
6
0
0
0
2
3
0
0
0
1
0
0
ADDR: 10h
AEHF
(ACTIVE ENERGY REGISTER HALF FULL)
SAG
(SAG EVENT DETECT)
ZX
(ZERO-CROSSING TIMEOUT DETECTION)
ZX
(ZERO-CROSSING DETECTION)
REV. 0–40–
Page 41

OUTLINE DIMENSIONS
24-Lead Standard Small Outline Package [SOIC]
Wide Body
(RW-24)
Dimensions shown in millimeters and (inches)
15.60 (0.6142)
15.20 (0.5984)
ADE7754
24 13
1
0.30 (0.0118)
0.10 (0.0039)
COPLANARITY
0.10
1.27 (0.0500)
BSC
CONTROLLING DIMENSIONS ARE IN MILLIMETERS; INCH DIMENSIONS
(IN PARENTHESES) ARE ROUNDED-OFF MILLIMETER EQUIVALENTS FOR
REFERENCE ONLY AND ARE NOT APPROPRIATE FOR USE IN DESIGN
COMPLIANT TO JEDEC STANDARDS MS-013AD
0.51 (0.020)
0.33 (0.013)
7.60 (0.2992)
7.40 (0.2913)
12
2.65 (0.1043)
2.35 (0.0925)
SEATING
PLANE
10.65 (0.4193)
10.00 (0.3937)
0.32 (0.0126)
0.23 (0.0091)
0.75 (0.0295)
0.25 (0.0098)
8
0
45
1.27 (0.0500)
0.40 (0.0157)
REV. 0
–41–
Page 42

–42–
Page 43

–43–
Page 44

C02677–0–5/03(0)
–44–
 Loading...