

Page 1
Dual 12-/14-/16-Bit,1 GSPS,
FEATURES
Low power: 1.0 W @ 1 GSPS, 600 mW @ 500 MSPS,
full operating conditions
Single carrier W-CDMA ACLR = 7 dBc @ 80 MHz IF
Analog output: adjustable 8.7 mA to 31.7 mA,
R
= 25 Ω to 50 Ω
L
Novel 2×, 4×, and 8× interpolator/coarse complex modulator
allows carrier placement anywhere in DAC bandwidth
Auxiliary DACs allow control of external VGA and offset control
Multiple chip synchronization interface
High performance, low noise PLL clock multiplier
Digital inverse sinc filter
100-lead, exposed paddle TQFP
APPLICATIONS
Wireless infrastructure
W-CDMA, CDMA2000, TD-SCDMA, WiMax, GSM
Digital high or low IF synthesis
Internal digital upconversion capability
Transmit diversity
Wideband communications: LMDS/MMDS, point-to-point
Digital-to-Analog Converters
AD9776A/AD9778A/AD9779A
GENERAL DESCRIPTION
The AD9776A/AD9778A/AD9779A are dual, 12-/14-/16-bit,
high dynamic range, digital-to-analog converters (DACs) that
provide a sample rate of 1 GSPS, permitting a multicarrier
generation up to the Nyquist frequency. They include features
optimized for direct conversion transmit applications, including
complex digital modulation, and gain and offset compensation.
The DAC outputs are optimized to interface seamlessly with
analog quadrature modulators such as the ADL537x FMOD
series from Analog Devices, Inc. A serial peripheral interface
(SPI) provides for programming/readback of many internal
parameters. Full-scale output current can be programmed over
a range of 10 mA to 30 mA. The devices are manufactured on
an advanced 0.18 m CMOS process and operate on 1.8 V and
3.3 V supplies for a total power consumption of 1.0 W. They are
enclosed in a 100-lead TQFP.
PRODUCT HIGHLIGHTS
1. Ultralow noise and intermodulation distortion (IMD)
enable high quality synthesis of wideband signals from
baseband to high intermediate frequencies.
2. A proprietary DAC output switching technique enhances
dynamic performance.
3. The current outputs are easily configured for various
single-ended or differential circuit topologies.
4. CMOS data input interface with adjustable setup and hold.
5. Novel 2×, 4×, and 8× interpolator/coarse complex
modulator allows carrier placement anywhere in DAC
bandwidth.
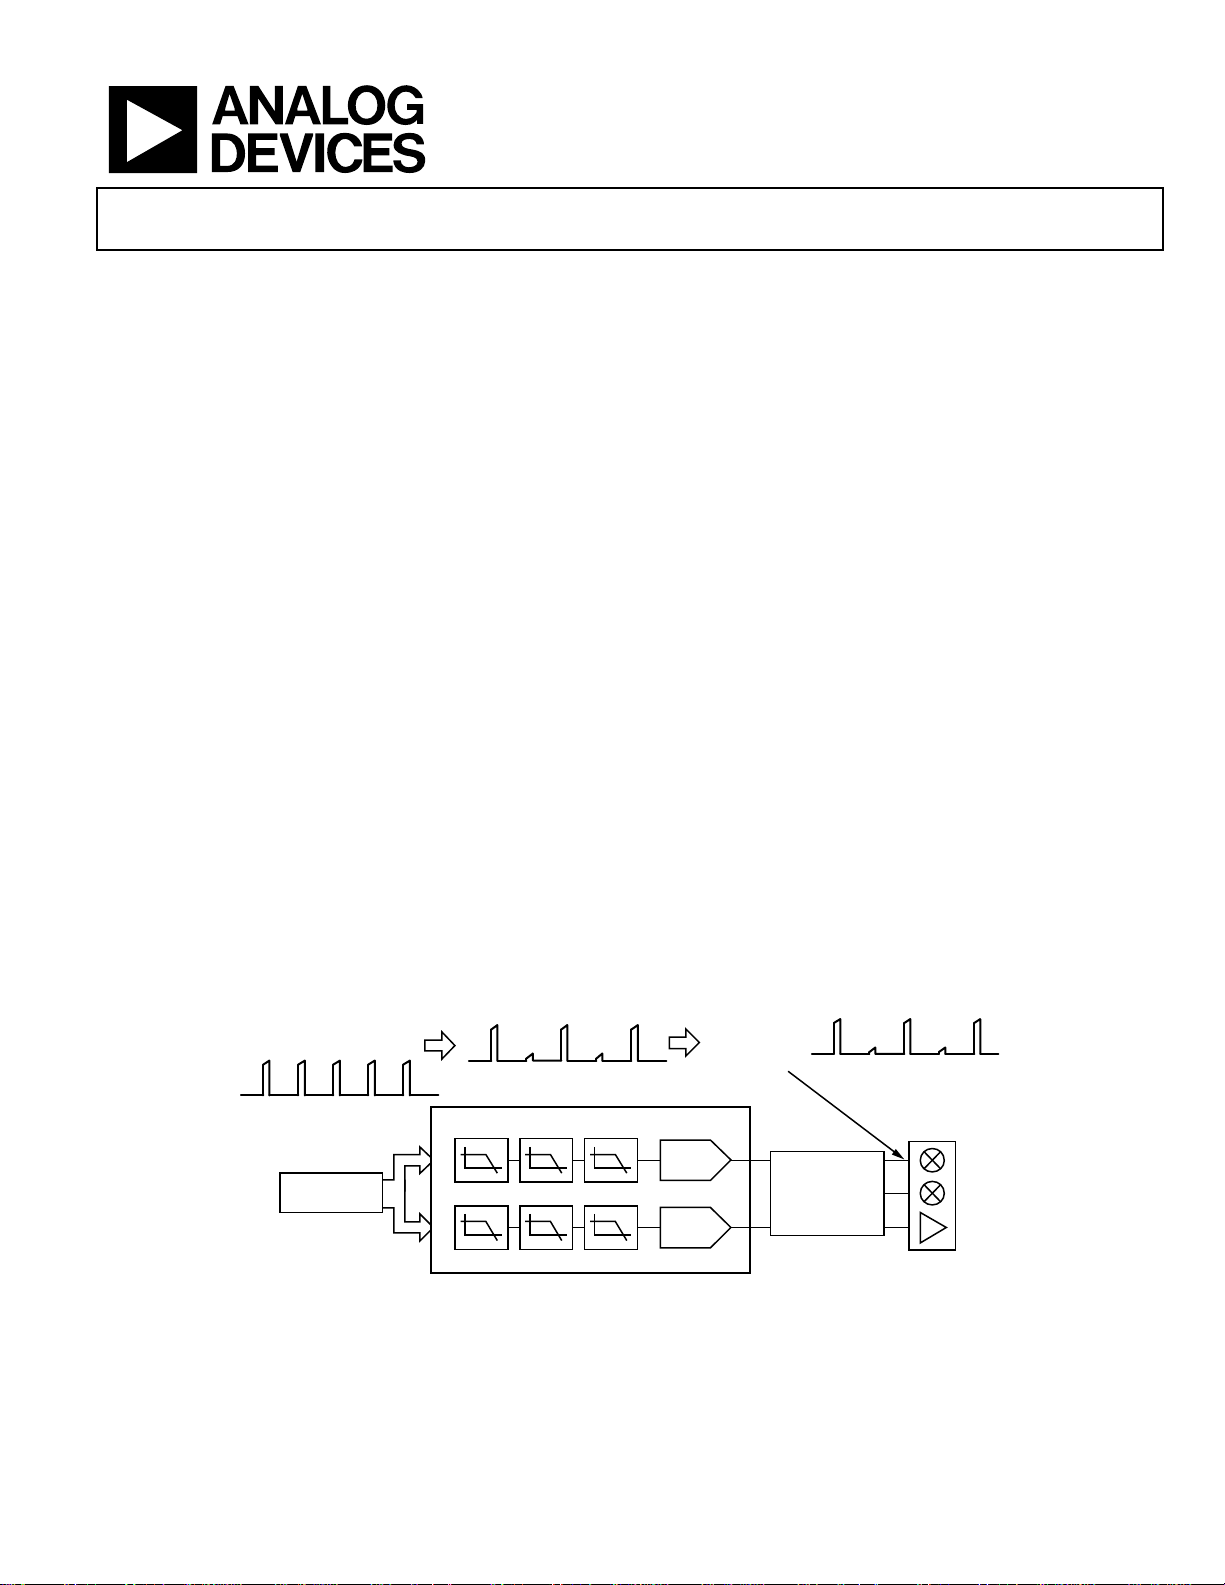
TYPICAL SIGNAL CHAIN
COMPLEX I AND Q
DC
DC
FPGA/ASI C/DSP
Rev. A
Information furnished by Analog Devices is believed to be accurate and reliable. However, no
responsibility is assumed by Analog Devices for its use, nor for any infringements of patents or other
rights of third parties that may result from its use. Specifications subject to change without notice. No
license is granted by implication or otherwise under any patent or patent rights of Analog Devices.
Trademarks and registered trademarks are the property of their respective owners.
DIGITAL INTERPOL ATION FILTERS
AD9776A/AD9778A/AD9779A
QUADRATURE
MODULATOR/
MIXER/
AMPLIFIER
I DAC
POST DAC
ANALOG FILTER
Q DAC
Figure 1.
One Technology Way, P.O. Box 9106, Norwood, MA 02062-9106, U.S.A.
Tel: 781.329.4700 www.analog.com
Fax: 781.461.3113 ©2007–2008 Analog Devices, Inc. All rights reserved.
LO
A
6452-114
Page 2

AD9776A/AD9778A/AD9779A
TABLE OF CONTENTS
Features .............................................................................................. 1
Applications ....................................................................................... 1
General Description ......................................................................... 1
Product Highlights ........................................................................... 1
Typical Signal Chain ......................................................................... 1
Revision History ............................................................................... 2
Functional Block Diagram .............................................................. 3
Specifications ..................................................................................... 4
DC Specifications ......................................................................... 4
Digital Specifications ................................................................... 5
Digital Input Data Timing Specifications ................................. 6
AC Specifications .......................................................................... 6
Absolute Maximum Ratings ............................................................ 7
Thermal Resistance ...................................................................... 7
ESD Caution .................................................................................. 7
Pin Configurations and Function Descriptions ........................... 8
Typical Performance Characteristics ........................................... 14
Terminolog y .................................................................................... 22
Theory of Operation ...................................................................... 23
Differences Between AD9776/AD9778/ AD9779 and
AD9776A/AD9778A/AD9779A............................................... 23
Serial Peripheral Interface ............................................................. 24
General Operation of the Serial Interface ............................... 24
Instruction Byte .......................................................................... 24
Serial Interface Port Pin Descriptions ..................................... 25
MSB/LSB Transfers..................................................................... 25
SPI Register Map ............................................................................. 26
Interpolation Filter Architecture .................................................. 31
Interpolation Filter Bandwidth Limits .................................... 35
Sourcing the DAC Sample Clock ................................................. 36
Direct Clocking .......................................................................... 36
Clock Multiplication .................................................................. 36
Driving the REFCLK Input ....................................................... 38
Full-Scale Current Generation ..................................................... 39
Internal Reference ...................................................................... 39
Transmit Path Gain and Offset Correction................................. 40
I/Q Channel Gain Matching ..................................................... 40
Auxiliary DAC Operation ......................................................... 40
LO Feedthrough Compensation .............................................. 41
Results of Gain and Offset Correction .................................... 41
Input Data Ports ............................................................................. 42
Single Port Mode ........................................................................ 42
Dual Port Mode .......................................................................... 42
Input Data Referenced to DATACLK ...................................... 42
Input Data Referenced to REFCLK ......................................... 43
Optimizing the Data Input Timing .......................................... 44
Device Synchronization ................................................................. 45
Synchronization Logic Overview ............................................. 45
Synchronizing Devices to a System Clock .............................. 46
Interrupt Request Operation .................................................... 46
Power Dissipation ........................................................................... 47
Power-Down and Sleep Modes................................................. 48
Evaluation Board Operation ......................................................... 49
Using the ADL5372 Quadrature Modulator .......................... 51
Evaluation Board Schematics ................................................... 52
Outline Dimensions ....................................................................... 60
Ordering Guide .......................................................................... 60
REVISION HISTORY
3/08—Rev. 0 to Rev. A
Changes to Features .......................................................................... 1
Added Note 2 .................................................................................... 4
Changes to Table 2 ............................................................................ 5
Changes to Table 3 ............................................................................ 6
Changes to Thermal Resistance Section ........................................ 7
Inserted Table 6 ................................................................................. 8
Changes to Pin 39 Description, Table 7 ......................................... 9
Changes to Pin 39 Description, Table 8 ....................................... 10
Changes to Pin 39 Description, Table 9 ....................................... 12
Changes to Theory of Operation Section .................................... 23
Rev. A | Page 2 of 60
Changes to Table 10 ....................................................................... 23
Changes to Table 13 ....................................................................... 26
Changes to Table 14 ....................................................................... 27
Changes to Interpolation Filter Architecture Section ............... 33
Replaced Sourcing the DAC Sample Clock Section .................. 36
Replaced Transmit Path Gain and Offset Correction Section . 40
Replaced Input Data Ports Section .............................................. 42
Replaced Device Synchronization Section .................................. 45
Deleted Figure 112 to Figure 117 ................................................. 58
8/07—Revision 0: Initial Version
Page 3
AD9776A/AD9778A/AD9779A
K
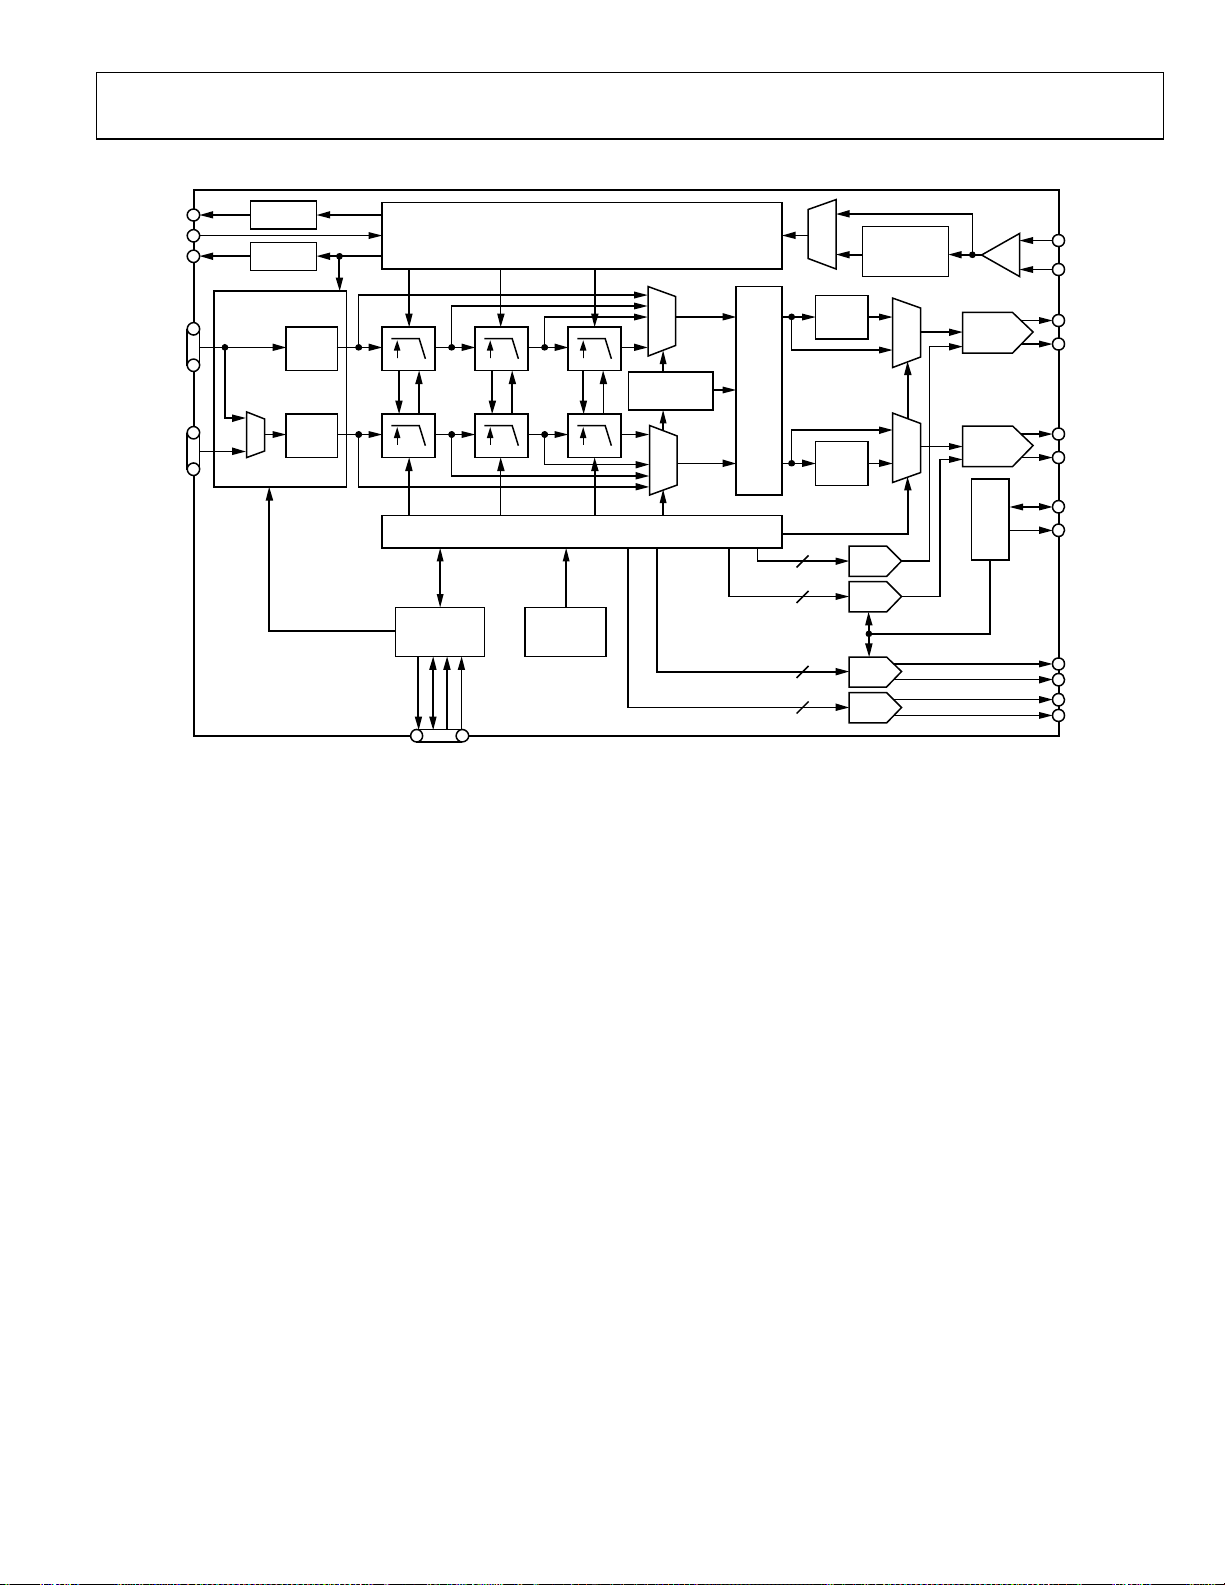
FUNCTIONAL BLOCK DIAGRAM
SYNC_O
SYNC_I
DATACLK
P1D<15:0>
P2D<15:0>
DELAY
LINE
DELAY
LINE
DATA
ASSEMBLER
LATCH
LATCH
AD9779A
CLOCK GENERAT ION/DISTRIBUTIO N
I
Q
2× 2×
2× 2× 2×
DIGITAL CONTROLL ER
SERIAL
PERIPHERAL
INTERFACE
SDO
SDIO
SCL
CSB
POWER-ON
RESET
2×
n × f
/8
DAC
n = 0, 1, 2 ... 7
COMPLEX
MODULATOR
10
10
10
10
SYNC
SYNC
CLOCK
MULTIPLIER
2×/4×/8×
GAIN
GAIN
GAIN
GAIN
16-BIT
I DAC
16-BIT
Q DAC
REFERENCE
AND BIAS
REFCLK+
REFCLK–
OUT1_P
OUT1_N
OUT2_P
OUT2_N
VREF
I120
AUX1_P
AUX1_N
AUX2_P
AUX2_N
6452-001
Figure 2. AD9779A Functional Block Diagram
Rev. A | Page 3 of 60
Page 4
AD9776A/AD9778A/AD9779A
SPECIFICATIONS
DC SPECIFICATIONS
T
to T
MIN
otherwise noted.
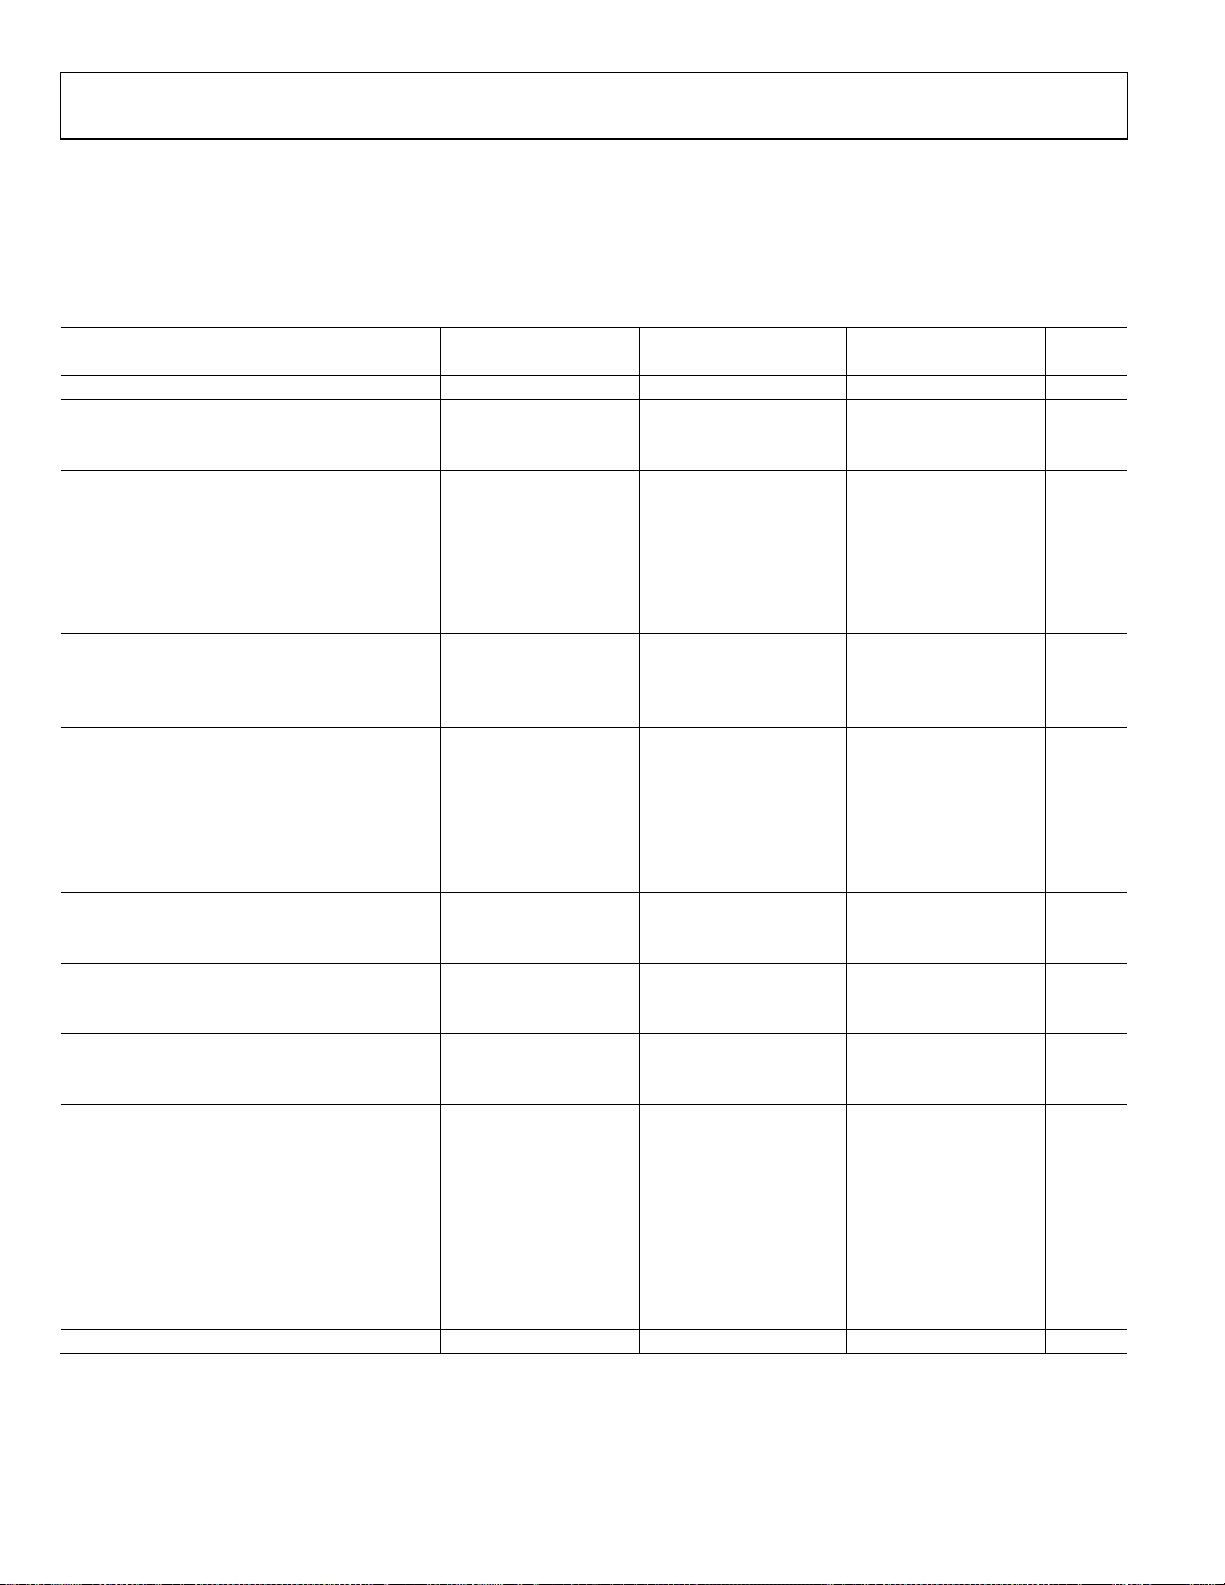
Table 1.
AD9776A AD9778A AD9779A
Parameter Min Typ Max Min Typ Max Min Typ Max Unit
RESOLUTION 12 14 16 Bits
ACCURACY
Differential Nonlinearity (DNL) ±0.1 ±0.65 ±2.1 LSB
Integral Nonlinearity (INL) ±0.6 ±1 ±3.7 LSB
MAIN DAC OUTPUTS
Offset Error −0.001 0 +0.001 −0.001 0 +0.001 −0.001 0 +0.001 % FSR
Gain Error (With Internal Reference) ±2 ±2 ±2 % FSR
Full-Scale Output Current
Output Compliance Range −1.0 +1.0 −1.0 +1.0 −1.0 +1.0 V
Output Resistance 10 10 10 MΩ
Gain DAC Monotonicity Guaranteed Guaranteed Guaranteed
MAIN DAC TEMPERATURE DRIFT
Offset 0.04 0.04 0.04 ppm/°C
Gain 100 100 100 ppm/°C
Reference Voltage 30 30 30 ppm/°C
AUX DAC OUTPUTS
Resolution 10 10 10 Bits
Full-Scale Output Current
Output Compliance Range (Source) 0 1.6 0 1.6 0 1.6 V
Output Compliance Range (Sink) 0.8 1.6 0.8 1.6 0.8 1.6 V
Output Resistance 1 1 1 MΩ
AUX DAC Monotonicity Guaranteed Guaranteed Guaranteed
REFERENCE
Internal Reference Voltage 1.2 1.2 1.2 V
Output Resistance 5 5 5 kΩ
ANALOG SUPPLY VOLTAGES
AVDD33 3.13 3.3 3.47 3.13 3.3 3.47 3.13 3.3 3.47 V
CVDD18 1.70 1.8 2.05 1.70 1.8 2.05 1.70 1.8 2.05 V
DIGITAL SUPPLY VOLTAGES
DVDD33 3.13 3.3 3.47 3.13 3.3 3.47 3.13 3.3 3.47 V
DVDD18 1.70 1.8 2.05 1.70 1.8 2.05 1.70 1.8 2.05 V
POWER CONSUMPTION
1× Mode, f
2× Mode, f
2× Mode, f
4× Mode, f
8× Mode, f
Power-Down Mode 2.5 9.8 2.5 9.8 2.5 9.8 mW
Power Supply Rejection Ratio, AVDD33 −0.3 +0.3 −0.3 +0.3 −0.3 +0.3 % FSR/V
OPERATING RANGE −40 +25 +85 −40 +25 +85 −40 +25 +85 °C
1
Based on a 10 kΩ external resistor.
2
See the Power Dissipation section for more details.
, AVDD33 = 3.3 V, DVDD33 = 3.3 V, DVDD18 = 1.8 V, CVDD18 = 1.8 V, I
MAX
1
1
2
= 100 MSPS, IF = 1 MHz 250 300 250 300 250 300 mW
DAC
= 320 MSPS, IF = 16 MHz, PLL Off 498 498 498 mW
DAC
= 320 MSPS, IF = 16 MHz, PLL On 588 588 588 mW
DAC
/4 Modulation, f
DAC
= 500 MSPS,
DAC
8.66 20.2 31.66 8.66 20.2 31.66 8.66 20.2 31.66 mA
−1.998 +1.998 −1.998 +1.998 −1.998 +1.998 mA
572 572 572 mW
IF = 137.5 MHz, Q DAC Off
/4 Modulation, f
DAC
= 1 GSPS,
DAC
980 980 980 mW
IF = 262.5 MHz
= 20 mA, maximum sample rate, unless
OUTFs
Rev. A | Page 4 of 60
Page 5

AD9776A/AD9778A/AD9779A
DIGITAL SPECIFICATIONS
T
to T
MIN
, AVDD33 = 3.3 V, DVDD33 = 3.3 V, DVDD18 = 1.8 V, CVDD18 = 1.8 V, I
MAX
otherwise noted. LVDS driver and receiver are compliant to the IEEE-1596 reduced range link, unless otherwise noted.
Table 2.
Parameter Conditions Min Typ Max Unit
CMOS INPUT LOGIC LEVEL
Input VIN Logic High 2.0 V
Input VIN Logic Low 0.8 V
Maximum Input Data Rate at Interpolation
1× 300 MSPS
2× 250 MSPS
4× 200 MSPS
8× DVDD18, CVDD18 = 1.8 V ± 5% 112.5 MSPS
DVDD18, CVDD18 = 1.9 V ± 5% 125 MSPS
DVDD18, CVDD18 = 2.0 V ± 2% 137.5 MSPS
CMOS OUTPUT LOGIC LEVEL (DATACLK, PIN 37)
Output V
Output V
Logic High 2.4 V
OUT
Logic Low 0.4 V
OUT
1
DATACLK Output Duty Cycle At 250 MHz, into 5 pF load 40 50 60 %
LVDS RECEIVER INPUTS (SYNC_I+, SYNC_I−) SYNC_I+ = VIA, SYNC_I− = VIB
Input Voltage Range, VIA or VIB 825 1575 mV
Input Differential Threshold, V
Input Differential Hysteresis, V
−100 +100 mV
IDTH
− V
IDTHH
20 mV
IDTHL
Receiver Differential Input Impedance, RIN 80 120 Ω
LVDS Input Rate
Additional limits on f
apply; see description of
SYNC_I
Register 5, Bits<3:1> in Tab le 14
Setup Time, SYNC_I to REFCLK 0.4 ns
Hold Time, SYNC_I to REFCLK 0.55 ns
LVDS DRIVER OUTPUTS (SYNC_O+, SYNC_O−) SYNC_O+ = VOA, SYNC_O− = VOB, 100 Ω termination
Output Voltage High, VOA or VOB 1375 mV
Output Voltage Low, VOA or VOB 1025 mV
Output Differential Voltage, |VOD| 150 200 250 mV
Output Offset Voltage, VOS 1150 1250 mV
Output Impedance, RO Single-ended 80 100 120 Ω
DAC CLOCK INPUT (REFCLK+, REFCLK−)
Differential Peak-to-Peak Voltage 400 800 2000 mV
Common-Mode Voltage 300 400 500 mV
Maximum Clock Rate DVDD18, CVDD18 = 1.8 V ± 5% 900 MSPS
DVDD18, CVDD18 = 1.9 V ± 5% 1000 MSPS
DVDD18, CVDD18 = 2.0 V ± 2% 1100 MSPS
SERIAL PERIPHERAL INTERFACE
Maximum Clock Rate (SCLK) 40 MHz
Minimum Pulse Width High 12.5 ns
Minimum Pulse Width Low 12.5 ns
Setup Time, SDI to SCLK 1.6 ns
Hold Time, SDI to SCLK 0.0 ns
Data Valid, SDO to SCLK 2.0 ns
1
Specification is at a DATACLK frequency of 100 MHz into a 1 kΩ load, maximum drive capability of 8 mA. At higher speeds or greater loads, best practice suggests
using an external buffer for this signal.
= 20 mA, maximum sample rate, unless
OUTFs
250 MSPS
Rev. A | Page 5 of 60
Page 6

AD9776A/AD9778A/AD9779A
DIGITAL INPUT DATA TIMING SPECIFICATIONS
All modes, −40°C to +85°C.
Table 3.
Parameter Conditions Min Typ Max Unit
Input Data1
Setup Time Input data to DATACLK 3.0 ns
Hold Time Input data to DATACLK 0.0 ns
Setup Time Input data to REFCLK −0.8 ns
Hold Time Input data to REFCLK 3.7 ns
Latency
1× Interpolation With or without modulation 25 DACCLK Cycles
2× Interpolation With or without modulation 70 DACCLK Cycles
4× Interpolation With or without modulation 146 DACCLK Cycles
8× Interpolation With or without modulation 297 DACCLK Cycles
Inverse Sync 18 DACCLK Cycles
Power-Up Time
1
Timing vs. temperature and data valid keep out windows are delineated in Table 25.
2
Measured from CSB rising edge on Register 0x00, Bit 4 write from 0 to 1. VREF decoupling capacitor equal to 0.1 μF.
AC SPECIFICATIONS
T
to T
MIN
otherwise noted.
2
, AVDD33 = 3.3 V, DVDD33 = 3.3 V, DVDD18 = 1.8 V, CVDD18 = 1.8 V, I
MAX
260 ms
= 20 mA, maximum sample rate, unless
OUTFs
Table 4.
AD9776A AD9778A AD9779A
Parameter Min Typ Max Min Typ Max Min Typ Max Unit
SPURIOUS FREE DYNAMIC RANGE (SFDR)
f
= 100 MSPS, f
DAC
f
= 200 MSPS, f
DAC
f
= 400 MSPS, f
DAC
f
= 800 MSPS, f
DAC
= 20 MHz 82 82 82 dBc
OUT
= 50 MHz 81 81 82 dBc
OUT
= 70 MHz 80 80 80 dBc
OUT
= 70 MHz 85 85 87 dBc
OUT
TWO-TONE INTERMODULATION DISTORTION (IMD)
f
= 200 MSPS, f
DAC
f
= 400 MSPS, f
DAC
f
= 400 MSPS, f
DAC
f
= 800 MSPS, f
DAC
NOISE SPECTRAL DENSITY (NSD) EIGHT-TONE, 500 kHz
= 50 MHz 87 87 91 dBc
OUT
= 60 MHz 80 85 85 dBc
OUT
= 80 MHz 75 81 81 dBc
OUT
= 100 MHz 75 80 81 dBc
OUT
TONE SPACING
f
= 200 MSPS, f
DAC
f
= 400 MSPS, f
DAC
f
= 800 MSPS, f
DAC
W-CDMA ADJACENT CHANNEL LEAKAGE RATIO (ACLR),
= 80 MHz −152 −155 −158 dBm/Hz
OUT
= 80 MHz −155 −159 −160 dBm/Hz
OUT
= 80 MHz −157.5 −160 −161 dBm/Hz
OUT
SINGLE CARRIER
f
= 491.52 MSPS, f
DAC
f
= 491.52 MSPS, f
DAC
W-CDMA SECOND ADJACENT CHANNEL LEAKAGE RATIO
= 100 MHz 76 78 79 dBc
OUT
= 200 MHz 69 73 74 dBc
OUT
(ACLR), SINGLE CARRIER
f
= 491.52 MSPS, f
DAC
f
= 491.52 MSPS, f
DAC
= 100 MHz 77.5 80 81 dBc
OUT
= 200 MHz 76 78 78 dBc
OUT
Rev. A | Page 6 of 60
Page 7
AD9776A/AD9778A/AD9779A
ABSOLUTE MAXIMUM RATINGS
Table 5.
Parameter With Respect To Rating
AVDD33, DVDD33
DVDD18, CVDD18
AGND DGND, CGND −0.3 V to +0.3 V
DGND AGND, CGND −0.3 V to +0.3 V
CGND AGND, DGND −0.3 V to +0.3 V
I120, VREF, IPTAT AGND
OUT1_P, OUT1_N,
OUT2_P, OUT2_N,
AUX1_P, AUX1_N,
AUX2_P, AUX2_N
P1D<15> to P1D<0>,
P2D<15> to P2D<0>
DATACLK, TXENABLE DGND
REFCLK+, REFCLK− CGND
RESET, IRQ, PLL_LOCK,
SYNC_O+, SYNC_O−,
SYNC_I+, SYNC_I−,
CSB, SCLK, SDIO, SDO
Junction Temperature +125°C
Storage Temperature
Range
AGND, DGND,
CGND
AGND, DGND,
CGND
AGND
DGND
DGND
−65°C to +150°C
−0.3 V to +3.6 V
−0.3 V to +2.1 V
−0.3 V to
AVDD33 + 0.3 V
−1.0 V to
AVDD33 + 0.3 V
−0.3 V to
DVDD33 + 0.3 V
−0.3 V to
DVDD33 + 0.3 V
−0.3 V to
CVDD18 + 0.3 V
−0.3 V to
DVDD33 + 0.3 V
Stresses above those listed under Absolute Maximum Ratings
may cause permanent damage to the device. This is a stress
rating only; functional operation of the device at these or any
other conditions above those indicated in the operational
section of this specification is not implied. Exposure to absolute
maximum rating conditions for extended periods may affect
device reliability.
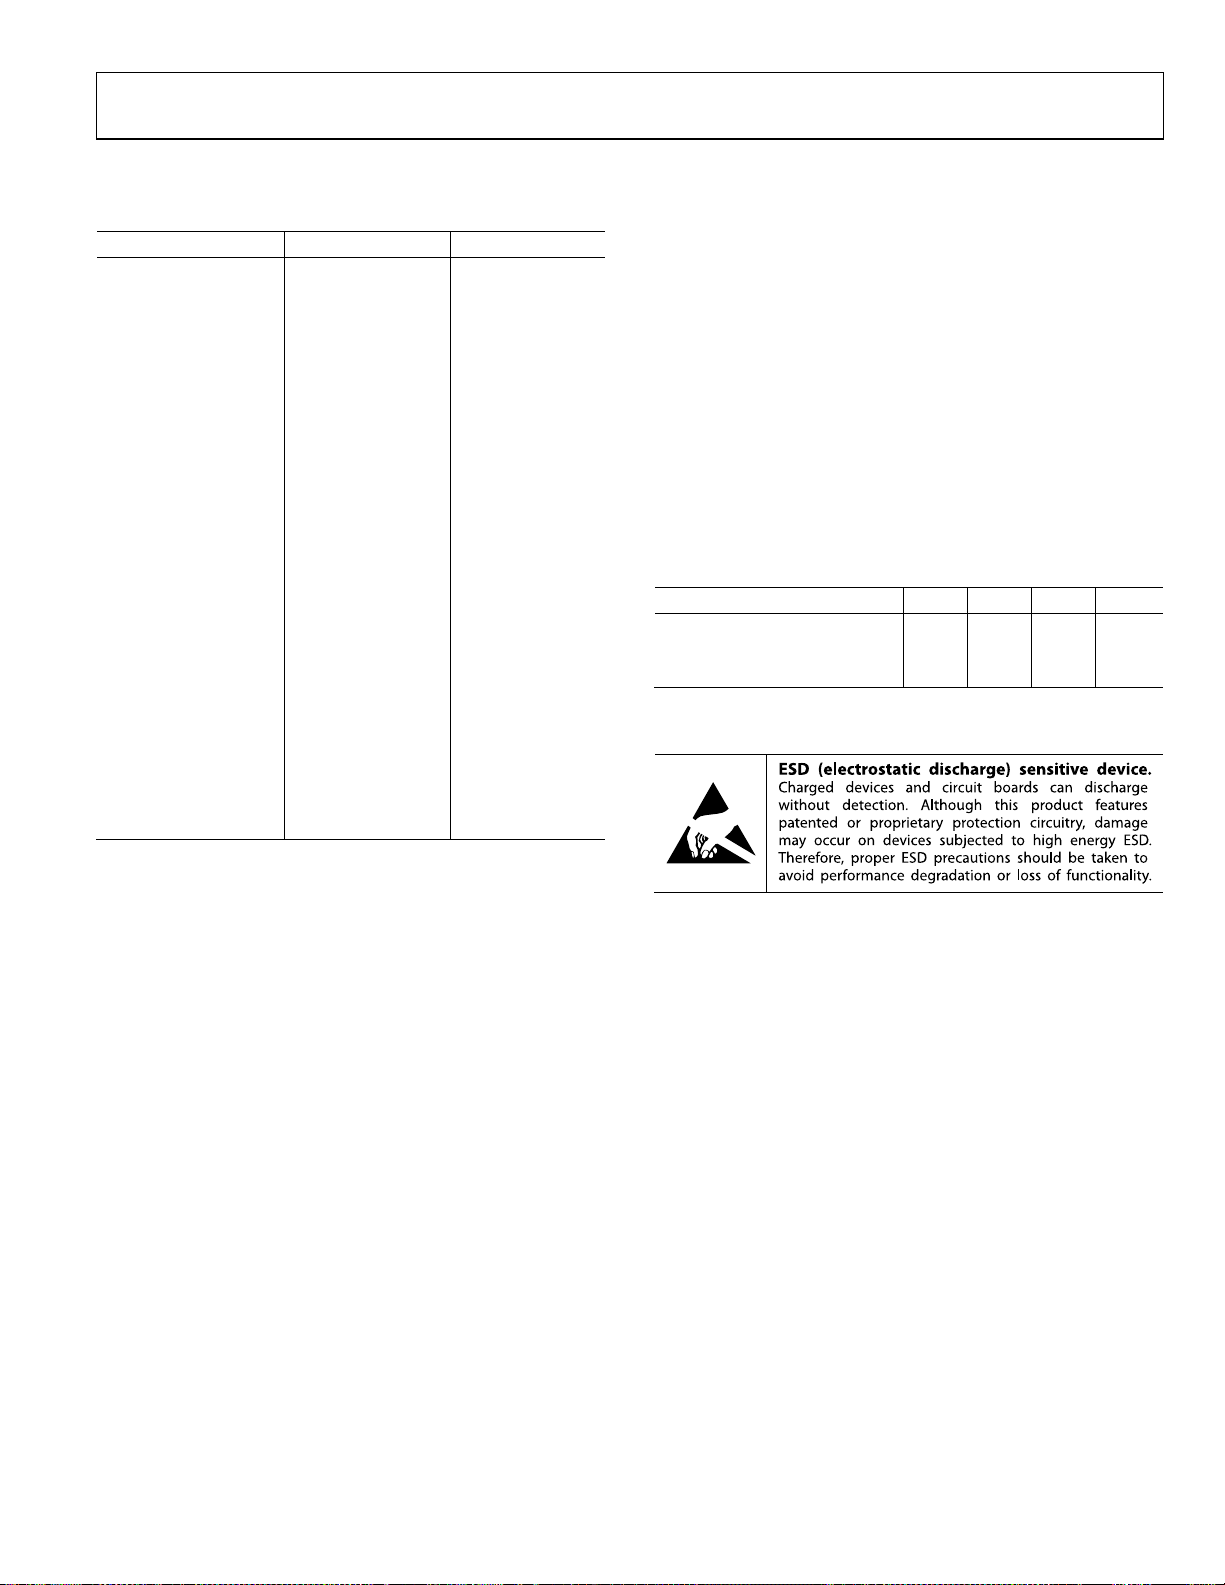
THERMAL RESISTANCE
For optimal thermal performance, the exposed paddle (EPAD)
should be soldered to the ground plane for the 100-lead,
thermally enhanced TQFP_EP package.
Typical θ
Airflow increases heat dissipation effectively reducing θ
and θJC are specified for a 4-layer board in still air.
JA
JA
.
Table 6. Thermal Resistance
Package Type θJA θJB θJC Unit
100-Lead TQFP_EP
EPAD Soldered 19.1 12.4 7.1 °C/W
EPAD Not Soldered 27.4 °C/W
ESD CAUTION
Rev. A | Page 7 of 60
Page 8
AD9776A/AD9778A/AD9779A
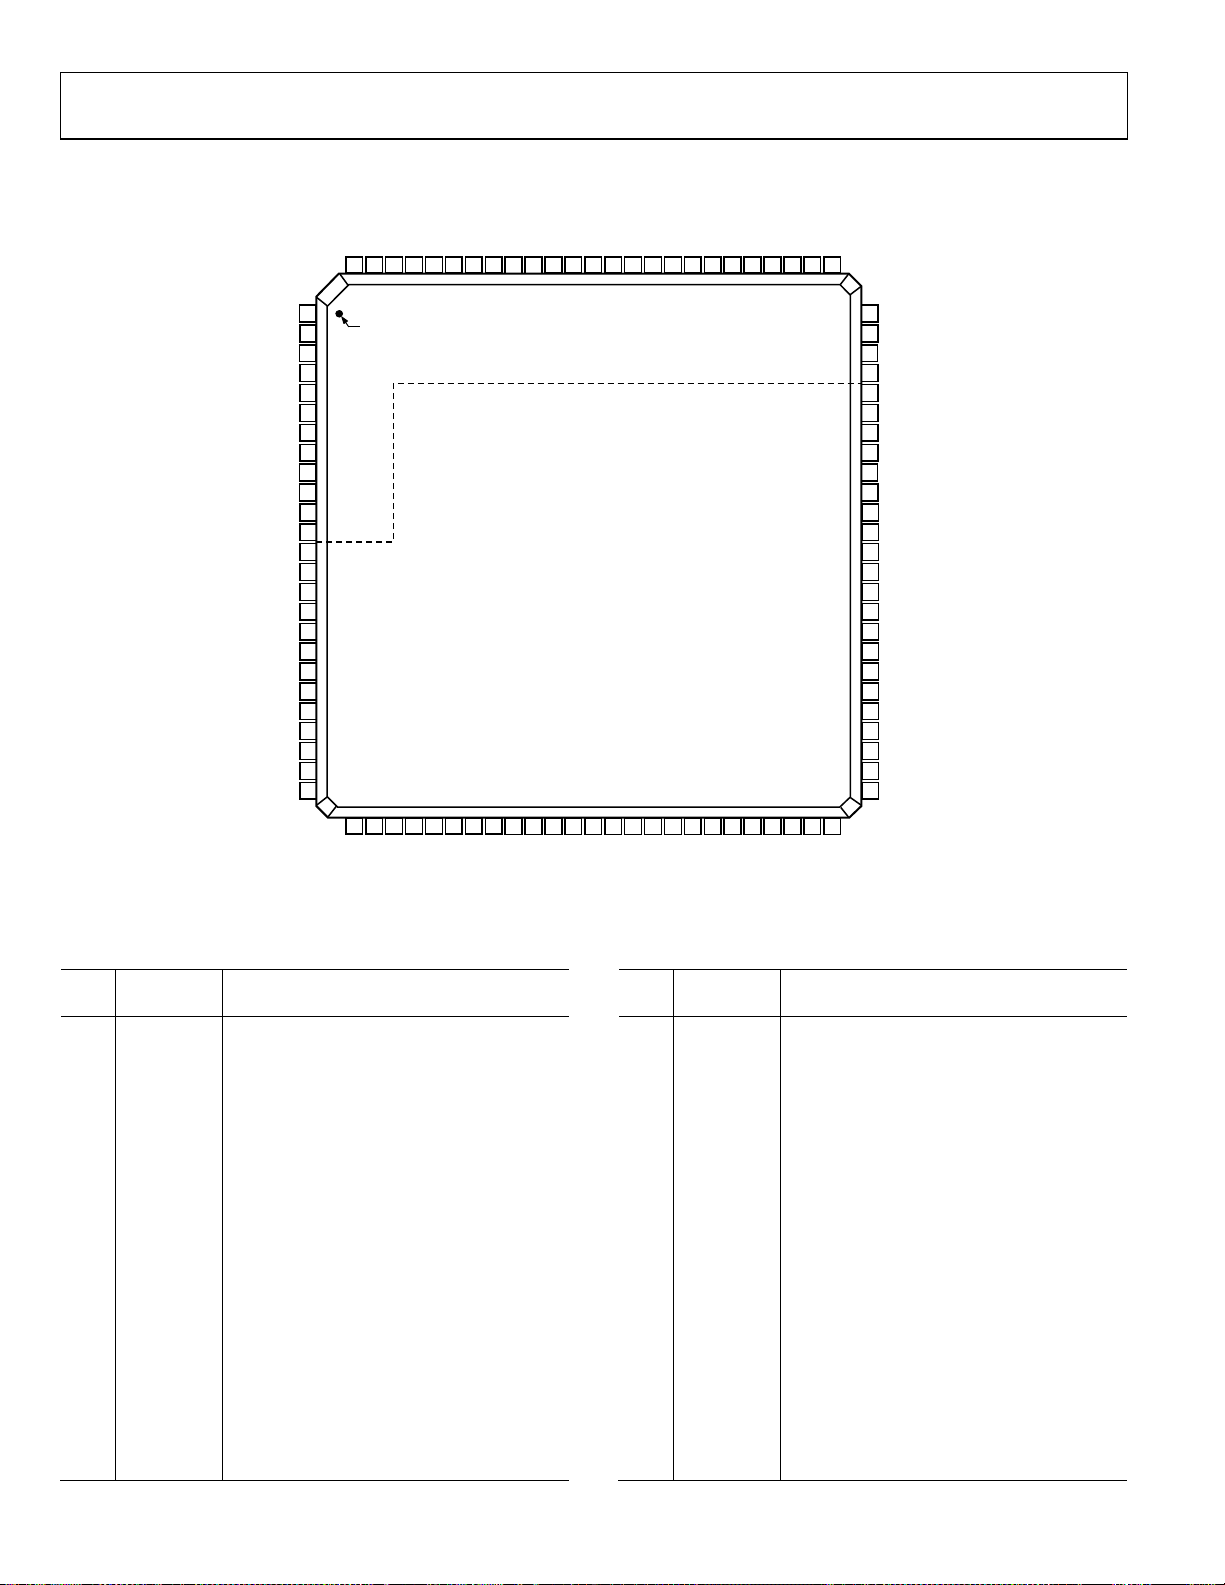
PIN CONFIGURATIONS AND FUNCTION DESCRIPTIONS
AVDD3399AGND98AVDD3397AGND96AVDD3395AGND94AGND93OUT1_P92OUT1_N91AGND90AUX1_P89AUX1_N88AGND87AUX2_N86AUX2_P85AGND84OUT2_N83OUT2_P82AGND81AGND80AVDD3379AGND78AVDD3377AGND76AVDD33
100
CGND
CGND
CGND
CGND
CGND
AGND
DGND
P1D<9>
P1D<8>
P1D<7>
DGND
P1D<6>
P1D<5>
1
2
3
4
5
6
7
8
9
10
11
12
13
14
15
16
17
18
19
20
21
22
23
24
25
CVDD18
CVDD18
REFCLK+
REFCLK–
CVDD18
CVDD18
SYNC_I+
SYNC_I–
DVDD18
P1D<11>
P1D<10>
DVDD18
NC = NO CONNECT
PIN 1
26
P1D<4>27P1D<3>28P1D<2>29P1D<1>30P1D<0>
ANALOG DOMAIN
DIGITAL DO MAIN
AD9776A
TOP VIEW
(Not to Scale)
31NC32
33
DGND
DVDD18
34NC35NC36NC37
38
39
40
DVDD33
P2D<11>41P2D<10>
DATACLK
TXENABLE
Figure 3. AD9776A Pin Configuration
75
I120
74
VREF
73
IPTAT
72
AGND
71
IRQ
70
RESET
69
CSB
68
SCLK
67
SDIO
66
SDO
65
PLL_LOCK
64
DGND
63
SYNC_O+
62
SYNC_O–
61
DVDD33
60
DVDD18
59
NC
58
NC
57
NC
56
NC
55
P2D<0>
54
DGND
53
DVDD18
52
P2D<1>
51
P2D<2>
42
43
44
45
DGND
P2D<9>
P2D<8>46P2D<7>47P2D<6>48P2D<5>49P2D<4>50P2D<3>
DVDD18
06452-002
Table 7. AD9776A Pin Function Descriptions
Pin
No. Mnemonic Description
Pin
No. Mnemonic Description
1 CVDD18 1.8 V Clock Supply. 20 P1D<8> Port 1, Data Input D8.
2 CVDD18 1.8 V Clock Supply. 21 P1D<7> Port 1, Data Input D7.
3 CGND
4 CGND
5 REFCLK+
6 REFCLK−
7 CGND
8 CGND
9 CVDD18
10 CVDD18
11 CGND
12 AGND
13 SYNC_I+
14 SYNC_I−
15 DGND
16 DVDD18
17 P1D<11>
18 P1D<10>
19 P1D<9> Port 1, Data Input D9.
Clock Ground. 22 DGND Digital Ground.
Clock Ground. 23 DVDD18 1.8 V Digital Supply.
Differential Clock Input. 24 P1D<6> Port 1, Data Input D6.
Differential Clock Input. 25 P1D<5> Port 1, Data Input D5.
Clock Ground. 26 P1D<4> Port 1, Data Input D4.
Clock Ground. 27 P1D<3> Port 1, Data Input D3.
1.8 V Clock Supply. 28 P1D<2> Port 1, Data Input D2.
1.8 V Clock Supply. 29 P1D<1> Port 1, Data Input D1.
Clock Ground. 30 P1D<0> Port 1, Data Input D0 (LSB).
Analog Ground. 31 NC No Connect.
Differential Synchronization Input. 32 DGND Digital Ground.
Differential Synchronization Input. 33 DVDD18 1.8 V Digital Supply.
Digital Ground. 34 NC No Connect.
1.8 V Digital Supply. 35 NC No Connect.
Port 1, Data Input D11 (MSB). 36 NC No Connect.
Port 1, Data Input D10. 37
DATACLK
Data Clock Output.
38 DVDD33 3.3 V Digital Supply.
Rev. A | Page 8 of 60
Page 9

AD9776A/AD9778A/AD9779A
Pin
No. Mnemonic Description
39 TXENABLE
40 P2D<11> Port 2, Data Input D11 (MSB).
41 P2D<10> Port 2, Data Input D10.
42 P2D<9> Port 2, Data Input D9.
43 DVDD18 1.8 V Digital Supply.
44 DGND Digital Ground.
45 P2D<8> Port 2, Data Input D8.
46 P2D<7> Port 2, Data Input D7.
47 P2D<6> Port 2, Data Input D6.
48 P2D<5> Port 2, Data Input D5.
49 P2D<4> Port 2, Data Input D4.
50 P2D<3> Port 2, Data Input D3.
51 P2D<2> Port 2, Data Input D2.
52 P2D<1> Port 2, Data Input D1.
53 DVDD18 1.8 V Digital Supply.
54 DGND Digital Ground.
55 P2D<0> Port 2, Data Input D0 (LSB).
56 NC No Connect.
57 NC No Connect.
58 NC No Connect.
59 NC No Connect.
60 DVDD18 1.8 V Digital Supply.
61 DVDD33 3.3 V Digital Supply.
62 SYNC_O− Differential Synchronization Output.
63 SYNC_O+ Differential Synchronization Output.
64 DGND Digital Ground.
65 PLL_LOCK PLL Lock Indicator.
66 SDO SPI Port Data Output.
67 SDIO SPI Port Data Input/Output.
68 SCLK SPI Port Clock.
69 CSB SPI Port Chip Select Bar.
70 RESET Reset, Active High.
71 IRQ Interrupt Request.
Transmit Enable. In single port mode, this
pin also functions as IQSELECT.
Pin
No. Mnemonic Description
72 AGND Analog Ground.
73 IPTAT
74 VREF Voltage Reference Output.
75 I120 120 μA Reference Current.
76 AVDD33 3.3 V Analog Supply.
77 AGND Analog Ground.
78 AVDD33 3.3 V Analog Supply.
79 AGND Analog Ground.
80 AVDD33 3.3 V Analog Supply.
81 AGND Analog Ground.
82 AGND Analog Ground.
83 OUT2_P Differential DAC Current Output, Channel 2.
84 OUT2_N Differential DAC Current Output, Channel 2.
85 AGND Analog Ground.
86 AUX2_P Auxiliary DAC Current Output, Channel 2.
87 AUX2_N Auxiliary DAC Current Output, Channel 2.
88 AGND Analog Ground.
89 AUX1_N Auxiliary DAC Current Output, Channel 1.
90 AUX1_P Auxiliary DAC Current Output, Channel 1.
91 AGND Analog Ground.
92 OUT1_N Differential DAC Current Output, Channel 1.
93 OUT1_P Differential DAC Current Output, Channel 1.
94 AGND Analog Ground.
95 AGND Analog Ground.
96 AVDD33 3.3 V Analog Supply.
97 AGND Analog Ground.
98 AVDD33 3.3 V Analog Supply.
99 AGND Analog Ground.
100 AVDD33 3.3 V Analog Supply.
Factory Test Pin. Output current is
proportional to absolute temperature,
approximately 14 μA at 25°C with
approximately 20 nA/°C slope. This pin
should remain floating.
Rev. A | Page 9 of 60
Page 10
AD9776A/AD9778A/AD9779A
AVDD3399AGND98AVDD3397AGND96AVDD3395AGND94AGND93OUT1_P92OUT1_N91AGND90AUX1_P89AUX1_N88AGND87AUX2_N86AUX2_P85AGND84OUT2_N83OUT2_P82AGND81AGND80AVDD3379AGND78AVDD3377AGND76AVDD33
100
CGND
CGND
CGND
CGND
CGND
AGND
DGND
P1D<9>
DGND
P1D<8>
P1D<7>
1
2
3
4
5
6
7
8
9
10
11
12
13
14
15
16
17
18
19
20
21
22
23
24
25
CVDD18
CVDD18
REFCLK+
REFCLK–
CVDD18
CVDD18
SYNC_I+
SYNC_I–
DVDD18
P1D<13>
P1D<12>
P1D<11>
P1D<10>
DVDD18
NC = NO CONNECT
PIN 1
26
P1D<6>27P1D<5>28P1D<4>29P1D<3>30P1D<2>31P1D<1>
ANALOG DOMAIN
DIGITAL DO MAIN
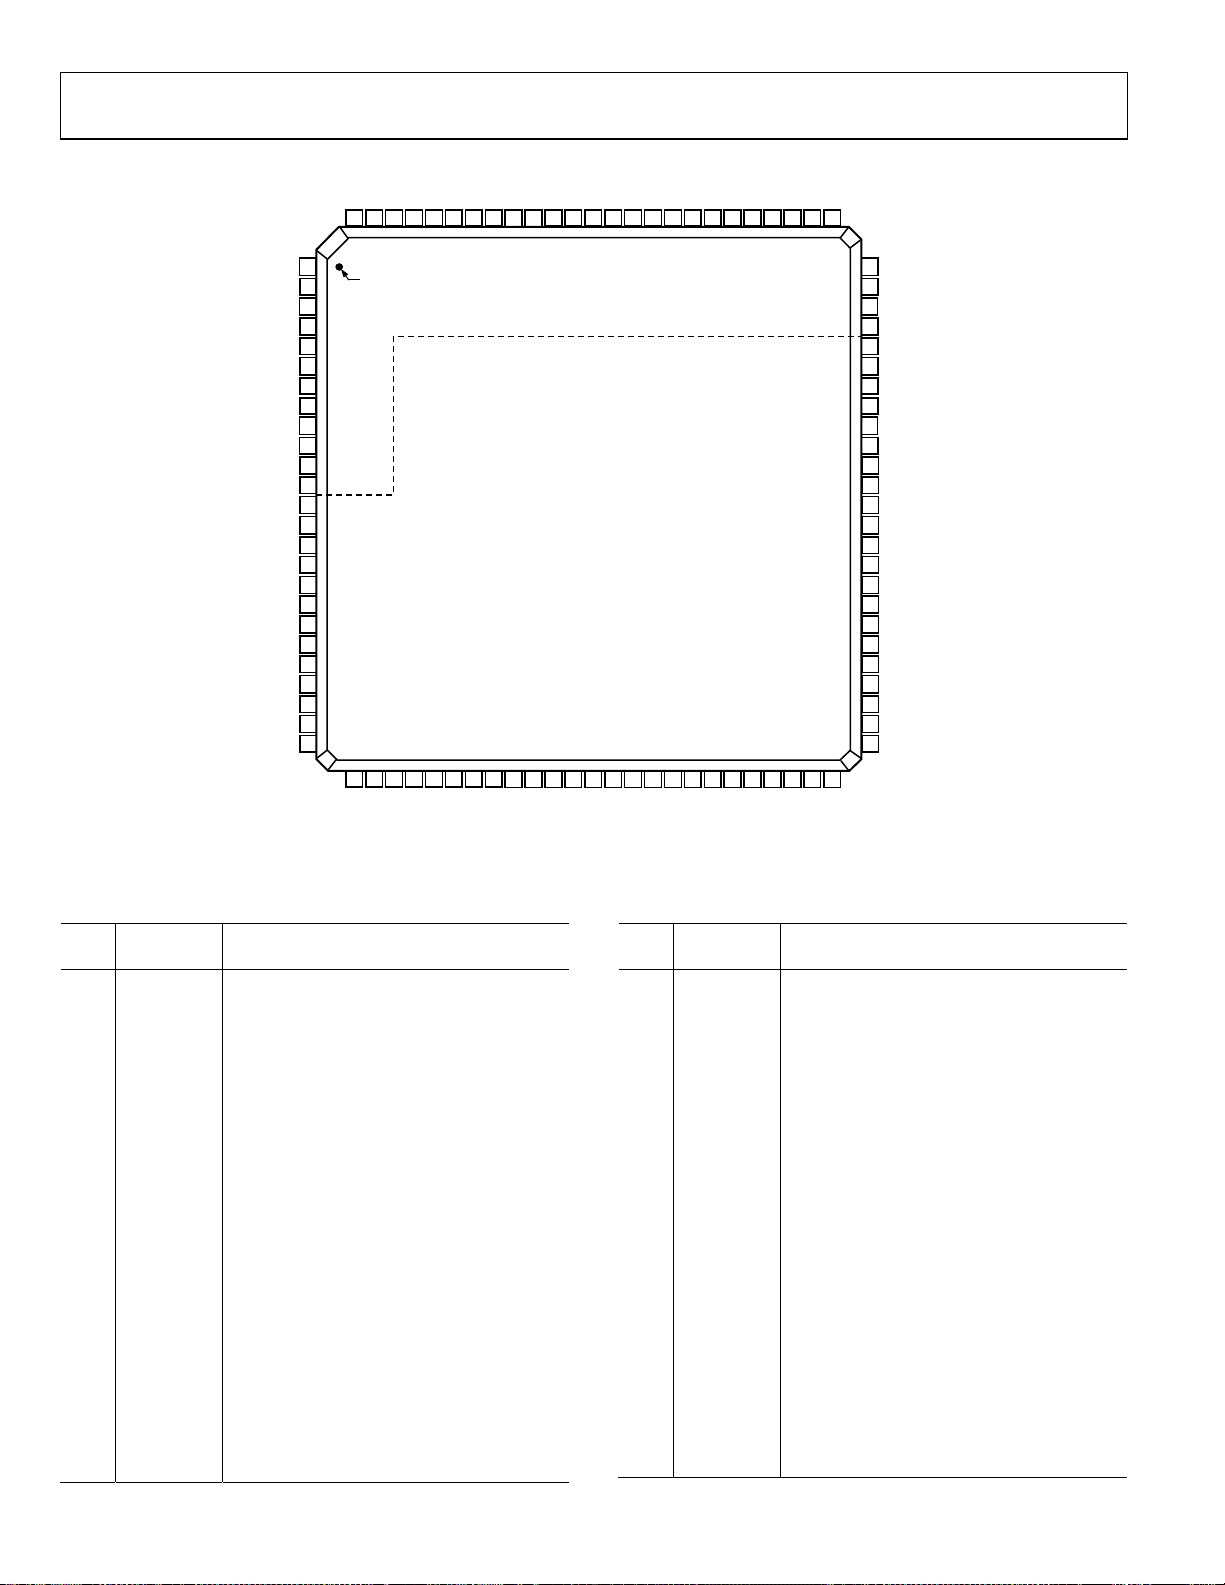
AD9778A
TOP VIEW
(Not to Scale)
32
33
34
DGND
DVDD18
35NC36NC37
P1D<0>
38
39
40
DVDD33
P2D<13>41P2D<12>42P2D<11>
DATACLK
TXENABLE
Figure 4. AD9778A Pin Configuration
75
I120
74
VREF
73
IPTAT
72
AGND
71
IRQ
70
RESET
69
CSB
68
SCLK
67
SDIO
66
SDO
65
PLL_LOCK
64
DGND
63
SYNC_O+
62
SYNC_O–
61
DVDD33
60
DVDD18
59
NC
58
NC
57
P2D<0>
56
P2D<1>
55
P2D<2>
54
DGND
53
DVDD18
52
P2D<3>
51
P2D<4>
43
44
45
46
DGND
P2D<9>47P2D<8>48P2D<7>49P2D<6>50P2D<5>
DVDD18
P2D<10>
06452-003
Table 8. AD9778A Pin Function Descriptions
Pin
No. Mnemonic Description
1 CVDD18 1.8 V Clock Supply.
2 CVDD18 1.8 V Clock Supply.
3 CGND Clock Ground.
4 CGND Clock Common.
5 REFCLK+ Differential Clock Input.
6 REFCLK− Differential Clock Input.
7 CGND Clock Ground.
8 CGND Clock Ground.
9 CVDD18 1.8 V Clock Supply.
10 CVDD18 1.8 V Clock Supply.
11 CGND Clock Ground.
12 AGND Analog Ground.
13 SYNC_I+ Differential Synchronization Input.
14 SYNC_I− Differential Synchronization Input.
15 DGND Digital Ground.
16 DVDD18 1.8 V Digital Supply.
17 P1D<13> Port 1, Data Input D13 (MSB).
18 P1D<12> Port 1, Data Input D12.
19 P1D<11> Port 1, Data Input D11.
20 P1D<10> Port 1, Data Input D10.
21 P1D<9> Port 1, Data Input D9.
Pin
No. Mnemonic Description
22 DGND Digital Ground.
23 DVDD18 1.8 V Digital Supply.
24 P1D<8> Port 1, Data Input D8.
25 P1D<7> Port 1, Data Input D7.
26 P1D<6> Port 1, Data Input D6.
27 P1D<5> Port 1, Data Input D5.
28 P1D<4> Port 1, Data Input D4.
29 P1D<3> Port 1, Data Input D3.
30 P1D<2> Port 1, Data Input D2.
31 P1D<1> Port 1, Data Input D1.
32 DGND Digital Ground.
33 DVDD18 1.8 V Digital Supply.
34 P1D<0> Port 1, Data Input D0 (LSB).
35 NC No Connect.
36 NC No Connect.
37
38 DVDD33 3.3 V Digital Supply.
39 TXENABLE
40 P2D<13> Port 2, Data Input D13 (MSB).
41 P2D<12> Port 2, Data Input D12.
Rev. A | Page 10 of 60
DATACLK
Data Clock Output.
Transmit Enable. In single port mode, this
pin also functions as IQSELECT.
Page 11

AD9776A/AD9778A/AD9779A
Pin
No. Mnemonic Description
42 P2D<11> Port 2, Data Input D11.
43 DVDD18 1.8 V Digital Supply.
44 DGND Digital Ground.
45 P2D<10> Port 2, Data Input D10.
46 P2D<9> Port 2, Data Input D9.
47 P2D<8> Port 2, Data Input D8.
48 P2D<7> Port 2, Data Input D7.
49 P2D<6> Port 2, Data Input D6.
50 P2D<5> Port 2, Data Input D5.
51 P2D<4> Port 2, Data Input D4.
52 P2D<3> Port 2, Data Input D3.
53 DVDD18 1.8 V Digital Supply.
54 DGND Digital Ground.
55 P2D<2> Port 2, Data Input D2.
56 P2D<1> Port 2, Data Input D1.
57 P2D<0> Port 2, Data Input D0 (LSB).
58 NC No Connect.
59 NC No Connect.
60 DVDD18 1.8 V Digital Supply.
61 DVDD33 3.3 V Digital Supply.
62 SYNC_O− Differential Synchronization Output.
63 SYNC_O+ Differential Synchronization Output.
64 DGND Digital Ground.
65 PLL_LOCK PLL Lock Indicator.
66 SDO SPI Port Data Output.
67 SDIO SPI Port Data Input/Output.
68 SCLK SPI Port Clock.
69 CSB SPI Port Chip Select Bar.
70 RESET Reset, Active High.
71 IRQ Interrupt Request.
72 AGND Analog Ground.
Pin
No. Mnemonic Description
73 IPTAT
74 VREF Voltage Reference Output.
75 I120 120 μA Reference Current.
76 AVDD33 3.3 V Analog Supply.
77 AGND Analog Ground.
78 AVDD33 3.3 V Analog Supply.
79 AGND Analog Ground.
80 AVDD33 3.3 V Analog Supply.
81 AGND Analog Ground.
82 AGND Analog Ground.
83 OUT2_P Differential DAC Current Output, Channel 2.
84 OUT2_N Differential DAC Current Output, Channel 2.
85 AGND Analog Ground.
86 AUX2_P Auxiliary DAC Current Output, Channel 2.
87 AUX2_N Auxiliary DAC Current Output, Channel 2.
88 AGND Analog Ground.
89 AUX1_N Auxiliary DAC Current Output, Channel 1.
90 AUX1_P Auxiliary DAC Current Output, Channel 1.
91 AGND Analog Ground.
92 OUT1_N Differential DAC Current Output, Channel 1.
93 OUT1_P Differential DAC Current Output, Channel 1.
94 AGND Analog Ground.
95 AGND Analog Ground.
96 AVDD33 3.3 V Analog Supply.
97 AGND Analog Ground.
98 AVDD33 3.3 V Analog Supply.
99 AGND Analog Ground.
100 AVDD33 3.3 V Analog Supply.
Factory Test Pin. Output current is
proportional to absolute temperature,
approximately 14 μA at 25°C with
approximately 20 nA/°C slope. This pin
should remain floating.
Rev. A | Page 11 of 60
Page 12
AD9776A/AD9778A/AD9779A
AVDD3399AGND98AVDD3397AGND96AVDD3395AGND94AGND93OUT1_P92OUT1_N91AGND90AUX1_P89AUX1_N88AGND87AUX2_N86AUX2_P85AGND84OUT2_N83OUT2_P82AGND81AGND80AVDD3379AGND78AVDD3377AGND76AVDD33
100
CVDD18
CVDD18
CGND
CGND
REFCLK+
REFCLK–
CGND
CGND
CVDD18
CVDD18
CGND
AGND
SYNC_I+
SYNC_I–
DGND
DVDD18
P1D<15>
P1D<14>
P1D<13>
P1D<12>
P1D<11>
DGND
DVDD18
P1D<10>
P1D<9>
1
2
3
4
5
6
7
8
9
10
11
12
13
14
15
16
17
18
19
20
21
22
23
24
25
PIN 1
26
P1D<8>27P1D<7>28P1D<6>29P1D<5>30P1D<4>31P1D<3>
ANALOG DOMAIN
DIGITAL DO MAIN
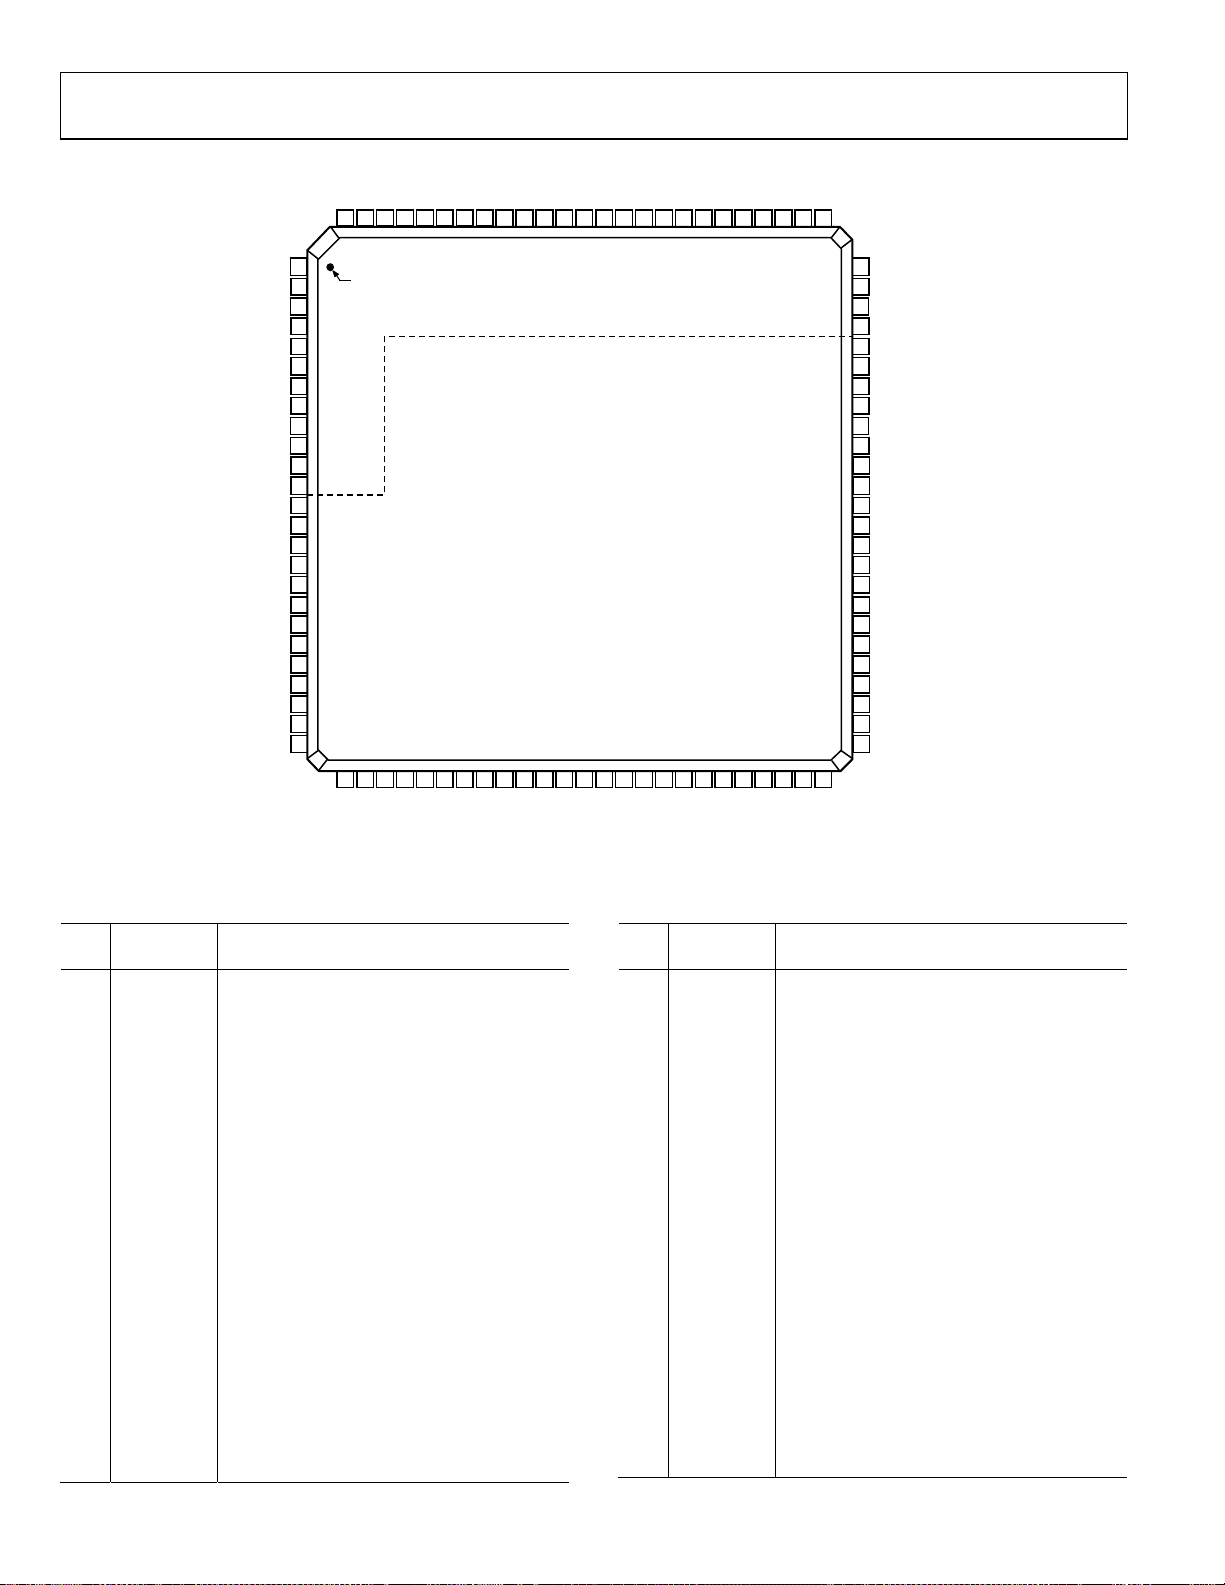
AD9779A
TOP VIEW
(Not to Scale)
32
33
DGND
34
DVDD18
P1D<2>35P1D<1>36P1D<0>
37
38
39
40
DVDD33
P2D<15>41P2D<14>42P2D<13>
XENABLE
DATACLK
Figure 5. AD9779A Pin Configuration
75
I120
74
VREF
73
IPTAT
72
AGND
71
IRQ
70
RESET
69
CSB
68
SCLK
67
SDIO
66
SDO
65
PLL_LOCK
64
DGND
63
SYNC_O+
62
SYNC_O–
61
DVDD33
60
DVDD18
59
P2D<0>
58
P2D<1>
57
P2D<2>
56
P2D<3>
55
P2D<4>
54
DGND
53
DVDD18
52
P2D<5>
51
P2D<6>
43
44
45
48
DGND
DVDD18
P2D<12>46P2D<11>47P2D<10>
P2D<9>49P2D<8>50P2D<7>
6452-004
Table 9. AD9779A Pin Function Descriptions
Pin
No. Mnemonic Description
Pin
No. Mnemonic Description
1 CVDD18 1.8 V Clock Supply. 22 DGND Digital Ground.
2 CVDD18 1.8 V Clock Supply.
3 CGND Clock Ground.
4 CGND Clock Ground.
5 REFCLK+ Differential Clock Input.
6 REFCLK− Differential Clock Input.
7 CGND Clock Ground.
8 CGND Clock Ground.
9 CVDD18 1.8 V Clock Supply.
10 CVDD18 1.8 V Clock Supply.
11 CGND Clock Ground.
12 AGND Analog Ground.
13 SYNC_I+ Differential Synchronization Input.
14 SYNC_I− Differential Synchronization Input.
15 DGND Digital Ground.
16 DVDD18 1.8 V Digital Supply.
17 P1D<15> Port 1, Data Input D15 (MSB).
18 P1D<14> Port 1, Data Input D14.
19 P1D<13> Port 1, Data Input D13.
20 P1D<12> Port 1, Data Input D12.
21 P1D<11> Port 1, Data Input D11.
Rev. A | Page 12 of 60
23 DVDD18 1.8 V Digital Supply.
24 P1D<10> Port 1, Data Input D10.
25 P1D<9> Port 1, Data Input D9.
26 P1D<8> Port 1, Data Input D8.
27 P1D<7> Port 1, Data Input D7.
28 P1D<6> Port 1, Data Input D6.
29 P1D<5> Port 1, Data Input D5.
30 P1D<4> Port 1, Data Input D4.
31 P1D<3> Port 1, Data Input D3.
32 DGND Digital Ground.
33 DVDD18 1.8 V Digital Supply.
34 P1D<2> Port 1, Data Input D2.
35 P1D<1> Port 1, Data Input D1.
36 P1D<0> Port 1, Data Input D0 (LSB).
DATACLK
37
Data Clock Output.
38 DVDD33 3.3 V Digital Supply.
39 TXENABLE
Transmit Enable. In single port mode, this
pin also functions as IQSELECT.
40 P2D<15> Port 2, Data Input D15 (MSB).
41 P2D<14> Port 2, Data Input D14.
Page 13

AD9776A/AD9778A/AD9779A
Pin
No. Mnemonic Description
42 P2D<13> Port 2, Data Input D13.
43 DVDD18 1.8 V Digital Supply.
44 DGND Digital Ground.
45 P2D<12> Port 2, Data Input D12.
46 P2D<11> Port 2, Data Input D11.
47 P2D<10> Port 2, Data Input D10.
48 P2D<9> Port 2, Data Input D9.
49 P2D<8> Port 2, Data Input D8.
50 P2D<7> Port 2, Data Input D7.
51 P2D<6> Port 2, Data Input D6.
52 P2D<5> Port 2, Data Input D5.
53 DVDD18 1.8 V Digital Supply.
54 DGND Digital Ground.
55 P2D<4> Port 2, Data Input D4.
56 P2D<3> Port 2, Data Input D3.
57 P2D<2> Port 2, Data Input D2.
58 P2D<1> Port 2, Data Input D1.
59 P2D<0> Port 2, Data Input D0 (LSB).
60 DVDD18 1.8 V Digital Supply.
61 DVDD33 3.3 V Digital Supply.
62 SYNC_O− Differential Synchronization Output.
63 SYNC_O+ Differential Synchronization Output.
64 DGND Digital Ground.
65 PLL_LOCK PLL Lock Indicator.
66 SDO SPI Port Data Output.
67 SDIO SPI Port Data Input/Output.
68 SCLK SPI Port Clock.
69 CSB SPI Port Chip Select Bar.
70 RESET Reset, Active High.
71 IRQ Interrupt Request.
72 AGND Analog Ground.
Pin
No. Mnemonic Description
73 IPTAT
74 VREF Voltage Reference Output.
75 I120 120 μA Reference Current.
76 AVDD33 3.3 V Analog Supply.
77 AGND Analog Ground.
78 AVDD33 3.3 V Analog Supply.
79 AGND Analog Ground.
80 AVDD33 3.3 V Analog Supply.
81 AGND Analog Ground.
82 AGND Analog Ground.
83 OUT2_P Differential DAC Current Output, Channel 2.
84 OUT2_N Differential DAC Current Output, Channel 2.
85 AGND Analog Ground.
86 AUX2_P Auxiliary DAC Current Output, Channel 2.
87 AUX2_N Auxiliary DAC Current Output, Channel 2.
88 AGND Analog Ground.
89 AUX1_N Auxiliary DAC Current Output, Channel 1.
90 AUX1_P Auxiliary DAC Current Output, Channel 1.
91 AGND Analog Ground.
92 OUT1_N Differential DAC Current Output, Channel 1.
93 OUT1_P Differential DAC Current Output, Channel 1.
94 AGND Analog Ground.
95 AGND Analog Ground.
96 AVDD33 3.3 V Analog Supply.
97 AGND Analog Ground.
98 AVDD33 3.3 V Analog Supply.
99 AGND Analog Ground.
100 AVDD33 3.3 V Analog Supply.
Factory Test Pin. Output current is
proportional to absolute temperature,
approximately 14 μA at 25°C with
approximately 20 nA/°C slope. This pin
should remain floating.
Rev. A | Page 13 of 60
Page 14
AD9776A/AD9778A/AD9779A
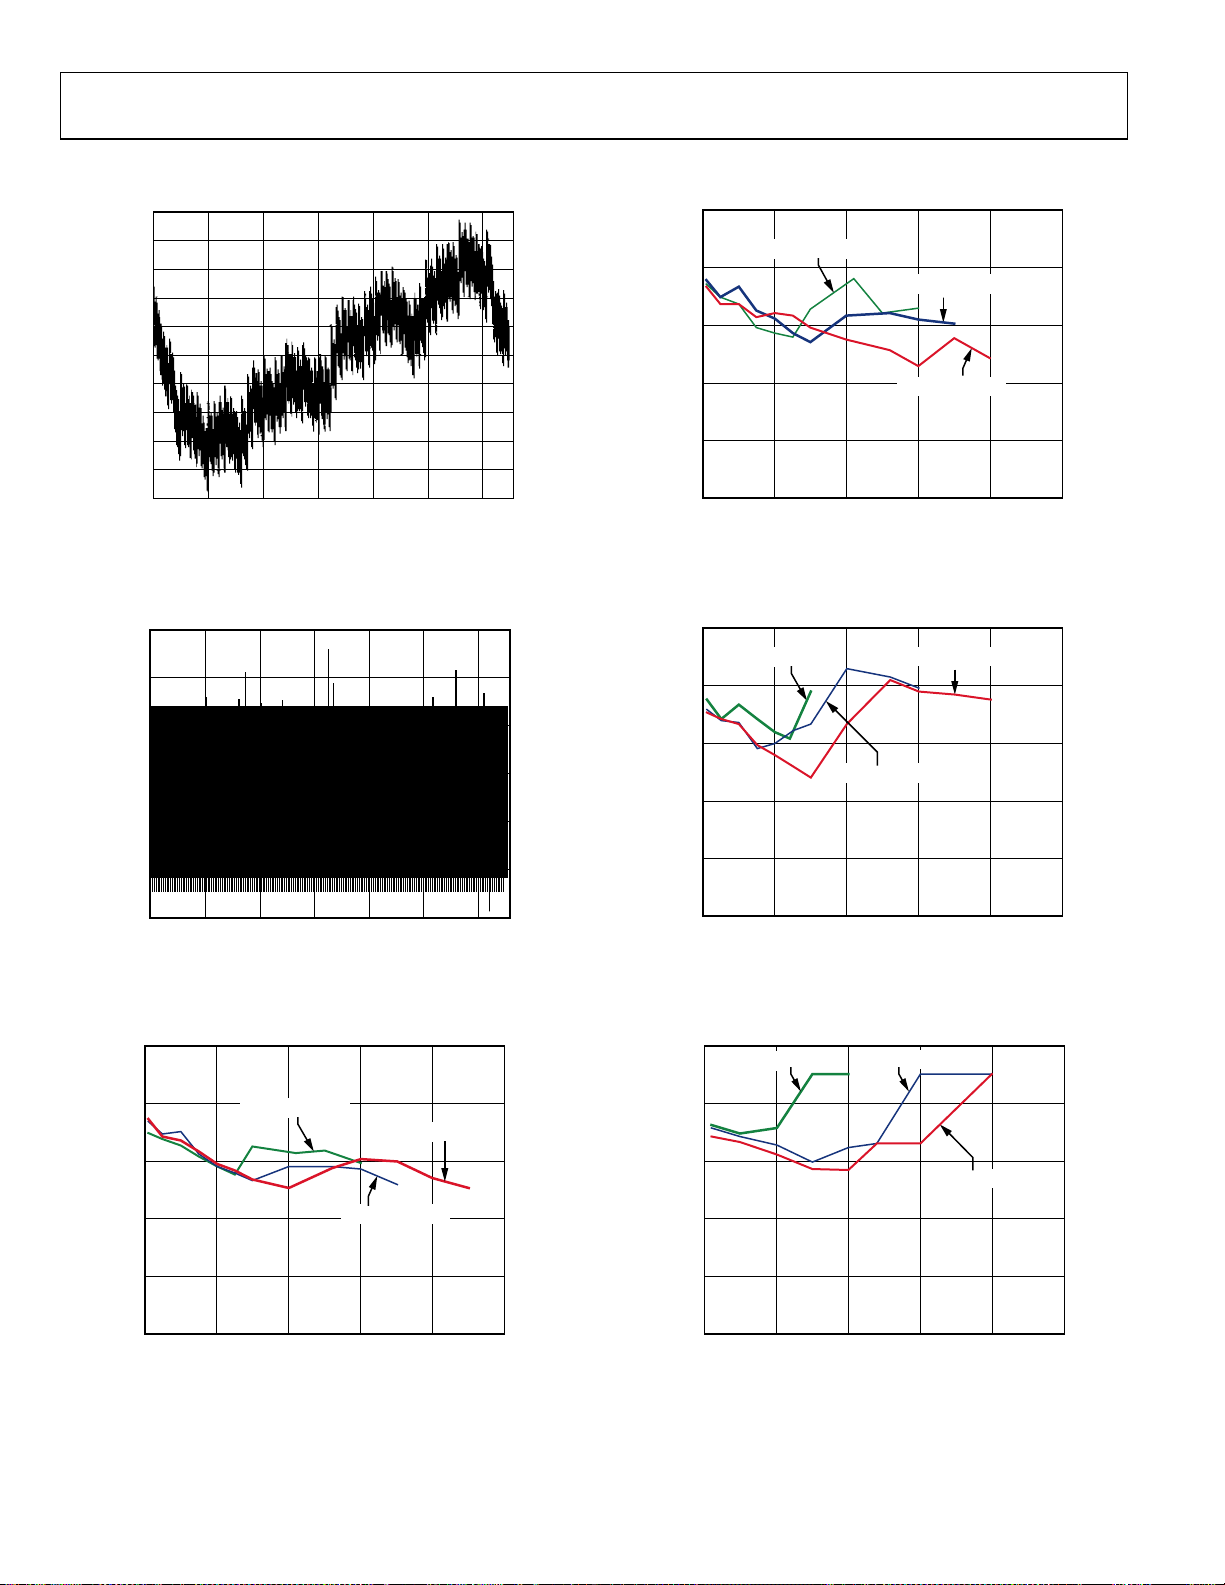
TYPICAL PERFORMANCE CHARACTERISTICS
4
3
2
1
0
–1
–2
INL (16-BIT LSB)
–3
–4
–5
–6
10k 20k 30k 60k50k
0
CODE
40k
06452-005
Figure 6. AD9779A Typical INL
100
f
= 160MSPS
90
80
70
SFDR (dBc)
60
50
0
DATA
f
= 200MSPS
DATA
f
= 250MSPS
DATA
20 40 60 80
f
(MHz)
OUT
Figure 9. AD9779A In-Band SFDR vs. f
OUT
100
06452-008
,
2× Interpolation
DNL (16-BIT L SB)
100
SFDR (dBc)
1.5
1.0
0.5
0
–0.5
–1.0
–1.5
–2.0
0 60k50k40k30k20k10k
90
80
70
CODE
Figure 7. AD9779A Typical DNL
f
= 160MSPS
DATA
f
DATA
f
= 200MSPS
DATA
= 250MSPS
100
f
f
= 100MSPS
DATA
90
80
f
= 150MSPS
DATA
70
SFDR (dBc)
60
50
0
6452-006
20 40 60 80
f
(MHz)
OUT
Figure 10. AD9779A In-Band SFDR vs. f
DATA
= 200MSPS
OUT
100
06452-009
,
4× Interpolation
100
f
= 50MSPS
DATA
90
80
70
SFDR (dBc)
f
DATA
= 100MSPS
f
DATA
= 125MSPS
60
50
0
20 40 60 80
f
OUT
Figure 8. AD9779A In-Band SFDR vs. f
(MHz)
OUT
100
06452-007
,
1× Interpolation
60
50
0
10 20 30 40
Figure 11. AD9779A In-Band SFDR vs. f
8× Interpolation
f
OUT
(MHz)
OUT
50
06452-010
,
Rev. A | Page 14 of 60
Page 15
AD9776A/AD9778A/AD9779A
100
100
90
f
= 160MSPS
DATA
80
70
SFDR (dBc)
60
50
0
20 40 60 80
Figure 12. AD9779A Out-of-Band SFDR vs. f
f
OUT
f
DATA
(MHz)
= 200MSPS
f
DATA
= 250MSPS
,
OUT
100
06452-011
2× Interpolation
100
90
80
f
= 150MSPS
DATA
70
SFDR (dBc)
f
= 100MSPS
DATA
90
80
70
SFDR (dBc)
60
50
0
10 20 30
f
OUT
PLL OFF
(MHz)
Figure 15. AD9779A In-Band SFDR, 4× Interpolation,
= 100 MSPS, PLL On/Off
f
DATA
100
90
80
70
SFDR (dBc)
0dBFS
–3dBFS
–6dBFS
PLL ON
40
06452-014
60
50
0
20 40 60 80
Figure 13. AD9779A Out-of-Band SFDR vs. f
f
OUT
(MHz)
f
DATA
= 200MSPS
OUT
100
06452-012
,
4× Interpolation
100
90
f
80
70
SFDR (dBc)
60
50
0
10 20 30 40
Figure 14. AD9779A Out-of-Band SFDR vs. f
DATA
= 50MSPS
f
DATA
f
OUT
= 125MSPS
(MHz)
f
DATA
= 100MSPS
,
OUT
50
06452-013
8× Interpolation
60
50
0
20 40 60
f
(MHz)
OUT
Figure 16. AD9779A In-Band SFDR vs. f
OUT
80
06452-015
,
Digital Full Scale
100
90
80
70
SFDR (dBc)
60
50
0
Figure 17. AD9779A In-Band SFDR vs. f
10mA
20mA
30mA
20 40 60
f
(MHz)
OUT
OUT
80
06452-016
,
Output Full-Scale Current
Rev. A | Page 15 of 60
Page 16
AD9776A/AD9778A/AD9779A
IMD (dBc)
100
90
f
80
70
60
50
0
= 250MSPS
DATA
20 40 60 80 100
f
OUT
Figure 18. AD9779A Third-Order IMD vs. f
1× Interpolation
f
DATA
(MHz)
= 160MSPS
f
DATA
= 200MSPS
,
OUT
120
06452-017
IMD (dBc)
100
90
80
70
f
50
DATA
75
= 50MSPS
150
125
100
175
f
DATA
f
OUT
200
60
50
0
25
Figure 21. AD9779A Third-Order IMD vs. f
8× Interpolation
f
= 75MSPS
DATA
= 125MSPS
250
225
(MHz)
275
f
300
DATA
= 100MSPS
350
325
OUT
375
,
400
425
450
06452-020
100
f
= 160MSPS
DATA
90
80
IMD (dBc)
70
60
50
0 20 40 60 80 100 120 140 160 180 200
f
DATA
= 200MSPS
f
OUT
(MHz)
Figure 19. AD9779A Third-Order IMD vs. f
2× Interpolation
100
90
80
f
= 150MSPS
DATA
IMD (dBc)
70
f
= 100MSPS
DATA
60
f
= 200MSPS
DATA
50
0
40 80 120 160 200 240 280 320 360
f
(MHz)
OUT
Figure 20. AD9779A Third-Order IMD vs. f
4× Interpolation
f
DATA
= 250MSPS
,
OUT
,
OUT
220
400
100
90
80
PLL OFF
IMD (dBc)
70
60
50
0
20 40 60 80 120 140 160 180
06452-018
Figure 22. AD9779A Third-Order IMD vs. f
4× Interpolation, f
100
95
90
85
80
75
IMD (dBc)
70
65
60
55
50
0
40 80 120 160 200 240 280 320
06452-019
Figure 23. AD9779A Third-Order IMD vs. f
50 Parts, 4× Interpolation, f
PLL ON
100
f
(MHz)
OUT
= 100 MSPS, PLL On vs. PLL Off
DATA
f
(MHz)
OUT
OUT
= 200 MSPS
DATA
,
OUT
, over
200
06452-021
400360
06452-022
Rev. A | Page 16 of 60
Page 17
AD9776A/AD9778A/AD9779A
–
100
95
90
85
80
75
IMD (dBc)
70
65
60
55
50
0 400
0dBFS
–3dBFS
–6dBFS
80 160 240 36032040 120 200 280
f
(MHz)
OUT
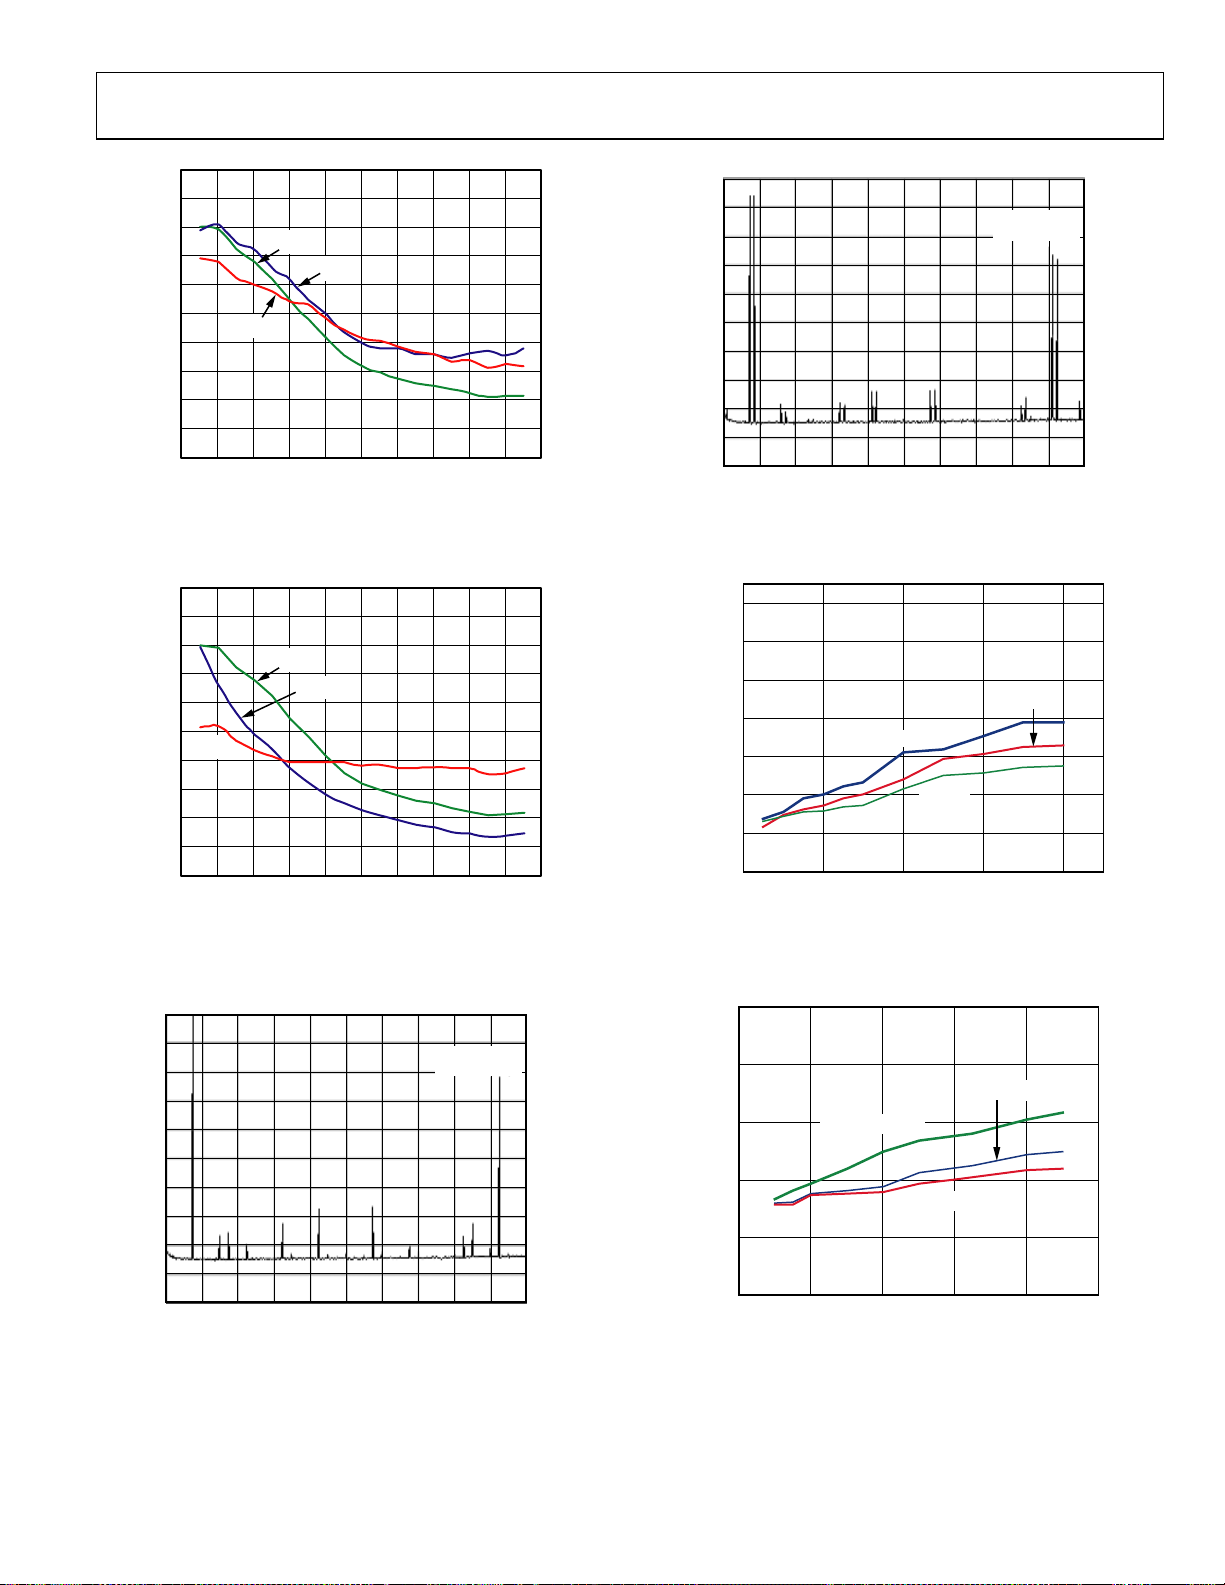
Figure 24. AD9779A IMD Performance vs. Digital Full-Scale Input over
Output Frequency, 4× Interpolation, f
= 200 MSPS
DATA
REF 0dBm
*PEAK
Log
10dB
LGAV
51
S2
W1
FC
S3
AA
£(f):
FTUN
SWP
START 1.0MHz
06452-117
*RES BW 20kHz
4× Interpolation, f
*ATTEN 20dB
EXT REF
DC-COUPLED
VBW 20kHz
STOP 400.0M Hz
SWEEP 1.203s (601 pts)
Figure 27. AD9779A Two-Tone Spectrum,
= 100 MSPS, f
DATA
= 30 MHz, 35 MHz
OUT
06452-024
100
95
90
85
80
75
30mA
IMD (dBc)
70
65
60
55
50
0 400
20mA
10mA
80 160 240 36032040 120 200 280
f
(MHz)
OUT
Figure 25. AD9779A IMD Performance vs. Full-Scale Output Current over
Output Frequency, 4× Interpolation, f
REF 0dBm
*PEAK
Log
10dB
LGAV
51
S2
W1
FC
S3
AA
£(f):
FTUN
SWP
START 1.0MHz
*RES BW 20kHz
*ATTEN 20dB
VBW 20kHz
= 200 MSPS
DATA
EXT REF
DC-COUPLED
STOP 400.0M Hz
SWEEP 1.203s (601 pts)
06452-023
Figure 26. AD9779A Single Tone, 4× Interpolation,
f
= 100 MSPS, f
DATA
= 30 MHz
OUT
–142
–146
–150
–154
–158
NSD (dBm/Hz)
–162
–166
–170
0
06452-118
20 40 60 80
0dBFS
f
OUT
–6dBFS
(MHz)
–3dBFS
06452-025
Figure 28. AD9779A Noise Spectral Density vs. Digital Full-Scale over Output
Frequency of Single Tone Input, f
= 200 MSPS,
DATA
2× Interpolation
150
–154
f
= 400MSPS
DAC
f
–158
–162
NSD (dBm/Hz)
–166
–170
0
Figure 29. AD9779A Noise Spectral Density vs. f
Eight-Tone Input with 500 kHz Spacing, f
= 200MSPS
DAC
f
= 800MSPS
DAC
20 40 60 80
f
(MHz)
OUT
over Output Frequency for
DAC
= 200 MSPS
DATA
100
06452-026
Rev. A | Page 17 of 60
Page 18
AD9776A/AD9778A/AD9779A
–
–
–
–
150
55
–154
f
= 200MSPS
DAC
f
f
DAC
= 400MSPS
DAC
= 800MSPS
NSD (dBm/Hz)
–158
–162
–166
–170
0
20 40 60 80
f
(MHz)
OUT
Figure 30. AD9779A Noise Spectral Density vs. f
over Output Frequency
DAC
100
06452-027
with a Single Tone Input at −6 dBFS
55
–60
–65
0dBFS, PLL ENABLED
0dBFS, PL L DISABLED
–70
–75
ACLR (dBc)
–3dBFS, PLL DISABLED
–80
–6dBFS, PL L DISABLED
–85
–90
0
f
(MHz)
OUT
26024022020018016014012010080604020
06452-300
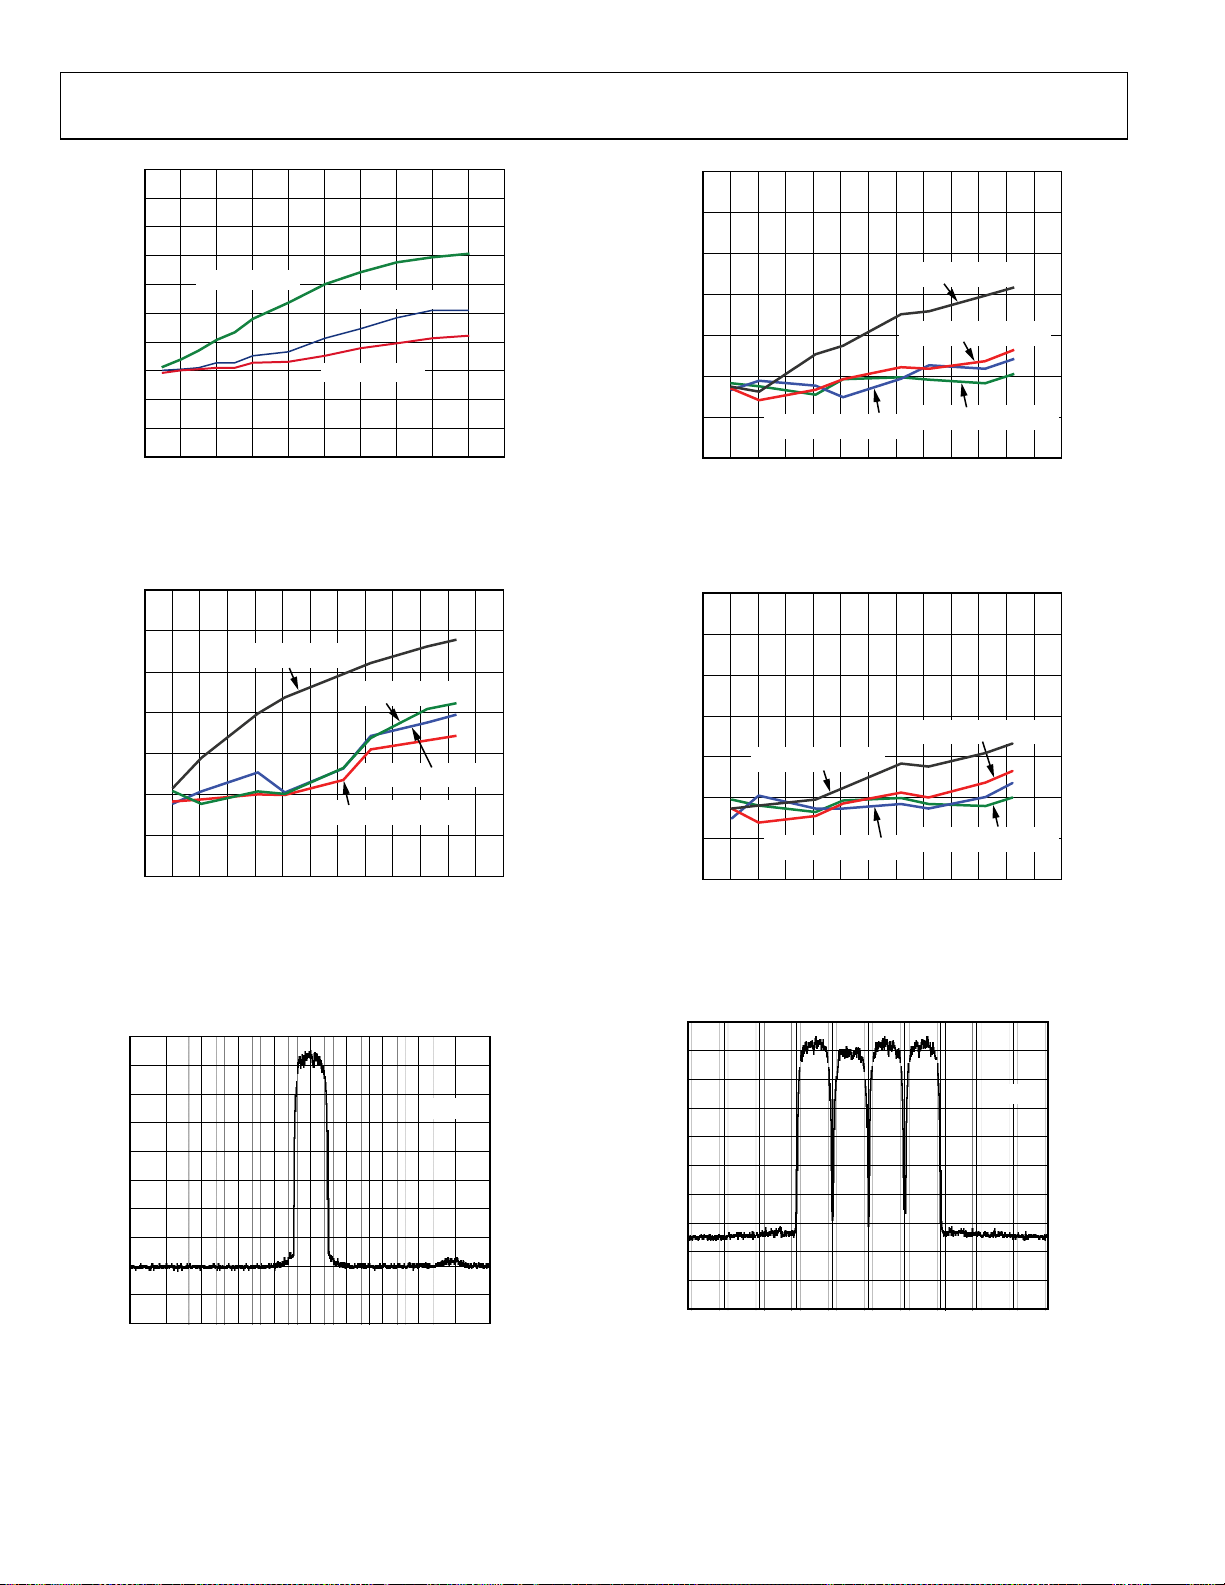
Figure 31. AD9779A ACLR for First Adjacent Band W-CDMA, 4× Interpolation,
= 122.88 MSPS, On-Chip Modulation Translates Baseband Signal to IF
f
DATA
REF –25.28dBm
*AVG
Log
10dB
*ATTEN 4dB
EXT REF
–60
–65
0dBFS, PLL ENABLED
–70
ACLR (dBc)
–75
–6dBFS, PLL DISABLED
–80
–85
–90
–3dBFS , PLL DISABL ED
0
f
OUT
0dBFS, PLL DISABLED
(MHz)
Figure 33. AD9779A ACLR for Second Adjacent Band W-CDMA,
4× Interpolation, f
= 122.88 MSPS;
DATA
On-Chip Modulation Translates Baseband Signal to IF
55
–60
–65
ACLR (dBc)
–70
–75
0dBFS, PL L ENABLED
–6dBFS, PL L DISABLE D
–80
–85
–90
–3dBFS , PLL DISABL ED
0
f
OUT
0dBFS, PLL DISABLED
(MHz)
Figure 34. AD9779A ACLR for Third Adjacent Band W-CDMA, 4×
Interpolation, f
= 122.88 MSPS, On-Chip Modulation Translates
DATA
Baseband Signal to IF
REF –30.28dBm
*AVG
Log
10dB
*ATTEN 4dB
EXT REF
26024022020018016014012010080604020
06452-301
26024022020018016014012010080604020
06452-302
PAVG
PAVG
10
W1 S2
CENTER 143.88MHz
*RES BW 30kHz
RMS RESULTS
CARRIER POW ER
–12.49dBm/
3.84000MHz
FREQ OFFSET
5.000MHz
10.00MHz
15.00MHz
VBW 300kHz
REF BW
3.840MHz
3.840MHz
3.840MHz
SWEEP 162. 2ms (601 pts)
LOWER
dBm
dBc
–89.23
–76.75
–93.43
–80.94
–92.44
–79.95
Figure 32. AD9779A W-CDMA Signal, 4× Interpolation,
= 122.88 MSPS, f
f
DATA
/4 Modulation
DAC
SPAN 50MHz
UPPER
dBc
–77.42
–80.47
–78.96
dBm
–89.91
–92.96
–91.45
06452-031
10
W1 S2
CENTER 151.38MHz
*RES BW 30kHz
TOTAL CARRIER POWER –12.61dBm/15.3600MHz
REF CARRIER PO WER –17.87dBm/3.84000MHz
1 –17.87dBm
2 –20.65dBm
3 –18.26dBm
4 –18.23dBm
VBW 300kHz
FREQ OFFSET
5.000MHz
10.00MHz
15.00MHz
INTEG BW
3.840MHz
3.840MHz
3.840MHz
Figure 35. AD9779A Multicarrier W-CDMA Signal,
4× Interpolation, f
= 122.88 MSPS, f
DAC
dBc
dBm
–67.70
–85.57
–69.32
–97.87
–71.00
–99.52
/4 Modulation
DAC
SPAN 50MHz
UPPER
SWEEP 162. 2ms (601 pts)
LOWER
dBc
–67.70
–70.00
–71.65
dBm
–85.57
–87.19
–88.88
06452-032
Rev. A | Page 18 of 60
Page 19

AD9776A/AD9778A/AD9779A
1.5
1.0
0.5
0
INL (14-BIT LSB)
–0.5
–1.0
–1.5
0
2k 4k 6k 8k
CODE
10k
6452-033
Figure 36. AD9778A Typical INL
0.6
0.4
0.2
0
–0.2
–0.4
DNL (14-BIT L SB)
–0.6
–0.8
–1.0
0
CODE
16k14k12k10k8k6k4k2k
06452-034
Figure 37. AD9778A Typical DNL
100
90
f
= 160MSPS
DATA
f
DATA
= 200MSPS
80
f
= 250MSPS
70
SFDR (dBc)
DATA
60
50
0
20 40 60 80
f
(MHz)
OUT
Figure 39. AD9778A In-Band SFDR vs. f
, 2× Interpolation
OUT
100
–60
ACLR (dBc)
–70
3RD ADJ CHAN
1ST ADJ CHAN
–80
2ND ADJ CHAN
–90
0
25 50 75 100 125 150 175 200 225
f
(MHz)
OUT
250
Figure 40. AD9778A ACLR, Single Carrier W-CDMA, 4× Interpolation,
f
= 122.88 MSPS, Amplitude = −3 dBFS
DATA
06452-036
06452-037
100
90
80
IMD (dBc)
70
4× 100MSPS
60
50
0
40 80 120 160 200 240 280 320 360
Figure 38. AD9778A IMD vs. f
4× 150MSPS
f
(MHz)
OUT
4× 200MSPS
, 4× Interpolation
OUT
400
06452-035
Rev. A | Page 19 of 60
REF –25.39dBm
*AVG
Log
10dB
PAVG
10
W1 S2
CENTER 143.88MHz
*RES BW 30kHz
RMS RESULTS
CARRIER POW ER
–12.74dBm/
3.84000MHz
FREQ OFFSET
5.000MHz
10.00MHz
15.00MHz
Figure 41. AD9778A ACLR, f
*ATTEN 4dB
VBW 300kHz
REF BW
3.884MHz
3.840MHz
3.840MHz
/4 Modulation
f
DAC
dBm
–89.23
–92.87
–93.64
SPAN 50MHz
UPPER
dBc
–76.89
–80.02
–79.53
dBm
–89.63
–92.76
–92.27
SWEEP 162. 2ms (601 pts)
LOWER
dBc
–76.49
–80.13
–80.90
= 122.88 MSPS, 4× Interpolation,
DATA
06452-038
Page 20

AD9776A/AD9778A/AD9779A
–
–
NSD (dBm/Hz)
150
–154
–158
–162
–166
f
DAC
= 200MSPS
f
f
DAC
= 400MSPS
DAC
= 800MSPS
DNL (12-BIT LSB)
0.20
0.15
0.10
0.05
0
–0.05
–0.10
–0.15
–170
0
20 40 60 80
f
(MHz)
OUT
Figure 42. AD9778A Noise Spectral Density vs. f
DATA
(MHz)
= 200 MSPS
f
DAC
NSD (dBm/Hz)
150
–154
–158
–162
–166
–170
with 500 kHz Spacing, f
f
= 200MSPS
DAC
0
20 40 60 80
f
DAC
= 800MSPS
f
OUT
Figure 43. AD9778A Noise Spectral Density vs. f
at −6 dBFS, f
0.4
= 200 MSPS
DATA
for Eight-Tone Input
OUT
= 400MSPS
with Single Tone Input
OUT
100
100
–0.20
0
512 1024 1536 2560 3072 3584
06452-039
2048
CODE
4096
06452-042
Figure 45. AD9776A Typical DNL
100
95
90
85
80
75
IMD (dBc)
70
65
60
55
50
0
40 80 120 160 200 240 280 320 360
06452-040
Figure 46. AD9776A IMD vs. f
100
4× 100MSPS
4× 150MSPS
f
(MHz)
OUT
4× 200MSPS
, 4× Interpolation
OUT
400
06452-043
0.3
0.2
0.1
0
–0.1
INL (12-BIT LSB)
–0.2
–0.3
–0.4
0
512 1024 256020481536 3072 3584
CODE
4096
06452-041
Figure 44. AD9776A Typical INL
90
f
= 160MSPS
DATA
80
70
SFDR (dBc)
60
50
f
= 200MSPS
DATA
0
20 40 60 80
f
OUT
Figure 47. AD9776A In-Band SFDR vs. f
(MHz)
f
= 250MSPS
DATA
, 2× Interpolation
OUT
100
06452-044
Rev. A | Page 20 of 60
Page 21

AD9776A/AD9778A/AD9779A
–
–
–
55
–60
–65
–70
–75
ACLR (d Bc)
–80
–85
3RD ADJ CHAN
1ST ADJ CHAN
2ND ADJ CHAN
NSD (dBm/Hz)
150
–154
–158
–162
–166
f
DAC
= 200MSPS
f
= 800MSPS
DAC
f
= 400MSPS
DAC
–90
0 250
25 50 75 100 125 150 175 200 225
(MHz)
F
OUT
Figure 48. AD9776A ACLR, f
REF –25.29dBm
*AVG
Log
10dB
PAVG
10
W1 S2
CENTER 143.88MHz
*RES BW 30kHz
RMS RESULTS
CARRIER POW ER
–12.67dBm/
3.84000MHz
FREQ OFFSET
5.000MHz
10.00MHz
15.00MHz
*ATTEN 4dB
VBW 300kHz
= 122.88 MSPS, 4× Interpolation,
DATA
/4 Modulation
f
DAC
SWEEP 162. 2ms (601 pts)
REF BW
3.884MHz
3.840MHz
3.840MHz
LOWER
dBc
–75.00
–78.05
–77.73
dBm
–87.67
–90.73
–90.41
dBc
–75.30
–77.99
–77.50
SPAN 50MHz
UPPER
dBm
–87.97
–90.66
–90.17
Figure 49. AD9776A, Single Carrier W-CDMA, 4× Interpolation,
= 122.88 MSPS, Amplitude = −3 dBFS
f
DATA
–170
0
10 30 50 70 90
20 40 60 80
f
(MHz)
= 200MSPS
f
= 800MSPS
DAC
f
OUT
OUT
DATA
f
(MHz)
OUT
= 200 MSPS
= 400MSPS
DAC
, Eight-Tone Input
06452-045
Figure 50. AD9776A Noise Spectral Density vs. f
with 500 kHz Spacing, f
150
f
DAC
–154
–158
–162
NSD (dBm/Hz)
–166
–170
0
10 30 50 70 90
20 40 60 80
06452-046
Figure 51. AD9776A Noise Spectral Density vs. f
Single Tone Input at −6 dBFS, f
= 200 MSPS
DATA
OUT
100
06452-047
100
06452-048
,
Rev. A | Page 21 of 60
Page 22

AD9776A/AD9778A/AD9779A
TERMINOLOGY
Integral Nonlinearity (INL)
INL is defined as the maximum deviation of the actual analog
output from the ideal output, determined by a straight line
drawn from zero scale to full scale.
Differential Nonlinearity (DNL)
DNL is the measure of the variation in analog value, normalized
to full scale, associated with a 1 LSB change in digital input code.
Monotonicity
A DAC is monotonic if the output either increases or remains
constant as the digital input increases.
Offset Error
The deviation of the output current at Code 0 from the ideal
of zero is called offset error. For I
when the inputs are all 0s. For I
, 0 mA output is expected
OUTA
, 0 mA output is expected
OUTB
when all inputs are set to 1s.
Gain Error
Gain error is difference between the actual and ideal output
span. The actual span is determined by the difference between
the full-scale output and bottom-scale output.
Output Compliance Range
Output compliance range is the range of allowable voltage at
the output of a current-output DAC. Operation beyond the
maximum compliance limits can cause either output stage
saturation or breakdown, resulting in nonlinear performance.
Temp er at u re D ri ft
Temperature drift is specified as the maximum change from
the ambient (25°C) value to the value at either T
MIN
or T
MAX
.
For offset and gain drift, the drift is reported in ppm of fullscale range (FSR) per degree Celsius. For reference drift, the
drift is reported in ppm per degree Celsius.
Power Supply Rejection (PSR)
PSR is the maximum change in the full-scale output as the
supplies are varied from minimum to maximum specified
voltages.
Settling Time
Settling time is the time required for the output to reach and
remain within a specified error band around its final value,
measured from the start of the output transition.
In-Band Spurious Free Dynamic Range (SFDR)
In-band SFDR is the difference, in decibels, between the peak
amplitude of the output signal and the peak spurious signal
between dc and the frequency equal to half the input data rate.
Out-of-Band Spurious Free Dynamic Range (SFDR)
Out-of-band SFDR is the difference, in decibels, between the
peak amplitude of the output signal and the peak spurious signal
within the band that starts at the frequency of the input data
rate and ends at the Nyquist frequency of the DAC output sample
rate. Normally, energy in this band is rejected by the interpolation
filters. This specification, therefore, defines how well the interpolation filters work and the effect of other parasitic coupling
paths to the DAC output.
Total Harmonic Distortion (THD)
THD is the ratio of the rms sum of the first six harmonic components to the rms value of the measured fundamental. It is
expressed as a percentage or in decibels.
Signal-to-Noise Ratio (SNR)
SNR is the ratio of the rms value of the measured output signal
to the rms sum of all other spectral components below the
Nyquist frequency, excluding the first six harmonics and dc.
The value for SNR is expressed in decibels.
Interpolation Filter
If the digital inputs to the DAC are sampled at a multiple rate of
f
(interpolation rate), a digital filter can be constructed that
DATA
has a sharp transition band near f
appear around f
(output data rate) can be greatly suppressed.
DAC
/2. Images that typically
DATA
Adjacent Channel Leakage Ratio (ACLR)
ACLR is the ratio in dBc between the measured power within a
channel relative to its adjacent channel.
Complex Image Rejection
In a traditional two part upconversion, two images are created
around the second IF frequency. These images have the effect of
wasting transmitter power and system bandwidth. By placing
the real part of a second complex modulator in series with the
first complex modulator, either the upper or lower frequency
image near the second IF can be rejected.
Rev. A | Page 22 of 60
Page 23

AD9776A/AD9778A/AD9779A
THEORY OF OPERATION
The AD9776A/AD9778A/AD9779A have many features that
make them highly suited for wired and wireless communications
systems. The dual digital signal path and dual DAC structure
allow an easy interface with common quadrature modulators
when designing single sideband transmitters. The speed and
performance of the parts allow wider bandwidths and more
carriers to be synthesized than in previously available DACs.
The digital engine uses an innovative filter architecture that
combines the interpolation with a digital quadrature modulator.
This allows the parts to perform digital quadrature frequency
upconversions. The on-chip synchronization circuitry enables
multiple devices to be synchronized to each other, or to a
system clock.
DIFFERENCES BETWEEN AD9776/AD9778/ AD9779 AND AD9776A/AD9778A/AD9779A
REFCLK Maximum Frequency vs. Supply
With some restrictions on the DVDD18 and CVDD18 power
supplies, the AD9776A/AD9778A/AD9779A support a maximum sample rate of 1100 MHz. Tabl e 2 lists the valid operating
frequencies vs. power supply voltage.
REFCLK Amplitude
With a differential sinusoidal clock applied to REFCLK, the
PLL on the AD9776/AD9778/AD9779 does not achieve optimal
noise performance unless the REFCLK differential amplitude is
increased to 2 V p-p. Note that if an LVPECL driver is used on the
AD9776/AD9778/AD9779, the PLL gives optimal performance if
the REFCLK amplitude is well within LVPECL specifications
(<1.6 V p-p differential). The design of the PLL on the AD9779A
has been improved so that even with a sinusoidal clock, the PLL
still achieves optimal amplitude with the swing = 1.6 V p-p.
PLL Lock Ranges
The individual lock ranges for the AD9776A/AD9778A/AD9779A
PLL are wider than those for the AD9776/AD9778/AD9779.
Table 10.
BW Adjustment,
Register 0x0A
Part No.
AD9776/AD9778/AD9779 11111 111 010 00
AD9776A/AD9778A/AD9779A 01111 011 011 11
Bits<4:0>
PLL Bias Setting,
Register 0x09
Bits<2:0>
This means that the AD9776A/AD9778A/AD9779A PLL
remains in lock in a given range over a wider temperature range
than the AD9776/ AD9778/AD9779. See Tab l e 21 for PLL lock
ranges for the AD9776A/AD9778A/AD9779A.
PLL Optimal Settings
The optimal settings for the AD9776/AD9778/AD9779 differ
from the AD9776A/AD9778A/AD9779A. Refer to the PLL Bias
Settings section for complete details.
Input Data Delay Line, Manual and Automatic Correction Modes
The AD9776A/AD9778A/AD9779A can be programmed to
sense when the timing margin on the input data falls below
a preset threshold and to take action. The device can be
programmed to either set the IRQ (pin and register) or
automatically reoptimize the timing input data timing.
Input Data Timing
See Tab le 2 5 for timing specifications vs. temperature. The
input data timing specifications (setup and hold) have changed
in the AD9776A/AD9778A/AD9779A. They are not the same
as the timing specifications in the AD9776/AD9778/AD9779.
DATACLK D elay R ange
In the AD9776/AD9778/AD9779, the input data delay was
controlled by Register 4, Bits<7:4>. At 25°C, the delay was
stepped by approximately 180 ps/increment. In the AD9779A,
an extra bit has been added, which effectively doubles the delay
range. This bit is now located at Register 1, Bit 1. The increment/
step on the AD9776A/AD9778A/AD9779A remains at ~180 ps.
Versi on Regi st e r
The version register (Register 0x1F) of the AD9776A/AD9778A/
AD9779A reads a value of 0x03. The version register of the
AD9776/AD9778/AD9779 reads a value of 0x02.
Optimal PLL Value,
Register 0x0A
Bits<7:5>
PLL VCO AGC,
Register 0x08
Bits<1:0>
Rev. A | Page 23 of 60
Page 24

AD9776A/AD9778A/AD9779A
S
SERIAL PERIPHERAL INTERFACE
The SPI port is a flexible, synchronous serial communications
port allowing easy interface to many industry-standard microcontrollers and microprocessors. The port is compatible with
most synchronous transfer formats including both the Motorola
SPI and Intel® SSR protocols.
The interface allows read and write access to all registers
that configure the AD9776A/AD9778A/AD9779A. Single
or multiple byte transfers are supported as well as MSB first
or LSB first transfer formats. Serial data input/output can be
accomplished through a single bidirectional pin (SDIO) or
through two unidirectional pins (SDIO/SDO).
The serial port configuration is controlled by Register 0x00,
Bits<7:6>. It is important to note that any change made to the
serial port configuration occurs immediately upon writing to
the last bit of this byte. Therefore, it is possible with a multibyte
transfer to write to this register and change the configuration in
the middle of a communication cycle. Care must be taken to
compensate for the new configuration within the remaining
bytes of the current communication cycle.
Use of a single byte transfer when changing the serial port
configuration is recommended to prevent unexpected device
behavior.
As described in this section, all serial port data is transferred
to/from the device in synchronization to the SCLK pin. If
synchronization is lost, the device has the ability to asynchronously terminate an I/O operation, putting the serial port
controller into a known state and, thereby, regaining synchronization.
66
SDO
67
SDIO
CLK
CSB
Figure 52. SPI Port
SPI
PORT
68
69
6452-049
GENERAL OPERATION OF THE SERIAL INTERFACE
There are two phases to a communication cycle with the
AD9776A/AD9778A/AD9779A. Phase 1 is the instruction cycle
(the writing of an instruction byte into the device), coinciding
with the first eight SCLK rising edges. The instruction byte
provides the serial port controller with information regarding
the data transfer cycle, Phase 2 of the communication cycle.
The Phase 1 instruction byte defines whether the upcoming
data transfer is a read or write, the number of bytes in the data
transfer, and the starting register address for the first byte of the
data transfer. The first eight SCLK rising edges of each communication cycle are used to write the instruction byte into the device.
A logic high on the CSB pin followed by a logic low resets the
SPI port timing to the initial state of the instruction cycle.
From this state, the next eight rising SCLK edges represent the
instruction bits of the current I/O operation, regardless of the
state of the internal registers or the other signal levels at the
inputs to the SPI port. If the SPI port is in an instruction cycle
or a data transfer cycle, none of the present data is written.
The remaining SCLK edges are for Phase 2 of the communication cycle. Phase 2 is the actual data transfer between the device
and the system controller. Phase 2 of the communication cycle
is a transfer of one, two, three, or four data bytes as determined
by the instruction byte. Using one multibyte transfer is preferred.
Single byte data transfers are useful in reducing CPU overhead
when register access requires only one byte. Registers change
immediately upon writing to the last bit of each transfer byte.
INSTRUCTION BYTE
See Tab le 1 1 for information contained in the instruction byte.
Table 11. SPI Instruction Byte
MSB LSB
I7 I6 I5 I4 I3 I2 I1 I0
R/W
R/W, Bit 7 of the instruction byte, determines whether a read
or a write data transfer occurs after the instruction byte write.
Logic 1 indicates a read operation. Logic 0 indicates a write
operation.
N1 and N0, Bit 6 and Bit 5 of the instruction byte, determine
the number of bytes to be transferred during the data transfer
cycle. The translation for the number of bytes to be transferred
is listed in Tabl e 12.
A4, A3, A2, A1, and A0—Bit 4, Bit 3, Bit 2, Bit 1, and Bit 0,
respectively—of the instruction byte determine the register that
is accessed during the data transfer portion of the communication
cycle. For multibyte transfers, this address is the starting byte
address. The remaining register addresses are generated by the
device based on the LSB First bit (Register 0x00, Bit 6).
Table 12. Byte Transfer Count
N1 N0 Description
0 0 Transfer one byte
0 1 Transfer three bytes
1 0 Transfer two bytes
1 1 Transfer four bytes
N1 N0 A4 A3 A2 A1 A0
Rev. A | Page 24 of 60
Page 25

AD9776A/AD9778A/AD9779A
SERIAL INTERFACE PORT PIN DESCRIPTIONS
Serial Clock (SCLK)
The serial clock pin synchronizes data to and from the device
as well as running the internal state machines. The maximum
frequency of SCLK is 40 MHz. All data input is registered on
the rising edge of SCLK. All data is driven out on the falling
edge of SCLK.
Chip Select (CSB)
Active low input starts and gates a communication cycle. It
allows more than one device to be used on the same serial
communications lines. The SDO and SDIO pins go to a high
impedance state when this input is high. Chip select should
stay low during the entire communication cycle.
Serial Data I/O (SDIO)
Data is always written into the device on this pin. However, this
pin can be used as a bidirectional data line. The configuration
of this pin is controlled by Register 0x00, Bit 7. The default is
Logic 0, configuring the SDIO pin as unidirectional.
Serial Data Out (SDO)
Data is read from this pin for protocols that use separate lines
for transmitting and receiving data. In the case where the device
operates in a single bidirectional I/O mode, this pin does not
output data and is set to a high impedance state.
MSB/LSB TRANSFERS
The serial port can support both MSB first and LSB first data
formats. This functionality is controlled by Register Bit LSB/MSB
First (Register 0x00, Bit 6). The default is MSB first (LSB/MSB
First = 0).
When LSB/MSB first = 0 (MSB first) the instruction and
data bit must be written from MSB to LSB. Multibyte data
transfers in MSB first format start with an instruction byte
that includes the register address of the most significant data
byte. Subsequent data bytes should follow from high address to
low address. In MSB first mode, the serial port internal byte address
generator decrements for each data byte of the multibyte
communication cycle.
When LSB/MSB First = 1 (LSB first) the instruction and data
bit must be written from LSB to MSB. Multibyte data transfers
in LSB first format start with an instruction byte that includes
the register address of the least significant data byte followed by
multiple data bytes. The serial port internal byte address generator increments for each byte of the multibyte communication cycle.
The serial port controller data address decrements from the data
address written toward 0x00 for multibyte I/O operations if the
MSB first mode is active. The serial port controller address increments from the data address written toward 0x1F for multibyte
I/O operations if the LSB first mode is active.
INSTRUCTIO N CYCLE DATA TRANSFER CYCL E
CSB
SCLK
SDIO
SDO
R/W N1 N0 A4 A3 A2 A1 A0 D7 D6ND5
D7 D6ND5
N
N
D00D10D20D3
0
D00D10D20D3
0
Figure 53. Serial Register Interface Timing, MSB First
INSTRUCTIO N CYCLE DATA TRANSFER CYCL E
CSB
SCLK
SDIO
SDO
A0 A1 A2 A3 A4 N0 N1 R/W D00D10D2
D00D10D2
0
0
D7ND6ND5ND4
N
D7ND6ND5ND4
N
Figure 54. Serial Register Interface Timing, LSB First
t
CSB
SCLK
SDIO
DS
t
DS
t
PWH
t
t
SCLK
t
PWL
DH
INSTRUCTIO N BIT 6INSTRUCTIO N BIT 7
Figure 55. Timing Diagram for SPI Register Write
CSB
SCLK
t
SDIO
SDO
Figure 56. Timing Diagram for SPI Register Read
DV
DATA BIT n –1DATA BIT n
06452-050
06452-051
06452-052
6452-053
Rev. A | Page 25 of 60
Page 26

AD9776A/AD9778A/AD9779A
SPI REGISTER MAP
Note that all unused register bits should be kept at the device default values.
Table 13.
Register
Name
Comm 0x00 00 SDIO
Digital
Control
Sync
Control
PLL
Control
Misc.
Control
I DAC
Control
AUX
DAC1
Control
Q DAC
Control
AUX
DAC2
Control
Interrupt 0x19 25 Data Timing
Version 0x1F 31 Version<7:0> 0x03
Address
Hex Decimal
0x01 01 Interpolation Factor<1:0> Filter Modulation Mode<3:0> DATACLK
0x02 02 Data Format Interleaved
0x03 03 DATACLK
0x04 04 DATACLK Delay<3:0> SYNC_O Divide<2:0> SYNC_O
0x05 05 SYNC_O Delay<3:0> SYNC_I Ratio<2:0> SYNC_I
0x06 06 SYNC_I Delay<3:0> SYNC_I Timing Margin<3:0> 0x00
0x07 07 SYNC_I
0x08 08 PLL Band Select<5:0> PLL VCO Drive<1:0> 0xE7
0x09 09 PLL Enable PLL VCO Divide
0x0A 10 VCO Control Voltage<2:0> (Read Only) PLL Loop Bandwidth<4:0> 0x1F
0x0B 11 I DAC Gain Adjustment<7:0> 0xF9
0x0C 12 I DAC Sleep I DAC
0x0D 13 Auxiliary DAC1 Data<7:0> 0x00
0x0E 14 Auxiliary
0x0F 15 Q DAC Gain Adjustment<7:0> 0xF9
0x10 16 Q DAC
0x11 17 Auxiliary DAC2 Data<7:0> 0x00
0x12 18 Auxiliary
0x13
19 to 24 Reserved
to
0x18
Bit 7 Bit 6 Bit 5 Bit 4 Bit 3 Bit 2 Bit 1 Bit 0 Def.
Bidirectional
Delay Mode
Enable
DAC1 Sign
Sleep
DAC2 Sign
Error IRQ
LSB/MSB
First
Data Bus
Reserved
(Set to 1)
SYNC_O
Enable
Ratio<1:0>
PowerDown
Auxiliary
DAC1
Current
Direction
Q DAC
PowerDown
Auxiliary
DAC2
Current
Direction
Sync Timing
Error IRQ
Software
Reset
Real Mode DATACLK
DATACLK Divide<1:0> Data Timing Margin<3:0> 0x00
SYNC_O
Triggering
Edge
I DAC Gain
Auxiliary
DAC1
PowerDown
Q DAC Gain
Auxiliary
DAC2
PowerDown
Data
PowerDown
Mode
Delay
Enable
PLL Loop Divide
Timing
Error
Type
Auto
PowerDown
Enable
Inverse
Sinc
Enable
Ratio<1:0>
Auxiliary DAC1
Auxiliary DAC2
Data
Timing
Error
IRQ
Enable
PLL Lock
DATACLK
Invert
Clock State<4:0> 0x00
Sync
Timing
Error IRQ
Enable
Indicator
(Read
Only)
Delay<4>
TxEnable
Invert
PLL Bias<2:0> 0x52
Adjustment<9:8>
Adjustment<9:8>
0x00
Zero
Stuffing
Enable
Q First 0x00
Delay<4>
Delay<4>
Data<9:8>
Data<9:8>
Internal
Sync
Loopback
0x00
0x00
0x00
0x01
0x00
0x01
0x00
0x00
Rev. A | Page 26 of 60
Page 27

AD9776A/AD9778A/AD9779A
Table 14. SPI Register Description
Register Name Parameter Function Default
Comm 0x00 7 SDIO Bidirectional 0: use SDIO pin as input data only
Digital Control 0x01 7:6 Interpolation Factor<1:0> 00: 1× interpolation
Register
Address Bits
0x00 6 LSB/MSB First 0: first bit of serial data is MSB of data byte
0x00 5 Software Reset
0x00 4 Power-Down Mode 0: all circuitry is active
0x00 3 Auto Power-Down Enable
0x00 1
0x01 5:2 Filter Modulation Mode<3:0> See Tab le 19 for filter modes. 0000
0x01 1 DATACLK Delay<4> Sets delay of REFCLK input to DATACLK output. 0
0x01 0 Zero Stuffing Enable 0: zero stuffing off
0x02 7 Data Format 0: signed binary
0x02 6 Interleaved Data Bus 0: both P1D and P2D data ports enabled
0x02 5 Real Mode 0: enable Q path for signal processing
0x02 4 DATACLK Delay Enable
0x02 3 Inverse Sinc Enable 0: inverse sinc filter disabled
0x02 2 DATACLK Invert
0x02 1 TxEnable Invert
0x02 0 Q First
0
1: use SDIO as both input and output data
0
1: first bit of serial data is LSB of data byte
0
0
00
0
0
0
0
0
0
0
PLL Lock Indicator
(Read Only)
Bit must be written with a 1, then 0 to soft reset SPI
register map.
1: disable all digital and analog circuitry, only SPI
port is active
Controls auto power-down mode. See the PowerDown and Sleep Modes section.
0: PLL is not locked
1: PLL is locked
01: 2× interpolation
10: 4× interpolation
11: 8× interpolation
1: zero stuffing on
1: unsigned binary
1: data for both DACs received on P1D data port
1: disable Q path data (internal Q channel clocks
disabled, I and Q modulators disabled)
Enables the DATACLK delay feature. More details
on this feature are shown in the Optimizing the
Data Input Timing section.
1: inverse sinc filter enabled
0: output DATACLK same phase as internal data
sampling clock, DCLK_SMP
1: output DATACLK opposite phase as internal data
sampling clock, DCLK_SMP
Inverts the polarity of Pin 39, the TXENABLE input
pin (also functions as IQSELECT).
0: in interleaved mode, the first byte of a data-word
pair is sent to the I DAC
1: in interleaved mode, the first byte of a data-word
pair is sent to the Q DAC
Rev. A | Page 27 of 60
Page 28

AD9776A/AD9778A/AD9779A
Register Name Parameter Function Default
Sync Control 0x03 7 DATACLK Delay Mode 0: manual data timing error correct mode
Register
Address
0x03 6 Reserved Should always be set to 1. 0
0x03 5:4 DATACLK Divide<1:0> DATACLK output divider value.
0x03 3:0 Data Timing Margin<3:0>
0x04 7:4 DATACLK Delay<3:0> Sets delay of REFCLK in to DATACLK out. 0000
0x04 3:1 SYNC_O Divide<2:0>
0x04
0x05
0x05 3:1 SYNC_I Ratio<2:0>
0x05
0x06
0x06 3:0 SYNC_I Timing Margin<3:0> 0
0x07 7 SYNC_I Enable 1: enables the SYNC_I input 0
0x07 6 SYNC_O Enable 1: enables the SYNC_O output 0
0x07 5 SYNC_O Triggering Edge 0: SYNC_O changes on REFCLK falling edge
0x07 4:0 Clock State<4:0>
Bits
0
7:4
0
7:4
0
1: automatic data timing error correct mode
00
00: divide by 1
01: divide by 2
10: divide by 4
11: divide by 1
0000
000
00000
000
00000
0
0
SYNC_O Delay<4>
SYNC_O Delay<3:0>
SYNC_I Delay<4>
SYNC_I Delay<3:0>
Sets the timing margin required to prevent the
Data Timing Error IRQ from being asserted. See
Table 26 for details.
The frequency of the SYNC_O signal is equal to
/N, where N is set as follows:
f
DAC
000: N = 32
001: N = 16
010: N = 8
011: N = 4
100: N = 2
101: N = 1
110: N = undefined
111: N = undefined
This value programs the value of the delay line of
the SYNC_O signal. The delay of SYNC_O is relative
to REFCLK. The delay line resolution is 80 ps per
step.
0000: nominal delay
0001: adds 80 ps delay to SYNC_O
0010: adds 160 ps delay to SYNC_O
…
1111: Adds 2480 ps delay to SYNC_O
This value controls the number of SYNC_I input
pulses required to generate a synchronization
pulse. See Tab le 27 for details.
This value programs the value of the delay line
of the SYNC_I signal. The delay line resolution is
190 ps per step.
0000: no added delay
0001: adds 190 ps delay to SYNC_I
0010: adds 380 ps delay to SYNC_I
…
1111: adds 2480 ps delay to SYNC_I
1: SYNC_O changes on REFCLK rising edge
This value determines the state of the internal
clock generation state machine upon
synchronization.
Rev. A | Page 28 of 60
Page 29

AD9776A/AD9778A/AD9779A
Register Name Parameter Function Default
Register
Address
PLL Control 0x08 7:2 PLL Band Select<5:0>
0x08 1:0 PLL VCO Drive<1:0>
0x09 7 PLL Enable
0x09 6:5 PLL VCO Divide Ratio<1:0>
0x09 4:3 PLL Loop Divide Ratio<1:0>
0x09 2:0 PLL Bias<2:0>
Misc. Control 0x0A 7:5
0x0A 4:0 PLL Loop Bandwidth<4:0>
I DAC Control 0x0C
0x0B
0x0C 7 I DAC Sleep 0: I DAC on
0x0C 6 I DAC Power-Down 0: I DAC on
AUX DAC1 Control 0x0E
0x0D
0x0E 7 Auxiliary DAC1 Sign 0: AUX1_P active
0x0E 6
0x0E 5 Auxiliary DAC1 Power-Down 0: AUX DAC1 on
Q DAC Control 0x10
0x0F
0x10 7 Q DAC Sleep 0: Q DAC on
0x10 6 Q DAC Power-Down 0: Q DAC on
Bits
This sets the operating frequency range of the
111001
VCO. For details, see Table 21 .
Controls the signal strength of the VCO output. Set
11
to 11 for optimal performance.
0: PLL off, DAC sample clock is sourced directly by
the REFCLK input.
0
1: PLL on, DAC clock synthesized internally from
REFCLK input via PLL clock multiplier.
Sets the value of the VCO output divider which
determines the ratio of the VCO output frequency
to the DAC sample clock frequency, f
00: f
01: f
10: f
11: f
VCO/fDACCLK
VCO/fDACCLK
VCO/fDACCLK
VCO/fDACCLK
= 1
= 2
= 4
= 8
VCO/fDACCLK
.
Sets the value of the DACCLK divider which
10
10
determines the ratio of the DAC sample clock
frequency to the REFCLK frequency, f
00: f
DACCLK/fREFCLK
01: f
DACCLK/fREFCLK
10: f
DACCLK/fREFCLK
11: f
DACCLK/fREFCLK
= 2
= 4
= 8
= 16
DACCLK/fREFCLK
Controls VCO bias current. Set to 011 for optimal
.
010
performance.
VCO Control Voltage<2:0>
(Read Only)
000 to 111, proportional to voltage at VCO control
voltage input, readback only. A value of 011
000
indicates the VCO centered in its frequency range.
Controls the bandwidth of the PLL filter. Increasing
11111
the value lowers the loop bandwidth. Set to 01111
for optimal performance.
1:0
I DAC Gain Adjustment<9:8>
7:0
I DAC Gain Adjustment<7:0>
I DAC 10-bit gain setting word. Bit 9 is the MSB and
Bit 0 is the LSB.
01
11111001
0
1: I DAC off
0
1: I DAC off
1:0
Auxiliary DAC1 Data<9:8>
7:0
Auxiliary DAC1 Data<7:0>
AUX DAC1 10-bit output current control word.
Magnitude of the AUX DAC current increases with
00
00000000
increasing value. Bit 9 is the MSB and Bit 0 is the LSB
0
1: AUX1_N active
Auxiliary DAC1 Current
Direction
0: source
1: sink
0
0
1: AUX DAC1 off
1:0
Q DAC Gain Adjustment<9:8>
7:0
Q DAC Gain Adjustment<7:0>
Q DAC 10-bit gain setting word. Bit 9 is the MSB
and Bit 0 is the LSB.
01
11111001
0
1: Q DAC off
0
1: Q DAC off
Rev. A | Page 29 of 60
Page 30

AD9776A/AD9778A/AD9779A
Register Name Parameter Function Default
AUX DAC2 Control 0x12
Interrupt 0x19 7 Data Timing Error IRQ
Version 0x1F 7:0 Version<7:0> Indicates device hardware revision number. 00000011
Register
Address
0x11
0x12 7 Auxiliary DAC2 Sign 0: AUX2_P active
0x12 6
0x12 5 Auxiliary DAC2 Power-Down 0: AUX DAC2 on
0x19 6 Sync Timing Error IRQ
0x19 4 Data Timing Error Type Read only. Indicates the timing error type.
0x19 3 Data Timing Error IRQ Enable 0: Data Timing Error IRQ is masked
0x19 2 Sync Timing Error IRQ Enable 0: Sync Timing Error IRQ is masked
0x19 0 Internal Sync Loopback
Bits
1:0
7:0
Auxiliary DAC2 Data<9:8>
Auxiliary DAC2 Data<7:0>
Auxiliary DAC2 Current
Direction
AUX DAC2 10-bit output current control word.
Magnitude of the AUX DAC current increases with
increasing value. Bit 9 is the MSB and Bit 0 is the LSB.
1: AUX2_N active
0: source
1: sink
1: AUX DAC2 off
Read only. Active high indicates a timing violation
occurred on the input data port. The IRQ is latched.
This bit is cleared when the Interrupt register is
read.
Read only. Active high indicates a timing violation
occurred on the SYNC_I input. The IRQ is latched.
This bit is cleared when the Interrupt register is
read.
0: hold time violation
1: setup time violation
Meaningful when Data Timing Error IRQ is active.
1: Data Timing Error IRQ is enabled
1: Sync Timing Error IRQ is enabled
The received SYNC_I signal is looped back to the
SYNC_O output pins.
00
00000000
0
0
0
0
0
0
0
0
Rev. A | Page 30 of 60
Page 31

AD9776A/AD9778A/AD9779A
INTERPOLATION FILTER ARCHITECTURE
The AD9776A/AD9778A/AD9779A can provide up to 8× interpolation, or the interpolation filters can be entirely disabled. It
is important to note that the input signal should be backed off
by approximately 0.01 dB from full scale to avoid overflowing
the interpolation filters. The coefficients of the low-pass filters
and the inverse sinc filter are given in Tab l e 1 5 , Tabl e 16, Tab l e 1 7 ,
and Tabl e 18 . Spectral plots for the filter responses are shown in
Figure 57, Figure 58, and Figure 59.
Table 15. Low-Pass Filter 1
Lower Coefficient Upper Coefficient Integer Value
H(1) H(55) −4
H(2) H(54) 0
H(3) H(53) +13
H(4) H(52) 0
H(5) H(51) −34
H(6) H(50) 0
H(7) H(49) +72
H(8) H(48) 0
H(9) H(47) −138
H(10) H(46) 0
H(11) H(45) +245
H(12) H(44) 0
H(13) H(43) −408
H(14) H(42) 0
H(15) H(41) +650
H(16) H(40) 0
H(17) H(39) −1003
H(18) H(38) 0
H(19) H(37) +1521
H(20) H(36) 0
H(21) H(35) −2315
H(22) H(34) 0
H(23) H(33) +3671
H(24) H(32) 0
H(25) H(31) −6642
H(26) H(30) 0
H(27) H(29) +20,755
H(28)
+32,768
Table 16. Low-Pass Filter 2
Lower Coefficient Upper Coefficient Integer Value
H(1) H(23) −2
H(2) H(22) 0
H(3) H(21) +17
H(4) H(20) 0
H(5) H(19) −75
H(6) H(18) 0
H(7) H(17) +238
H(8) H(16) 0
H(9) H(15) −660
H(10) H(14) 0
H(11) H(13) +2530
H(12) +4096
Table 17. Low-Pass Filter 3
Lower Coefficient Upper Coefficient Integer Value
H(1) H(15) −39
H(2) H(14) 0
H(3) H(13) +273
H(4) H(12) 0
H(5) H(11) −1102
H(6) H(10) 0
H(7) H(9) +4964
H(8) +8192
Table 18. Inverse Sinc Filter
Lower Coefficient Upper Coefficient Integer Value
H(1) H(9) +2
H(2) H(8) −4
H(3) H(7) +10
H(4) H(6) −35
H(5) +401
10
0
–10
–20
–30
–40
–50
–60
ATTENUATION (dB)
–70
–80
–90
–100
–4
–3–2–10123
f
(× Input Data Rate)
OUT
Figure 57. 2× Interpolation, Low-Pass Response to ±4× Input Data Rate
(Dotted Lines Indicate 1 dB Roll-Off)
4
06452-054
Rev. A | Page 31 of 60
Page 32

AD9776A/AD9778A/AD9779A
–
–
–
–
–7–5–3–
10
0
–10
–20
–30
–40
–50
–60
ATTENUATION (dB)
–70
–80
–90
–100
–4
–3–2–10123
f
(× Input Data Rate)
OUT
4
06452-055
Figure 58. 4× Interpolation, Low-Pass Response to ±4× Input Data Rate
(Dotted Lines Indicate 1 dB Roll-Off)
10
0
–10
–20
–30
–40
–50
–60
ATTENUATION (dB)
–70
–80
–90
–100
–4
–3–2–10123
f
(× Input Data Rate)
OUT
4
06452-056
Figure 59. 8× Interpolation, Low-Pass Response to ±4× Input Data Rate
(Dotted Lines Indicate 1 dB Roll-Off)
With the interpolation filter and modulator combined, the
incoming signal can be placed anywhere within the Nyquist
region of the DAC output sample rate. When the input signal
is complex, this architecture allows modulation of the input
signal to positive or negative Nyquist regions (see Table 1 9).
The Nyquist regions of up to 4× the input data rate can be seen
in Figure 60.
8
6
4
2DC11×32×53×7
12 4 6 8
–4×
–3×
–2×
–1×
4×
06452-057
Figure 60. Nyquist Zones
Figure 57, Figure 58, and Figure 59 show the low-pass response
of the digital filters with no modulation. By turning on the modulation feature, the response of the digital filters can be tuned to
anywhere within the DAC bandwidth. As an example, Figure 61
to Figure 67 show the nonshifted mode filter responses (refer to
Tabl e 19 for shifted/nonshifted mode filter responses).
10
0
–10
–20
–30
–40
–50
–60
ATTENUATION (dB)
–70
–80
–90
–100
–4
–3–2–10123
f
(× Input Data Rate)
OUT
Figure 61. Interpolation/Modulation Combination of 4f
10
0
–10
–20
–30
–40
–50
–60
ATTENUATION (dB)
–70
–80
–90
–100
–4
–3–2–10123
f
(× Input Data Rate)
OUT
Figure 62. Interpolation/Modulation Combination of −3f
10
0
–10
–20
–30
–40
–50
–60
ATTENUATION (dB)
–70
–80
–90
–100
–4
–3–2–10123
f
(× Input Data Rate)
OUT
Figure 63. Interpolation/Modulation Combination of −2f
DAC
DAC
DAC
4
/8 Filter
4
/8 Filter
4
/8 Filter
06452-058
06452-059
06452-060
Rev. A | Page 32 of 60
Page 33

AD9776A/AD9778A/AD9779A
10
0
–10
–20
–30
–40
–50
–60
ATTENUATION (dB)
–70
–80
–90
–100
–4
–3–2–10123
f
(× Input Data Rate)
OUT
Figure 64. Interpolation/Modulation Combination of −f
10
0
–10
–20
–30
–40
–50
–60
ATTENUATION (dB)
–70
–80
–90
–100
–4
–3–2–10123
f
(× Input Data Rate)
OUT
Figure 65. Interpolation/Modulation Combination of f
10
0
–10
–20
–30
–40
–50
–60
ATTENUATION (dB)
–70
–80
–90
–100
–4
–3–2–10123
f
(× Input Data Rate)
OUT
Figure 66. Interpolation/Modulation Combination of 2f
4
06452-061
/8 Filter Figure 67. Interpolation/Modulation Combination of 3f
DAC
4
06452-062
4
/8 Filter
06452-063
DAC
DAC
/8 Filter
10
0
–10
–20
–30
–40
–50
–60
ATTENUATION (dB)
–70
–80
–90
–100
–4
–3–2–10123
f
(× Input Data Rate)
OUT
DAC
4
/8 Filter
06452-064
Shifted mode filter responses allow the pass band to be centered
around ±0.5 f
DATA
, ±1.5 f
DATA
, ±2.5 f
, and ±3.5 f
DATA
. Switching to
DATA
the shifted mode response does not affect the center frequency
of the signal. Instead, the pass band of the filter is simply shifted.
For example, use the response shown in Figure 67 and assume
the signal in-band is a complex signal over the bandwidth 3.2 f
to 3.3 f
the pass band becomes centered at 3.5 f
. If the shifted mode filter response is then selected,
DATA
. However, the signal
DATA
DATA
remains at the same place in the spectrum. The shifted mode
capability allows the filter pass band to be placed anywhere in
the DAC Nyquist bandwidth.
The AD9776A/AD9778A/AD9779A are dual DACs with
internal complex modulators built into the interpolating filter
response. In dual channel mode, the devices expect the real and
the imaginary components of a complex signal at Digital Input
Port 1 and Digital Input Port 2 (I and Q, respectively). The DAC
outputs then represent the real and imaginary components of
the input signal, modulated by the complex carrier (f
f
DAC
/4, or f
DAC
/8).
DAC
/2,
With Register 2, Bit 6 set, the device accepts interleaved data
on Port 1 in the I, Q, I, Q … sequence. Note that in interleaved
mode, the channel data rate at the beginning of the I and the Q
data paths is now half the input data rate because of the interleaving. The maximum input data rate is still subject to the
maximum specification of the device. This limits the synthesis
bandwidth available at the input in interleaved mode.
With Register 0x02, Bit 5 (real mode) set, the Q channel and
the internal I and Q digital modulation are turned off. The
output spectrum at the I DAC then represents the signal at
Digital Input Port 1, interpolated by 1×, 2×, 4×, or 8×.
The general recommendation is that if the desired signal is
within ±0.4 × f
, use the nonshifted filter mode. Outside of
DATA
this, the shifted filter mode should be used. In any situation, the
total bandwidth of the signal should be less than 0.8 × f
DATA
.
Rev. A | Page 33 of 60
Page 34

AD9776A/AD9778A/AD9779A
Table 19. Interpolation Filter Modes, (Register 0x01, Bits<5:2>)
Interpolation
Factor<7:6>
Filter Mode<5:2> Modulation
Nyquist Zone
Pass Band
Frequency Normalized to f
Low Center High
8 0x00 DC +1 −0.05 0 +0.05
8 0x01 DC shifted +2 +0.0125 +0.0625 +0.1125
8 0x02 f
8 0x03 f
8 0x04 f
8 0x05 f
8 0x06 3f
8 0x07 3f
8 0x08 f
8 0x09 f
8 0x0A −3f
8 0x0B −3f
8 0x0C −f
8 0x0D −f
8 0x0E −f
8 0x0F −f
/8 +3 +0.075 +0.125 +0.175
DAC
/8 shifted +4 +0.1375 +0.1875 +0.2375
DAC
/4 +5 +0.2 +0.25 +0.3
DAC
/4 shifted +6 +0.2625 +0.3125 +0.3625
DAC
/8 +7 +0.325 +0.375 +0.425
DAC
/8 shifted +8 +0.3875 +0.4375 +0.4875
DAC
/2 −8 −0.55 −0.5 −0.45
DAC
/2 shifted −7 −0.4875 −0.4375 −0.3875
DAC
/8 −6 −0.425 −0.375 −0.343
DAC
/8 shifted −5 −0.3625 −0.3125 −0.2625
DAC
/4 −4 −0.3 −0.25 −0.2
DAC
/4 shifted −3 −0.2375 −0.1875 −0.1375
DAC
/8 −2 −0.175 −0.125 −0.075
DAC
/8 shifted −1 −0.1125 −0.0625 −0.0125
DAC
4 0x00 DC +1 −0.1 0 +0.1
4 0x01 DC shifted +2 +0.025 +0.125 +0.225
4 0x02 f
4 0x03 f
4 0x04 f
4 0x05 f
4 0x06 −f
4 0x07 −f
/4 +3 +0.15 +0.25 +0.35
DAC
/4 shifted +4 +0.275 +0.375 +0.475
DAC
/2 −4 −0.6 −0.5 −0.4
DAC
/2 shifted −3 −0.475 −0.375 −0.275
DAC
/4 −2 −0.35 −0.25 −0.15
DAC
/4 shifted −1 −0.225 −0.125 −0.025
DAC
2 0x00 DC +1 −0.2 0 +0.2
2 0x01 DC shifted +2 +0.05 +0.25 +0.45
2 0x02 f
2 0x03 f
/2 −2 −0.7 −0.5 −0.3
DAC
/2 shifted −1 −0.45 −0.25 −0.05
DAC
DAC
Comments
In 8× interpolation;
BW (min) = 0.0375 × f
BW (max) = 0.1 × f
In 4× interpolation;
BW (min) = 0.075 × f
BW (max) = 0.2 × f
In 2× interpolation;
BW (min) = 0.15 × f
BW (max) = 0.4 × f
DAC
DAC
DAC
DAC
DAC
DAC
Rev. A | Page 34 of 60
Page 35

AD9776A/AD9778A/AD9779A
INTERPOLATION FILTER BANDWIDTH LIMITS
The AD9776A/AD9778A/AD9779A use a novel interpolation
filter architecture that allows DAC IF frequencies to be generated anywhere in the spectrum. Figure 68 shows the traditional
choice of DAC IF output bandwidth placement. Note that there
are no possible filter modes in which the carrier can be placed
near 0.5 × f
–10
–20
–30
–40
–50
ATTENUATIO N (dB)
–60
–70
–80
Figure 68. Traditional Bandwidth Options for TxDAC Output IF
The filter architecture not only allows the interpolation filter
pass bands to be centered in the middle of the input Nyquist
zones (as explained in this section), but also allows the possibility of a 3 × f
combinations, a carrier of given bandwidth can be placed
anywhere in the spectrum and fall into a possible pass band
of the interpolation filters. The possible bandwidths accessible
with the filter architecture are shown in Figure 69 and Figure 70.
Note that the shifted and nonshifted filter modes are all
accessible by programming the filter mode for the particular
interpolation rate.
–10
–20
–30
–40
–50
ATTENUATIO N (dB)
–60
–70
–80
Figure 69. Nonshifted Bandwidths Accessible with the Filter Architecture
, 1.5 × f
DATA
10
0
/2
DAC
f
–
–4 4
–3–2–10123
/8 modulation mode. With all of these filter
DAC
10
0
/8
/2
DAC
DAC
–f
–3 × f
–4 4
–3 –2 –1 0 1 2 3
, 2.5 × f
DATA
/8
/4
DAC
DAC
f
f
–
–
f
(× Input Data Rate),
OUT
ASSUMING 8× I NTERPOLATION
/4
/8
DAC
DAC
–f
–f
f
(× Input Data Rate),
OUT
ASSUMING 8× I NTERPOL ATION
, and so on.
DATA
BASEBAND
BASEBAND
/8
DAC
f
+
/8
DAC
+f
/4
+f
/4
DAC
f
+
DAC
/8
DAC
+3 × f
/2
f
+
/2
DAC
+f
DAC
06452-065
06452-066
10
0
/8
/4
–10
DAC
–20
–30
SHIFTED –3 × f
–40
–50
ATTENUATIO N (dB)
–60
–70
–80
–4 4
–3–2–10123
/8
DAC
DAC
SHIFTED –f
SHIFTED –f
SHIFTED –DC
f
(× Input Data Rate),
OUT
ASSUMING 8× I NTERPOLATION
/8
DAC
SHIFTED –DC
SHIFTED –f
/8
/4
DAC
DAC
SHIFTED –f
SHIFTED –3 × f
06452-067
Figure 70. Shifted Bandwidths Accessible with the Filter Architecture
With this filter architecture, a signal placed anywhere in the
spectrum is possible. However, the signal bandwidth is limited
by the input sample rate of the DAC and the specific placement
of the carrier in the spectrum. The bandwidth restriction resulting
from the combination of filter response and input sample rate is
often referred to as the synthesis bandwidth, because this is the
largest bandwidth that the DAC can synthesize.
The maximum bandwidth condition exists if the carrier is
placed directly in the center of one of the filter pass bands. In
this case, the total 0.1 dB bandwidth of the interpolation filters
is equal to 0.8 × f
. As Tab le 19 shows, the synthesis band-
DATA
width as a fraction of the DAC output sample rate drops by a
factor of 2 for every doubling of interpolation rate. The minimum bandwidth condition exists, for example, if a carrier is
placed at 0.25 × f
. In this situation, if the nonshifted filter
DATA
response is enabled, the high end of the filter response cuts off
at 0.4 × f
, thus limiting the high end of the signal bandwidth.
DATA
If the shifted filter response is enabled instead, then the low end
of the filter response cuts off at 0.1 × f
, thus limiting the low
DATA
end of the signal bandwidth. The minimum bandwidth specification that applies for a carrier at 0.25 × f
. The minimum bandwidth behavior is repeated over the
f
DATA
spectrum for carriers placed at (±n ± 0.25) × f
is therefore 0.3 ×
DATA
, where n is
DATA
any integer.
Rev. A | Page 35 of 60
Page 36

AD9776A/AD9778A/AD9779A
××=
×
=
(
SOURCING THE DAC SAMPLE CLOCK
The AD9776A/AD9778A/AD9779A offer two modes of sourcing
the DAC sample clock (DACCLK). The first mode employs an
on-chip clock multiplier that accepts a reference clock operating
at the lower input frequency, most commonly the data input
frequency. The on-chip PLL then multiplies the reference clock
up to a higher frequency, which can then be used to generate all
of the internal clocks required by the DAC. The clock multiplier
provides a high quality clock that meets the performance requirements of most applications. Using the on-chip clock multiplier
removes the burden of generating and distributing the high
speed DACCLK at the board level. The second mode bypasses
the clock multiplier circuitry and allows DACCLK to be directly
sourced through the REFCLK pins. This mode enables the user
to source a very high quality input clock directly to the DAC
core. Sourcing the DACCLK directly through the REFCLK pins
may be necessary in demanding applications that require the
lowest possible DAC output noise at higher output frequencies.
In either case (using the on-chip clock multiplier, or sourcing
the DACCLK directly though the REFCLK pins), it is necessary
that the REFCLK signal have low jitter to maximize the DAC
noise performance.
DIRECT CLOCKING
When the PLL is disabled (Register 0x09, Bit 7 = 0), the REFCLK
input is used directly as the DAC sample clock (DACCLK). The
frequency of REFCLK needs to be the input data rate multiplied
by the interpolation factor (and by an additional factor of two if
zero stuffing is enabled).
CLOCK MULTIPLICATION
When the PLL is enabled (Register 0x09, Bit 7 = 1), the clock
multiplication circuit generates the DAC sample clock from the
lower rate REFCLK input. The functional diagram of the clock
multiplier is shown in Figure 71.
PIN 65 AND
REFCLK
PIN 5, PIN 6)
0x0A <1>
PLL LOCK
DETECT
PHASE
DETECTO R
0x09 <4:3>
PLL LOOP
DIVISOR
0x09 <7>
PLL ENABLE
Figure 71. Clock Multiplier Circuit
LOOP
FILTER
÷N
2
0x09 <6:5>
PLL VCO
DIVISO R
DACCLK
ADC
VCO
÷N
1
÷IF
0x01 <7:6>
INTERPOLATI ON
FACTOR
The clock multiplier circuit operates such that the VCO outputs
a frequency, f
, equal to the REFCLK input signal frequency
VCO
multiplied by N1 × N2.
0x0A <7:5>
PLL CONT ROL
VOLTAGE
0x08 <7:2>
VCO BAND
SELECT
DATACLK O UT (PI N 37)
REFCLKVCO
The DAC sample clock frequency, f
REFCLKDACCLK
The values of N1 and N2 must be chosen to keep f
optimal operating range of 1.0 GHz to 2.0 GHz. Once, the
VCO output frequency is known, the correct VCO band select
(Register 0x08, Bits<7:2>) value can be chosen.
PLL Bias Settings
There are three bias settings for the PLL circuitry that should be
programmed to their nominal values. The PLL values shown in
Tabl e 20 are the recommended settings for these parameters.
Table 20. PLL Settings
PLL SPI Control
PLL Loop Bandwidth 0x0A <4:0> 01111
PLL VCO Drive 0x08 <1:0> 11
PLL Bias 0x09 <2:0> 011
The PLL loop bandwidth variable configures the bandwidth of
the PLL loop filter. A setting of 00000 configures the bandwidth
to be approximately 1 MHz. A setting of 11111 configures the
bandwidth to be approximately 10 MHz. The optimal value of
01111 sets the loop bandwidth to be approximately 3 MHz.
Configuring the PLL Band Select Value
The PLL VCO has a valid operating range from approximately
1.0 GHz to 2.0 GHz. This range is covered in 63 overlapping
frequency bands, as shown in Ta bl e 21 . For any desired VCO
output frequency, there are multiple valid PLL band select values.
It is important to note that the data shown in Tab le 21 is for a
typical device. Device-to-device variations can shift the actual
VCO output frequency range by 30 MHz to 40 MHz. In addition,
the VCO output frequency varies as a function of temperature.
Therefore, it is required that the optimal PLL band select value
be determined for each individual device at the particular
operating temperature.
The device has an automatic PLL band select feature on-chip.
When enabled, the device determines the optimal PLL band
setting for the device at the given temperature. This setting holds
for a ±60°C temperature swing in ambient temperature. If the
device is operated in an environment that experiences a larger
temperature swing, an offset should be applied to the automatically
selected PLL band. The following procedure outlines a method
for setting the PLL band select value for a device operating at a
particular temperature that holds for a change in ambient temper-
06452-404
ature over the total −40°C to +85°C operating range of the device
without further user intervention. Note that REFCLK must be
applied to the device during this procedure.
N2ff
Address
)( N2N1ff
DACCL K
, is equal to
VCO
Optimal Setting Register Bits
in the
Rev. A | Page 36 of 60
Page 37

AD9776A/AD9778A/AD9779A
Table 21. Typical VCO Frequency Range vs. PLL Band Select Value
PLL Lock Ranges over Temperature, −40°C to +85°C
VCO Frequency Range in MHz
PLL Band Select
111111 (63) Auto mode
111110 (62) 1975 2026
111101 (61) 1956 2008
111100 (60) 1938 1992
111011 (59) 1923 1977
111010 (58) 1902 1961
111001 (57) 1883 1942
111000 (56) 1870 1931
110111 (55) 1848 1915
110110 (54) 1830 1897
110101 (53) 1822 1885
110100 (52) 1794 1869
110011 (51) 1779 1853
110010 (50) 1774 1840
110001 (49) 1748 1825
110000 (48) 1729 1810
101111 (47) 1730 1794
101110 (46) 1699 1780
101101 (45) 1685 1766
101100 (44) 1684 1748
101011 (43) 1651 1729
101010 (42) 1640 1702
101001 (41) 1604 1681
101000 (40) 1596 1658
100111 (39) 1564 1639
100110 (38) 1555 1606
100101 (37) 1521 1600
100100 (36) 1514 1575
100011 (35) 1480 1553
100010 (34) 1475 1529
100001 (33) 1439 1505
100000 (32) 1435 1489
011111 (31) 1402 1468
011110 (30) 1397 1451
011101 (29) 1361 1427
011100 (28) 1356 1412
011011 (27) 1324 1389
011010 (26) 1317 1375
011001 (25) 1287 1352
011000 (24) 1282 1336
010111 (23) 1250 1313
010110 (22) 1245 1299
010101 (21) 1215 1277
010100 (20) 1210 1264
010011 (19) 1182 1242
010010 (18) 1174 1231
f
f
LOW
HIGH
PLL Lock Ranges over Temperature, −40°C to +85°C
VCO Frequency Range in MHz
PLL Band Select
010001 (17) 1149 1210
010000 (16) 1141 1198
001111 (15) 1115 1178
001110 (14) 1109 1166
001101 (13) 1086 1145
001100 (12) 1078 1135
001011 (11) 1055 1106
001010 (10) 1047 1103
001001 (9) 1026 1067
001000 (8) 1019 1072
000111 (7) 998 1049
000110 (6) 991 1041
000101 (5) 976 1026
000100 (4) 963 1011
000011 (3) 950 996
000010 (2) 935 981
000001 (1) 922 966
000000 (0) 911 951
f
f
LOW
HIGH
Configuring PLL Band Select with Temperature Sensing
1. The values of N1 (Register 0x09, Bits<6:5>) and N2
(Register 0x09, Bits<4:3>) should be programmed along
with the PLL settings shown in Tabl e 20 .
Set the PLL band (Register 0x08, Bits<7:2>) to 63 to enable
2.
PLL auto mode.
Wait for the PLL_LOCK pin or the PLL lock indicator
3.
(Register 0x00, Bit 1) to go high. This should occur within
5 ms.
Read back the 6-bit PLL band (Register 0x08, Bits<7:2>).
4.
Based on the temperature when the PLL auto band select is
5.
performed, set the PLL band indicated in either Ta ble 2 2 or
Tabl e 23 by rewriting the readback values into the PLL
Band Select parameter (Register 0x08, Bits<7:2>).
If the optimal band is in the range of 0 to 31 (lower VCO
frequency), refer to Tab l e 22 .
Table 22. Setting Optimal PLL Band, When Band Is in the
Lower Range (0 to 31)
If System Startup
Temperature Is
−40°C to −10°C Set PLL band = readback band + 2
−10°C to +15°C Set PLL band = readback band + 1
15°C to 55°C Set PLL band = readback band
55°C to 85°C Set PLL band = readback band − 1
Set PLL Band as Follows
Rev. 0 | Page 37 of 60
Page 38

AD9776A/AD9778A/AD9779A
F
T
F
V
If the optimal band is in the range of 32 to 62 (higher VCO
frequency), refer to Tab l e 23 .
Table 23. Setting Optimal PLL Band, When Band Is in the
Higher Range (32 to 62)
If System Startup
Temperature Is Set PLL Band as Follows
−40°C to −30°C Set PLL band = readback band + 3
−30°C to −10°C Set PLL band = readback band + 2
−10°C to +15°C Set PLL band = readback band + 1
15°C to 55°C Set PLL band = readback band
55°C to 85°C Set PLL band = readback band − 1
Known Temperature Calibration with Memory
The preceding procedure requires temperature sensing upon
start-up or reset of the device to optimally choose the PLL band
select value that holds over the entire operating temperature
range. If temperature sensing is not available in the system, a
factory calibration at a known temperature is another method
for guaranteeing lock over temperature.
Factory calibration can be performed as follows:
The values of N1 (Register 0x09, Bits<6:5>) and N2
1.
(Register 0x09, Bits<4:3>) should be programmed along
with the PLL settings shown in Tabl e 20 .
Set the PLL band (Register 0x08, Bits<7:2>) to 63 to enable
2.
PLL auto mode.
Wait for the PLL_LOCK pin or the PLL lock indicator
3.
(Register 0x00, Bit 1) to go high. This should occur within
5 ms.
Read back the 6-bit PLL band (Register 0x08, Bits<7:2>).
4.
Based on the temperature when the PLL auto band select is
5.
performed, store into nonvolatile memory the PLL band
indicated in either Tabl e 22 or Tabl e 23 . On system powerup or restart, load the stored PLL band value into the PLL
band select parameter (Register 0x08, Bits<7:2>).
Set and Forget Device Option
If the PLL band select configuration methods described in
the previous sections cannot be implemented in a particular
system, there may be a screened device option that can satisfy
the system requirements. Analog Devices offers a pair of screened
devices that are guaranteed to maintain PLL lock over the entire
operating temperature range for a predetermined PLL band
select setting. This allows the user to preload a specific PLL
band select value for all devices that holds over temperature.
DRIVING THE REFCLK INPUT
The REFCLK input requires a low jitter differential drive signal.
The signal level can range from 400 mV p-p differential to
1.6 V p-p differential centered about a 400 mV input commonmode voltage. Looking at the single-ended inputs, REFCLK+ or
REFCLK−, each input pin can safely swing from 200 mV p-p to
800 mV p-p about the 400 mV common-mode voltage. Although
these input levels are not directly LVDS compatible, REFCLK
can be driven by an offset ac-coupled LVDS signal, as shown in
Figure 72.
LVDS_P_IN
LVDS_N_IN
If a clean sine clock is available, it can be transformer-coupled
to REFCLK, as shown in Figure 72. Use of a CMOS or TTL
clock is also acceptable for lower sample rates. It can be routed
through a CMOS to LVDS translator, then ac-coupled, as
described in this section. Alternatively, it can be transformercoupled and clamped, as shown in Figure 73.
TL OR CMOS
CLK INPU T
Figure 73. TTL or CMOS REFCLK Drive Circuit
A simple bias network for generating VCM is shown in Figure 74.
It is important to use CVDD18 and CGND for the clock bias
circuit. Any noise or other signal that is coupled onto the clock
is multiplied by the DAC digital input signal and can degrade
DAC performance.
1kΩ
287Ω
0.1µ
50Ω
50Ω
0.1µF
Figure 72. LVDS REFCLK Drive Circuit
0.1µ
0.1µF
Figure 74. REFCLK V
1nF
Generator Circuit
CM
V
CM
CM
REFCLK+
= 400mV
REFCLK–
50Ω
50Ω
BAV99ZXCT
HIGH SPEED
DUAL DIODE
V
= 400mV
1nF
= 400mV
CM
CVDD18
CGND
06452-068
REFCLK+
REFCLK–
06452-070
06452-069
Rev. A | Page 38 of 60
Page 39

AD9776A/AD9778A/AD9779A
FULL-SCALE CURRENT GENERATION
INTERNAL REFERENCE
Full-scale current on the I DAC and Q DAC can be set from
8.66 mA to 31.66 mA. Initially, the 1.2 V band gap reference is
used to set up a current in an external resistor connected to I120
(Pin 75). A simplified block diagram of the reference circuitry is
shown in Figure 75. The recommended value for the external
resistor is 10 k, which sets up an I
REFERENCE
120 A, which in turn provides a DAC output full-scale current
of 20 mA. Because the gain error is a linear function of this resistor,
a high precision resistor improves gain matching to the internal
matching specification of the devices. Internal current mirrors
provide a current-gain scaling, where I DAC or Q DAC gain is a
10-bit word in the SPI port register (Register 0x0B, Register 0x0C,
Register 0x0F, and Register 0x10). The default value for the DAC
gain registers gives an I
I
FS
R
of approximately 20 mA. IFS is equal to
FS
⎛
⎜
1024
⎝
6
×+×= DAC Gain
27V 1.2
⎛
⎜
12
⎝
in the resistor of
⎞
⎞
32
×
⎟
⎟
⎠
⎠
0.1µF
(mA)
FS
I
AD9776A/AD9778A/AD9779A
VREF
I120
10kΩ
35
30
25
20
15
10
5
1.2V BAND GAP
Figure 75. Reference Circuitry
I DAC GAIN
CURRENT
SCALING
Q DAC GAIN
I DAC
DAC FULL-SCALE
REFERENCE
CURRENT
Q DAC
06452-073
0
0
200 400 600 800
DAC GAIN CODE
Figure 76. I
vs. DAC Gain Code
FS
1000
06452-074
Rev. A | Page 39 of 60
Page 40

AD9776A/AD9778A/AD9779A
TRANSMIT PATH GAIN AND OFFSET CORRECTION
Analog quadrature modulators make it very easy to realize
single sideband radios. However, there are several nonideal
aspects of quadrature modulator performance. Among these
analog degradations are
• Gain mismatch—the gain in the real and imaginary signal
paths of the quadrature modulator may not be matched
perfectly. This leads to less than optimal image rejection as
the cancellation of the negative frequency image is less than
perfect.
• LO feedthrough—the quadrature modulator has a finite dc
referred offset, as well as coupling from its LO port to the
signal inputs. These can lead to a significant spectral spurs
at the frequency of the quadrature modulator LO.
The AD9776A/AD9778A/AD9779A have the capability to
correct for both of these analog degradations. Note that these
degradations drift over temperature; therefore, if close to optimal
single sideband performance is desired, a scheme for sensing
these degradations over temperature and correcting for them
may be necessary.
I/Q CHANNEL GAIN MATCHING
Gain matching is achieved by adjusting the values in the DAC
gain registers. For the I DAC, these values are in the I DAC
Control Register 0x05. For the Q DAC, these values are in the
Q DAC Control Register 0x07. These are 10-bit values. To
perform gain compensation, raise or lower the value of one of
these registers by a fixed step size and measure the amplitude
of the unwanted image. If the unwanted image is increasing in
amplitude, stop the procedure and try the same adjustment on
the other DAC control register. Do this until the image rejection
cannot be improved through further adjustment of these registers.
It should be noted that LO feedthrough compensation is independent of phase compensation. However, gain compensation
could affect the LO compensation because the gain compensation may change the common-mode level of the signal. The dc
offset of some modulators is common-mode level dependent.
Therefore, it is recommended that the gain adjustment is
performed prior to LO compensation.
AUXILIARY DAC OPERATION
Two auxiliary DACs are provided on the AD9776A/AD9778A/
AD9779A. The full-scale output current on these DACs is derived
from the 1.2 V band gap reference and external resistor between
the I120 pin and ground. The gain scale from the reference
amplifier current (I
current is 16.67 with the auxiliary DAC gain set to full scale
(10-bit values, SPI Register 0x0D and SPI Register 0x11), this
) to the auxiliary DAC reference
REFERENCE
gives a full-scale current of approximately 2 mA for AUX DAC1
and AUX DAC2.
The AUX DAC structure is shown in Figure 77. Only one of
the two output pins of the AUX DAC is active at a time. The
inactive side goes to a high impedance state (>100 k). The
active output pin is chosen by writing to Register 0x0E and
Register 0x10, Bit 7.
The active output can act as either a current source or a current
sink. When sourcing current, the output compliance voltage is
0 V to 1.6 V. When sinking current, the output compliance voltage
is 0.8 V to 1.6 V. The output pin is chosen to be a current source
or current sink by writing to Register 0x0E and Register 0x10, Bit 6.
0 TO 2mA
(SOURCE)
V
BIAS
0 TO 2mA
(SINK)
SOURCE/
SINC
Figure 77. Auxiliary DAC Structure on AD9776A/AD9778A/AD97779A
P/N
AUXP
AUXN
6452-303
The magnitude of the AUX DAC1 current is controlled by the
AUX DAC1 Control Register 0x0D, and the magnitude of the
AUX DAC2 current is controlled by the AUX DAC2 Control
Register 0x11. These AUX DACs have the ability to source or
sink current. This is programmable via Bit 14 in either AUX
DAC control register. The choice of sinking or sourcing should
be made at circuit design time. There is no advantage to switching between source or sinking current once the circuit is in place.
The auxiliary DACs can be used for local oscillator (LO)
cancellation when the DAC output is followed by a quadrature
modulator. This LO feedthrough is caused by the input referred
dc offset voltage of the quadrature modulator (and the DAC
output offset voltage mismatch) and can degrade system performance. Typical DAC-to-quadrature modulator interfaces are
shown in Figure 78 and Figure 79. Often, the input commonmode voltage for the modulator is much higher than the output
compliance range of the DAC, so that ac coupling or a dc level
shift is necessary. If the required common-mode input voltage
on the quadrature modulator matches that of the DAC, then the
dc blocking capacitors in Figure 78 can be removed. A low-pass
or band-pass passive filter is recommended when spurious signals
from the DAC (distortion and DAC images) at the quadrature
modulator inputs can affect the system performance. Placing the
filter at the location shown in Figure 78 and Figure 79 allows
easy design of the filter, as the source and load impedances can
easily be designed close to 50 Ω.
Rev. A | Page 40 of 60
Page 41

AD9776A/AD9778A/AD9779A
–
–
B
AD9779A
I DAC
25Ω TO 50Ω
0.1µF
0.1µF
AD9779A
Q DAC
25Ω TO 50Ω
OPTIO NAL
PASSIVE
FILTERING
QUADRATURE
MODULATOR V +
AD9779A
QUAD MOD
I INPUTS
0.1µF
OPTIONAL
PASSIVE
FILTERING
0.1µF
AUX
DAC1
QUADRATURE
MODULATOR V +
AD9779A
AUX
DAC2
QUAD MOD
Q INPUTS
Figure 78. Typical Use of Auxiliary DACs AC Coupling to
Quadrature Modulator
QUADRATURE
MODULATOR V+
AD9779A
AD9779A
I OR Q DAC
25Ω TO 50Ω
AUX DAC1
OR
AUX DAC2
OPTIONAL
PASSIVE
FILTERING
QUAD MOD
I OR Q INPUTS
25Ω TO 50Ω
06452-116
Figure 79. Typical Use of Auxiliary DACs DC Coupling to Quadrature
Modulator with DC Shift
LO FEEDTHROUGH COMPENSATION
The LO feedthrough compensation is the most complex of all
three operations. This is due to the structure of the offset auxiliary DACs, as shown in Figure 77. To achieve LO feedthrough
compensation in a circuit, each of four outputs of these AUX
DACs must be connected through a 50 resistor to ground
and through a 250 resistor to one of the four quadrature
modulator signal inputs. The purpose of these connections is
to drive a very small amount of current into the nodes at the
quadrature modulator inputs, therefore adding a slight dc bias
to one or the other of the quadrature modulator signal inputs.
This can be seen in the schematics for the AD9776A/AD9778A/
AD9779A evaluation board (see Figure 106).
To achieve LO feedthrough compensation, the user should start
with the default conditions of the AUX DAC sign registers, and
then increment the magnitude of one or the other AUX DAC
output currents. While this is being done, the amplitude of the
LO feedthrough at the quadrature modulator output should be
sensed. If the LO feedthrough amplitude increases, try either
changing the sign of the AUX DAC being adjusted, or adjusting
the output current of the other AUX DAC. It may take practice
before an effective algorithm is achieved.
Rev. A | Page 41 of 60
Using the AD9776A/AD9778A/AD9779A evaluation board, the
LO feedthrough can typically be adjusted down to the noise
floor, although this is not stable over temperature.
RESULTS OF GAIN AND OFFSET CORRECTION
The results of gain and offset correction can be seen in Figure 80
and Figure 81. Figure 80 shows the output spectrum of the quadrature demodulator before gain and offset correction. Figure 81
shows the output spectrum after correction. The LO feedthrough
spur at 2.1 GHz has been suppressed to the noise level. This
result can be achieved by applying the correction, but the correction needs to be repeated after a large change in temperature.
Note that the gain matching improved the negative frequency
06452-115
image rejection, but there is still a significant image present.
The remaining image is now due to phase mismatch in the
quadrature modulator. Phase mismatch can be distinguished
from gain mismatch by the shape of the image. Note that the
image in Figure 80 is relatively flat and the image in Figure 81
slopes down with frequency. Phase mismatch is frequency
dependent, so an image dominated by phase mismatch has
this sloping characteristic.
RBW 3kHz REF ATT 30 dB
VBW 3kHz MI XER –40dBm
SWT 56s UNIT dBm
20MHz
SPAN 200MHzCENTER 2.1G Hz
06452-304
–10
–20
–30
–40
–50
–60
–70
–80
–90
100
0
REF LVL
0dBm
Figure 80. AD9779A and ADL5372 with a Multitone Signal at 2.1GHz, No
Gain or LO Compensation
REF LVL
0dBm
0
–10
–20
–30
–40
–50
–60
–70
–80
–90
100
Figure 81. AD9779A and ADL5372 with a Multitone Signal at 2.1 GHz, Gain
and LO Compensation Optimized
RBW 20kHz REF ATT 20d
VBW 20kHz MI XER –40dBm
SWT 1.25s UNIT dBm
20MHz
SPAN 200MHzCENTER 2.1G Hz
06452-305
Page 42

AD9776A/AD9778A/AD9779A
INPUT DATA PORTS
The AD9776A/AD9778A/AD9779A can operate in two data
input modes: dual port mode and single port mode. For the
default dual port mode (Single Port = 0), each DAC receives
data from a dedicated input port. In single port mode (Single
Port = 1), both DACs receive data from Port 1. In single port
mode, DAC1 and DAC2 data is interleaved and the TXENABLE
input is used to steer data to the intended DAC. In dual port
mode, the TXENABLE input is used to power down the digital
data path.
In dual port mode, the data must be delivered at the input data
rate. In single port mode, data must be delivered at twice the
input data rate of each DAC. Because the data inputs function
up to a maximum of 300 MSPS, it is only practical to operate
with input data rates up to 150 MHz per DAC in single port mode.
In dual port and single port modes, a data clock output
(DATACLK) signal is available as a fixed time base with which
to drive data from an FPGA or other data source. This output
signal operates at the input data rate.
SINGLE PORT MODE
In single port mode, data for both DACs is received on the Port 1
input bus (P1D<15:0>). I and Q data samples are interleaved
and are sampled on the rising edges of DATACLK. Along with
the data, a framing signal must be supplied on the TXENABLE
input (Pin 39), which steers incoming data to its respective DAC.
When TXENABLE is high, the corresponding data-word is sent
to the I DAC and when TXENABLE is low the corresponding data
is sent to the Q DAC. The timing of the digital interface in
interleaved mode is shown in Figure 83.
The Q First bit (Register 0x02, Bit 0) controls the pairing order
of the input data. With the Q First bit set to the default of 0, the
IQ pairing sent to the DACs is the two input data-words corresponding to TXENABLE low followed by TXENABLE high. With
the Q First bit set to 1, the IQ pairing sent to the DACs is the
two input data-words corresponding to TXENABLE high followed
by TXENABLE low. Note that with either order pairing, the
data sent with TXENABLE high is directed to the I DAC, and
the data sent with TXENABLE low is directed to the Q DAC.
DATACLK
P1D<15:0>
IQSELECT
Q FIRST = 0
Q FIRST = 1
I DAC<15:0>
Q DAC<15:0>
I DAC<15:0>
Q DAC<15:0>
P1D<1> P1D<2> P1D<3> P1D<4> P1D<5> P1D<6> P1D<7> P1D<8>
Figure 83. Single Port Mode Digital Interface Timing
DUAL PORT MODE
In dual port mode, data for each DAC is received on the
respective input bus (P1D<15:0> or P2D<15:0>). I and Q data
arrive simultaneously and are sampled on the rising edge of the
DATACLK signal. The TXENABLE signal must be high to enable
the transmit path.
INPUT DATA REFERENCED TO DATACLK
The simplest method of interfacing to the AD9776A/AD9778A/
AD9779A is when the input data is referenced to the DATACLK
output. The DATACLK output is a buffered version (with some
fixed delay) of the internal clock that is used to latch the input
data. Therefore, if setup and hold times of the input data with
respect to DATACLK are met, the input data is latched correctly.
Detailed timing diagrams for the single and dual port cases
using DATACLK as the timing reference are shown in Figure 82.
DATACLK
t
SDATACLK
DATA
Figure 82. Input Data Port Timing, Data Referenced to DATACLK
Tabl e 25 shows the setup and hold time requirements for the
input data over the operating temperature range of the device.
Also shown is the keep out window (KOW). The keep out
window is the sum of the setup and hold times of the interface.
This is the minimum amount of time valid data must be
presented to the device in order to ensure proper sampling.
DATACLK Frequency Settings
The DATACLK signal is derived from the internal DAC sample
clock, DACCLK. The frequency of the DATACLK output depends
on several programmable settings. Normally, the frequency of
DATACLK is equal to the input data rate. The relationship
between the frequency of DACCLK and DATACLK is
f
f
DATACLK
=
DACCLK
DATACLKDIVSPZSIF
×××
The variables IF, ZS, SP, and DATACLKDIV have the values
shown in Tab l e 24 .
P1D<1> P1D<3> P1D< 5>
P1D<2> P1D<4> P1D< 6>
P1D<1>
P1D<0>
P1D<3> P1D<5>
P1D<2> P1D<4>
06452-306
t
HDATACLK
06452-308
Rev. A | Page 42 of 60
Page 43

AD9776A/AD9778A/AD9779A
K
The DATACLKDIV only affects the DATACLK output frequency
and not the frequency of the data sampling clock. To maintain
an f
frequency that samples the input data that remains
DATACLK
consistent with the expected data rate, DATACLKDIV should
be set to 00.
Table 24. DACCLK to DATACLK Divisor Values
Address
Variable Value
Register Bit
IF Interpolation factor 0x01 <7:6>
ZS 1, if zero stuffing is disabled
0x01 <0>
2, if zero stuffing is enabled
SP 0.5, if single port is enabled
0x02 <6>
1, if dual port is selected
DATACLKDIV 1, 2, or 4 0x03 <5:4>
INPUT DATA REFERENCED TO REFCLK
In some systems, it may be more convenient to use the REFCLK
input rather than the DATACLK output as the input data timing
reference. If the frequency of DACCLK is equal to the frequency
of the data input (no interpolation is used), then the Data with
Respect to REFCLK± timing specifications of Tab le 2 5 apply
directly without further considerations. If the frequency of
DACCLK is greater than the frequency of the input data, a
divider is used to generate the DATACLK output (and the
internal data sampling clock). This divider creates a phase
ambiguity between REFCLK and DATACLK, which results in
uncertainty in the sampling time. In order to establish fixed
setup and hold times of the data interface, this phase ambiguity
must be eliminated.
To eliminate the phase ambiguity, the SYNC_I input pins (Pin 13
and Pin 14) must be used to force the data to be sampled on a
specific REFCLK edge. The relationship between REFCLK,
SYNC_I, and the input data is shown in Figure 84 and Figure 85.
Therefore, both SYNC_I and DATA must meet the timing in
Tabl e 25 for reliable data transfer into the device.
SYNC_I
t
H_SYNC
t
S_SYNC
REFCL
t
SREFCLK
DATA
Figure 84. Input Data Port Timing, Data Referenced to REFCLK, f
t
HREFCLK
DACCLK
= f
REFCLK
Note that even though the setup and hold time of SYNC_I
is relative to REFCLK, the SYNC_I input is sampled at the
internal DACCLK rate. In the case where the PLL is employed,
SYNC_I must be asserted to meet the setup time with respect to
REFCLK (t
), but cannot be asserted prior to the previous
S_SYNC
rising edge of the internal SYNC_I sample clock. In other words,
the SYNC_I assert edge has to be placed between its successive
keep out windows that replicate at the DACCLK rate and not
the REFCLK rate. The valid window for asserting SYNC_I is
shaded gray in Figure 85 for the case where the PLL provides a
DACCLK frequency of four times the REFCLK frequency.
Thus, the minimum setup time is t
setup time is t
SYNC_I
REFCLK
DACCLK
DATA
Figure 85. Input Data Port Timing, Data Referenced to REFCLK,
DACCLK
t
− t
t
DACCLK
SREFCLK
H_SYNC
f
DACCLK
.
t
S_SYNC
t
HREFCLK
= f
t
and the maximum
S_SYNC
H_SYNC
× 4
REFCLK
06452-310
More details of the synchronization circuitry are found in the
Device Synchronization section of this data sheet.
06452-309
Table 25. Data Timing Specifications vs. Temperature
PLL Disabled PLL Enabled
Timing Parameter Temperature
Min tS (ns) Min tH (ns) Min KOW (ns) Min tS (ns) Min tH (ns) Min KOW (ns)
Data with Respect to REFCLK± −40°C −0.80 3.35 2.55 −0.83 3.87 2.99
+25°C −1.00 3.50 2.50 −1.06 4.04 2.98
+85°C −1.10 3.80 2.70 −1.19 4.37 3.16
−40°C to +85°C −0.80 3.80 3.00 −0.83 4.37 3.54
Data with Respect to DATACLK −40°C 2.50 −0.05 2.45 2.50 −0.05 2.45
+25°C 2.70 −0.20 2.50 2.70 −0.20 2.50
+85°C 3.00 −0.40 2.60 3.00 −0.40 2.60
−40°C to +85°C 3.00 −0.05 2.95 3.00 −0.05 2.95
SYNC_I± to REFCLK± −40°C 0.30 0.65 0.95 0.27 1.17 1.39
+25°C 0.25 0.75 1.00 0.19 1.29 1.48
+85°C 0.15 0.90 1.05 0.06 1.47 1.51
−40°C to +85°C 0.30 0.90 1.20 0.27 1.47 1.74
Rev. A | Page 43 of 60
Page 44

AD9776A/AD9778A/AD9779A
0
OPTIMIZING THE DATA INPUT TIMING
The AD9776A/AD9778A/AD9779A have on-chip circuitry that
enables the user to optimize the input data timing by adjusting
the relationship between the DATACLK output and DCLK_SMP,
the internal clock that samples the input data. This optimization
is made by a sequence of SPI register read and write operations.
The timing optimization can be done under strict control of the
user, or the device can be programmed to maintain a configurable timing margin automatically. Each of these methods is
detailed in the following section.
Figure 86 shows the circuitry that detects sample timing errors
and adjusts the data interface timing. The DCLK_SMP signal is
the internal clock used to latch the input data. Ultimately, it is
the rising edge of this signal that needs to be centered in the
valid sampling period of the input data. This is accomplished by
adjusting the time delay, t
timing and as a result, the arrival time of the input data with
respect to DCLK_SMP.
Δ
TIMING
MARGIN <3:0>
PD1<0>
DATACLK
DELAY<3:0>
DCLK_SMP
Figure 86. Timing Error Detection and Optimization Circuitry
The error detect circuitry works by creating two sets of sampled
data (referred to as the margin test data) in addition to the
actual sampled data used in the device data path. One set of
sampled data is latched before the actual data sampling point.
The other set of sampled data is latched after the actual data
sampling point. If the margin test data match the actual data,
the sampling is considered valid and no error is declared. If
there is a mismatch between the actual data and the margin test
data an error is declared.
The Data Timing Margin<3:0> variable determines how much
before and after the actual data sampling point the margin test
data are latched. Therefore, the data timing margin variable
determines how much setup and hold margin the interface
needs for the data timing error IRQ to remain inactive (show
error free operation). Therefore, the timing error IRQ is set
whenever the setup and hold margins drop below the Data
Timing Margin<3:0> value and does not necessarily indicate
that the data latched into the device is incorrect.
In addition to setting the data timing error IRQ, the Data
Timing Error Type bit is indicated when an error occurs. The
Data Timing Error Type bit is set low to indicate a hold error
, which changes the DATACLK
D
t
M
Δ
Δ
D
CLK
DETECT ION
DQQ
t
CLK
M
t
D
TIMING
ERROR
TIMING
ERROR IRQ
TIMING
ERROR TYPE
DATAC LK
06452-402
and high to indicate a setup error. Figure 87 shows a timing
diagram of the data interface and the status of the Data Timing
Error Type bit.
DATA
TIMING ERROR = 0
ΔtMΔt
M
DATA
TIMING ERROR = 1
ΔtMΔt
M
DATA
ΔtMΔt
M
DELAYED
DATA
SAMPLING
Figure 87. Timing Diagram of Margin Test Data
ACTUAL
SAMPLING
INSTANT
DATA T IMING E RROR TYPE = 1
TIMING ERROR = 1
DATA T IMING E RROR TYPE =
DELAYED
CLOCK
SAMPLING
06452-403
Automatic Timing Optimization
When automatic timing optimization mode is enabled
(Register 0x03, Bit 7 = 1), the device continuously monitors
the Data Timing Error IRQ and Data Timing Error Type bits.
The DATACLK Delay<3:0> is increased if a setup error is
detected and decreased if a hold error is detected. The value of
the DATACLK Delay<3:0> setting currently in use can be read
back by the user.
Manual Timing Optimization
When the device is operating in manual timing optimization
mode (Register 0x03, Bit 7 = 0), the device does not alter the
DATACLK Delay<3:0> value from what is programmed by the
user. By default, the DATACLK Delay Enable is inactive. This
bit must be set high for the DATACLK Delay<3:0> value to be
realized. The delay (in absolute time) when programming
DATACLK delay between 00000 and 11111 varies from about
700 ps to about 6.5 ns. The typical delays per increment over
temperature are shown in Tabl e 26 .
Table 26. Data Delay Line Typical Delays Over Temperature
Delay −40°C +25°C +85°C Unit
Zero Code Delay (Delay Upon
630 700 740 ps
Enabling Delay Line)
Average Unit Delay 175 190 210 ps
In manual mode, the error checking logic is activated and
generates an interrupt if a setup/hold violation is detected. One
error check operation is performed per device configuration.
Any change to the Data Timing Margin<3:0> or DATACLK
Delay<3:0> values triggers a new error check operation.
Rev. A | Page 44 of 60
Page 45

AD9776A/AD9778A/AD9779A
DEVICE SYNCHRONIZATION
System demands can impose two different requirements for
synchronization. Some systems require multiple DACs to be
synchronized to each other. This is the case when supporting
transmit diversity or beam forming, where multiple antennas
are used to transmit a correlated signal. In this case, the DAC
outputs need to be phase aligned with each other, but there may
not be a requirement for the DAC outputs to be aligned with a
system level reference clock. In systems with a time division
multiplexing transmit chain, one or more DACs may need to be
synchronized with a system level reference clock. The options
for synchronizing devices under these two conditions are
described in the following section.
SYNCHRONIZATION LOGIC OVERVIEW
Figure 88 shows the block diagram of the on-chip synchronization logic. The basic operation of the synchronization logic is to
generate a single DACCLK cycle wide initialization pulse that
sets the clock generation state machine logic to a known state.
This initialization pulse loads the clock generation state machine
with the Clock State<4:0> value as its next state. If the initialization pulse from the synchronization logic is generated properly,
it is active for one DAC clock cycle, every 32 DAC clock cycles.
Because the clock generation state machine has 32 states operating
at the DACCLK rate, every initialization pulse received after the
first pulse loads the state in which the state machine is already
in, maintaining proper clocking operation of the device.
PLL
BYPASS
INTERNAL
DACCLK
CLOCK
GENERATION
STATE
MACHINE
SYNC_I
NO MINIMUM FREQUENCY
MIN 1 DACCLK CYCLE
BIT 0 (1× INTERPOLATION)
BIT 1 (2×)
BIT 2 (4×)
BIT 3 (8×)
BIT 4 (8× WITH
ZERO STUFFING)
LOAD DACCLK OF FSET VALUE (REG 0x07),
[4:0], ONE DACCLK CYCLE/INCREMENT
DELAY REGISTER
(REG 0x06), [7:4]
FREQUENCY
MAX
f
DATA
DUTY CYCLE
MAX 50%
Figure 88. Synchronization Circuitry Block Diagram
/2
SYNC
DELAY
ERROR DETECT
GENERATION
PLL
MUX
CIRCUITRY
PULSE
LOGIC
Nominally, the SYNC_I input should have one rising edge every
32 (or multiple of 32) clock cycles to maintain proper synchronization. The pulse generation logic can be programmed to
suppress outgoing pulses if the incoming SYNC_I frequency is
above DACCLK/32. Extra pulses can be suppressed by the ratios
listed in Table 2 7. The SYNC_I frequency can be lower than
DACCLK/32 as long as output pulses are generated from the
REFCLK
SYNC IRQ
Rev. A | Page 45 of 60
06452-400
pulse generation circuit on a multiple of 32 DACCLK periods.
In any case, the maximum frequency of SYNC_I must be less
DACCLK
.
than f
Table 27. Settings Required to Support Various SYNC_I
Frequencies
SYNC_I
Ratio<2:0>
SYNC_I Rising Edges Required for
Synchronization Pulse
000 1 (default)
001 2
010
011
100
101
110
4
8
16
Invalid setting
Invalid setting
111 Invalid setting
As an example, if a SYNC_I signal with a frequency of f
DACCLK
/4
is used, then both 011 and 100 are valid settings for the SYNC_I
Ratio<2:0> value. A setting of 011 results in one initialization
pulse being generated every 32 DACCLK cycles and a setting
of 100 results in one initialization pulse being generated every
64 DACCLK cycles. Both cases result in proper device
synchronization.
The Clock State<4:0> value is the state to which the clock
generation state machine resets upon initialization. By varying
this value, the timing of the internal clocks with respect to the
SYNC_I signal can be adjusted. Every increment of the Clock
State<4:0> value advances the internal clocks by one DACCLK
period.
Synchronization Timing Error Detection
The synchronization logic has error detection circuitry similar
to the input data timing. The SYNC_I Timing Margin<3:0>
variable determines how much setup and hold margin the
synchronization interface needs for the SYNC_I timing error
IRQ to remain inactive (show error free operation). Therefore,
the SYNC_I timing error IRQ is set whenever the setup and
hold margins drop below the SYNC_I Timing Margin<3:0>
value and does not necessarily indicate that the SYNC_I input
was latched incorrectly.
When a SYNC_I timing error IRQ is set, corrective action can
be taken to restore timing margin. One course of action is to
temporarily reduce the timing margin until the SYNC_I timing
error is cleared. Then increase the SYNC_I delay by two increments. Check whether the timing margin has increased or
decreased. If it has increased, continue incrementing the value
of SYNC_I delay until the margin is maximized. If incrementing
the SYNC_I delay reduced the timing margin, then the delay
should be reduced until the timing margin is optimized.
Page 46

AD9776A/AD9778A/AD9779A
TOUTMA
SYNCHRONIZING DEVICES TO A SYSTEM CLOCK
The AD9776A/AD9778A/AD9779A offer a pulse mode synchronization scheme (see Figure 89) to align the DAC outputs of
multiple devices within a system to the same DAC clock edge.
The internal clocks are synchronized by providing either a one
time pulse or periodic signal to the SYNC_I inputs (SYNC_I+,
SYNC_I−). The SYNC_I signal is sampled by the internal
DACCLK sample rate clock.
The SYNC_I input frequency has the following constraint:
ff ≤
DATA
ISYNC
_
When the internal clocks are synchronized, the data sampling
clocks between all devices are phase aligned. The data input
timing relationships can be referenced to either REFCLK or
DATACLK.
For this synchronization scheme, all devices are slave devices,
while the system clock generation/distribution chip serves as
the master. It is vital that the SYNC_I signal be distributed
between the DACs with low skew. Likewise, the REFCLK
signals must be distributed with low skew. Any skew on these
signals between the DACs must be accounted for in the timing
budget. Figure 89 shows an example clock and synchronization
input scheme.
Figure 90 shows the timing of the SYNC_I input with respect to
the REFCLK input. Note that although the timing is relative to
the REFCLK signal, SYNC_I is sampled at the DACCLK rate.
This means that the rising edge of the SYNC_I signal must occur
after the hold time of the preceding DACCLK rising edge and
not the preceding REFCLK rising edge.
INTERRUPT REQUEST OPERATION
The IRQ pin (Pin 71) acts as an alert in the event that the
device has a timing error and should be queried (by reading
Register 0x19) to determine the exact fault condition. The IRQ
pin is an open-drain, active low output. The IRQ pin should be
pulled high external to the device. This pin can be tied to the
IRQ pins of other devices with open-drain outputs to wire-OR
these pins together.
There are two different error flags that can trigger an interrupt
request, a data timing error or a sync timing error. By default,
when either or both of these error flags are set, the IRQ pin is
active low. Either or both of these error flags can be masked to
prevent them from activating an interrupt on the IRQ pin.
The error flags are latched and remain active until the Interrupt
register, Register 0x19, is either read from or the error flag bits
are overwritten.
TCHED
LENGTH TRACES
REFCLK
SYNC_I
OU
SYSTEM CLOCK
PULSE
GENERATOR
LOW SKEW
CLOCK DRIVER
REFCLK
SYNC_I
LOW SKEW
CLOCK DRIVER
Figure 89. Multichip Synchronization in Pulse Mode
MATCHED
LENGTH TRACES
06452-311
SYNC_I
REFCLK
DACCLK
Figure 90. Timing Diagram of SYNC_I with Respect to REFCLK Synchronizing Multiple Devices to Each Other
t
S_SYNC
t
H_SYNC
06452-312
Rev. A | Page 46 of 60
Page 47

AD9776A/AD9778A/AD9779A
POWER DISSIPATION
Figure 91 to Figure 99 show the power dissipation of the 1.8 V
and 3.3 V digital and clock supplies in single DAC and dual DAC
modes. In addition to this, the power dissipation/current of the
3.3 V analog supply (mode and speed independent) in single DAC
0.7
0.6
8× INTERPOLATI ON,
0.5
0.4
0.3
POWER (W)
0.2
0.1
ZERO STUFFING
8× INTERPOLATION
4× INT ERPOLATI ON,
ZERO STUFFING
4× INTERPOLATION
2× INT ERPOLATI ON,
ZERO STUFFING
2× INTERPOLATION
1× INT ERPOLATI ON,
ZERO STUFFING
1× INTERPOLATION
mode is 102 mW/31 mA. In dual DAC mode, this is 182 mW/
55 mA. When the PLL is enabled, it adds 50 mA/90 mW to the
1.8 V clock supply.
0.075
ALL INTERPOLATIO N MODES
0.050
POWER (W)
0.025
0
0
25 50 75 100 125 150 175 200 225
f
(MSPS)
DATA
250
06452-076
Figure 91. Total Power Dissipation, I Data Only, Real Mode
0.4
8× INTERPOLATION
0.3
0.2
POWER (W)
0.1
0
0
25 50 75 100 125 150 175 200 225
4× INTERPOLATION
f
(MSPS)
DATA
2× INTERPOLATION
1× INTERPOLATION
250
06452-078
Figure 92. Power Dissipation, Digital 1.8 V Supply, I Data Only, Real Mode,
Does Not Include Zero Stuffing
0.08
0.06
8× INTERPOLATION
4× INTERPOLATION
0
0
25 50 75 100 125 150 175 200 225
f
(MSPS)
DATA
250
06452-080
Figure 94. Power Dissipation, Digital 3.3 V Supply, I Data Only, Real Mode,
Includes Modulation Modes and Zero Stuffing
1.0
8× INTE RPOLATI ON,
0.9
ZERO STUFFING
0.8
0.7
0.6
0.5
0.4
POWER (W)
0.3
0.2
4× INT ERPOLATI ON,
ZERO STUFFING
0.1
0
25 50 75 1 00 125 150 175 200 225
0 300250 275
8× INTE RPOLATI ON, ALL
MODULATION MO DES
2× INTERPOLATI ON,
ZERO STUFFING
f
DATA
(MSPS)
1× INTERPOLATION,
ZERO STUFFING
4× INTERPOLATION,
ALL MODULATION
MODES
2× INTERPOLATION,
ALL MODULATION MODES
1× INTERPOLATION
06452-077
Figure 95. Total Power Dissipation, Dual DAC Mode
0.8
8× INTERPOLATION, f
0.7
0.6
0.5
NO MODULATI ON
f
f
DAC
DAC
DAC
/8,
/4,
/2,
4× INTE RPOL ATION
0.04
POWER (W)
0.02
0
0
25 50 75 100 125 150 175 200 225
f
(MSPS)
DATA
2× INTERPOLATION
1× INTERPOLATION
250
Figure 93. Power Dissipation, Clock 1.8 V Supply, I Data Only, Real Mode,
Includes Modulation Modes, Does Not Include Zero Stuffing
Rev. A | Page 47 of 60
0.4
POWER (W)
0.3
0.2
0.1
0
02
25 50 75 100 125 150 175 200 225
f
(MSPS)
06452-079
DATA
2× INTERPOLATION
1× INTERPOLATION,
NO MODULATI ON
50
06452-081
Figure 96. Power Dissipation, Digital 1.8 V Supply, I and Q Data, Dual DAC
Mode, Does Not Include Zero Stuffing
Page 48

AD9776A/AD9778A/AD9779A
0.125
8× INTERPOLATION, f
0.100
0.075
0.050
POWER (W)
0.025
0
0
NO MODULATI ON
25 50 75 100 125 150 175 200 225
f
f
DAC
DAC
DAC
f
/8,
/4,
/2,
DATA
(MSPS)
4× INTERPOLATION
2× INTERPOLATION
1× INTERPOLATION,
NO MODULATI ON
250
Figure 97. Power Dissipation, Clock 1.8 V Supply, I and Q Data, Dual DAC
Mode, Does Not Include Zero Stuffing
0.075
ALL INTERPOLATION MODES
0.050
POWER (W)
0.025
06452-082
POWER-DOWN AND SLEEP MODES
The AD9776A/AD9778A/AD9779A have a variety of powerdown modes; thus, the digital engine, main TxDACs, or auxiliary
DACs can be powered down individually or together. Via the SPI
port, the main TxDACs can be placed in sleep or power-down
mode. In sleep mode, the TxDAC output is turned off, thus
reducing power dissipation. The reference remains powered on,
however, so that recovery from sleep mode is very fast. With the
power-down mode bit set (Register 0x00, Bit 4), all analog and
digital circuitry, including the reference, is powered down. The
SPI port remains active in this mode. This mode offers more
substantial power savings than sleep mode, but the turn-on
time is much longer. The auxiliary DACs also have the capability
to be programmed into sleep mode via the SPI port. The Auto
Power-Down Enable bit (Register 0x00, Bit 3) controls the
power-down function for the digital section of the devices. The
auto power-down function works in conjunction with the
TXENABLE pin (Pin 39) according to Ta b le 2 8 .
Table 28.
TXENABLE
(Pin 39) Description
0
1 Normal operation.
If Auto Power-Down Enable bit = 0, flush data
path with 0s.
If Auto Power-Down Enable bit = 1, flush data
for multiple REFCLK cycles; then automatically
place the digital engine in power-down state.
DACs, reference, and SPI port are not affected.
0
0
25 50 75 100 125 150 175 200 225
f
(MSPS)
DATA
Figure 98. Power Dissipation, Digital 3.3 V Supply, I and Q Data,
Dual DAC Mode
0.16
0.14
0.12
0.10
0.08
POWER (W)
0.06
0.04
0.02
0
0
200 400 600 800 1000
f
(MSPS)
DAC
Figure 99. DVDD18 Power Dissipation of Inverse Sinc Filter
250
1200
As shown in Figure 100, the power dissipation saved by using
the power-down mode is nearly proportional to the duty cycle
06452-083
06452-084
of the signal at the TXENABLE pin.
0.9
0.8
0.7
0.6
0.5
0.4
POWER SAVINGS
0.3
0.2
0.1
0
0180604020
DUTY CYCLE (%)
Figure 100. Power Savings Based on Duty Cycle of TXENABLE
(If the TxEnable Invert bit (Register 0x02, Bit 1) is set, the function of the
TXENABLE pin is inverted)
2× INT f
2× INT f
4× INT
4× INT f
8× INT f
8× INT f
DATA
DATA
f
DATA
DATA
DATA
DATA
= 50MSPS
= 200MSPS
= 50MSPS
= 200MSPS
= 50MSPS
= 200MSPS
00
06452-119
Rev. A | Page 48 of 60
Page 49

AD9776A/AD9778A/AD9779A
C
EVALUATION BOARD OPERATION
The AD9776A/AD9778A/AD9779A evaluation board is
designed to optimize the DAC performance and the speed of
the digital interface, yet remains user friendly. To operate the
board, the user needs a power source, a clock source, and a
digital data source. The user also needs a spectrum analyzer
or an oscilloscope to look at the DAC output. The diagram in
CLOCK
GENERATOR
ADAPTER
CABLES
CLKIN SPI PORT
Figure 101 illustrates the test setup. A sine or square wave clock
works well as a clock source. The dc offset on the clock is not a
problem, because the clock is ac-coupled on the evaluation board
before the REFCLK inputs. All necessary connections to the
evaluation board are shown in more detail in Figure 102.
SPECTRUM
ANALYZER
1.8V POWE R SUPPLY
3.3V POWE R SUPPLY
6452-097
DIGITAL
PATTERN
GENERATOR
LOCK IN
DATACLK OUT
AD9776A/
AD9778A/
AD9779A
EVALUATIO N
BOARD
Figure 101. Typical Test Setup
AUX33
P4 DIGITAL INPUT CONNE CTOR
Figure 102. AD9776A/AD9778A/AD9779A Evaluation Board Showing All Connections
DVDD18 DVDD33 CVDD18 AVDD33
J1 CLOCK IN
JP4
JP15
JP8
SPI PORT
JP14
JP3
JP16
JP2
JP17
AD9779A
S7 DCLKOUT
MODULATOR
S5 OUTPUT 1
ADL537x
S6 OUTPUT 2
J2
5V SUPPLY
OUTPUT
+5V
GND
LOCAL OSC
INPUT
ANALOG
DEVICES
AD9776A/
AD9788A/
AD9779A
06452-098
Rev. A | Page 49 of 60
Page 50

AD9776A/AD9778A/AD9779A
1. SET INTERPOLATION RATE
2. SET INT ERPOLAT ION FI LTER MODE
3. SET INPUT DATA FORMAT
4. SET DATACLK POLARITY TO MATCH INPUT TIMING
Figure 103. SPI Port Software Window
The evaluation board comes with software that allows the user
to program the SPI port. Via the SPI port, the devices can be
programmed into any of its various operating modes. When
first operating the evaluation board, it is useful to start with a
simple configuration, that is, a configuration in which the SPI
port settings are as close as possible to the default settings. The
default software window is shown in Figure 103. The arrows
indicate which settings need to be changed for an easy first time
evaluation. Note that this implies that the PLL is not being used
and that the clock being used is at the speed of the DAC output
sample rate.
The default settings for the evaluation board allow the user
to view the differential outputs through a transformer that
converts the DAC output signal to a single-ended signal. On
6452-099
the evaluation board, these transformers are designated T1A,
T2A, T3A, and T4A. There are also four common-mode
transformers on the board that are designated T1B, T2B, T3B,
and T4B. The recommended operating setup places the transformer and common-mode transformer in series. A pair
of transformers and common-mode transformers are installed
on each DAC output, so that the pairs can be set up in either
order. As an example, for the frequency range of dc to 30 MHz,
it is recommended that the transformer be placed right after
the DAC. Above DAC output frequencies of 30 MHz, it is
recommended that the common-mode transformer be placed
right after the DAC outputs, followed by the transformer.
Rev. A | Page 50 of 60
Page 51

AD9776A/AD9778A/AD9779A
USING THE ADL5372 QUADRATURE MODULATOR
The evaluation board contains an Analog Devices ADL5372
quadrature modulator. The AD9776A/AD9778A/AD9779A
and ADL5372 provide an easy-to-interface DAC/modulator
combination that can be easily characterized on the evaluation
board. Solderable jumpers can be configured to evaluate the
single-ended or differential outputs of the AD9776A/AD9778A/
AD9779A. This is the default configuration from the factory
and consists of the following jumper positions:
• JP2, JP3, JP4, JP8—unsoldered
• JP14, JP15, JP16, JP17—soldered
To evaluate the ADL5372 on this board, these same jumper
positions should be reversed so that they are in the following
positions:
• JP2, JP3, JP4, JP8—soldered
• JP14, JP15, JP16, JP17—unsoldered
Note that the ADL5372 also requires its own separate +5 V and
GND connection on the evaluation board.
Figure 104. AD9776A/AD9778A/AD9779A Evaluation Board
Rev. A | Page 51 of 60
6452-307
Page 52

AD9776A/AD9778A/AD9779A
0
EVALUATION BOARD SCHEMATICS
6452-203
43
74AC14
U6
SO14
VDDM
RED
TP13
C66
.1UF
CC0402
LC1812
L12
C67
EXC-CL4532U1
.1UF
CC0402
22UF
16V
ACASE
VDDM_IN
TP14
RED
GND
C46
TP15
BLACK
89
74AC14
74AC14
U6
U6
SO14
1110
GND
74AC14
U6
SO14
SO14
56
R519K
U5
U5
P1
1
2
453
RC0805
RC0805
9KR53
SO14
1213
74AC14
12
SO14
74AC14
RC0805
R549K
1110
SO14
SO14
U5
U5
89
74AC14
74AC14
56
SO14
SO14
U5
U5
43
74AC14
74AC14
FCI-6889 8
TJAK06RAP
6
CLASS=IO
RED
TP16
1213
74AC14
U6
SO14
74AC14
U6
SO14
12
10K
R52
RC0805
RC0805
R55
10K
SPI_CSB
SPI_CLK
SPI_SDO
SPI_SDI
TP2
CVDD18
L1
LC1812
EXC-CL4532U1
RED
TP1
CVDD18_IN
BLK
C69
.1UF
C68
.1UF
CC0603 CC0603
TP17
RED
ACASE
C77
16V
22UF
DVDD18
L2
LC1812
EXC-CL4532U1
RED
TP3
DVDD18_IN
TP4
BLK
TP8
AVDD33
C70
.1UF
L3
LC1812
C71
.1UF
CC0603 CC0603
TP18
RED
ACASE
C76
16V
22UF
EXC-CL4532U1
AVDD33_IN
RED
BLK
C26
.1UF
C28
.1UF
CC0603 CC0603
TP19
RED
ACASE
C20
16V
22UF
DVDD33
L4
LC1812
EXC-CL4532U1
RED
TP6
DVDD33_IN
BLK
TP9
C42
.1UF
C45
.1UF
CC0603 CC0603
TP20
RED
ACASE
C21
16V
22UF
Figure 105. Evaluation Board, Rev. A, Power Supply and Decoupling
Rev. A | Page 52 of 60
Page 53

AD9776A/AD9778A/AD9779A
F
F
RC 060 3
S9
1
0
R22
QN
R10
6
T1B
1
QOUT_N
2
QOUT-QOUT_P
1
S6
2
6
TC1-1TT C1-1T
T4A
1234
T3A
JP16
0R8
R7 0
RC0603
50
50
R9
RC 060 3
RC0603
IN
JP14
1234
ADTL1-12
PS
6
34
34
ADTL1-12
6
34
ADTL1-12
1234
JP17
QP
RC0603
RC 060 3 RC 060 3
RC0603
0R6R5
0
JP15
.1U
C39
1NFC35
CC 040 2CC 0 40 2CC 0 40 2CC 040 2CC 0 40 2CC 040 2
C40 .1UF
C36 1NF
4.7UF
1NF
C34
CC 040 2CC0 40 2CC 040 2CC 040 2
.1UF
C38
DNP
RC 060 3
R21
1
PS
T4B
6
DVDD33
10K
GND ;5
1
PS
R11
13
T3B
6
50
JP2
JP3
RC0 60 3
50
R1
IP
T1A
RC1206
42
SW1
RED
TP12
TP11
D2P
D1N
JP8
D2N
JP4
CC 040 2CC0 40 2
1NF
C33
C62
.1UF
R63
RED
CC 060 3
C18
1NF
D1P
C37
.1UF
CC 040 2
CC 040 2
C60
C61
1NF
VOLT
ACA S E
C2
1NF
.1UF
C10
C25
DVDD33
P2D6
P2D5
P2D4
P2D3
2
S11
6.3V
1
ACASE
C8
P2D2
P2D1
P2D0
2
S14
1
R651K
CR2
RC 120 6
VAL
SPI_SDO
SPI_SDI
SPI_CLK
SPI_CSB
VAL
1K
RC 120 6
CR1
10UF
10K
R56
RC0 80 5
IOUT2_P
IOUT2_N
AUX2_P
AUX2_N
AUX1_N
AUX1_P
IOUT1_N
IOUT1_P
4.7UF
VOLT
CC0 40 2
CC 040 2
ACA S E
C1
C9
1NF
C24
.1UF
AVDD33
CC 040 2 CC0 40 2
C59
1NF
.1UF
.1U
C11
1NFC27
4.7UF
VOLT
ACA S E
C3
1NF
C12
C29
DVDD18
PAD
PAD
P2D6P2D7
5150
P2D5
52
VDDD18 _5 3
53
VSSD_54
54
P2D4
55
P2D3
56
P2D2
57
P2D1
58
P2D0
59
VDDD18 _6 0
60
VDDD33 _6 1
61
SYNC_ON
62
SYNC_OP
63
VSSD_64
64
PLL_LOCK
65
SPI_SDO
66
SPI_SDI
67
SPI_CLK
68
SPI_CSB
69
RESET
R64
70
IRQ
71
VSS_72
72
IPTAT
73
VREF_ 74
74
I120
75
VDDA33 _7 6
76
VSSA_77
77
VDDA33 _7 8
78
VSSA_79
79
VDDA33 _8 0
80
VSSA_81
81
VSSA_82
82
IOUT2_N
83
IOUT2_P
84
VSSA_85
85
AUX2_N
86
AUX2_P
87
VSSA_88
88
AUX1_P
89
AUX1_N
90
VSSA_91
91
IOUT1_N
92
IOUT1_P
93
VSSA_94
94
VSSA_95
95
VDDA33 _9 6
96
VSSA_97
97
VDDA33 _9 8
98
VSSA_99
99
VDDA33_100
100
CC 040 2CC0 40 2 CC 040 2
CC 040 2
CC0 40 2
C56
C57
C58
C55
1NF
1NF
.1UF
CC 040 2 CC 04 0 2CC 0 40 2
CC 040 2
7
9
Q
1NF
C30
4.7UF
.1UF
C13
C5
VOLT
ACA S E
CC 040 2
DVDD18
Q_
PRE
CLR
GND
14
10
JKCLK
U10
131211
74LCX112
.1UF
2
VOLT
ACA S E
DVDD33
C4
4.7UF
U1
9779TQ FP
P2D8
49
P2D9
48
P2D10
47
P2D11
46
P2D12
45
VSSD_44
44
VDD18_4 3
43
P2D13
42
P2D14
41
P2D15
40
TX
39
VDDD33_38
38
DCLK
37
P1D0
36
P1D1
35
P1D2
34
VDDD18_33
33
VSSD_32
32
P1D3
31
P1D4
30
P1D5
29
P1D6
28
P1D7
27
P1D8
26
P1D9
25
P1D10
24
VDDD18_23
23
VSSD_22
22
P1D11
21
P1D12
20
P1D13
19
P1D14
18
P1D15
17
VDDD33_16
16
VSSD_15
15
SYNC_1N
14
SYNC_1P
13
VSS_12
12
VSSC_11
11
VDDC18_10
10
VDDC18_9
9
VSSC_8
8
VSSC_7
7
CLK_N
6
CLK_P
5
VSSC_4
4
VSSC_3
3
VDDC18_2
2
VDDC18_1
1
CLK_N
S16
1
RC0805
R59
RC0805
22
R58
P2D15
6
5
JP7
P2D7
P2D8
P2D9
P2D10
P2D11
1
2
P2D12
P2D13
P2D14
P2D15
P1D0
P1D1
P1D2
P1D3
P1D4
P1D5
P1D6
P1D7
P1D8
DVDD33
P1D9
P1D10
P1D11
P1D12
P1D13
P1D14
P1D15
CLK_P
DVDD33
22
5
Q
PRE
4
JKCLK
321
6PINCONN
34
JP18
R18
100
RC 060 3
U11
GND
Y
4
RC0603
R32 25
1
S7
6
Q_
CLR
15
U10
74LCX112
C84
CC 060 3
.1UF
100
R26
RC 060 3
123
A
NC
SN74LVC1G34
VCC
5
DVDD33
ACA S E
ACA S E
VOLT
2
VOLT
C78
C7
4.7UF
4.7UF
4.7UF
VOLT
ACA S E
C6
C14
1NF
C31
.1UF
.1UF
CVDD18
1
1
2
2
S12
S15
06452-204
.1UF
C32
CC 040 2CC 040 2
1NF
C15
1234
6
T2B
ADTL1-12
PS
1
34
0
RC 060 3
R20
1
2
S8
IOUT_N
T2A
TC1-1T TC1-1T
6
DNP
RC 060 3
R19
1
2
S5
IOUT-IOUT_P
IP
JP1
R2
250
RC0603
RC 060 3
AUX1_P
IN
JP5
R4
250
500
RC0603
R3
RC 060 3
AUX1_N
QP
JP6
250
500
R14
RC0603
R12
RC 060 3
AUX2_P
QN
JP11
250
R16
500
R15
500
RC0603
RC0 60 3
R17
AUX2_N
Figure 106. Evaluation Board, Rev. A, Analog and Digital Interfaces to TxDAC
Rev. A | Page 53 of 60
Page 54

AD9776A/AD9778A/AD9779A
0
VDDM
10UF
10V
C44
ACA SE
GND
VDDM
VDDM
10UF
10V
C41
.1UF
C90
CC040 2
GND
ACA SE
6452-205
100PF
C51
CC040 2
L17
LC0805
.1UF
C52
CC040 2
100PF
C83
CC040 2
MOD_IN
MOD_IP
MOD_QN
MOD_ IP
RC0603
MOD_ IN
DNP
RC0603
MOD_QP
DNP
R23
R24
MOD_QP
MOD_QN
U9
17
18
9121
20
21
22
23
24
PAD
1
2
L18
VAL
VAL
LC0805
100PF
C87
CC040 2
FMOD
13
16
14
15
11
10
789
3
4
6
5
CC040 2CC040 2
CC040 2
C54
C53
100PF
C63
MODULATED
C72
CC040 2
100PF
CC040 2
100PF
J3
.1UF
GND
2
1
100PF
C73
34
T4
2
SP
1
ETC1-1-13
OUTPUT
GND
5
1
2
GND
J4
VDDM
R25
10K
57C47C
VAL
C82C81
CC060 3
VAL
C79
CC060 3
VAL
CC060 3
VAL
C64
CC060 3
RC0603
.1UF
C47
CC040 2CC040 2
C50
100PF
L8
L10
LC0805
VAL
CC060 3
D1P
L11
VAL
VAL
LC0805
VAL
C80
CC060 3
D1N
LC0805
VAL
CC060 3
D2N
L9
VAL
VAL
LC0805
VAL
C65
CC060 3
D2P
JP12
VDDM
GND
GND
ACA SE
C43
10V
10UF
Figure 107. Evaluation Board, Rev. A, ADL5372 (FMOD2) Quadrature Modulator
Rev. A | Page 54 of 60
Page 55

AD9776A/AD9778A/AD9779A
CLK_P
06452-206
CLK_N
CVDD18
C17
C16
DNP
CC0402
1K
R30
RC0402
RC0402RC0402
25
R28
CC0402CC0402
.1UF
C19
.1UF
CC0402
R31
300
RC0402
25
R29
.1UF
C23
3
1
2
SP
ETC1-1-13
T2
5
4
VAL
R13
RC0402
1
2
J1
Figure 108. Evaluation Board, Rev. A, Tx DAC Clock Interface
Rev. A | Page 55 of 60
Page 56

AD9776A/AD9778A/AD9779A
P2D11
P2D13
P2D3
P2D5
P2D1
P4
E1E2E3E4E5E6E7E8E9
P4
D1D2D3D4D5D6D7D8D9
P2D7
P2D9
P2D15
P1D13
P1D1
P1D3
P1D5
P1D7
P1D9
E10
E11
D10
D11
E15
E16
E17
E18
E19
E20
E21
D15
D16
D17
D18
D19
D20
D21
P1D15
P1D11
E22
E23
E24
E25
PKG_TYP E =M OL EX110
D22
D23
VAL VAL
D24
D25
PKG_TYP E =M OL EX110
06452-207
P2D0
P2D14
P2D12
P2D10
P1D0
P1D2
P1D8
P1D4
P1D6
P1D10
P1D12
P1D14
P2D8
P2D6
P2D4
P2D2
TP7
P4
C1C2C3C4C5C6C7C8C9
P4
B1B2B3B4B5B6B7B8B9
P4
A1A2A3A4A5A6A7A8A9
C10
C11
B10
B11
A10
A11
C15
C16
C17
C18
C19
C20
C21
C22
C23
C24
C25
PKG_TYPE=MOLEX110
B15
B16
B17
B18
B19
B20
B21
B22
B23
B24
B25
PKG_TYPE=MOLE X110
A15
A16
A17
A18
A19
A20
A21
A22
A23
A24
A25
PKG_TYPE=MOLE X110
GND
BLK BLK
VAL VAL VAL
Figure 109. Evaluation Board, Rev. A, Digital Input Data Lines
Rev. A | Page 56 of 60
Page 57

AD9776A/AD9778A/AD9779A
N
U2
CVDD18_IN
4
123
JP19
ADP3339-1-8
U3
DVDD18_I
JP20
4
ADP3339-1-8
3
2
1
U4
DVDD33_IN
4
123
AVDD33_IN
JP21
U7
JP22
4
ADP3339-3-3
3
2
1
ADP3339-3-3
06452-208
C85
1UF
1UF
C86
CC0603 CC0603
1
2
J2
P2
VAL
1
2
CNTERM_2P
C88
1UF
CC0603
C89
1UF
CC0603
C91
1UF
CC0603
C92
1UF
CC0603
C94
1UF
CC0603CC0603
C93
1UF
Figure 110. Evaluation Board, Rev. A, On-Board Power Supply
Rev. A | Page 57 of 60
Page 58

AD9776A/AD9778A/AD9779A
Figure 111. Evaluation Board, Rev A, Top Side Silk Screen
Rev. A | Page 58 of 60
06452-209
Page 59

AD9776A/AD9778A/AD9779A
06452-216
Figure 112. Evaluation Board, Rev. A, Bottom Side Silk Screen
Rev. A | Page 59 of 60
Page 60

AD9776A/AD9778A/AD9779A
2
C
OUTLINE DIMENSIONS
1.20
0.75
MAX
0.60
0.45
SEATING
PLANE
0.20
0.09
NOTES
1. CENTER FI GURES ARE TYPICAL UNL ESS OTHERWI SE NOTED.
. THE PACKAGE HAS A CONDUCTIVE HEAT SLUG TO HELP DISSIPATE HEAT AND ENSURE RELI ABLE OPER ATION OF
THE DEVICE OVER THE FULL INDUSTRIAL TEMPERATURE RANGE. THE SLUG IS EXPOSED ON THE BOTTOM OF
THE PACKAGE AND ELECTRICALLY CONNECTED TO CHIP GROUND. IT IS RECOMMENDED THAT NO PCB SIGNAL
TRACES OR VIAS BE LO
SLUG. ATTACHING THE SLUG TO A GROUND PLANE WILL REDUCE THE JUNCTI ON TEMPE RATURE OF THE
DEVICE WHICH MAY BE BENEFICIAL I N HIGH TEMP ERATURE ENVIRONMENTS.
7°
3.5°
0°
16.00 BSC SQ
1
PIN 1
25
26 50
0.50 BSC
COMPLIANT TO JEDEC STANDARDS MS-026-AED-HD
ATED UNDER THE PACKAGE THAT COULD COME IN CONTACT WITH THE CONDUCT IVE
14.00 BSC SQ
TOP VIEW
(PINS DOWN)
0.27
0.22
0.17
76100
0.15
0.05
75
51
76 100
75
BOTTOM VIE W
(PINS UP)
CONDUCTIVE
HEAT SINK
51
1.05
1.00
0.95
COPLANARITY
0.08
6.50
NOM
Figure 113. 100-Lead Thin Quad Flat Package, Exposed Pad [TQFP_EP]
(SV-100-1)
Dimensions shown in millimeters
1
25
2650
040506-A
ORDERING GUIDE
Model Temperature Range Package Description Package Option
AD9776ABSVZ
AD9776ABSVZRL
AD9778ABSVZ
AD9778ABSVZRL
AD9779ABSVZ
AD9779ABSVZRL
AD9776A-EBZ
AD9778A-EBZ
AD9779A-EBZ
1
Z = RoHS Compliant Part.
©2007–2008 Analog Devices, Inc. All rights reserved. Trademarks and
registered trademarks are the property of their respective owners.
D06452-0-3/08(A)
1
1
−40°C to +85°C 100-Lead Thin Quad Flat Package, Exposed Pad [TQFP_EP] SV-100-1
1
−40°C to +85°C 100-Lead Thin Quad Flat Package, Exposed Pad [TQFP_EP] SV-100-1
1
Evaluation Board
1
Evaluation Board
1
−40°C to +85°C 100-Lead Thin Quad Flat Package, Exposed Pad [TQFP_EP] SV-100-1
1
−40°C to +85°C 100-Lead Thin Quad Flat Package, Exposed Pad [TQFP_EP] SV-100-1
1
−40°C to +85°C 100-Lead Thin Quad Flat Package, Exposed Pad [TQFP_EP] SV-100-1
1
−40°C to +85°C 100-Lead Thin Quad Flat Package, Exposed Pad [TQFP_EP] SV-100-1
Evaluation Board
Rev. A | Page 60 of 60
 Loading...