

Page 1
Octal LNA/VGA/AAF/12-Bit ADC
A
A
FEATURES
8 channels of LNA, VGA, AAF, ADC, and I/Q demodulator
Low noise preamplifier (LNA)
Input-referred noise: 0.75 nV/√Hz typical at 5 MHz
(gain = 21.3 dB)
SPI-programmable gain: 15.6 dB/17.9 dB/21.3 dB
Single-ended input: V
550 mV p-p/367 mV p-p
Dual-mode active input impedance matching
Bandwidth (BW) > 100 MHz
Full-scale (FS) output: 4.4 V p-p differential
Variable gain amplifier (VGA)
Attenuator range: −42 dB to 0 dB
Postamp gain: 21 dB/24 dB/27 dB/30 dB
Linear-in-dB gain control
Antialiasing filter (AAF)
Programmable second-order LPF from 8 MHz to 18 MHz
Programmable HPF
Analog-to-digital converter (ADC)
12 bits at 10 MSPS to 80 MSPS
SNR: 70 dB
SFDR: 75 dB
Serial LVDS (ANSI-644, IEEE 1596.3 reduced range link)
Data and frame clock outputs
CW mode I/Q demodulator
Individual programmable phase rotation
Output dynamic range per channel >160 dBFS/√Hz
Low power: 195 mW per channel at 12 bits/40 MSPS (TGC),
94 mW per channel for CW Doppler
Flexible power-down modes
Overload recovery in <10 ns
Fast recovery from low power standby mode: <2 μs
100-lead TQFP_EP
maximum = 733 mV p-p/
IN
and CW I/Q Demodulator
AD9276
APPLICATIONS
Medical imaging/ultrasound
Automotive radar
PRODUCT HIGHLIGHTS
1. Small Footprint.
Eight channels are contained in a small, space-saving
package. Full TGC path, ADC, and I/Q demodulator
contained within a 100-lead, 16 mm × 16 mm TQFP.
2. Low Power.
In TGC mode, low power of 195 mW per channel
at 40 MSPS. In CW mode, ultralow power of 94 mW
per channel.
3. Integrated High Dynamic Range I/Q Demodulator with
Phase Rotation.
4. Ease of Use.
A data clock output (DCO±) operates up to 480 MHz
and supports double data rate (DDR) operation.
5. User Flexibility.
Serial port interface (SPI) control offers a wide range of
flexible features to meet specific system requirements.
6. Integrated Second-Order Antialiasing Filter.
This filter is placed before the ADC and is programmable
from 8 MHz to 18 MHz.
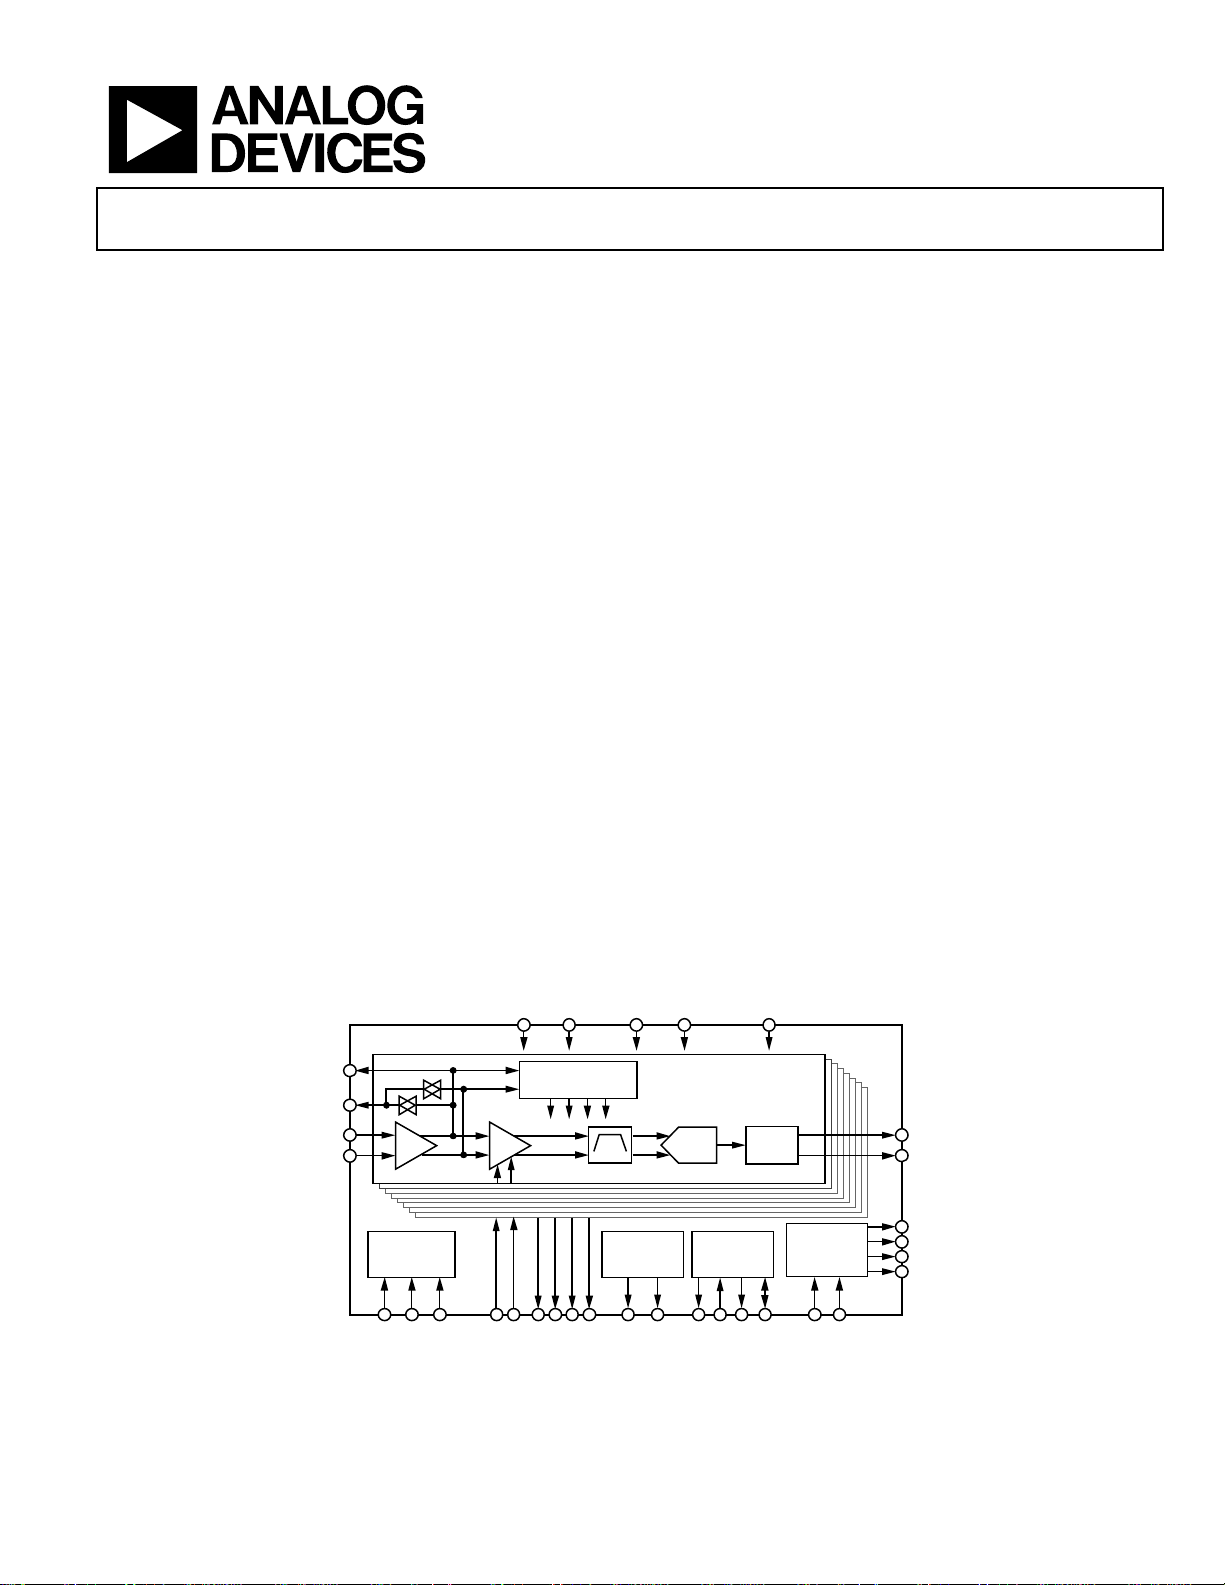
FUNCTIONAL BLOCK DIAGRAM
VDD2
VDD1
LO-A TO LO-H
LOSW-A TO LOSW-H
LI-A TO LI-H
LG-A TO LG-H
LO
GENERATIO N
4LO+
RESET
Rev. 0
Information furnished by Analog Devices is believed to be accurate and reliable. However, no
responsibility is assumed by Analog Devices for its use, nor for any infringements of patents or other
rights of third parties that may result from its use. Specifications subject to change without notice. No
license is granted by implication or otherwise under any patent or patent rights of Analog Devices.
Trademarks and registered trademarks are the property of their respective owners.
VGALNA
4LO–
GAIN+
I/Q
DEMODULATO R
CWI–
CWI+
CWQ–
GAIN–
AAF
REFERENCE
VREF
CWQ+
Figure 1.
STBYPDWN
12-BIT
ADC
RBIAS
One Technology Way, P.O. Box 9106, Norwood, MA 02062-9106, U.S.A.
Tel: 781.329.4700 www.analog.com
Fax: 781.461.3113 ©2009 Analog Devices, Inc. All rights reserved.
DRVDD
8 CHANNELS
SERIAL
LVDS
SERIAL
PORT
INTERFACE
CSB
SCLK
GPO[0:3]
MULTIPLIER
SDIO
DATA
RATE
CLK+
DOUTA+ TO DO UTH+
DOUTA– TO DOUT H–
FCO+
FCO–
DCO+
DCO–
CLK–
08180-001
Page 2

AD9276
TABLE OF CONTENTS
Features .............................................................................................. 1
Applications ....................................................................................... 1
Product Highlights ........................................................................... 1
Functional Block Diagram .............................................................. 1
Revision History ............................................................................... 2
General Description ......................................................................... 3
Specifications ..................................................................................... 4
AC Specifications .......................................................................... 4
Digital Specifications ................................................................... 7
Switching Specifications .............................................................. 8
ADC Timing Diagrams ............................................................... 9
Absolute Maximum Ratings .......................................................... 10
Thermal Impedance ................................................................... 10
ESD Caution ................................................................................ 10
Pin Configuration and Function Descriptions ........................... 11
Typical Performance Characteristics ........................................... 14
TGC Mode ................................................................................... 14
CW Doppler Mode ..................................................................... 17
Equivalent Circuits ......................................................................... 19
Theory of Operation ...................................................................... 21
Ultrasound .................................................................................. 21
Channel Overview ..................................................................... 22
Input Overdrive .......................................................................... 25
CW Doppler Operation ............................................................. 25
TGC Operation ........................................................................... 29
ADC ............................................................................................. 33
Clock Input Considerations ...................................................... 33
Digital Outputs and Timing ..................................................... 35
Serial Port Interface (SPI) .............................................................. 39
Hardware Interface ..................................................................... 40
Memory Map .................................................................................. 41
Reading the Memory Map Table .............................................. 41
Reserved Locations .................................................................... 41
Default Values ............................................................................. 41
Logic Levels ................................................................................. 41
Applications Information .............................................................. 45
Power and Ground Recommendations ................................... 45
Exposed Paddle Thermal Heat Slug Recommendations ...... 45
Outline Dimensions ....................................................................... 46
Ordering Guide .......................................................................... 46
REVISION HISTORY
7/09—Revision 0: Initial Version
Rev. 0 | Page 2 of 48
Page 3

AD9276
GENERAL DESCRIPTION
The AD9276 is designed for low cost, low power, small size,
and ease of use. It contains eight channels of a variable gain
amplifier (VGA) with a low noise preamplifier (LNA); an antialiasing filter (AAF); a 12-bit, 10 MSPS to 80 MSPS analog-todigital converter (ADC); and an I/Q demodulator with
programmable phase rotation.
Each channel features a variable gain range of 42 dB, a fully
differential signal path, an active input preamplifier termination,
a maximum gain of up to 52 dB, and an ADC with a conversion
rate of up to 80 MSPS. The channel is optimized for dynamic
performance and low power in applications where a small
package size is critical.
The LNA has a single-ended-to-differential gain that is selectable
through the SPI. The LNA input noise is typically 0.75 nV/√Hz
at a gain of 21.3 dB, and the combined input-referred noise of
the entire channel is 0.85 nV/√Hz at maximum gain. Assuming
a 15 MHz noise bandwidth (NBW) and a 21.3 dB LNA gain, the
input SNR is roughly 92 dB. In CW Doppler mode, each LNA
output drives an I/Q demodulator. Each demodulator has independently programmable phase rotation through the SPI with
16 phase settings.
The AD9276 requires a LVPECL-/CMOS-/LVDS-compatible
sample rate clock for full performance operation. No external
reference or driver components are required for many applications.
The ADC automatically multiplies the sample rate clock for
the appropriate LVDS serial data rate. A data clock (DCO±) for
capturing data on the output and a frame clock (FCO±) trigger
for signaling a new output byte are provided.
Powering down individual channels is supported to increase
battery life for portable applications. A standby mode option
allows quick power-up for power cycling. In CW Doppler operation, the VGA, AAF, and ADC are powered down. The power of
the TGC path scales with selectable ADC speed power modes.
The ADC contains several features designed to maximize flexibility
and minimize system cost, such as a programmable clock, data
alignment, and programmable digital test pattern generation. The
digital test patterns include built-in fixed patterns, built-in pseudorandom patterns, and custom user-defined test patterns entered
via the serial port interface.
Fabricated in an advanced CMOS process, the AD9276 is
available in a 16 mm × 16 mm, RoHS compliant, 100-lead
TQFP. It is specified over the industrial temperature range
of −40°C to +85°C.
Rev. 0 | Page 3 of 48
Page 4
AD9276
SPECIFICATIONS
AC SPECIFICATIONS
AVDD1 = 1.8 V, AVDD2 = 3.0 V, DRVDD = 1.8 V, 1.0 V internal ADC reference, fIN = 5 MHz, RS = 50 Ω, LNA gain = 21.3 dB, LNA bias = high,
PGA gain = 27 dB, GAIN− = 0.8 V, AAF LPF cutoff = f
Mode I = f
= 40 MSPS, Mode II = f
SAMPLE
= 65 MSPS, Mode III = f
SAMPLE
otherwise noted.
/3 (Mode I/Mode II), f
SAMPLE
SAMPLE
/4.5 (Mode III), HPF cutoff = LPF cutoff/20.7 (default),
SAMPLE
= 80 MSPS, full temperature, ANSI-644 LVDS mode, unless
Table 1.
1
Parameter
Test Conditions/Comments Min Typ Max Unit
LNA CHARACTERISTICS
Gain Single-ended input to differential output 15.6/17.9/21.3 dB
Single-ended input to single-ended output 9.6/11.9/15.3 dB
Input Voltage Range
(Single-Ended)
LNA output limited to 4.4 V p-p differential
output
LNA gain = 15.6 dB 733 mV p-p
LNA gain = 17.9 dB 550 mV p-p
LNA gain = 21.3 dB 367 mV p-p
Input Common Mode (LI-x, LG-x) 1.0 V
Output Common Mode (LO-x) 1.5 V
Output Common Mode (LOSW-x) Switch off High-Z Ω
Switch on 1.5 V
Input Resistance (LI-x) RFB = 250 Ω 50 Ω
R
R
= 500 Ω 100 Ω
FB
= ∞ 15 kΩ
FB
Input Capacitance (LI-x) 22 pF
−3 dB Bandwidth 100 MHz
Input Noise Voltage RS = 0 Ω, RFB = ∞
LNA gain = 15.6 dB 0.98 nV/√Hz
LNA gain = 17.9 dB 0.86 nV/√Hz
LNA gain = 21.3 dB 0.75 nV/√Hz
Input Noise Current RFB = ∞ 1 pA/√Hz
1 dB Input Compression Point GAIN+ = 0 V
LNA gain = 15.6 dB 1.0 V p-p
LNA gain = 17.9 dB 0.8 V p-p
LNA gain = 21.3 dB 0.5 V p-p
Noise Figure RS = 50 Ω
Active Termination Matched LNA gain = 15.6 dB, RFB = 200 Ω 4.8 dB
LNA gain = 17.9 dB, RFB = 250 Ω 4.1 dB
LNA gain = 21.3 dB, RFB = 350 Ω 3.2 dB
Unterminated LNA gain = 15.6 dB, RFB = ∞ 3.4 dB
LNA gain = 17.9 dB, RFB = ∞ 2.8 dB
LNA gain = 21.3 dB, RFB = ∞ 2.3 dB
FULL-CHANNEL (TGC)
CHARACTERISTICS
AAF Low-Pass Cutoff
In Range −3 dB, programmable 8 18 MHz
In Range AAF Bandwidth
±10 %
Tol er an ce
Group Delay Variation f = 1 MHz to 18 MHz, GAIN+ = 0 V to 1.6 V ±0.5 ns
Input-Referred Noise Voltage GAIN+ = 1.6 V, RFB = ∞
LNA gain = 15.6 dB 1.26 nV/√Hz
LNA gain = 17.9 dB 1.04 nV/√Hz
LNA gain = 21.3 dB 0.85 nV/√Hz
Rev. 0 | Page 4 of 48
Page 5

AD9276
Parameter
1
Test Conditions/Comments Min Typ Max Unit
Noise Figure GAIN+ = 1.6 V, RS = 50 Ω
Active Termination Matched
LNA gain = 15.6 dB, R
= 200 Ω 8.0/7.7/7.6 dB
FB
Mode I/Mode II/Mode III
LNA gain = 17.9 dB, RFB = 250 Ω 6.6/6.2/6.1 dB
LNA gain = 21.3 dB, RFB = 350 Ω 4.7/4.5/4.4 dB
Unterminated LNA gain = 15.6 dB, RFB = ∞ 4.7 dB
LNA gain = 17.9 dB, RFB = ∞ 3.7 dB
LNA gain = 21.3 dB, RFB = ∞ 2.8 dB
Correlated Noise Ratio No signal, correlated/uncorrelated −30 dB
Output Offset −35 +35 LSB
f
Signal-to-Noise Ratio (SNR)
= 5 MHz at −10 dBFS, GAIN+ = 0 V 65/64/63 dBFS
IN
Mode I/Mode II/Mode III
f
Harmonic Distortion
= 5 MHz at −1 dBFS, GAIN+ = 1.6 V 57/56/54.5 dBFS
IN
Mode I/Mode II/Mode III
Second Harmonic fIN = 5 MHz at −10 dBFS, GAIN+ = 0 V −62/−58/−55 dBc
f
= 5 MHz at −1 dBFS, GAIN+ = 1.6 V −60/−61/−58 dBc
IN
Third Harmonic fIN = 5 MHz at −10 dBFS, GAIN+ = 0 V −71/−60/−60 dBc
f
Two-Tone Intermodulation (IMD3)
= 5 MHz at −1 dBFS, GAIN+ = 1.6 V −57/−55/−56 dBc
IN
= 5.015 MHz, f
f
RF1
A
RF1
= 0 dB, A
= −20 dB, GAIN+ = 1.6 V,
RF2
IMD3 relative to A
= 5.020 MHz,
RF2
RF2
−55 dBc
Channel-to-Channel Crosstalk fIN = 5 MHz at −1 dBFS −70 dB
Overrange condition
Channel-to-Channel Delay
Full TGC p ath, f
2
−65 dB
= 5 MHz, GAIN+ = 0 V to 1.6 V 0.3 Degrees
IN
Variation
PGA Gain Differential input to differential output 21/24/27/30 dB
GAIN ACCURACY 25°C
Gain Law Conformance Error
0 < GAIN+ < 0.16 V 1.5 dB
Mode I/Mode II/Mode III
0.16 V < GAIN+ < 1.44 V
1.44 V < GAIN+ < 1.6 V
−1.5/−1.5/
−1.6
−1.5/−1.5/
−1.6
−2.5
+1.5/+1.5/
+1.6
+1.5/+1.5/
+1.6
dB
dB
Linear Gain Error GAIN+ = 0.8 V, normalized for ideal AAF loss −1.5 +1.5 dB
Channel-to-Channel Matching 0.16 V < GAIN+ < 1.44 V 0.1 dB
GAIN CONTROL INTERFACE
Normal Operating Range 0 1.6 V
Gain Range GAIN+ = 0 V to 1.6 V −42 0 dB
Scale Factor 28.5 dB/V
Response Time 42 dB change 750 ns
GAIN+ Impedance Single-ended 10 MΩ
GAIN− Impedance Single-ended 70 kΩ
CW DOPPLER MODE
LO Frequency fLO = f
/4 1 10 MHz
4LO
Phase Increment Per channel 22.5 Degrees
Output DC Bias (Single-Ended) CWI+, CWI−, CWQ+, CWQ− 1.5 V
Maximum Output Swing
Per CWI+, CWI−, CWQ+, CWQ−, per channel
±1.25 mA
enabled
Transconductance (Differential) Demodulated I
, each I or Q output
OUT/VIN
LNA gain = 15.6 dB 1.8 mA/V
LNA gain = 17.9 dB 2.4 mA/V
LNA gain = 21.3 dB 3.5 mA/V
Rev. 0 | Page 5 of 48
Page 6
AD9276
Parameter
1
Test Conditions/Comments Min Typ Max Unit
Input-Referred Noise Voltage RS = 0 Ω, RFB = ∞
LNA gain = 15.6 dB 1.5 nV/√Hz
LNA gain = 17.9 dB 1.4 nV/√Hz
LNA gain = 21.3 dB 1.3 nV/√Hz
Noise Figure RS = 50 Ω, RFB = ∞
LNA gain = 15.6 dB 5.7 dB
LNA gain = 17.9 dB 5.3 dB
LNA gain = 21.3 dB 4.8 dB
Input-Referred Dynamic Range RS = 0 Ω, RFB = ∞
LNA gain = 15.6 dB 164 dBFS/√Hz
LNA gain = 17.9 dB 162 dBFS/√Hz
LNA gain = 21.3 dB 160 dBFS/√Hz
Output-Referred SNR
−3 dBFS input, f
= 2.5 MHz, f
RF
= 10 MHz,
4LO
155 dBc/√Hz
1 kHz offset
Two-Tone Intermodulation (IMD3)
= 5.015 MHz, f
f
RF1
f
= 20 MHz, A
4LO
RF1
IMD3 relative to A
= 5.020 MHz,
RF2
= 0 dB, A
RF2
RF2
= −20 dB,
−58 dB
Quadrature Phase Error I to Q, all phases, 1 σ 0.15 Degrees
I/Q Amplitude Imbalance I to Q, all phases, 1 σ 0.015 dB
Channel-to-Channel Matching Phase I to I, Q to Q, 1 σ 0.5 Degrees
Amplitude I to I, Q to Q, 1 σ 0.25 dB
POWER SUPPLY
Mode I/Mode II/Mode III
AVDD1 1.7 1.8 1.9 V
AVDD2 2.7 3.0 3.6 V
DRVDD 1.7 1.8 1.9 V
I
TGC mode 190/263/317 mA
AVDD1
CW Doppler mode 15 mA
I
TGC mode, no signal 365 mA
AVDD2
CW Doppler mode per channel enabled,
30 mA
no signal
I
49/51/52 mA
DRVDD
Total Power Dissipation
(Including Output Drivers)
TGC mode, no signal
CW Doppler mode with eight channels
1560/1690/
1780
1800/1940/
2050
750 mW
mW
enabled, no signal
Power-Down Dissipation 5 mW
Standby Power Dissipation 175/200/210 mW
Power Supply Rejection Ratio
1.6 mV/V
(PSRR)
ADC RESOLUTION 12 Bits
ADC REFERENCE
Output Voltage Error VREF = 1 V ±20 mV
Load Regulation at 1.0 mA VREF = 1 V 2 mV
Input Resistance 6 kΩ
1
See the AN-835 Application Note, Understanding High Speed ADC Testing and Evaluation, for a complete set of definitions and information about how these tests were
completed.
2
The overrange condition is specified as being 6 dB more than the full-scale input range.
Rev. 0 | Page 6 of 48
Page 7

AD9276
DIGITAL SPECIFICATIONS
AVDD1 = 1.8 V, AVDD2 = 3.0 V, DRVDD = 1.8 V, 1.0 V internal ADC reference, fIN = 5 MHz, full temperature, unless otherwise noted.
Table 2.
1
Parameter
Temperature Min Typ Max Unit
CLOCK INPUTS (CLK+, CLK−)
Logic Compliance CMOS/LVDS/LVPECL
Differential Input Voltage
2
Full 250 mV p-p
Input Common-Mode Voltage Full 1.2 V
Input Resistance (Differential) 25°C 20 kΩ
Input Capacitance 25°C 1.5 pF
CW 4LO INPUTS (4LO+, 4LO−)
Logic Compliance CMOS/LVDS/LVPECL
2
Differential Input Voltage
Full 250 mV p-p
Input Common-Mode Voltage Full 1.2 V
Input Resistance (Differential) 25°C 20 kΩ
Input Capacitance 25°C 1.5 pF
LOGIC INPUTS (PDWN, STBY, SCLK, RESET)
Logic 1 Voltage Full 1.2 3.6 V
Logic 0 Voltage Full 0.3 V
Input Resistance 25°C 30 kΩ
Input Capacitance 25°C 0.5 pF
LOGIC INPUT (CSB)
Logic 1 Voltage Full 1.2 3.6 V
Logic 0 Voltage Full 0.3 V
Input Resistance 25°C 70 kΩ
Input Capacitance 25°C 0.5 pF
LOGIC INPUT (SDIO)
Logic 1 Voltage Full 1.2 DRVDD + 0.3 V
Logic 0 Voltage Full 0 0.3 V
Input Resistance 25°C 30 kΩ
Input Capacitance 25°C 2 pF
LOGIC OUTPUT (SDIO)
3
Logic 1 Voltage (IOH = 800 A) Full 1.79 V
Logic 0 Voltage (IOL = 50 A) Full 0.05 V
DIGITAL OUTPUTS (DOUTx+, DOUTx−), (ANSI-644)
1
Logic Compliance LVDS
Differential Output Voltage (VOD) Full 247 454 mV
Output Offset Voltage (VOS) Full 1.125 1.375 V
Output Coding (Default) Offset binary
DIGITAL OUTPUTS (DOUTx+, DOUTx−),
(LOW POWER, REDUCED SIGNAL OPTION)
1
Logic Compliance LVDS
Differential Output Voltage (VOD) Full 150 250 mV
Output Offset Voltage (VOS) Full 1.10 1.30 V
Output Coding (Default) Offset binary
LOGIC OUTPUTS (GPO0, GPO1, GPO2, GPO3)
Logic 0 Voltage (IOL = 50 A) Full 0.05 V
1
See the AN-835 Application Note, Understanding High Speed ADC Testing and Evaluation, for a complete set of definitions and information about how these tests were
completed.
2
Specified for LVDS and LVPECL only.
3
Specified for 13 SDIO pins sharing the same connection.
Rev. 0 | Page 7 of 48
Page 8

AD9276
SWITCHING SPECIFICATIONS
AVDD1 = 1.8 V, AVDD2 = 3.0 V, DRVDD = 1.8 V, 1.0 V internal ADC reference, fIN = 5 MHz, full temperature, unless otherwise noted.
Table 3.
1
Parameter
CLOCK
2
Temperature Min Typ Max Unit
Clock Rate
40 MSPS (Mode I) Full 10 40 MHz
65 MSPS (Mode II) Full 10 65 MHz
80 MSPS (Mode III) Full 10 80 MHz
Clock Pulse Width High (tEH) Full 6.25 ns
Clock Pulse Width Low (tEL) Full 6.25 ns
OUTPUT PARAMETERS
Propagation Delay (tPD) Full (t
2, 3
/2) + 1.5 (t
SAMPLE
/2) + 2.3 (t
SAMPLE
/2) + 3.1 ns
SAMPLE
Rise Time (tR) (20% to 80%) Full 300 ps
Fall Time (tF) (20% to 80%) Full 300 ps
FCO Propagation Delay (t
DCO Propagation Delay (t
DCO to Data Delay (t
DCO to FCO Delay (t
Data-to-Data Skew (t
) Full (t
FCO
4
)
Full t
CPD
4
)
Full (t
DATA
4
)
Full (t
FRAME
DATA-MAX
− t
) Full ±100 ±350 ps
DATA-MIN
/2) + 1.5 (t
SAMPLE
/24) − 300 (t
SAMPLE
/24) − 300 (t
SAMPLE
/2) + 2.3 (t
SAMPLE
+ (t
FCO
SAMPLE
/24) (t
SAMPLE
/24) (t
SAMPLE
/2) + 3.1 ns
SAMPLE
/24) ns
/24) + 300 ps
SAMPLE
/24) + 300 ps
SAMPLE
Wake-Up Time (Standby), GAIN+ = 0.5 V 25°C 2 µs
Wake-Up Time (Power-Down) 25°C 1 ms
Pipeline Latency Full 8
Clock
cycles
APERTURE
Aperture Uncertainty (Jitter) 25°C <1 ps rms
LO GENERATION
4LO Frequency Full 4 40 MHz
LO Divider RESET Setup Time
LO Divider RESET Hold Time
5
5
Full 5 ns
Full 5 ns
LO Divider RESET High Pulse Width Full 20 ns
1
See the AN-835 Application Note, Understanding High Speed ADC Testing and Evaluation, for a complete set of definitions and information about how these tests were
completed.
2
Can be adjusted via the SPI.
3
Measurements were made using a part soldered to FR-4 material.
4
t
/24 is based on the number of bits divided by 2 because the delays are based on half duty cycles.
SAMPLE
5
RESET edge to rising 4LO edge.
Rev. 0 | Page 8 of 48
Page 9
AD9276
ADC TIMING DIAGRAMS
N – 1
AIN
N
CLK–
CLK+
DCO–
DCO+
FCO–
FCO+
DOUTx–
DOUTx+
AIN
N – 1
t
EH
t
CPD
t
FCO
t
PD
t
FRAME
MSB
D10
N – 8
N – 8D9N – 8D8N – 8D7N – 8D6N – 8D5N – 8D4N – 8D3N – 8D2N – 8D1N – 8D0N – 8
t
EL
t
DATA
D10
MSB
N – 7
N – 7
08180-002
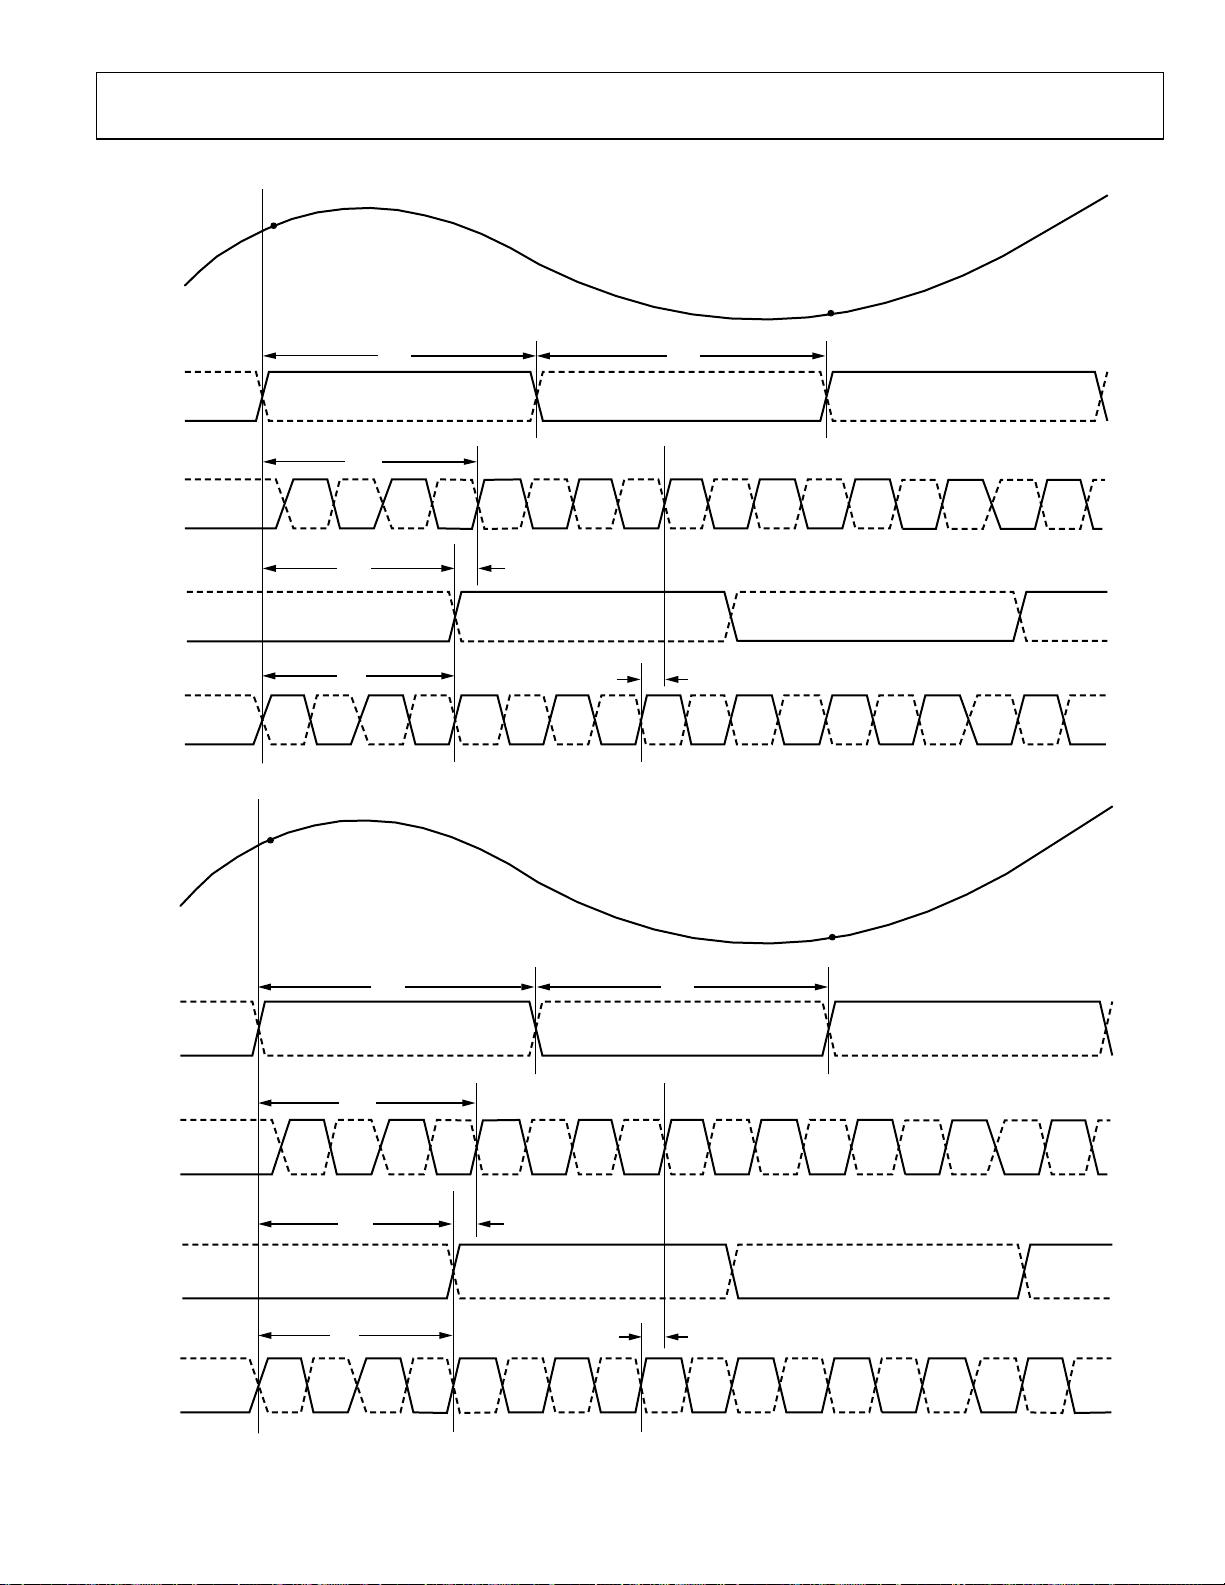
Figure 2. 12-Bit Data Serial Stream (Default)
N
CLK–
CLK+
DCO–
DCO+
FCO–
FCO+
DOUTx–
DOUTx+
t
EH
t
CPD
t
FCO
t
PD
t
FRAME
LSB
N – 8D0N – 8D1N – 8D2N – 8D3N – 8D4N – 8D5N – 8D6N – 8D7N – 8D8N – 8D9N – 8
t
EL
t
DATA
D10
N – 8
LSB
N – 7
D0
N – 7
08180-003
Figure 3. 12-Bit Data Serial Stream, LSB First
Rev. 0 | Page 9 of 48
Page 10
AD9276
ABSOLUTE MAXIMUM RATINGS
Table 4.
Parameter Rating
AVDD1 to GND −0.3 V to +2.0 V
AVDD2 to GND −0.3 V to +3.9 V
DRVDD to GND −0.3 V to +2.0 V
GND to GND −0.3 V to +0.3 V
AVDD2 to AVDD1 −2.0 V to +3.9 V
AVDD1 to DRVDD −2.0 V to +2.0 V
AVDD2 to DRVDD −2.0 V to +3.9 V
Digital Outputs (DOUTx+, DOUTx−,
DCO+, DCO−, FCO+, FCO−) to GND
CLK+, CLK−, SDIO to GND −0.3 V to +2.0 V
LI-x, LO-x, LOSW-x to GND −0.3 V to +3.9 V
CWI−, CWI+, CWQ−, CWQ+ to GND −0.3 V to +3.9 V
PDWN, STBY, SCLK, CSB to GND −0.3 V to +2.0 V
GAIN+, GAIN−, RESET, 4LO+, 4LO−,
GPO0, GPO1, GPO2, GPO3 to GND
RBIAS, VREF to GND −0.3 V to +2.0 V
Operating Temperature Range (Ambient) −40°C to +85°C
Storage Temperature Range (Ambient) −65°C to +150°C
Maximum Junction Temperature 150°C
Lead Temperature (Soldering, 10 sec) 300°C
−0.3 V to +2.0 V
−0.3 V to +3.9 V
Stresses above those listed under Absolute Maximum Ratings
may cause permanent damage to the device. This is a stress
rating only; functional operation of the device at these or any
other conditions above those indicated in the operational
section of this specification is not implied. Exposure to absolute
maximum rating conditions for extended periods may affect
device reliability.
THERMAL IMPEDANCE
Table 5.
Airflow Velocity (m/s) θ
0.0 20.3 °C/W
1.0 14.4 7.6 4.7 °C/W
2.5 12.9 °C/W
1
θ
for a 4-layer PCB with solid ground plane (simulated). Exposed pad
JA
soldered to PCB.
1
θJB θJC Unit
JA
ESD CAUTION
Rev. 0 | Page 10 of 48
Page 11
AD9276
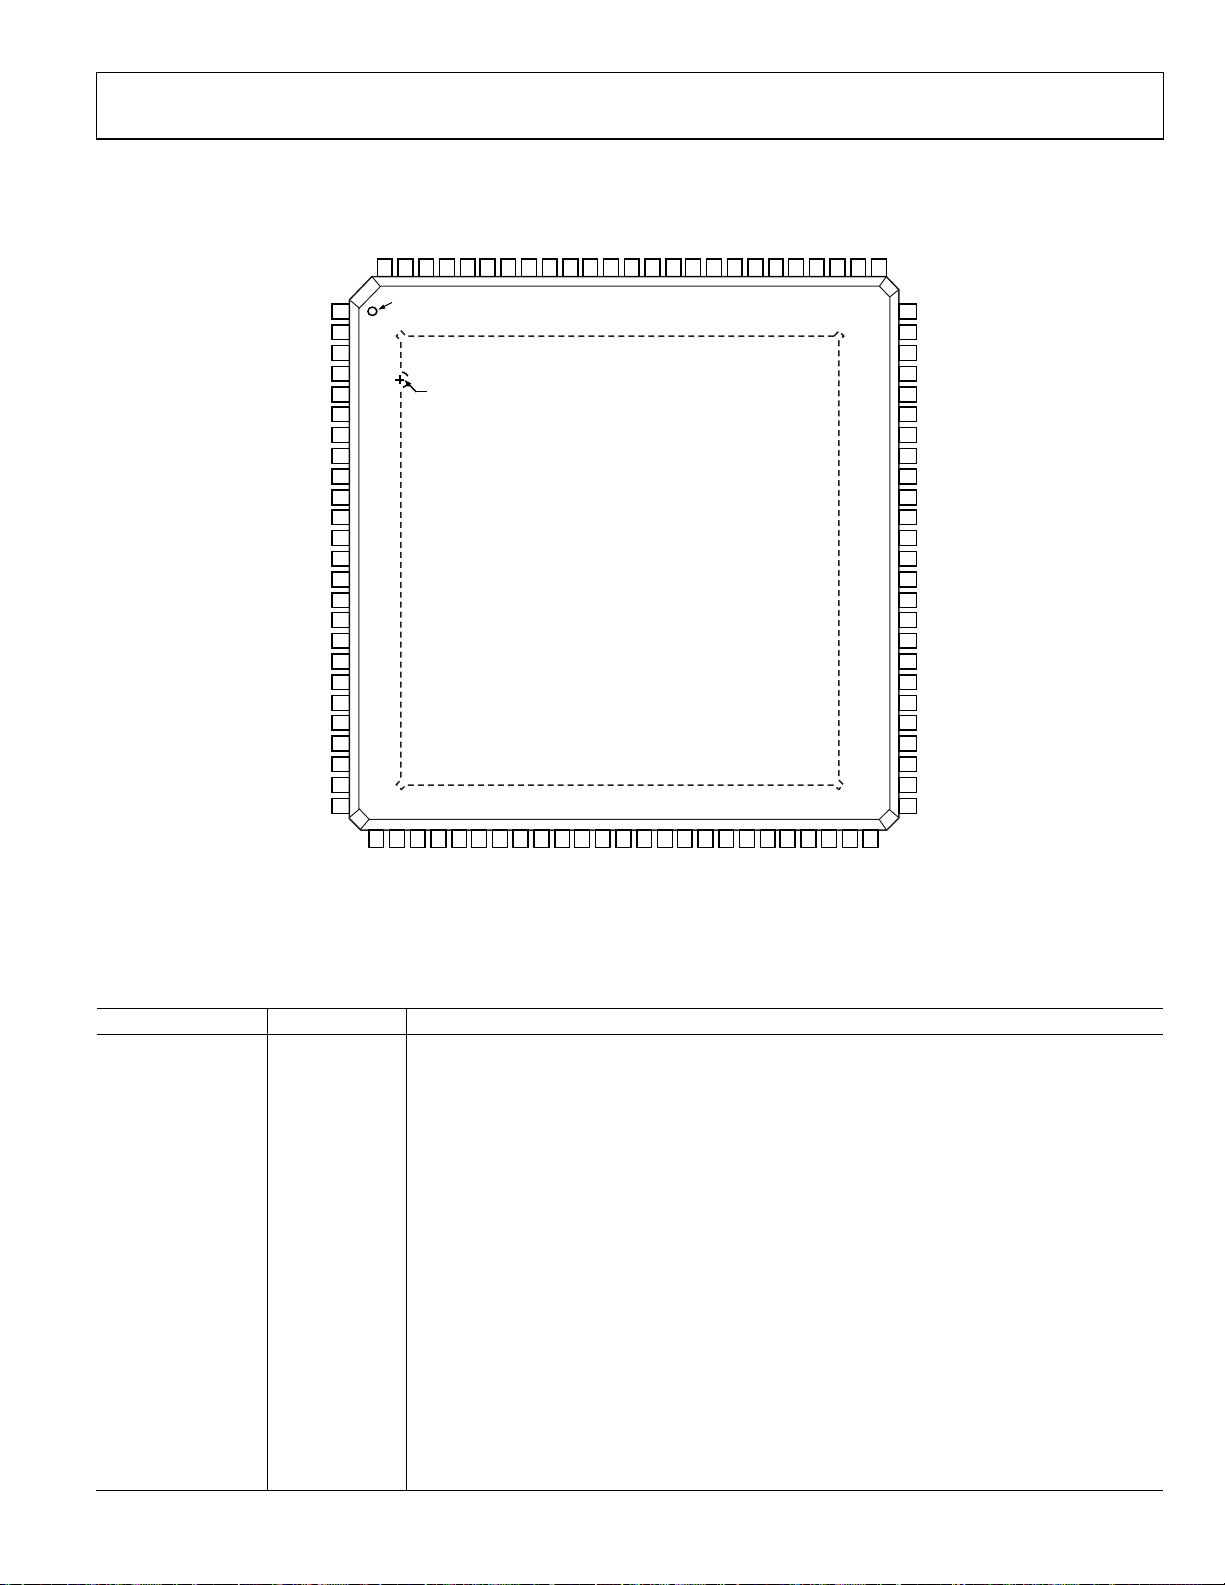
PIN CONFIGURATION AND FUNCTION DESCRIPTIONS
LOSW-DLO-D
GPO0
GPO1
GPO2
GPO3
RESET
4LO–
4LO+
AVDD2
AVDD2
GAIN–
GAIN+
VREF
RBIAS
AVDD2
AD9276
TOP VIEW
(Not to Scale)
76
LI-D
75
LG-D
74
AVDD2
73
AVDD1
72
LO-C
71
LOSW-C
70
LI-C
69
LG-C
68
AVDD2
67
AVDD1
66
LO-B
65
64
LOSW-B
63
LI-B
LG-B
62
AVDD2
61
AVDD1
60
59
LO-A
58
LOSW-A
57
LI-A
LG-A
56
AVDD2
55
54
AVDD1
53
CSB
52
SDIO
51
SCLK
LI-E
LG-E
AVDD2
AVDD1
LO-F
LOSW-F
LI-F
LG-F
AVDD2
AVDD1
LO-G
LOSW-G
LI-G
LG-G
AVDD2
AVDD1
LO-H
LOSW-H
LI-H
LG-H
AVDD2
AVDD1
CLK–
CLK+
AVDD1
CWI+
CWQ–
CWQ+
GND
GND
GND
LO-E
LOSW-E
9998979695949392919089888786858483828180797877
100
PIN 1
1
INDICATOR
2
3
4
5
6
7
8
9
10
11
12
13
14
15
16
17
18
19
20
21
22
23
24
25
EXPOSED PADDLE, PIN 0
(BOTTOM OF PACKAGE)
CWI–
2627282930313233343536373839404142434445464748
FCO–
DRVDD
DOUTH–
DOUTH+
DOUTG –
NOTES
1. THE EXPOSED PAD SHOULD BE TIED TO A QUIET ANALOG GROUND.
DOUTF+
DOUTG+
DOUTF–
DCO–
DOUTE–
DOUTE+
FCO+
DCO+
DOUTD–
DOUTD+
DOUTC–
DOUTC+
DOUTA+
DOUTB+
DRVDD
DOUTA–
DOUTB–
50
49
STBY
PDWN
AVDD1
Figure 4. Pin Configuration
Table 6. Pin Function Descriptions
Pin No. Name Description
0, 96, 97, 98 GND Ground. Exposed paddle should be tied to a quiet analog ground.
1 LI-E LNA Analog Input for Channel E.
2 LG-E LNA Ground for Channel E.
3, 9, 15, 21, 55, 61,
AVDD2 3.0 V Analog Supply.
67, 73, 85, 86, 91
4, 10, 16, 22, 25, 50,
AVDD1 1.8 V Analog Supply.
54, 60, 66, 72
5 LO-F LNA Analog Inverted Output for Channel F.
6 LOSW-F LNA Analog Switched Output for Channel F.
7 LI-F LNA Analog Input for Channel F.
8 LG-F LNA Ground for Channel F.
11 LO-G LNA Analog Inverted Output for Channel G.
12 LOSW-G LNA Analog Switched Output for Channel G.
13 LI-G LNA Analog Input for Channel G.
14 LG-G LNA Ground for Channel G.
17 LO-H LNA Analog Inverted Output for Channel H.
18 LOSW-H LNA Analog Switched Output for Channel H.
19 LI-H LNA Analog Input for Channel H.
20 LG-H LNA Ground for Channel H.
Rev. 0 | Page 11 of 48
08180-004
Page 12
AD9276
Pin No. Name Description
23 CLK− Clock Input Complement.
24 CLK+ Clock Input True.
26, 47 DRVDD 1.8 V Digital Output Driver Supply.
27 DOUTH− ADC H Digital Output Complement.
28 DOUTH+ ADC H Digital Output True.
29 DOUTG− ADC G Digital Output Complement.
30 DOUTG+ ADC G Digital Output True.
31 DOUTF− ADC F Digital Output Complement.
32 DOUTF+ ADC F Digital Output True.
33 DOUTE− ADC E Digital Output Complement.
34 DOUTE+ ADC E Digital Output True.
35 DCO− Digital Clock Output Complement.
36 DCO+ Digital Clock Output True.
37 FCO− Digital Frame Clock Output Complement.
38 FCO+ Digital Frame Clock Output True.
39 DOUTD− ADC D Digital Output Complement.
40 DOUTD+ ADC D Digital Output True.
41 DOUTC− ADC C Digital Output Complement.
42 DOUTC+ ADC C Digital Output True.
43 DOUTB− ADC B Digital Output Complement.
44 DOUTB+ ADC B Digital Output True.
45 DOUTA− ADC A Digital Output Complement.
46 DOUTA+ ADC A Digital Output True.
48 STBY Standby Power-Down.
49 PDWN Full Power-Down.
51 SCLK Serial Clock.
52 SDIO Serial Data Input/Output.
53 CSB Chip Select Bar.
56 LG-A LNA Ground for Channel A.
57 LI-A LNA Analog Input for Channel A.
58 LOSW-A LNA Analog Switched Output for Channel A.
59 LO-A LNA Analog Inverted Output for Channel A.
62 LG-B LNA Ground for Channel B.
63 LI-B LNA Analog Input for Channel B.
64 LOSW-B LNA Analog Switched Output for Channel B.
65 LO-B LNA Analog Inverted Output for Channel B.
68 LG-C LNA Ground for Channel C.
69 LI-C LNA Analog Input for Channel C.
70 LOSW-C LNA Analog Switched Output for Channel C.
71 LO-C LNA Analog Inverted Output for Channel C.
74 LG-D LNA Ground for Channel D.
75 LI-D LNA Analog Input for Channel D.
76 LOSW-D LNA Analog Switched Output for Channel D.
77 LO-D LNA Analog Inverted Output for Channel D.
78 GPO0 General-Purpose Open-Drain Output 0.
79 GPO1 General-Purpose Open-Drain Output 1.
80 GPO2 General-Purpose Open-Drain Output 2.
81 GPO3 General-Purpose Open-Drain Output 3.
82 RESET Reset for Synchronizing 4LO Divide-by-4 Counter.
83 4LO− CW Doppler 4LO Input Complement.
84 4LO+ CW Doppler 4LO Input True.
87 GAIN− Gain Control Voltage Input Complement.
88 GAIN+ Gain Control Voltage Input True.
Rev. 0 | Page 12 of 48
Page 13

AD9276
Pin No. Name Description
89 RBIAS External Resistor to Set the Internal ADC Core Bias Current.
90 VREF Voltage Reference Input/Output.
92 CWI− CW Doppler I Output Complement.
93 CWI+ CW Doppler I Output True.
94 CWQ− CW Doppler Q Output Complement.
95 CWQ+ CW Doppler Q Output True.
99 LO-E LNA Analog Inverted Output for Channel E.
100 LOSW-E LNA Analog Switched Output for Channel E.
Rev. 0 | Page 13 of 48
Page 14
AD9276
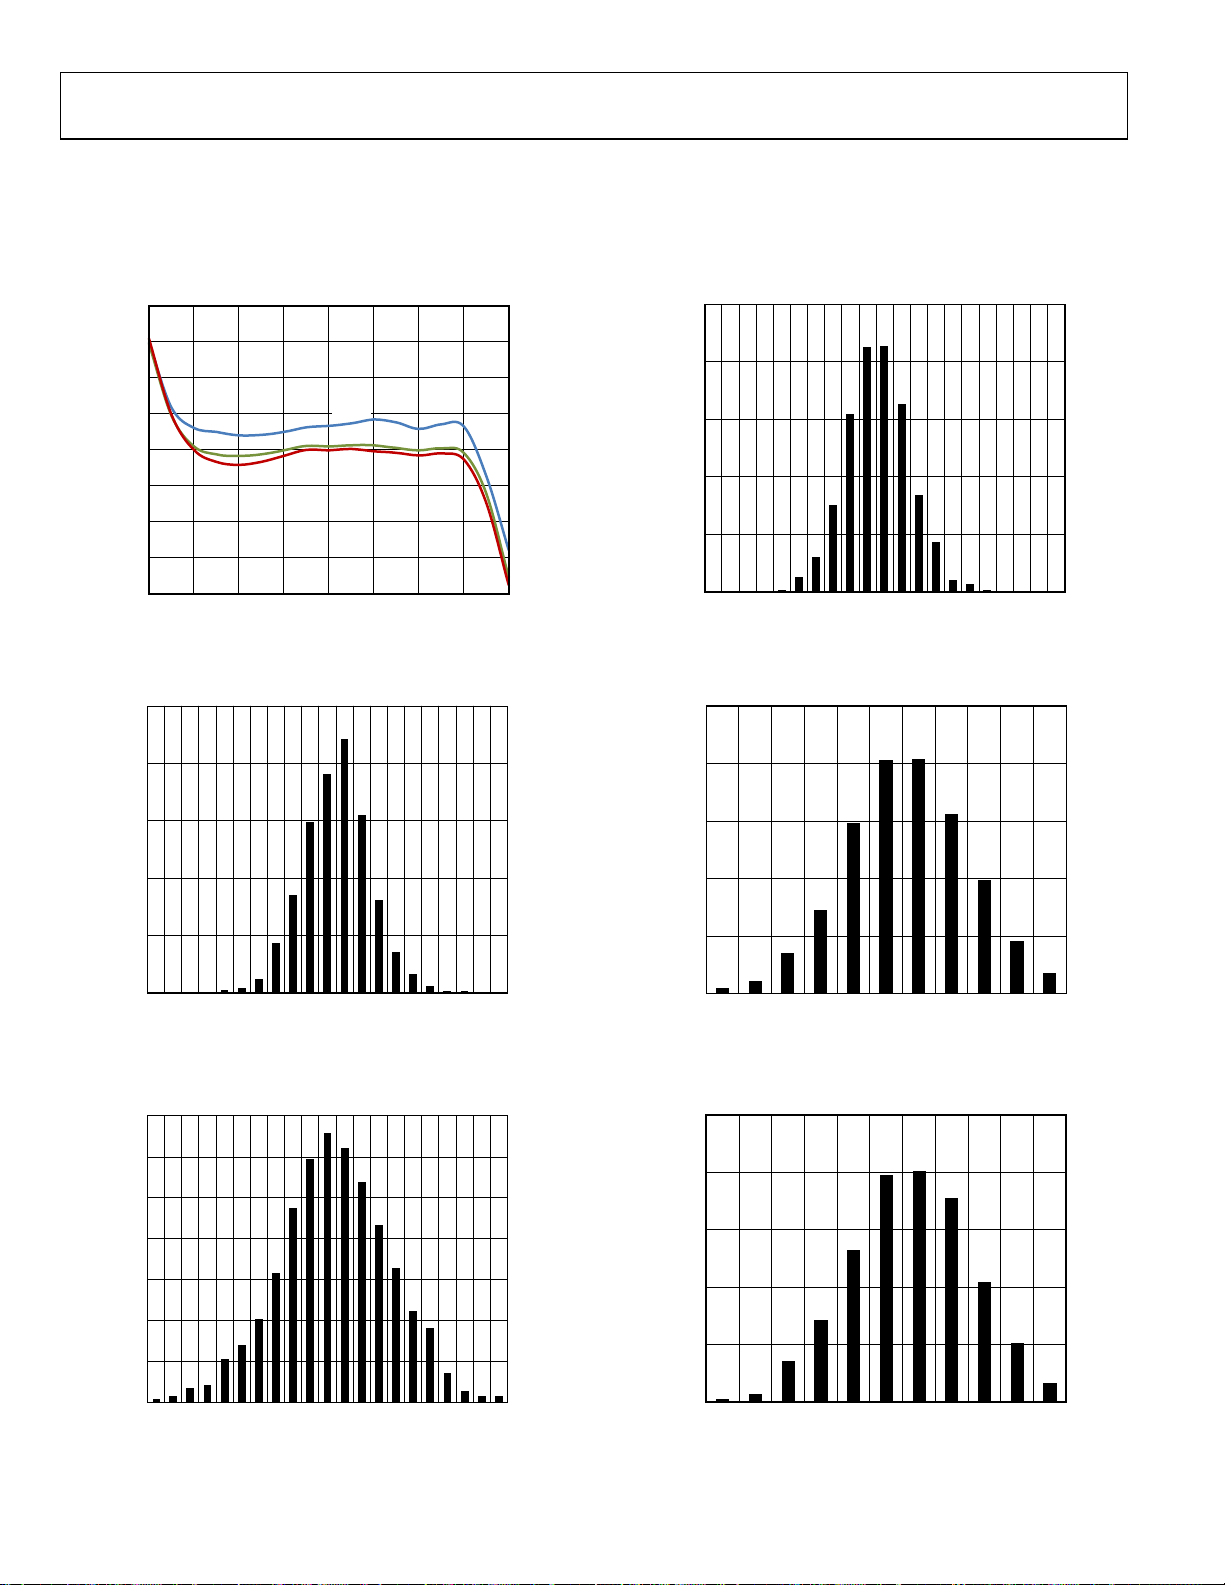
TYPICAL PERFORMANCE CHARACTERISTICS
TGC MODE
f
= 40 MSPS, fIN = 5 MHz, RS = 50 Ω, LNA gain = 21.3 dB, LNA bias = high, PGA gain = 27 dB, AAF LPF cutoff = f
SAMPLE
HPF cutoff = LPF cutoff/20.7 (default).
2.0
1.5
1.0
0.5
0
–0.5
GAIN ERROR (dB)
–1.0
–1.5
–2.0
0 0.2 0.4 0. 6 0. 8 1.0
–40°C
+25°C
+85°C
GAIN+ (V)
Figure 5. Gain Error vs. GAIN+ at Three Temperatures
1.2 1.4 1.6
08180-005
25
20
15
10
PERCENTAGE OF UNITS (%)
5
0
–1.0
–0.9
–0.8
–0.7
–0.6
–0.5
–0.4
–0.3
–0.2
GAIN ERROR (dB)
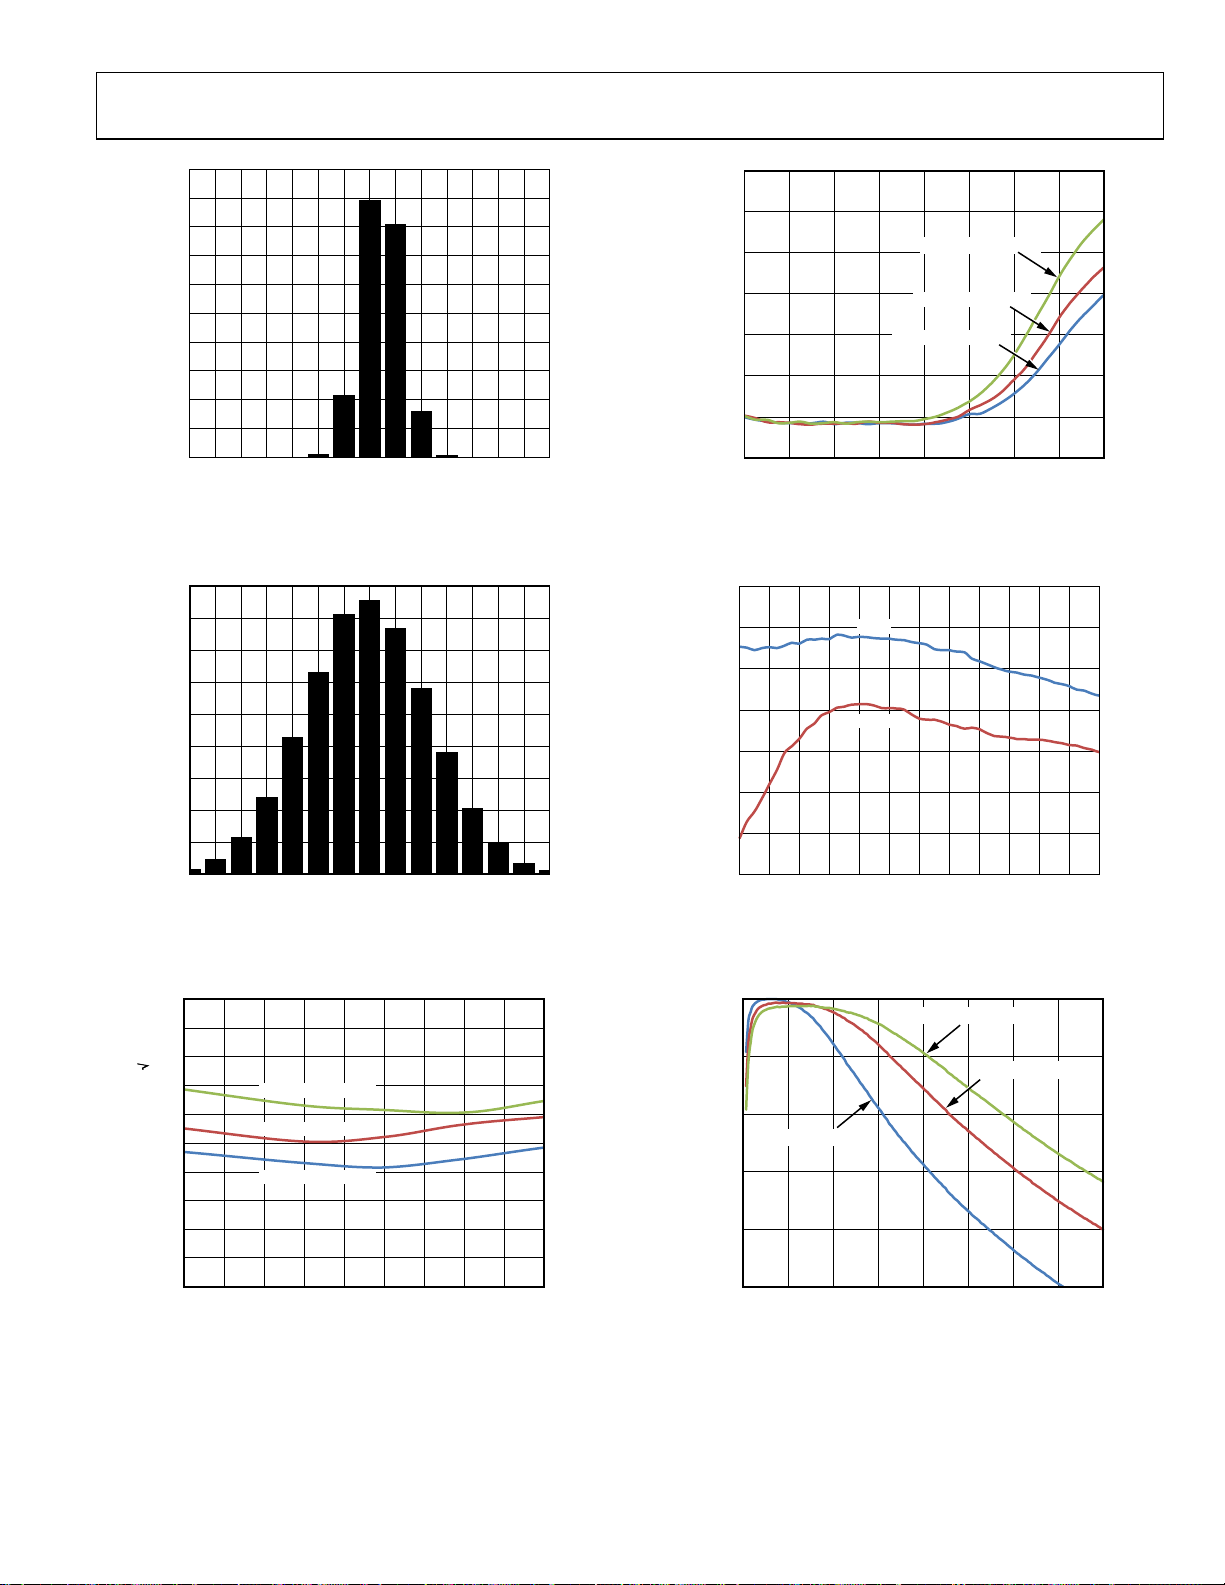
Figure 8. Gain Error Histogram, GAIN+ = 1.44 V
0
0.1
0.2
0.3
–0.1
0.4
SAMPLE
0.5
0.6
/3,
0.7
0.8
0.9
1.0
08180-008
25
20
15
10
PERCENTAGE OF UNITS (%)
5
0
–1.0
–0.9
–0.8
–0.7
–0.6
–0.5
–0.4
0
–0.3
–0.2
–0.1
GAIN ERROR (d B)
Figure 6. Gain Error Histogram, GAIN+ = 0.16 V
14
12
10
8
6
4
PERCENTAGE OF UNITS (%)
2
25
20
15
10
PERCENTAGE O F UNITS (%)
5
0
0.1
0.2
0.3
0.4
0.5
0.6
0.7
0.8
0.9
1.0
08180-006
–1.25 –1.00 –0.75
–0.50 –0.25 0
CHANNEL-TO-CHANNEL GAIN MATCHI NG (dB)
0.25 0.50 0.75 1.00 1. 25
08180-009
Figure 9. Gain Match Histogram, GAIN+ = 0.3 V
25
20
15
10
PERCENTAGE OF UNITS (%)
5
0
–1.0
–0.9
–0.8
–0.7
–0.6
–0.5
–0.4
0
–0.3
GAIN ERROR (dB)
0.1
–0.2
–0.1
0.2
Figure 7. Gain Error Histogram, GAIN+ = 0.8 V
0
0.3
0.4
0.5
0.6
0.7
0.8
0.9
1.0
08180-007
–1.25 –1.00 –0.75
–0.50 –0.25 0
CHANNEL-TO-CHANNEL GAIN MATCHI NG (dB)
0.25 0.50 0.75 1.00 1. 25
08180-010
Figure 10. Gain Match Histogram, GAIN+ = 1.3 V
Rev. 0 | Page 14 of 48
Page 15
AD9276
–
A
500k
450k
400k
350k
300k
250k
200k
NUMBER OF HIT S
150k
100k
50k
0
–7 –6 –5 –4
–3–2–101234567
CODES
Figure 11. Output-Referred Noise Histogram, GAIN+ = 0.0 V
08180-011
126
–128
–130
–132
–134
–136
OUTPUT-REF ERRED NOISE ( dBFS/Hz)
–138
–140
0 0.2 0.4 0.6 0.8
LNA GAIN = 21.3dB
LNA GAIN = 17.9dB
LNA GAIN = 15.6dB
1.0 1.2 1.4 1.6
GAIN+ (V)
Figure 14. Short-Circuit, Output-Referred Noise vs. GAIN+
08180-014
180k
160k
140k
120k
100k
80k
60k
NUMBER OF HIT S
40k
20k
0
–7 –6 –5 –4
–3–2–101234567
CODES
Figure 12. Output-Referred Noise Histogram, GAIN+ = 1.6 V
2.0
1.8
1.6
1.4
1.2
1.0
0.8
0.6
0.4
INPUT-REFERRE D NOISE (n V/ Hz)
0.2
0
12345678910
LNA GAIN = 15.6dB
LNA GAIN = 17.9dB
LNA GAIN = 21.3dB
FREQUENCY (MHz)
Figure 13. Short-Circuit, Input-Referred Noise vs. Frequency,
PGA Gain = 30 dB, GAIN+ = 1.6 V
64
62
60
58
D(dBFS)
56
SNR/SIN
54
52
50
08180-012
0.4 0.5 0.6 0.7 0.8 0. 9 1.0 1.1 1.2 1.3 1.4 1.5 1.6
SNR
SINAD
GAIN+ (V)
08180-015
Figure 15. SNR/SINAD vs. GAIN+, AIN = −1.0 dBFS
0
–5
–10
MODE I – 40MS PS
–15
AMPLITUDE ( dBFS)
–20
–25
0 5 10 15 20 25 30 35 40
08180-013
MODE III – 80MSPS
FREQUENCY (MHz )
MODE II – 65MSPS
08180-016
Figure 16. Antialiasing Filter (AAF) Pass-Band Response,
LPF Cutoff = f
/3 (Mode I and Mode II), f
SAMPLE
/4.5 (Mode III)
SAMPLE
Rev. 0 | Page 15 of 48
Page 16

AD9276
R
A
R
A
A
R
A
0
–10
–20
–30
–40
–50
RMONIC DISTORTION (dBFS)
H
–60
–70
GAIN+ = 1. 0V
0246810121416
INPUT FREQUENCY (MHz)
SECOND-ORDE
–80
–90
GAIN+ = 0. 4V
GAIN+ = 1. 6V
08180-018
Figure 17. Second-Order Harmonic Distortion vs. Frequency, AIN = −1.0 dBFS
0
–20
–40
–60
RMONIC DISTORTION (dBFS)
H
–80
–100
THIRD-ORDE
–120
–40 –35 –30 –25 –20 –15 –10 –5 0
ADC OUTPUT LEVEL (dBF S)
GAIN+ = 0V
GAIN+ = 1.6V
GAIN+ = 0. 8V
Figure 20. Third-Order Harmonic Distortion vs. ADC Output Level
08180-021
0
–10
–20
–30
GAIN+ = 0.4V
GAIN+ = 1.6V
GAIN+ = 1.0V
0 2 4 6 8 10 12 14 16
INPUT FREQ UENCY (MHz)
08180-019
RMONIC DISTORTION (dBFS)
H
THIRD-ORDE
–40
–50
–60
–70
–80
Figure 18. Third-Order Harmonic Distortion vs. Frequency, AIN = −1.0 dBFS
0
–20
–40
–60
RMONIC DISTORTION (dBFS)
–80
–100
SECOND-ORDER H
–120
–50 –40 –30 –20 –10 0
GAIN+ = 0V
ADC OUTPUT LEVEL (dBFS)
GAIN+ = 0. 8V
GAIN+ =
1.6V
08180-020
Figure 19. Second-Order Harmonic Distortion vs. ADC Output Level
0
f
=
f
+0.01MHz
IN2
f
IN1
IN1
= –1dBFS,
f
IN2
= –21dBFS
2.3MHz 5MHz
GAIN+ (V)
–10
–20
–30
–40
–50
IMD3 (dBFS)
–60
–70
–80
–90
0.4 0.6 0.8 1.0 1.2 1.4 1.6
Figure 21. IMD3 vs. GAIN+
0
f
= 5.00MHz,
IN1
FUND2 LEVEL = FUND1 LEVEL – 20dB
–20
–40
–60
IMD3 (dBFS)
–80
–100
–120
–40 –35 –30 –25 –20 –15 –10 –5 0
f
= 5.01MHz
IN2
GAIN+ = 0V
GAIN+ = 0.8V
AMPLITUDE LEVEL (dBFS)
GAIN+ = 1.6V
Figure 22. IMD3 vs. Amplitude Level
8MHz
08180-022
08180-023
Rev. 0 | Page 16 of 48
Page 17

AD9276
CW DOPPLER MODE
fRF = 2.5 MHz at −3 dBFS, f
1.2
1.0
0.8
0.6
0.4
0.2
0
–0.2
–0.4
–0.6
–0.8
QUADRATURE PHASE ERRO R (Degrees)
–1.0
–1.2
100 1k 10k
Figure 23. Quadrature Phase Error vs. Baseband Frequency
= 10 MHz, RS = 50 Ω, LNA gain = 21.3 dB, LNA bias = high, all CW channels enabled, phase rotation 0°.
4LO
175
BASEBAND FREQUENCY (Hz)
170
165
160
155
DYNAMIC RANGE (dBF S/ Hz)
150
145
0 1000 2000 3000 4000 5000 6000 7000 8000 9000 10,000
08180-073
BASEBAND FREQUENCY (Hz)
CH A + B + C + D + E + F + G + H
CH A + B + C + D
CH A
Figure 26. Small-Signal Dynamic Range
CH A + B
08180-076
0.10
0.08
0.06
0.04
0.02
0
–0.02
–0.04
–0.06
–0.08
QUADRATURE AMPLI TUDE IMBALANCE (dB)
–0.10
100 1k 10k
BASEBAND FREQUENCY (Hz)
Figure 24. Quadrature Amplitude Imbalance vs. Baseband Frequency
140
142
144
146
148
150
152
154
156
158
160
162
OUTPUT-REF ERRED SNR (dBc/ Hz)
164
166
–20 –18 –16 –14 –12 –10 –8 –6 –4 –2 0
1kHz OFFS ET
5kHz OFFSET
INPUT LEVEL (dBFS)
Figure 25. Output-Referred SNR vs. Input Level
12
10
8
6
4
NOISE FI GURE (dB)
2
0
0 1000 2000 3000 4000 5000 6000 7000 8000 9000 10,000
08180-074
BASEBAND FREQUENCY (Hz )
08180-077
Figure 27. Noise Figure vs. Baseband Frequency
130
135
140
145
150
155
OUTPUT-REF ERRED SNR (dBc/ Hz)
160
165
08180-075
0 1000 2000 3000 4000 5000 6000 7000 8000 9000 10,000
BASEBAND FREQUENCY (Hz)
08180-078
Figure 28. Output-Referred SNR vs. Baseband Frequency
Rev. 0 | Page 17 of 48
Page 18

AD9276
170
168
166
164
162
160
DYNAMIC RANGE (dB)
158
156
154
1 2 3 4 5678910
LNA GAIN = 15.6dB
LNA GAIN = 17. 9dB
LNA GAIN = 21.3dB
RF FREQUENCY (MHz )
08180-079
Figure 29. Small-Signal Dynamic Range vs. RF Frequency
Rev. 0 | Page 18 of 48
Page 19

AD9276
V
S
A
O
A
V
A
V
EQUIVALENT CIRCUITS
AVDD2
CM
VDD1
LI-x,
LG-x
15kΩ
Figure 30. Equivalent LNA Input Circuit
LO-x,
LOSW-x
AVDD2
AVDD2
10Ω
Figure 31. Equivalent LNA Output Circuit
AVDD1
CLK+
350Ω
DIO
08180-024
350Ω
30kΩ
08180-028
Figure 34. Equivalent SDIO Input Circuit
DRVDD
DRVDD
V
DOUTx–
V
08180-025
DRGND
DRVDD
V
DOUTx+
V
08180-029
Figure 35. Equivalent Digital Output Circuit
DD1
10kΩ
AVDD1
10kΩ
CLK–
350Ω
Figure 32. Equivalent Clock Input Circuit
AVDD2
4LO+
AVDD2
4LO–
350Ω
10kΩ
10kΩ
350Ω
Figure 33. Equivalent 4LO Input Circuit
1.25V
1.25V
SCLK,
PDWN,
R STBY
08180-026
350Ω
30kΩ
08180-030
Figure 36. Equivalent SCLK, PDWN, or STBY Input Circuit
DD2
RESET
08180-027
350Ω
08180-031
Figure 37. Equivalent RESET Input Circuit
Rev. 0 | Page 19 of 48
Page 20

AD9276
C
A
V
A
G
V
C
A
V
SB
DD1
350Ω
AVD D1
70kΩ
GAIN+
VDD2
50Ω
Figure 38. Equivalent CSB Input Circuit
VREF
6kΩ
Figure 39. Equivalent VREF Circuit
RBIAS
100Ω
8180-033
08180-035
Figure 41. Equivalent GAIN+ Input Circuit
AVDD2
AIN–
08180-034
50Ω
0.8
70kΩ
08180-036
Figure 42. Equivalent GAIN− Input Circuit
AVDD2
Wx+,
CWx–
08180-037
Figure 43. Equivalent CWI±, CWQ± Output Circuit
08180-032
DD2
Figure 40. Equivalent RBIAS Circuit
GPOx
10Ω
08180-038
Figure 44. Equivalent GPOx Output Circuit
Rev. 0 | Page 20 of 48
Page 21

AD9276
THEORY OF OPERATION
ULTRASOUND
The primary application for the AD9276 is medical ultrasound.
Figure 45 shows a simplified block diagram of an ultrasound
system. A critical function of an ultrasound system is the time
gain control (TGC) compensation for physiological signal
attenuation. Because the attenuation of ultrasound signals is
exponential with respect to distance (time), a linear-in-dB VGA
is the optimal solution.
Key requirements in an ultrasound signal chain are very low
noise, active input termination, fast overload recovery, low power,
and differential drive to an ADC. Because ultrasound machines
use beamforming techniques requiring large binary-weighted
numbers of channels (for example, 32 to 512), using the lowest
power at the lowest possible noise is of chief importance.
Tx HV AMPLIFIERS
Most modern ultrasound machines use digital beamforming.
In this technique, the signal is converted to digital format
immediately following the TGC amplifier, and then beamforming is accomplished digitally.
The ADC resolution of 12 bits with up to 80 MSPS sampling
satisfies the requirements of both general-purpose and high
end systems.
Power conservation and low cost are two of the most important
factors in low end and portable ultrasound machines, and the
AD9276 is designed to meet these criteria.
For additional information regarding ultrasound systems, refer
to “How Ultrasound System Considerations Influence Front-End
Component Choice,” Analog Dialogue, Volume 36, Number 3,
May–July 2002, and “The AD9271—A Revolutionary Solution for
Portable Ultrasound,” Analog Dialogue, Volume 41, Number 7,
July 2007.
BEAMFORMER
CENTRAL CONTRO L
MULTICHANNEL S
Rx BEAMFORMER
(B AND F MODES)
IMAGE AND
MOTION
PROCESSING
(B MODE)
DISPLAY
COLOR
DOPPLER (PW )
PROCESSING
(F MODE)
08180-039
TRANSDUCER
ARRAY
128, 256, ETC.,
ELEMENTS
HV
MUX/
DEMUX
BIDIRECTIO NAL
CABLE
T/R
SWITCHES
Tx BEAMFORMER
VGALNA
CW (ANALOG)
BEAMFORMER
AUDIO
OUTPUT
AAF
ADC
SPECTRAL
DOPPLER
PROCESSING
MODE
Figure 45. Simplified Ultrasound System Block Diagram
Rev. 0 | Page 21 of 48
Page 22

AD9276
R
4
ATTENUATOR
–42dB TO 0d B
GAIN
INTERPOLATOR
POST
AMP
21dB,
24dB,
27dB,
30dB
X-AMP VGA
AAF
PIPELINE
ADC
SERIAL
LVDS
CWI+
CWI–
CWQ+
CWQ–
DOUTx+
DOUTx–
TRANSDUCE
T/R
SWITCH
4LO–
4LO+
RESET
R
LO-x
FB1
R
LOSW-x
FB2
C
S
C
SH
LI-x
LG-x
C
LG
LNA
GENERATIO N
15.6dB,
17.9dB,
21.3dB
LO
GAIN+
Figure 46. Simplified Block Diagram of a Single Channel
CHANNEL OVERVIEW
Each channel contains both a TGC signal path and a CW Doppler
signal path. Common to both signal paths, the LNA provides useradjustable input impedance termination. The CW Doppler path
includes an I/Q demodulator. The TGC path includes a differential X-AMP® VGA, an antialiasing filter, and an ADC. Figure 46
shows a simplified block diagram with external components.
The signal path is fully differential throughout to maximize signal
swing and reduce even-order distortion; however, the LNA is
designed to be driven from a single-ended signal source.
Low Noise Amplifier (LNA)
Good noise performance relies on a proprietary ultralow noise
LNA at the beginning of the signal chain, which minimizes the
noise contribution in the following VGA. Active impedance
control optimizes noise performance for applications that
benefit from input impedance matching.
A simplified schematic of the LNA is shown in Figure 47. LI-x
is capacitively coupled to the source. An on-chip bias generator
establishes dc input bias voltages of around 0.9 V and centers the
output common-mode levels at 1.5 V (AVDD2 divided by 2). A
capacitor, C
C
, is connected from the LG-x pin to ground.
S
It is highly recommended that the LG-x pins form a Kelvin type
connection to the input or probe connection ground. Simply
connecting the LG-x pin to ground near the device can allow
differences in potential to be amplified through the LNA. This
generally shows up as a dc offset voltage that can vary from
channel to channel and part to part, depending on the application and the layout of the PCB.
, of the same value as the input coupling capacitor,
LG
GAIN–
SWITCH
TRANSDUCER
T/R
C
FB
VO+
V
CM
LI-x
C
S
C
SH
R
FB1
R
FB2
V
–
O
LOSW-x
V
CM
LG-x
C
LG
Figure 47. Simplified LNA Schematic
The LNA supports differential output voltages as high as 4.4 V p-p
with positive and negative excursions of ±1.1 V from a commonmode voltage of 1.5 V. The LNA differential gain sets the maximum
input signal before saturation. One of three gains is set through the
SPI. The corresponding full-scale input for the gain settings of
15.6 dB, 17.9 dB, and 21.3 dB is 733 mV p-p, 550 mV p-p, and
367 mV p-p, respectively. Overload protection ensures quick
recovery time from large input voltages. Because the inputs are
capacitively coupled to a bias voltage near midsupply, very large
inputs can be handled without interacting with the ESD
protection.
LO-x
08180-040
08180-041
Rev. 0 | Page 22 of 48
Page 23

AD9276
Low value feedback resistors and the current-driving capability
of the output stage allow the LNA to achieve a low inputreferred noise voltage of 0.75 nV/√Hz (at a gain of 21.3 dB).
This is achieved with a current consumption of only 27 mA per
channel (80 mW). On-chip resistor matching results in precise
single-ended gains, which are critical for accurate impedance
control. The use of a fully differential topology and negative
feedback minimizes distortion. Low second-order harmonic
distortion is particularly important in second harmonic ultrasound imaging applications. Differential signaling enables
smaller swings at each output, further reducing third-order
harmonic distortion.
Active Impedance Matching
The LNA consists of a single-ended voltage gain amplifier with
differential outputs and the negative output externally available.
For example, with a fixed gain of 8× (17.9 dB), an active input
termination is synthesized by connecting a feedback resistor
between the negative output pin, LO-x, and the positive input
pin, LI-x. This well-known technique is used for interfacing
multiple probe impedances to a single system. The input
resistance is shown in Equation 1.
R
R
IN
FB
=
1(
(1)
A
)
+
2
where:
A/2 is the single-ended gain or the gain from the LI-x inputs to
the LO-x outputs.
R
is the resulting impedance of the R
FB
FB1
and R
combination
FB2
(see Figure 47).
Because the amplifier has a gain of 8× from its input to its
differential output, it is important to note that the gain A/2
is the gain from Pin LI-x to Pin LO-x and that it is 6 dB less
than the gain of the amplifier, or 11.9 dB (4×). The input
resistance is reduced by an internal bias resistor of 15 kΩ in
parallel with the source resistance connected to Pin LI-x, with
Pin LG-x ac grounded. Equation 2 can be used to calculate the
required R
For example, to set R
If the simplified equation (Equation 2) is used to calculate R
for a desired RIN, even for higher values of RIN.
FB
R
R
IN
FB
= k15||
+
)31(
(2)
Ω
to 200 Ω, the value of RFB must be 1000 Ω.
IN
,
IN
the value is 188 Ω, resulting in a gain error of less than 0.6 dB.
Some factors, such as the presence of a dynamic source resistance,
may influence the absolute gain accuracy more significantly. At
higher frequencies, the input capacitance of the LNA must be
considered. The user must determine the level of matching
accuracy and adjust R
accordingly.
FB
The bandwidth (BW) of the LNA is greater than 100 MHz.
Ultimately, the BW of the LNA limits the accuracy of the
synthesized R
. For RIN = RS up to about 200 Ω, the best match
IN
is between 100 kHz and 10 MHz, where the lower frequency
limit is determined by the size of the ac coupling capacitors, and
the upper limit is determined by the LNA BW. Furthermore, the
input capacitance and R
Figure 48 shows R
1k
RS = 500Ω, RFB = 2kΩ
RS = 200Ω, RFB = 800Ω
RS = 100Ω, RFB = 400Ω, CSH = 20pF
100
RS = 50Ω, RFB = 200Ω, CSH = 70pF
INPUT RESIS TANCE (Ω)
10
100k 1M 10M 100M
Figure 48. R
(Effects of R
limit the BW at higher frequencies.
S
vs. frequency for various values of RFB.
IN
FREQUENCY (Hz)
vs. Frequency for Various Values of RFB
IN
and CSH Are Also Shown)
S
08180-042
Note that at the lowest value of RIN (50 Ω), RIN peaks at frequencies
greater than 10 MHz. This is due to the BW roll-off of the LNA,
as mentioned previously.
However, as can be seen for larger R
values, parasitic capaci-
IN
tance starts rolling off the signal BW before the LNA can produce
peaking. C
not be used for values of R
lists the recommended values for R
is needed in series with RFB because the dc levels at Pin LO-x
C
FB
further degrades the match; therefore, CSH should
SH
that are greater than 100 Ω. Table 7
IN
and CSH in terms of RIN.
FB
and Pin LI-x are unequal.
Table 7. Active Termination External Component Values
LNA Gain
(dB) R
(Ω) RFB (Ω)
IN
Minimum
CSH (pF) BW (MHz)
15.6 50 200 90 57
17.9 50 250 70 69
21.3 50 350 50 88
15.6 100 400 30 57
17.9 100 500 20 69
21.3 100 700 10 88
15.6 200 800 N/A 72
17.9 200 1000 N/A 72
21.3 200 1400 N/A 72
Rev. 0 | Page 23 of 48
Page 24

AD9276
LNA Noise
The short-circuit noise voltage (input-referred noise) is an
important limit on system performance. The short-circuit noise
voltage for the LNA is 0.75 nV/√Hz at a gain of 21.3 dB, including
the VGA noise at a VGA postamp gain of 27 dB. These measurements, which were taken without a feedback resistor, provide
the basis for calculating the input noise and noise figure (NF)
performance of the configurations shown in Figure 49.
UNTERMINATED
R
IN
R
S
+
LI-x
–
RESISTIVE TERMINAT ION
R
R
S
+
LI-x
–
ACTIVE IMPEDANCE MATCH
R
R
S
+
LI-x
–
RIN=
IN
IN
R
FB
1 + A/2
R
S
R
V
OUT
V
OUT
FB
V
OUT
08180-043
Figure 49. Input Configurations
Figure 50 and Figure 51 are simulations of noise figure vs. RS
results using these configurations and an input-referred noise
voltage of 3.8 nV/√Hz for the VGA. Unterminated (R
= ∞)
FB
operation exhibits the lowest equivalent input noise and noise
figure. Figure 51 shows the noise figure vs. source resistance
rising at low R
with the source noise—and at high R
from R
—where the LNA voltage noise is large compared
S
due to the noise contribution
S
. The lowest NF is achieved when RS matches RIN.
FB
The main purpose of input impedance matching is to improve
the transient response of the system. With resistive termination,
the input noise increases due to the thermal noise of the matching resistor and the increased contribution of the LNA’s input
voltage noise generator. With active impedance matching,
however, the contributions of both are smaller (by a factor of
1/(1 + LNA gain)) than they would be for resistive termination.
Figure 50 shows the relative noise figure performance. With an
LNA gain of 21.3 dB, the input impedance was swept with R
S
to
preserve the match at each point. The noise figures for a source
impedance of 50 are 7.3 dB, 4.2 dB, and 2.8 dB for the resistive
termination, active termination, and unterminated configurations,
respectively. The noise figures for 200 are 4.5 dB, 1.7 dB, and
1.0 dB, respectively.
Figure 51 shows the noise figure as it relates to R
values of R
, which is helpful for design purposes.
IN
12.0
10.5
9.0
7.5
6.0
4.5
NOISE FI GURE (dB)
3.0
UNTERMINATED
1.5
0
10 100 1k
Figure 50. Noise Figure vs. R
RESISTIV E TERMINATI ON
ACTIVE TERMINATION
RS(Ω)
for Resistive Termination, Active
S
Termination Matched, and Unterminated Inputs, V
for various
S
= 0.8 V
GAIN
08180-044
8
7
6
5
4
3
NOISE FI GURE (dB)
2
1
0
10 100 1k
Figure 51. Noise Figure vs. R
Active Termination Matched Inputs, V
RIN = 50Ω
R
= 75Ω
IN
R
= 100Ω
IN
R
= 200Ω
IN
UNTERMINATED
R
(Ω)
S
for Various Fixed Values of RIN,
S
GAIN
= 0.8 V
08180-045
Rev. 0 | Page 24 of 48
Page 25

AD9276
INPUT OVERDRIVE
Excellent overload behavior is of primary importance in
ultrasound. Both the LNA and VGA have built-in overdrive
protection and quickly recover after an overload event.
Input Overload Protection
As with any amplifier, voltage clamping prior to the inputs
is highly recommended if the application is subject to high
transient voltages.
Figure 52 shows a simplified ultrasound transducer interface.
A common transducer element serves the dual functions of
transmitting and receiving ultrasound energy. During the
transmitting phase, high voltage pulses are applied to the ceramic
elements. A typical transmit/receive (T/R) switch can consist of
four high voltage diodes in a bridge configuration. Although the
diodes ideally block transmit pulses from the sensitive receiver
input, diode characteristics are not ideal, and the resulting leakage
transients imposed on the LI-x inputs can be problematic.
Because ultrasound is a pulse system and time-of-flight is used
to determine depth, quick recovery from input overloads is
essential. Overload can occur in the preamplifier and in the
VGA. Immediately following a transmit pulse, the typical VGA
gains are low, and the LNA is subject to overload from T/R
switch leakage. With increasing gain, the VGA can become
overloaded due to strong echoes that occur near field echoes
and acoustically dense materials, such as bone.
Figure 52 illustrates an external overload protection scheme. A
pair of back-to-back signal diodes should be in place prior to
the ac coupling capacitors. Keep in mind that all diodes are
prone to exhibiting some amount of shot noise. Many types of
diodes are available for achieving the desired noise performance.
The configuration shown in Figure 52 tends to add 2 nV/√Hz of
input-referred noise. Decreasing the 5 kΩ resistor and increasing
the 2 kΩ resistor may improve noise contribution, depending
on the application. With the diodes shown in Figure 52, clamping levels of ±0.5 V or less significantly enhance the overload
performance of the system.
+5V
Tx
DRIVER
TRANSDUCER
5kΩ
HV
2kΩ
5kΩ
–5V
Figure 52. Input Overload Protection
10nF
10nF
AD9276
LNA
08180-046
CW DOPPLER OPERATION
Each channel of the AD9276 includes an I/Q demodulator. Each
demodulator has an individual programmable phase shifter.
The I/Q demodulator is ideal for phased array beamforming
applications in medical ultrasound. Each channel can be programmed for 16 delay states (360°/16 or 22.5°/step), selectable
via the SPI port. The part has a RESET input used to synchronize
the LO dividers of each channel. If multiple AD9276s are used,
a common RESET across the array ensures synchronized phase
for all channels. Internal to the AD9276, the individual channel I
and Q outputs are current summed. If multiple AD9276s are used,
the I and Q outputs from each AD9276 can be current summed
and converted to a voltage using an external trans
mplifier.
a
Quadrature Generation
The internal 0° and 90° LO phases are digitally generated by
a divide-by-4 logic circuit. The divider is dc-coupled and
inherently broadband; the maximum LO frequency is limited
only by its switching speed. The duty cycle of the quadrature LO
signals is intrinsically 50% and is unaffected by the asymmetry
of the externally connected 4LO input. Furthermore, the divider
is implemented such that the 4LO signal reclocks the final flipflops that generate the internal LO signals and thereby minimizes
noise introduced by the divide circuitry.
For optimum performance, the 4LO input is driven differentially,
as done on the AD9276 evaluation board. The common-mode
voltage on each pin is approximately 1.2 V with the nominal 3 V
supply. It is important to ensure that the LO source has very low
phase noise (jitter), fast slew rate, and adequate input level to
obtain optimum performance of the CW signal chain.
Beamforming applications require a precise channel-to-channel
phase relationship for coherence among multiple channels. A
RESET pin is provided to synchronize the LO divider circuits
in different AD9276s when they are used in arrays. The RESET
pin resets the dividers to a known state after power is applied to
multiple AD9276s. Accurate channel-to-channel phase matching
can only be achieved via a common pulse on the RESET pin when
using more than one AD9276.
impedance
Rev. 0 | Page 25 of 48
Page 26

AD9276
I/Q Demodulator and Phase Shifter
The I/Q demodulators consist of double-balanced passive mixers.
The RF input signals are converted into currents by transconductance stages that have a maximum differential input signal
capability matching the LNA output full scale. These currents
are then presented to the mixers, which convert them to baseband (RF − LO) and twice RF (RF + LO). The signals are phase
shifted according to the codes programmed into the SPI latch
(see Table 8). The phase shift function is an integral part of the
overall circuit. The phase shift listed in Column 1 of Table 8 is
defined as being between the baseband I or Q channel outputs.
As an example, for a common signal applied to a pair of RF inputs
to an AD9276, the baseband outputs are in phase for matching
phase codes. However, if the phase code for Channel 1 is 0000
and that of Channel 2 is 0001, then Channel 2 leads Channel 1
by 22.5°.
Table 8. Phase Select Code for Channel-to-Channel Phase Shift
I/Q Demodulator Phase
Φ Shift
0° 0000
22.5° 0001
45° 0010
67.5° 0011
90° 0100
112.5° 0101
135° 0110
157.5° 0111
180° 1000
202.5° 1001
225° 1010
247.5° 1011
270° 1100
292.5° 1101
315° 1110
337.5° 1111
(SPI Register 0x2D[3:0])
Dynamic Range and Noise
Figure 53 is an interconnection block diagram of all eight
channels of the AD9276. More channels are easily added to the
summation (up to 32 when using an AD8021 as the summation
amplifier) by wire-OR connecting the outputs as shown. In
beamforming applications, the I and Q outputs of a number
of receiver channels are summed. The dynamic range of the
system increases by the factor 10 log
(N), where N is the
10
number of channels (assuming random uncorrelated noise).
The noise in the 8-channel example of Figure 53 is increased
by 9 dB, whereas the signal quadruples (18 dB), yielding an
aggregate SNR improvement of (18 − 9) = 9 dB.
The output-referred noise of the CW signal path depends on the
LNA gain, the selection of the external summing amplifier, and
the value of R
important to know the active low-pass filter (LPF) values, R
and C
FILT
channel are 2 kΩ for R
. To determine the output-referred noise, it is
FILT
FILT
, shown in Figure 53. Typical filter values for a single
and 0.8 nF for C
FILT
; these values
FILT
implement a 100 kHz single-pole LPF. In the case where eight
channels are summed, R
FILT
and C
are 250 Ω and 6.4 nF.
FILT
If the RF and LO are offset by 10 kHz, the demodulated signal is
10 kHz and is passed by the LPF. The single-channel mixing gain
from the RF input to the AD8021 output (for example, I1´, Q1´)
is approximately the LNA gain for R
FILT
and C
of 2 kΩ and
FILT
0.8 nF.
This gain can be increased by increasing the filter resistor while
maintaining the corner frequency. The factor limiting the
magnitude of the gain is the output swing and drive capability
of the op amp selected for the I-to-V converter, in this example,
the AD8021. Because any amplifier has limited drive capability,
there is a finite number of channels that can be summed. The
channel-summing limit relates directly to the current drive
capability of the amplifier used to implement the active lowpass filter and current-to-voltage converter. The maximum
sum, when the AD8021 is used, is 32 channels of the AD9276;
that is, four AD9276s (4 × 8 = 32 channels) can be summed in
one AD8021.
Rev. 0 | Page 26 of 48
Page 27

AD9276
C
FILT
CHANNEL A
CHANNEL H
LNA
LNA
OTHER
AD9276s
CWI+
1.5V
1.5V
CWI–
CWQ+
CWQ–
1.5V
1.5V
R
FILT
AD8021
AD8021
R
FILT
C
FILT
C
FILT
R
FILT
AD8021
AD8021
R
FILT
C
FILT
I
Q
18-BIT ADC
18-BIT ADC
4
LO
GENERATION
4LO–
4LO+
RESET
Figure 53. Typical Connection Interface for I/Q Outputs in CW Mode
Phase Compensation and Analog Beamforming
Beamforming, as applied to medical ultrasound, is defined as
the phase alignment and summation of signals generated from a
common source but received at different times by a multielement
ultrasound transducer. Beamforming has two functions: it imparts
directivity to the transducer, enhancing its gain, and it defines a
focal point within the body from which the location of the returning echo is derived. The primary application for the AD9276 I/Q
demodulators is in analog beamforming circuits for ultrasound
CW Doppler.
Modern ultrasound machines used for medical applications
employ an array of receivers for beamforming, with typical CW
Doppler array sizes of up to 64 receiver channels that are phase
shifted and summed together to extract coherent information.
When used in multiples, the desired signals from each of the
channels can be summed to yield a larger signal (increased by a
factor N, where N is the number of channels), whereas the noise
is increased by the square root of the number of channels. This
technique enhances the signal-to-noise performance of the
machine. The critical elements in a beamformer design are the
means to align the incoming signals in the time domain and the
means to sum the individual signals into a composite whole.
In traditional analog beamformers incorporating Doppler, a
V-to-I converter per channel and a crosspoint switch precede
passive delay lines used as a combined phase shifter and
summing circuit. The system operates at the carrier frequency
(RF) through the delay line, which also sums the signals from
the various channels, and then the combined signal is downconverted by an I/Q demodulator. The dynamic range of the
demodulator can limit the achievable dynamic range.
The resultant I and Q signals are filtered and then sampled by
two high resolution analog-to-digital converters. The sampled
signals are processed to extract the relevant Doppler information.
Alternatively, the RF signal can be processed by downconversion
on each channel individually, phase shifting the downconverted
signal and then combining all channels. Because the dynamic
range expansion from beamforming occurs after demodulation,
the demodulator dynamic range has little effect on the output
dynamic range. The AD9276 implements this architecture. The
downconversion is done by an I/Q demodulator on each channel,
and the summed current output is the same as in the delay line
approach. The subsequent filters after the I-to-V conversion
and the ADCs are similar.
08180-047
Rev. 0 | Page 27 of 48
Page 28

AD9276
For CW Doppler operation, the AD9276 integrates the LNA,
phase shifter, frequency conversion, and I/Q demodulation
into a single package and directly yields the baseband signal.
Figure 54 is a simplified diagram showing the concept for four
channels. The ultrasound wave (US wave) is received by four
transducer elements, TE1 through TE4, in an ultrasound probe
and generates signals E1 through E4. In this example, the phase
at TE1 leads the phase at TE2 by 45°.
In a real application, the phase difference depends on the
element spacing, wavelength (λ), speed of sound, angle of
incidence, and other factors. In Figure 54, the signals E1
through E4 are amplified by the low noise amplifiers. For
optimum signal-to-noise performance, the output of the LNA
is applied directly to the input of the demodulators. To sum the
signals E1 through E4, E2 is shifted 45° relative to E1 by setting
the phase code in Channel 2 to 0010, E3 is shifted 90° (0100), and
E4 is shifted 135° (0110). The phase-aligned current signals at
the output of the AD9276 are summed in an I-to-V converter to
provide the combined output signal with a theoretical improvement in dynamic range of 6 dB for the four channels.
CW Application Information
The RESET pin is used to synchronize the LO dividers when
using multiple AD9276s. Because they are driven by the same
internal LO, the channels in any AD9276 are inherently synchronous. However, when multiple AD9276s are used, it is
possible for their dividers to wake up in different phase states.
The function of the RESET pin is to phase align all the LO
signals in multiple AD9276s.
The 4LO divider of each AD9276 can be initiated in one of four
possible states: 0°, 90°, 180°, and 270° relative to other AD9276s.
The internally generated I/Q signals of each AD9276 LO are always
at a 90° angle relative to each other, but a phase shift can occur
during power-up between the dividers of multiple AD9276s
used in a common array.
TRANSDUCER
ELEM ENTS TE1
THROUGH TE4
CONVERT US TO
ELEC TRIC AL
SIGN ALS
0°
E1
The RESET mechanism also allows the measurement of nonmixing gain from the RF input to the output. The rising edge of
the active high RESET pulse can occur at any time; however, the
duration should be ≥ 20 ns minimum. When the RESET pulse
transitions from high to low, the LO dividers are reactivated on
the next rising edge of the 4LO clock. To guarantee synchronous
operation of multiple AD9276s, the RESET pulse must go low
on all devices before the next rising edge of the 4LO clock.
Therefore, it is best to have the RESET pulse go low on the falling
edge of the 4LO clock; at the very least, the t
should be ≥ 5 ns.
SETUP
An optimal timing setup is for the RESET pulse to go high on a
4LO falling edge and to go low on a 4LO falling edge; this gives
15 ns of setup time even at a 4LO frequency of 32 MHz (8 MHz
internal LO).
Check the synchronization of multiple AD9276s using the
following procedure:
1. Activate at least one channel per AD9276 by setting the
appropriate channel enable bit in the serial interface (see
Table 18, Register 0x2D, Bit 4).
2. Set the phase code of all AD9276 channels to the same
logic state, for example, 0000.
3. Apply the same test signal to all devices to generate a sine
wave in the baseband output and measure the output of
one channel per device.
4. Apply a RESET pulse to all AD9276s.
5. Because all the phase codes of the AD9276s should be the
same, the combined signal of multiple devices should be N
times greater than a single channel. If the combined signal
is less than N times one channel, one or more of the LO
phases of the individual AD9276s is in error.
S1 THROUGH S4
ARE NOW
IN PHASE
S1
LNA
PHASE BIT
SETT INGS
CH 1
PHA SE SET
FOR 135°
LAG
S2
S3
S4
SUMMED
OUTPU T
S1 + S2 + S3 + S4
08180-048
4 US WAVES
ARE DELAY ED
45° EACH WIT H
RESPECT TO
EACH OTHER
135°
90°
45°
E2
LNA
E3
LNA
E4
LNA
CH 2
PHA SE SET
FOR 90°
LAG
CH 3
PHA SE SET
FOR 45°
LAG
CH 4
PHA SE SET
FOR 0°
LAG
Figure 54. Simplified Example of the AD9276 Phase Shifter
Rev. 0 | Page 28 of 48
Page 29

AD9276
A
TGC OPERATION
The TGC signal path is fully differential throughout to maximize signal swing and reduce even-order distortion; however,
the LNAs are designed to be driven from a single-ended signal
source. Gain values are referenced from the single-ended LNA
input to the differential ADC input. A simple exercise in understanding the maximum and minimum gain requirements is
shown in Figure 55.
The maximum gain required is determined by
(ADC Noise Floor/LNA Input Noise Floor) + Margin =
20 log(224/3.9) + 11 dB = 46 dB
The minimum gain required is determined by
(ADC Input FS/LNA Input FS) + Margin =
20 log(2/0.55) − 10 dB = 3 dB
Therefore, 42 dB of gain range for a 12-bit, 40 MSPS ADC with
15 MHz of bandwidth should suffice in achieving the dynamic
range required for most of today’s ultrasound systems.
The system gain is distributed as listed in Table 9 .
Table 9. Channel Gain Distribution
Section Nominal Gain (dB)
LNA 15.6/17.9/21.3
Attenuator −42 to 0
VGA Amplifier 21/24/27/30
Filter 0
ADC 0
MINIMUM GAIN
LNA FULL SCAL E
(0.55V p-p SINGLE-ENDED)
The linear-in-dB gain (law conformance) range of the TGC path
is 42 dB. The slope of the gain control interface is 28.5 dB/V,
and the gain control range is −0.8 V to +0.8 V. Equation 3 is the
expression for the differential voltage V
, and Equation 4 is
GAIN
the expression for the channel gain.
V
(V) = (GAIN+) – (GAIN−) (3)
GAIN
Gain (dB) = 28.5 dB/V × V
+ ICPT (4)
GAIN
where ICPT is the intercept point of the TGC gain.
In its default condition, the LNA has a gain of 21.3 dB (12×), and
the VGA postamp gain is 24 dB if the voltage on the GAIN+ pin
is 0 V and the voltage on the GAIN− pin is 0.8 V (42 dB attenuation). This results in a total gain (or ICPT) of 3.6 dB through
the TGC path if the LNA input is unmatched, or a total gain of
−2.4 dB if the LNA is matched to 50 Ω (R
= 350 Ω). However,
FB
if the voltage on the GAIN+ pin is 1.6 V and the voltage on the
GAIN− pin is 0.8 V (0 dB attenuation), the VGA gain is 24 dB.
This results in a total gain of 45 dB through the TGC path if the
LNA input is unmatched or in a total gain of 39 dB if the LNA
input is matched.
Each LNA output is dc-coupled to a VGA input. The VGA
consists of an attenuator with a range of −42 dB to 0 dB followed
by an amplifier with 21 dB/24 dB/27 dB/30 dB of gain. The
X-AMP gain interpolation technique results in low gain error
and uniform bandwidth, and differential signal paths minimize
distortion.
DC FULL SCALE (2V p-p)
~10dB MA RGIN
70dB
ADC
94dB
LNA
LNA INPUT-REF ERRED
(3.9µV rms) @ AAF BW = 15MHz
LNA + VGA NOISE = 1.0nV/ Hz
NOISE FLOOR
VGA GAIN RANG E > 42dB
MAX CHANNEL GAI N > 48dB
Figure 55. Gain Requirements of TGC Operation for a 12-Bit, 40 MSPS ADC
>11dB MARGI N
ADC NOISE FL OOR
(224µV rms)
MAXIMUM GAIN
08180-049
Rev. 0 | Page 29 of 48
Page 30

AD9276
Table 10. Sensitivity and Dynamic Range Trade-Offs
LNA VGA Channel
Gain
Full-Scale
(V/V) (dB) GAIN+ = 0 V
Input (V p-p)
Input Noise
(nV/√Hz) Postamp Gain (dB)
6 15.6 0.733 0.98 21 67.5 65.1 1.395
24 66.4 63.0 1.286
27 64.6 60.6 1.227
30 62.5 57.9 1.197
8 17.9 0.550 0.86 21 67.5 64.5 1.149
24 66.4 62.3 1.071
27 64.6 59.8 1.030
30 62.5 57.1 1.009
12 21.3 0.367 0.75 21 67.5 63.3 0.910
24 66.4 60.9 0.865
27 64.6 58.2 0.842
30 62.5 55.4 0.830
1
LNA: output full scale = 4.4 V p-p differential.
2
Filter: loss ≈ 1 dB, NBW = 13.3 MHz, GAIN− = 0.8 V.
3
ADC: 40 MSPS, 70 dB SNR, 2 V p-p full-scale input.
4
Output dynamic range at minimum VGA gain (VGA dominated).
5
Output dynamic range at maximum VGA gain (LNA dominated).
6
Channel noise at maximum VGA gain.
Table 10 demonstrates the sensitivity and dynamic range
trade-offs that can be achieved relative to various LNA and
VGA gain settings.
For example, when the VGA is set for the minimum gain voltage,
the TGC path is dominated by VGA noise and achieves the
maximum output SNR. However, as the postamp gain options
are increased, the input-referred noise is reduced and the SNR
is degraded.
If the VGA is set for the maximum gain voltage, the TGC path
is dominated by LNA noise and achieves the lowest inputreferred noise, but with degraded output SNR. The higher the
TGC (LNA + VGA) gain, the lower the output SNR. As the
postamp gain is increased, the input-referred noise is reduced.
At low gains, the VGA should limit the system noise performance
(SNR); at high gains, the noise is defined by the source and the
LNA. The maximum voltage swing is bound by the full-scale
peak-to-peak ADC input voltage (2 V p-p).
Both the LNA and VGA have full-scale limitations within each
section of the TGC path. These limitations are dependent on the
gain setting of each function block and on the voltage applied to
the GAIN+ and GAIN− pins. The LNA has three limitations,
or full-scale settings, that can be applied through the SPI.
1, 2, 3
Typical Output Dynamic Range (dB)
4
GAIN+ = 1.6 V
Input-Referred Noise6 @
5
GAIN+ = 1.6 V (nV/√Hz)
Similarly, the VGA has four postamp gain settings that can be
applied through the SPI. The voltage applied to the GAIN± pins
determines which amplifier (the LNA or VGA) saturates first.
The maximum signal input level that can be applied as a
function of voltage on the GAIN± pins for the selectable gain
options of the SPI is shown in Figure 56 to Figure 58.
0.9
0.8
0.7
0.6
0.5
0.4
0.3
INPUT FULL SCALE (V p-p)
0.2
0.1
PGA GAIN = 27dB
PGA GAIN = 30dB
0
0 0.2 0.4 0.6 0.8 1.0 1.2 1.4 1.6
Figure 56. LNA with 15.6 dB Gain Setting/VGA Full-Scale Limitations
PGA GAIN = 21dB
PGA GAIN = 24dB
GAIN+ (V)
08180-050
Rev. 0 | Page 30 of 48
Page 31

AD9276
G
0.6
0.5
0.4
0.3
0.2
INPUT FULL SCALE (V p-p)
0.1
0
0 0.2 0.4 0.6 0.8 1.0 1.2 1.4 1.6
PGA GAIN = 27dB
PGA GAIN = 30dB
PGA GAIN = 21dB
PGA GAIN = 24dB
GAIN+ (V)
Figure 57. LNA with 17.9 dB Gain Setting/VGA Full-Scale Limitations
0.40
0.35
0.30
0.25
0.20
0.15
PGA GAIN = 27d B
0.10
INPUT FULL SCALE (V p-p)
0.05
PGA GAIN = 30dB
0
0 0.2 0.4 0.6 0.8 1.0 1.2 1.4 1.6
PGA GAIN = 21dB
PGA GAIN = 24dB
GAIN+ (V)
Figure 58. LNA with 21.3 dB Gain Setting/VGA Full-Scale Limitations
Variable Gain Amplifier (VGA)
The differential X-AMP VGA provides precise input attenuation and interpolation. It has a low input-referred noise of
3.8 nV/√Hz and excellent gain linearity. A simplified block
diagram is shown in Figure 59.
AIN±
VIP
VIN
g
m
3.5dB
GAIN INTERPOLATOR
POSTAMP
+
08180-051
08180-052
The input of the VGA is a 14-stage differential resistor ladder with
3.5 dB per tap. The resulting total gain range is 42 dB, which
allows for range loss at the endpoints. The effective input resistance
per side is 180 Ω nominally for a total differential resistance of
360 Ω. The ladder is driven by a fully differential input signal from
the LNA. LNA outputs are dc-coupled to avoid external decoupling
capacitors. The common-mode voltage of the attenuator and the
VGA is controlled by an amplifier that uses the same midsupply
voltage derived in the LNA, permitting dc coupling of the LNA
to the VGA without introducing large offsets due to commonmode differences. However, any offset from the LNA becomes
amplified as the gain increases, producing an exponentially
increasing VGA output offset.
The input stages of the X-AMP are distributed along the ladder,
and a biasing interpolator, controlled by the gain interface, determines the input tap point. With overlapping bias currents, signals
from successive taps merge to provide a smooth attenuation range
from −42 dB to 0 dB. This circuit technique results in linear-in-dB
gain law conformance and low distortion levels—only deviating
±0.5 dB or less from the ideal. The gain slope is monotonic with
respect to the control voltage and is stable with variations in
process, temperature, and supply.
The X-AMP inputs are part of a programmable gain feedback
amplifier that completes the VGA. Its bandwidth is approximately
100 MHz. The input stage is designed to reduce feedthrough to
the output and to ensure excellent frequency response uniformity
across the gain setting.
Gain Control
The gain control interface, GAIN±, is a differential input. V
GAIN
varies the gain of all VGAs through the interpolator by selecting
the appropriate input stages connected to the input attenuator.
For GAIN− at 0.8 V, the nominal GAIN+ range for 28.5 dB/V is
0 V to 1.6 V, with the best gain linearity from about 0.16 V to
1.44 V, where the error is typically less than ±0.5 dB. For GAIN+
voltages greater than 1.44 V and less than 0.16 V, the error
increases. The value of GAIN+ can exceed the supply voltage
by 1 V without gain foldover.
Gain control response time is less than 750 ns to settle within 10%
of the final value for a change from minimum to maximum gain.
The GAIN+ and GAIN− pins can be interfaced in one of two
ways. Using a single-ended method, a Kelvin type of connection to ground can be used, as shown in Figure 60. For driving
multiple devices, it is preferable to use a differential method, as
shown in Figure 61. In either method, the GAIN+ and GAIN−
pins should be dc-coupled and driven to accommodate a 1.6 V
full-scale input.
–
POSTAMP
08180-053
Figure 59. Simplified VGA Schematic
Rev. 0 | Page 31 of 48
GAIN+
GAIN–
0.01µF
Figure 60. Single-Ended GAIN+, GAIN− Pin Configuration
100Ω
0.01µF
KELVIN
CONNECTION
50Ω
0V TO 1.6V DC
08180-054
Page 32

AD9276
GAIN+
GAIN–
Figure 61. Differential GAIN+, GAIN− Pin Configuration
100Ω
0.01µF
100Ω
0.01µF
±0.4V DC
AT 0.8V CM
±0.4V DC
AT 0.8V CM
499Ω
AD8138
499Ω
499Ω
0.8V CM
523Ω
AVDD2
31.3kΩ
±0.8V DC
50Ω
10kΩ
VGA Noise
In a typical application, a VGA compresses a wide dynamic
range input signal to within the input span of an ADC. The
input-referred noise of the LNA limits the minimum resolvable
input signal, whereas the output-referred noise, which depends
primarily on the VGA, limits the maximum instantaneous
dynamic range that can be processed at any one particular gain
control voltage. This latter limit is set in accordance with the
total noise floor of the ADC.
Output-referred noise as a function of GAIN+ is shown in
Figure 11, Figure 12, and Figure 14 for the short-circuit input
conditions. The input noise voltage is simply equal to the output
noise divided by the measured gain at each point in the control
range.
The output-referred noise is a flat 60 nV/√Hz (postamp gain =
24 dB) over most of the gain range because it is dominated by
the fixed output-referred noise of the VGA. At the high end of
the gain control range, the noise of the LNA and of the source
prevails. The input-referred noise reaches its minimum value
near the maximum gain control voltage, where the inputreferred contribution of the VGA is miniscule.
At lower gains, the input-referred noise and, therefore, the
noise figure, increase as the gain decreases. The instantaneous
dynamic range of the system is not lost, however, because the
input capacity increases as the input-referred noise increases.
The contribution of the ADC noise floor has the same dependence. The important relationship is the magnitude of the VGA
output noise floor relative to that of the ADC.
Gain control noise is a concern in very low noise applications.
Thermal noise in the gain control interface can modulate the
channel gain. The resultant noise is proportional to the output
signal level and is usually evident only when a large signal is
present. The gain interface includes an on-chip noise filter,
which significantly reduces this effect at frequencies above
5 MHz. Care should be taken to minimize noise impinging at
the GAIN± inputs. An external RC filter can be used to remove
V
source noise. The filter bandwidth should be sufficient to
GAIN
accommodate the desired control bandwidth.
Antialiasing Filter (AAF)
The filter that the signal reaches prior to the ADC is used to
reject dc signals and to band limit the signal for antialiasing.
Figure 62 shows the architecture of the filter.
The antialiasing filter is a combination of a single-pole highpass filter and a second-order low-pass filter. The high-pass
filter can be configured at a ratio of the low-pass filter cutoff.
This is selectable through the SPI.
The filter uses on-chip tuning to trim the capacitors and, in
08180-055
turn, to set the desired cutoff frequency and reduce variations.
The default −3 dB low-pass filter cutoff is 1/3 or 1/4.5 the ADC
sample clock rate. The cutoff can be scaled to 0.7, 0.8, 0.9, 1, 1.1,
1.2, or 1.3 times this frequency through the SPI. The cutoff
tolerance is maintained from 8 MHz to 18 MHz.
4kΩ
C
30C
30C
C = 0.8pF T O 5.1pF
n = 0 TO 7
Figure 62. Simplified Antialiasing Filter Schematic
4kΩ
10kΩ/n
4kΩ
4C
2kΩ
2kΩ
4kΩ
C
08180-056
Tuning is normally off to avoid changing the capacitor settings
during critical times. The tuning circuit is enabled and disabled
through the SPI. Initializing the tuning of the filter must be
performed after initial power-up and after reprogramming the
filter cutoff scaling or ADC sample rate. Occasional retuning
during an idle time is recommended to compensate for
temperature drift.
A total of eight SPI-programmable settings allows the user to
vary the high-pass filter cutoff frequency as a function of the
low-pass cutoff frequency. Two examples are shown in Table 11:
one is for an 8 MHz low-pass cutoff frequency, and the other is
for an 18 MHz low-pass cutoff frequency. In both cases, as the
ratio decreases, the amount of rejection on the low-end frequencies increases. Therefore, making the entire AAF frequency
pass band narrow can reduce low frequency noise or maximize
dynamic range for harmonic processing.
Table 11. SPI-Selectable High-Pass Filter Cutoff Options
High-Pass Cutoff Frequency
SPI Setting Ratio1
Low-Pass Cutoff
= 8 MHz
Low-Pass Cutoff
= 18 MHz
0 20.65 387 kHz 872 kHz
1 11.45 698 kHz 1.571 MHz
2 7.92 1.010 MHz 2.273 MHz
3 6.04 1.323 MHz 2.978 MHz
4 4.88 1.638 MHz 3.685 MHz
5 4.10 1.953 MHz 4.394 MHz
6 3.52 2.270 MHz 5.107 MHz
7 3.09 2.587 MHz 5.822 MHz
1
Ratio = low-pass filter cutoff frequency/high-pass filter cutoff frequency.
Rev. 0 | Page 32 of 48
Page 33

AD9276
V
*
V
V
ADC
The AD9276 uses a pipelined ADC architecture. The quantized
output from each stage is combined into a 12-bit result in the
digital correction logic. The pipelined architecture permits the
first stage to operate on a new input sample and the remaining
stages to operate on preceding samples. Sampling occurs on the
rising edge of the clock.
The output staging block aligns the data, corrects errors, and
passes the data to the output buffers. The data is then serialized
and aligned to the frame and output clocks.
CLOCK INPUT CONSIDERATIONS
For optimum performance, the AD9276 sample clock inputs
(CLK+ and CLK−) should be clocked with a differential signal.
This signal is typically ac-coupled into the CLK+ and CLK− pins
via a transformer or capacitors. These pins are biased internally
and require no additional bias.
Figure 63 shows the preferred method for clocking the AD9276.
A low jitter clock source, such as the Valpey Fisher oscillator
VFAC3-BHL−50 MHz, is converted from single-ended to differential using an RF transformer. The back-to-back Schottky
diodes across the secondary transformer limit clock excursions
into the AD9276 to approximately 0.8 V p-p differential. This
helps to prevent the large voltage swings of the clock from
feeding through to other portions of the AD9276, and it
preserves the fast rise and fall times of the signal, which are
critical to low jitter performance.
3.3
OUT
VFAC3
Figure 63. Transformer-Coupled Differential Clock
If a low jitter clock is available, another option is to ac-couple
a differential PECL signal to the sample clock input pins, as
shown in Figure 64. The AD951x family of clock drivers offers
excellent jitter performance.
3.3V
*
50Ω
VFAC3
OUT
*
50Ω RESISTOR IS O PTIONAL.
MINI-CIRCUI TS
0.1µF
50Ω
0.1µF
0.1µF
ADT1-1WT, 1:1Z
100Ω
AD951x FAMILY
CLK
PECL DRIVER
CLK
XFMR
0.1µF
0.1µF
0.1µF
SCHOTTKY
DIODES:
HSM2812
100Ω
240Ω240Ω
Figure 64. Differential PECL Sample Clock
0.1µF
0.1µF
CLK+
ADC
CLK–
CLK+
ADC
CLK–
8180-057
08180-058
3.3V
*
50Ω
VFAC3
OUT
50Ω RESISTOR I S OPTIONAL.
0.1µF
0.1µF
AD951x FAMILY
CLK
LVDS DRIVER
CLK
0.1µF
100Ω
0.1µF
CLK+
CLK–
ADC
08180-059
Figure 65. Differential LVDS Sample Clock
In some applications, it is acceptable to drive the sample clock
inputs with a single-ended CMOS signal. In such applications,
CLK+ should be driven directly from a CMOS gate, and the
CLK− pin should be bypassed to ground with a 0.1 F capacitor
in parallel with a 39 kΩ resistor (see Figure 66). Although the
CLK+ input circuit supply is AVDD1 (1.8 V), this input is
designed to withstand input voltages of up to 3.3 V, making the
selection of the drive logic voltage very flexible.
3.3
AD951x FAMILY
CLK
CMOS DRIVER
CLK
0.1µF
OPTIONAL
100Ω
39kΩ
0.1µF
CLK+
ADC
CLK–
50Ω
0.1µF
0.1µF
*
VFAC3
OUT
*
50Ω RESISTOR IS OPTIONAL.
Figure 66. Single-Ended 1.8 V CMOS Sample Clock
3.3
AD951x FAMILY
CLK
CMOS DRIVER
CLK
OPTI ONAL
100Ω
0.1µF
0.1µF
CLK+
ADC
CLK–
50Ω
0.1µF
0.1µF
*
VFAC3
OUT
*
50Ω RESISTOR IS O PTIONAL .
Figure 67. Single-Ended 3.3 V CMOS Sample Clock
Clock Duty Cycle Considerations
Typical high speed ADCs use both clock edges to generate a
variety of internal timing signals. As a result, these ADCs may
be sensitive to the clock duty cycle. Commonly, a 5% tolerance is
required on the clock duty cycle to maintain dynamic performance
characteristics. The AD9276 contains a duty cycle stabilizer (DCS)
that retimes the nonsampling edge, providing an internal clock
signal with a nominal 50% duty cycle. This allows a wide range
of clock input duty cycles without affecting the performance of
the AD9276. When the DCS is on, noise and distortion performance are nearly flat for a wide range of duty cycles. However,
some applications may require the DCS function to be off. If so,
keep in mind that the dynamic range performance can be affected
when operated in this mode. See Tabl e 18 for more details on
using this feature.
08180-060
08180-061
Rev. 0 | Page 33 of 48
Page 34

AD9276
G
The duty cycle stabilizer uses a delay-locked loop (DLL) to
create the nonsampling edge. As a result, any changes to the
sampling frequency require approximately eight clock cycles
to allow the DLL to acquire and lock to the new rate.
Clock Jitter Considerations
High speed, high resolution ADCs are sensitive to the quality of the
clock input. The degradation in SNR at a given input frequency (f
due only to aperture jitter (t
SNR Degradation = 20 × log10(1/2 × π × f
) can be calculated as follows:
J
× tJ)
A
A
In this equation, the rms aperture jitter represents the root mean
square of all jitter sources, including the clock input, analog input
signal, and ADC aperture jitter. IF undersampling applications
are particularly sensitive to jitter (see Figure 68).
The clock input should be treated as an analog signal in cases
where aperture jitter may affect the dynamic range of the AD9276.
Power supplies for clock drivers should be separated from the
ADC output driver supplies to avoid modulating the clock signal
with digital noise. Low jitter, crystal-controlled oscillators make
the best clock sources, such as the Valpey Fisher VFAC3 series.
If the clock is generated from another type of source (by gating,
dividing, or other methods), it should be retimed by the original
clock during the last step.
Refer to the AN-501 Application Note and the AN-756
Application Note for more in-depth information about how
jitter performance relates to ADCs (visit www.analog.com).
130
RMS CLOCK JIT TER REQUIREM ENT
120
110
100
90
80
SNR (dB)
70
10 BITS
60
8 BITS
50
40
30
1 10 100 1000
ANALOG INPUT FREQUENCY (MHz)
0.125ps
0.25ps
0.5ps
1.0ps
2.0ps
16 BITS
14 BITS
12 BITS
08180-062
Figure 68. Ideal SNR vs. Input Frequency and Jitter
Power Dissipation and Power-Down Mode
As shown in Figure 69 and Figure 70, the power dissipated by
the AD9276 is proportional to its sample rate. The digital power
dissipation does not vary significantly because it is determined
primarily by the DRVDD supply and the bias current of the
LVDS output dr ivers.
400
350
300
I
, 80MSPS SPEED GRADE
AVDD1
250
200
)
150
CURRENT (mA)
100
50
0
0
10 3020 40 50 60 70 80
I
AVDD1
SAMPLING FREQUENCY (MSPS)
Figure 69. Supply Current vs. f
220
215
210
205
200
195
190
185
POWER/CHANNEL (mW)
180
175
170
0
80MSPS SPEED GRADE
10 3020 5040 60 8070
SAMPLING FREQUENCY (MSPS)
Figure 70. Power per Channel vs. f
I
, 65MSPS SPEED GRADE
AVDD1
, 40MSPS SPEED GRADE
I
DRVDD
for fIN = 5 MHz
SAMPLE
65MSPS SPEED GRADE
40MSPS SPEED GRADE
for fIN = 5 MHz
SAMPLE
08180-063
08180-064
The AD9276 features scalable LNA bias currents (see Table 1 8,
Register 0x12). The default LNA bias current settings are high.
Figure 71 shows the typical reduction of AVDD2 current with
each bias setting. It is also recommended that the LNA offset be
adjusted using Register 0x10 (see Tabl e 18) when the LNA bias
setting is low.
HIGH
MID-HIGH
MID-LOW
LNA BIAS SETT IN
LOW
0 50 100 150 200 250 30 0 350 40 0
Figure 71. AVDD2 Current at Different LNA Bias Settings, f
TOTAL AVDD2 CURRENT (mA)
SAMPLE
= 40 MSPS
08180-065
Rev. 0 | Page 34 of 48
Page 35

AD9276
By asserting the PDWN pin high, the AD9276 is placed into
power-down mode. In this state, the device typically dissipates
5 mW. During power-down, the LVDS output drivers are placed
into a high impedance state. The AD9276 returns to normal
operating mode when the PDWN pin is pulled low. This pin
is both 1.8 V and 3.3 V tolerant.
By asserting the STBY pin high, the AD9276 is placed into a
standby mode. In this state, the device typically dissipates 175 mW.
During standby, the entire part is powered down except for the
internal references. The LVDS output drivers are placed into a
high impedance state. This mode is well suited for applications
that require power savings because it allows the device to be
powered down when not in use and then quickly powered up.
The time to power the device back up is also greatly reduced.
The AD9276 returns to normal operating mode when the STBY
pin is pulled low. This pin is both 1.8 V and 3.3 V tolerant.
In power-down mode, low power dissipation is achieved by
shutting down the reference, reference buffer, PLL, and biasing
networks. The decoupling capacitors on VREF are discharged
when entering power-down mode and must be recharged when
returning to normal operation. As a result, the wake-up time is
related to the time spent in the power-down mode: shorter cycles
result in proportionally shorter wake-up times. To restore the
device to full operation, approximately 0.5 ms is required when
using the recommended 1 µF and 0.1 µF decoupling capacitors
on the VREF pin and the 0.01 µF decoupling capacitors on the
GAIN± pins. Most of this time is dependent on the gain decoupling: higher value decoupling capacitors on the GAIN± pins
result in longer wake-up times.
A number of other power-down options are available when
using the SPI port interface. The user can individually power
down each channel or put the entire device into standby mode.
This allows the user to keep the internal PLL powered up when
fast wake-up times are required. The wake-up time is slightly
dependent on gain. To achieve a 1 µs wake-up time when the
device is in standby mode, 0.8 V must be applied to the GAIN±
pins. See
Table 18 for more details on using these features.
DIGITAL OUTPUTS AND TIMING
The AD9276 differential outputs conform to the ANSI-644
LVDS standard on default power-up. This can be changed to
a low power, reduced signal option similar to the IEEE 1596.3
standard via the SPI, using Register 0x14, Bit 6. This LVDS
standard can further reduce the overall power dissipation of
the device by approximately 36 mW.
The LVDS driver current is derived on chip and sets the output
current at each output equal to a nominal 3.5 mA. A 100 Ω
differential termination resistor placed at the LVDS receiver
inputs results in a nominal 350 mV swing at the receiver.
The AD9276 LVDS outputs facilitate interfacing with LVDS
receivers in custom ASICs and FPGAs that have LVDS capability
for superior switching performance in noisy environments.
Single point-to-point network topologies are recommended with
a 100 Ω termination resistor placed as close to the receiver as
possible. No far-end receiver termination and poor differential
trace routing may result in timing errors. It is recommended
that the trace length be no longer than 24 inches and that the
differential output traces be kept close together and at equal
lengths. An example of the FCO, DCO, and data stream with
proper trace length and position is shown in Figure 72.
CH1 500mV/DIV = DCO
CH2 500mV/DIV = DAT A
CH3 500mV/DIV = F CO
Figure 72. LVDS Output Timing Example in ANSI-644 Mode (Default)
5.0ns/DI V
08180-066
An example of the LVDS output using the ANSI-644 standard
(default) data eye and a time interval error (TIE) jitter histogram
with trace lengths less than 24 inches on regular FR-4 material
is shown in Figure 73. Figure 74 shows an example of the trace
lengths exceeding 24 inches on regular FR-4 material. Notice
that the TIE jitter histogram reflects the decrease of the data eye
opening as the edge deviates from the ideal position; therefore,
the user must determine whether the waveforms meet the timing
budget of the design when the trace lengths exceed 24 inches.
Additional SPI options allow the user to further increase the
internal termination (and therefore increase the current) of all
eight outputs in order to drive longer trace lengths (see Figure 75).
Even though this produces sharper rise and fall times on the
data edges, is less prone to bit errors, and improves frequency
distribution (see Figure 75), the power dissipation of the
DRVDD supply increases when this option is used.
In cases that require increased driver strength to the DCO± and
FCO± outputs because of load mismatch, the user can double the
drive strength by setting Bit 0 in Register 0x15. Note that this
feature cannot be used with Bits[5:4] in Register 0x15 because
these bits take precedence over this feature. See Table 18 for
more details.
Rev. 0 | Page 35 of 48
Page 36

AD9276
600
400
EYE: ALL BITS
ULS: 2398/2398
400
300
EYE: ALL BITS
ULS: 2399/2399
200
100
0
–100
–200
EYE DIAGRAM VO LTAGE (V)
–400
–600
–1.5ns –0. 5ns–1.0ns 0ns 0.5ns 1.0ns 1. 5ns
25
20
15
10
TIE JIT TER HIST OGRAM (Hi ts)
5
0
–200ps –100ps 0ps 100p s 200p s
08180-067
Figure 73. Data Eye for LVDS Outputs in ANSI-644 Mode with Trace Lengths
of Less Than 24 Inches on Standard FR-4
200
100
0
–100
–200
EYE DIAG RAM VOLTAG E (V)
–300
–400
–1.5ns –0. 5ns–1.0ns 0ns 0.5ns 1.0ns 1. 5ns
25
20
15
10
TIE JITTER HIST OGRAM (Hits)
5
0
–200ps –100ps 0ps 100ps 200p s
08180-068
Figure 74. Data Eye for LVDS Outputs in ANSI-644 Mode with Trace Lengths
of Greater Than 24 Inches on Standard FR-4
Rev. 0 | Page 36 of 48
Page 37

AD9276
600
EYE: ALL BITS
400
200
0
–200
EYE DIAGRAM VO LTAGE (V)
–400
–600
–1.5ns –0. 5ns–1.0ns 0ns 0.5ns 1.0ns 1. 5ns
25
20
15
10
TIE JIT TER HIST OGRAM (Hi ts)
5
0
–200ps –100ps 0ps 100ps 200p s
Figure 75. Data Eye for LVDS Outputs in ANSI-644 Mode with 100 Ω
Termination On and T race Lengths of Greater Than 24 Inches on Standard FR-4
ULS: 2396/2396
08180-069
The format of the output data is offset binary by default. Table 12
provides an example of the output coding format. To change the
output data format to twos complement, see the Memory Map
section.
Table 12. Digital Output Coding
(V
) − (V
Code
IN−
),
IN+
Input Span = 2 V p-p (V)
Digital Output
Offset Binary (D11 to D0)
4095 +1.00 1111 1111 1111
2048 0.00 1000 0000 0000
2047 −0.000488 0111 1111 1111
0 −1.00 0000 0000 0000
Data from each ADC is serialized and provided on a separate
channel. The data rate for each serial stream is equal to 12 bits
times the sample clock rate, with a maximum of 960 Mbps
(12 bits × 80 MSPS = 960 Mbps). The lowest typical conversion
rate is 10 MSPS, but the PLL can be set up for encode rates as
low as 5 MSPS via the SPI if lower sample rates are required for
a specific application. See Tab le 18 for details on enabling this
feature.
Rev. 0 | Page 37 of 48
Two output clocks are provided to assist in capturing data from
the AD9276. DCO± is used to clock the output data and is equal
to six times the sampling clock rate. Data is clocked out of the
AD9276 and must be captured on the rising and falling edges
of DCO±, which supports double data rate (DDR) capturing.
The frame clock output (FCO±) is used to signal the start of a
new output byte and is equal to the sampling clock rate. See the
timing diagram shown in Figure 2 for more information.
When using the serial port interface (SPI), the DCO± phase
can be adjusted in 60° increments relative to the data edge. This
enables the user to refine system timing margins if required. The
default DCO± timing, as shown in Figure 2, is 180° relative to
the output data edge.
An 8-, 10-, or 14-bit serial stream can also be initiated from the
SPI. This allows the user to implement different serial streams and
to test the device’s compatibility with lower and higher resolution
systems. When changing the resolution to an 8- or 10-bit serial
stream, the data stream is shortened. When using the 14-bit
option, the data stream stuffs two 0s at the end of the normal
12-bit serial data.
When using the SPI, all of the data outputs can also be inverted
from their nominal state by setting Bit 2 in the output mode
register (Address 0x14). This is not to be confused with inverting
the serial stream to an LSB first mode. In default mode, as shown
in Figure 2, the MSB is represented first in the data output serial
stream. However, this order can be inverted so that the LSB is
represented first in the data output serial stream (see Figure 3).
There are 12 digital output test pattern options available that
can be initiated through the SPI. This feature is useful when
validating receiver capture and timing. Refer to Tabl e 13 for the
output bit sequencing options available. Some test patterns have
two serial sequential words and can be alternated in various
ways, depending on the test pattern chosen. Note that some
patterns may not adhere to the data format select option. In
addition, custom user-defined test patterns can be assigned in
the user pattern registers (Address 0x19 through Address 0x1C).
All test mode options except PN sequence short and PN sequence
long can support 8- to 14-bit word lengths in order to verify
data capture to the receiver.
The PN sequence short pattern produces a pseudorandom
bit sequence that repeats itself every 2
9
− 1 bits, or 511 bits. A
description of the PN sequence short and how it is generated
can be found in Section 5.1 of the ITU-T O.150 (05/96) standard.
The only difference is that the starting value is a specific value
instead of all 1s (see Table 14 for the initial values).
Page 38

AD9276
Table 13. Flexible Output Test Modes
Output Test Mode
Bit Sequence Pattern Name Digital Output Word 1 Digital Output Word 2
0000 Off (default) N/A N/A N/A
0001 Midscale short 1000 0000 0000 Same Yes
0010 +Full-scale short 1111 1111 1111 Same Yes
0011 −Full-scale short 0000 0000 0000 Same Yes
0100 Checkerboard 1010 1010 1010 0101 0101 0101 No
0101 PN sequence long N/A N/A Yes
0110 PN sequence short N/A N/A Yes
0111 One-/zero-word toggle 1111 1111 1111 0000 0000 0000 No
1000 User input Register 0x19 and Register 0x1A Register 0x1B and Register 0x1C No
1001 1-/0-bit toggle 1010 1010 1010 N/A No
1010 1× sync 0000 0011 1111 N/A No
1011 One bit high 1000 0000 0000 N/A No
1100 Mixed bit frequency 1010 0011 0011 N/A No
The PN sequence long pattern produces a pseudorandom bit
sequence that repeats itself every 2
23
− 1 bits, or 8,388,607 bits.
A description of the PN sequence long and how it is generated
can be found in Section 5.6 of the ITU-T O.150 (05/96) standard.
The only differences are that the starting value is a specific value
instead of all 1s and that the AD9276 inverts the bit stream with
relation to the ITU-T standard (see Table 14 for the initial values).
Table 14. PN Sequence
Initial
Sequence
PN Sequence Short 0x0DF 0xDF9, 0x353, 0x301
PN Sequence Long 0x29B80A 0x591, 0xFD7, 0x0A3
Value
First Three Output Samples
(MSB First)
See the Memory Map section for information on how to change
these additional digital output timing features through the SPI.
SDIO Pin
This pin is required to operate the SPI. It has an internal 30 kΩ
pull-down resistor that pulls this pin low and is only 1.8 V
tolerant. If applications require that this pin be driven from a
3.3 V logic level, insert a 1 kΩ resistor in series with this pin to
limit the current.
SCLK Pin
This pin is required to operate the SPI port interface. It has an
internal 30 kΩ pull-down resistor that pulls this pin low and is
both 1.8 V and 3.3 V tolerant.
CSB Pin
This pin is required to operate the SPI port interface. It has an
internal 70 kΩ pull-up resistor that pulls this pin high and is
both 1.8 V and 3.3 V tolerant.
RBIAS Pin
To set the internal core bias current of the ADC, place a resistor
nominally equal to 10.0 kΩ to ground at the RBIAS pin. Using a
resistor other than the recommended 10.0 kΩ resistor for RBIAS
degrades the performance of the device. Therefore, it is imperative
that at least a 1% tolerance on this resistor be used to achieve
consistent performance.
Voltage Reference
A stable and accurate 0.5 V voltage reference is built into the
AD9276. This is gained up internally by a factor of 2, setting
VREF to 1.0 V, which results in a full-scale differential input span
of 2.0 V p-p for the ADC. VREF is set internally by default, but
the VREF pin can be driven externally with a 1.0 V reference to
achieve more accuracy. However, the AD9276 does not support
ADC full-scale ranges below 2.0 V p-p.
When applying the decoupling capacitors to the VREF pin,
use ceramic, low ESR capacitors. These capacitors should be
close to the reference pin and on the same layer of the PCB as
the AD9276. The VREF pin should have both a 0.1 µF capacitor
and a 1 µF capacitor connected in parallel to the analog ground.
These capacitor values are recommended for the ADC to
properly settle and acquire the next valid sample.
The reference settings can be selected using the SPI. The settings
allow two options: using the internal reference or using an
external reference. The internal reference option is the default
setting and has a resulting differential span of 2 V p-p.
Table 15. SPI-Selectable Reference Settings
Resulting
SPI-Selected Mode
External Reference N/A 2 × external reference
Internal Reference (Default) 1.0 2.0
VREF (V)
Subject to Data
Format Select
Resulting Differential
Span (V p-p)
Rev. 0 | Page 38 of 48
Page 39

AD9276
SERIAL PORT INTERFACE (SPI)
The AD9276 serial port interface allows the user to configure
the signal chain for specific functions or operations through a
structured register space provided inside the chip. The SPI
offers the user added flexibility and customization, depending
on the application. Addresses are accessed via the serial port
and can be written to or read from via the port. Memory is
organized into bytes that can be further divided into fields, as
documented in the Memory Map section. Detailed operational
information can be found in the Analog Devices, Inc., AN-877
Application Note, Interfacing to High Speed ADCs via SPI.
Three pins define the serial port interface, or SPI: SCLK, SDIO,
and CSB (see Table 16). The SCLK (serial clock) pin is used to
synchronize the read and write data presented to the device. The
SDIO (serial data input/output) pin is a dual-purpose pin that
allows data to be sent to and read from the internal memory map
registers of the device. The CSB (chip select bar) pin is an active
low control that enables or disables the read and write cycles.
Table 16. Serial Port Pins
Pin Function
SCLK
Serial clock. Serial shift clock input. SCLK is used to
synchronize serial interface reads and writes.
SDIO
Serial data input/output. Dual-purpose pin that
typically serves as an input or an output, depending
on the instruction sent and the relative position in
the timing frame.
CSB
Chip select bar (active low). This control gates the
read and write cycles.
The falling edge of CSB in conjunction with the rising edge of
SCLK determines the start of the framing sequence. During an
instruction phase, a 16-bit instruction is transmitted, followed
by one or more data bytes, which is determined by Bit Field W0
and Bit Field W1. An example of the serial timing and its definitions can be found in Figure 76 and Tabl e 17 .
t
HIGH
t
DH
t
LOW
t
CLK
Figure 76. Serial Timing Details
D5 D4 D3 D2 D1 D0
CSB
SCLK
SDIO
DON’T
CARE
DON’T
CARE
t
DS
t
S
R/W W1 W0 A12 A11 A10 A9 A8 A7
Table 17. Serial Timing Definitions
Parameter Timing (ns min) Description
tDS 5 Setup time between the data and the rising edge of SCLK
tDH 2 Hold time between the data and the rising edge of SCLK
t
40 Period of the clock
CLK
tS 5 Setup time between CSB and SCLK
tH 2 Hold time between CSB and SCLK
t
16 Minimum period that SCLK should be in a logic high state
HIGH
t
16 Minimum period that SCLK should be in a logic low state
LOW
t
10
EN_SDIO
Minimum time for the SDIO pin to switch from an input to an output relative to the SCLK falling
edge (not shown in Figure 76)
t
10
DIS_SDIO
Minimum time for the SDIO pin to switch from an output to an input relative to the SCLK rising
edge (not shown in Figure 76)
t
H
DON’T
CARE
DON’T
CARE
08180-072
Rev. 0 | Page 39 of 48
Page 40

AD9276
During normal operation, CSB is used to signal to the device
that SPI commands are to be received and processed. When
CSB is brought low, the device processes SCLK and SDIO to
execute instructions. Normally, CSB remains low until the
communication cycle is complete. However, if connected to a
slow device, CSB can be brought high between bytes, allowing
older microcontrollers enough time to transfer data into shift
registers. CSB can be stalled when transferring one, two, or three
bytes of data. When W0 and W1 are set to 11, the device enters
streaming mode and continues to process data, either reading
or writing, until CSB is taken high to end the communication
cycle. This allows complete memory transfers without the need
for additional instructions. Regardless of the mode, if CSB is taken
high in the middle of a byte transfer, the SPI state machine is
reset and the device waits for a new instruction.
In addition to the operation modes, the SPI port can be
configured to operate in different manners. For applications
that do not require a control port, the CSB line can be tied and
held high. This places the remainder of the SPI pins in their
secondary mode (see the AN-877 Application Note). CSB can
also be tied low to enable 2-wire mode. When CSB is tied low,
SCLK and SDIO are the only pins required for communication.
Although the device is synchronized during power-up, caution
must be exercised when using 2-wire mode to ensure that the
serial port remains synchronized with the CSB line. When
operating in 2-wire mode, it is recommended that a 1-, 2-, or
3-byte transfer be used exclusively. Without an active CSB line,
streaming mode can be entered but not exited.
In addition to word length, the instruction phase determines
whether the serial frame is a read or write operation, allowing
the serial port to be used to both program the chip and to read
the contents of the on-chip memory. If the instruction is a readback operation, performing a readback causes the serial data
input/output (SDIO) pin to change direction from an input to
an output at the appropriate point in the serial frame.
Data can be sent in MSB first mode or LSB first mode. MSB
first mode is the default at power-up and can be changed by
adjusting the configuration register. For more information
about this and other features, see the AN-877 Application Note,
Interfacing to High Speed ADCs via SPI.
HARDWARE INTERFACE
The pins described in Tabl e 16 constitute the physical interface
between the user’s programming device and the serial port of
the AD9276. The SCLK and CSB pins function as inputs when
using the SPI. The SDIO pin is bidirectional, functioning as an
input during write phases and as an output during readback.
If multiple SDIO pins share a common connection, ensure that
proper V
pins that can be connected together and the resulting V
assuming the same load for each AD9276.
This interface is flexible enough to be controlled by either serial
PROMs or PIC microcontrollers, providing the user with
an alternative method, other than a full SPI controller, for
programming the device (see the AN-812 Application Note).
levels are met. Figure 77 shows the number of SDIO
OH
1.800
1.795
1.790
1.785
1.780
1.775
1.770
1.765
1.760
(V)
1.755
OH
V
1.750
1.745
1.740
1.735
1.730
1.725
1.720
1.715
0302010 40 50 60 70 80 90 100
NUMBER OF SDIO PINS CONNECT ED TOGET HER
Figure 77. SDIO Pin Loading
OH
level,
08180-071
Rev. 0 | Page 40 of 48
Page 41

AD9276
MEMORY MAP
READING THE MEMORY MAP TABLE
Each row in the memory map register table has eight bit locations. The memory map is roughly divided into three sections:
the chip configuration register map (Address 0x00 to Address 0x02),
the device index and transfer register map (Address 0x04 to
Address 0xFF), and the program register map (Address 0x08
to Address 0x2D).
The leftmost column of the memory map indicates the register
address, and the default value is shown in the second rightmost
column. The Bit 7 (MSB) column is the start of the default
hexadecimal value given. For example, Address 0x09, the clock
register, has a default value of 0x01, meaning that Bit 7 = 0, Bit 6 =
0, Bit 5 = 0, Bit 4 = 0, Bit 3 = 0, Bit 2 = 0, Bit 1 = 0, and Bit 0 = 1,
or 0000 0001 in binary. This setting is the default for the duty
cycle stabilizer in the on condition. By writing a 0 to Bit 0 of this
address, followed by 0x01 in Register 0xFF (the transfer bit), the
duty cycle stabilizer is turned off. It is important to follow each
writing sequence with a transfer bit to update the SPI registers.
All registers except Register 0x00, Register 0x02, Register 0x04,
Register 0x05, and Register 0xFF are buffered with a master
slave latch and require writing to the transfer bit. For more
information on this and other functions, consult the AN-877
Application Note, Interfacing to High Speed ADCs via SPI.
RESERVED LOCATIONS
Undefined memory locations should not be written to except
when writing the default values suggested in this data sheet.
Addresses that have values marked as 0 should be considered
reserved and have a 0 written into their registers during power-up.
DEFAULT VALUES
After a reset, critical registers are automatically loaded with
default values. These values are indicated in Tabl e 18, where
an X refers to an undefined feature.
LOGIC LEVELS
An explanation of various registers follows: “bit is set” is
synonymous with “bit is set to Logic 1” or “writing Logic 1 for
the bit.” Similarly, “bit is cleared” is synonymous with “bit is set
to Logic 0” or “writing Logic 0 for the bit.”
Rev. 0 | Page 41 of 48
Page 42

AD9276
Table 18. AD9276 Memory Map Registers
Addr.
(Hex) Register Name
Chip Configuration Registers
0x00 chip_port_config 0 LSB first
0x01 chip_id Chip ID Bits[7:0]
0x02 chip_grade X X Child ID[5:4]
Device Index and Transfer Registers
0x04 device_index_2 X X X X Data
0x05 device_index_1 X X Clock
0xFF device_update X X X X X X X SW
Program Function Registers
0x08 modes X X X LNA
0x09 clock X X X X X X X DCS
0x0D test_io User test mode
0x0E GPO outputs X X X X General-purpose digital outputs 0x00 Values placed on
Bit 7
(MSB) Bit 6 Bit 5 Bit 4 Bit 3 Bit 2 Bit 1
1 = on
0 = off
(default)
00 = off (default)
01 = on, single
alternate
10 = on, single once
11 = on, alternate once
Soft
reset
1 = on
0 = off
(default)
(identify device
variants of chip ID)
00: Mode I
(40 MSPS) (default)
01: Mode II (65 MSPS)
10: Mode III (80 MSPS)
Channel
DCO±
1 = on
0 = off
(default)
Reset PN
long
gen
1 = on
0 = off
(default)
1 1 Soft
(AD9276 = 0x72, default)
Clock
Channel
FCO±
1 = on
0 = off
(default)
input
impedance
1 = 5 kΩ
0 = 15 kΩ
(default)
Reset PN
short
gen
1 = on
0 = off
(default)
Rev. 0 | Page 42 of 48
reset
1 = on
0 = off
(default)
X X X X 0x00 Child ID used to
Data
Channel
H
1 = on
(default)
0 = off
Data
Channel
D
1 = on
(default)
0 = off
0 Internal power-down mode
Output test mode—see Table 13
0000 = off (default)
0001 = midscale short
0010 = +FS short
0011 = −FS short
0100 = checkerboard output
0101 = PN sequence long
0110 = PN sequence short
0111 = one-/zero-word toggle
1000 = user input
1001 = 1-/0-bit toggle
1010 = 1× sync
1011 = one bit high
1100 = mixed bit frequency (format
determined by output_mode)
Channel
G
1 = on
(default)
0 = off
Data
Channel
C
1 = on
(default)
0 = off
000 = chip run (default)
001 = full power-down
010 = standby
011 = reset
100 = CW mode (TGC PDWN)
LSB first
1 = on
0 = off
(default)
Data
Channel
F
1 = on
(default)
0 = off
Data
Channel
B
1 = on
(default)
0 = off
Bit 0
(LSB)
0 0x18 Nibbles should be
Data
Channel
E
1 = on
(default)
0 = off
Data
Channel
A
1 = on
(default)
0 = off
transfer
1 = on
0 = off
(default)
1 = on
(default)
0 = off
Default
Value Comments
mirrored so that
LSB or MSB first
mode is set correctly regardless of
shift mode.
Default is unique
chip ID, different
for each device.
Read-only register.
differentiate ADC
speed power
modes.
0x0F Bits are set to
determine which
on-chip device
receives the next
write command.
0x0F Bits are set to
determine which
on-chip device
receives the next
write command.
0x00 Synchronously
transfers data
from the master
shift register to
the slave.
0x00 Determines
generic modes
of chip operation
(global).
0x01 Turns the internal
duty cycle stabilizer
(DCS) on and off
(global).
0x00 When this register
is set, the test data
is placed on the
output pins in
place of normal
data. (Local, except
for PN sequence.)
GPO[0:3] pins
(global).
Page 43

AD9276
Addr.
(Hex) Register Name
0x0F flex_channel_input Filter cutoff frequency control
0x10 flex_offset X X 6-bit LNA offset adjustment
0x11 flex_gain X X X X PGA gain
0x12 bias_current X X X X 1 X LNA bias
0x14 output_mode X 0 = LVDS
0x15 output_adjust X X Output driver
0x16 output_phase X X X X 0011 = output clock phase adjust
0x18 flex_vref X 0 =
Bit 7
(MSB) Bit 6 Bit 5 Bit 4 Bit 3 Bit 2 Bit 1
X X X X 0x30 Antialiasing filter
0000 = 1.3 × 1/3 × f
0001 = 1.2 × 1/3 × f
0010 = 1.1 × 1/3 × f
0011 = 1.0 × 1/3 × f
0100 = 0.9 × 1/3 × f
0101 = 0.8 × 1/3 × f
0110 = 0.7 × 1/3 × f
1000 = 1.3 × 1/4.5 × f
1001 = 1.2 × 1/4.5 × f
1010 = 1.1 × 1/4.5 × f
1011 = 1.0 × 1/4.5 × f
1100 = 0.9 × 1/4.5 × f
1101 = 0.8 × 1/4.5 × f
1110 = 0.7 × 1/4.5 × f
SAMPLE
SAMPLE
SAMPLE
SAMPLE
SAMPLE
SAMPLE
SAMPLE
SAMPLE
SAMPLE
SAMPLE
SAMPLE
SAMPLE
SAMPLE
SAMPLE
(default)
10 0000 for LNA bias high, mid-high, mid-low (default)
10 0001 for LNA bias low
LNA gain
00 = 21 dB
01 = 24 dB (default)
10 = 27 dB
11 = 30 dB
00 = 15.6 dB
01 = 17.9 dB
10 = 21.3 dB
(default)
00 = high (default)
01 = mid-high
10 = mid-low
11 = low
ANSI-644
(default)
1 = LVDS
low power,
(IEEE
X X X Output
invert
enable
1 = on
0 = off
(default)
Data format select
00 = offset binary
(default)
01 = twos
complement
1596.3
similar)
X X X DCO±
termination
00 = none (default)
01 = 200 Ω
10 = 100 Ω
11 = 100 Ω
(0000 through 1010)
(Default: 180° relative to data edge)
0000 = 0° relative to data edge
0001 = 60° relative to data edge
0010 = 120° relative to data edge
0011 = 180° relative to data edge
0100 = 240° relative to data edge
0101 = 300° relative to data edge
0110 = 360° relative to data edge
0111 = 420° relative to data edge
1000 = 480° relative to data edge
1001 = 540° relative to data edge
1010 = 600° relative to data edge
1011 to 1111 = 660° relative to data edge
X X X X X X 0x00 Select internal
internal
reference
1 =
external
reference
Bit 0
(LSB)
and
FCO±
2× drive
strength
1 = on
0 = off
(default)
Default
Value Comments
cutoff (global).
0x20 LNA force offset
correction
(local).
0x06 LNA and PGA gain
adjustment
(global).
0x08 LNA bias current
adjustment
(global).
0x00 Configures the
outputs and the
format of the data
(Bits[7:3] and
Bits[1:0] are global;
Bit 2 is local).
0x00 Determines LVDS
or other output
properties.
Primarily functions
to set the LVDS
span and
common-mode
levels in place of
an external resistor
(Bits[7:1] are global;
Bit 0 is local).
0x03 On devices that
utilize global
clock divide,
determines which
phase of the
divider output is
used to supply
the output clock.
Internal latching
is unaffected.
reference
(recommended
default) or
external reference
(global).
Rev. 0 | Page 43 of 48
Page 44

AD9276
Addr.
(Hex) Register Name
0x19 user_patt1_lsb B7 B6 B5 B4 B3 B2 B1 B0 0x00 User-Defined
0x1A user_patt1_msb B15 B14 B13 B12 B11 B10 B9 B8 0x00 User-Defined
0x1B user_patt2_lsb B7 B6 B5 B4 B3 B2 B1 B0 0x00 User-Defined
0x1C user_patt2_msb B15 B14 B13 B12 B11 B10 B9 B8 0x00 User-Defined
0x21 serial_control LSB first
0x22 serial_ch_stat X X X X X X Channel
0x2B flex_filter X Enable
0x2C analog_input X X X X X X LO-x, LOSW-x
0x2D CW Doppler
I/Q demodulator
phase
Bit 7
(MSB) Bit 6 Bit 5 Bit 4 Bit 3 Bit 2 Bit 1
1 = on
0 = off
(default)
X X X <10
MSPS,
low
encode
rate
mode
1 = on
Serial bit stream length
000 = 12 bits (default, normal
bit stream)
001 = 8 bits
010 = 10 bits
011 = 12 bits
100 = 14 bits
0 = off
(default)
output
reset
1 = on
0 = off
(default)
X X High-pass filter cutoff
automatic
low-pass
tuning
1 = on
(selfclearing)
0000 = f
0001 = f
0010 = f
0011 = f
0100 = f
0101 = f
0110 = f
0111 = f
/20.7
LP
/11.5
LP
/7.9
LP
/6.0
LP
/4.9
LP
/4.1
LP
/3.5
LP
/3.1
LP
connection
00 = (−)LNA output,
high-Z
01 = (−)LNA output,
(−)LNA output
10 = (−)LNA output,
(+)LNA output
11 = high-Z, high-Z
X X X CW
Doppler
channel
enable
1 = on
0 = off
I/Q demodulator phase
0000 = 0°
0001 = 22.5°
0010 = 45°
0011 = 67.5°
0100 = 90°
0101 = 112.5°
0110 = 135°
0111 = 157.5°
1000 = 180°
1001 = 202.5°
1010 = 225°
1011 = 247.5°
1100 = 270°
1101 = 292.5°
1110 = 315°
1111 = 337.5°
Bit 0
(LSB)
Channel
powerdown
1 = on
0 = off
(default)
Default
Value Comments
Pattern 1, LSB
(global).
Pattern 1, MSB
(global).
Pattern 2, LSB
(global).
Pattern 2, MSB
(global).
0x00 Serial stream
control (global).
0x00 Used to power
down individual
sections of a
converter (local).
0x00 Filter cutoff
(global).
(f
= low-pass
LP
filter cutoff
frequency.)
0x00 LNA active
termination/input
impedance
(global).
Phase of
demodulators
(local).
Rev. 0 | Page 44 of 48
Page 45

AD9276
APPLICATIONS INFORMATION
POWER AND GROUND RECOMMENDATIONS
When connecting power to the AD9276, it is recommended that
two separate 1.8 V supplies be used: one for analog (AVDD)
and one for digital (DRVDD). If only one 1.8 V supply is
available, it should be routed to the AVDD1 pin first and then
tapped off and isolated with a ferrite bead or a filter choke
preceded by decoupling capacitors for the DRVDD pin. The
user should employ several decoupling capacitors on all
supplies to cover both high and low frequencies. Locate these
capacitors close to the point of entry at the PCB level and close
to the part, with minimal trace lengths.
A single PCB ground plane should be sufficient when using the
AD9276. With proper decoupling and smart partitioning of the
analog, digital, and clock sections of the PCB, optimum performance can be easily achieved.
EXPOSED PADDLE THERMAL HEAT SLUG RECOMMENDATIONS
It is required that the exposed paddle on the underside of the
device be connected to analog ground to achieve the best electrical and thermal performance of the AD9276. An exposed
continuous copper plane on the PCB should mate to the AD9276
exposed paddle, Pin 0. The copper plane should have several vias
to achieve the lowest possible resistive thermal path for heat
dissipation to flow through the bottom of the PCB. These vias
should be solder-filled or plugged with nonconductive epoxy.
To maximize the coverage and adhesion between the device and
the PCB, partition the continuous copper plane into several uniform sections by overlaying a silkscreen or solder mask on the
PCB. This ensures several tie points between the AD9276 and
the PCB during the reflow process, whereas using one continuous
plane with no partitions guarantees only one tie point. See
Figure 78 for a PCB layout example. For detailed information
about packaging and for more PCB layout examples, see the
AN-772 Application Note, A Design and Manufacturing Guide
for the Lead Frame Chip Scale Package (LFCSP), at
www.analog.com.
SILKSCREEN PARTITION
PIN 1 INDICATOR
08180-070
Figure 78. Typical PCB Layout
Rev. 0 | Page 45 of 48
Page 46

AD9276
OUTLINE DIMENSIONS
0.75
0.60
0.45
1.20
MAX
16.00 BSC SQ
100
1
PIN 1
14.00 BSC SQ
76
76 100
75
75
1
1.05
1.00
0.95
0.15
SEATING
0.05
PLANE
VIEW A
ROTATED 90° CCW
0° MIN
0.08 MAX
COPLANARIT Y
0.20
0.09
3.5°
BOTTOM VIEW
0.50 BSC
LEAD PITCH
EXPOSED
PAD
(PINS UP)
0.27
0.22
0.17
TOP VIEW
(PINS DOWN)
51
7°
0°
25
26 50
VIEW A
COMPLIANT TO JEDEC STANDARDS MS-026-AED-HD
51
9.50 SQ
25
2650
FOR PROPER CONNECTION O F
THE EXPOSED PAD, REFER TO
THE PIN CONF IGURATIO N AND
FUNCTION DES CRIPTIONS
SECTION OF THIS DATA SHEET.
100908-A
Figure 79. 100-Lead Thin Quad Flat Package, Exposed Pad [TQFP_EP]
(SV-100-3)
Dimensions shown in millimeters
ORDERING GUIDE
Model Temperature Range Package Description Package Option
AD9276BSVZ
AD9276-65EBZ
AD9276-80KITZ
1
Z = RoHS Compliant Part.
1
1
−40°C to +85°C 100-Lead Thin Quad Flat Package, Exposed Pad [TQFP_EP] SV-100-3
Evaluation Board
1
Evaluation Board and High Speed FPGA-Based Data Capture Board
Rev. 0 | Page 46 of 48
Page 47

AD9276
NOTES
Rev. 0 | Page 47 of 48
Page 48

AD9276
NOTES
©2009 Analog Devices, Inc. All rights reserved. Trademarks and
registered trademarks are the property of their respective owners.
D08180-0-7/09(0)
Rev. 0 | Page 48 of 48
 Loading...