

Page 1
Low Noise,
–
A
Data Sheet
FEATURES
Low noise: 2.7 nV/√Hz @ f = 10 kHz
Low offset voltage: 250 μV max over V
Offset voltage drift: 0.4 μV/°C typ and 2.3 μV/°C max
Bandwidth: 28 MHz
Rail-to-rail input/output
Unity gain stable
2.7 V to 5.5 V operation
−40°C to +125°C operation
Qualified for automotive applications (AD8656)
APPLICATIONS
ADC and DAC buffers
Audio
Industrial controls
Precision filters
Digital scales
Automotive collision avoidance
PLL filters
GENERAL DESCRIPTION
CM
1
NC
IN
2
+IN
3
(Not to Scale)
V–
4
NC = NO CONNECT
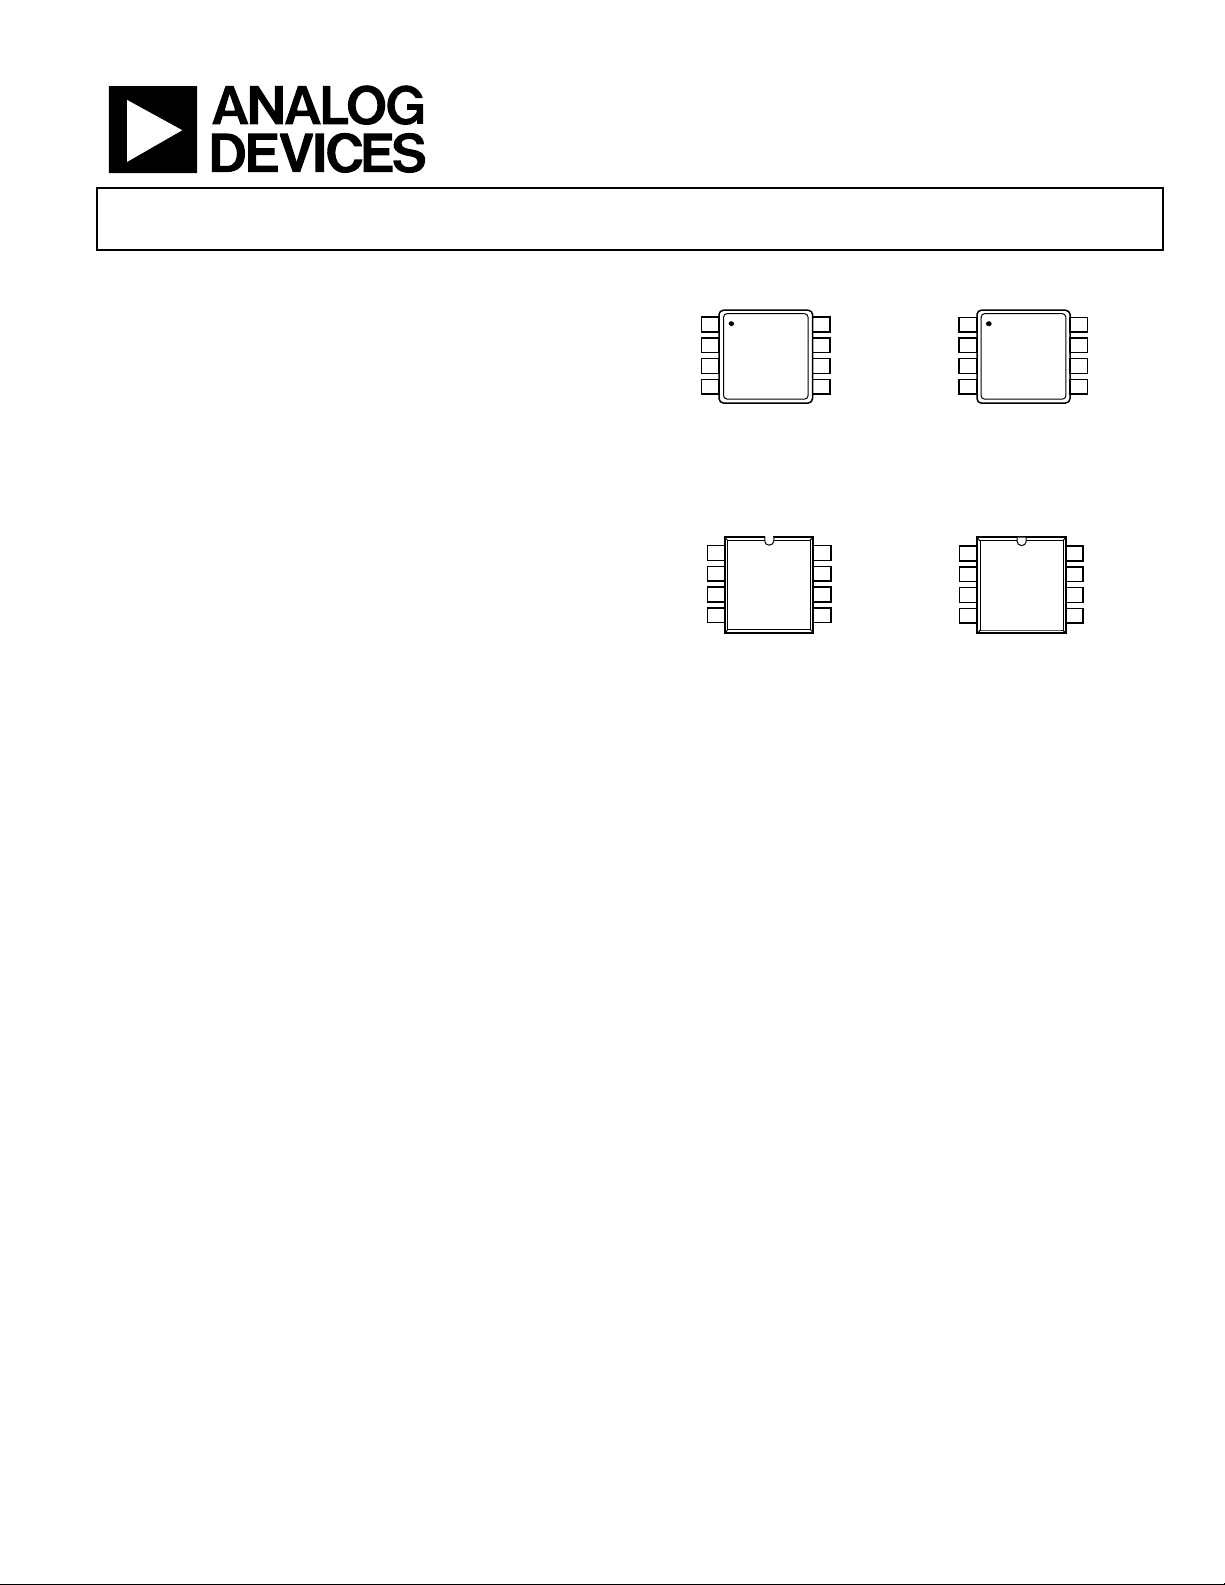
Figure 1. AD8655
8-Lead MSOP (RM-8)
NC
1
–IN
2
3
+IN
(Not to Scale)
4
V–
NC = NO CONNECT
Figure 3. AD8655
8-Lead SOIC (R-8)
Precision CMOS Amplifier
AD8655/AD8656
PIN CONFIGURATIONS
8
AD8655
TOP VIEW
AD8655
TOP VIEW
NC
V+
7
OUT
6
NC
5
05304-048
NC
8
V+
7
6
OUT
5
NC
05304-049
1
OUT
–IN A
2
+IN A
3
V–
4
Figure 2. AD8656
8-Lead MSOP (RM-8)
OUT A
1
2
–IN A
+IN A
3
V–
4
Figure 4. AD8656
8-Lead SOIC (R-8)
AD8656
TOP VIEW
(Not to Scale)
AD8656
TOP VIEW
(Not to Scale)
8
7
6
5
8
7
6
5
V+
OUT B
–IN B
+IN B
V+
OUT B
–IN B
+IN B
05304-059
05304-060
The AD8655/AD8656 are the industry’s lowest noise, precision
CMOS amplifiers. They leverage the Analog Devices DigiTrim®
technology to achieve high dc accuracy.
The AD8655/AD8656 provide low noise (2.7 nV/√Hz @ 10 kHz),
low THD + N (0.0007%), and high precision performance
(250 μV max over V
) to low voltage applications. The ability
CM
to swing rail-to-rail at the input and output enables designers
to buffer analog-to-digital converters (ADCs) and other wide
dynamic range devices in single-supply systems.
The high precision performance of the AD8655/AD8656
improves the resolution and dynamic range in low voltage
applications. Audio applications, such as microphone pre-amps
and audio mixing consoles, benefit from the low noise, low
distortion, and high output current capability of the AD8655/
AD8656 to reduce system level noise performance and maintain
audio fidelity. The high precision and rail-to-rail input and
output of the AD8655/AD8656 benefit data acquisition, process
controls, and PLL filter applications.
The AD8655/AD8656 are fully specified over the −40°C to
+125°C temperature range. The AD8655/AD8656 are available
in Pb-free, 8-lead MSOP and SOIC packages.
Rev. B
Information furnished by Analog Devices is believed to be accurate and reliable. However, no
responsibility is assumed by Analog Devi ces for its use, nor for any infringements of patents or other
rights of third parties that may result from its use. Specifications subject to change without notice. No
license is granted by implication or otherwise under any patent or patent rights of Analog Devices.
Trademarks and registered trademarks are the property of their respective owners.
One Technology Way, P.O. Box 9106, Norwood, MA 02062-9106, U.S.A.
Tel: 781.329.4700 www.analog.com
Fax: 781.461.3113 ©2005–2011 Analog Devices, Inc. All rights reserved.
Page 2

AD8655/AD8656
TABLE OF CONTENTS
Specifications..................................................................................... 3
Data Sheet
Driving Capacitive Loads.......................................................... 16
Absolute Maximum Ratings............................................................ 5
ESD Caution.................................................................................. 5
Typical Performance Characteristics............................................. 6
Theory of Operation ...................................................................... 15
Applications..................................................................................... 16
Input Overvoltage Protection................................................... 16
Input Capacitance....................................................................... 16
REVISION HISTORY
9/11—Rev. A to Rev. B
Changes to Features Section............................................................ 1
Updated Outline Dimensions....................................................... 19
Changes to Ordering Guide.......................................................... 19
Added Automotive Products Section .......................................... 19
6/05—Rev. 0 to Rev. A
Added AD8656 ...................................................................Universal
Added Figure 2 and Figure 4........................................................... 1
Changes to Specifications................................................................ 3
Changed Caption of Figure 12 and Added Figure 13.................. 7
Replaced Figure 16 ...........................................................................7
Changed Caption of Figure 37 and Added Figure 38................ 11
Replaced Figure 47 .........................................................................13
Added Figure 55.............................................................................. 14
Changes to Ordering Guide.......................................................... 18
Layout, Grounding, and Bypassing Considerations.................. 18
Power Supply Bypassing............................................................ 18
Grounding................................................................................... 18
Leakage Currents........................................................................ 18
Outline Dimensions .......................................................................19
Ordering Guide .......................................................................... 19
Automotive Products ................................................................. 19
4/05—Revision 0: Initial Version
Rev. B | Page 2 of 20
Page 3

Data Sheet
AD8655/AD8656
SPECIFICATIONS
VS = 5.0 V, VCM = VS/2, TA = 25°C, unless otherwise specified.
Table 1.
Parameter Symbol Conditions Min Typ Max Unit
INPUT CHARACTERISTICS
Offset Voltage VOS V
−40°C ≤ TA ≤ +125°C 550 μV
Offset Voltage Drift
ΔV
OS
/ΔT
Input Bias Current IB 1 10 pA
−40°C ≤ TA ≤ +125°C 500 pA
Input Offset Current IOS 10 pA
−40°C ≤ TA≤ +125°C 500 pA
Input Voltage Range 0 5 V
Common-Mode Rejection Ratio CMRR VCM = 0 V to 5 V 85 100 dB
Large Signal Voltage Gain AVO V
−40°C ≤ TA ≤ +125°C 95 dB
OUTPUT CHARACTERISTICS
Output Voltage High VOH I
Output Voltage Low VOL I
Output Current I
V
OUT
POWER SUPPLY
Power Supply Rejection Ratio PSRR VS = 2.7 V to 5.0 V 88 105 dB
Supply Current/Amplifier ISY V
−40°C ≤ TA ≤ +125°C 5.3 mA
INPUT CAPACITANCE CIN
Differential 9.3 pF
Common-Mode 16.7 pF
NOISE PERFORMANCE
Input Voltage Noise Density en f = 1 kHz 4
f = 10 kHz 2.7
Total Harmonic Distortion + Noise THD + N G = 1, RL = 1 kΩ, f = 1 kHz, VIN = 2 V p-p 0.0007 %
FREQUENCY RESPONSE
Gain Bandwidth Product GBP 28 MHz
Slew Rate SR RL = 10 kΩ 11 V/μs
Settling Time ts To 0.1%, VIN = 0 V to 2 V step, G = +1 370 ns
Phase Margin CL = 0 pF 69 degrees
= 0 V to 5 V 50 250 μV
CM
−40°C ≤ T
= 0.2 V to 4.8 V, RL = 10 kΩ, VCM = 0 V 100 110 dB
O
= 1 mA; −40°C ≤ TA ≤ +125°C 4.97 4.991 V
L
= 1 mA; −40°C ≤ TA ≤ +125°C 8 30 mV
L
OUT
= 0 V 3.7 4.5 mA
O
≤ +125°C 0.4 2.3 μV/°C
A
= ±0.5 V ±220 mA
nV/√Hz
nV/√Hz
Rev. B | Page 3 of 20
Page 4

AD8655/AD8656
Data Sheet
VS = 2.7 V, VCM = VS/2, TA = 25°C, unless otherwise specified.
Table 2.
Parameter Symbol Conditions Min Typ Max Unit
INPUT CHARACTERISTICS
Offset Voltage VOS V
= 0 V to 2.7 V 44 250 μV
CM
−40°C ≤ TA ≤ +125°C 550 μV
Offset Voltage Drift
ΔV
OS
/ΔT
−40°C ≤ T
≤ +125°C 0.4 2.0 μV/°C
A
Input Bias Current IB 1 10 pA
−40°C ≤ TA ≤ +125°C 500 pA
Input Offset Current IOS 10 pA
−40°C ≤ TA ≤ +125°C 500 pA
Input Voltage Range 0 2.7 V
Common-Mode Rejection Ratio CMRR VCM = 0 V to 2.7 V 80 98 dB
Large Signal Voltage Gain AVO V
= 0.2 V to 2.5 V, RL = 10 kΩ, VCM = 0 V 98 dB
O
−40°C ≤ TA ≤ +125°C 90 dB
OUTPUT CHARACTERISTICS
Output Voltage High VOH I
Output Voltage Low VOL I
Output Current I
V
OUT
= 1 mA; −40°C ≤ TA ≤ +125°C 2.67 2.688 V
L
= 1 mA; −40°C ≤ TA ≤ +125°C 10 30 mV
L
= ±0.5 V ±75 mA
OUT
POWER SUPPLY
Power Supply Rejection Ratio PSRR VS = 2.7 V to 5.0 V 88 105 dB
Supply Current/Amplifier ISY V
= 0 V 3.7 4.5 mA
O
−40°C ≤ TA ≤ +125°C 5.3 mA
INPUT CAPACITANCE CIN
Differential 9.3 pF
Common-Mode 16.7 pF
NOISE PERFORMANCE
Input Voltage Noise Density en f = 1 kHz 4.0
f = 10 kHz 2.7
nV/√Hz
nV/√Hz
Total Harmonic Distortion + Noise THD + N G = 1, RL = 1kΩ, f = 1 kHz, VIN = 2 V p-p 0.0007 %
FREQUENCY RESPONSE
Gain Bandwidth Product GBP 27 MHz
Slew Rate SR RL = 10 kΩ 8.5 V/μs
Settling Time ts To 0.1%, VIN = 0 to 1 V step, G = +1 370 ns
Phase Margin CL = 0 pF 54 degrees
Rev. B | Page 4 of 20
Page 5
Data Sheet
ABSOLUTE MAXIMUM RATINGS
Table 3.
Parameter Rating
Supply Voltage 6 V
Input Voltage VSS − 0.3 V to VDD + 0.3 V
Differential Input Voltage ±6 V
Output Short-Circuit Duration
to GND
Electrostatic Discharge (HBM) 3.0 kV
Storage Temperature Range
R, RM Packages
Junction Temperature Range
R, RM Packages
Lead Temperature
(Soldering, 10 sec)
Indefinite
−65°C to +150°C
−65°C to +150°C
260°C
AD8655/AD8656
Stresses above those listed under Absolute Maximum Ratings
may cause permanent damage to the device. This is a stress
rating only; functional operation of the device at these or any
other conditions above those indicated in the operational
section of this specification is not implied. Exposure to absolute
maximum rating conditions for extended periods may affect
device reliability.
Table 4.
Package Type θ
8-Lead MSOP (RM) 210 45 °C/W
8-Lead SOIC (R) 158 43 °C/W
1
θJA is specified for worst-case conditions; that is, θJA is specified for a device
soldered in the circuit board for surface-mount packages.
1
θJC Unit
JA
ESD CAUTION
ESD (electrostatic discharge) sensitive device. Electrostatic charges as high as 4000 V readily accumulate on
the human body and test equipment and can discharge without detection. Although this product features
proprietary ESD protection circuitry, permanent damage may occur on devices subjected to high energy
electrostatic discharges. Therefore, proper ESD precautions are recommended to avoid performance
degradation or loss of functionality.
Rev. B | Page 5 of 20
Page 6
AD8655/AD8656
TYPICAL PERFORMANCE CHARACTERISTICS
60
VS = ±2.5V
50
40
30
20
NUMBER OF AMPLIFIERS
10
Data Sheet
20
VS = ±2.5V
10
0
(μV)
OS
V
–10
–20
0
–150 –100 –50 0 50 100 150
(μV)
V
OS
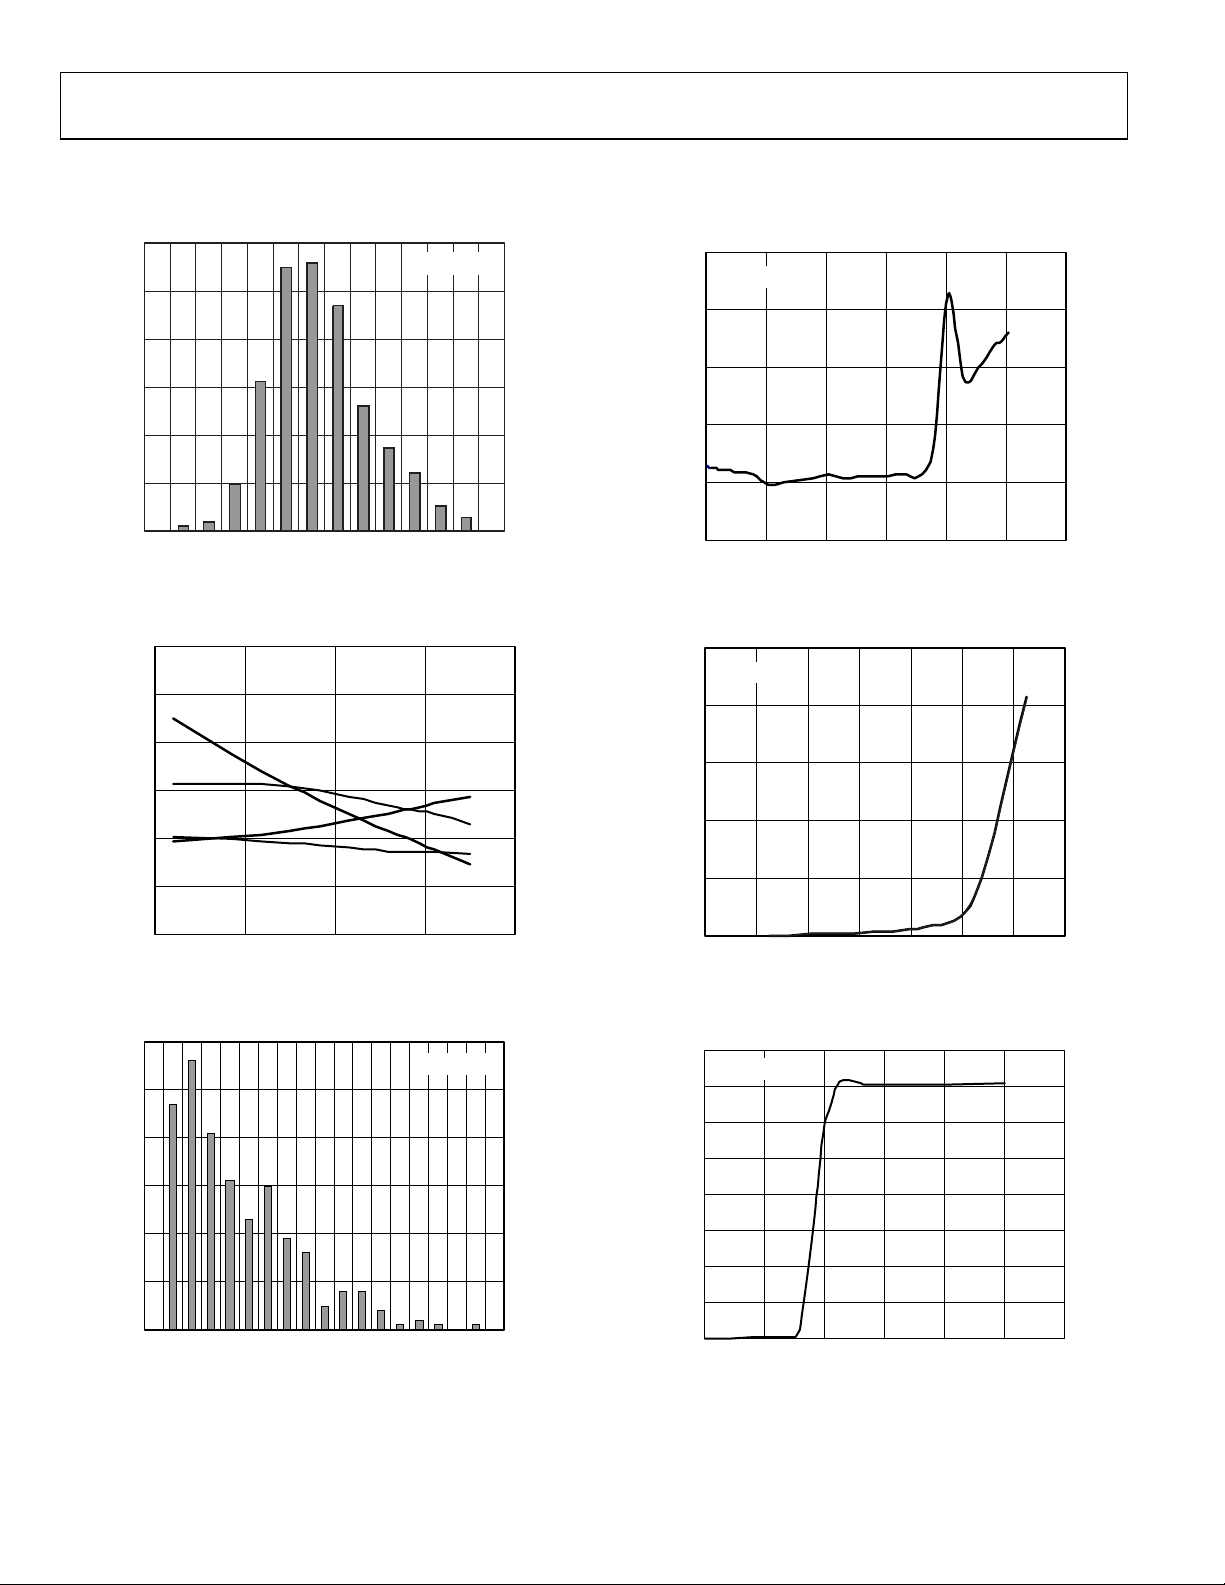
Figure 5. Input Offset Voltage Distribution
150.0
100.0
50.0
(μV)
0.0
OS
V
–50.0
–100.0
–150.0
–50 0 50
TEMPERATURE (°C)
Figure 6. Input Offset Voltage vs. Temperature
60
50
40
30
VS = ±2.5V
100 150
VS = ±2.5V
05304-001
05304-002
–30
01234
COMMON-MODE VOLTAGE (V)
Figure 8. Input Offset Voltage vs. Common-Mode Voltage
250
VS = ±2.5V
200
150
IB (pA)
100
50
0
0 20 40 60 80 100 120 140
TEMPERATURE (°C)
Figure 9. Input Bias Current vs. Temperature
4.0
VS = ±2.5V
3.5
3.0
2.5
2.0
56
05304-004
05304-005
20
NUMBER OF AMPLIFIERS
10
0
0 0.2 0.4 0.6 0.8 1.0 1.2
|TCV
Figure 7. |TC V
| (μV/°C)
OS
| Distribution
OS
1.4 1.6
05304-003
Rev. B | Page 6 of 20
1.5
SUPPLY CURRENT (mA)
1.0
0.5
0
012 34
SUPPLY VOLTAGE (V)
Figure 10. Supply Current vs. Supply Voltage
56
05304-006
Page 7

Data Sheet
4.5
VS = ±2.5V
4.0
3.5
3.0
(V)
OH
V
4.996
4.994
4.992
4.990
4.988
AD8655/AD8656
VS = ±2.5V
LOAD CURRENT = 1mA
SUPPLY CURRENT (mA)
2.5
2.0
–50 0 50
TEMPERATURE (°C)
100 150
Figure 11. Supply Current vs. Temperature
2500
VS = ±2.5V
2000
1500
V
OH
1000
V
OL
500
DELTA SWING FROM SUPPLY (mV)
0
0 50 100 150 200
CURRENT LOAD (mA)
250
Figure 12. AD8655 Output Voltage to Supply Rail vs. Current Load
10000
1000
VS = ±2.5V
05304-007
05304-008
4.986
4.984
4.982
–50 0 50
TEMPERATURE (°C)
100 150
Figure 14. Output Voltage Swing High vs. Temperature
12
LOAD CURRENT = 1mA
V
= ±2.5V
S
10
8
(mV)
OL
V
6
4
2
–50 0 50
TEMPERATURE (°C)
100 150
Figure 15. Output Voltage Swing Low vs. Temperature
120
100
80
VS = ±2.5V
= 28mV
V
IN
= 1MΩ
R
L
= 47pF
C
L
05304-009
05304-010
100
10
V
OL
DELTA SWING FROM SUPPLY (mV)
V
OH
1
0.1 1 10
CURRENT LOAD (mA)
Figure 13. AD8656 Output Swing vs. Current Load
100 1000
05304-056
Rev. B | Page 7 of 20
60
CMRR (dB)
40
20
0
100 1k 10k
Figure 16. CMRR vs. Fre quency
FREQUENCY (Hz)
100k 10M
1M
05304-011
Page 8

AD8655/AD8656
110.00
107.00
104.00
VS = ±2.5V
V
= 0V
CM
100
Hz 1/2)
√
Data Sheet
VS = ±2.5V
101.00
CMRR (dB)
98.00
95.00
92.00
–50 0 50
TEMPERATURE (°C)
Figure 17. Large Signal CMRR vs. Temperature
100
80
60
PSRR (dB)
40
20
0
100 1k 10k 100k 1M
+PSRR
–PSRR
FREQUENCY (Hz)
Figure 18. Small Signal PSSR vs. Frequency
110.00
108.00
VS = ±2.5V
100 150
VS = ±2.5V
V
= 50mV
IN
R
= 1M
Ω
L
CL = 47pF
10M 100M
05304-012
05304-013
10
VOLTAGE NOISE DENSITY (nV/
1
1 10 100 1k
FREQUENCY (Hz)
Figure 20. Voltage Noise Density vs. Frequency
VS = ±2.5V
Vn (p-p) = 1.23μV
1
500nV/DIV
1s/DIV
Figure 21. Low Frequency Noise (0.1 Hz to 10 Hz).
T
V
IN
V
OUT
VS = ±2.5V
C
= 50pF
L
GAIN = +1
10k 100k
05304-019
05304-020
106.00
2
PSRR (dB)
104.00
102.00
100.00
–50 0 50
Figure 19. Large Signal PSSR vs. Temperature
TEMPERATURE (°C)
100 150
05304-014
1V/DIV
20μs/DIV
Figure 22. No Phase Reversal
05304-021
Rev. B | Page 8 of 20
Page 9

Data Sheet
120
100
80
60
VS = ±2.5V
= 11.5pF
C
LOAD
PHASE MARGIN = 69°
–45
–90
AD8655/AD8656
6
5
4
VS = ±2.5V
V
= 5V
IN
G = +1
40
GAIN (dB)
20
0
–20
–40
10k 100k 1M
FREQUENCY (Hz)
10M 100M
Figure 23. Open-Loop Gain and Phase vs. Frequency
140.00
130.00
120.00
(dB)
VO
A
100.00
VS = ±2.5V
R
= 10kΩ
L
110.00
90.00
–50 0 50
TEMPERATURE (°C)
Figure 24. Large Signal Open-Loop Gain vs. Temperature
50
40
30
–225
100 150
VS = ±2.5V
R
= 1M
Ω
L
CL = 47pF
–135
–180
PHASE SHIFT (Degrees)
05304-015
05304-016
3
OUTPUT (V)
2
1
0
10k 100k 1M
FREQUENCY (Hz)
Figure 26. Maximum Output Swing vs. Frequency
VS = ±2.5V
C
= 100pF
L
GAIN = +1
V
= 4V
IN
2
(1V/DIV)
OUT
V
TIME (10μs/DIV)
Figure 27. Large Signal Response
T
VS = ±2.5V
C
= 100pF
L
G = +1
05304-018
10M
T
05304-022
20
10
0
CLOSED-LOOP GAIN (dB)
–10
–20
1k 10k 100k 1M
FREQUENCY (Hz)
Figure 25. Closed-Loop Gain vs. Frequency
2
(100mV/DIV)
OUT
V
10M 100M
05304-017
TIME (1μs/DIV)
05304-023
Figure 28. Small Signal Response
Rev. B | Page 9 of 20
Page 10

AD8655/AD8656
–
30
VS = ±2.5V
V
= 200mV
IN
25
20
15
OVERSHOOT %
10
5
–OS
+OS
100
VS = ±2.5V
G = +100
10
1
OUTPUT IMPEDANCE (Ω)
G = +10
Data Sheet
G = +1
0
0 50 100 150 200 250 300 350
CAPACITANCE (pF)
Figure 29. Small Signal Overshoot vs. Load Capacitance
300mV
0V
0V
–2.5V
T
V
IN
1
2
V
OUT
VS = ±2.5V
= 300mV
V
IN
GAIN = –10
RECOVERY TIME = 240ns
400ns/DIV
Figure 30. Negative Overload Recovery Time
T
1
0V
300mV
2.5V
V
IN
V
OUT
V
= ±2.5V
S
= 300mV
V
IN
GAIN = –10
RECOVERY TIME = 240ns
05304-024
05304-025
0.1
100 1k 10k 100k 1M 10M 100M
FREQUENCY (Hz)
Figure 32. Output Impedance vs. Frequency
80
70
60
50
40
30
NUMBER OF AMPLIFIERS
20
10
0
–150 –125 –100 –75 –50 –25 0
25 50 75 100 125 150
V
(μV)
OS
VS = ±1.35V
Figure 33. Input Offset Voltage Distribution
60
40
20
(μV)
OS
V
0
VS = ±1.35V
05304-027
05304-028
2
0V
400ns/DIV
05304-026
Figure 31. Positive Overload Recovery Time
–20
–40
–50 0 50 100 150
TEMPERATURE (°C)
Figure 34. Input Offset Voltage vs. Temperature
05304-029
Rev. B | Page 10 of 20
Page 11

Data Sheet
80
70
VS = ±1.35V
AD8655/AD8656
10000
VS =±1.35V
60
50
40
30
NUMBER OF AMPLIFIERS
20
10
0
0 0.2 0.4 0.6 0.8
4.5
VS = ±1.35V
4.0
3.5
3.0
SUPPLY CURRENT (mA)
2.5
|TCV
Figure 35. |TCV
1.0 1.2 1.4 1.6
| (μV/°C)
OS
| Distribution
OS
05304-030
1000
100
V
10
OL
DELTA OUTPUT FROM SUPPLY (mV)
1
0.1 1 10
V
OH
CURRENT LOAD (mA)
Figure 38. AD8656 Output Swing vs. Current Load
2.698
2.694
2.690
(V)
2.686
OH
V
2.682
2.678
VS = ±1.35V
LOAD CURRENT = 1mA
05304-057
100
2.0
–50 0 50 100 150
TEMPERATURE (°C)
Figure 36. Supply Current vs. Temperature
1400
VS = ±1.35V
1200
1000
800
) (mV)
OUT
-V
600
SY
(V
400
200
0
020406080
LOAD CURRENT (mA)
V
OH
V
OL
100 120
Figure 37. AD8655 Output Voltage to Supply Rail vs. Load Current
05304-031
05304-050
2.674
–50 0 50 100 150
TEMPERATURE (°C)
Figure 39. Output Voltage Swing High vs. Temperature
14
VS = ±1.35V
LOAD CURRENT = 1mA
12
10
8
(mV)
OL
V
6
4
2
–50 0 50 100 150
TEMPERATURE (°C)
Figure 40. Output Voltage Swing Low vs. Temperature
05304-032
05304-033
Rev. B | Page 11 of 20
Page 12

AD8655/AD8656
–
T
V
IN
V
OUT
2
1V/DIV
35
VS = ±1.35V
G = +1
C
= 50pF
L
30
25
20
15
OVERSHOOT %
10
5
VS = ±1.35V
V
= 200mV
IN
–OS
+OS
Data Sheet
(500mV/DIV)
V
OUT
2
Figure 41. No Phase Reversal
VS = ±1.35V
= 50pF
C
L
GAIN = +1
TIME (10μs/DIV)
Figure 42. Large Signal Response
T
20μs/DIV
T
VS = ±1.35V
= 100pF
C
L
GAIN = +1
05304-047
05304-042
0
0 50 100 150 200 250 300 350
CAPACITANCE (pF)
Figure 44. Small Signal Overshoot vs. Load Capacitance
T
200mV
0V
0V
–1.35V
1
2
V
IN
V
OUT
VS = ±1.35V
V
= 200mV
IN
GAIN = –10
RECOVERY TIME = 180ns
400ns/DIV
Figure 45. Negative Overload Recovery Time
T
1
0V
200mV
V
IN
VS = ±1.35V
= 200mV
V
IN
GAIN = –10
RECOVERY TIME = 200ns
05304-044
05304-045
(100mV/DIV)
V
OUT
2
TIME (1μs/DIV)
05304-043
Figure 43. Small Signal Response
1.35V
0V
V
2
OUT
400ns/DIV
Figure 46. Positive Overload Recovery Time
05304-046
Rev. B | Page 12 of 20
Page 13

Data Sheet
120
100
80
VS = ±1.35V
= 28mV
V
IN
= 1MΩ
R
L
= 47pF
C
L
120
100
AD8655/AD8656
VS = ±1.35V
C
= 11.5pF
LOAD
PHASE MARGIN = 54°
80
60
–45
–90
60
CMRR (dB)
40
20
0
100 1k 10k
Figure 47. CMRR vs. Fre quency
102.00
98.00
94.00
CMRR (dB)
90.00
86.00
–50 0 50
Figure 48. Large Signal CMRR vs. Temperature
100
80
60
+PSRR
–PSRR
FREQUENCY (Hz)
TEMPERATURE (°C)
100k 1M
VS = ±1.35V
100 150
VS = ±1.35V
= 50mV
V
IN
= 1MΩ
R
L
= 47pF
C
L
05304-034
05304-035
40
GAIN (dB)
20
0
–20
–40
10k 100k 1M
FREQUENCY (Hz)
10M 100M
Figure 50. Open-Loop Gain and Phase vs. Frequency
130.00
120.00
110.00
(dB)
VO
A
100.00
90.00
80.00
–50 0 50
TEMPERATURE (°C)
Figure 51. Large Signal Open-Loop Gain vs. Temperature
50
40
30
20
–135
–180
–225
VS = ±1.35V
R
= 10kΩ
L
100 150
VS = ±1.35V
R
= 1M
Ω
L
CL = 47pF
PHASE SHIFT (Degrees)
05304-036
05304-037
PSRR (dB)
40
20
0
100 1k 10k 100k
Figure 49. Small Signal PSSR vs. Frequency
FREQUENCY (Hz)
1M 100M10M
05304-040
Rev. B | Page 13 of 20
10
0
CLOSED-LOOP GAIN (dB)
–10
–20
1k 10k 100k 1M
FREQUENCY (Hz)
Figure 52. Closed-Loop Gain vs. Frequency
10M 100M
05304-038
Page 14

AD8655/AD8656
Data Sheet
3.0
2.5
VS = 1.35V
V
= 2.7V
IN
2.0
G = +1
NO LOAD
1.5
OUTPUT (V)
1.0
0.5
0
10k 100k 1M
FREQUENCY (Hz)
Figure 53. Maximum Output Swing vs. Frequency
1000
VS = ±1.35V
100
G = +100
10
G = +10
G = +1
10M
05304-039
0
–20
50mV p-p
–40
–60
–80
–100
CHANNEL SEPERATION (dB)
–120
–140
10 100 1k
+2.5V
V+
+
V
A
IN
V–
–
–2.5V
Figure 55. Channel Separation vs. Frequency
R1
10k
Ω
R2
100
V–
B
V
OUT
V+
10k
FREQUENCY (Hz)
100k 1M 10M 100M
VS =±2.5V
V
= 50mV
Ω
IN
05304-058
OUTPUT IMPEDANCE (Ω)
1
0.1
100 1k 10k 100k 1M 100M10M
FREQUENCY (Hz)
05304-041
Figure 54. Output Impedance vs. Frequency
Rev. B | Page 14 of 20
Page 15

Data Sheet
THEORY OF OPERATION
The AD8655/AD8656 amplifiers are voltage feedback, rail-torail input and output precision CMOS amplifiers, which operate
from 2.7 V to 5.0 V of power supply voltage. These amplifiers
use the Analog Devices DigiTrim technology to achieve a
higher degree of precision than is available from most CMOS
amplifiers. DigiTrim technology, used in a number of ADI
amplifiers, is a method of trimming the offset voltage of the
amplifier after it is packaged. The advantage of post-package
trimming is that it corrects any offset voltages caused by the
mechanical stresses of assembly.
AD8655/AD8656
The AD8655/AD8656 can be used in any precision op amp
application. The amplifier does not exhibit phase reversal for
common-mode voltages within the power supply. The
AD8655/AD8656 are great choices for high resolution data
acquisition systems with voltage noise of 2.7 nV/√Hz and
THD + Noise of –103 dB for a 2 V p-p signal at 10 kHz. Their
low noise, sub-pA input bias current, precision offset, and high
speed make them superb preamps for fast filter applications.
The speed and output drive capability of the AD8655/AD8656
also make them useful in video applications.
The AD8655/AD8656 are available in standard op amp pinouts,
making DigiTrim completely transparent to the user. The input
stage of the amplifiers is a true rail-to-rail architecture, allowing
the input common-mode voltage range of the amplifiers to
extend to both positive and negative supply rails. The openloop gain of the AD8655/AD8656 with a load of 10 kΩ is
typically 110 dB.
Rev. B | Page 15 of 20
Page 16

AD8655/AD8656
APPLICATIONS
INPUT OVERVOLTAGE PROTECTION
The internal protective circuitry of the AD8655/AD8656 allows
voltages exceeding the supply to be applied at the input. It is
recommended, however, not to apply voltages that exceed the
supplies by more than 0.3 V at either input of the amplifier. If a
higher input voltage is applied, series resistors should be used to
limit the current flowing into the inputs. The input current
should be limited to less than 5 mA.
The extremely low input bias current allows the use of larger
resistors, which allows the user to apply higher voltages at the
inputs. The use of these resistors adds thermal noise, which
contributes to the overall output voltage noise of the amplifier.
For example, a 10 kΩ resistor has less than 12.6 nV/√Hz of
thermal noise and less than 10 nV of error voltage at room
temperature.
INPUT CAPACITANCE
Along with bypassing and ground, high speed amplifiers can be
sensitive to parasitic capacitance between the inputs and ground.
For circuits with resistive feedback network, the total capacitance,
whether it is the source capacitance, stray capacitance on the
input pin, or the input capacitance of the amplifier, causes a
breakpoint in the noise gain of the circuit. As a result, a
capacitor must be added in parallel with the gain resistor to
obtain stability. The noise gain is a function of frequency and
peaks at the higher frequencies, assuming the feedback capacitor is selected to make the second-order system critically
damped. A few picofarads of capacitance at the input reduce
the input impedance at high frequencies, which increases the
amplifier’s gain, causing peaking in the frequency response or
oscillations. With the AD8655/AD8656, additional input
damping is required for stability with capacitive loads greater
than 200 pF with direct input to output feedback. See the
Driving Capacitive Loads section.
DRIVING CAPACITIVE LOADS
Although the AD8655/AD8656 can drive capacitive loads up to
500 pF without oscillating, a large amount of ringing is present
when operating the part with input frequencies above 100 kHz.
This is especially true when the amplifiers are configured in
positive unity gain (worst case). When such large capacitive
loads are required, the use of external compensation is highly
recommended. This reduces the overshoot and minimizes
ringing, which, in turn, improves the stability of the
AD8655/AD8656 when driving large capacitive loads.
Data Sheet
One simple technique for compensation is a snubber that
consists of a simple RC network. With this circuit in place,
output swing is maintained, and the amplifier is stable at all
gains. Figure 57 shows the implementation of a snubber, which
reduces overshoot by more than 30% and eliminates ringing.
Using a snubber does not recover the loss of bandwidth
incurred from a heavy capacitive load.
VS = ±2.5V
A
= 1
V
C
= 500pF
L
VOLTAGE (100mV/DIV)
TIME (2μs/DIV)
Figure 56. Driving Heavy Capacitive Loads Without Compensation
V
CC
+
V–
V+
–
+
–
200mV
Figure 57. Snubber Network
VS = ±2.5V
A
= 1
V
R
= 200Ω
S
= 500pF
C
S
C
= 500pF
L
VOLTAGE (100mV/DIV)
Figure 58. Driving Heavy Capacitive Loads Using a Snubber Network
500pF
V
EE
TIME (10μs/DIV)
200Ω
500pF
05304-052
05304-051
05304-053
Rev. B | Page 16 of 20
Page 17

Data Sheet
THD Readings vs. Common-Mode Voltage
Total harmonic distortion of the AD8655/AD8656 is well below
0.0007% with a load of 1 kΩ. This distortion is a function of the
circuit configuration, the voltage applied, and the layout, in
addition to other factors.
+2.5V
–
AD8655
+
–2.5V
V
IN
Figure 59. THD + N Test Circuit
V
OUT
R
L
05304-054
AD8655/AD8656
1.0
0.5
SWEEP 1:
= 2V p-p
V
IN
0.2
0.1
0.05
0.02
0.01
%
0.005
0.002
0.001
0.0005
0.0002
0.0001
= 10kΩ
R
L
SWEEP 2
SWEEP 1
20 100 1k 10k 80k50 500 5k 50k200 2k 20k
Hz
Figure 60. THD + Noise vs. Frequency
SWEEP 2:
V
= 2V p-p
IN
= 1kΩ
R
L
05304-055
Rev. B | Page 17 of 20
Page 18

AD8655/AD8656
LAYOUT, GROUNDING, AND BYPASSING CONSIDERATIONS
POWER SUPPLY BYPASSING
Power supply pins can act as inputs for noise, so care must be
taken to apply a noise-free, stable dc voltage. The purpose of
bypass capacitors is to create low impedances from the supply
to ground at all frequencies, thereby shunting or filtering most
of the noise. Bypassing schemes are designed to minimize the
supply impedance at all frequencies with a parallel combination
of capacitors with values of 0.1 μF and 4.7 μF. Chip capacitors
of 0.1 μF (X7R or NPO) are critical and should be as close as
possible to the amplifier package. The 4.7 μF tantalum capacitor
is less critical for high frequency bypassing, and, in most cases,
only one is needed per board at the supply inputs.
GROUNDING
A ground plane layer is important for densely packed PC
boards to minimize parasitic inductances. This minimizes
voltage drops with changes in current. However, an understanding of where the current flows in a circuit is critical to
implementing effective high speed circuit design. The length
of the current path is directly proportional to the magnitude
of parasitic inductances, and, therefore, the high frequency
impedance of the path. Large changes in currents in an
inductive ground return create unwanted voltage noise.
LEAKAGE CURRENTS
Poor PC board layout, contaminants, and the board insulator
material can create leakage currents that are much larger than
the input bias current of the AD8655/AD8656. Any voltage
differential between the inputs and nearby traces creates leakage
currents through the PC board insulator, for example, 1 V/100
GΩ = 10 pA. Similarly, any contaminants on the board can
create significant leakage (skin oils are a common problem).
To significantly reduce leakage, put a guard ring (shield) around
the inputs and input leads that are driven to the same voltage
potential as the inputs. This ensures there is no voltage potential
between the inputs and the surrounding area to create any
leakage currents. To be effective, the guard ring must be driven
by a relatively low impedance source and should completely
surround the input leads on all sides, above and below, by using
a multilayer board.
The charge absorption of the insulator material itself can also
cause leakage currents. Minimizing the amount of material
between the input leads and the guard ring helps to reduce the
absorption. Also, using low absorption materials, such as
Teflon® or ceramic, may be necessary in some instances.
Data Sheet
The length of the high frequency bypass capacitor leads is
critical, and, therefore, surface-mount capacitors are recommended. A parasitic inductance in the bypass ground trace
works against the low impedance created by the bypass
capacitor. Because load currents flow from the supplies, the
ground for the load impedance should be at the same physical
location as the bypass capacitor grounds. For larger value
capacitors intended to be effective at lower frequencies, the
current return path distance is less critical.
Rev. B | Page 18 of 20
Page 19

Data Sheet
OUTLINE DIMENSIONS
5.00(0.1968)
4.80(0.1890)
4.00 (0.1574)
3.80 (0.1497)
0.25 (0.0098)
0.10 (0.0040)
COPLANARITY
0.10
CONTROLLING DIMENSIONS ARE IN MILLIMETERS; INCH DIMENSIONS
(IN PARENTHESES)ARE ROUNDED-OFF MILLIMETER EQUIVALENTS FOR
REFERENCE ONLY AND ARE NOT APPROPRIATE FOR USE IN DESIGN.
85
1
1.27 (0.0500)
SEATING
PLANE
COMPLIANT TO JEDEC STANDARDS MS-012-AA
Figure 61. 8-Lead Standard Small Outline Package [SOIC_N]
Dimensions shown in millimeters and (inches)
6.20 (0.2441)
5.80 (0.2284)
4
BSC
0.51 (0.0201)
0.31 (0.0122)
Narrow Body (R-8)
1.75 (0.0688)
1.35 (0.0532)
8°
0°
0.25 (0.0098)
0.17 (0.0067)
0.50 (0.0196)
0.25 (0.0099)
1.27 (0.0500)
0.40 (0.0157)
45°
012407-A
3.20
3.00
2.80
PIN 1
IDENTIFIER
0.95
0.85
0.75
0.15
0.05
COPLANARITY
AD8655/AD8656
3.20
3.00
2.80
8
5
5.15
4.90
1
0.65 BSC
0.10
COMPLIANT TO JEDEC STANDARDS MO-187-AA
Figure 62. 8-Lead Mini Small Outline Package [MSOP]
4.65
4
15° MAX
6°
0°
0.23
0.09
0.40
0.25
1.10 MAX
(RM-8)
Dimensions shown in millimeters
0.80
0.55
0.40
10-07-2009-B
ORDERING GUIDE
1, 2
Model
AD8655ARZ −40°C to +125°C 8-Lead SOIC_N R-8
AD8655ARZ-REEL −40°C to +125°C 8-Lead SOIC_N R-8
AD8655ARZ-REEL7 −40°C to +125°C 8-Lead SOIC_N R-8
AD8655ARMZ-REEL −40°C to +125°C 8-Lead MSOP RM-8 A0D
AD8655ARMZ −40°C to +125°C 8-Lead MSOP RM-8 A0D
AD8656ARZ −40°C to +125°C 8-Lead SOIC_N R-8
AD8656ARZ-REEL −40°C to +125°C 8-Lead SOIC_N R-8
AD8656ARZ-REEL7 −40°C to +125°C 8-Lead SOIC_N R-8
AD8656ARMZ −40°C to +125°C 8-Lead MSOP RM-8 A0S
AD8656ARMZ-REEL −40°C to +125°C 8-Lead MSOP RM-8 A0S
AD8656WARMZ-REEL −40°C to +125°C 8-Lead MSOP RM-8 A0S
1
Z = RoHS Compliant Part.
2
W = Qualified for Automotive Applications.
Temperature
Range Package Description Package Option Branding
AUTOMOTIVE PRODUCTS
The AD8656W model is available with controlled manufacturing to support the quality and reliability requirements of automotive
applications. Note that these automotive models may have specifications that differ from the commercial models; therefore, designers
should review the Specifications section of this data sheet carefully. Only the automotive grade product shown is available for use in
automotive applications. Contact your local Analog Devices account representative for specific product ordering information and to
obtain the specific Automotive Reliability reports for this model.
.
Rev. B | Page 19 of 20
Page 20

AD8655/AD8656
NOTES
Data Sheet
©2005–2011 Analog Devices, Inc. All rights reserved. Trademarks and
registered trademarks are the property of their respective owners.
D05304-0-9/11(B)
Rev. B | Page 20 of 20
 Loading...