

Page 1
Programmable Gain
FEATURES
With no external resistors
Difference amplifier, gains of ½, 1, or 2
Single-ended amplifier: over 40 different gains
Set reference voltage at midsupply
Excellent ac specifications
15 MHz bandwidth
30 V/μs slew rate
High accuracy dc performance
0.08% maximum gain error
10 ppm/°C maximum gain drift
80 dB minimum CMRR (gain of 2)
10-lead MSOP package
Supply current: 2.6 mA
Supply range: ±2.5 V to ±18 V
APPLICATIONS
ADC driver
Instrumentation amplifier building blocks
Level translators
Automatic test equipment
High performance audio
Sine/cosine encoders
Precision Difference Amplifier
AD8271
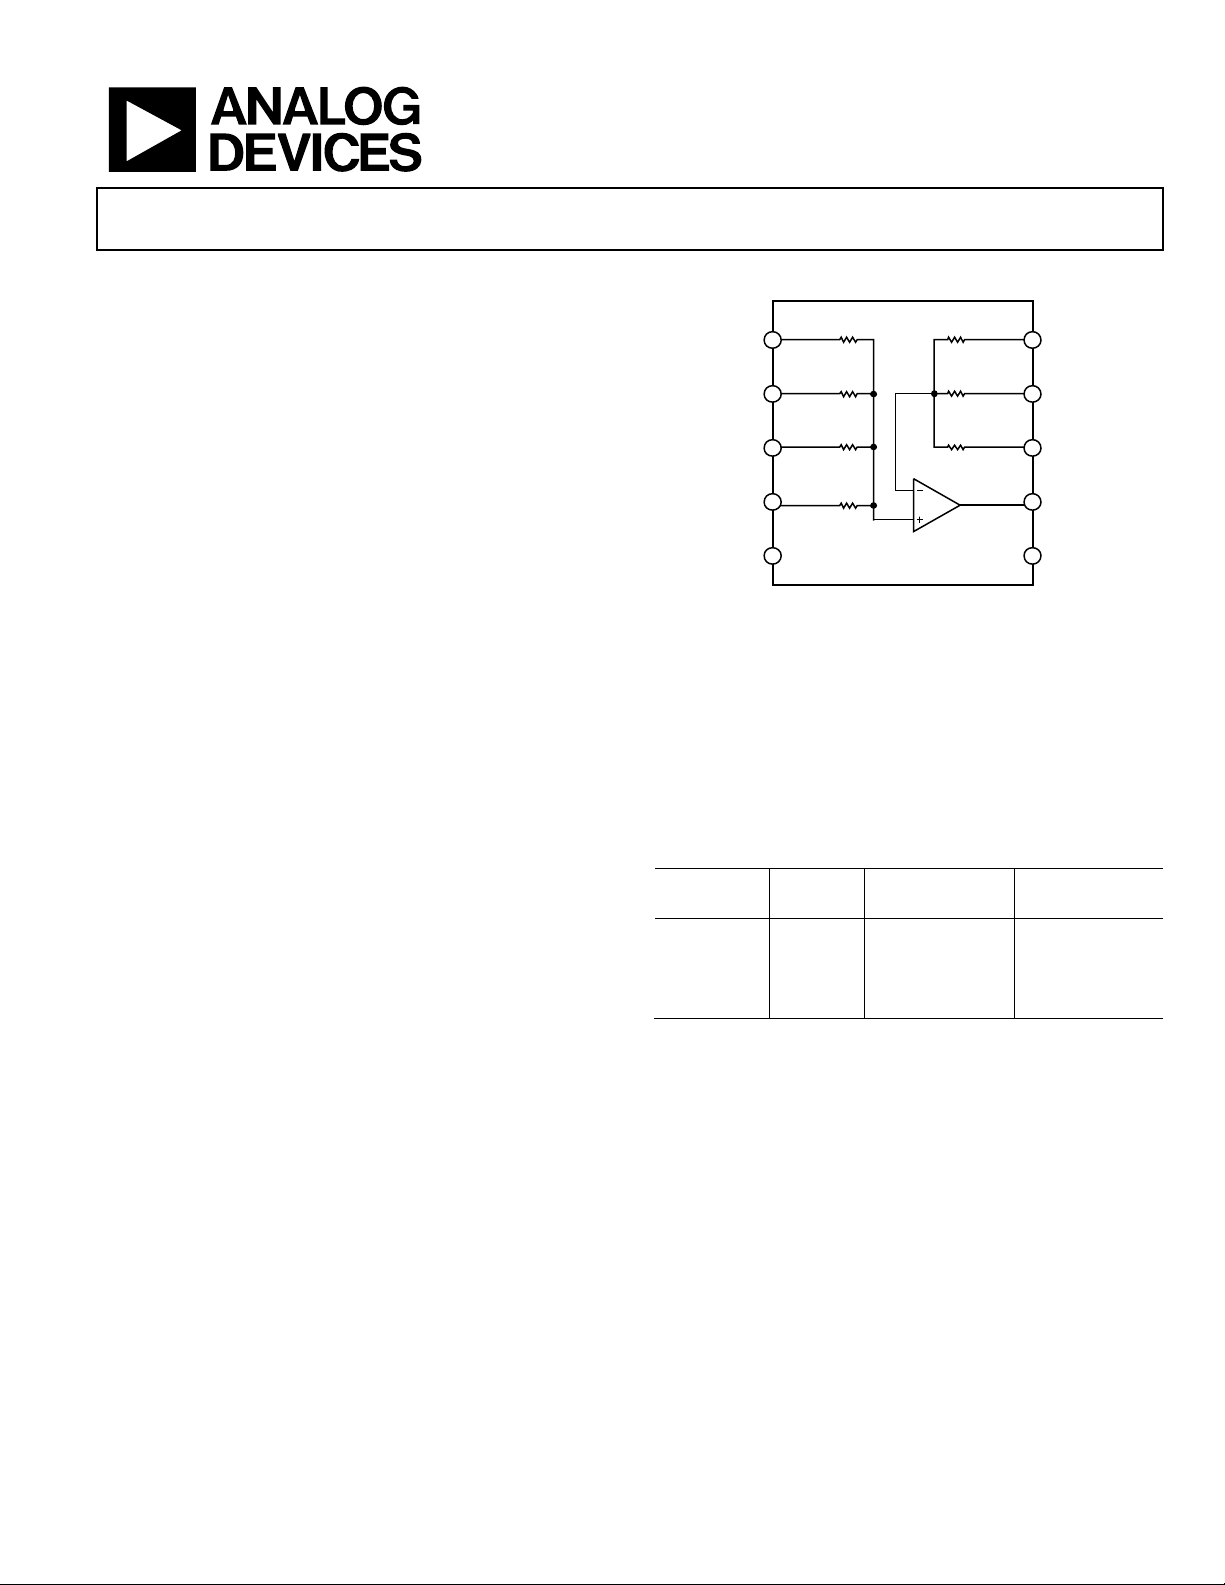
FUNCTIONAL BLOCK DIAGRAM
Figure 1.
10kΩ
10kΩ
10kΩ
10
N3
9
N2
N1
8
OUT
7
6
+V
S
07363-001
1
P1
2
P2
P3
3
4
P4
5
–V
S
10kΩ
10kΩ
20kΩ
20kΩ
AD8271
GENERAL DESCRIPTION
The AD8271 is a low distortion, precision difference amplifier
with internal gain setting resistors. With no external components,
it can be configured as a high performance difference amplifier
with gains of ½, 1, or 2. It can also be configured in over 40 singleended configurations, with gains ranging from −2 to +3.
The AD8271 comes in a 10-lead MSOP package. The AD8271
operates on both single and dual supplies and requires only a
2.6 mA maximum supply current. It is specified over the industrial
temperature range of −40°C to +85°C and is fully RoHS compliant.
For a dual channel version of the AD8271, see the AD8270
data sheet.
Table 1. Difference Amplifiers by Category
High
Speed
High
Voltage
Single-Supply
Unidirectional
Single-Supply
Bidirectional
AD8270 AD628 AD8202 AD8205
AD8273 AD629 AD8203 AD8206
AD8274 AD8216
AMP03
Rev. 0
Information furnished by Analog Devices is believed to be accurate and reliable. However, no
responsibility is assumed by Analog Devices for its use, nor for any infringements of patents or other
rights of third parties that may result from its use. Specifications subject to change without notice. No
license is granted by implication or otherwise under any patent or patent rights of Analog Devices.
Trademarks and registered trademarks are the property of their respective owners.
One Technology Way, P.O. Box 9106, Norwood, MA 02062-9106, U.S.A.
Tel: 781.329.4700 www.analog.com
Fax: 781.461.3113 ©2009 Analog Devices, Inc. All rights reserved.
Page 2

AD8271
TABLE OF CONTENTS
Features .............................................................................................. 1
Applications ....................................................................................... 1
Functional Block Diagram .............................................................. 1
General Description ......................................................................... 1
Revision History ............................................................................... 2
Specifications ..................................................................................... 3
Difference Amplifier Configurations ........................................ 3
Absolute Maximum Ratings ............................................................ 6
Thermal Resistance ...................................................................... 6
Maximum Power Dissipation ..................................................... 6
ESD Caution .................................................................................. 6
Pin Configuration and Function Description .............................. 7
Typical Performance Characteristics ............................................. 8
Operational Amplifier Plots ...................................................... 14
Theory of Operation ...................................................................... 15
Circuit Information .................................................................... 15
Driving the AD8271 ................................................................... 15
Power Supplies ............................................................................ 15
Input Voltage Range ................................................................... 15
Applications Information .............................................................. 16
Difference Amplifier Configurations ...................................... 16
Single-Ended Configurations ................................................... 17
Kelvin Measurement .................................................................. 18
Instrumentation Amplifier........................................................ 18
Driving Cabling .......................................................................... 19
Driving an ADC ......................................................................... 19
Outline Dimensions ....................................................................... 20
Ordering Guide .......................................................................... 20
REVISION HISTORY
1/09—Revision 0: Initial Version
Rev. 0 | Page 2 of 20
Page 3

AD8271
SPECIFICATIONS
DIFFERENCE AMPLIFIER CONFIGURATIONS
VS = ±5 to ±15 V, V
Table 2.
B Grade A Grade
Parameter Conditions Min Typ Max Min Typ Max Unit
DYNAMIC PERFORMANCE
Bandwidth 15 15 MHz
Slew Rate 30 30 V/μs
Settling Time to 0.01% VS = ±15, 10 V step on output 700 800 700 800 ns
V
Settling Time to 0.001% VS = ±15, 10 V step on output 750 900 750 900 ns
V
NOISE/DISTORTION
Harmonic Distortion + Noise
Voltage Noise1 f = 0.1 Hz to 10 Hz 1.5 1.5 μV p-p
f = 1 kHz 38 38 nV/√Hz
GAIN
Gain Error V
Gain Drift TA = −40°C to +85°C 1 2 1 10 ppm/°C
Gain Nonlinearity
INPUT CHARACTERISTICS
2
Offset
300 600 300 1000 μV
Average Temperature Drift TA = −40°C to +85°C 2 2 μV/°C
Common-Mode Rejection Ratio DC to 1 kHz 80 92 74 92 dB
Power Supply Rejection Ratio 2 10 2 10 μV/V
Input Voltage Range
Common-Mode Resistance
Bias Current Inputs grounded 500 500 nA
OUTPUT CHARACTERISTICS
Output Swing VS = ±15 −13.8 +13.8 −13.8 +13.8 V
V
V
V
Short-Circuit Current Limit Sourcing 100 100 mA
Sinking 60 60 mA
POWER SUPPLY
Supply Current 2.3 2.6 2.3 2.6 mA
T
1
Includes amplifier voltage and current noise, as well as noise of internal resistors.
2
Includes input bias and offset errors.
3
At voltages beyond the rails, internal ESD diodes begin to turn on. In some configurations, the input voltage range may be limited by the internal op amp (see the
4
Internal resistors, trimmed to be ratio matched, have ±20% absolute accuracy. Common-mode resistance was calculated with both inputs in parallel. The common-
mode impedance at only one input is 2× the resistance listed.
= 0 V, G = 1, R
REF
3
−V
4
10 10 kΩ
section for details). Input Voltage Range
= 2 kΩ, TA = 25°C, specifications referred to input (RTI), unless otherwise noted.
LOAD
= ±5, 5 V step on output 550 650 550 650 ns
S
= ±5, 5 V step on output 600 750 600 750 ns
S
= ±15, f = 1 kHz,
V
S
= 10 V p-p, R
V
OUT
= ±5, f = 1 kHz,
V
S
= 10 V p-p, R
V
OUT
= 10 V p-p 0.02 0.05 %
OUT
= 10 V p-p,
V
OUT
= 10 kΩ, 2 kΩ, 600 Ω
R
LOAD
= ±15, TA = −40°C to +85°C −13.7 +13.7 −13.7 +13.7 V
S
= ±5 −4 +4 −4 +4 V
S
= ±5, TA = −40°C to +85°C −3.9 +3.9 −3.9 +3.9 V
S
= −40°C to +85°C 3.2 3.2 mA
A
LOAD
LOAD
= 600 Ω
= 600 Ω
110 110 dB
141 141 dB
1 1 ppm
− 0.4 +VS + 0.4 −VS − 0.4 +VS + 0.4 V
S
Rev. 0 | Page 3 of 20
Page 4

AD8271
VS = ±5 to ±15 V, V
Table 3.
B Grade A Grade
Parameter Conditions Min Typ Max Min Typ Max Unit
DYNAMIC PERFORMANCE
Bandwidth 20 20 MHz
Slew Rate 30 30 V/μs
Settling Time to 0.01% VS = ±15, 10 V step on output 700 800 700 800 ns
V
Settling Time to 0.001% VS = ±15, 10 V step on output 750 900 750 900 ns
V
NOISE/DISTORTION
Harmonic Distortion + Noise
Voltage Noise1 f = 0.1 Hz to 10 Hz 2 2 μV p-p
f = 1 kHz 52 52 nV/√Hz
GAIN
Gain Error V
Gain Drift TA = −40°C to +85°C 0.5 2 1 10 ppm/°C
Gain Nonlinearity
INPUT CHARACTERISTICS
2
Offset
450 1000 450 1500 μV
Average Temperature Drift TA = −40°C to +85°C 3 3 μV/°C
Common-Mode Rejection Ratio DC to 1 kHz 74 86 70 86 dB
Power Supply Rejection Ratio 2 10 2 10 μV/V
Input Voltage Range
Common-Mode Resistance
Bias Current Inputs grounded 500 500 nA
OUTPUT CHARACTERISTICS
Output Swing VS = ±15 −13.8 +13.8 −13.8 +13.8 V
V
V
V
Short-Circuit Current Limit Sourcing 100 100 mA
Sinking 60 60 mA
POWER SUPPLY
Supply Current 2.3 2.6 2.3 2.6 mA
T
1
Includes amplifier voltage and current noise, as well as noise of internal resistors.
2
Includes input bias and offset errors.
3
At voltages beyond the rails, internal ESD diodes begin to turn on. In some configurations, the input voltage range may be limited by the internal op amp (see the
4
Internal resistors, trimmed to be ratio matched, have ±20% absolute accuracy. Common-mode resistance was calculated with both inputs in parallel. The common-
mode impedance at only one input is 2× the resistance listed.
= 0 V, G = ½, R
REF
3
−V
4
7.5 7.5 kΩ
section for details). Input Voltage Range
= 2 kΩ, TA = 25°C, specifications referred to input (RTI), unless otherwise noted.
LOAD
= ±5, 5 V step on output 550 650 550 650 ns
S
= ±5, 5 V step on output 600 750 600 750 ns
S
= ±15, f = 1 kHz,
V
S
= 10 V p-p, R
V
OUT
= ±5, f = 1 kHz,
V
S
= 10 V p-p, R
V
OUT
= 10 V p-p 0.04 0.08 %
OUT
= 10 V p-p,
V
OUT
= 10 kΩ, 2 kΩ, 600 Ω
R
LOAD
= ±15, TA = −40°C to +85°C −13.7 +13.7 −13.7 +13.7 V
S
= ±5 −4 +4 −4 +4 V
S
= ±5, TA = −40°C to +85°C −3.9 +3.9 −3.9 +3.9 V
S
= −40°C to +85°C 3.2 3.2 mA
A
LOAD
LOAD
= 600 Ω
= 600 Ω
74 74 dB
101 101 dB
200 200 ppm
− 0.4 +VS + 0.4 −VS − 0.4 +VS + 0.4 V
S
Rev. 0 | Page 4 of 20
Page 5

AD8271
VS = ±5 to ±15 V, V
Table 4.
B Grade A Grade
Parameter Conditions Min Typ Max Min Typ Max Unit
DYNAMIC PERFORMANCE
Bandwidth 10 10 MHz
Slew Rate 30 30 V/μs
Settling Time to 0.01% VS = ±15, 10 V step on output 700 800 700 800 ns
V
Settling Time to 0.001% VS = ±15, 10 V step on output 750 900 750 900 ns
V
NOISE/DISTORTION
Harmonic Distortion + Noise
Voltage Noise1 f = 0.1 Hz to 10 Hz 1 1 μV p-p
f = 1 kHz 26 26 nV/√Hz
GAIN
Gain Error V
Gain Drift TA = −40°C to +85°C 0.5 2 1 10 ppm/°C
Gain Nonlinearity
INPUT CHARACTERISTICS
2
Offset
225 500 225 750 μV
Average Temperature Drift TA = −40°C to +85°C 1.5 1.5 μV/°C
Common-Mode Rejection Ratio DC to 1 kHz 84 98 78 98 dB
Power Supply Rejection Ratio 2 10 2 10 μV/V
Input Voltage Range
Common-Mode Resistance
Bias Current Inputs grounded 500 500 nA
OUTPUT CHARACTERISTICS
Output Swing VS = ±15 −13.8 +13.8 −13.8 +13.8 V
V
V
V
Short-Circuit Current Limit Sourcing 100 100 mA
Sinking 60 60 mA
POWER SUPPLY
Supply Current 2.3 2.6 2.3 2.6 mA
T
1
Includes amplifier voltage and current noise, as well as noise of internal resistors.
2
Includes input bias and offset errors.
3
At voltages beyond the rails, internal ESD diodes begin to turn on. In some configurations, the input voltage range may be limited by the internal op amp (see the
4
Internal resistors, trimmed to be ratio matched, have ±20% absolute accuracy. Common-mode resistance was calculated with both inputs in parallel. The common-
mode impedance at only one input is 2× the resistance listed.
= 0 V, G = 2, R
REF
3
−V
4
7.5 7.5 kΩ
section for details). Input Voltage Range
= 2 kΩ, TA = 25°C, specifications referred to input (RTI), unless otherwise noted.
LOAD
= ±5, 5 V step on output 550 650 550 650 ns
S
= ±5, 5 V step on output 600 750 600 750 ns
S
= ±15, f = 1 kHz,
V
S
= 10 V p-p, R
V
OUT
= ±5, f = 1 kHz,
V
S
= 10 V p-p, R
V
OUT
= 10 V p-p 0.04 0.08 %
OUT
= 10 V p-p,
V
OUT
= 10 kΩ, 2 kΩ, 600 Ω
R
LOAD
= ±15, TA = −40°C to +85°C −13.7 +13.7 −13.7 +13.7 V
S
= ±5 −4 +4 −4 +4 V
S
= ±5, TA = −40°C to +85°C −3.9 +3.9 −3.9 +3.9 V
S
= −40°C to +85°C 3.2 3.2 mA
A
LOAD
LOAD
= 600 Ω
= 600 Ω
86 86 dB
112 112 dB
50 50 ppm
− 0.4 +VS + 0.4 −VS − 0.4 +VS + 0.4 V
S
Rev. 0 | Page 5 of 20
Page 6
AD8271
ABSOLUTE MAXIMUM RATINGS
Table 5.
Parameter Rating
Supply Voltage ±18 V
Output Short-Circuit Current
Input Voltage Range
See derating curve in
Figure 2
+ 0.4 V to
+V
S
−V
− 0.4 V
S
Storage Temperature Range −65°C to +130°C
Specified Temperature Range −40°C to +85°C
Package Glass Transition Temperature (TG) 150°C
ESD
Human Body Model 1 kV
Charge Device Model 1 kV
Machine Model 0.1 kV
Stresses above those listed under Absolute Maximum Ratings
may cause permanent damage to the device. This is a stress
rating only; functional operation of the device at these or any
other conditions above those indicated in the operational
section of this specification is not implied. Exposure to absolute
maximum rating conditions for extended periods may affect
device reliability.
THERMAL RESISTANCE
Table 6. Thermal Resistance
Package Type θJA θ
10-Lead MSOP 141.9 43.7 °C/W
The θJA values in Table 6 assume a 4-layer JEDEC standard
board with zero airflow.
Unit
JC
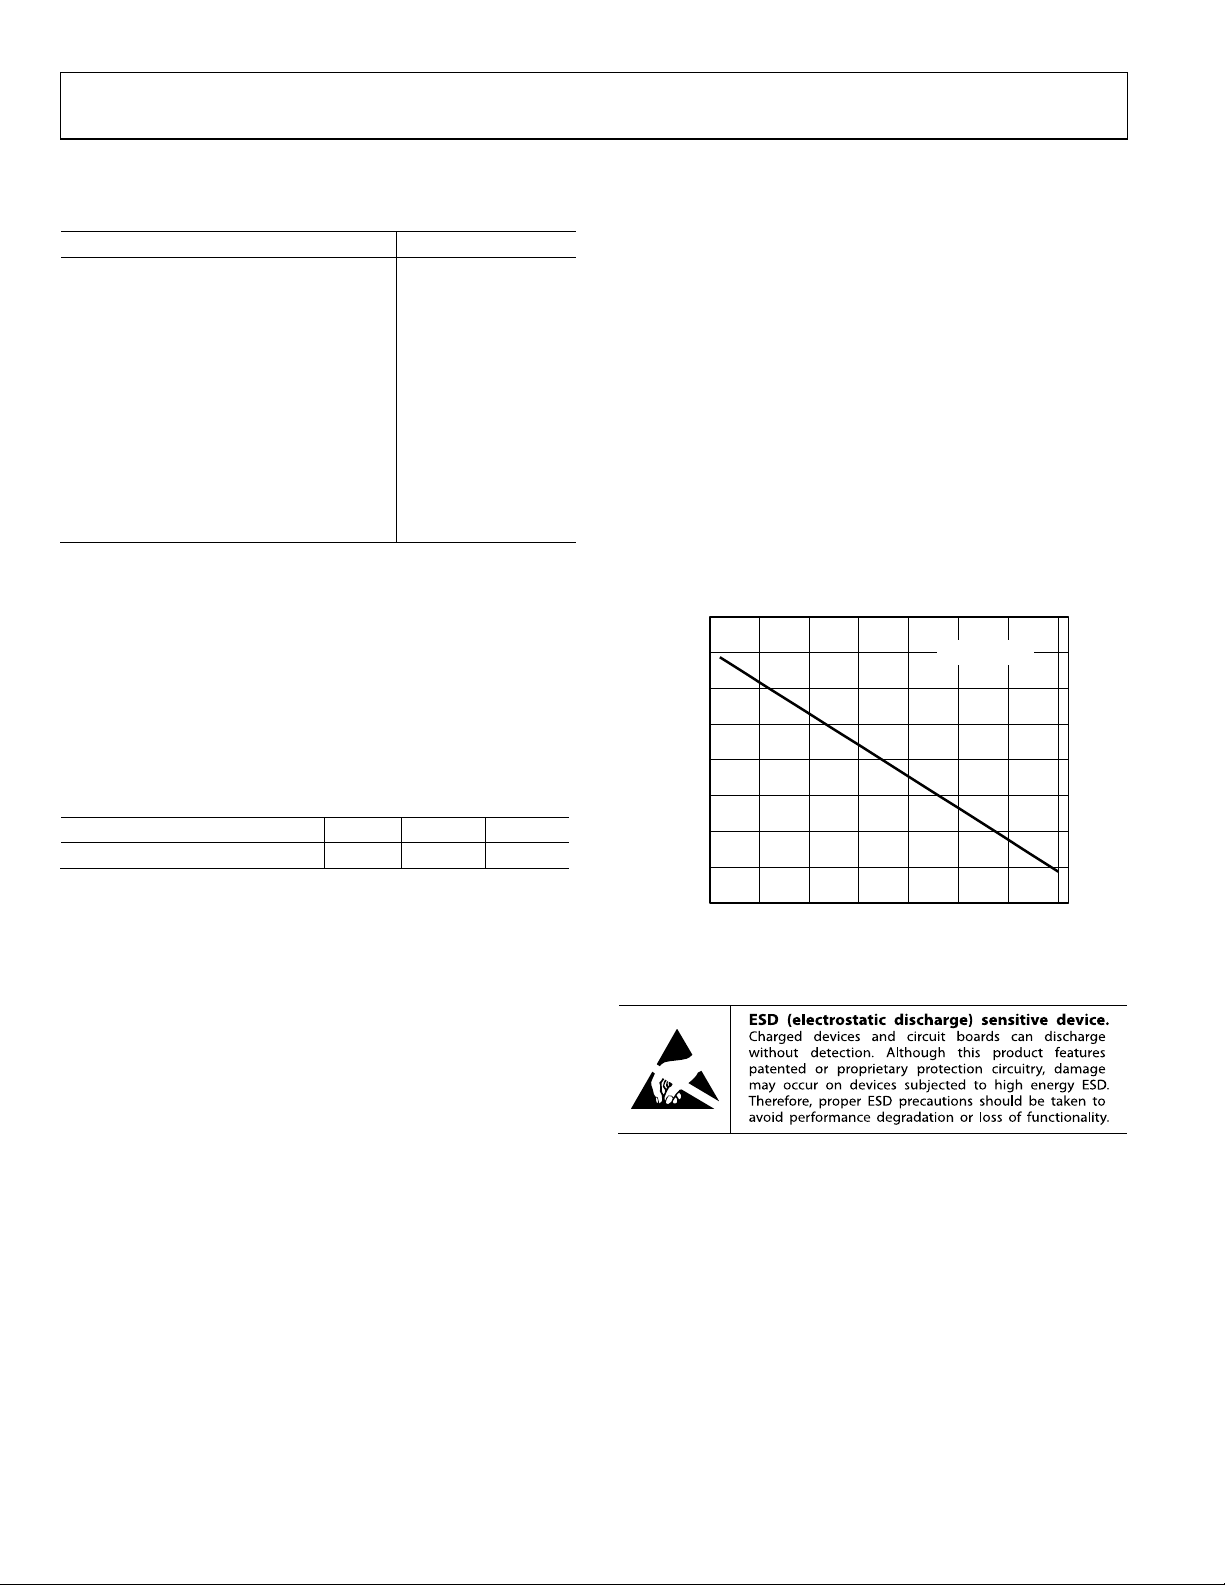
MAXIMUM POWER DISSIPATION
The maximum safe power dissipation for the AD8271 is limited
by the associated rise in junction temperature (T
approximately 150°C, which is the glass transition temperature,
the properties of the plastic change. Even temporarily exceeding
this temperature limit may change the stresses that the package
exerts on the die, permanently shifting the parametric performance of the amplifiers. Exceeding a temperature of 150°C for
an extended period of time can cause changes in silicon devices,
potentially resulting in a loss of functionality.
The AD8271 has built-in short-circuit protection that limits
the output current to approximately 100 mA (see Figure 22 for
more information). Although the short-circuit condition itself
does not damage the part, the heat generated by the condition
can cause the part to exceed its maximum junction temperature,
with corresponding negative effects on reliability.
1.6
1.4
1.2
1.0
0.8
0.6
0.4
MAXIMUM POWER DISSIPATION (W)
0.2
0
–50 –25 0 25 50 75 100 125
Figure 2. Maximum Power Dissipation vs. Ambient Temperature
AMBIENT TEMPERATURE (C)
TJ MAX = 150°C
) on the die. At
J
07363-102
ESD CAUTION
Rev. 0 | Page 6 of 20
Page 7

AD8271
PIN CONFIGURATION AND FUNCTION DESCRIPTION
1
P1
2
P2
AD8271
3
P3
TOP VIEW
(Not to Scale)
4
P4
5
–V
S
Figure 3.
Table 7. Pin Function Descriptions
Pin No. Mnemonic Description
1 P1 Noninverting Input. A 10 kΩ resistor is connected to the noninverting (+) terminal of the op amp.
2 P2 Noninverting Input. A 10 kΩ resistor is connected to the noninverting (+) terminal of the op amp.
3 P3
Noninverting Input. A 20 kΩ resistor is connected to the noninverting (+) terminal of the op amp. This pin
is used as a reference voltage input in many configurations.
4 P4
Noninverting Input. A 20 kΩ resistor is connected to the noninverting (+) terminal of the op amp. This pin
is used as a reference voltage input in many configurations.
5 −VS Negative Supply.
6 +VS Positive Supply.
7 OUT Output.
8 N1 Inverting Input. A 10 kΩ resistor is connected to the inverting (−) terminal of the op amp.
9 N2 Inverting Input. A 10 kΩ resistor is connected to the inverting (−) terminal of the op amp.
10 N3 Inverting Input. A 10 kΩ resistor is connected to the inverting (−) terminal of the op amp.
10
N3
9
N2
8
N1
7
OUT
6
+V
S
07363-002
Rev. 0 | Page 7 of 20
Page 8

AD8271
TYPICAL PERFORMANCE CHARACTERISTICS
VS = ±15 V, TA = 25°C, difference amplifier configuration, unless otherwise noted.
180
150
120
90
NUMBER OF UNIT S
60
30
0
–200 –100 0 100 200
CMMR (µV/V)
N = 989
MEAN = –29
SD = 43
Figure 4. Typical Distribution of CMRR, Gain = 1
180
150
120
N = 989
MEAN = –306
SD = 229
07363-107
70
GAIN = 1
60
50
40
30
20
10
CMRR (μV/V)
0
–10
–20
–30
–40
–50 –30 –10 10 30 50 70 90 110 130
REPRESENTATIVE SAMPLES
+0.6µV/V/°C
–0.1µV/V/°C
TEMPERATURE (°C)
Figure 7. CMRR vs. Temperature, Normalized at 25°C, Gain = 1
300
GAIN = 1
200
100
2.2µV/°C
07363-004
90
NUMBER OF UNITS
60
30
0
–1000 –500 0 500 1000
SYSTEM OFFSET VOLTAGE (µV)
Figure 5. Typical Distribution of System Offset, Gain = 1
07363-108
0
–100
SYSTEM OFFSET VOLTAGE (μV)
–200
REPRESENTATIVE SAMPLES
–300
–50–30–101030507090110130
TEMPERATURE (°C)
2.8µV/°C
Figure 8. System Offset vs. Temperature, Normalized at 25°C,
07363-005
Referred to Output, Gain = 1
240
210
180
150
120
NUMBER OF UNIT S
N = 1006
MEAN = 0.003
SD = 0.005
90
60
30
0
–0.04 –0.02 0 0.02 0.04
GAIN ERROR (%)
Figure 6. Typical Distribution of Gain Error, Gain = 1
07363-109
200
GAIN = 1
150
100
50
0
GAIN ERROR (μV/V)
–50
–100
–150
–50 –30 –10 10 30 50 70 90 110 130
REPRESENTATIVE SAMPLES
TEMPERATURE (°C)
1.7ppm/°C
0.5ppm/°C
Figure 9. Gain Error vs. Temperature, Normalized at 25°C, Gain = 1
07363-006
Rev. 0 | Page 8 of 20
Page 9

AD8271
VS = ±15 V, TA = 25°C, difference amplifier configuration, unless otherwise noted.
20
15
(–7.5, +7.5) (+7.5, +7.5)
10
5
0
(0, +15)
6
4
2
0
(–1.6, +1. 7 ) (+1.6, +1.7)
(0, +5)
(+4.3, + 2.85)(–4.3, +2.85)
(0, +2.5)
VS = ±2.5 VS = ±5
–5
–10
(–7.5, –7. 5) (+7.5, –7.5)
COMMON-MODE INPUT VOLTAGE (V)
–15
–20
–10 –5 0 5 10
(0, –15)
OUTPUT VOLTAGE (V)
Figure 10. Common-Mode Input Voltage vs. Output Voltage,
Gain = ½, ±15 V Supplies
6
4
(–2.5, +2.5) (+2.5, +2.5)
2
(–1.25, –1. 25) (+1.25, + 1.25)
0
(–1.25, –1. 25) (+1.25, – 1.25)
–2
(–2.5, –2. 5) (+2. 5, –2.5)
–4
COMMON-MODE I NPUT VOLTAGE (V)
–6
–3 –2 –1 0 1 2 3
(0, +5)
(0, +2.5)
VS = ±2.5 VS = ±5
(0, –2.5)
(0, –5)
OUTPUT VO LTAGE (V)
Figure 11. Common-Mode Input Voltage vs. Output Voltage,
Gain = ½, ±5 V and ±2.5 V Supplies
–2
–4
COMMON-MODE INPUT VOLTAGE (V)
–6
07363-007
(–1.6, –1.7) (+1. 6, –1. 7)
(–4.3, +2.85)
(–4.3, –2.85) (+4.3, –2.85)
–5 –4 –3 –2 –1 0 1 2 3 4 5
(0, –2.5)
(0, –5)
OUTPUT VO LTAGE (V)
07363-010
Figure 13. Common-Mode Input Voltage vs. Output Voltage,
Gain = 1, ±5 V and ±2.5 V Supplies
20
15
(–14.3, + 11.4)
10
5
0
–5
–10
COMMON-MODE INPUT VOLTAGE (V)
–15
–20
–20 –15 –10 –5 0 5 10 15 20
7363-008
(0, +15)
(0, –15)
OUTPUT VOLTAGE (V)
(+14.3, +11.4)
(+14.3, – 11.4)(–14.3, –11.4)
7363-011
Figure 14. Common-Mode Input Voltage vs. Output Voltage,
Gain = 2, ±15 V Supplies
20
15
(–14.3, +7.85) (+14.3, + 7.85)
10
5
0
–5
–10
(–14.3, –7. 85) (+14.3, –7.85)
COMMON-MO DE I NPUT V O L T AG E (V)
–15
–20
–20 –15 –10 –5 0 5 10 15 20
(0, +15)
(0, –15)
OUTPUT VOLTAGE (V)
Figure 12. Common-Mode Input Voltage vs. Output Voltage,
Gain =1, ±15 V Supplies
07363-009
Rev. 0 | Page 9 of 20
6
(–4, +4) (+4, +4)
4
2
0
–2
–4
COMMON-MODE INPUT VOLTAGE (V)
–6
(–1.6, +2.1) (+1.6, +2. 1)
(–1.6, –2.1) (+1. 6, –2. 1)
(–4, –4) (+4, –4)
–5 –4 –3 –2 –1 0 1 2 3 4 5
(0, +5)
(0, +2.5)
VS = ±2.5 VS = ±5
(0, –2.5)
(0, –5)
OUTPUT VO LTAGE (V)
Figure 15. Common-Mode Input Voltage vs. Output Voltage,
Gain = 2, ±5 V and ±2.5 V Supplies
07363-012
Page 10

AD8271
VS = ±15 V, TA = 25°C, difference amplifier configuration, unless otherwise noted.
10
GAIN = 2
5
140
120
GAIN = 2,½
0
–5
GAIN (dB)
–10
–15
–20
100 1k 10k 100k 1M 10M 100M
GAIN = 1
GAIN =½
FREQUENCY (Hz)
Figure 16. Gain vs. Frequency
100
GAIN = 2,½
90
80
GAIN = 1
70
60
50
40
CMRR (dB)
30
20
10
0
10 100 1k 10k 100k 1M 10M
FREQUENCY (Hz)
Figure 17. CMRR vs. Frequency
100
GAIN = 1
80
60
POSITIVE PSRR (dB)
40
20
0
07363-018
10 100 1k 10k 100k 1M
FREQUENCY (Hz)
07363-015
Figure 19. Positive PSRR vs. Frequency
140
GAIN = 2,½
120
GAIN = 1
100
80
60
NEGATIVE P SRR ( dB)
40
20
0
10 100 1k 10k 100k 1M
07363-019
FREQUENCY (Hz)
07363-016
Figure 20. Negative PSRR vs. Frequency
32
VS = ±15V
28
24
20
16
12
VS = ±5V
8
OUTPUT VOLTAGE SWING (V p-p)
4
0
100 1k 10k 100k 1M 10M
FREQUENCY (Hz)
Figure 18. Output Voltage Swing vs. Large-Signal Frequency Response
07363-017
Rev. 0 | Page 10 of 20
4
10V p-p INPUT
GAIN = 1
3
R
= 10kΩ, 2kΩ, 600Ω
LOAD
2
1
0
–1
NONLINEARIT Y (1ppm/DI V)
–2
–3
–4
–10 –8 –6 –4 –2 0 2 4 861
TEMPERATURE (°C)
0
Figure 21. Gain Nonlinearity, Gain = 1
07363-136
Page 11

AD8271
V
V
V
V
V
VS = ±15 V, TA = 25°C, difference amplifier configuration, unless otherwise noted.
120
100
80
60
40
20
0
–20
–40
SHORT-CIRCUI T CURRENT (mA)
–60
–80
–100
–50 –30 –10 10 30 50 70 90 110 130
TEMPERATURE (°C)
I
SHORT+
I
SHORT–
Figure 22. Short-Circuit Current vs. Temperature
+
S
+125°C
07363-118
VS = ±15V
100pF
18pF
0pF
50mV/DI
1µs/DIV
Figure 25. Small-Signal Step Response, Gain = ½
VS = ±15V
07363-024
+VS– 2
+V
–V
OUTPUT VOLTAGE SWING (V)
–V
– 4
S
+ 4
S
+ 2
S
–V
–40°C
0
+125°C
+85°C
+25°C
–40°C
S
1k200 10k
R
Figure 23. Output Voltage Swing vs. R
+
S
+VS – 3
– 6
+V
S
0
–VS + 6
OUTPUT VO LTAGE SW ING (V)
–V
+ 3
S
–V
S
0 2040608010
+125°C
CURRENT (mA)
Figure 24. Output Voltage Swing vs. Current (I
+25°C
LOAD
(Ω)
+85°C
+85°C
+125°C
+25°C
–40°C
LOAD
–40°C
OUT
+25°C
+85°C
)
0pF
50mV/DI
07363-022
Figure 26. Small-Signal Step Response, Gain = 1
VS = ±15V
0pF
50ms/DI
0
07363-023
Figure 27. Small-Signal Step Response, Gain = 2
33pF
100pF
220pF
470pF
1µs/DIV
1µs/DIV
07363-025
07363-026
Rev. 0 | Page 11 of 20
Page 12

AD8271
V
V
V
VS = ±15 V, TA = 25°C, difference amplifier configuration, unless otherwise noted.
160
140
120
100
VS = ±2.5V
VS = ±5V
VS = ±10V
GAIN = ½
80
60
OVERSHOOT (%)
40
20
0
0 102030405060708090100
VS = ±15V
CAPACITIVE LOAD (pF)
VS = ±18V
Figure 28. Small-Signal Overshoot vs. Capacitive Load, Gain = ½
80
70
60
50
40
30
OVERSHOOT (%)
20
10
0
0 50 100 150 200
VS = ±2.5V
VS = ±15V
CAPACITIVE LOAD (pF)
V
VS = ±18V
= ±5V
S
VS = ±10V
Figure 29. Small-Signal Overshoot vs. Capacitive Load, Gain = 1
2V/DI
1µs/DIV
07363-030
07363-127
Figure 31. Large-Signal Pulse Response, Gain = ½
GAIN = 1
2V/DI
1µs/DIV
07363-031
07363-128
Figure 32. Large-Signal Pulse Response, Gain = 1
80
70
60
50
40
30
OVERSHOOT (%)
20
10
VS = ±2.5V
0
VS = ±5V
CAPACITIVE LOAD (pF)
VS = ±10V
VS = ±18V
VS = ±15V
250 300 350 400 4500 50 100 150 200
Figure 30. Small-Signal Overshoot vs. Capacitive Load, Gain = 2
07363-132
GAIN = 2
2V/DI
1µs/DIV
Figure 33. Large-Signal Pulse Response, Gain = 2
07363-129
Rev. 0 | Page 12 of 20
Page 13

AD8271
VS = ±15 V, TA = 25°C, difference amplifier configuration, unless otherwise noted.
45
40
35
30
25
20
15
OUTPUT SLEW RATE (V/µs)
10
5
0
–45
–35
–25
5
–5
–15
+SR
–SR
15
25354555657585
TEMPERATURE (°C)
95
105
115
125
07363-130
Figure 34. Output Slew Rate vs. Temperature
0.1
GAIN = ½
0.01
GAIN = 2
THD + N (%)
0.001
GAIN = 1
0.0001
10 100 1k 10k 100k
FREQUENCY (Hz)
R
R
R
LOAD
LOAD
LOAD
= 100kΩ
= 2kΩ
= 600Ω
Figure 37. THD + N vs. Frequency
07363-133
1k
GAIN = 2
100
GAIN = 1
VOLTAGE NOISE SPECTRAL DENSITY (nV/√Hz)
10
1 10 100 1k 10k 100k
GAIN = ½
FREQUENCY (Hz)
07363-041
Figure 35. Voltage Noise Spectral Density vs. Frequency, Referred to Output
GAIN = 2
GAIN = 1
1
GAIN = 1
THDN + N (%)
0.0001
0.01
0.001
0.1
f = 1kHz
0
OUTPUT AMPLITUDE (d Bu)
R
LOAD
R
LOAD
R
LOAD
10 15
Figure 38. THD + N vs. Output Amplitude, Gain = 1
0.1
0.01
HD2, R
HD2, R
HD2, R
HD3, R
HD3, R
HD3, R
LOAD
LOAD
LOAD
LOAD
LOAD
LOAD
= 100kΩ
= 2kΩ
= 600Ω
= 100kΩ
= 2kΩ
= 600Ω
GAIN = 1
V
OUT
= 600Ω
= 2kΩ
= 100kΩ
= 10V p-p
20
255
7363-134
GAIN = ½
1µV/DIV 1s/DIV
Figure 36. 0.1 Hz to 10 Hz Voltage Noise, Referred to Output
07363-042
Rev. 0 | Page 13 of 20
0.001
0.0001
AMPLITUDE ( % OF FUNDAMENTAL )
0.00001
10 100 1k 10k 100k
FREQUENCY (Hz)
Figure 39. Harmonic Distortion Products vs. Frequency, Gain = 1
07363-135
Page 14

AD8271
OPERATIONAL AMPLIFIER PLOTS
VS = ±15 V, TA = 25°C, unless otherwise noted.
10
1
OFFSET (10µV/DIV)
CURRENT NOISE SPECTRAL DENSI TY (pA/√Hz)
012345678910
TIME (sec)
Figure 40. Change in Op Amp Offset Voltage vs. Warm-Up Time
07363-044
0.1
1 10 100 1k 10k 100k
FREQUENCY (Hz)
Figure 42. Current Noise Spectral Density vs. Frequency
7363-029
50pA/DIV 1s/DIV
07363-028
Figure 41. 0.1 Hz to 10 Hz Current Noise
Rev. 0 | Page 14 of 20
Page 15

AD8271
THEORY OF OPERATION
10kΩ
1
P1
10kΩ
2
P2
20kΩ
3
P3
20kΩ
4
P4
5
–V
S
Figure 43. Functional Block Diagram
AD8271
10kΩ
10kΩ
10kΩ
10
N3
9
N2
8
N1
7
OUT
6
+V
S
07363-032
CIRCUIT INFORMATION
The AD8271 consists of a high precision, low distortion op amp
and seven trimmed resistors. These resistors can be connected
to create a wide variety of amplifier configurations, including
difference, noninverting, and inverting configurations. The
resistors on the chip can be connected in parallel for a wider range
of options. Using the on-chip resistors of the AD8271 provides
the designer with several advantages over a discrete design.
DC Performance
Much of the dc performance of op amp circuits depends on the
accuracy of the surrounding resistors. The resistors on the AD8271
are laid out to be tightly matched. The resistors of each part are
laser trimmed and tested for their matching accuracy. Because
of this trimming and testing, the AD8271 can guarantee high
accuracy for specifications, such as gain drift, common-mode
rejection, and gain error.
AC Performance
Because feature size is much smaller in an integrated circuit than
on a printed circuit board (PCB), the corresponding parasitics are
also smaller. The smaller feature size helps the ac performance of
the AD8271. For example, the positive and negative input terminals
of the AD8271 op amp are not pinned out intentionally. By not
connecting these nodes to the traces on the PCB, the capacitance
remains low, resulting in both improved loop stability and
common-mode rejection over frequency.
Production Costs
Because one part, rather than several discrete components, is
placed on the PCB, the board can be built more quickly and
efficiently.
Size
The AD8271 fits an op amp and seven resistors in one MSOP
package.
DRIVING THE AD8271
The AD8271 is easy to drive, with all configurations presenting
at least several kilohms (kΩ) of input resistance. The AD8271
should be driven with a low impedance source: for example,
another amplifier. The gain accuracy and common-mode rejection
of the AD8271 depend on the matching of its resistors. Even
source resistance of a few ohms can have a substantial effect on
these specifications.
POWER SUPPLIES
A stable dc voltage should be used to power the AD8271. Noise
on the supply pins can adversely affect performance. A bypass
capacitor of 0.1 µF should be placed between each supply pin
and ground, as close as possible to each supply pin. A tantalum
capacitor of 10 µF should also be used between each supply and
ground. It can be farther away from the supply pins and, typically,
it can be shared by other precision integrated circuits.
The AD8271 is specified at ±15 V and ±5 V, but it can be used with
unbalanced supplies, as well. For example, −V
= 0 V, +VS = 20 V.
S
The difference between the two supplies must be kept below 36 V.
INPUT VOLTAGE RANGE
The AD8271 has a true rail-to-rail input range for the majority
of applications. Because most AD8271 configurations divide down
the voltage before they reach the internal op amp, the op amp sees
only a fraction of the input voltage. Figure 44 shows an example
of how the voltage division works in the difference amplifier
configuration.
R2
(V
)
+IN
R1 + R2
R4
R3
R1
R2
R2
(V
)
+IN
R1 + R2
Figure 44. Voltage Division in the Difference Amplifier Configuration
The internal op amp voltage range may be relevant in the
following applications, and calculating the voltage at the
internal op amp is advised.
• Difference amplifier configurations using supply voltages
of less than ±4.5 V
• Difference amplifier configurations with a reference
voltage near the rail
• Single-ended amplifier configurations
For correct operation, the input voltages at the internal op amp
must stay within 1.5 V of either supply rail.
Voltages beyond the supply rails should not be applied to the
part. The part contains ESD diodes at the input pins, which
conduct if voltages beyond the rails are applied. Currents greater
than 5 mA may damage these diodes and the part. For a similar
part that can operate with voltages beyond the rails, see the
AD8274 data sheet.
07363-033
Rev. 0 | Page 15 of 20
Page 16

AD8271
–V
V
APPLICATIONS INFORMATION
The resistors and connections provided on the AD8271 offer
abundant versatility through the variety of configurations that
are possible.
DIFFERENCE AMPLIFIER CONFIGURATIONS
The AD8271 can be placed in difference amplifier configurations
with gains of ½, 1, and 2. Figure 45 through Figure 47 show
sample difference amplifier configurations referenced to ground.
P1
10kΩ
1
+IN
P2
10kΩ
2
P3
20kΩ
3
P4
20kΩ
4
GND OUT
AD8271
Figure 45. Gain = ½ Difference Amplifier, Referenced to Ground
P1
10kΩ
1
+IN
P2
10kΩ
2
NC NC
P3
20kΩ
GND
3
P4
20kΩ
4
AD8271
Figure 46. Gain = 1 Difference Amplifier, Referenced to Ground
P1
10kΩ
1
+IN
P2
10kΩ
2
P3
20kΩ
GND
3
P4
20kΩ
4
AD8271
Figure 47. Gain = 2 Difference Amplifier, Referenced to Ground
10kΩ
10kΩ
10kΩ
10kΩ
10kΩ
10kΩ
10kΩ
10kΩ
10kΩ
N3
10
9
8
7
10
9
8
7
N2
N1
OUT
10
9
8
7
N3
N2
N1
OUT
N3
N2
N1
OUT
–IN
OUT
–IN
OUT
–IN
OUT
–IN
=
+IN
–IN
=
+IN
–IN
=
+IN
5kΩ
10kΩ
10kΩ
5kΩ
GND
10kΩ
10kΩ
10kΩ
10kΩ
GND
10kΩ
5kΩ
5kΩ
10kΩ
GND
07363-053
07363-054
07363-055
The AD8271 can also be referred to a combination of reference
voltages. For example, the reference can be set at 2.5 V, using
just 5 V and GND. Some of the possible configurations are
shown in Figure 48 through Figure 50. Note that the output
is not internally tied to a feedback path, so any of the 10 k
resistors on the inverting input can be used in the feedback
network. This flexibility allows for more efficient board layout options.
P1
10kΩ
1
+IN
P2
10kΩ
2
–V
S
P3
20kΩ
3
+V
S
P4
20kΩ
4
AD8271
Figure 48. Gain = ½ Difference Amplifier, Referenced to Midsupply
P1
10kΩ
1
+IN
P2
10kΩ
2
NC
P3
–V
S
+V
S
20kΩ
3
P4
20kΩ
4
AD8271
Figure 49. Gain = 1 Difference Amplifier, Referenced to Midsupply
P1
10kΩ
1
+IN
P2
10kΩ
2
P3
20kΩ
3
S
P4
+
20kΩ
4
S
AD8271
Figure 50. Gain = 2 Difference Amplifier, Referenced to Midsupply
10kΩ
10kΩ
10kΩ
10kΩ
10kΩ
10kΩ
10kΩ
10kΩ
10kΩ
N3
10
–IN
N2
9
N1
8
OUT
OUT
7
N3
10
–IN
N2
9
NC
N1
8
OUT
OUT
7
N3
10
+IN
N2
9
N1
8
OUT
OUT
7
10kΩ
–IN
=
10kΩ
+IN
10kΩ
–IN
=
10kΩ
+IN
–IN
=
+IN
+VS + –V
+VS + –V
2
5kΩ
5kΩ
+VS + –V
2
2
5kΩ
5kΩ
S
10kΩ
10kΩ
S
10kΩ
10kΩ
S
07363-056
07363-057
07363-058
Table 8. Pin Connections for Difference Amplifier Configurations
Configuration
Pin 1
Gain and Reference
(P1)
Gain of ½, Referenced to Ground +IN GND GND GND OUT
Gain of ½, Referenced to Midsupply +IN −VS +VS +VS OUT
Gain of 1, Referenced to Ground +IN NC GND GND OUT
Gain of 1, Referenced to Midsupply +IN NC −VS +VS OUT
Gain of 2, Referenced to Ground +IN +IN GND GND OUT
Gain of 2, Referenced to Midsupply +IN +IN −VS +VS OUT
Pin 2
(P2)
Pin 3
(P3)
Pin 4
(P4)
Pin 8
(N1)
Pin 9
(N2)
OUT
OUT
NC
NC
−IN
−IN
Pin 10
(N3)
−IN
−IN
−IN
−IN
−IN
−IN
Rev. 0 | Page 16 of 20
Page 17

AD8271
SINGLE-ENDED CONFIGURATIONS
The AD8271 can be configured for a wide variety of single-ended configurations with gains ranging from −2 to +3 (see Table 9).
Table 9. Selected Single-Ended Configurations
Electrical Performance Configuration
Signal Gain Op Amp Closed-Loop Gain Input Resistance Pin 10
1
−2 3 5 kΩ IN IN
−1.5 3 4.8 kΩ IN IN
−1.4 3 5 kΩ IN IN
−1.25 3 5.333 kΩ IN IN
−1 3 5 kΩ IN IN
−0.8 3 5.556 kΩ IN IN
−0.667 2 8 kΩ IN NC
−0.6 2 8.333 kΩ IN NC
−0.5 2 8.889 kΩ IN NC
−0.333 2 7.5 kΩ IN NC
−0.25 1.5 8 kΩ OUT IN
−0.2 1.5 8.333 kΩ OUT IN
−0.125 1.5 8.889 kΩ OUT IN
+0.1 1.5 8.333 kΩ OUT IN
+0.2 2 10 kΩ IN NC
+0.25 1.5 24 kΩ OUT GND
+0.3 1.5 25 kΩ OUT GND
+0.333 2 24 kΩ GND NC
+0.375 1.5 26.67 kΩ OUT GND
+0.4 2 25 kΩ GND NC
+0.5 3 24 kΩ GND GND
+0.5 1.5 15 kΩ OUT GND
+0.6 3 25 kΩ GND GND
+0.6 1.5 16.67 kΩ OUT GND
+0.625 1.5 16 kΩ OUT IN
+0.667 2 15 kΩ GND NC
+0.7 1.5 16.67 kΩ OUT IN
+0.75 3 26.67 kΩ GND GND
+0.75 1.5 13.33 kΩ OUT GND
+0.8 2 16.67 kΩ GND NC
+0.9 1.5 16.67 kΩ OUT GND
+1 1.5 15 kΩ OUT GND
+1 1.5 >1 GΩ OUT IN
+1 3 >1 GΩ IN IN
+1.125 1.5 26.67 kΩ OUT GND
+1.2 3 16.67 kΩ GND GND
+1.2 1.5 25 kΩ OUT GND
+1.25 1.5 24 kΩ OUT GND
+1.333 2 15 kΩ GND NC
+1.5 3 13.33 kΩ GND GND
+1.5 1.5 >1 GΩ OUT GND
+1.6 2 25 kΩ GND NC
+1.667 2 24 kΩ GND NC
+1.8 3 16.67 kΩ GND GND
+2 2 >1 GΩ GND NC
+2.25 3 26.67 kΩ GND GND
+2.4 3 25 kΩ GND GND
+2.5 3 24 kΩ GND GND
+3 3 >1 GΩ GND GND
1
A 10 kΩ resistor is connected to the inverting (−) terminal of the op amp.
2
A 10 kΩ resistor is connected to the noninverting (+) terminal of the op amp.
3
A 20 kΩ resistor is connected to the noninverting (+) terminal of the op amp.
Pin 9
1
Pin 8
OUT
OUT
OUT
OUT
OUT
OUT
OUT
OUT
OUT
OUT
OUT
OUT
OUT
OUT
OUT
OUT
OUT
OUT
OUT
OUT
OUT
OUT
OUT
OUT
OUT
OUT
OUT
OUT
OUT
OUT
OUT
OUT
OUT
OUT
OUT
OUT
OUT
OUT
OUT
OUT
OUT
OUT
OUT
OUT
OUT
OUT
OUT
OUT
OUT
1
Pin 12Pin 2
2
Pin 33Pin 4
GND GND GND GND
GND GND GND IN
GND GND NC IN
GND NC GND IN
GND GND IN IN
IN GND NC GND
GND GND GND IN
GND GND NC IN
GND NC GND IN
GND GND IN IN
GND GND GND IN
GND GND NC IN
GND NC GND IN
IN GND NC GND
GND IN NC IN
GND GND GND IN
GND GND NC IN
GND GND GND IN
GND NC GND IN
GND GND NC IN
GND GND GND IN
GND GND IN IN
GND GND NC IN
IN GND NC GND
NC IN IN GND
GND GND IN IN
IN IN NC GND
GND NC GND IN
GND IN GND IN
IN GND NC GND
GND IN NC IN
IN IN GND GND
IN IN IN IN
IN IN IN IN
NC IN IN GND
IN GND NC GND
IN IN NC GND
IN IN IN GND
IN IN GND GND
GND IN GND IN
IN IN IN IN
IN IN NC GND
IN IN IN GND
GND IN NC IN
IN IN IN IN
NC IN IN GND
IN IN NC GND
IN IN IN GND
IN IN IN IN
3
Rev. 0 | Page 17 of 20
Page 18

AD8271
Ω
A
Many signal gains have more than one configuration choice, which
allows freedom in choosing the op amp closed-loop gain. In
general, for designs that need to be stable with a large capacitive
load on the output, choose a configuration with high loop gain.
Otherwise, choose a configuration with low loop gain, because
these configurations typically have lower noise, lower offset,
and higher bandwidth.
The AD8271 Specifications section and Typi cal Performance
Characteristics section show the performance of the part primarily
when it is in the difference amplifier configuration. To estimate
the performance of the part in a single-ended configuration, refer
to the difference amplifier configuration with the corresponding
closed-loop gain (see Tabl e 10).
Table 10. Closed-Loop Gain of the Difference Amplifiers
Difference Amplifier Gain Closed-Loop Gain
0.5 1.5
1 2
2 3
Gain of 1 Configuration
The AD8271 is designed to be stable for loop gains of 1.5 and
greater. Because a typical voltage follower configuration has
a loop gain of 1, it may be unstable. Several stable configurations
for gain of 1 are listed in Tabl e 9.
KELVIN MEASUREMENT
In the case where the output load is located remotely or at
a distance from the AD8271, as shown in Figure 51, wire
resistance can actually cause significant errors at the load.
10k
R
10kΩ
–IN
10kΩ
+IN
10kΩ
Figure 51. Wire Resistance Causes Errors at Load Voltage
Since the output of the AD8271 is not internally tied to any of
the feedback resistors, Kelvin type measurements are possible
because the op amp output and feedback can both be connected
closer to the load (Figure 52). The Kelvin sensing on the feedback
minimizes error at the load caused by voltage drops across the
wire resistance. This technique is most effective in reducing errors
for loads less than 10 k. As the load resistance increases, the
error due to the wire resistance becomes less significant.
Because it adds the sense wire resistance to the feedback resistor, a
trade-off of the Kelvin connection is that it can degrade commonmode rejection, especially over temperature. For sense wire
resistance less than 1 , it is typically not an issue. If commonmode performance is critical, two amplifier stages can be used:
the first stage removes common-mode interference, and the
second stage performs the Kelvin drive.
W
(WIRE RESI STANCE)
R
1kΩ
L
07363-149
SENSE
FORCE
w
R
w
R
L
1kΩ
07363-150
–IN
+IN
10kΩ R
10kΩ
10kΩ
10kΩ
Figure 52. Connecting Both the Output and Feedback at the Load Minimizes
Error Due to Wire Resistance
INSTRUMENTATION AMPLIFIER
The AD8271 can be used as a building block for high performance
instrumentation amplifiers. For example, Figure 53 shows how
to build an ultralow noise instrumentation amplifier using the
AD8599 dual op amp. External resistors R
therefore, the output is
⎛
R
2
Fx
VVV
−+
D8599
A2
A2
⎜
1
+−=
ININ
⎜
R
G
⎝
–IN
+IN
()
OUT
R
F1
R
20Ω
2kΩ
G
R
F2
2kΩ
AD8599
Figure 53.Ultralow Noise Instrumentation Amplifier Using AD8599
Configured for Gain = 201
For optimal noise performance, it is desirable to have a high
gain at the input stage using low value gain-setting resistors, as
shown in this particular example. With less than 2 nV/√Hz
input-referred noise (see Figure 54) at ~10 mA supply current,
the AD8271 and AD8599 combination offers an in-amp with a
fine balance of critical specifications: a gain bandwidth product
of 10 MHz, low bias current, low offset drift, high CMRR, and
high slew rate.
10.0
9.0
8.0
7.0
6.0
5.0
4.0
3.0
2.0
1.0
VOLTAG E NOISE SPECTRAL DENSITY ( nV/√Hz)
0
1 10 100 1k 10k 100k
Figure 54. Ultralow Noise In-Amp Voltage Noise Spectral Density vs.
FREQUENCY (Hz)
Frequency, Referred to Input
and RFx provide gain;
G
⎞
⎟
()
⎟
⎠
10kΩ
10kΩ
G
AD
8271
10kΩ
AD8271
10kΩ
REF
= ±15V
V
S
G = 201
BANDWIDTH
LIMIT
OUT
07363-151
07363-153
Rev. 0 | Page 18 of 20
Page 19

AD8271
DRIVING CABLING DRIVING AN ADC
Because the AD8271 can drive large voltages at high output
currents and slew rates, it makes an excellent cable driver. It is
good practice to put a small value resistor between the AD8271
output and cable, since capacitance in the cable can cause peaking
or instability in the output response. A resistance of 20 or higher
is recommended.
AD8271
(SINGLE OUT)
Figure 55. Driving Cabling
07363-148
The AD271 high slew rate and drive capability, combined with
its dc accuracy, make it a good ADC driver. The AD8271 can
drive single-ended input ADCs. Many converters require the
output to be buffered with a small value resistor combined with
a high quality ceramic capacitor. See the relevant converter data
sheet for more details.
Rev. 0 | Page 19 of 20
Page 20

AD8271
OUTLINE DIMENSIONS
3.10
3.00
2.90
6
10
3.10
3.00
2.90
1
PIN 1
0.50 BSC
0.95
0.85
0.75
0.15
0.05
0.33
0.17
COPLANARITY
0.10
COMPLIANT TO JEDEC STANDARDS MO-187-BA
Figure 56. 10-Lead Mini Small Outline Package [MSOP]
ORDERING GUIDE
Model Temperature Range Package Description Package Option Branding
AD8271ARMZ
AD8271ARMZ-R7
AD8271ARMZ-RL
AD8271BRMZ
AD8271BRMZ-R7
AD8271BRMZ-RL
1
Z = RoHS Compliant Part.
1
−40°C to +85°C 10-Lead MSOP RM-10 Y1E
1
−40°C to +85°C 10-Lead MSOP, 7” Tape and Reel RM-10 Y1E
1
−40°C to +85°C 10-Lead MSOP, 13” Tape and Reel RM-10 Y1E
1
−40°C to +85°C 10-Lead MSOP RM-10 Y1G
1
−40°C to +85°C 10-Lead MSOP, 7” Tape and Reel RM-10 Y1G
1
−40°C to +85°C 10-Lead MSOP, 13” Tape and Reel RM-10 Y1G
5.15
4.90
4.65
5
1.10 MAX
SEATING
PLANE
0.23
0.08
8°
0°
(RM-10)
Dimensions are shown in millimeters
0.80
0.60
0.40
©2009 Analog Devices, Inc. All rights reserved. Trademarks and
registered trademarks are the property of their respective owners.
D07363-0-1/09(0)
Rev. 0 | Page 20 of 20
 Loading...