

Page 1
Low-Cost, 300 MHz
8
7
6
5
1
2
3
4
NC
–IN
+IN
DISABLE
(AD8063 ONLY)
+V
S
V
OUT
NC–V
S
AD8061/
AD8063
NC = NO CONNECT
(Not to Scale)
a
FEATURES
Low Cost
Single (AD8061), Dual (AD8062)
Single with Disable (AD8063)
Rail-to-Rail Output Swing
6 mV V
High Speed
300 MHz, –3 dB Bandwidth (G = 1)
800 V/s Slew Rate
8.5 nV/√Hz @ 5 V
35 ns Settling Time to 0.1% with 1 V Step
Operates on 2.7 V to 8 V Supplies
Input Voltage Range = –0.2 V to +3.2 V with V
Excellent Video Specs (R
Gain Flatness 0.1 dB to 30 MHz
0.01% Differential Gain Error
0.04ⴗ Differential Phase Error
35 ns Overload Recovery
Low Power
6.8 mA/Amplifier Typical Supply Current
AD8063 400 A when Disabled
Small Packaging
AD8061 Available in SOIC-8 and SOT-23-5
AD8062 Available in SOIC-8 and SOIC
AD8063 Available in SOIC-8 and SOT-23-6
APPLICATIONS
Imaging
Photodiode Preamp
Professional Video and Cameras
Hand Sets
DVD/CD
Base Stations
Filters
A-to-D Driver
PRODUCT DESCRIPTION
The AD8061, AD8062, and AD8063 are rail-to-rail output voltage feedback amplifiers offering ease of use and low cost. They
have bandwidth and slew rate typically found in current feedback amplifiers. All have a wide input common-mode voltage
range and output voltage swing, making them easy to use on
single supplies as low as 2.7 V.
Despite being low cost, the AD8061, AD8062, and AD8063
provide excellent overall performance. For video applications
their differential gain and phase errors are 0.01% and 0.04°
into a 150 Ω load, along with 0.1 dB flatness out to 30 MHz.
Additionally, they offer wide bandwidth to 300 MHz along
with 800 V/µs slew rate.
OS
= 150 ⍀, G = 2)
L
= 5
S
Rail-to-Rail Amplifiers
AD8061/AD8062/AD8063
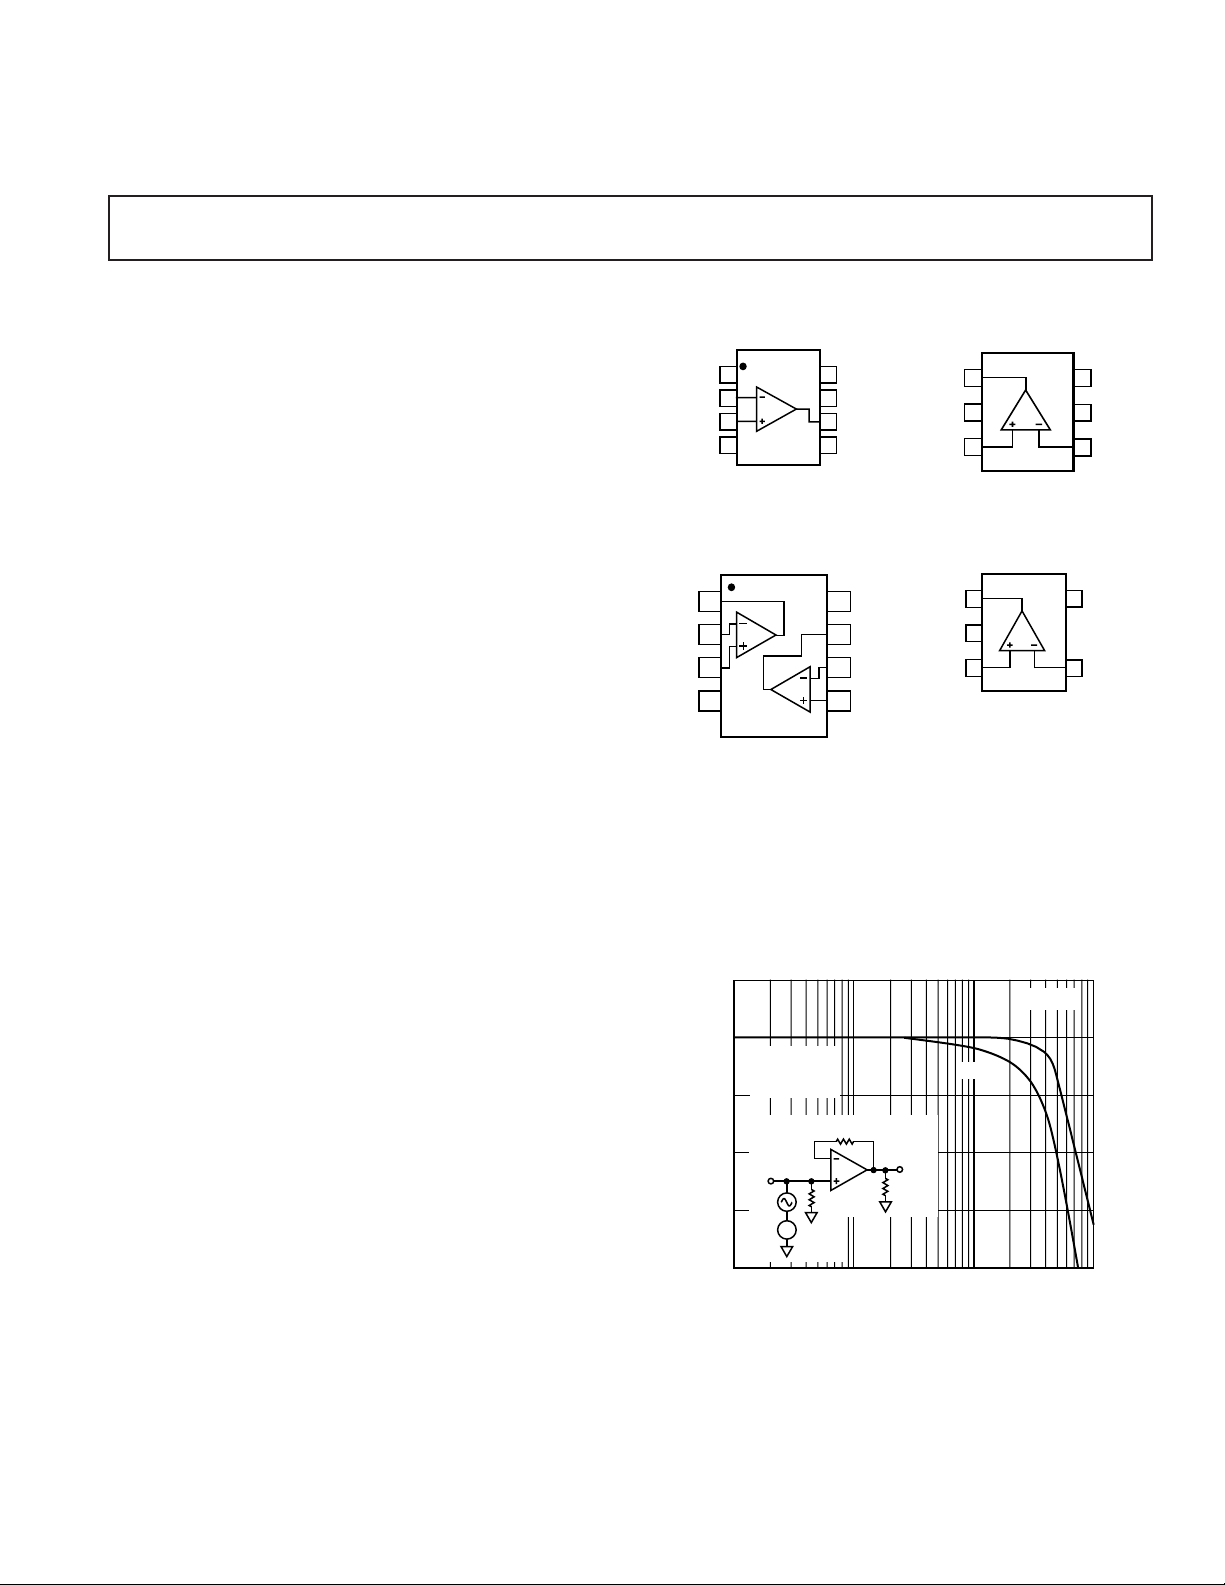
CONNECTION DIAGRAMS
(Top Views)
SOIC-8 (R) SOT-23-6 (RT)
AD8063
1
2
S
3
(Not to Scale)
SOT-23-5 (RT)
AD8061
1
2
S
3
(Not to Scale)
SOIC-8 (R) and SOIC (RM)
1
2
3
4
(Not to Scale)
AD8062
+V
8
S
V
7
OUT2
–IN2
6
+IN2
5
V
OUT1
–IN1
+IN1
–V
S
V
OUT
–V
+IN
V
OUT
–V
+IN
The AD8061, AD8062, and AD8063 offer a typical low power
of 6.8 mA/amplifier, while being capable of delivering up to
50 mA of load current. The AD8063 has a power-down disable
feature that reduces the supply current to 400 µA. These features
make the AD8063 ideal for portable and battery-powered
applications where size and power is critical.
3
0
VO = 0.2V p-p
= 1kV
R
L
= 1V
V
BIAS
–3
–6
IN
NORMALIZED GAIN – dB
–9
–12
1
50V
6
V
BIAS
R
F
OUT
R
L
FREQUENCY – MHz
RF = 0V
RF = 50V
10010
Figure 1. Small Signal Response, RF = 0 Ω, 50
6
5
4
5
4
1000
+V
S
DISABLE
–IN
+V
S
–IN
Ω
REV. A
Information furnished by Analog Devices is believed to be accurate and
reliable. However, no responsibility is assumed by Analog Devices for its
use, nor for any infringements of patents or other rights of third parties
which may result from its use. No license is granted by implication or
otherwise under any patent or patent rights of Analog Devices.
One Technology Way, P.O. Box 9106, Norwood, MA 02062-9106, U.S.A.
Tel: 781/329-4700 World Wide Web Site: http://www.analog.com
Fax: 781/326-8703 © Analog Devices, Inc., 2000
Page 2

(TA = 25ⴗC, VS = 5 V, RL = 1 k⍀, VO = 1 V,
AD8061/AD8062/AD8063–SPECIFICATIONS
Parameter Conditions Min Typ Max Unit
DYNAMIC PERFORMANCE
–3 dB Small Signal Bandwidth G = 1, VO = 0.2 V p-p 150 320 MHz
G = –1, +2, V
–3 dB Large Signal Bandwidth G = 1, V
Bandwidth for 0.1 dB Flatness G = 1, V
Slew Rate G = 1, V
G = 2, V
Settling Time to 0.1% G = 2, VO = 2 V Step 35 ns
NOISE/DISTORTION PERFORMANCE
Total Harmonic Distortion fC = 5 MHz, VO = 2 V p-p, R
f
= 20 MHz, VO = 2 V p-p, R
C
Crosstalk, Output to Output f = 5 MHz, G = 2, AD8062 –90 dBc
Input Voltage Noise f = 100 kHz 8.5 nV/√Hz
Input Current Noise f = 100 kHz 1.2 pA/√Hz
Differential Gain Error (NTSC) G = 2, R
Differential Phase Error (NTSC) G = 2, R
Third Order Intercept f = 10 MHz 28 dBc
SFDR f = 5 MHz 62 dB
DC PERFORMANCE
Input Offset Voltage 16mV
to T
T
MIN
Input Offset Voltage Drift 3.5 µV/°C
Input Bias Current 3.5 9 µA
to T
T
MIN
Input Offset Current 0.3 4.5 ±µA
Open-Loop Gain VO = 0.5 V to 4.5 V, R
VO = 0.5 V to 4.5 V, R
INPUT CHARACTERISTICS
Input Resistance 13 MΩ
Input Capacitance 1pF
Input Common-Mode Voltage Range –0.2 to +3.2 V
Common-Mode Rejection Ratio VCM = –0.2 V to +3.2 V 62 80 dB
OUTPUT CHARACTERISTICS
Output Voltage Swing—Load Resistance R
Is Terminated at Midsupply R
Output Current V
Capacitive Load Drive, V
= 0.8 V 30% Overshoot: G = 1, R
OUT
= 150 Ω 0.3 0.1 to 4.5 4.75 V
L
= 2␣ kΩ 0.25 0.1 to 4.9 4.85 V
L
= 0.5 V to 4.5 V 25 50 mA
O
G = 2, R
POWER-DOWN DISABLE
Turn-On Time 40 ns
Turn-Off Time 300 ns
DISABLE Voltage—Off 2.8 V
DISABLE Voltage—On 3.2 V
POWER SUPPLY
Operating Range 2.7 5 8 V
Quiescent Current per Amplifier 6.8 9.5 mA
Supply Current when Disabled 0.4 mA
(AD8063 Only)
Power Supply Rejection Ratio ∆V
Specifications subject to change without notice.
= 2.7 V to 5 V 72 80 dB
S
= 0.2 V p-p 60 115 MHz
O
= 1 V p-p 280 MHz
O
= 0.2 V p-p 30 MHz
O
= 2 V Step, R
O
= 2 V Step, R
O
= 150 Ω 0.01 %
L
= 150 Ω 0.04 Degree
L
MAX
MAX
= 2 kΩ 500 650 V/µs
L
= 2 kΩ 300 500 V/µs
L
= 1 kΩ –77 dBc
L
= 1 kΩ –50 dBc
L
= 150 Ω 68 70 dB
L
= 2 kΩ 74 90 dB
L
= 0 Ω 25 pF
S
= 4.7 Ω 300 pF
S
unless otherwise noted)
26mV
49µA
–2–
REV. A
Page 3

AD8061/AD8062/AD8063
SPECIFICATIONS
Parameter Conditions Min Typ Max Unit
DYNAMIC PERFORMANCE
–3 dB Small Signal Bandwidth G = 1, VO = 0.2 V p-p 150 300 MHz
–3 dB Large Signal Bandwidth G = 1, V
Bandwidth for 0.1 dB Flatness G = 1, V
Slew Rate G = 1, V
Settling Time to 0.1% G = 2, VO = 1 V Step 40 ns
NOISE/DISTORTION PERFORMANCE
Total Harmonic Distortion f
Crosstalk, Output to Output f = 5 MHz, G = 2 –90 dBc
Input Voltage Noise f = 100 kHz 8.5 nV/√Hz
Input Current Noise f = 100 kHz 1.2 pA/√Hz
DC PERFORMANCE
Input Offset Voltage 16mV
Input Offset Voltage Drift 3.5 µV/°C
Input Bias Current 3.5 8.5 µA
Input Offset Current 0.3 4.5 ±µA
Open-Loop Gain VO = 0.5 V to 2.5 V, R
INPUT CHARACTERISTICS
Input Resistance 13 MΩ
Input Capacitance 1pF
Input Common-Mode Voltage Range –0.2 to +1.2 V
Common-Mode Rejection Ratio VCM = –0.2 V to +1.2 V 80 dB
OUTPUT CHARACTERISTICS
Output Voltage Swing R
Output Current V
Capacitive Load Drive, V
POWER-DOWN DISABLE
Turn-On Time 40 ns
Turn-Off Time 300 ns
DISABLE Voltage—Off 0.8 V
DISABLE Voltage—On 1.2 V
POWER SUPPLY
Operating Range 2.7 3 V
Quiescent Current per Amplifier 6.8 9 mA
Supply Current when Disabled 0.4 mA
(AD8063 Only)
Power Supply Rejection Ratio 72 80 dB
OUT
(TA = 25ⴗC, VS = 3 V, RL = 1 k⍀, VO = 1 V, unless otherwise noted)
G = –1, +2, V
G = 2, V
= 5 MHz, VO = 2 V p-p, R
C
= 20 MHz, VO = 2 V p-p, R
f
C
to T
T
MIN
to T
T
MIN
VO = 0.5 V to 2.5 V, R
= 150 Ω 0.3 0.1 to 2.87 2.85 V
L
= 2␣ kΩ 0.3 0.1 to 2.9 2.90 V
R
L
= 0.5 V to 2.5 V 25 mA
O
= 0.8 V 30% Overshoot, G = 1, R
G = 2, R
= 0.2 V p-p 60 115 MHz
O
= 1 V p-p 250 MHz
O
= 0.2 V p-p 30 MHz
O
= 1 V Step, R
O
= 1.5 V Step, R
O
MAX
MAX
= 2 kΩ 190 280 V/µs
L
= 2 kΩ 180 230 V/µs
L
= 1 kΩ –60 dBc
L
= 1 kΩ –44 dBc
L
= 150 Ω 66 70 dB
L
= 2 kΩ 74 90 dB
L
= 0 Ω,25 pF
S
= 4.7 Ω 300 pF
S
26mV
4 8.5 µA
Specifications subject to change without notice.
REV. A
–3–
Page 4

(TA = 25ⴗC, VS = 2.7 V, RL = 1 k⍀, VO = 1 V,
AD8061/AD8062/AD8063–SPECIFICATIONS
Parameter Conditions Min Typ Max Unit
DYNAMIC PERFORMANCE
–3 dB Small Signal Bandwidth G = 1, VO = 0.2 V p-p 150 300 MHz
G = –1, +2, V
G = 1, V
Bandwidth for 0.1 dB Flatness G = 1, V
Slew Rate G = 1, V
G = 2, V
Settling Time to 0.1% G = 2, VO = 1 V Step 40 ns
NOISE/DISTORTION PERFORMANCE
Total Harmonic Distortion fC = 5 MHz, VO = 2 V p-p, R
f
= 20 MHz, VO = 2 V p-p, R
C
Crosstalk, Output to Output f = 5 MHz, G = 2 –90 dBc
Input Voltage Noise f = 100 kHz 8.5 nV/√Hz
Input Current Noise f = 100 kHz 1.2 pA/√Hz
DC PERFORMANCE
Input Offset Voltage 16mV
to T
T
MIN
Input Offset Voltage Drift 3.5 µV/°C
Input Bias Current 3.5 µA
to T
T
MIN
Input Offset Current 0.3 4.5 ±µA
Open-Loop Gain VO = 0.5 V to 2.2 V, R
VO = 0.5 V to 2.2 V, R
INPUT CHARACTERISTICS
Input Resistance 13 MΩ
Input Capacitance 1pF
Input Common-Mode Voltage Range –0.2 to +0.9 V
Common-Mode Rejection Ratio VCM = –0.2 V to +0.9 V 80 dB
OUTPUT CHARACTERISTICS
Output Voltage Swing R
Output Current V
Capacitive Load Drive, V
= 0.8 V 30% Overshoot: G = 1, R
OUT
= 150 Ω 0.3 0.1 to 2.55 2.55 V
L
R
= 2␣ kΩ 0.25 0.1 to 2.6 2.6 V
L
= 0.5 V to 2.2 V 25 mA
O
G = 2, R
POWER-DOWN DISABLE
Turn-On Time 40 ns
Turn-Off Time 300 ns
DISABLE Voltage—Off 0.5 V
DISABLE Voltage—On 0.9 V
POWER SUPPLY
Operating Range 2.7 8 V
Quiescent Current per Amplifier 6.8 8.5 mA
Supply Current when Disabled 0.4 mA
(AD8063 Only)
Power Supply Rejection Ratio 80 dB
= 0.2 V p-p 60 115 MHz
O
= 1 V p-p 230 MHz
O
= 0.2 V p-p, VO DC = 1 V 30 MHz
O
= 0.7 V Step, R
O
= 1.5 V Step, R
O
MAX
MAX
= 2 kΩ 110 150 V/µs
L
= 2 kΩ 95 130 V/µs
L
= 1 kΩ –60 dBc
L
= 1 kΩ –44 dBc
L
= 150 Ω 63 70 dB
L
= 2 kΩ 74 90 dB
L
= 0␣ Ω,25 pF
S
= 4.7␣ Ω 300 pF
S
unless otherwise noted)
26mV
48.5µA
Specifications subject to change without notice.
–4–
REV. A
Page 5
AD8061/AD8062/AD8063
ABSOLUTE MAXIMUM RATINGS
Supply Voltage . . . . . . . . . . . . . . . . . . . . . . . . . . . . . . . . . . 8 V
Internal Power Dissipation
2
1
Plastic Package (N) . . . . . . . . . . . . . . . . . . . . . . . . . . . . 1.3 W
Small Outline Package (R) . . . . . . . . . . . . . . . . . . . . . . . 0.8 W
SOT-23-5 Package . . . . . . . . . . . . . . . . . . . . . . . . . . . . 0.5 W
SOT-23-6 Package . . . . . . . . . . . . . . . . . . . . . . . . . . . . 0.5 W
µSOIC Package . . . . . . . . . . . . . . . . . . . . . . . . . . . . . . . 0.6 W
Input Voltage (Common-Mode) (–V
Differential Input Voltage . . . . . . . . . . . . . . . . . . . . . . . . ±V
– 0.2 V) to (+VS – 1.8 V)
S
S
Output Short Circuit Duration
. . . . . . . . . . . . . . . . . . . . . . Observe Power Derating Curves
Storage Temperature Range R, RM, SOT-23-5,
SOT-23-6 . . . . . . . . . . . . . . . . . . . . . . . . –65°C to +125°C
Operating Temperature Range . . . . . . . . . . . –40°C to +85°C
Lead Temperature Range (Soldering 10 sec) . . . . . . . . 300°C
NOTES
1
Stresses above those listed under Absolute Maximum Ratings may cause perma-
nent damage to the device. This is a stress rating only; functional operation of the
device at these or any other conditions above those indicated in the operational
section of this specification is not implied. Exposure to absolute maximum rating
conditions for extended periods may affect device reliability.
2
Specification is for device in free air:
8-Lead SOIC Package: θJA = 160°C/W; θJC = 56°C/W
5-Lead SOT-23-5 Package: θJA = 240°C/W; θJC = 92°C/W
6-Lead SOT-23-6 Package: θJA = 230°C/W; θJC = 92°C/W
8-Lead µSOIC Package: θJA = 200°C/W; θJC = 44°C/W.
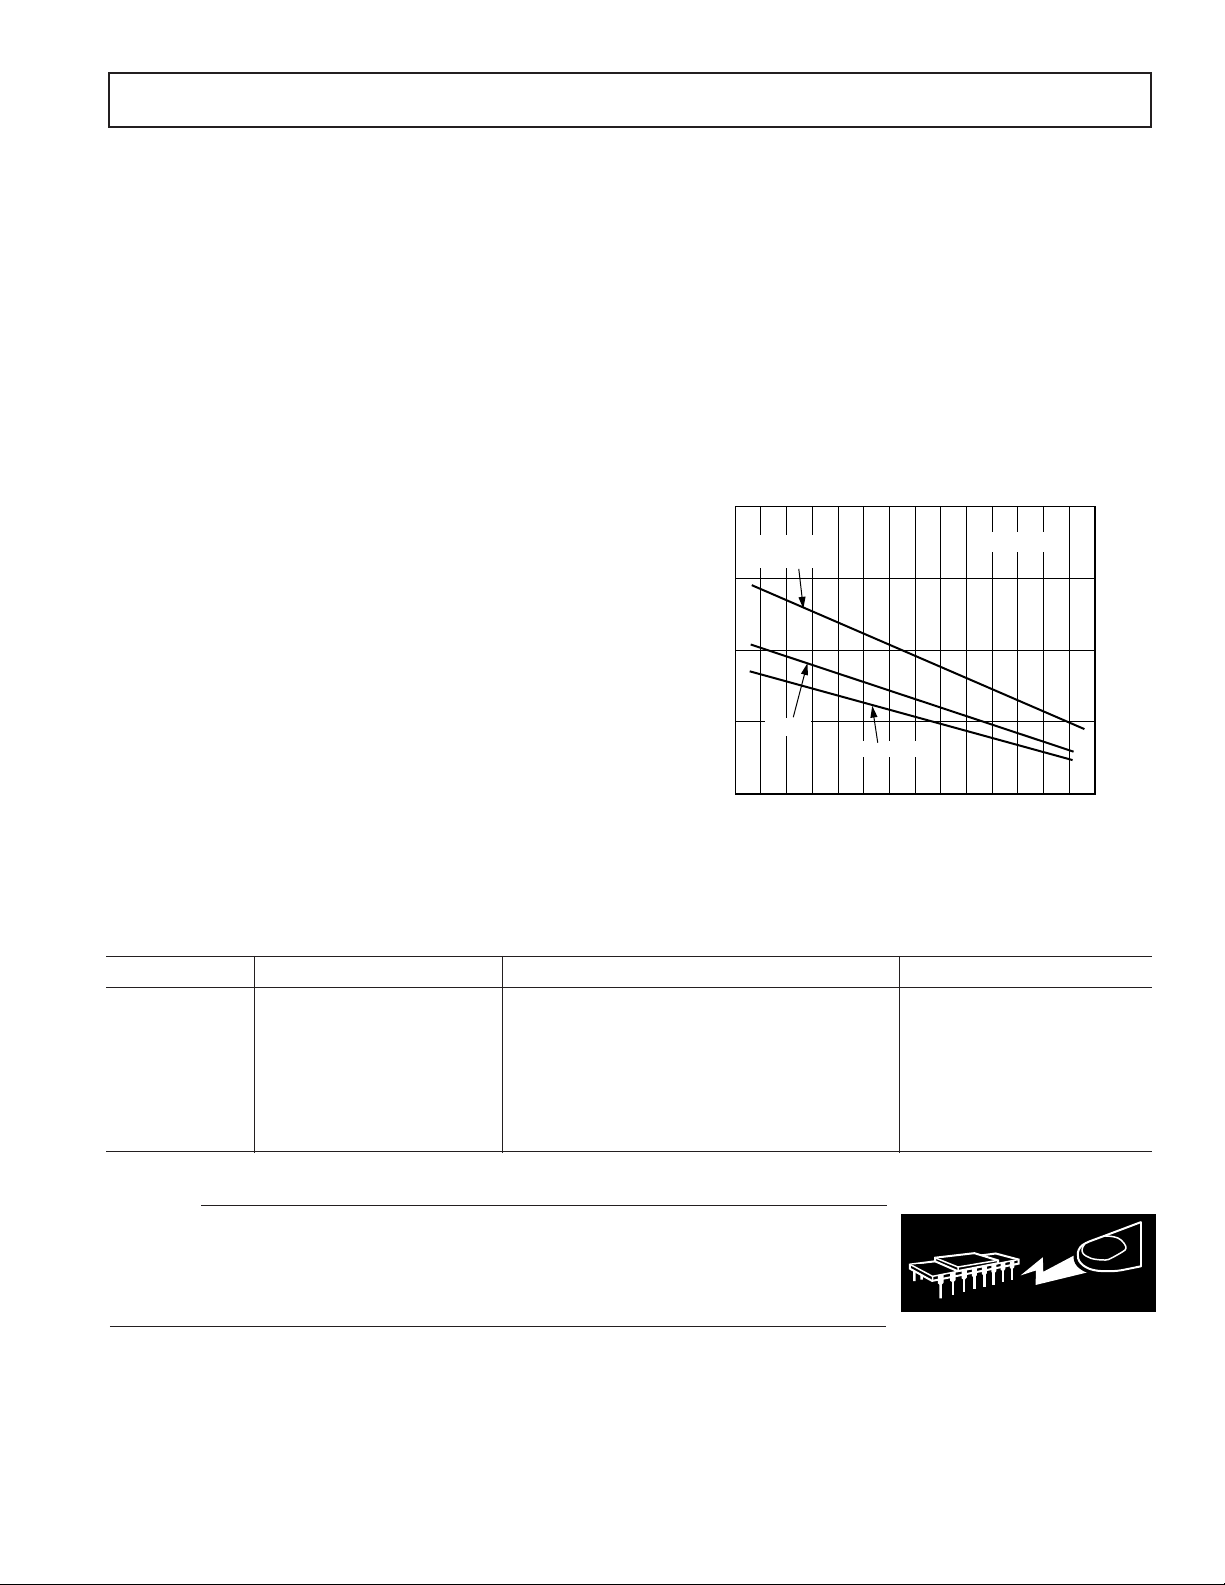
MAXIMUM POWER DISSIPATION
The maximum power that can be safely dissipated by the AD806x
is limited by the associated rise in junction temperature. The
maximum safe junction temperature for plastic encapsulated
devices is determined by the glass transition temperature of the
plastic, approximately 150°C. Temporarily exceeding this limit
may cause a shift in parametric performance due to a change
in the stresses exerted on the die by the package. Exceeding a
junction temperature of 175°C for an extended period can result
in device failure. While the AD806x is internally short circuit
protected, this may not be sufficient to guarantee that the
maximum junction temperature (150°C) is not exceeded under
all conditions.
To ensure proper operation, it is necessary to observe the
maximum power derating curves.
2.0
8-LEAD SOIC
PACKAGE
1.5
1.0
0.5
mSOIC
MAXIMUM POWER DISSIPATION – Watts
0
–30
–50 –40
SOT-23-5, -6
AMBIENT TEMPERATURE – 8C
2010
TJ = 1508C
605040300–10–20
70 80
90
Figure 2. Plot of Maximum Power Dissipation vs.
Temperature for AD8061/AD8062/AD8063
ORDERING GUIDE
Model Temperature Range Package Description Package Option
AD8061AR –40°C to +85°C 8-Lead SOIC R-8
AD8061ART –40°C to +85°C 5-Lead SOT-23-5 RT-5
AD8062AR –40°C to +85°C 8-Lead SOIC R-8
AD8062ARM –40°C to +85°C 8-Lead µSOIC RM-8
AD8063AR –40°C to +85°C 8-Lead SOIC R-8
AD8063ART –40°C to +85°C 6-Lead SOT-23-6 RT-6
AD806x-EB Evaluation Board for AD806xAR
CAUTION
ESD (electrostatic discharge) sensitive device. Electrostatic charges as high as 4000 V readily
accumulate on the human body and test equipment and can discharge without detection. Although
WARNING!
the AD8061/AD8062/AD8063 features proprietary ESD protection circuitry, permanent damage
may occur on devices subjected to high energy electrostatic discharges. Therefore, proper ESD
precautions are recommended to avoid performance degradation or loss of functionality.
ESD SENSITIVE DEVICE
REV. A
–5–
Page 6

AD8061/AD8062/AD8063
1.2
S
1.0
0.8
+V
0.6
–V
0.4
VOLTAGE DIFFERENTIAL FROM V
0.2
0
OUT
10
0
OUT
@ –408C
20 30 40 50 60 70 80
LOAD CURRENT – mA
+V
OUT
@ –408C
–V
+V
OUT
@ +258C
@ +258C
OUT
@ +858C
–V
OUT
@ +858C
90
Figure 3. Output Saturation Voltage vs. Load Current
18
16
14
12
10
8
6
4
POWER SUPPLY CURRENT – mA
2
0
283
Figure 4. I
4567
SINGLE POWER SUPPLY – Voltage
SUPPLY
vs. V
AD8062
AD8061
SUPPLY
3
0
–3
–6
NORMALIZED GAIN – dB
VO = 0.2V p-p
–9
= 1kV
R
L
= 1V
V
BIAS
–12
1
G = 2
G = 5
FREQUENCY – MHz
G = 1
10010
Figure 6. Small Signal Frequency Response
3
VO = 1.0V p-p
= 1kV
R
L
= 1V
V
BIAS
0
–3
–6
NORMALIZED GAIN – dB
–9
–12
1
G = 5
FREQUENCY – MHz
G = 1
G = 2
10010
Figure 7. Large Signal Frequency Response
1000
1000
3
0
VO = 0.2V p-p
= 1kV
R
L
= 1V
V
BIAS
–3
–6
IN
NORMALIZED GAIN – dB
–9
–12
1
50V
6
V
BIAS
R
F
OUT
R
L
FREQUENCY – MHz
RF = 0V
RF = 50V
10010
Figure 5. Small Signal Response, RF = 0 Ω, 50
1000
Ω
–6–
3
0
–3
–6
IN
NORMALIZED GAIN – dB
–9
–12
1
50V
6
V
BIAS
G = –5
R
F
OUT
R
L
FREQUENCY – MHz
VS = 5V
= 0.2V p-p
V
O
R
= 1kV
L
= 1V
V
BIAS
G = –1
G = –2
10010
Figure 8. Small Signal Frequency Response
1000
REV. A
Page 7

AD8061/AD8062/AD8063
INPUT SIGNAL BIAS – Volts
0
–50
–100
0.5
HARMONIC DISTORTION – dBc
1.0
3.0
3.5
–10
–20
–30
–40
–60
–70
–80
–90
2.52.01.5
3RD @ 1MHz
3RD @ 10MHz
2ND @ 1MHz
2ND @ 10MHz
VS = 5V
R
L
= 1kV
G = 1
FREQUENCY – MHz, START = 10kHz, STOP = 30MHz
–70
0.01
DISTORTION – dB
–40
–50
–60
–80
–90
–100
–110
0.1
11050
3RD H
2ND H
+1.25V
dc
50V
604V
1kV
52.3V
0.1mF
10mF
+5V
+
+
–
0.1mF
1k
V
(R
LOAD
)
1M
V INPUT
3
0
–3
–6
NORMALIZED GAIN – dB
–9
–12
1
G = –2
G = –5
FREQUENCY – MHz
VS = 5V
= 1V p-p
V
O
= 1kV
R
L
= 1V
V
BIAS
G = –1
10010
Figure 9. Large Signal Frequency Response
0.1
–0.1
VS = 2.7V
0
VS = 5.0V
VO = 0.2V p-p
R
= 1kV
L
= 1V
V
BIAS
G = 1
1000
Figure 12. Harmonic Distortion for a 1 V p-p Signal vs.
Input Signal DC Bias
–0.2
–0.3
NORMALIZED GAIN – dB
–0.4
–0.5
80
70
60
50
40
30
20
10
PHASE – Degrees
–10
–20
–30
Figure 11. Open-Loop Gain and Phase vs. Frequency,
= 5 V, RL = 1 k
V
S
REV. A
1
0
1
VS = 3.0V
FREQUENCY – MHz
10010
Figure 10. 0.1 dB Flatness
FREQUENCY – MHz
Ω
10010
1000
140
120
100
80
60
40
20
0
OPEN-LOOP GAIN – dB
–20
–40
–60
–80
1000
Figure 13. Harmonic Distortion for a 1 V p-p Output
Signal vs. Input Signal DC Bias
–30
–40
–50
–60
–70
–80
DISTORTION – dB
–90
–100
–110
–120
0
2ND
3RD
10MHz
2ND
15
OUTPUT SIGNAL DC BIAS – Volts
3RD
2ND
VS = 5V
R
L
G = 5
V
O
5MHz
= 1kV
= 1V p-p
Figure 14. Harmonic Distortion vs. Output Signal
DC Bias
–7–
1MHz
3RD
432
Page 8

AD8061/AD8062/AD8063
–40
VS = 5V
= RL = 1kV
R
F
–50
G = 2
–60
–70
–80
DISTORTION – dB
–90
–100
–110
1.0
2ND @ 10MHz
50V
1kV
2ND @ 2MHz
2ND @ 500kHz
3RD @ 2MHz
3RD @ 500kHz
2.52.01.5
RTO OUTPUT – Volts pk-pk
3.0
+5V
3.5
10mF
+
0.1mF
1k
V
50V
1MV
INPUT
TO 3589A
1k
V
4.0 4.5
Figure 15. Harmonic Distortion vs. Output Signal
Amplitude
–30
VS = 5V
R
= RL = 1kV
I
–40
V
= 2V p-p
O
G = +2
–50
–60
–70
S1 2ND HARMONIC/
–80
SINGLE +5V SUPPLY
DISTORTION – dB
–90
–100
–110
0.01 0.1 1 10
S1 2ND HARMONIC/
DUAL 62.5V SUPPLY
FREQUENCY – MHz, START = 10kHz, STOP = 30MHz
S1 3RD HARMONIC/
DUAL 62.5V SUPPLY
S1 3RD HARMONIC/
SINGLE +5V SUPPLY
Figure 16. Harmonic Distortion vs. Frequency
0.01
0.00
–0.01
%
–0.02
–0.04
–0.06
DIFFERENTIAL GAIN –
DIFFERENTIAL PHASE –
1ST 2ND 3RD 4TH 5TH 6TH 7TH 8TH 9TH 10TH 11TH
0.02
0.00
–0.02
Degrees
–0.04
–0.06
1ST 2ND 3RD 4TH 5TH 6TH 7TH 8TH 9TH 10TH 11TH
Figure 18. Differential Gain and Phase Error, G = 2,
NTSC Input Signal, R
0.010
0.005
%
0.000
–0.005
–0.010
DIFFERENTIAL GAIN –
DIFFERENTIAL PHASE –
1ST 2ND 3RD 4TH 5TH 6TH 7TH 8TH 9TH 10TH 11TH
0.04
0.03
0.02
0.01
Degrees
0.00
–0.01
–0.02
1ST 2ND 3RD 4TH 5TH 6TH 7TH 8TH 9TH 10TH 11TH
= 1 kΩ, VS = 5 V
L
Figure 19. Differential Gain and Phase Error, G = 2,
NTSC Input Signal, R
= 150 Ω, VS = 5 V
L
1.0
0.9
0.8
0.7
0.6
0.5
0.4
0.3
OUTPUT VOLTAGE – Volts
0.2
0.1
0
0.100
0.20
0.30 0.40 0.50
TIME – ms
Figure 17. 400 mV Pulse Response
VS = 5V
R
= 1kV
L
G = 1
–8–
1000
900
VS = 5V
= 1kV
R
800
700
600
500
400
SLEW RATE – V/ms
300
200
100
L
G = 1
0
1.0
1.5
OUTPUT STEP AMPLITUDE – Volts
FALLING EDGE
RISING EDGE
2.0 2.5
3.0
Figure 20. Slew Rate vs. Output Step Amplitude
REV. A
Page 9

1400
500mV/DIV
0 20 40 60 80 100 120 140 160 180 200
2.5V
VOLTS
TIME – ns
0.0V
V
IN
V
OUT
VS = 62.5V
G = 1
R
L
= 1kV
FREQUENCY – MHz
0.01 500
CMRR – dB
0.1 10 100
–100
–90
–80
–70
–60
–50
–40
–30
–20
–10
0
1
SIDE 1
SIDE 2
VCM = 0.2V p-p
R
L
= 100V
V
S
= 62.5V
154V
154V
57.6V
50V
V
IN
200mV p-p
604V
604V
1200
1000
800
FALLING EDGE
FALLING EDGE
= 5V
V
S
V
= 64V
S
AD8061/AD8062/AD8063
600
SLEW RATE – V/ms
400
200
0
0 4.0
1.0 2.0
0.5 1.5 3.0 3.5
OUTPUT STEP – Volts
RISING EDGE
V
= 5V
S
2.5
RISING EDGE
= 64V
V
S
Figure 21. Slew Rate vs. Output Step Amplitude, G = 2,
= 1 kΩ, VS = 5 V
R
L
1000
VS = +5V
R
= 1kV
L
100
10
VOLTAGE NOISE – nV/ Hz
1
10 10M100 1k 100k 1M
10k
FREQUENCY – Hz
Figure 22. Voltage Noise vs. Frequency
Figure 24. Input Overload Recovery, Input Step = 0 V
to 2 V
VS = 62.5V
G = 5
= 1kV
R
L
V
2.5V
VOLTS
1.0V
0.0V
500mV/DIV
0 20 40 60 80 100 120 140 160 180 200
OUT
V
IN
TIME – ns
Figure 25. Output Overload Recovery, Input Step = 0 V
to 1 V
100
10
1
CURRENT NOISE – pA/ Hz
REV. A
0
10 10M
100 1k 100k 1M
Figure 23. Current Noise vs. Frequency
FREQUENCY – Hz
10k
VS = 5V
= 1kV
R
L
Figure 26. CMRR vs. Frequency
–9–
Page 10

AD8061/AD8062/AD8063
0
DVS = 0.2V p-p
RL = 1kV
–10
VS = +5V
–20
–30
–40
–50
PSRR – dB
–60
–70
–80
–90
–100
0.01
–PSRR
+PSRR
1
FREQUENCY – MHz
Figure 27.±PSRR vs. Frequency Delta
–20
–30
–40
–50
–60
–70
–90
–80
–100
OUTPUT TO OUTPUT CROSSTALK – dB
–110
–120
1kV
1kV
+2.5V
IN
50V
–2.5V
INPUT = SIDE 2 INPUT = SIDE 1
0.1 10 100
0.01
OUT
1kV
1
FREQUENCY – MHz
Figure 28. AD8062 Crosstalk, V
G = 1, V
= 5 V
S
VS = 5V
V
= 400mV rms
IN
R
= 1kV
L
G = 2
= 2.0 V p-p, RL = 1 kΩ,
OUT
5000.1 10 100
500
7
VS = 5V
6
5
4
– mA
3
SUPPLY
I
2
1
0
1.5 2.0 2.5
1.0
Figure 30.
6
5
4
3
2
1
OUTPUT VOLTAGE – Volts
0
–1
02.0
Figure 31.
DISABLE
V
DISABLE
0.4
DISABLE
3.0
3.5 4.0 4.5
DISABLE VOLTAGE
5.0
Voltage vs. Supply Current
VS = 5V
G = 2
f
= 10MHz
IN
V
0.8
TIME – ms
OUT
@ 1.3V
RL = 100V
1.2 1.6
BIAS
Function, Voltage = 0 V to 5 V
0
–10
–20
–30
–40
–50
–60
–70
DISABLED ISOLATION – dB
–80
–90
1
FREQUENCY – MHz
10010
VS = 5V
= 0.2V p-p
V
O
= 1kV
R
L
V
BIAS
= 1V
1000
Figure 29. Disabled Output Isolation Frequency Response
1000
VS = 5V
V
= 0.2V p-p
O
R
= 1kV
L
100
V
= 1V
BIAS
V
10
1
IMPEDANCE –
0.1
0.01
0.1 1000
1 10 100
FREQUENCY – MHz
Figure 32. Output Impedance vs. Frequency, V
p-p, R
= 1 kΩ, VS = 5 V
L
–10–
OUT
= 0.2 V
REV. A
Page 11

+0.1%
500mV/DIV
VS = 5V
G = 2
R
L
= 1kV
V
IN
= 1V p-p
0 1020 8090100
3.5V
TIME – ns
2.5V
1.5V
7060504030
20mV/DIV
VS = 5V
G = 2
R
L
= 1kV
V
IN
= 100mV
0 1020 8090100
2.6V
TIME – ns
2.5V
2.4V
7060504030
–0.1%
SETTLING TIME TO 0.1%
t = 0
20ns/DIV
1kV
50V
1kV
VS = 5V
= 1kV
R
L
RL = 1kV
AD8061/AD8062/AD8063
Figure 33. Output Settling Time to 0.1%
50
FALLING EDGE
45
40
35
30
25
20
SETTLING TIME – ns
15
10
5
0
0.5
1 1.5 2
OUTPUT VOLTAGE STEP
RISING EDGE
Figure 34. Settling Time vs. V
4.86
VS = 5V
= 1kV
R
L
G = 1
OUT
VS = 5V
G = –1
= 1kV
R
F
R
= 1kV
L
2.5
Figure 36. 1 V Step Response
Figure 37. 100 mV Step Response
VS = 5V
G = 2
= RL = 1kV
R
F
= 4V p-p
V
IN
2.43
0.0V
1V
REV. A
Figure 35. Output Swing
2ms
–11–
0.0V
2ms/DIV
Figure 38. Output Rail-to-Rail Swing
1V/DIV
Page 12

AD8061/AD8062/AD8063
VS = 5V
G = 1
R
2.6V
2.5V
2.4V
50mV/DIV
0 5 10 40 45 50
TIME – ns
3530252015
Figure 39. 200 mV Step Response
VS = 5V
G = 2
= RF = 1kV
R
L
= 2V p-p
V
IN
4.5V
2.5V
0.5V
= 1kV
L
The input stage will be the headroom limit for signals when the
amplifier is used in a gain of 1 for signals approaching the
positive rail. Figure 41 shows a typical offset voltage versus
input common-mode voltage for the AD806x amplifier on a
5 V supply. Accurate dc performance is maintained from about
200 mV below the minus supply to within 1.8 V of the positive
supply. For high-speed signals, however, there are other considerations. Figure 42 shows –3 dB bandwidth versus dc input
–0.4
–0.8
–1.2
–1.6
–2.0
– mV
OS
V
–2.4
–2.8
–3.2
–3.6
–4.0
–0.5 0 0.5 1.0 1.5 2.0 2.5 3.0 3.5 4.0
VCM – Volts
Figure 41. VOS vs. Common-Mode Voltage, VS = 5 V
2
1V/DIV
0 5 10 40 45 50
TIME – ns
3530252015
Figure 40. 2 V Step Response
CIRCUIT DESCRIPTION
The AD8061/AD8062/AD8063 family are very high-speed voltage feedback op amps. The high slew rate input stage is a true
single-supply topology, capable of sensing signals at or below
the minus supply rail. The rail-to-rail output stage can pull
within 30 mV of either supply rail when driving light loads and
within 0.3 V when driving 150 Ω. High-speed performance is
maintained at supply voltages as low as 2.7 V.
Headroom Considerations
These amplifiers are designed for use in low-voltage systems. To
obtain optimum performance, it is useful to understand the behavior of the amplifier as input and output signals approach the
amplifier’s headroom limits.
The AD806x’s input common-mode voltage range extends from
the negative supply voltage (actually 200 mV below this), or
“ground” for single supply operation, to within 1.8 V of the
positive supply voltage. Thus, at a gain of 2, the AD806x can
provide full “rail-to-rail” output swing for supply voltage as low
as 3.6 V, assuming the input signal swing from –V
to +V
/2. At a gain of 3, the AD806x can provide a rail-to-rail
S
(or ground)
S
output range down to 2.7 V total supply voltage.
Exceeding the headroom limit is not a concern for any inverting
gain on any supply voltage, as long as the reference voltage at
the amplifier’s positive input lies within the amplifier’s input
common-mode range.
0
–2
GAIN – dB
–4
–6
–8
0.1
1 10 100 1000 10000
FREQUENCY – MHz
VCM = 3.0
VCM = 3.1
VCM = 3.2
VCM = 3.3
VCM = 3.4
Figure 42. Unity Gain Follower Bandwidth vs. Input
Common Mode, V
= 5 V
S
voltage for a unity gain follower. As the common-mode voltage
approaches the positive supply, the amplifier holds together
well, but the bandwidth begins to drop at 1.9 V within +V
.
S
This can manifest itself in increased distortion or settling time.
Figure 12 plots the distortion of a 1 V p-p signal with the
AD806x amplifier used as a follower on a 5 V supply versus
signal common-mode voltage. Distortion performance is maintained until the input signal center voltage gets beyond 2.5 volts,
as the peak of the input sine wave begins to run into the upper
common-mode voltage limit. Higher frequency signals require
more headroom than the lower frequencies to maintain distortion performance. Figure 43 illustrates how the rising edge
settling time for the amplifier configured as a unity gain follower
stretches out as the top of a 1 V step input approaches and exceeds
the specified input common-mode voltage limit.
–12–
REV. A
Page 13

AD8061/AD8062/AD8063
For signals approaching the minus supply and inverting gain
and high positive gain configurations, the headroom limit will be
the output stage. The AD806x amplifiers use a common emitter
style output stage. This output stage maximizes the available
output range, limited by the saturation voltage of the output
transistors. The saturation voltage increases with the drive
current the output transistor is required to supply, due to the
output transistors’ collector resistance. The saturation voltage
can be estimated using the equation V
where I
is the output current, and 8 Ω is a typical value for the
O
= 25 mV + I
SAT
× 8 Ω,
O
output transistors’ collector resistance.
3.6
3.4
3.2
3.0
2.8
2.6
2.4
OUTPUT VOLTAGE – Volts
2.2
2.0
4 8 12 16 20 24 28 32
0
2V TO 3V STEP
2.1V TO 3.1V STEP
2.2V TO 3.2V STEP
2.3V TO 3.3V STEP
2.4V TO 3.4V STEP
TIME – ns
Figure 43. Output Rising Edge for 1 V Step at Input Headroom Limits, G = 1, V
= 5 V, 0 V
S
As the saturation point of the output stage is approached, the
output signal will show increasing amounts of compression and
clipping. As in the input headroom case, the higher frequency
signals require a bit more headroom than the lower frequency
signals. Figures 13, 14, and 15 illustrate the point, plotting typical distortion versus output amplitude and bias for gains of 2
and 5.
Overload Behavior and Recovery
Input
The specified input common-mode voltage of the AD806x is
–200 mV below the negative supply to within 1.8 V of the positive supply. Exceeding the top limit results in lower bandwidth
and increased settling time as seen in the previous Figures 42
and 43. Pushing the input voltage of a unity gain follower beyond
1.6 V within the positive supply leads to the behavior shown in
Figure 44—an increasing amount of output error as well as
much increased settling time. Recovery time from input voltages 1.6 V or closer to the positive supply is about 35 ns, which
is limited by the settling artifacts caused by transistors in the
input stage coming out of saturation.
The AD806x family does not exhibit phase reversal, even for
input voltages beyond the voltage supply rails. Going more than
0.6 V beyond the power supplies will turn on protection diodes
at the input stage which will greatly increase the device’s current
draw.
3.7
3.5
3.3
3.1
VOLTAGE STEP FROM 2.4V TO 3.4V
2.9
2.7
OUTPUT VOLTAGE – Volts
2.5
2.3
2.1
VOLTAGE STEP FROM 2.4V TO 3.6V
VOLTAGE STEP FROM 2.4V TO 3.8V, 4 AND 5V
100
0
200 300 400 500 600
TIME – ns
Figure 44. Pulse Response for G = 1 Follower, Input Step
Overloading the Input Stage
Output
Output overload recovery is typically within 40 ns after the
amplifier’s input is brought to a nonoverloading value. Figure
45 shows output recovery transients for the amplifier recovering
from a saturated output from the top and bottom supplies to a
point at midsupply.
5.0
4.6
4.2
3.8
3.4
3.0
INPUT VOLTAGE
2.6
2.2
1.8
1.4
1.0
.60
INPUT AND OUTPUT VOLTAGE – Volts
.20
–.20
0 10203040506070
EDGES
TIME – ns
OUTPUT VOLTAGE
5V TO 2.5V
OUTPUT VOLTAGE
0V TO 2.5V
R
V
IN
2.5V
R
5V
V
O
Figure 45. Overload Recovery, G = –1, VS = 5 V
CAPACITIVE LOAD DRIVE
The AD806x family is optimized for bandwidth and speed, not
for driving capacitive loads. Output capacitance will create a
pole in the amplifier’s feedback path, leading to excessive
peaking and potential oscillation. If dealing with load capacitance is a requirement of the application, the two strategies to
consider are (1) using a small resistor in series with the
amplifier’s output and the load capacitance and (2) reducing
the bandwidth of the amplifier’s feedback loop by increasing the
overall noise gain.
REV. A
–13–
Page 14

AD8061/AD8062/AD8063
Figure 46 shows a unity gain follower using the series resistor
strategy. The resistor isolates the output from the capacitance
and, more importantly, creates a zero in the feedback path that
compensates for the pole created by the output capacitance.
R
AD8061
V
IN
SERIES
C
LOAD
V
O
Figure 46. Series Resistor Isolating Capacitive Load
Voltage feedback amplifiers like those in AD806x family will be
able to drive more capacitive load without excessive peaking
when used in higher gain configurations. This is because the
increased noise gain reduces the bandwidth of the overall feedback loop. Figure 47 plots the capacitance that produces 30%
overshoot versus noise gain for a typical amplifier.
10000
1000
CAPACITIVE LOAD – pF
RS = 4.7
100
10
152
RS = 0
34
CLOSED-LOOP GAIN
Figure 47. Capacitive Load vs. Closed-Loop Gain
DISABLE OPERATION
The internal circuit for the AD8063 disable function is shown in
Figure 48. When the DISABLE node is pulled below 2 V from
the positive supply, the supply current will decrease from typi-
cally 6.5 mA to under 400 µA, and the AD8063 output will
enter a high impedance state. If the DISABLE node is not con-
nected, and thus is allowed to float, the AD8063 will stay biased
at full power.
VCC
2V
TO AMPLIFIER
DISABLE
VEE
BIAS
Figure 48. Disable Circuit of the AD8063
Figure 30 shows AD8063 supply current versus DISABLE voltage. Figure 31 plots the output seen when the AD8063 input is
driven with a 10 MHz sine wave, and the DISABLE is toggled
from 0 to +5 V, illustrating the part’s turn on and turn off time.
Figure 29 shows the input/output isolation response with the
AD8063 shut off.
BOARD LAYOUT CONSIDERATIONS
Maintaining the high speed performance of the AD806x family
requires the use of high speed board layout techniques and low
parasitic components.
The PCB should have a ground plane covering unused portions
of the component side of the board to provide a low impedance
path. The ground plane should be removed near the package to
reduce parasitic capacitance.
Proper bypassing is critical. A ceramic 0.1 µF chip capacitor
should be used to bypass both supplies, and be located within
3 mm of each power pin. An additional 4.7 µF to 10 µF tanta-
lum electrolytic capacitor should be connected in parallel to
provide charge for fast, large signal changes at the output.
Minimizing parasitic capacitance at the amplifier’s inverting
input pin is very important. The feedback resistor should be
located close to the inverting input pin. The value of the feed-
back resistor may come into play—for instance, 1 kΩ interacting
with 1 pF of parasitic capacitance creates a pole at 159 MHz.
Stripline design techniques should be used for signal traces
longer than 25 mm. These should be designed with either 50 Ω
or 75 Ω characteristic impedance, and be properly terminated at
each end.
APPLICATIONS
Single Supply Sync Stripper
When a video signal contains synchronization pulses, it is
sometimes desirable to remove them prior to performing
certain operations. In the case of A-to-D conversion, the sync
pulses will consume some of the dynamic range, so removing
them will increase the converter’s available dynamic range for
the video information.
Figure 49 shows a basic circuit for creating a sync stripper using
the AD8061 powered by a single supply. When the negative supply is at ground potential, the lowest potential to
which the output can go is ground. This feature is exploited
to create a waveform whose lowest amplitude is the black level
of the video and does not include the sync level.
3V
VIDEO IN
75V
3
2
R
1kV
AD8061
G
0.1mF
7
R
4
F
1kV
6
PIN NUMBERS ARE
FOR 8-PIN PACKAGE
10mF
75V
VIDEO OUT
75V
Figure 49. Single 3 V Sync Stripper Using AD8061
In this case, the input video signal has its black level at ground,
so it comes out at ground at the input. Since the sync level is below
the black level, it will not show up at the output. However, all
of the active video portion of the waveform will be amplified
by a gain of two and then be normalized to unity gain by the
back-terminated transmission line. Figure 50 is an oscilloscope
plot of the input and output waveforms.
–14–
REV. A
Page 15

AD8061/AD8062/AD8063
1
INPUT
2
OUTPUT
500mV
10ms
Figure 50. Input and Output Waveforms for a Single
Supply Video Sync Stripper Using an AD8061
Some video signals with sync are derived from single supply
devices, such as video DACs. These signals can contain sync,
but the whole waveform is positive, and the black level is not at
ground but at some positive voltage. The circuit can be modified to
provide the sync stripping function for such a waveform. Instead
of connecting RG to ground, it should be connected to a dc
voltage that is two times the black-level of the input signal. The
gain from the +input to the output is two, which means that
the black level will be amplified by two to the output. However,
the gain through RG is –unity to the output. It will take a dc
level of twice the input black level to shift the black level to
ground at the output. When this occurs, the sync will be
stripped, and the active video will be passed as in the ground
referenced case.
RED
DAC
GREEN
DAC
BLUE
DAC
75V
75V
75V
1kV
1kV
1kV
2
3
2
3
5
6
+3V
7
AD8061
4
+3V
8
AD8062
AD8062
1kV
1kV
1kV
75V
75V
75V
6
MONITOR
#1
10mF0.1mF
10mF0.1mF
1
7
4
75V
75V
75V
RED
75V
MONITOR
#2
GREEN
75V
BLUE
75V
RGB Amplifier
Most RGB graphics signals are created by video-DAC outputs
that drive a current through a resistor to ground. At the video
black-level, the current goes to zero and thus the voltage of the
video is also zero. Before the availability of high speed rail-torail op amps, it was essential that an amplifier have a negative
supply to amplify such a signal. Such an amplifier is necessary
if one wants to drive a second monitor with from the same
DAC outputs.
However, high speed, rail-to-rail output amplifiers like the AD8061
and AD8062 can accept ground level input signals and output
ground level signals, and thus be used as RGB signal amplifiers.
A combination of the AD8061 (single) and AD8062 (dual) can
amplify the three video channels of an RGB system. Figure 51
shows a circuit that performs this function.
Multiplexer
The AD8063 has a disable pin that can be used to power-down
the amplifier to save power, or can be used to create a mux circuit.
If two (or more) AD8063 outputs are connected together and
only one is enabled, then only the signal of the enabled amplifier
will appear at the output. This configuration can be used to select
from various input-signal sources. Additionally, the same input
signal can be applied to different gain stages or differently
tuned filters to make a gain-step amplifier or a selectablefrequency amplifier.
Figure 52 shows a schematic of two AD8063s used to create a
mux that selects between two inputs. One of these is a 1 V p-p,
3 MHz sine wave and the other is a 2 V p-p, 1 MHz sine wave.
+4V
10mF0.1mF
–4V
+4V
–4V
1
1kV
1
1kV
HCO4
10mF0.1mF
49.9V
V
OUT
49.9V
10mF0.1mF
10mF0.1mF
1V
3MHz
2V
1MHz
P-P
P-P
TIME
BASE
OUT
TIME
BASE
IN
SELECT
49.9V
1kV
49.9V
1kV
AD8063
AD8063
Figure 52. Two-to-One Multiplexer Using Two AD8063s
Figure 51. RGB Cable Driver Using AD8061 and AD8062
REV. A
–15–
Page 16

AD8061/AD8062/AD8063
The SELECT signal and the output waveforms for this circuit
are shown in Figure 53. For synchronization clarity, two different frequency synthesizers whose time bases are locked to each
other generate the signals.
OUTLINE DIMENSIONS
Dimensions shown in inches and (mm).
5-Lead SOT-23-5
(RT-5)
0.1220 (3.100)
0.1063 (2.700)
0.0709 (1.800)
0.0590 (1.500)
0.0512 (1.300)
0.0354 (0.900)
0.0059 (0.150)
0.0000 (0.000)
54
1 3 2
PIN 1
0.0748 (1.900)
REF
0.0197 (0.500)
0.0118 (0.300)
0.1181 (3.000)
0.0984 (2.500)
0.0374 (0.950) REF
0.0571 (1.450)
0.0354 (0.900)
SEATING
PLANE
108
08
0.0079 (0.200)
0.0035 (0.090)
0.0236 (0.600)
0.0039 (0.100)
0.1574 (4.00)
0.1497 (3.80)
PIN 1
0.0098 (0.25)
0.0040 (0.10)
SEATING
OUTPUT
SELECT
1V
Figure 53. AD8063 Mux Output
8-Lead SOIC
(R-8)
0.1968 (5.00)
0.1890 (4.80)
85
0.0500 (1.27)
PLANE
0.2440 (6.20)
0.2284 (5.80)
41
BSC
0.0192 (0.49)
0.0138 (0.35)
0.102 (2.59)
0.094 (2.39)
0.0098 (0.25)
0.0075 (0.19)
2ms
2V
0.0196 (0.50)
0.0099 (0.25)
88
08
0.0500 (1.27)
0.0160 (0.41)
C3702–0–2/00 (rev. A)
3 458
0.071 (1.80)
0.059 (1.50)
0.051 (1.30)
0.035 (0.90)
PIN 1
0.006 (0.15)
0.000 (0.00)
0.122 (3.10)
0.106 (2.70)
1
0.075 (1.90)
6-Lead SOT-23-6
(RT-6)
4 5 6
0.118 (3.00)
2
BSC
0.020 (0.50)
0.010 (0.25)
0.098 (2.50)
3
0.037 (0.95) BSC
0.057 (1.45)
0.035 (0.90)
SEATING
PLANE
0.009 (0.23)
0.003 (0.08)
108
08
0.022 (0.55)
0.014 (0.35)
–16–
0.122 (3.10)
0.114 (2.90)
0.006 (0.15)
0.002 (0.05)
0.122 (3.10)
0.114 (2.90)
85
PIN 1
0.0256 (0.65) BSC
0.016 (0.40)
0.010 (0.25)
8-Lead SOIC
(RM-8)
0.193
(4.90)
BSC
41
0.043
(1.10)
MAX
SEATING
PLANE
0.009 (0.23)
0.005 (0.13)
68
08
0.037 (0.95)
0.030 (0.75)
0.028 (0.70)
0.016 (0.40)
PRINTED IN U.S.A.
REV. A
 Loading...