

Datasheet AD8032BR-REEL7, AD8032BR-REEL, AD8032BR, AD8032BN, AD8032ARM-REEL Datasheet (Analog Devices)
...Page 1

a
1
2
3
4
8
7
6
5
AD8032
OUT1
–IN1
+IN1
–V
S
+IN2
–IN2
+V
S
OUT2
2ms/Div
1V/Div
1V/Div
2ms/Div
V
IN
+5V
1kV
1.7pF
+2.5V
V
OUT
2.7 V, 800 A, 80 MHz
Rail-to-Rail I/O Amplifiers
AD8031/AD8032
FEATURES
Low Power
Supply Current 800 A/Amplifier
Fully Specified at +2.7 V, +5 V and ⴞ5 V Supplies
High Speed and Fast Settling on +5 V
80 MHz –3 dB Bandwidth (G = +1)
30 V/s Slew Rate
125 ns Settling Time to 0.1%
Rail-to-Rail Input and Output
No Phase Reversal with Input 0.5 V Beyond Supplies
Input CMVR Extends Beyond Rails by 200 mV
Output Swing to Within 20 mV of Either Rail
Low Distortion
–62 dB @ 1 MHz, V
–86 dB @ 100 kHz, V
= 2 V p-p
O
= 4.6 V p-p
O
Output Current: 15 mA
High Grade Option
V
(max) = 1.5 mV
OS
APPLICATIONS
High-Speed Battery-Operated Systems
High Component Density Systems
Portable Test Instruments
A/D Buffer
Active Filters
High-Speed Set-and-Demand Amplifier
GENERAL DESCRIPTION
The AD8031 (single) and AD8032 (dual) single supply voltage
feedback amplifiers feature high-speed performance with 80 MHz
of small signal bandwidth, 30 V/µs slew rate and 125 ns settling
time. This performance is possible while consuming less than
4.0 mW of power from a single +5 V supply. These features
increase the operation time of high speed battery-powered
systems without compromising dynamic performance.
The products have true single supply capability with rail-to-rail
input and output characteristics and are specified for +2.7 V,
+5 V and ±5 V supplies. The input voltage range can extend to
500 mV beyond each rail. The output voltage swings to within
20 mV of each rail providing the maximum output dynamic range.
The AD8031/AD8032 also offer excellent signal quality for only
800 µA of supply current per amplifier; THD is –62 dBc with a
2 V p-p, 1 MHz output signal and –86 dBc for a 100 kHz, 4.6 V p-p
signal on +5 V supply. The low distortion and fast settling
make them ideal as buffers to single supply, A-to-D converters.
Operating on supplies from +2.7 V to +12 V and dual supplies up to
time
±6 V, the AD8031/AD8032 are ideal for a wide range of applications,
from battery-operated systems with large bandwidth requirements
CONNECTION DIAGRAMS
8-Lead Plastic DIP (N)
and SOIC (R) Packages
8-Lead Plastic DIP (N),
SOIC (R) and SOIC (RM)
Packages
AD8031
NC
1
–IN
2
+IN
3
–V
4
S
NC = NO CONNECT
NC
8
+V
7
S
OUT
6
NC
5
5-Lead Plastic Surface Mount Package
SOT-23-5 (RT-5)
V
OUT
–V
S
+IN
AD8031
1
2
3
(Not to Scale)
+V
5
S
4
–IN
to high-speed systems where component density requires lower
power dissipation. The AD8031/AD8032 are available in 8-lead
plastic DIP and SOIC packages and will operate over the indus-
trial temperature range of –40°C to +85°C. The AD8031A is also
available in the space-saving 5-lead SOT-23-5 package and the
AD8032A is available in AN 8-lead µSOIC package.
Input V
IN
Output V
OUT
Circuit Diagram
REV. B
Information furnished by Analog Devices is believed to be accurate and
reliable. However, no responsibility is assumed by Analog Devices for its
use, nor for any infringements of patents or other rights of third parties
which may result from its use. No license is granted by implication or
otherwise under any patent or patent rights of Analog Devices.
Figure 1. Rail-to-Rail Performance at 100 kHz
One Technology Way, P.O. Box 9106, Norwood, MA 02062-9106, U.S.A.
Tel: 781/329-4700 World Wide Web Site: http://www.analog.com
Fax: 781/326-8703 © Analog Devices, Inc., 1999
Page 2

AD8031/AD8032–SPECIFICATIONS
+2.7 V Supply
(@ TA = +25ⴗC, VS = +2.7 V, RL = 1 k⍀ to +1.35 V, RF = 2.5 k⍀ unless otherwise noted)
AD8031A/AD8032A AD8031B/AD8032B
Parameter Conditions Min Typ Max Min Typ Max Units
DYNAMIC PERFORMANCE
–3 dB Small Signal Bandwidth G = +1, V
Slew Rate G = –1, V
< 0.4 V p-p 54 80 54 80 MHz
O
= 2 V Step 25 30 25 30 V/µs
O
Settling Time to 0.1% G = –1, VO = 2 V Step, CL = 10 pF 125 125 ns
DISTORTION/NOISE PERFORMANCE
Total Harmonic Distortion f
= 1 MHz, VO = 2 V p-p, G = +2 –62 –62 dBc
C
= 100 kHz, VO = 2 V p-p, G = +2 –86 –86 dBc
f
C
Input Voltage Noise f = 1 kHz 15 15 nV/√Hz
Input Current Noise f = 100 kHz 2.4 2.4 pA/√Hz
f = 1 kHz 5 5 pA/√Hz
Crosstalk (AD8032 Only) f = 5 MHz –60 –60 dB
DC PERFORMANCE
V
Input Offset Voltage V
T
Offset Drift V
Input Bias Current V
T
CM
MIN
CM
CM
MIN
=
to T
=
=
to T
CC
;
V
= 1.35 V ±1 ±6 ± 0.5 ±1.5 mV
OUT
2
MAX
V
CC
;
V
= 1.35 V 10 10 µV/°C
OUT
2
V
CC
;
V
= 1.35 V 0.45 2 0.45 2 µA
OUT
2
MAX
±6 ±10 ±1.6 ± 2.5 mV
2.2 2.2 µA
Input Offset Current 50 500 50 500 nA
V
CC
=
;
V
Open Loop Gain V
CM
2
T
to T
MIN
MAX
= 0.35 V to 2.35 V 76 80 76 80 dB
OUT
74 74 dB
INPUT CHARACTERISTICS
Common-Mode Input Resistance 40 40 MΩ
Differential Input Resistance 280 280 kΩ
Input Capacitance 1.6 1.6 pF
Input Voltage Range –0.5 to –0.5 to
+3.2 +3.2 V
Input Common-Mode Voltage Range
–0.2 to –0.2 to
+2.9 +2.9 V
Common-Mode Rejection Ratio V
= 0 V to 2.7 V 46 64 46 64 dB
CM
= 0 V to 1.55 V 58 74 58 74 dB
V
CM
Differential Input Voltage 3.4 3.4 V
OUTPUT CHARACTERISTICS
Output Voltage Swing Low R
= 10 kΩ +0.05 +0.02 +0.05 +0.02 V
L
Output Voltage Swing High +2.6 +2.68 +2.6 +2.68 V
Output Voltage Swing Low R
= 1 kΩ +0.15 +0.08 +0.15 +0.08 V
L
Output Voltage Swing High +2.55 +2.6 +2.55 +2.6 V
Output Current 15 15 mA
Short Circuit Current Sourcing 21 21 mA
Sinking –34 –34 mA
Capacitive Load Drive G = +2 (See Figure 41) 15 15 pF
POWER SUPPLY
Operating Range +2.7 +12 +2.7 +12 V
Quiescent Current per Amplifier 750 1250 750 1250 µA
Power Supply Rejection Ratio V
– = 0 V to –1 V or
S
VS+ = +2.7 V to +3.7 V 75 86 75 86 dB
Specifications subject to change without notice.
REV. B–2–
Page 3

SPECIFICATIONS
AD8031/AD8032
+5 V Supply
(@ TA = +25ⴗC, VS = +5 V, RL = 1 k⍀ to +2.5 V, RF = 2.5 k⍀ unless otherwise noted)
AD8031A/AD8032A AD8031B/AD8032B
Parameter Conditions Min Typ Max Min Typ Max Units
DYNAMIC PERFORMANCE
–3 dB Small Signal Bandwidth G = +1, V
Slew Rate G = –1, V
< 0.4 V p-p 54 80 54 80 MHz
O
= 2 V Step 27 32 27 32 V/µs
O
Settling Time to 0.1% G = –1, VO = 2 V Step, CL = 10 pF 125 125 ns
DISTORTION/NOISE PERFORMANCE
Total Harmonic Distortion f
= 1 MHz, VO = 2 V p-p, G = +2 –62 –62 dBc
C
= 100 kHz, VO = 2 V p-p, G = +2 –86 –86 dBc
f
C
Input Voltage Noise f = 1 kHz 15 15 nV/√Hz
Input Current Noise f = 100 kHz 2.4 2.4 pA/√Hz
f = 1 kHz 5 5 pA/√Hz
Differential Gain R
Differential Phase R
= 1 kΩ 0.17 0.17 %
L
= 1 kΩ 0.11 0.11 Degrees
L
Crosstalk (AD8032 Only) f = 5 MHz –60 –60 dB
DC PERFORMANCE
V
Input Offset Voltage V
T
Offset Drift V
Input Bias Current V
T
CM
MIN
CM
CM
MIN
=
to T
=
=
to T
CC
;
V
= 2.5 V ±1 ±6 ±0.5 ±1.5 mV
OUT
2
MAX
V
CC
;
V
= 2.5 V 5 5 µV/°C
OUT
2
V
CC
;
V
= 2.5 V 0.45 1.2 0.45 1.2 µA
OUT
2
MAX
±6 ±10 ±1.6 ± 2.5 mV
2.0 2.0 µA
Input Offset Current 50 350 50 250 nA
V
CC
=
;
V
Open Loop Gain V
CM
2
T
to T
MIN
MAX
= 1.5 V to 3.5 V 76 82 76 82 dB
OUT
74 74 dB
INPUT CHARACTERISTICS
Common-Mode Input Resistance 40 40 MΩ
Differential Input Resistance 280 280 kΩ
Input Capacitance 1.6 1.6 pF
Input Voltage Range –0.5 to –0.5 to
+5.5 +5.5 V
Input Common-Mode Voltage Range
–0.2 to –0.2 to
+5.2 +5.2 V
Common-Mode Rejection Ratio V
= 0 V to 5 V 56 70 56 70 dB
CM
= 0 V to 3.8 V 66 80 66 80 dB
V
CM
Differential Input Voltage 3.4 3.4 V
OUTPUT CHARACTERISTICS
Output Voltage Swing Low R
= 10 kΩ +0.05 +0.02 +0.05 +0.02 V
L
Output Voltage Swing High +4.95 +4.98 +4.95 +4.98 V
Output Voltage Swing Low R
= 1 kΩ +0.2 +0.1 +0.2 +0.1 V
L
Output Voltage Swing High +4.8 +4.9 +4.8 +4.9 V
Output Current 15 15 mA
Short Circuit Current Sourcing 28 28 mA
Sinking –46 –46 mA
Capacitive Load Drive G = +2 (See Figure 41) 15 15 pF
POWER SUPPLY
Operating Range +2.7 +12 +2.7 +12 V
Quiescent Current per Amplifier 800 1400 800 1400 µA
Power Supply Rejection Ratio V
– = 0 V to –1 V or
S
VS+ = +5 V to +6 V 75 86 75 86 dB
Specifications subject to change without notice.
REV. B
–3–
Page 4

AD8031/AD8032–SPECIFICATIONS
ⴞ5 V Supply
(@ TA = +25ⴗC, VS = ⴞ5 V, RL = 1 k⍀ to 0 V, RF = 2.5 k⍀ unless otherwise noted)
AD8031A/AD8032A AD8031B/AD8032B
Parameter Conditions Min Typ Max Min Typ Max Units
DYNAMIC PERFORMANCE
–3 dB Small Signal Bandwidth G = +1, V
Slew Rate G = –1, V
< 0.4 V p-p 54 80 54 80 MHz
O
= 2 V Step 30 35 30 35 V/µs
O
Settling Time to 0.1% G = –1, VO = 2 V Step, CL = 10 pF 125 125 ns
DISTORTION/NOISE PERFORMANCE
Total Harmonic Distortion f
= 1 MHz, VO = 2 V p-p, G = +2 –62 –62 dBc
C
= 100 kHz, VO = 2 V p-p, G = +2 –86 –86 dBc
f
C
Input Voltage Noise f = 1 kHz 15 15 nV/√Hz
Input Current Noise f = 100 kHz 2.4 2.4 pA/√Hz
f = 1 kHz 5 5 pA/√Hz
Differential Gain R
Differential Phase R
= 1 kΩ 0.15 0.15 %
L
= 1 kΩ 0.15 0.15 Degrees
L
Crosstalk (AD8032 Only) f = 5 MHz –60 –60 dB
DC PERFORMANCE
Input Offset Voltage V
Offset Drift V
Input Bias Current V
CM
T
MIN
CM
CM
T
MIN
= 0 V; V
to T
= 0 V; V
= 0 V; V
to T
= 0 V ±1 ±6 ±0.5 ±1.5 mV
OUT
MAX
= 0 V 5 5 µV/°C
OUT
= 0 V 0.45 1.2 0.45 1.2 µA
OUT
MAX
±6 ±10 ±1.6 ± 2.5 mV
2.0 2.0 µA
Input Offset Current 50 350 50 250 nA
Open Loop Gain V
CM
T
MIN
= 0 V; V
to T
= ±2 V 76 80 76 80 dB
OUT
MAX
74 74 dB
INPUT CHARACTERISTICS
Common-Mode Input Resistance 40 40 MΩ
Differential Input Resistance 280 280 kΩ
Input Capacitance 1.6 1.6 pF
Input Voltage Range –5.5 to –5.5 to
+5.5 +5.5 V
Input Common-Mode Voltage Range
–5.2 to –5.2 to
+5.2 +5.2 V
Common-Mode Rejection Ratio V
= –5 V to +5 V 60 80 60 80 dB
CM
= –5 V to +3.5 V 66 90 66 90 dB
V
CM
Differential/Input Voltage 3.4 3.4 V
OUTPUT CHARACTERISTICS
Output Voltage Swing Low R
= 10 kΩ –4.94 –4.98 –4.94 –4.98 V
L
Output Voltage Swing High +4.94 +4.98 +4.94 +4.98 V
Output Voltage Swing Low R
= 1 kΩ –4.7 –4.85 –4.7 –4.85 V
L
Output Voltage Swing High +4.7 +4.75 +4.7 +4.75 V
Output Current 15 15 mA
Short Circuit Current Sourcing 35 35 mA
Sinking –50 –50 mA
Capacitive Load Drive G = +2 (See Figure 41) 15 15 pF
POWER SUPPLY
Operating Range ±1.35 ±6 ±1.35 ±6V
Quiescent Current per Amplifier 900 1600 900 1600 µA
Power Supply Rejection Ratio V
– = –5 V to –6 V or
S
VS+ = +5 V to +6 V 76 86 76 86 dB
Specifications subject to change without notice.
–4–
REV. B
Page 5
AD8031/AD8032
WARNING!
ESD SENSITIVE DEVICE
ABSOLUTE MAXIMUM RATINGS
Supply Voltage . . . . . . . . . . . . . . . . . . . . . . . . . . . . . . . +12.6 V
Internal Power Dissipation
2
1
Plastic DIP Package (N) . . . . . . . . . . . . . . . . . . . 1.3 Watts
Small Outline Package (R) . . . . . . . . . . . . . . . . . . 0.8 Watts
µSOIC (RM) . . . . . . . . . . . . . . . . . . . . . . . . . . . . 0.6 Watts
SOT-23-5 (RT) . . . . . . . . . . . . . . . . . . . . . . . . . . 0.5 Watts
Input Voltage (Common-Mode) . . . . . . . . . . . . . ±V
± 0.5 V
S
Differential Input Voltage . . . . . . . . . . . . . . . . . . . . . . . ±3.4 V
Output Short Circuit Duration
. . . . . . . . . . . . . . . . . . . . . . Observe Power Derating Curves
Storage Temperature Range (N, R, RM, RT)
. . . . . . . . . . . . . . . . . . . . . . . . . . . . . . . . . . –65°C to +125°C
Lead Temperature Range (Soldering 10 sec) . . . . . . . . +300°C
NOTES
1
Stresses above those listed under Absolute Maximum Ratings may cause perma-
nent damage to the device. This is a stress rating only; functional operation of the
device at these or any other conditions above those indicated in the operational
section of this specification is not implied. Exposure to absolute maximum rating
conditions for extended periods may affect device reliability.
2
Specification is for the device in free air:
8-Lead Plastic DIP Package: θJA = 90°C/W.
8-Lead SOIC Package: θJA = 155°C/W.
8-Lead µSOIC Package: θJA = 200°C/W.
5-Lead SOT-23-5 Package: θJA = 240°C/W.
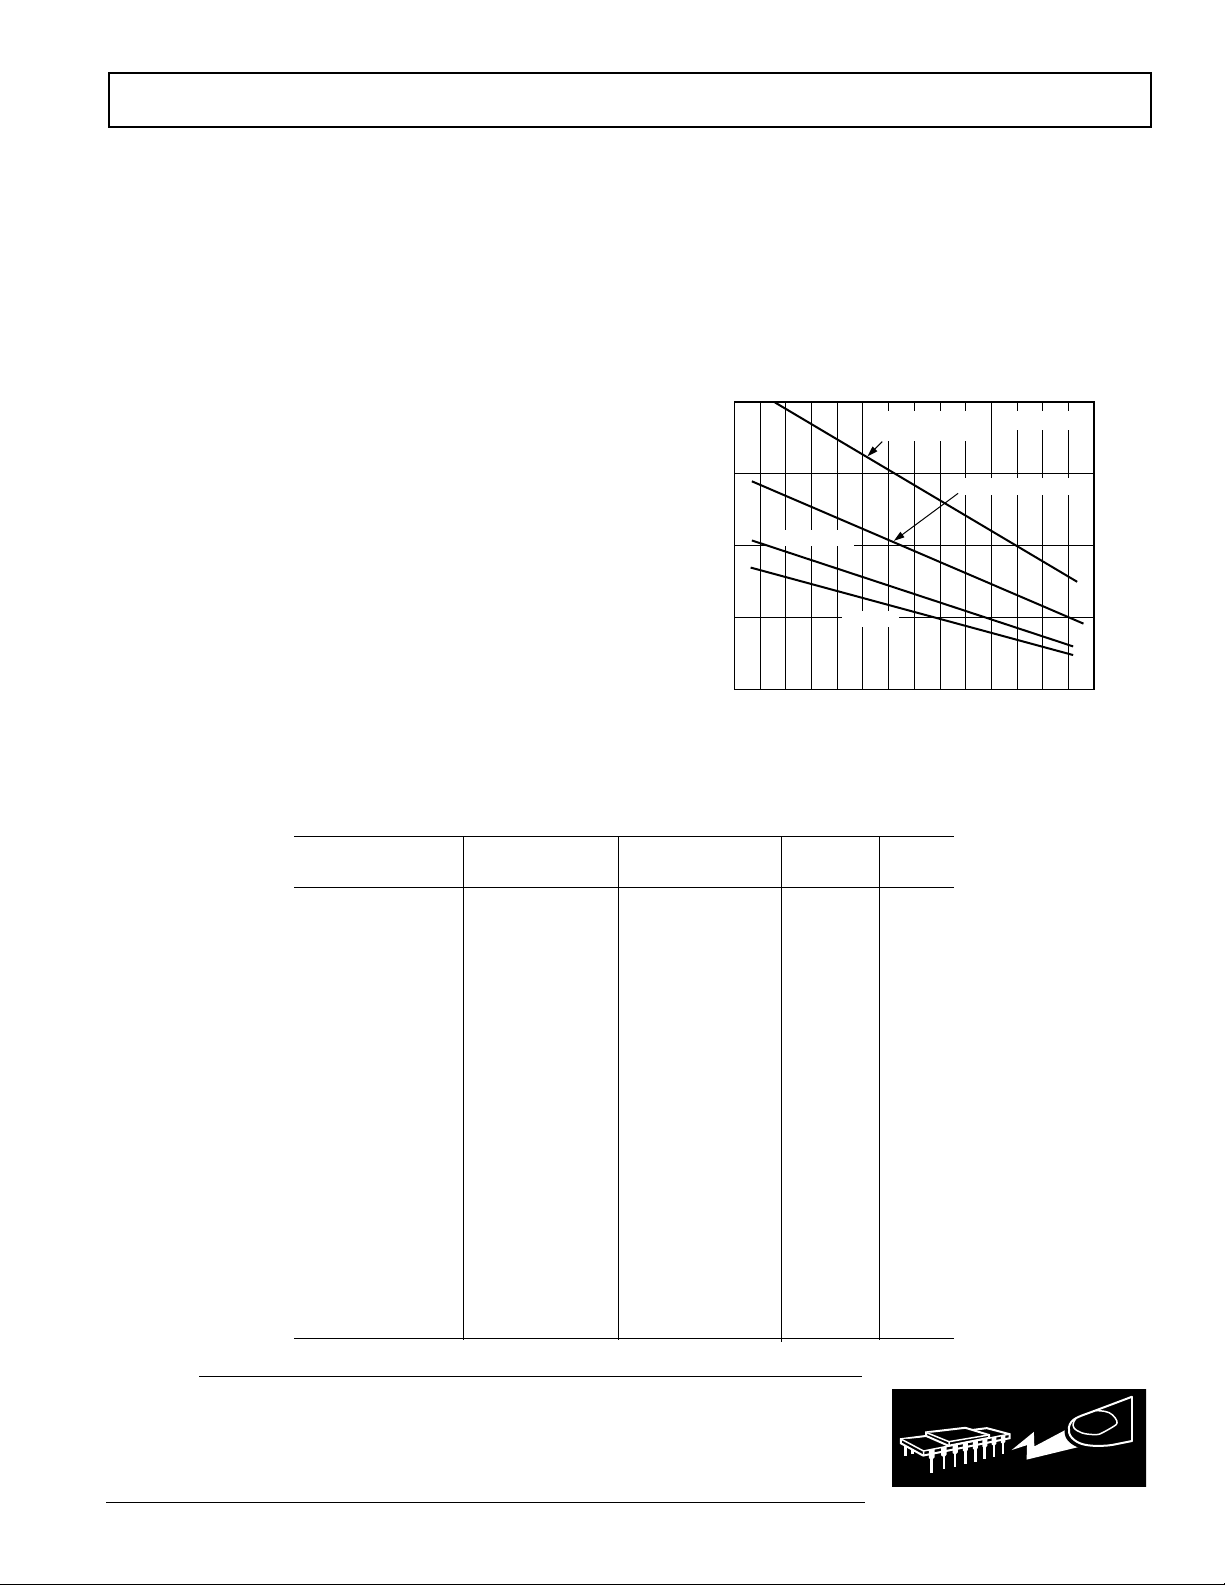
MAXIMUM POWER DISSIPATION
The maximum power that can be safely dissipated by the
AD8031/AD8032 are limited by the associated rise in junction
temperature. The maximum safe junction temperature for plastic encapsulated devices is determined by the glass transition
temperature of the plastic, approximately +150°C. Exceeding
this limit temporarily may cause a shift in parametric performance due to a change in the stresses exerted on the die by
the package. Exceeding a junction temperature of +175°C for
an extended period can result in device failure.
While the AD8031/AD8032 are internally short circuit protected, this may not be sufficient to guarantee that the maxi-
mum junction temperature (+150°C) is not exceeded under
all conditions. To ensure proper operation, it is necessary to
observe the maximum power derating curves shown in Figure 2.
2.0
1.5
8-LEAD mSOIC
1.0
0.5
MAXIMUM POWER DISSIPATION – Watts
0
–50 80–40
–30 –20 –10010 20 30 40 50 60 70
8-LEAD PLASTIC
DIP PACKAGE
SOT-23-5
AMBIENT TEMPERATURE – 8C
8-LEAD SOIC PACKAGE
TJ = +1508C
90
Figure 2. Maximum Power Dissipation vs. Temperature
ORDERING GUIDE
Temperature Package Package Brand
Model Range Descriptions Options Code
AD8031AN –40°C to +85°C 8-Lead Plastic DIP N-8
AD8031AR –40°C to +85°C 8-Lead SOIC SO-8
AD8031AR-REEL –40°C to +85°C 13" Tape and Reel SO-8
AD8031AR-REEL7 –40°C to +85°C 7" Tape and Reel SO-8
AD8031ART-REEL –40°C to +85°C 13" Tape and Reel RT-5 H0A
AD8031ART-REEL7 –40°C to +85°C 7" Tape and Reel RT-5 H0A
AD8031BN –40°C to +85°C 8-Lead Plastic DIP N-8
AD8031BR –40°C to +85°C 8-Lead SOIC SO-8
AD8031BR-REEL –40°C to +85°C 13" Tape and Reel SO-8
AD8031BR-REEL7 –40°C to +85°C 7" Tape and Reel SO-8
AD8032AN –40°C to +85°C 8-Lead Plastic DIP N-8
AD8032AR –40°C to +85°C 8-Lead SOIC SO-8
AD8032AR-REEL –40°C to +85°C 13" Tape and Reel SO-8
AD8032AR-REEL7 –40°C to +85°C 7" Tape and Reel SO-8
AD8032ARM –40°C to +85°C 8-Lead µSOIC RM-8 H9A
AD8032ARM-REEL –40°C to +85°C 13" Tape and Reel RM-8 H9A
AD8032ARM-REEL7 –40°C to +85°C 7" Tape and Reel RM-8 H9A
AD8032BN –40°C to +85°C 8-Lead Plastic DIP N-8
AD8032BR –40°C to +85°C 8-Lead SOIC SO-8
AD8032BR-REEL –40°C to +85°C 13" Tape and Reel SO-8
AD8032BR-REEL7 –40°C to +85°C 7" Tape and Reel SO-8
CAUTION
ESD (electrostatic discharge) sensitive device. Electrostatic charges as high as 4000 V readily
accumulate on the human body and test equipment and can discharge without detection.
Although the AD8031/AD8032 feature proprietary ESD protection circuitry, permanent damage
may occur on devices subjected to high energy electrostatic discharges. Therefore, proper ESD
precautions are recommended to avoid performance degradation or loss of functionality.
REV. B
–5–
Page 6

AD8031/AD8032–Typical Performance Characteristics
OFFSET VOLTAGE – mV
COMMON-MODE VOLTAGE – V
0
–0.3
–0.6
050.5 1 1.5 2 2.5 3 3.5 4 4.5
–0.1
–0.2
–0.4
–0.5
VS = +5V
90
80
70
60
50
40
30
NUMBER OF PARTS IN BIN
20
10
0
–5 –4 –3 –2 –1 0 1 2 3 4 5
VOS – mV
N = 250
Figure 3. Typical VOS Distribution @ VS = 5 V
2.5
2.3
2.1
VS = +5V
800
600
400
200
0
–200
–400
INPUT BIAS CURRENT – nA
–600
–800
0101
VS = +2.7V
23456789
VS = +5V
COMMON-MODE VOLTAGE – V
VS = +10V
Figure 6. Input Bias Current vs. Common-Mode Voltage
1.9
OFFSET VOLTAGE – mV
1.7
1.5
–40 90–30
–20–100 1020304050607080
Figure 4. Input Offset Voltage vs. Temperature
1
0.95
0.9
0.85
0.8
0.75
0.7
INPUT BIAS – mA
0.65
0.6
0.55
0.5
–40 90–30
–20–100 1020 3040506070 80
Figure 5. Input Bias Current vs. Temperature
VS = 65V
TEMPERATURE – 8C
TEMPERATURE – 8C
VS = +5V
Figure 7. VOS vs. Common-Mode Voltage
1000
950
900
850
800
750
700
SUPPLY CURRENT/AMPLIFIER – mA
650
600
–40 90–30 –20 –10 0 10 20 30 40 50 60 70 80
6IS, VS = 65V
+IS, VS = +5V
+IS, VS = +2.7V
TEMPERATURE – 8C
Figure 8. Supply Current vs. Temperature
–6–
REV. B
Page 7

0
1.2
1
0
DIFFERENCE FROM V
EE
– Volts
100
10k1k
0.6
0.4
0.2
0.8
R
LOAD
– Ohms
V
CC
V
EE
V
IN
R
LOAD
V
OUT
V
CC
2
VCC = +2.7V
VCC = +10V
V
CC
= +5V
1.2
1
0
100
10k1k
0.6
0.4
0.2
0.8
R
LOAD
– Ohms
DIFFERENCE FROM V
CC
– Volts
V
CC
V
EE
V
IN
R
LOAD
V
OUT
V
CC
2
VCC = +2.7V
VCC = +10V
V
CC
= +5V
1.2
1
0
DIFFERENCE FROM V
EE
– Volts
100
10k1k
0.6
0.4
0.2
0.8
R
LOAD
– Ohms
V
CC
V
EE
V
IN
R
LOAD
V
OUT
V
CC
2
VCC = +2.7V
VCC = +10V
V
CC
= +5V
VCC = +2.7V
–0.5
– Volts
CC
–1
–1.5
–2
DIFFERENCE FROM V
–2.5
100 10k1k
V
VCC = +10V
CC
= +5V
R
LOAD
V
IN
– Ohms
AD8031/AD8032
V
CC
V
OUT
R
LOAD
V
EE
V
CC
2
Figure 9. +Output Saturation Voltage vs. R
0
VCC = +2.7V
–0.5
– Volts
CC
–1
–1.5
–2
DIFFERENCE FROM V
–2.5
100 10k1k
V
VCC = +10V
CC
= +5V
R
LOAD
V
IN
– Ohms
Figure 10. +Output Saturation Voltage vs. R
0
VCC = +2.7V
–0.5
– Volts
CC
–1
–1.5
–2
DIFFERENCE FROM V
–2.5
100 10k1k
Figure 11. +Output Saturation Voltage vs. R
VCC = +10V
V
= +5V
CC
V
IN
R
– Ohms
LOAD
@ +85°C
LOAD
V
CC
V
OUT
R
V
LOAD
EE
V
CC
2
@ +25°C
LOAD
V
CC
V
OUT
R
LOAD
V
EE
V
CC
2
@ –40°C
LOAD
Figure 12. –Output Saturation Voltage vs. R
Figure 13. –Output Saturation Voltage vs. R
Figure 14. –Output Saturation Voltage vs. R
LOAD
LOAD
LOAD
@ +85°C
@ +25°C
@ –40°C
REV. B
–7–
Page 8

AD8031/AD8032–Typical Performance Characteristics
0.05
DIFF GAIN – %
–0.15
–0.05
–0.10
0.00
11th1st 2nd 3rd 4th 5th 6th 7th 8th 9th 10th
11th1st 2nd 3rd 4th 5th 6th 7th 8th 9th 10th
0.10
DIFF PHASE – Degrees
–0.10
0.00
–0.05
0.05
FREQUENCY – Hz
100
30
0.3
10 10M100 1k 10k 100k 1M
10
3
1
VS = +5V
INPUT VOLTAGE NOISE – nV/ Hz
VOLTAGE NOISE
CURRENT NOISE
100
10
1
0.1
INPUT CURRENT NOISE – pA/ Hz
110
105
100
95
90
85
GAIN – dB
80
75
70
65
60
0 10k2k 4k 6k 8k
–A
OL
R
LOAD
+A
OL
– Ohms
VS = +5V
Figure 15. Open-Loop Gain (AOL) vs. R
86
84
82
GAIN – dB
80
+A
–A
OL
VS = +5V
= 1kV
R
L
OL
LOAD
100
90
10
0
10
–10
0%
INPUT BIAS CURRENT – mA
0.5 2.5 4.5 6.5
–1.5
INPUT VOLTAGE – Volts
500mV
500mV
V
= +5V
S
1V
Figure 18. Differential Input Overvoltage I-V
Characteristics
78
76
–40 90–30 –20 –10 0 10 20 30 40 50 60 70 80
TEMPERATURE – 8C
Figure 16. Open-Loop Gain (AOL) vs. Temperature
110
R
= 10kV
100
90
– dB
80
OL
A
70
60
50
050.5 1 1.5 2 2.5 3 3.5 4 4.5
Figure 17. Open-Loop Gain (AOL) vs. V
LOAD
R
= 1kV
LOAD
V
OUT
– V
VS = +5V
OUT
–8–
Figure 19. Differential Gain and Phase @ VS = ±5 V;
R
= 1 k
⍀
L
Figure 20. Input Voltage Noise vs. Frequency
REV. B
Page 9

5
FUNDAMENTAL FREQUENCY – Hz
1k 10M
TOTAL HARMONIC DISTORTION – dBc
100k 1M
–80
–20
–30
–40
–50
–60
–70
2.5V p-p
V
S
= +2.7V
10k
G = +1, RL = 2kV TO
V
CC
2
4.8V p-p
V
S
= +5V
2V p-p
V
S
= +2.7V
1.3V p-p
V
S
= +2.7V
FUNDAMENTAL FREQUENCY – Hz
1k 10M
TOTAL HARMONIC DISTORTION – dBc
100k 1M
–80
–20
–30
–40
–50
–60
–70
4.6V p-p
10k
4V p-p
G = +2
V
S
= +5V
R
L
= 1kV TO
V
CC
2
–90
1V p-p
4.8V p-p
4
3
2
1
0
–1
–2
NORMALIZED GAIN – dB
–3
–4
–5
0.1 100
VS = +5V
G = +1
R
= 1kV
L
110
FREQUENCY – MHz
AD8031/AD8032
GAIN
–90
–135
–180
–225
PHASE – Degree
0.3 100
PHASE
110
FREQUENCY – MHz
40
30
20
10
0
–10
OPEN-LOOP GAIN – dB
–20
Figure 21. Unity Gain , –3 dB Bandwidth
3
2
1
0
–1
–2
NORMALIZED GAIN – dB
–3
–4
–5
VS = +5V
= –16dBm
V
IN
V
S
2kV
V
IN
0.1 100
110
FREQUENCY – MHz
Figure 22. Closed-Loop Gain vs. Temperature
2
1
0
–1
–2
–3
–4
–5
CLOSED-LOOP GAIN – dB
–6
–7
–8
REV. B
100k 100M
Figure 23. Closed-Loop Gain vs. Supply Voltage
+ CL TO 1.35V
R
L
G = +1
C
= 5pF
L
R
= 1kV
L
1M 10M
FREQUENCY – Hz
V
50V
VS = +2.7V
OUT
+858C
–408C
+258C
VS = 65V
VS = +5V
RL + C
TO 2.5V
Figure 24. Open-Loop Frequency Response
Figure 25. Total Harmonic Distortion vs. Frequency; G = +1
L
Figure 26. Total Harmonic Distortion vs. Frequency; G = +2
–9–
Page 10

AD8031/AD8032–Typical Performance Characteristics
10ms / Div
VS = +5V
RL = 10kV TO 2.5V
5.5
4.5
3.5
1.5
0.5
–0.5
1V / Div
2.5
VIN = 6V p-p
G = +1
10ms / Div
VS = +5V
G = +1
INPUT = 650mV
BEYOND RAILS
5.5
4.5
3.5
1.5
0.5
1V / Div
2.5
INPUT
–0.5
10
8
6
4
OUTPUT – V p-p
2
0
1k 10M100k 1M
VS = 65V
VS = +5V
VS = +2.7V
10k
FREQUENCY – Hz
Figure 27. Large Signal Response
100
– V
R
50
10
OUT
0.1
1
RBT = 50V
RBT = 0
RB
0
–20
–40
–60
–80
–100
POWER SUPPLY REJECTION RATIO – dB
–120
100 10M
VS = +5V
1k 10k
100k
FREQUENCY – Hz
1M
100M
Figure 30. PSRR vs. Frequency
T
V
OUT
0.1 100
Figure 28. R
0
–20
–40
–60
VS = +5V
–80
COMMON-MODE REJECTION RATIO – dB
–100
100 10M
1k 10k
Figure 29. CMRR vs. Frequency
110
FREQUENCY – MHz
vs. Frequency
OUT
100k
FREQUENCY – Hz
1M
200
–10–
Figure 31. Output Voltage
Figure 32. Output Voltage Phase Reversal Behavior
REV. B
Page 11

AD8031/AD8032
RL TO
+2.5V
500mV/Div
RL TO GND
0
10ms / Div
Figure 33. Output Swing
3.1
2.9
2.7
2.5
200mV/Div
2.3
2.1
1.9
VS = +5V
RL = 1kV
G = –1
G = +2
RF = RG = 2.5kV
RL = 2kV
CL = 5pF
VS = +5V
2.85
2.35
1.85
1.35
RL TO
500mV/Div
0.85
1.35V
0.35
RL TO GND
10ms / Div
Figure 35. Output Swing
2.56
2.54
2.52
2.50
20mV/Div
2.48
2.46
2.44
VS = +2.7V
RL = 1kV
G = –1
G = +1
RF = 0
RL = 2kV TO 2.5V
CL = 5pF TO 2.5V
VS = +5V
50ns/Div
Figure 34. 1 V Step Response
–50
–60
–70
–80
–90
CROSSTALK – dB
–100
Figure 36. 100 mV Step Response
VS = 62.5V
= +10dBm
V
IN
2.5kV2.5kV
V
IN
50V
1kV
TRANSMITTER
0.1 100
110
FREQUENCY – MHz
2.5kV
2.5kV
50V
RECEIVER
Figure 37. Crosstalk vs. Frequency
50ns / Div
V
OUT
200
REV. B
–11–
Page 12

AD8031/AD8032
THEORY OF OPERATION
The AD8031/AD8032 are single and dual versions of high
speed, low power voltage feedback amplifiers featuring an innovative architecture that maximizes the dynamic range capability
on the inputs and outputs. Linear input common-mode range
exceeds either supply voltage by 200 mV, and the amplifiers
show no phase reversal up to 500 mV beyond supply. The output swings to within 20 mV of either supply when driving a light
load; 300 mV when driving up to 5 mA.
Fabricated on Analog Devices’ XFCB, a 4 GHz dielectrically
isolated fully complementary bipolar process, the amplifier
provides an impressive 80 MHz bandwidth when used as a
follower and 30 V/µs slew rate at only 800 µA supply current.
Careful design allows the amplifier to operate with a supply
voltage as low as 2.7 volts.
Input Stage Operation
A simplified schematic of the input stage appears in Figure 38.
For common-mode voltages up to 1.1 volts within the positive
supply, (0 V to 3.9 V on a single 5 V supply) tail current I2
flows through the PNP differential pair, Q13 and Q17. Q5 is cut
off; no bias current is routed to the parallel NPN differential
pair Q2 and Q3. As the common-mode voltage is driven within
1.1 V of the positive supply, Q5 turns on and routes the tail
current away from the PNP pair and to the NPN pair. During
this transition region, the amplifier’s input current will change
magnitude and direction. Reusing the same tail current ensures
that the input stage has the same transconductance (which determines the amplifier’s gain and bandwidth) in both regions of
operation.
Switching to the NPN pair as the common-mode voltage is
driven beyond 1 V within the positive supply allows the amplifier to provide useful operation for signals at either end of the
supply voltage range and eliminates the possibility of phase
reversal for input signals up to 500 mV beyond either power
supply. Offset voltage will also change to reflect the offset of the
input pair in control. The transition region is small, on the order
of 180 mV. These sudden changes in the dc parameters of
the input stage can produce glitches that will adversely affect
distortion.
Overdriving the Input Stage
Sustained input differential voltages greater than 3.4 volts
should be avoided as the input transistors may be damaged.
Input clamp diodes are recommended if the possibility of this
condition exists.
The voltages at the collectors of the input pairs are set to 200 mV
from the power supply rails. This allows the amplifier to remain
in linear operation for input voltages up to 500 mV beyond the
supply voltages. Driving the input common-mode voltage beyond that point will forward bias the collector junction of the
input transistor, resulting in phase reversal. Sustaining this
condition for any length of time should be avoided as it is easy
to exceed the maximum allowed input differential voltage when
the amplifier is in phase reversal.
1.1V
50kV
V
CC
Q9
R5
I1
5mA
Q5
V
IN
V
IP
V
EE
I2
90mA
R6
850VR7850V
Q13
Q17
Q18
Q3
R8
850VR9850V
Q4
Q2
R1
2kV
Q8
4
Q14
4
R3
2kV
I3
25mA
Q6
Q15
Q10
Q16
I4
25mA
1
1
R2
2kV
1
Q7
4
OUTPUT STAGE,
COMMON-MODE
FEEDBACK
Q11
4
1
R4
2kV
Figure 38. Simplified Schematic of AD8031 Input Stage
–12–
REV. B
Page 13

AD8031/AD8032
VS = 62.5V
VIN = 62.5V
RL = +1kV TO GND
100ns
1V
RF = RG = 2kV
V
OUT
R
F
50V
R
G
V
IN
R
L
1000
10
100
01 4
CAPACITIVE LOAD – pF
CLOSED-LOOP GAIN – V/V
23
R
G
C
L
R
F
V
OUT
VS = +5V
200mV STEP
WITH 30% OVERSHOOT
RS = 20V
RS = 0V, 5V
1
5
RS = 20V
R
S
RS = 0V
RS = 5V
Output Stage, Open-Loop Gain and Distortion vs. Clearance
from Power Supply
The AD8031 features a rail-to-rail output stage. The output
transistors operate as common emitter amplifiers, providing the
output drive current as well as a large portion of the amplifier’s
open-loop gain.
I1
25mA
DIFFERENTIAL
DRIVE
FROM
INPUT STAGE
Q20
25mA
Q21
I4
Figure 39. Output Stage Simplified Schematic
The output voltage limit depends on how much current the
output transistors are required to source or sink. For applications with very low drive requirements (a unity gain follower
driving another amplifier input, for instance), the AD8031 typically swings within 20 mV of either voltage supply. As the required current load increases, the saturation output voltage will
increase linearly as I
current and R
is the output transistor collector resistance. For
C
LOAD
× R
the AD8031, the collector resistances for both output transistors
are typically 25 Ω. As the current load exceeds the rated output
current of 15 mA, the amount of base drive current required to
drive the output transistor into saturation will reach its limit,
and the amplifier’s output swing will rapidly decrease.
The open-loop gain of the AD8031 decreases approximately
linearly with load resistance and also depends on the output
voltage. Open-loop gain stays constant to within 250 mV of the
positive power supply, 150 mV of the negative power supply and
then decreases as the output transistors are driven further into
saturation.
The distortion performance of the AD8031/AD8032 amplifiers
differs from conventional amplifiers. Typically an amplifier’s
distortion performance degrades as the output voltage amplitude increases.
Used as a unity gain follower, the AD8031/AD8032 output will
exhibit more distortion in the peak output voltage region around
V
–0.7 V. This unusual distortion characteristic is caused by
CC
the input stage architecture and is discussed in detail in the
section covering “Input Stage Operation.”
REV. B
Q42
Q37
Q43
Q50
, where I
C
R29
300V
Q38
Q48
Q44
Q51
Q68
Q27
I5
25mA
is the required load
LOAD
I2
25mA
C5
1.5pF
C9
5pF
Q47
Q49
Output Overdrive Recovery
Output overdrive of an amplifier occurs when the amplifier
attempts to drive the output voltage to a level outside its normal
range. After the overdrive condition is removed, the amplifier
must recover to normal operation in a reasonable amount of
time. As shown in Figure 40, the AD8031/AD8032 recover
within 100 ns from negative overdrive and within 80 ns from
positive overdrive.
V
OUT
Figure 40. Overdrive Recovery
Driving Capacitive Loads
Capacitive loads interact with an op amp’s output impedance to
create an extra delay in the feedback path. This reduces circuit
stability, and can cause unwanted ringing and oscillation. A
given value of capacitance causes much less ringing when the
amplifier is used with a higher noise gain.
The capacitive load drive of the AD8031/AD8032 can be increased by adding a low valued resistor in series with the capacitive load. Introducing a series resistor tends to isolate the
capacitive load from the feedback loop, thereby, diminishing its
influence. Figure 41 shows the effects of a series resistor on
capacitive drive for varying voltage gains. As the closed-loop
gain is increased, the larger phase margin allows for larger capacitive loads with less overshoot. Adding a series resistor at
lower closed-loop gains accomplishes the same effect. For large
capacitive loads, the frequency response of the amplifier will be
dominated by the roll-off of the series resistor and capacitive
load.
Figure 41. Capacitive Load Drive vs. Closed-Loop Gain
–13–
Page 14

AD8031/AD8032
1M
FREQUENCY – Hz
10k 100M
GAIN – dB
100k 10M
–50
0
–10
–30
–40
–20
+5V
0.1mF
7
3
2
2N3904
200V
V
OUT
6
2.49kV
49.9V
4
10mF
AD8031
V
IN
2.49kV
49.9V
49.9V
APPLICATIONS
A 2 MHz Single Supply Biquad Bandpass Filter
Figure 42 shows a circuit for a single supply biquad bandpass
filter with a center frequency of 2 MHz. A 2.5 V bias level is
easily created by connecting the noninverting inputs of all three
op amps to a resistor divider consisting of two 1 kΩ resistors
connected between +5 V and ground. This bias point is also
decoupled to ground with a 0.1 µF capacitor. The frequency
response of the filter is shown in Figure 43.
In order to maintain an accurate center frequency, it is essential
that the op amp has sufficient loop gain at 2 MHz. This requires
the choice of an op amp with a significantly higher unity gain
crossover frequency. The unity gain crossover frequency of the
AD8031/AD8032 is 40 MHz. Multiplying the open-loop gain by
the feedback factors of the individual op amp circuits yields the
loop gain for each gain stage. From the feedback networks of the
individual op amp circuits, we can see that each op amp has a
loop gain of at least 21 dB. This level is high enough to ensure
that the center frequency of the filter is not affected by the op
amp’s bandwidth. If, for example, an op amp with a gain bandwidth product of 10 MHz was chosen in this application, the
resulting center frequency would shift by 20% to 1.6 MHz.
R6
1kV
C1
50pF
R2
2kV
+5V
1kV
0.1mF
AD8031
R3
2kV
V
OUT
V
IN
0.1mF
R1
3kV
1kV
Figure 42. A 2 MHz Biquad Bandpass Filter Using AD8031/
AD8032
R4
2kV
+5V
0.1mF
AD8032
1/2
R5
2kV
C2
50pF
1/2
AD8032
Figure 43. Frequency Response of 2 MHz Bandpass Filter
High Performance Single Supply Line Driver
Even though the AD8031/AD8032 swing close to both rails,
the AD8031 has optimum distortion performance when the
signal has a common-mode level half way between the supplies
and when there is about 500 mV of headroom to each rail. If
low distortion is required in single supply applications for signals that swing close to ground, an emitter follower circuit can
be used at the op amp output.
Figure 44. Low Distortion Line Driver for Single Supply
Ground Referenced Signals
–14–
REV. B
Page 15

AD8031/AD8032
START 0Hz STOP 20MHz
VERTICAL SCALE – 10dB/Div
+7dBm
Figure 44 shows the AD8031 configured as a single supply gain-
of-2 line driver. With the output driving a back terminated 50 Ω
line, the overall gain from V
IN
to V
is unity. In addition to
OUT
minimizing reflections, the 50 Ω back termination resistor pro-
tects the transistor from damage if the cable is short circuited.
The emitter follower, which is inside the feedback loop, ensures
that the output voltage from the AD8031 stays about 700 mV
above ground. Using this circuit, very low distortion is attainable even when the output signal swings to within 50 mV of
ground. The circuit was tested at 500 kHz and 2 MHz. Figures
45 and 46 show the output signal swing and frequency spectrum
at 500 kHz. At this frequency, the output signal (at V
OUT
),
which has a peak-to-peak swing of 1.95 V (50 mV to 2 V), has a
THD of –68 dB (SFDR = –77 dB).
100
90
2V
10
0%
50mV
1ms0.5V
Figure 45. Output Signal Swing of Low Distortion Line
Driver at 500 kHz
Figures 47 and 48 show the output signal swing and frequency
spectrum at 2 MHz. As expected, there is some degradation in
signal quality at the higher frequency. When the output signal
has a peak-to-peak swing of 1.45 V (swinging from 50 mV to
1.5 V), the THD is –55 dB (SFDR = –60 dB).
This circuit could also be used to drive the analog input of a
single supply high speed ADC whose input voltage range is
referenced to ground (e.g., 0 V to 2 V or 0 V to 4 V). In this
case, a back termination resistor is not necessary (assuming a
short physical distance from transistor to ADC), so the emitter of the external transistor would be connected directly to the
ADC input. The available output voltage swing of the circuit
would, therefore be doubled.
1.5V
100
90
10
0%
50mV
0.2V
200ns
Figure 47. Output Signal Swing of Low Distortion Line
Driver at 2 MHz
+9dBm
VERTICAL SCALE – 10dB/Div
START 0Hz
STOP 5MHz
Figure 46. THD of Low Distortion Line Driver at 500 kHz
Figure 48. THD of Low Distortion Line Driver at 2 MHz
REV. B
–15–
Page 16

AD8031/AD8032
0.1968 (5.00)
0.1890 (4.80)
8
5
41
0.2440 (6.20)
0.2284 (5.80)
PIN 1
0.1574 (4.00)
0.1497 (3.80)
0.0688 (1.75)
0.0532 (1.35)
SEATING
PLANE
0.0098 (0.25)
0.0040 (0.10)
0.0192 (0.49)
0.0138 (0.35)
0.0500
(1.27)
BSC
0.0098 (0.25)
0.0075 (0.19)
0.0500 (1.27)
0.0160 (0.41)
8°
0°
0.0196 (0.50)
0.0099 (0.25)
x 45°
0.1181 (3.00)
0.1102 (2.80)
PIN 1
0.0669 (1.70)
0.0590 (1.50)
0.1181 (3.00)
0.1024 (2.60)
1 3
4 5
0.0748 (1.90)
BSC
0.0374 (0.95) BSC
2
0.0079 (0.20)
0.0031 (0.08)
0.0217 (0.55)
0.0138 (0.35)
108
08
0.0197 (0.50)
0.0138 (0.35)
0.0059 (0.15)
0.0019 (0.05)
0.0512 (1.30)
0.0354 (0.90)
SEATING
PLANE
0.0571 (1.45)
0.0374 (0.95)
OUTLINE DIMENSIONS
Dimensions shown in inches and (mm).
0.31
(7.87)
0.165 ±0.01
(4.19 ±0.25)
0.125 (3.18)
MIN
0.018 ±0.003
(0.46 ±0.08)
8-Lead Plastic DIP
0.39 (9.91)
MAX
8
14
PIN 1
0.10
(2.54)
BSC
5
0.033
(0.84)
NOM
(6.35)
0.035 ±0.01
(0.89 ±0.25)
8-Lead SOIC
(RM-8)
0.122 (3.10)
0.114 (2.90)
(N-8)
0.25
SEATING
PLANE
0.18 ±0.03
(4.57 ±0.76)
0.30 (7.62)
REF
15°
0°
0.011 ±0.003
(0.28 ±0.08)
8-Lead Plastic SOIC
(SO-8)
C2152b–0–9/99
5-Lead Plastic Surface Mount (SOT-23)
(RT-5)
0.122 (3.10)
0.114 (2.90)
0.006 (0.15)
0.002 (0.05)
PIN 1
SEATING
PLANE
5
8
1
4
0.0256 (0.65) BSC
0.120 (3.05)
0.112 (2.84)
0.018 (0.46)
0.008 (0.20)
0.199 (5.05)
0.187 (4.75)
0.043 (1.09)
0.037 (0.94)
0.011 (0.28)
0.003 (0.08)
0.120 (3.05)
0.112 (2.84)
33°
27°
0.028 (0.71)
0.016 (0.41)
–16–
PRINTED IN U.S.A.
REV. B
 Loading...