

Page 1
REV. A
Information furnished by Analog Devices is believed to be accurate and
reliable. However, no responsibility is assumed by Analog Devices for its
use, nor for any infringements of patents or other rights of third parties
which may result from its use. No license is granted by implication or
otherwise under any patent or patent rights of Analog Devices.
a
AD7470/AD7472
One Technology Way, P.O. Box 9106, Norwood, MA 02062-9106, U.S.A.
Tel: 781/329-4700 World Wide Web Site: http://www.analog.com
Fax: 781/326-8703 © Analog Devices, Inc., 2000
1.75 MSPS, 4 mW
10-Bit/12-Bit Parallel ADCs
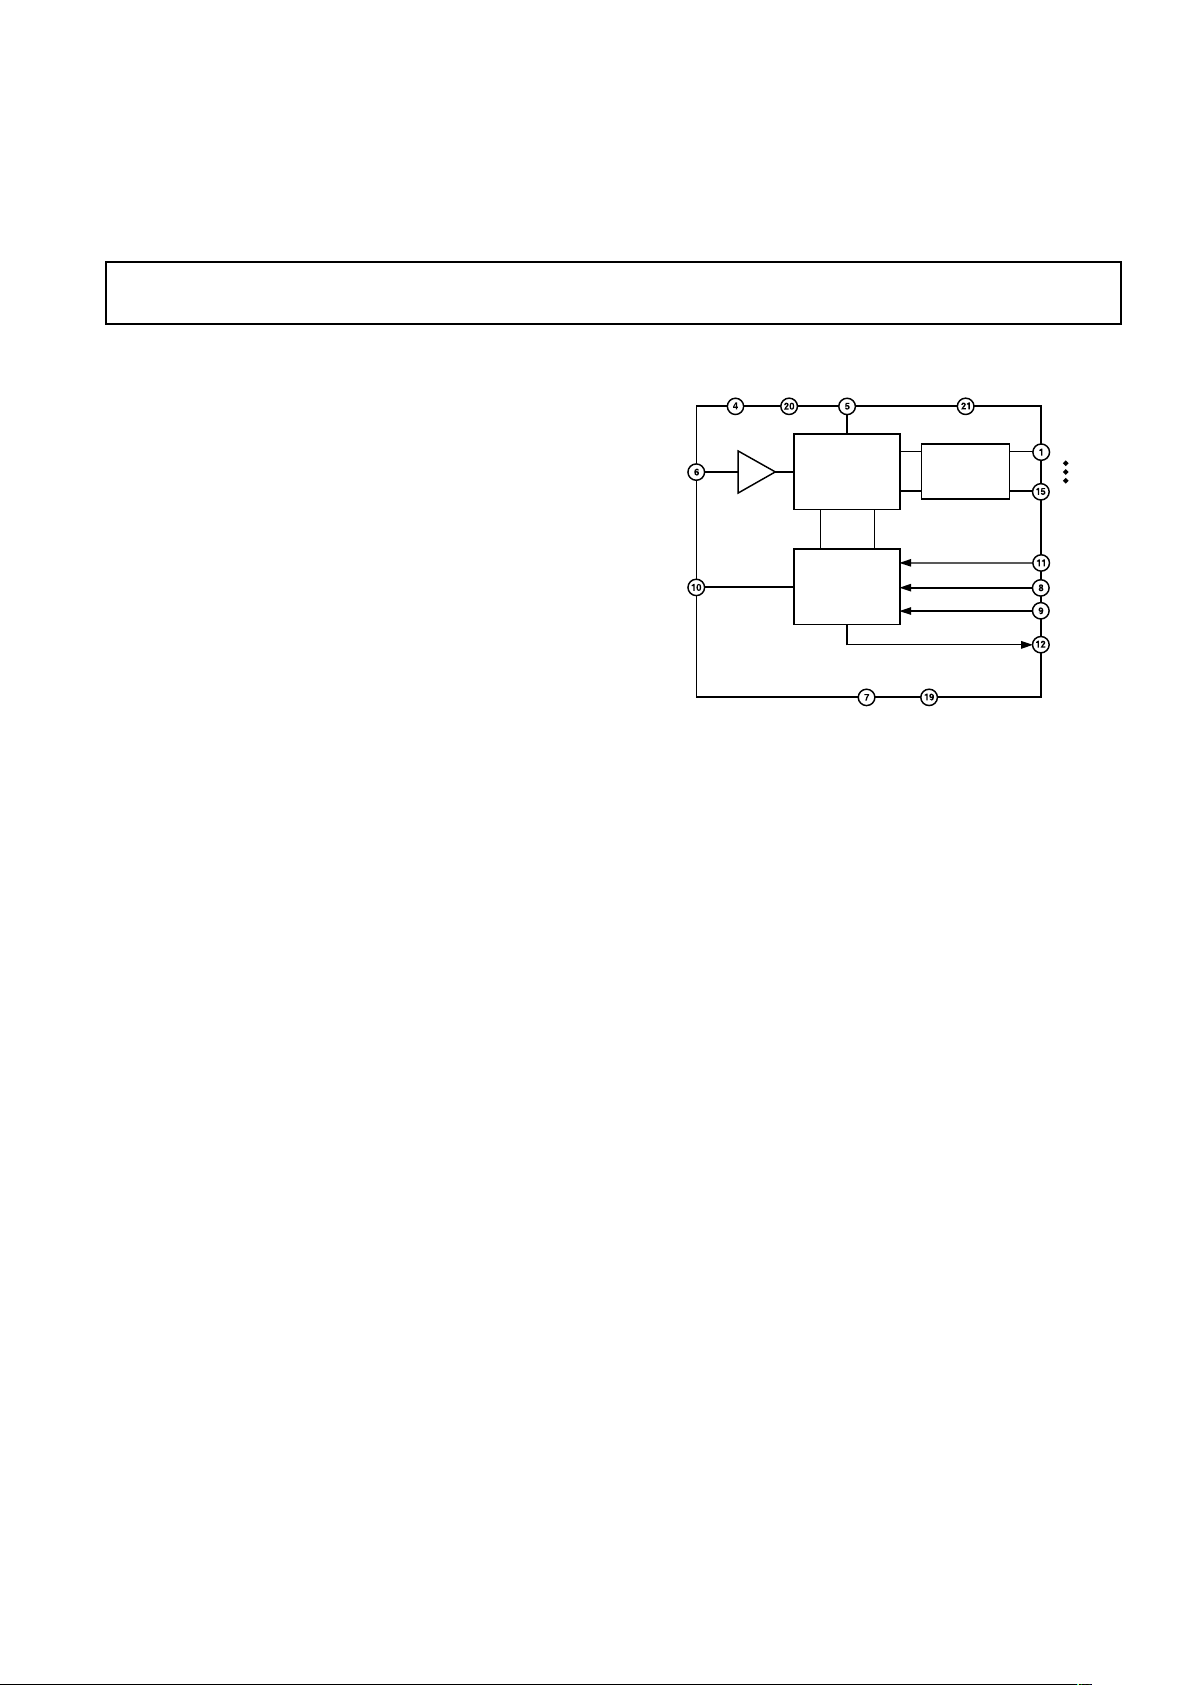
FUNCTIONAL BLOCK DIAGRAM
T/H
10-/12-BIT
SUCCESSIVE
APPROXIMATION
ADC
OUTPUT
DRIVERS
AD7470/AD7472
V
IN
CONVST
AGND DGND
AV
DDDVDD
REF IN
V
DRIVE
DB9 (DB11)
DB0
CLK IN
CS
RD
BUSY
CONTROL
LOGIC
AD7470 IS A 10-BIT PART WITH DB0 TO DB9 AS OUTPUTS.
AD7472 IS A 12-BIT PART WITH DB0 TO DB11 AS OUTPUTS.
FEATURES
Specified for V
DD
of 2.7 V to 5.25 V
1.75 MSPS for AD7470 (10-Bit)
1.5 MSPS for AD7472 (12-Bit)
Low Power
AD7470: 3.34 mW Typ at 1.5 MSPS with 3 V Supplies
7.97 mW Typ at 1.75 MSPS with 5 V Supplies
AD7472: 3.54 mW Typ at 1.2 MSPS with 3 V Supplies
8.7 mW Typ at 1.5 MSPS with 5 V Supplies
Wide Input Bandwidth
70 dB Typ SNR at 500 kHz Input Frequency
Flexible Power/Throughput Rate Management
No Pipeline Delays
High Speed Parallel Interface
Sleep Mode: 50 nA Typ
24-Lead SOIC and TSSOP Packages
GENERAL DESCRIPTION
The AD7470/AD7472 are 10-bit/12-bit high speed, low power,
successive-approximation ADCs. The parts operate from a
single 2.7 V to 5.25 V power supply and feature throughput rates
up to 1.5 MSPS for the 12-bit AD7472 and up to 1.75 MSPS for
the 10-bit AD7470. The parts contain a low noise, wide bandwidth track/hold amplifier that can handle input frequencies in
excess of 1 MHz.
The conversion process and data acquisition are controlled
using standard control inputs allowing easy interfacing to
microprocessors or DSPs. The input signal is sampled on the
falling edge of CONVST and conversion is also initiated at
this point. The BUSY goes high at the start of conversion and
goes low 531.66 ns after falling edge of CONVST (AD7472 with
a clock frequency of 26 MHz) to indicate that the conversion is
complete. There are no pipelined delays associated with the part.
The conversion result is accessed via standard CS and RD sig-
nals over a high speed parallel interface.
The AD7470/AD7472 uses advanced design techniques to
achieve very low power dissipation at high throughput rates. With
3 V supplies and 1.5 MSPS throughput rate, the AD7470 typically consumes, on average, just 1.1 mA. With 5 V supplies and
1.75 MSPS, the average current consumption is typically
1.6 mA. The part also offers flexible power/throughput rate
management. Operating the AD7470 with 3 V supplies and
500 kSPS throughput reduces the current consumption to 713 µA.
At 5 V supplies and 500 kSPS, the part consumes 944 µA.
It is also possible to operate the parts in an auto sleep mode,
where the part wakes up to do a conversion and automatically
enters sleep mode at the end of conversion. Using this method
allows very low power dissipation numbers at lower throughput
rates. In this mode, the AD7472 can be operated with 3 V supplies at 100 kSPS, and consume an average current of just 124 µA.
At 5 V supplies and 100 kSPS, the average current consumption
is 171 µA.
The analog input range for the part is 0 to REF IN. The +2.5 V
reference is applied externally to the REF IN pin. The conversion rate is determined by the externally-applied clock.
PRODUCT HIGHLIGHTS
1. High Throughput with Low Power Consumption. The
AD7470 offers 1.75 MSPS throughput and the AD7472
offers 1.5 MSPS throughput rates with 4 mW power
consumption.
2. Flexible Power/Throughput Rate Management. The conversion rate is determined by an externally-applied clock allowing the power to be reduced as the conversion rate is reduced.
The part also features an auto sleep mode to maximize power
efficiency at lower throughput rates.
3. No Pipeline Delay. The part features a standard successiveapproximation ADC with accurate control of the sampling
instant via a CONVST input and once off conversion
control.
Page 2
REV. A
AD7470/AD7472
–2–
AD7470–SPECIFICATIONS
1
(VDD = +2.7 V to +5.25 V2, REF IN = 2.5 V, f
CLK IN
= 30 MHz @ 5 V and 24 MHz @ 3 V;
TA = T
MIN
to T
MAX
3
, unless otherwise noted.)
Parameter A Version
1
Units Test Conditions/Comments
DYNAMIC PERFORMANCE 5 V 3 V f
S
= 1.75 MSPS @ 5 V, fS = 1.5 MSPS @ 3 V
Signal to Noise + Distortion (SINAD) 60 60 dB min fIN = 500 kHz Sine Wave
60 60 fIN = 100 kHz Sine Wave
Signal-to-Noise Ratio (SNR) 60 60 dB min fIN = 500 kHz Sine Wave
60 60 fIN = 100 kHz Sine Wave
Total Harmonic Distortion (THD) –83 –83 dB typ f
IN
= 500 kHz Sine Wave
–75 –75 dB max fIN = 100 kHz Sine Wave
Peak Harmonic or Spurious Noise (SFDR) –85 –85 dB typ fIN = 500 kHz Sine Wave
–75 –75 dB max f
IN
= 100 kHz Sine Wave
Intermodulation Distortion (IMD)
Second Order Terms –79 –75 dB typ fIN = 500 kHz Sine Wave
–75 –75 dB max fIN = 100 kHz Sine Wave
Third Order Terms –77 –75 dB typ fIN = 500 kHz Sine Wave
–75 –75 dB max fIN = 100 kHz Sine Wave
Aperture Delay 5 5 ns typ
Aperture Jitter 15 15 ps typ
Full Power Bandwidth 20 20 MHz typ
DC ACCURACY fS = 1.75 MSPS @ 5 V; fS = 1.5 MSPS @ 3 V
Resolution 10 10 Bits
Integral Nonlinearity ± 1 ±1 LSB max
Differential Nonlinearity ± 0.9 ±0.9 LSB max Guaranteed No Missed Codes to 10 Bits
Offset Error ± 2.5 ±2.5 LSB max
Gain Error ± 1 ±1 LSB max
ANALOG INPUT
Input Voltage Ranges 0 to REF IN 0 to REF IN V
DC Leakage Current ±1 ±1 µA max
Input Capacitance 33 33 pF typ
REFERENCE INPUT
REF IN Input Voltage Range 2.5 2.5 V ± 1% for Specified Performance
DC Leakage Current ±1 ±1 µA max
Input Capacitance 10/20 10/20 pF typ Track/Hold Mode
LOGIC INPUTS
Input High Voltage, V
INH
2.4 2.4 V min
Input Low Voltage, V
INL
0.4 0.4 V max
Input Current, I
IN
± 1 ±1 µA max Typically 10 nA, VIN = 0 V or V
DD
Input Capacitance, C
IN
4
10 10 pF max
LOGIC OUTPUTS
Output High Voltage, V
OH
V
DRIVE
– 0.2 V
DRIVE
– 0.2 V min I
SOURCE
= 200 µA
Output Low Voltage, V
OL
0.4 0.4 V max I
SINK
= 200 µA
Floating-State Leakage Current ± 10 ± 10 µA max VDD = 2.7 V to 5.25 V
Floating-State Output Capacitance 10 10 pF max
Output Coding Straight (Natural) Binary
CONVERSION RATE
Conversion Time 12 12 CLK IN Cycles (max)
Track/Hold Acquisition Time 135 135 ns min
Throughput Rate 1.75 1.5 MSPS max Conversion Time + Acquisition Time
CLK IN of 30 MHz @ 5 V and 24 MHz @ 3 V
POWER REQUIREMENTS
V
DD
+2.7/+5.25 V min/max
I
DD
5
Digital I/Ps = 0 V or DV
DD
Normal Mode 2.4 mA max VDD = 4.75 V to 5.25 V; fS = 1.75 MSPS; Typ 2 mA
Quiescent Current 900 µA max VDD = 4.75 V to 5.25 V; fS = 1.75 MSPS
Normal Mode 1.5 mA max VDD = 2.7 V to 3.3 V; fS = 1.5 MSPS; Typ 1.3 mA
Quiescent Current 800 µA max VDD = 2.7 V to 3.3 V; fS = 1.5 MSPS
Sleep Mode 1 µA max CLK IN = 0 V or DV
DD
Power Dissipation
5
Digital I/Ps = 0 V or DV
DD
Normal Mode 12 mW max VDD = 5 V
4.5 mW max VDD = 3 V
Sleep Mode 5 µW max VDD = 5 V; CLK IN = 0 V or DV
DD
3 µW max VDD = 3 V; CLK IN = 0 V or DV
DD
NOTES
1
Temperature ranges as follows: A Version: -40°C to +85°C.
2
The AD7470 functionally works at 2.35 V. Typical specifications @ +25°C for SNR (100 kHz) = 59 dB; THD (100 kHz) = –84 dB; INL ± 0.8 LSB.
3
The AD7470 will typically maintain A-grade performance up to +125°C, with a reduced CLK of 20 MHz @ 5 V and 16 MHz @ 3 V. Typical Sleep Mode current @ +125°C is 700 nA.
4
Sample tested @ +25°C to ensure compliance.
5
See Power vs. Throughput Rate section.
Specifications subject to change without notice.
Page 3
REV. A –3–
AD7470/AD7472
AD7472–SPECIFICATIONS
1
(VDD = +2.7 V to +5.25 V2, REF IN = 2.5 V, f
CLK IN
= 26 MHz @ 5 V and 20 MHz @ 3 V;
TA = T
MIN
to T
MAX
3
, unless otherwise noted.)
Parameter A Version
1
B Version
1
Units Test Conditions/Comments
DYNAMIC PERFORMANCE 5 V3 V 5 V3 V f
S
= 1.5 MSPS @ 5 V, fS = 1.2 MSPS @ 3 V
Signal to Noise + Distortion (SINAD) 69 69 69 69 dB typ fIN = 500 kHz Sine Wave
68 68 68 68 dB min f
IN
= 100 kHz Sine Wave
Signal-to-Noise Ratio (SNR) 70 70 70 70 dB typ f
IN
= 500 kHz Sine Wave
68 68 68 68 dB min fIN = 100 kHz Sine Wave
Total Harmonic Distortion (THD) –83 –78 –83 –78 dB typ fIN = 500 kHz Sine Wave
–83 –84 –83 –84 dB typ f
IN
= 100 kHz Sine Wave
–75 –75 –75 –75 dB max f
IN
= 100 kHz Sine Wave
Peak Harmonic or Spurious Noise
(SFDR) –86 –81 –86 –81 dB typ fIN = 500 kHz Sine Wave
–86 –86 –86 –86 dB typ fIN = 100 kHz Sine Wave
–76 –76 –76 –76 dB max fIN = 100 kHz Sine Wave
Intermodulation Distortion (IMD)
Second Order Terms –77 –77 –77 –77 dB typ fIN = 500 kHz Sine Wave
–86 –86 –86 –86 dB typ fIN = 100 kHz Sine Wave
Third Order Terms –77 –77 –77 –77 dB typ fIN = 500 kHz Sine Wave
–86 –86 –86 –86 dB typ fIN = 100 kHz Sine Wave
Aperture Delay 5 5 5 5 ns typ
Aperture Jitter 15 15 15 15 ps typ
Full Power Bandwidth 20 20 20 20 MHz typ
DC ACCURACY fS = 1.5 MSPS @ 5 V; fS = 1.2 MSPS @ 3 V
Resolution 12 12 12 12 Bits
Integral Nonlinearity ± 2 ± 2 ± 1 ± 1 LSB max Guaranteed No Missed Codes to 11 Bits
(A Version)
Differential Nonlinearity ± 1.8 ±1.8 ± 0.9 ± 0.9 LSB max Guaranteed No Missed Codes to 12 Bits
(B Version)
Offset Error ± 10 ±10 ± 10 ±10 LSB max
Gain Error ± 2 ± 2 ± 2 ± 2 LSB max
ANALOG INPUT
Input Voltage Ranges 0 to REF IN 0 to REF IN 0 to REF IN 0 to REF IN V
DC Leakage Current ±1 ± 1 ±1 ±1 µA max
Input Capacitance 33 33 33 33 pF typ
REFERENCE INPUT
REF IN Input Voltage Range 2.5 2.5 2.5 2.5 V ± 1% for Specified Performance
DC Leakage Current ± 1 ± 1 ±1 ±1 µA max
Input Capacitance 10/20 10/20 10/20 10/20 pF typ Track/Hold Mode
LOGIC INPUTS
Input High Voltage, V
INH
2.4 2.4 2.4 2.4 V min
Input Low Voltage, V
INL
0.4 0.4 0.4 0.4 V max
Input Current, I
IN
±1 ±1 ± 1 ±1 µA max Typically 10 nA, VIN = 0 V or V
DD
Input Capacitance, C
IN
4
10 10 10 10 pF max
LOGIC OUTPUTS
Output High Voltage, V
OH
V
DRIVE
– 0.2 V
DRIVE
– 0.2 V
DRIVE
– 0.2 V
DRIVE
– 0.2 V min I
SOURCE
= 200 µA
Output Low Voltage, V
OL
0.4 0.4 0.4 0.4 V max I
SINK
= 200 µA
Floating-State Leakage Current ±10 ±10 ±10 ± 10 µA max VDD = 2.7 V to 5.25 V
Floating-State Output Capacitance 10 10 10 10 pF max
Output Coding Straight (Natural) Binary Straight (Natural) Binary
CONVERSION RATE
Conversion Time 14 14 14 14 CLK IN
Cycles (max)
Track/Hold Acquisition Time 135 135 135 135 ns min
Throughput Rate 1.5 1.2 1.5 1.2 MSPS max Conversion Time + Acquisition Time
CLK IN Is 26 MHz @ 5 V and 20 MHz @ 3 V
POWER REQUIREMENTS
V
DD
+2.7/+5.25 +2.7/+5.25 V min/max
I
DD
5
Digital I/Ps = 0 V or DV
DD
Normal Mode 2.4 2.4 mA max VDD = 4.75 V to 5.25 V; fS = 1.5 MSPS; Typ 2 mA
Quiescent Current 900 900 µA max VDD = 4.75 V to 5.25 V; fS = 1.5 MSPS
Normal Mode 1.5 1.5 mA max VDD = 2.7 V to 3.3 V; fS = 1.2 MSPS; Typ 1.3 mA
Quiescent Current 800 800 µAV
DD
= 2.7 V to 3.3 V; fS = 1.2 MSPS
Sleep Mode 1 1 µA max CLK IN = 0 V or DV
DD
Power Dissipation
5
Digital I/Ps = 0 V or DV
DD
Normal Mode 12 12 mW max VDD = 5 V
4.5 4.5 mW max VDD = 3 V
Sleep Mode 5 5 µW max VDD = 5 V; CLK IN = 0 V or DV
DD
33µW max VDD = 3 V; CLK IN = 0 V or DV
DD
NOTES
1
Temperature ranges as follows: A and B Versions: –40°C to +85°C.
2
The AD7472 functionally works at 2.35 V. Typical specifications @ +25°C for SNR (100 kHz) = 68 dB; THD (100 kHz) = –84 dB; INL ± 0.8 LSB.
3
The AD7472 will typically maintain A-grade performance up to +125°C, with a reduced CLK of 18 MHz @ 5 V and 14 MHz @ 3 V. Typical Sleep Mode current @ +125°C is 700 nA.
4
Sample tested @ +25°C to ensure compliance.
5
See Power vs. Throughput Rate section.
Specifications subject to change without notice.
Page 4
REV. A
AD7470/AD7472
–4–
Limit at T
MIN
, T
MAX
Parameter AD7470 AD7472 Units Description
f
CLK
2
10 10 kHz min
30 26 MHz max
t
CONVERT
436.42 531.66 ns min t
CLK
= 1/f
CLK IN
t
WAKEUP
11µs max Wake-Up Time
t
1
10 10 ns min CONVST Pulsewidth
t
2
3
10 10 ns max CONVST to BUSY Delay, VDD = 5 V
30 30 ns max CONVST to BUSY Delay, V
DD
= 3 V
t
3
0 0 ns max BUSY to CS Setup Time
t
4
4
0 0 ns max CS to RD Setup Time
t
5
20 20 ns min RD Pulsewidth
t
6
4
15 15 ns min Data Access Time After Falling Edge of RD
t
7
5
8 8 ns max Bus Relinquish Time After Rising Edge of RD
t
8
0 0 ns max CS to RD Hold Time
t
9
135 135 ns min Acquisition Time
t
10
100 100 ns min Quiet Time
NOTES
1
Sample tested at +25°C to ensure compliance. All input signals are specified with tr = tf = 5 ns (10% to 90% of VDD) and timed from a voltage level of 1.6 V. See
Figure 1.
2
Mark/Space ratio for the CLK input is 40/60 to 60/40. First CLK pulse should be 10 ns min from falling edge of CONVST.
3
t2 is 35 ns max @ +125°C.
4
Measured with the load circuit of Figure 1 and defined as the time required for the output to cross 0.8 V or 2.0 V.
5
t7 is derived from the measured time taken by the data outputs to change 0.5 V when loaded with the circuit of Figure 1. The measured number is then extrapolated
back to remove the effects of charging or discharging the 50 pF capacitor. This means that the time, t
7
, quoted in the timing characteristics is the true bus relinquish
time of the part and is independent of the bus loading.
Specifications subject to change without notice.
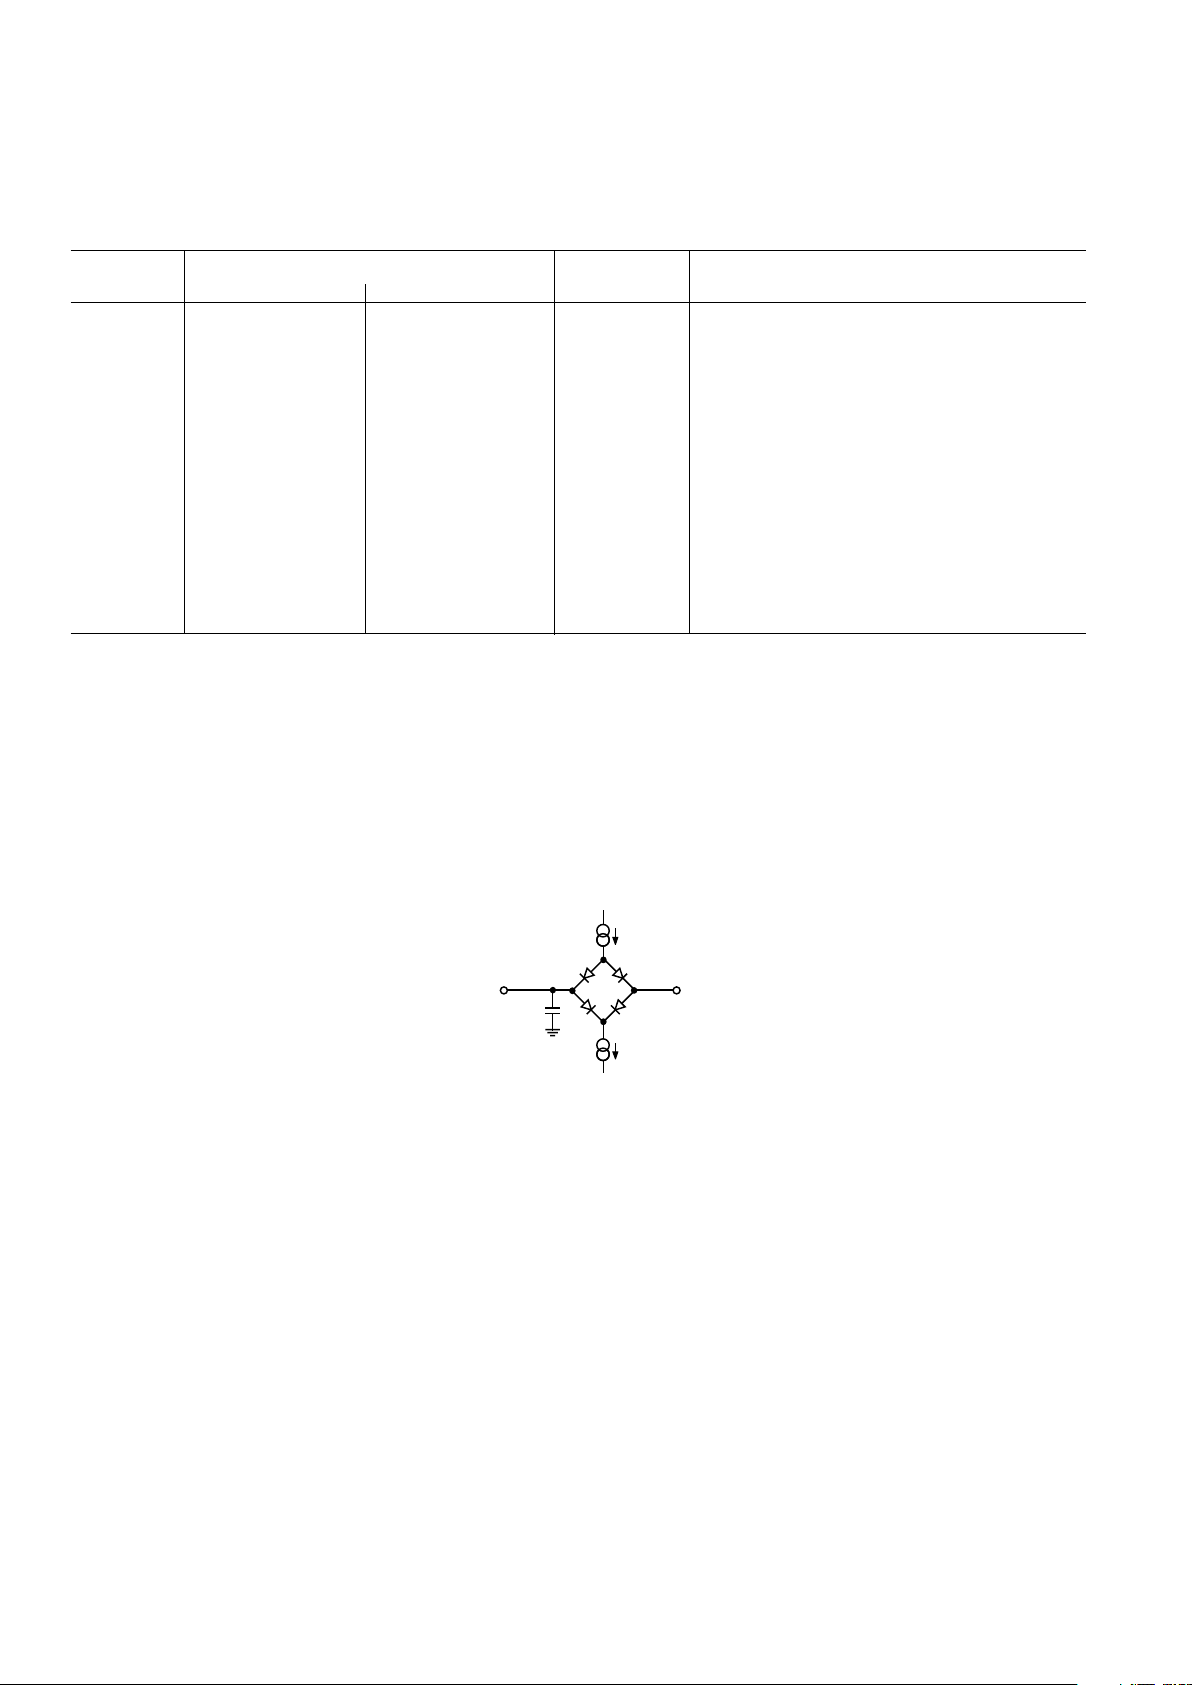
TIMING SPECIFICATIONS
1
(VDD = +2.7 V to +5.25 V, REF IN = 2.5 V; TA = T
MIN
to T
MAX
, unless otherwise noted.)
200A
I
OL
200A
I
OH
C
L
50pF
TO OUTPUT
PIN
+1.6V
Figure 1. Load Circuit for Digital Output Timing Specifications
Page 5
REV. A
AD7470/AD7472
–5–
CAUTION
ESD (electrostatic discharge) sensitive device. Electrostatic charges as high as 4000 V readily
accumulate on the human body and test equipment and can discharge without detection.
Although the AD7470/AD7472 features proprietary ESD protection circuitry, permanent damage may occur on devices subjected to high energy electrostatic discharges. Therefore, proper
ESD precautions are recommended to avoid performance degradation or loss of functionality.
WARNING!
ESD SENSITIVE DEVICE
ABSOLUTE MAXIMUM RATINGS
1
(TA = +25°C unless otherwise noted)
AV
DD
to AGND/DGND . . . . . . . . . . . . . . . . . –0.3 V to +7 V
DV
DD
to AGND/DGND . . . . . . . . . . . . . . . . . –0.3 V to +7 V
V
DRIVE
to AGND/DGND . . . . . . . . . . . . . . . . –0.3 V to +7 V
AV
DD
to DVDD . . . . . . . . . . . . . . . . . . . . . . .–0.3 V to +0.3 V
V
DRIVE
to DVDD . . . . . . . . . . . . . . . –0.3 V to DVDD + 0.3 V
AGND TO DGND . . . . . . . . . . . . . . . . . . . . –0.3 V to +0.3 V
Analog Input Voltage to AGND . . . –0.3 V to AVDD + 0.3 V
Digital Input Voltage to DGND . . . –0.3 V to DVDD + 0.3 V
REF IN to AGND . . . . . . . . . . . . . . –0.3 V to AVDD + 0.3 V
Input Current to Any Pin Except Supplies
2
. . . . . . . . ± 10 mA
Operating Temperature Range
Commercial (A and B Version) . . . . . . . . . –40°C to +85°C
Storage Temperature Range . . . . . . . . . . . –65°C to +150°C
Junction Temperature . . . . . . . . . . . . . . . . . . . . . . . . .+150°C
SOIC, TSSOP Package Dissipation . . . . . . . . . . . . . +450 mW
θ
JA
Thermal Impedance . . . . . . . . . . . . . . . 75°C/W (SOIC)
. . . . . . . . . . . . . . . . . . . . . . . . . . . . . . . . .115°C/W (TSSOP)
θ
JC
Thermal Impedance . . . . . . . . . . . . . . . 25°C/W (SOIC)
. . . . . . . . . . . . . . . . . . . . . . . . . . . . . . . . .35°C/W (TSSOP)
Lead Temperature, Soldering
Vapor Phase (60 secs) . . . . . . . . . . . . . . . . . . . . . . .+215°C
Infrared (15 secs) . . . . . . . . . . . . . . . . . . . . . . . . . . .+220°C
NOTES
1
Stresses above those listed under Absolute Maximum Ratings may cause perma-
nent damage to the device. This is a stress rating only; functional operation of the
device at these or any other conditions above those listed in the operational
sections of this specification is not implied. Exposure to absolute maximum rating
conditions for extended periods may affect device reliability.
2
Transient currents of up to 100 mA will not cause SCR latch-up.
ORDERING GUIDE
Temperature Resolution Package
Model Range (Bits) Options
1
AD7470ARU –40°C to +85°C 10 RU-24
AD7472AR –40°C to +85°C 12 R-24
AD7472BR –40°C to +85°C 12 R-24
AD7472ARU –40°C to +85°C 12 RU-24
AD7472BRU –40°C to +85°C 12 RU-24
EVAL-AD7470CB
2
Evaluation Board
EVAL-AD7472CB
2
Evaluation Board
EVAL-CONTROL BOARD
3
Controller Board
HSC-INTERFACE BOARD Evaluation High Speed Interface Board
NOTES
1
R = SOIC; RU = TSSOP.
2
This can be used as a stand-alone evaluation board or in conjunction with the EVAL-CONTROL BOARD for evaluation/demonstration purposes.
3
This board is a complete unit allowing a PC to control and communicate with all Analog Devices evaluation boards ending in the CB designators.
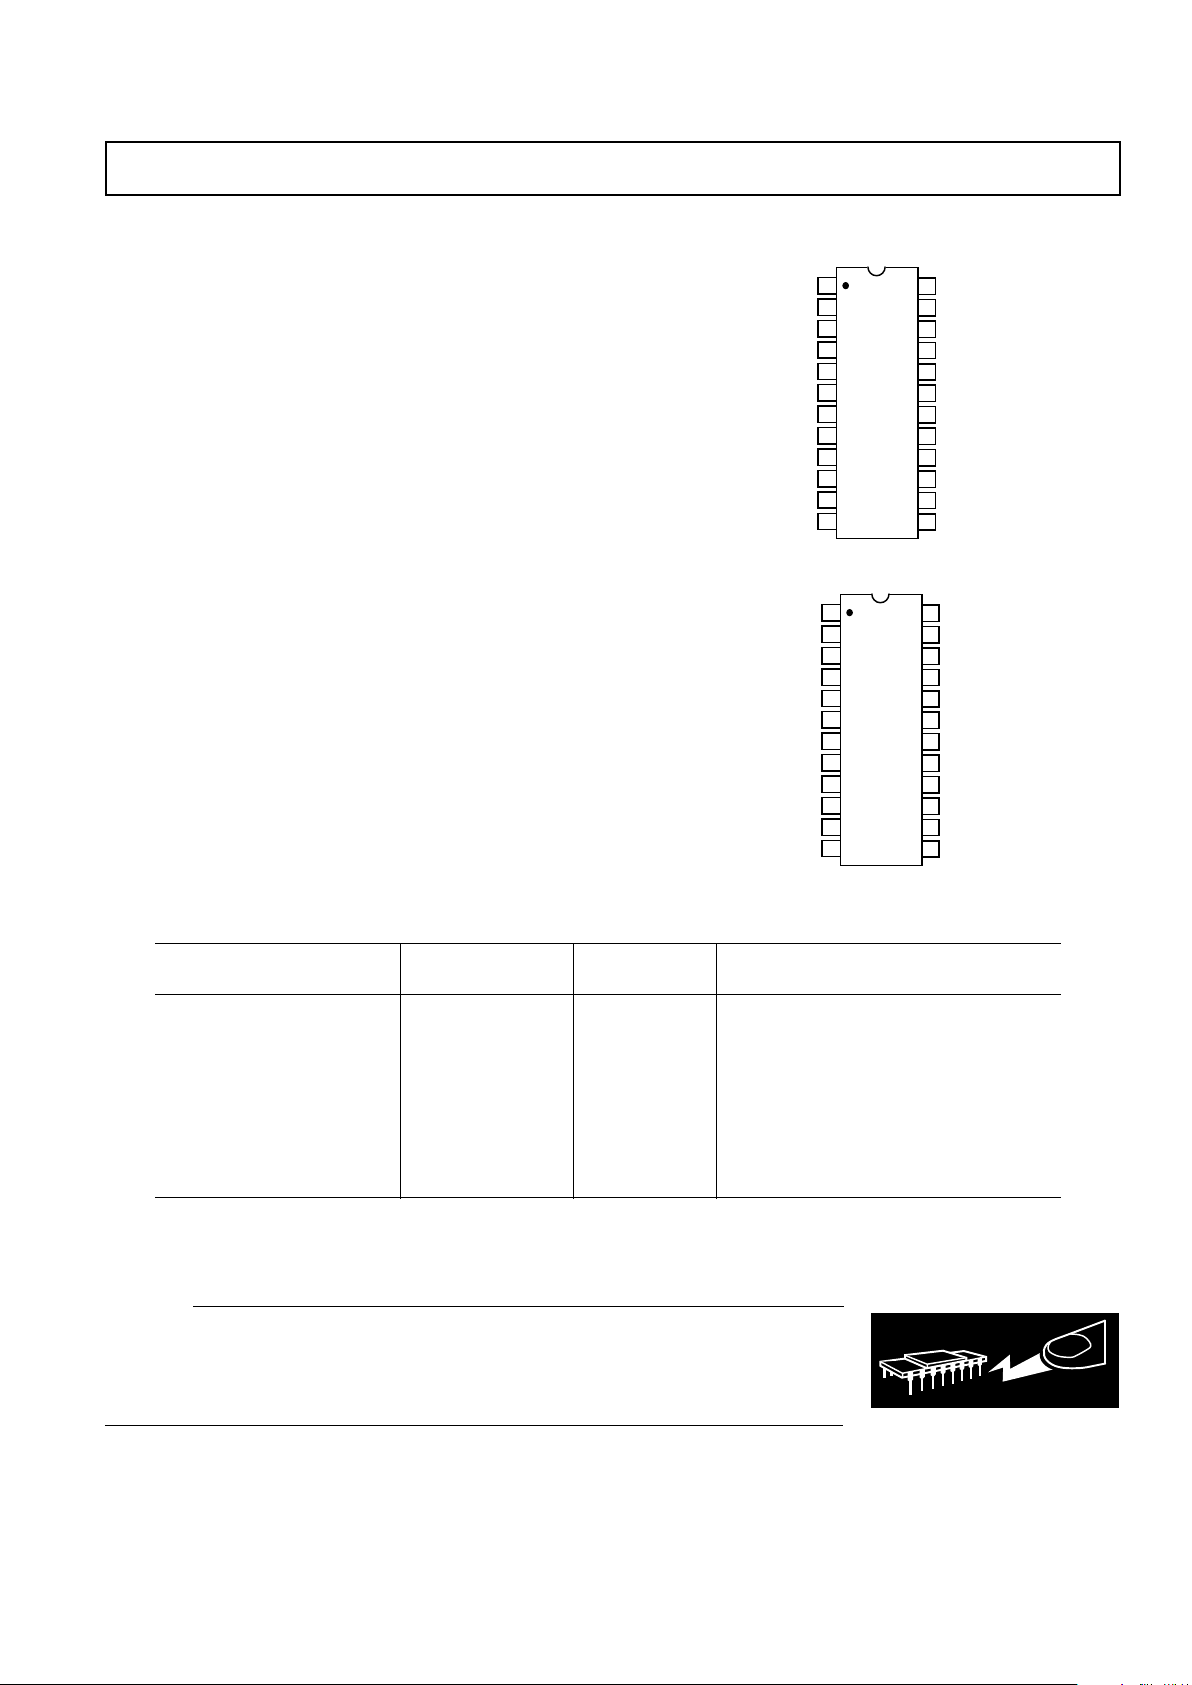
PIN CONFIGURATIONS
TOP VIEW
(Not to Scale)
24
23
22
21
20
19
18
17
16
15
14
13
1
2
3
4
5
6
7
8
9
10
11
12
AD7470
NC = NO CONNECT
DB7 DB6
DB8 DB5
(MSB) DB9 DB4
AV
DD
V
DRIVE
REF IN DV
DD
V
IN
DGND
AGND DB3
CS
DB2
RD
DB1
CONVST
DB0 (LSB)
CLKIN NC
BUSY NC
TOP VIEW
(Not to Scale)
24
23
22
21
20
19
18
17
16
15
14
13
1
2
3
4
5
6
7
8
9
10
11
12
AD7472
DB9 DB8
DB10 DB7
(MSB) DB11 DB6
AV
DD
V
DRIVE
REF IN DV
DD
V
IN
DGND
AGND DB5
CS
DB4
RD
DB3
CONVST
DB2
CLKIN DB1
BUSY DB0 (LSB)
Page 6

REV. A
AD7470/AD7472
–6–
PIN FUNCTION DESCRIPTION
Pin
Mnemonic Function
CS Chip Select. Active low logic input used in conjunction with RD to access the conversion result. The conversion
result is placed on the data bus following the falling edge of both CS and RD. CS and RD are both connected to
the same AND gate on the input so the signals are interchangeable. CS can be hardwired permanently low.
RD Read Input. Logic Input used in conjunction with CS to access the conversion result. The conversion result is
placed on the data bus following the falling edge of both CS and RD. CS and RD are both connected to same
AND gate on the input so the signals are interchangeable. CS and RD can be hardwired permanently low in which
case, the data bus is always active and the result of the new conversion is clocked out slightly before to the BUSY
line going low.
CONVST Conversion Start Input. Logic Input used to initiate conversion. The input track/hold amplifier goes from track
mode to hold mode on the falling edge of CONVST and the conversion process is initiated at this point. The conversion input can be as narrow as 15 ns. If the CONVST input is kept low for the duration of conversion and is
still low at the end of conversion, the part will automatically enter sleep mode. If the part enters this sleep mode,
the next rising edge of CONVST wakes up the part. Wake-up time for the part is typically 1 µs.
CLK IN Master Clock Input. The clock source for the conversion process is applied to this pin. Conversion time for the
AD7472 takes 14 clock cycles while conversion time for the AD7470 takes 12 clock cycles. The frequency of this
master clock input, therefore, determines the conversion time and achievable throughput rate. While the ADC is
not converting, the Clock-In pad is in three-state and thus no clock is going through the part.
BUSY BUSY Output. Logic Output indicating the status of the conversion process. The BUSY signal goes high after the
falling edge of CONVST and stays high for the duration of conversion. Once conversion is complete and the conversion result is in the output register, the BUSY line returns low. The track/hold returns to track mode just prior
to the falling edge of BUSY and the acquisition time for the part begins when BUSY goes low. If the CONVST
input is still low when BUSY goes low, the part automatically enters its sleep mode on the falling edge of BUSY.
REF IN Reference Input. An external reference must be applied to this input. The voltage range for the external reference
is 2.5 V ± 1% for specified performance.
AV
DD
Analog Supply Voltage, +2.7 V to +5.25 V. This is the only supply voltage for all analog circuitry on the AD7470/
AD7472. The AV
DD
and DV
DD
voltages should ideally be at the same potential and must not be more than 0.3 V
apart even on a transient basis. This supply should be decoupled to AGND.
DV
DD
Digital Supply Voltage, +2.7 V to +5.25 V. This is the supply voltage for all digital circuitry on the AD7470/
AD7472 apart from the output drivers. The DV
DD
and AV
DD
voltages should ideally be at the same potential and
must not be more than 0.3 V apart even on a transient basis. This supply should be decoupled to DGND.
AGND Analog Ground. Ground reference point for all analog circuitry on the AD7470/AD7472. All analog input signals
and any external reference signal should be referred to this AGND voltage. The AGND and DGND voltages
should ideally be at the same potential and must not be more than 0.3 V apart even on a transient basis.
DGND Digital Ground. This is the ground reference point for all digital circuitry on the AD7470 and AD7472. The
DGND and AGND voltages should ideally be at the same potential and must not be more than 0.3 V apart even
on a transient basis.
V
IN
Analog Input. Single-ended analog input channel. The input range is 0 V to REFIN. The analog input presents a
high dc input impedance.
V
DRIVE
Supply Voltage for the Output Drivers, +2.7 V to +5.25 V. This voltage determines the output high voltage for the
data output pins. It allows the AV
DD
and DVDD to operate at 5 V (and maximize the dynamic performance of the
ADC) while the digital outputs can interface to 3 V logic.
DB0–DB9/11 Data Bit 0 to Data Bit 9 (AD7470) and DB11 (AD7472). Parallel digital outputs that provide the conversion
result for the part. These are three-state outputs that are controlled by CS and RD. The output high voltage level
for these outputs is determined by the V
DRIVE
input.
Page 7

REV. A
AD7470/AD7472
–7–
TERMINOLOGY
Integral Nonlinearity
This is the maximum deviation from a straight line passing
through the endpoints of the ADC transfer function. The endpoints of the transfer function are zero scale, a point 1/2 LSB
below the first code transition, and full scale, a point 1/2 LSB
above the last code transition.
Differential Nonlinearity
This is the difference between the measured and the ideal 1 LSB
change between any two adjacent codes in the ADC.
Offset Error
This is the deviation of the first code transition (00 . . . 000) to
(00 . . . 001) from the ideal, i.e., AGND + 1 LSB.
Gain Error
The last transition should occur at the analog value 1 1/2 LSB
below the nominal full scale. The first transition is a 1/2 LSB
above the low end of the scale (zero in the case of AD7470/
AD7472). The gain error is the deviation of the actual difference
between the first and last code transitions from the ideal difference between the first and last code transitions with offset errors
removed.
Track/Hold Acquisition Time
The track/hold amplifier returns into track mode after the end of
conversion. Track/Hold acquisition time is the time required for
the output of the track/hold amplifier to reach its final value,
within ± 1 LSB, after the end of conversion.
Signal to (Noise + Distortion) Ratio
This is the measured ratio of signal to (noise + distortion) at the
output of the A/D converter. The signal is the rms amplitude of
the fundamental. Noise is the sum of all nonfundamental signals up to half the sampling frequency (f
S
/2), excluding dc. The
ratio is dependent on the number of quantization levels in the
digitization process; the more levels, the smaller the quantization
noise. The theoretical signal to (noise + distortion) ratio for an
ideal N-bit converter with a sine wave input is given by:
Signal to (Noise + Distortion) = (6.02 N + 1.76) dB
Thus for a 12-bit converter, this is 74 dB and for a 10-bit converter is 62 dB.
Total Harmonic Distortion
Total harmonic distortion (THD) is the ratio of the rms sum of
harmonics to the fundamental. For the AD7470/AD7472 it is
defined as:
THD dB
VVVVV
V
( ) log
()
=
++++
20
223242526
2
1
where V1 is the rms amplitude of the fundamental and V2, V3,
V
4
, V5 and V6 are the rms amplitudes of the second through the
sixth harmonics.
Peak Harmonic or Spurious Noise
Peak harmonic or spurious noise is defined as the ratio of the
rms value of the next largest component in the ADC output
spectrum (up to f
S
/2 and excluding dc) to the rms value of the
fundamental. Normally, the value of this specification is determined by the largest harmonic in the spectrum, but for ADCs
where the harmonics are buried in the noise floor, it will be a
noise peak.
Intermodulation Distortion
With inputs consisting of sine waves at two frequencies, fa and
fb, any active device with nonlinearities will create distortion
products at sum and difference frequencies of mfa ± nfb where
m, n = 0, 1, 2, 3, etc. Intermodulation distortion terms are
those for which neither m nor n is equal to zero. For example,
the second order terms include (fa + fb) and (fa – fb), while the
third order terms include (2fa + fb), (2fa – fb), (fa + 2fb) and
(fa – 2fb).
The AD7470/AD7472 are tested using the CCIF standard
where two input frequencies near the top end of the input bandwidth are used. In this case, the second order terms are usually
distanced in frequency from the original sine waves while the
third order terms are usually at a frequency close to the input
frequencies. As a result, the second and third order terms are
specified separately. The calculation of the intermodulation
distortion is as per the THD specification where it is the ratio of
the rms sum of the individual distortion products to the rms
amplitude of the sum of the fundamentals expressed in dBs.
Aperture Delay
In a sample/hold, the time required after the hold command for
the switch to open fully is the aperture delay. The sample is, in
effect, delayed by this interval, and the hold command would
have to be advanced by this amount for precise timing.
Aperture Jitter
Aperture jitter is the range of variation in the aperture delay. In
other words, it is the uncertainty about when the sample is
taken. Jitter is the result of noise which modulates the phase of
the hold command. This specification establishes the ultimate
timing error, hence the maximum sampling frequency for a
given resolution. This error will increase as the input dV/dt
increases.
Page 8

REV. A
AD7470/AD7472
–8–
CIRCUIT DESCRIPTION
CONVERTER OPERATION
The AD7470/AD7472 is a 10-bit/12-bit successive approximation analog-to-digital converter based around a capacitive DAC.
The AD7470/AD7472 can convert analog input signals in the
range 0 V to V
REF
. Figure 2 shows a very simplified schematic of
the ADC. The Control Logic, SAR and the Capacitive DAC
are used to add and subtract fixed amounts of charge from
the sampling capacitor to bring the comparator back into a
balanced condition.
CAPACITIVE
DAC
SWITCHES
SAR
CONTROL LOGIC
COMPARATOR
OUTPUT DATA
10-/12-BIT PARALLEL
V
IN
V
REF
CONTROL
INPUTS
Figure 2. Simplified Block Diagram of AD7470/AD7472
Figure 3 shows the ADC during its acquisition phase. SW2 is
closed and SW1 is in Position A. The comparator is held in a
balanced condition and the sampling capacitor acquires the
signal on V
IN
.
COMPARATOR
V
IN
CONTROL LOGIC
CAPACITIVE
DAC
AGND
2k⍀
SW2
SW1
A
B
Figure 3. ADC Acquisition Phase
Figure 4 shows the ADC during conversion. When conversion
starts SW2 will open and SW1 will move to position B, causing
the comparator to become unbalanced. The ADC then runs
through its successive approximation routine and brings the
comparator back into a balanced condition. When the comparator is rebalanced, the conversion result is available in the SAR
register.
COMPARATOR
V
IN
CONTROL LOGIC
CAPACITIVE
DAC
AGND
2k⍀
SW2
SW1AB
Figure 4. ADC Conversion Phase
TYPICAL CONNECTION DIAGRAM
Figure 5 shows a typical connection diagram for the AD7470/
AD7472. Conversion is initiated by a falling edge on CONVST.
Once CONVST goes low the BUSY signal goes high, and at the
end of conversion the falling edge of BUSY is used to activate
an Interrupt Service Routine. The CS and RD lines are then
activated in parallel to read the 10- or 12-data bits. The recommended REF IN voltage is 2.5 V providing an analog input
range of 0 V to 2.5 V, making the AD7470/AD7472 a unipolar
A/D. It is recommended to perform a dummy conversion after
power-up as the first conversion result could be incorrect. This
also ensures that the part is in the correct mode of operation.
The CONVST pin should not be floating when power is applied
as a rising edge on CONVST might not wake up the part.
In Figure 5 the V
DRIVE
pin is tied to DVDD, which results in logic
output voltage values being either 0 V or DV
DD
. The voltage
applied to V
DRIVE
controls the voltage value of the output logic
signals. For example, if DV
DD
is supplied by a 5 V supply and
V
DRIVE
by a 3 V supply, the logic output voltage levels would be
either 0 V or 3 V. This feature allows the AD7470/AD7472 to
interface to 3 V parts while still enabling the A/D to process
signals at 5 V supply.
10F0.1F
PARALLED
INTERFACE
+2.5V*
*RECOMMENDED REF IN VOLTAGE
0V TO
REF IN
1nF
10F 0.1F 47F
AD7470/
AD7472
AV
DD
V
DRIVE
DV
DD
REF IN
DB0–
DB9 (DB11)
CS
BUSY
CONVST
RD
V
IN
C/P
ANALOG
SUPPLY
2.7V–5.25V
++
Figure 5. Typical Connection Diagram
Page 9

REV. A
AD7470/AD7472
–9–
ADC TRANSFER FUNCTION
The output coding of the AD7470/AD7472 is straight binary.
The designed code transitions occur at successive integer LSB
values (i.e., 1 LSB, 2 LSB, etc.). The LSB size is = (REF IN)/
4096 for the AD7472 and (REF IN)/1024 for the AD7470. The
ideal transfer characteristic for the AD7472 is shown in Figure 6.
111...111
111...110
111...000
011...111
000...010
000...001
000...000
ADC CODE
0V 1/2LSB +V
REF
–1LSB
ANALOG INPUT
1LSB = V
REF
/4096
Figure 6. Transfer Characteristic for 12 Bits
AC ACQUISITION TIME
In ac applications it is recommended to always buffer analog
input signals. The source impedance of the drive circuitry must
be kept as low as possible to minimize the acquisition time of
the ADC. Large values of impedance at the VIN pin of the
ADC will cause the THD to degrade at high input frequencies.
TYPICAL AMPLIFIER
INPUT SNR THD CURRENT
BUFFERS 500kHz 500kHz CONSUMPTION
AD8047 70 78 5.8mA
AD9631 69.5 80 17mA
AD8051 68.6 78 4.4mA
AD797 70 84 8.2mA
AD7470/AD7472
DYNAMIC
PERFORMANCE
SPECIFICATIONS
Figure 7. Recommended Input Buffers
Reference Input
The following references are best suited for use with the
AD7470/AD7472.
ADR291
AD780
AD192
For optimum performance, a 2.5 V reference is recommended.
The part can function with a reference up to 3 V and down to
2 V, but the performance deteriorates.
DC Acquisition Time
The ADC starts a new acquisition phase at the end of a conversion and ends it on the falling edge of the CONVST signal. At
the end of conversion there is a settling time associated with the
sampling circuit. This settling time lasts approximately 135 ns.
The analog signal on V
IN
is also being acquired during this
settling time; therefore, the minimum acquisition time needed is
approximately 135 ns.
Figure 8 shows the equivalent charging circuit for the sampling
capacitor when the ADC is in its acquisition phase. R3 represents the source impedance of a buffer amplifier or resistive
network, R1 is an internal switch resistance, R2 is for bandwidth
control and C1 is the sampling capacitor. C2 is back-plate capacitance and switch parasitic capacitance.
During the acquisition phase the sampling capacitor must be
charged to within 1 LSB of its final value.
R3
R1
125⍀
V
IN
C1
22pF
C2
8pF
R2
636⍀
Figure 8. Equivalent Sampling Circuit
ANALOG INPUT
Figure 9 shows the equivalent circuit of the analog input structure of the AD7470/AD7472. The two diodes, D1 and D2,
provide ESD protection for the analog inputs. The capacitor C3
is typically about 4 pF and can be primarily attributed to pin
capacitance. The resistor R1 is an internal switch resistance.
This resistor is typically about 125 Ω. The capacitor C1 is the
sampling capacitor while R2 is used for bandwidth control.
R1
125⍀
V
IN
C1
22pF
C2
8pF
R2
636⍀
D1
D2
C3
4pF
V
DD
Figure 9. Equivalent Analog Input Circuit
CLOCK SOURCES
The max CLK specification for the AD7470 is 30 MHz and for
the AD7472, it is 26 MHz. These frequencies are not standard
off-the-shelf oscillator frequencies. Many manufacturers produce oscillator modules close to these frequencies; a typical one
being 25.175 MHz from IQD Limited. AEL Crystals Limited
produce a 25 MHz oscillator module in various packages. Crystal oscillator manufacturers will produce 26 MHz and 30 MHz
oscillators to order. Of course any clock source can be used, not
just crystal oscillators.
Page 10

REV. A
AD7470/AD7472
–10–
PARALLEL INTERFACE
The parallel interface of the AD7470 and AD7472 is 10-bits
and 12-bits wide respectively. The output data buffers are activated when both CS and RD are logic low. At this point the
contents of the data register are placed onto the data bus. Figure
10 shows the timing diagram for the parallel port.
Figure 11 shows the timing diagram for the parallel port when
CS and RD are tied permanently low. In this setup, once the
BUSY line goes from high to low the conversion process is
completed. The data is available on the output bus slightly
before the falling edge of BUSY.
It is important to point out that data bus cannot change state
while the A/D is doing a conversion as this would have a detrimental effect on the conversion in progress. The data out lines
will go three-state again when either the RD or CS line goes
high. Thus the CS can be tied low permanently, leaving the RD
line to control conversion result access. Please reference the
V
DRIVE
section for output voltage levels.
t
2
t
CONVERT
t
3
t
4
t
8
t
5
t
6
t
7
t
9
t
10
BUSY
CS
RD
DBx
CONVST*
*CONVST SHOULD GO HIGH WHEN THE CLK IS HIGH OR BEFORE THE FIRST CLK CYCLE.
Figure 10. Parallel Port Timing
t
2
t
CONVERT
t
9
CONVST*
BUSY
DBx
DATA N DATA N+1
*CONVST SHOULD GO HIGH WHEN THE CLK IS HIGH OR BEFORE THE FIRST CLK CYCLE.
Figure 11. Parallel Port Timing with CS and RD Tied Low
t
2
t
3
t
4
t
8
t
6
t
7
CLK IN
CONVST
BUSY
CS
RD
DB
X
t
WAKEUP
t
5
t
CONVERT
Figure 12. Wake-Up Timing Diagram (Burst Clock)
Page 11

REV. A
AD7470/AD7472
–11–
OPERATING MODES
The AD7470 and AD7472 have two possible modes of operation depending on the state of the CONVST pulse at the end of
a conversion, Mode 1 and Mode 2. There is a continuous clock
on the CLK IN pin.
Mode 1 (High Speed Sampling)
In this mode of operation the CONVST pulse is brought high
before the end of conversion i.e., before the BUSY goes low (see
Figure 10). If the CONVST pin is brought from high to low while
BUSY is high, the conversion is restarted. When operating in
this mode a new conversion should not be initiated until 135 ns
after BUSY goes low. This acquisition time allows the track/
hold circuit to accurately acquire the input signal. As mentioned
earlier, a read should not be done during a conversion. This
mode facilitates the fastest throughput times for the AD7470/
AD7472.
Mode 2 (Sleep Mode)
Figure 13 shows AD7470/AD7472 in Mode 2 operation where
the ADC goes into sleep mode after conversion. The CONVST
line is brought low to initiate a conversion and remains low until
after the end of conversion. If CONVST goes high and low
again while BUSY is high, the conversion is restarted. Once the
BUSY line goes from a high to a low, the CONVST line has its
status checked and, if low, the part enters sleep mode.
The device wakes up again on the rising edge of the CONVST
signal. There is a wake-up time of typically 1 µs after the rising
edge of CONVST before the BUSY line can go high to indicate
start of conversion. BUSY will only go high once CONVST goes
low. The CONVST line can go from a high to a low during this
wake-up time, but the conversion will still not be initiated until
after the 1 µs wake-up time. Superior power performance can be
achieved in this mode of operation by waking up the AD7470
and AD7472 only to carry out a conversion.
Burst Mode
Burst mode on the AD7470/AD7472 is a subsection of Mode 1
and Mode 2, the clock is noncontinuous. Figure 12 shows how
the ADC works in burst mode for Mode 2. The clock needs
only to be switched on during conversion, minimum of 12 clock
cycles for the AD7470 and 14 clock cycles for the AD7472. As
the clock is off during nonconverting intervals, system power is
saved. The BUSY signal can be used to gate the CLK IN pulses.
The ADC does not begin the conversion process until the first
CONVST
BUSY
CS
RD
DBx
t
WAKEUP
t
CONVERT
Figure 13. Mode 2 Operation
CLK IN rising edge after BUSY goes high. The clock needs to
start less than two clock cycles away from the CONVST active
edge otherwise INL deteriorates; e.g., if the clock frequency is
28 MHz the clock must start within 71.4 ns of CONVST going
low. In Figure 12 the A-D converter section is put into sleep
mode once conversion is completed and on the rising edge of
CONVST it is woken up again; the user must be wary of the
wake-up time as this will reduce the sampling rate of the ADC.
V
DRIVE
The V
DRIVE
pin is used as the voltage supply to the output driv-
ers and is a separate supply from AV
DD
and DVDD. The purpose
of using a separate supply for the output drivers is that the user
can vary the output high voltage, V
OH
, from the VDD supply to
the AD7470/AD7472. For example, if AV
DD
and DVDD is using
a 5 V supply, the V
DRIVE
pin can be powered from a 3 V supply.
The ADC has better dynamic performance at 5 V than at 3 V,
so operating the part at 5 V, while still being able to interface to
3 V parts, pushes the AD7470/AD7472 to the top bracket of
high performance 10-bit/12-bit A/Ds. Of course, the ADC can
have its V
DRIVE
and DVDD pins connected together and be pow-
ered from a 3 V or 5 V supply.
All outputs are powered from V
DRIVE
. These are all the data out
pins and the BUSY pin. The CONVST, CS, RD and CLK IN
signals are related to the DV
DD
voltage.
POWER-UP
It is recommended that the user performs a dummy conversion
after power-up, as the first conversion result could be incorrect.
This also ensures that the parts is in the correct mode of operation. The recommended power-up sequence is as follows:
1 > GND 4 > Digital Inputs
2 > V
DD
5 > REF IN
3 > V
DRIVE
6 > V
IN
Power vs. Throughput
The two modes of operation for the AD7470 and AD7472 will
produce different power versus throughput performances, Mode
1 and Mode 2; see Operating Modes section of the data sheet
for more detailed descriptions of these modes. Mode 2 is the
Sleep Mode of the part and it achieves the optimum power
performance.
Page 12

REV. A
AD7470/AD7472
–12–
Mode 1
Figure 14 shows the AD7472 conversion sequence in Mode 1
using a throughput rate of 500 kSPS and a clock frequency of
26 MHz. At 5 V supply the current consumption for the part
when converting is 2 mA and the quiescent current is 650 µA.
The conversion time of 531.66 ns contributes 2.658 mW to the
overall power dissipation in the following way:
(531.66 ns/2 µs) × (5 × 2 mA) = 2.658 mW
The contribution to the total power dissipated by the remaining
1.468 µs of the cycle is 2.38 mW.
(1.468 µs/2 µs) × (5 × 650 µA) = 2.38 mW
Thus the power dissipated during each cycle is:
2.658 mW + 2.38 mW = 5.038 mW
CONVST
BUSY
531.66ns 1.468s
2s
t
CONVERT
t
QUIESCENT
Figure 14. Mode 1 Power Dissipation
Mode 2
Figure 15 shows the AD7472 conversion sequence in Mode 2
using a throughput rate of 500 kSPS and a clock frequency of
26 MHz. At 5 V supply the current consumption for the part
when converting is 2 mA, while the sleep current is 1 µA max.
The power dissipated during this power-down is negligible and
is thus not worth considering in the total power figure. During
the wake-up phase, the AD7472 will draw 650 µA. Overall
power dissipated is:
531 66 2 5 2 1 2 5 650 4 283./ / .ns s mA s s A mWµµµµ
()
××
()
+
()
××
()
=
CONVST
BUSY
t
WAKEUP
531.66ns 1.468s
2s
1s
t
CONVERT
t
QUIESCENT
Figure 15. Mode 2 Power Dissipation
Figure 16 and Figure 17 show a typical graphical representation
of Power vs. Throughput for the AD7472 when in (a) Mode 1
@ 5 V and 3 V and Mode 2 @ 5 V and 3 V.
THROUGHPUT – kHz
8
4
0
50 300
POWER – mW
1500130011001000800600
7
3
6
2
5
1
+5V
+3V
Figure 16. Power vs. Throughput (Mode 1 @ 5 V and 3 V)
THROUGHPUT – kHz
4
0
50 100
POWER – mW
750700650600300200
7
3
6
2
5
1
150 350250 400 450 500 550
+5V
+3V
Figure 17. Power vs. Throughput (Mode 2 @ 5 V and 3 V)
CODE
1
0
–1
0
INL ERROR – LSB
4096
–0.8
358430722560204815361024512
–0.6
–0.4
–0.2
0.2
0.4
0.6
0.8
Figure 18. Typical INL for 2.75 V @ +25°C
Page 13

REV. A
AD7470/AD7472
–13–
CODE
1
0
–1
0
DNL ERROR – LSB
4096
–0.8
358430722560204815361024512
–0.6
–0.4
–0.2
0.2
0.4
0.6
0.8
Figure 19. Typical DNL for 2.75 V @ +25°C
INPUT FREQUENCY – kHz
72
62
52
10
SNR + D – dB
2000
54
100050020010050
56
58
60
64
66
68
70
AD7472 +5V
AD7472 +3V
AD7470 +5V
AD7470 +3V
Figure 20. Typical SNR+D vs. Input Tone
INPUT FREQUENCY – kHz
90
75
50
10
THD – dB
2000
55
100050020010050
60
65
70
80
85
AD7472 +5V
AD7472 +3V
AD7470 +5V
AD7470 +3V
Figure 21. Typical THD vs. Input Tone
SUPPLY – Volts
69.2
2.5
SNR – dB
2.75 3 3.25 3.5 3.75 4 4.25 4.5 4.75 5 5.25
69.4
69.6
69.8
70
70.2
70.4
70.6
+85ⴗC
+25ⴗC
–40ⴗC
Figure 22. Typical SNR vs. Supply
FREQUENCY – Hz
–120
0
dB
100000 200000 300000 400000 500000 600000
–100
–80
–60
–40
–20
0
Figure 23. Typical SNR @ 500 kHz Input Tone
FREQUENCY – kHz
–3.8
10
dB
100 1000 10000 100000
–3.3
–2.8
–2.3
–1.8
–1.3
–0.8
0.2
–0.3
+5V
+3V
Figure 24. Typical Bandwidth
Page 14
REV. A
AD7470/AD7472
–14–
GROUNDING AND LAYOUT
The analog and digital power supplies are independent and
separately pinned out to minimize coupling between analog and
digital sections within the device. To complement the excellent
noise performance of the AD7470/AD7472 it is imperative that
care be given to the PCB layout. Figure 25 shows a recommended connection diagram for the AD7470/AD7472.
All of the AD7470/AD7472 ground pins should be soldered
directly to a ground plane to minimize series inductance. The
AV
DD
, DV
DD
and V
DRIVE
pins should be decoupled to both the
analog and digital ground planes. The large value capacitors will
decouple low frequency noise to analog ground, the small value
capacitors will decouple high frequency noise to digital ground.
All digital circuitry power pins should be decoupled to the digital ground plane. The use of ground planes can physically separate sensitive analog components from the noisy digital system.
The two ground planes should be joined in only one place and
should not overlap so as to minimize capacitive coupling between them. If the AD7470/AD7472 is in a system where
multiple devices require AGND to DGND connections, the
connection should still be made at one point only, a star ground
point, which should be established as close as possible to the
AD7470/AD7472.
Noise can be minimized by applying some simple rules to the
PCB layout: analog signals should be kept away from digital
signals; fast switching signals like clocks should be shielded with
digital ground to avoid radiating noise to other sections of the
board and clock signals should never be run near the analog
inputs; avoid running digital lines under the device as these will
couple noise onto the die; the power supply lines to the AD7470/
AD7472 should use as large a trace as possible to provide a low
impedance path and reduce the effects of glitches on the power
supply line; avoid crossover of digital and analog signals and
place traces that are on opposite sides of the board at right angles
to each other.
Noise to the analog power line can be further reduced by use of
multiple decoupling capacitors as shown in Figure 25. Decoupling capacitors should be placed directly at the power inlet to
the PCB and also as close as possible to the power pins of the
AD7470/AD7472. The same decoupling method should be
used on other ICs on the PCB, with the capacitor leads as short
as possible to minimize lead inductance.
POWER SUPPLIES
Separate power supplies for AV
DD
and DV
DD
are desirable but if
necessary DV
DD
may share its power connection to AVDD. The
digital supply (DV
DD
) must not exceed the analog supply (AVDD)
by more than 0.3 V in normal operation.
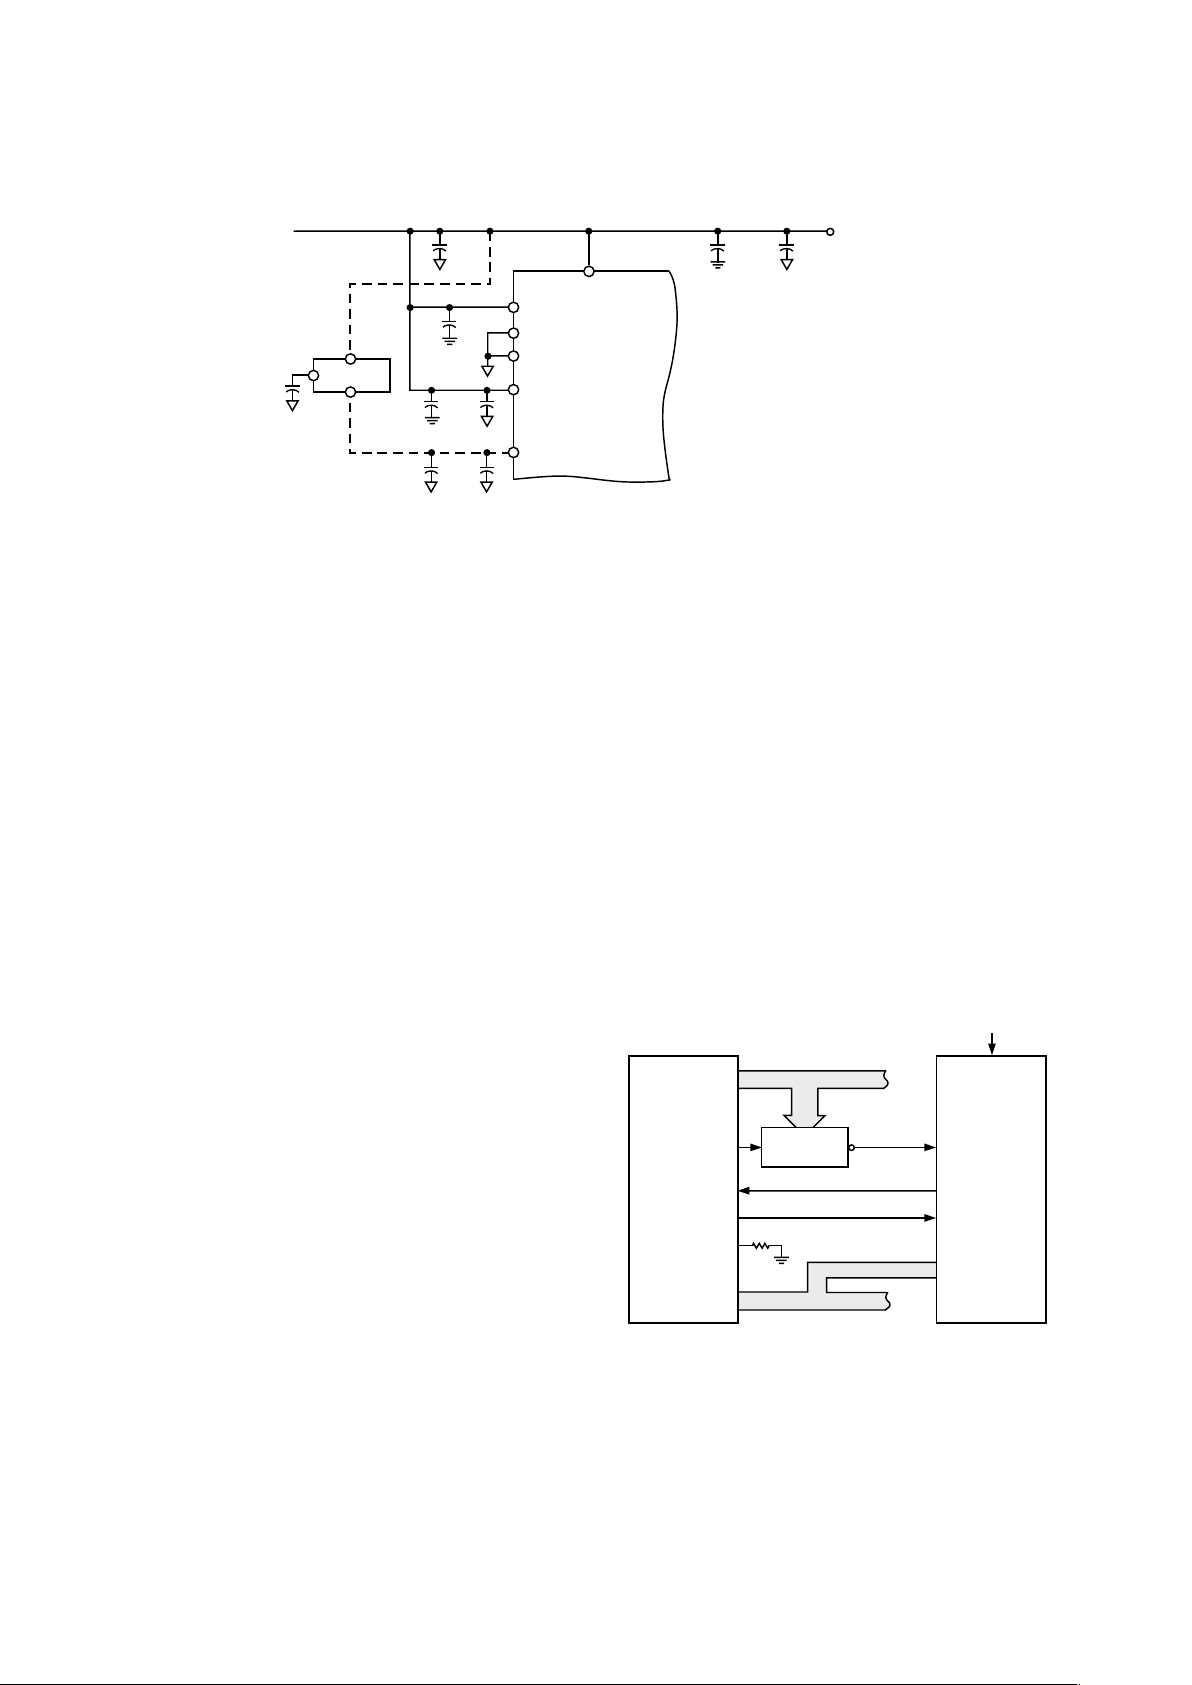
MICROPROCESSOR INTERFACING
AD7470/AD7472 to ADSP-2185 Interface
Figure 26 shows a typical interface between the AD7470/AD7472
and the ADSP-2185. The ADSP-2185 processor can be used in
one of two memory modes, Full Memory Mode and Host Mode.
The Mode C pin determines in which mode the processor works.
The interface in Figure 26 is set up to have the processor working in Full Memory Mode, which allows full external addressing
capabilities.
When the AD7470/AD7472 has finished converting, the BUSY
line requests an interrupt through the IRQ2 pin. The IRQ2
interrupt has to be set up in the interrupt control register as
edge-sensitive. The DMS (Data Memory Select) pin latches in
the address of the A/D into the address decoder. The read operation is thus started.
ADDRESS
DECODER
AD7470/
AD7472*
ADSP-2185*
A0–A15
DMS
IRQ2
RD
MODE C
D0–D23
CONVST
CS
RD
BUSY
DB0–DB9
(DB11)
ADDRESS BUS
DATA BUS
100k⍀
*ADDITIONAL PINS OMITTED FOR CLARITY
OPTIONAL
Figure 26. Interfacing to the ADSP-2185
AD7470/AD7472 to ADSP-21065 Interface
Figure 27 shows a typical interface between the AD7470/AD7472
and the ADSP-21065L SHARC
®
processor. This interface is an
example of one of three DMA handshake modes. The MSX
AD7470/
AD7472
AD780
10F
+
1nF
V
IN
V
OUT
1nF
+
10F
0.1F
10F
DV
DD
AGND
DGND
V
DRIVE
VREF
AV
DD
+
0.1F47F
ANALOG
SUPPLY
+5V
+
0.1F
Figure 25. Decoupling Circuit
SHARC is a registered trademark of Analog Devices, Inc.
Page 15

REV. A
AD7470/AD7472
–15–
control line is actually three memory select lines. Internal
ADDR
25–24
are decoded into MS
3-0
, these lines are then asserted
as chip selects. The DMAR
1
(DMA Request 1) is used in this
setup as the interrupt to signal end of conversion. The rest of
the interface is standard handshaking operation.
AD7470/
AD7472*
ADSP-21065L*
ADDR0–ADDR
23
RD
D0–D31
CONVST
RD
BUSY
DB0–DB9
(DB11)
ADDRESS BUS
DATA BUS
*ADDITIONAL PINS OMITTED FOR CLARITY
OPTIONAL
DMAR
1
ADDRESS
LATCH
ADDRESS
BUS
ADDRESS
DECODER
MS
X
CS
Figure 27. Interfacing to ADSP-21065L
AD7470/AD7472 to TMS320C25 Interface
Figure 28 shows an interface between the AD7470/AD7472
and the TMS320C25. The CONVST signal can be applied
from the TMS320C25 or from an external source. The BUSY
line interrupts the digital signal processor when conversion is
completed. The TMS320C25 does not have a separate RD
output to drive the AD7470/AD7472 RD input directly. This
has to be generated from the processor STRB and R/W outputs
with the addition of some glue logic. The RD signal is OR-gated
with the MSC signal to provide the WAIT state required in the
read cycle for correct interface timing. The following instruction
is used to read the conversion from the AD7470/AD7472:
IN D,ADC
where D is Data Memory address and the ADC is the AD7470/
AD7472 address. The read operation must not be attempted
during conversion.
ADDRESS
DECODER
AD7470/
AD7472*
TMS320C25*
A0–A15
IS
STRB
R/W
READY
DMD0–DMD15
CONVST
CS
RD
BUSY
DB0–DB9
(DB11)
ADDRESS BUS
*ADDITIONAL PINS OMITTED FOR CLARITY
OPTIONAL
MSC
DATA BUS
Figure 28. Interfacing to the TMS320C25
AD7470/AD7472 to PIC17C4x Interface
Figure 29 shows a typical parallel interface between the AD7470/
AD7472 and PIC17C42/43/44. The microcontroller sees the
A/D as another memory device with its own specific memory
address on the memory map. The CONVST signal can either be
controlled by the microcontroller or an external source. The
BUSY signal provides an interrupt request to the microcontroller
when a conversion ends. The INT pin on the PIC17C42/43/44
must be configured to be active on the negative edge. PORTC
and PORTD of the microcontroller are bidirectional and used
to address the AD7470/AD7472 and also to read in the 10-bit
(AD7470) or 12-bit (AD7472) data. The OE pin on the PIC
can be used to enable the output buffers on the AD7470/AD7472
and preform a read operation.
*ADDITIONAL PINS OMITTED FOR CLARITY
ADDRESS
DECODER
ADDRESS
LATCH
OPTIONAL
PIC17C4x*
AD0–AD15
OE
INT
AD7470/
AD7472*
CONVST
CS
RD
BUSY
DB0–DB9
(DB11)
ALE
Figure 29. Interfacing to the PIC17C4x
AD7470/AD7472 to 80C186 Interface
Figure 30 shows the AD7470/AD7472 interfaced to the 80C186
microprocessor. The 80C186 DMA controller provides two
independent high speed DMA channels where data transfer can
occur between memory and I/O spaces. (The AD7470/AD7472
occupies one of these I/O spaces.) Each data transfer consumes
two bus cycles, one cycle to fetch data and the other to store
data.
After the AD7470/AD7472 has finished conversion, the BUSY
line generates a DMA request to Channel 1 (DRQ1). As a result
of the interrupt, the processor performs a DMA READ operation which also resets the interrupt latch. Sufficient priority
must be assigned to the DMA channel to ensure that the DMA
request will be serviced before the completion of the next conversion. This configuration can be used with 6 MHz and 8 MHz
80C186 processors.
80C186*
AD0–AD15
A16–A19
RD
DRQ1
ADDRESS/DATA BUS
DATA BUS
*ADDITIONAL PINS OMITTED FOR CLARITY
ADDRESS
LATCH
ADDRESS
BUS
ADDRESS
DECODER
ALE
RSQ
AD7470/
AD7472*
CONVST
RD
BUSY
DB0–DB9
(DB11)
OPTIONAL
CS
Figure 30. Interfacing to the 80C186
Page 16

REV. A
AD7470/AD7472
–16–
OUTLINE DIMENSIONS
Dimensions shown in inches and (mm).
C3600–0–3/00 (rev. A)
PRINTED IN U.S.A.
24-Lead SOIC
(R-24)
0.0125 (0.32)
0.0091 (0.23)
8ⴗ
0ⴗ
0.0291 (0.74)
0.0098 (0.25)
ⴛ 45ⴗ
0.0500 (1.27)
0.0157 (0.40)
SEATING
PLANE
0.0118 (0.30)
0.0040 (0.10)
0.0192 (0.49)
0.0138 (0.35)
0.1043 (2.65)
0.0926 (2.35)
0.0500
(1.27)
BSC
24 13
12
1
0.4193 (10.65)
0.3937 (10.00)
0.2992 (7.60)
0.2914 (7.40)
PIN 1
0.6141 (15.60)
0.5985 (15.20)
24-Lead TSSOP
(RU-24)
24 13
121
0.256 (6.50)
0.246 (6.25)
0.177 (4.50)
0.169 (4.30)
PIN 1
0.311 (7.90)
0.303 (7.70)
SEATING
PLANE
0.006 (0.15)
0.002 (0.05)
0.0118 (0.30)
0.0075 (0.19)
0.0256 (0.65)
BSC
0.0433 (1.10)
MAX
0.0079 (0.20)
0.0035 (0.090)
0.028 (0.70)
0.020 (0.50)
8ⴗ
0ⴗ
 Loading...