

Page 1
Dual, Low Noise, Wideband
A
FEATURES
2 channels with independent gain control
Linear in dB gain response
2 gain ranges
AD600: 0 dB to 40 dB
AD602: –10 dB to +30 dB
Accurate absolute gain: ±0.3 dB
Low input noise: 1.4 nV/√Hz
Low distortion: −60 dBc THD at ±1 V output
High bandwidth: dc to 35 MHz (−3 dB)
Stable group delay: ±2 ns
Low power: 125 mW (maximum) per amplifier
Signal gating function for each amplifier
Drive high speed ADCs
MIL-STD-883-compliant and DESC versions available
APPLICATIONS
Ultrasound and sonar time-gain controls
High performance audio and RF AGC systems
Signal measurement
GENERAL DESCRIPTION
The AD600/AD6021 dual-channel, low noise, variable gain
amplifiers are optimized for use in ultrasound imaging systems
but are applicable to any application requiring precise gain, low
noise and distortion, and wide bandwidth. Each independent
channel provides a gain of 0 dB to +40 dB in the AD600 and
−10 dB to +30 dB in the AD602. The lower gain of the AD602
results in an improved signal-to-noise ratio (SNR) at the output.
However, both products have the same 1.4 nV/√Hz input noise
spectral density. The decibel gain is directly proportional to the
control voltage, accurately calibrated, and supply and temperature stable.
To achieve the difficult performance objectives, a proprietary
circuit form, the X-AMP®, was developed. Each channel of the
X-AMP comprises a variable attenuator of 0 dB to −42.14 dB
followed by a high speed fixed gain amplifier. In this way, the
amplifier never has to cope with large inputs and can benefit
from the use of negative feedback to precisely define the gain
and dynamics. The attenuator is realized as a 7-stage R-2R
ladder network having an input resistance of 100 , laser
trimmed to ±2%. The attenuation between tap points is 6.02 dB;
the gain-control circuit provides continuous interpolation between
these taps. The resulting control function is linear in dB.
1
Patented.
Variable Gain Amplifiers
AD600/AD602
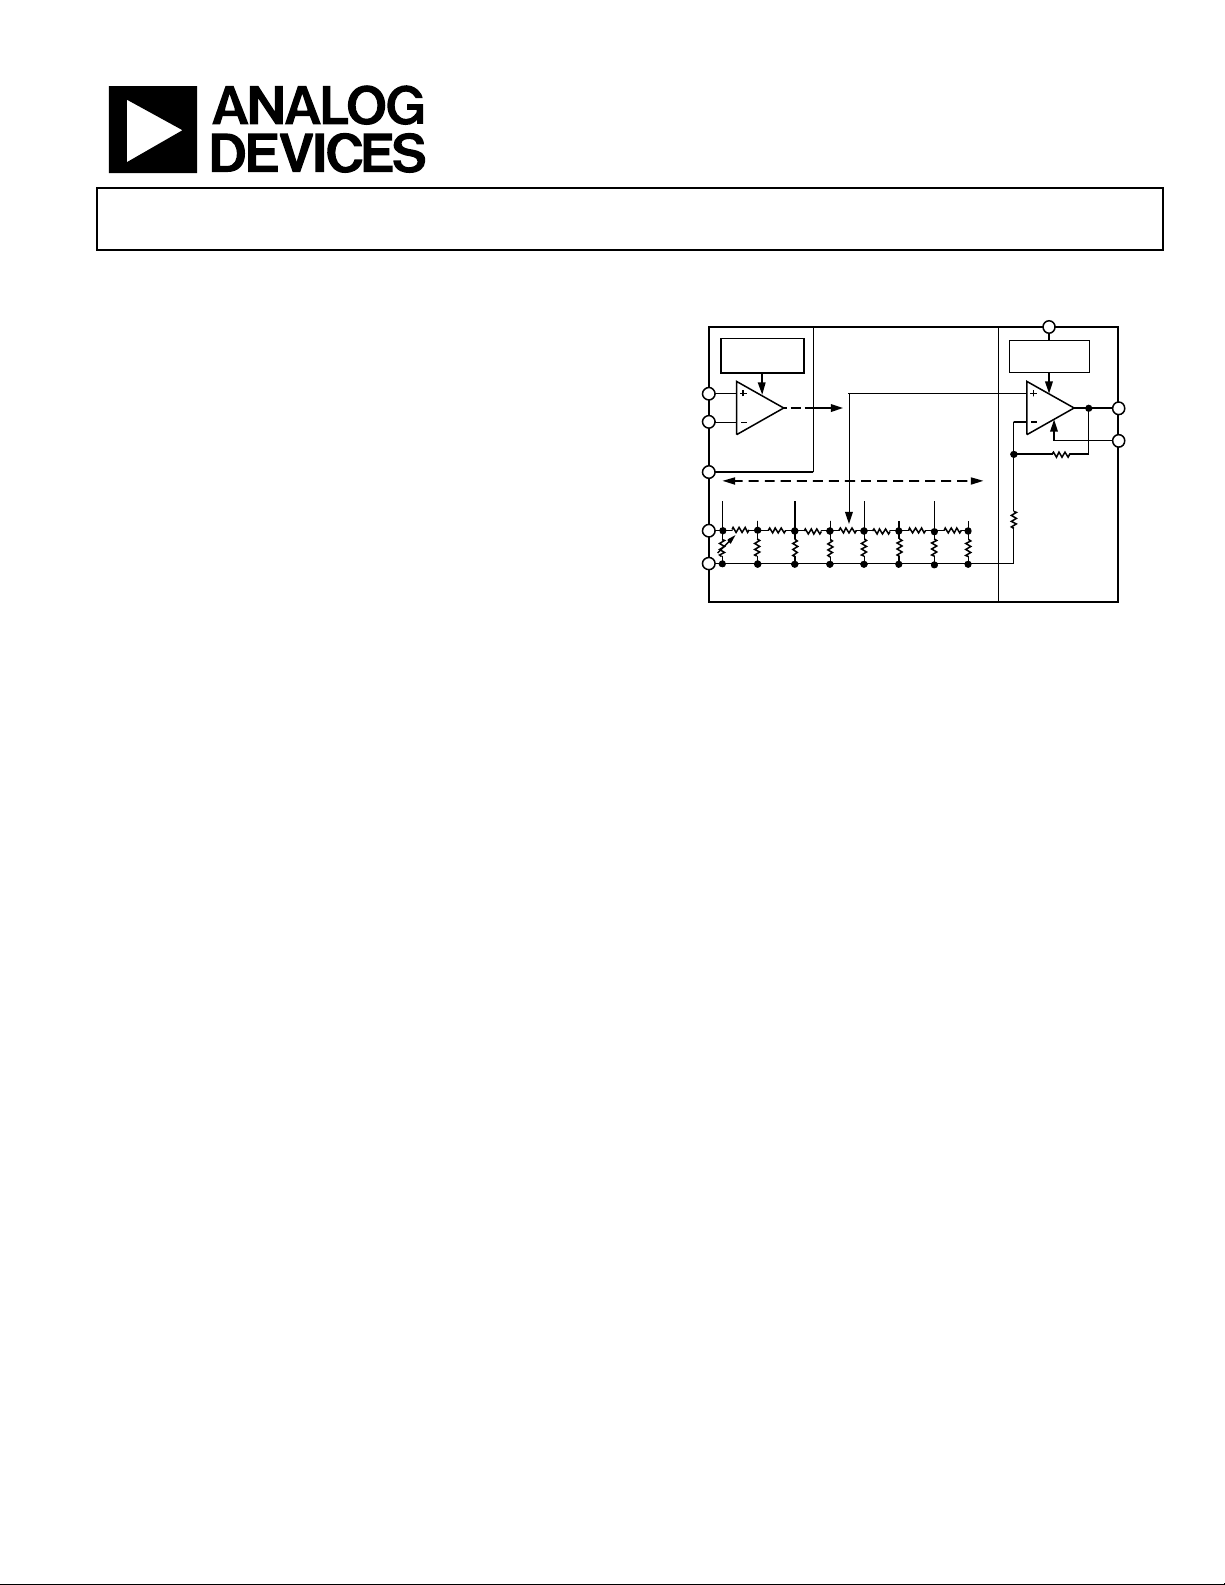
FUNCTIONAL BLOCK DIAGRAM
G
T1
SCALING
REFERENCE
C1HI
V
G
C1LO
GAIN CONTROL
INTERFACE
0dB
A1HI
A1LO
500Ω
Figure 1. Functional Block Diagram of a Single Channel of the AD600/AD602
–12.04dB
–6.02dB
R-2R LADDER NETWORK
The gain-control interfaces are fully differential, providing an
input resistance of ~15 M and a scale factor of 32 dB/V (that
is, 31.25 mV/dB) defined by an internal voltage reference. The
response time of this interface is less than 1 µs. Each channel
also has an independent gating facility that optionally blocks
signal transmission and sets the dc output level to within a few
millivolts of the output ground. The gating control input is
TTL- and CMOS-compatible.
The maximum gain of the AD600 is 41.07 dB, and the maximum
gain of the AD602 is 31.07 dB; the −3 dB bandwidth of both
models is nominally 35 MHz, essentially independent of the
gain. The SNR for a 1 V rms output and a 1 MHz noise
bandwidth is typically 76 dB for the AD600 and 86 dB for the
AD602. The amplitude response is flat within ±0.5 dB from
100 kHz to 10 MHz; over this frequency range, the group delay
varies by less than ±2 ns at all gain settings.
Each amplifier channel can drive 100 load impedances with
low distortion. For example, the peak specified output is ±2.5 V
minimum into a 500 load or ±1 V into a 100 load. For a
200 load in shunt with 5 pF, the total harmonic distortion for
a ±1 V sinusoidal output at 10 MHz is typically −60 dBc.
The AD600J/AD602J are specified for operation from 0°C to 70°C
and are available in 16-lead PDIP (N) and 16-lead SOIC packages.
The AD600A/AD602A are specified for operation from −40°C to
+85°C and are available in 16-lead CERDIP (Q) and 16-lead SOIC
packages. The AD600S/AD602S are specified for operation from
−55°C to +125°C, are available in a 16-lead CERDIP (Q) package,
and are MIL-STD-883-compliant. The AD600S/AD602S are also
available under DESC SMD 5962-94572.
PRECISION PASSIVE
INPUT ATTENUATOR
–18.06dB
–22.08dB
–30.1dB
–36.12dB
–42.14dB
62.5Ω
GATING
INTERFACE
RF2
2.24kΩ (AD600)
694Ω (AD602)
RF1
20Ω
FIXED-GAIN
AMPLIFIER
41.07dB (AD600)
31.07dB (AD602)
A1OP
A1CM
00538-001
Rev. F
Information furnished by Analog Devices is believed to be accurate and reliable. However, no
responsibility is assumed by Analog Devices for its use, nor for any infringements of patents or other
rights of third parties that may result from its use. Specifications subject to change without notice. No
license is granted by implication or otherwise under any patent or patent rights of Analog Devices.
Trademarks and registered trademarks are the property of their respective owners.
One Technology Way, P.O. Box 9106, Norwood, MA 02062-9106, U.S.A.
Tel: 781.329.4700 www.analog.com
Fax: 781.461.3113 ©2008 Analog Devices, Inc. All rights reserved.
Page 2

AD600/AD602
TABLE OF CONTENTS
Features .............................................................................................. 1
Applications ....................................................................................... 1
General Description ......................................................................... 1
Functional Block Diagram .............................................................. 1
Revision History ............................................................................... 2
Specifications ..................................................................................... 3
Absolute Maximum Ratings ............................................................ 5
ESD Caution .................................................................................. 5
Pin Configuration and Function Descriptions ............................. 6
Typical Performance Characteristics ............................................. 7
Theory of Operation ...................................................................... 10
Noise Performance ..................................................................... 10
Gain-Control Interface .............................................................. 11
Signal-Gating Inputs .................................................................. 11
Common-Mode Rejection ........................................................ 11
Achieving 80 dB Gain Range .................................................... 11
Sequential Mode (Maximum SNR) ......................................... 12
Parallel Mode (Simplest Gain-Control Interface) .................. 13
Low Ripple Mode (Minimum Gain Error) ............................. 13
Applications Information .............................................................. 15
Time-Gain Control (TGC) and Time-Variable
Gain (TVG) ................................................................................. 15
Increasing Output Drive ............................................................ 15
Driving Capacitive Loads .......................................................... 15
Realizing Other Gain Ranges ................................................... 16
Ultralow Noise VCA .................................................................. 16
Low Noise, 6 dB Preamplifier ................................................... 16
Low Noise AGC Amplifier with 80 dB Gain Range .............. 17
Wide Range, RMS-Linear dB Measurement System
(2 MHz AGC Amplifier with RMS Detector) ........................ 19
100 dB to 120 dB RMS Responding Constant Bandwidth
AGC Systems with High Accuracy Decibel Outputs ............ 21
100 dB RMS/AGC System with Minimal Gain Error
(Parallel Gain with Offset) ........................................................ 22
120 dB RMS/AGC System with Optimal SNR
(Sequential Gain) ....................................................................... 23
Outline Dimensions ....................................................................... 27
Ordering Guide .......................................................................... 29
REVISION HISTORY
10/08—Rev. E to Rev. F
Changes to Power Supply Parameter, Table 1 ............................... 3
Changes to Figure 41 ...................................................................... 20
Changes to Figure 45 ...................................................................... 21
Changes to Figure 47 ...................................................................... 22
Changes to Figure 51 ...................................................................... 24
Updated Outline Dimensions ....................................................... 27
Changes to Ordering Guide .......................................................... 29
1/06—Rev. D to Rev. E
Updated Format .................................................................. Universal
Changes to Table 2 ............................................................................ 5
Changes to The Gain-Control Interface Section ........................ 11
Updated Outline Dimensions ....................................................... 27
Changes to Ordering Guide .......................................................... 28
3/04—Rev. C to Rev. D
Changes to Specifications ................................................................ 2
Changes to Ordering Guide ............................................................ 3
Changes to Figure 3 .......................................................................... 8
Changes to Figure 29 ...................................................................... 18
Updated Outline Dimensions ....................................................... 20
5/02—Rev. B to Rev. C
Changes to Specifications ................................................................. 2
Renumber Tables and TPCs ................................................... Global
8/01—Rev. A to Rev. B
Changes to Accuracy Section of AD600A/AD602A column ...... 2
Rev. F | Page 2 of 32
Page 3

AD600/AD602
SPECIFICATIONS
Each amplifier section at TA = 25°C, VS = ±5 V, −625 mV ≤ VG ≤ +625 mV, RL = 500 Ω, and CL = 5 pF, unless otherwise noted.
Specifications for the AD600/AD602 are identical, unless otherwise noted.
Table 1.
1
AD600J/AD602J
AD600A/AD602A1
Parameter Conditions Min Typ Max Min Typ Max Unit
INPUT CHARACTERISTICS
Input Resistance Pin 2 to Pin 3; Pin 6 to Pin 7
98
100
102 95
100
105
Ω
Input Capacitance 2 2 pF
Input Noise Spectral Density
2
1.4 1.4 nV/√Hz
Noise Figure RS = 50 Ω, maximum gain 5.3 5.3 dB
R
= 200 Ω, maximum gain 2 2 dB
S
Common-Mode Rejection Ratio f = 100 kHz 30 30 dB
OUTPUT CHARACTERISTICS
−3 dB Bandwidth V
= 100 mV rms 35 35 MHz
OUT
Slew Rate 275 275 V/µs
Peak Output
3
R
≥ 500 Ω ±2.5 ±3 ±2.5 ±3 V
L
Output Impedance f ≤ 10 MHz 2 2 Ω
Output Short-Circuit Current 50 50 mA
Group Delay Change vs. Gain f = 3 MHz; full gain range ±2 ±2 ns
Group Delay Change vs. Frequency VG = 0 V, f = 1 MHz to 10 MHz ±2 ±2 ns
Total Harmonic Distortion RL= 200 Ω, V
= ±1 V peak, RPD = 1 kΩ −60 −60 dBc
OUT
ACCURACY
AD600
Gain Error 0 dB to 3 dB gain
3 dB to 37 dB gain
37 dB to 40 dB gain
Maximum Output Offset Voltage
4
V
= –625 mV to +625 mV 10
G
0
−0.5
−1
Output Offset Variation VG = –625 mV to +625 mV 10
+0.5
+1 −0.5
±0.2
+0.5 −1.0
−0.5
0 −1.5
50
50
+0.5
+1.5
±0.2
+1.0
−0.5
+0.5
10
10
65
65
dB
dB
dB
mV
mV
AD602
Gain Error –10 dB to –7 dB gain
–7 dB to +27 dB gain
27 dB to 30 dB gain
Maximum Output Offset Voltage
4
V
= −625 mV to +625 mV 5
G
0
−0.5
−1
Output Offset Variation VG = −625 mV to +625 mV 5
+0.5
+1 –0.5
±0.2
+0.5 −1.0
−0.5
0 −1.5
30
30
+0.5
+1.5
±0.2
+1.0
−0.5
+0.5
10
10
45
45
dB
dB
dB
mV
mV
GAIN CONTROL INTERFACE
Gain Scaling Factor
+3 dB to +37 dB (AD600);
31.7
32
32.3 30.5
32
33.5
dB/V
−7 dB to +27 dB (AD602)
Common-Mode Range −0.75 +2.5 −0.75 +2.5 V
Input Bias Current 0.35 1 0.35 1 A
Input Offset Current 10 50 10 50 nA
Differential Input Resistance Pin 1 to Pin 16; Pin 8 to Pin 9 15 15 MΩ
Response Rate Full 40 dB gain change 40 40 dB/s
Rev. F | Page 3 of 32
Page 4

AD600/AD602
AD600J/AD602J
1
AD600A/AD602A1
Parameter Conditions Min Typ Max Min Typ Max Unit
SIGNAL GATING INTERFACE
Logic Input Low (Output On) 0.8 0.8 V
Logic Input High (Output Off) 2.4 2.4 V
Response Time On to off, off to on 0.3 0.3 µs
Input Resistance Pin 4 to Pin 3; Pin 5 to Pin 6 30 30 kΩ
Output Gated Off
Output Offset Voltage ±10
±100
±10
±400
mV
Output Noise Spectral Density 65 65 nV/√Hz
Signal Feedthrough @ 1 MHz
AD600 −80 −80 dB
AD602 −70 −70 dB
POWER SUPPLY
Specified Operating Range ±4.75 ±5.25 ±4.75 ±5.25 V
Quiescent Current Each channel 11
1
Specifications shown in boldface are tested on all production units at final electrical test. Results from those tests are used to calculate outgoing quality levels. All
minimum and maximum specifications are guaranteed, although only those shown in boldface are tested on all production units.
2
Typical open- or short-circuited input; noise is lower when the system is set to maximum gain and the input is short-circuited. This figure includes the effects of both
voltage and current noise sources.
3
With an additional 1 kΩ pull-down resistor, if RL < 500 Ω.
4
The dc gain of the main amplifier in the AD600 is ×113; therefore, an input offset of only 100 V becomes an 11.3 mV output offset. In the AD602, the amplifier gain is
×35.7; therefore, an input offset of 100 V becomes a 3.57 mV output offset.
12.5
11
14
mA
Rev. F | Page 4 of 32
Page 5
AD600/AD602
ABSOLUTE MAXIMUM RATINGS
Table 2.
Parameter Rating
Supply Voltage ± VS ±7.5 V
Input Voltages
Pin 1, Pin 8, Pin 9, Pin 16 ±VS
Pin 2, Pin 3, Pin 6, Pin 7 ±2 V continuous
±VS for 10 ms
Pin 4, Pin 5 ±VS
Internal Power Dissipation 600 mW
Operating Temperature Range
J Grade 0°C to 70°C
A Grade −40°C to +85°C
S Grade −55°C to +125°C
Storage Temperature Range −65°C to +150°C
Lead Temperature (Soldering, 60 sec) 300°C
θJA
16-Lead PDIP 85°C/W
16-Lead SOIC 100°C/W
16-Lead CERDIP 120°C/W
Stresses above those listed under Absolute Maximum Ratings
may cause permanent damage to the device. This is a stress
rating only; functional operation of the device at these or any
other conditions above those indicated in the operational
section of this specification is not implied. Exposure to absolute
maximum rating conditions for extended periods may affect
device reliability.
ESD CAUTION
Rev. F | Page 5 of 32
Page 6
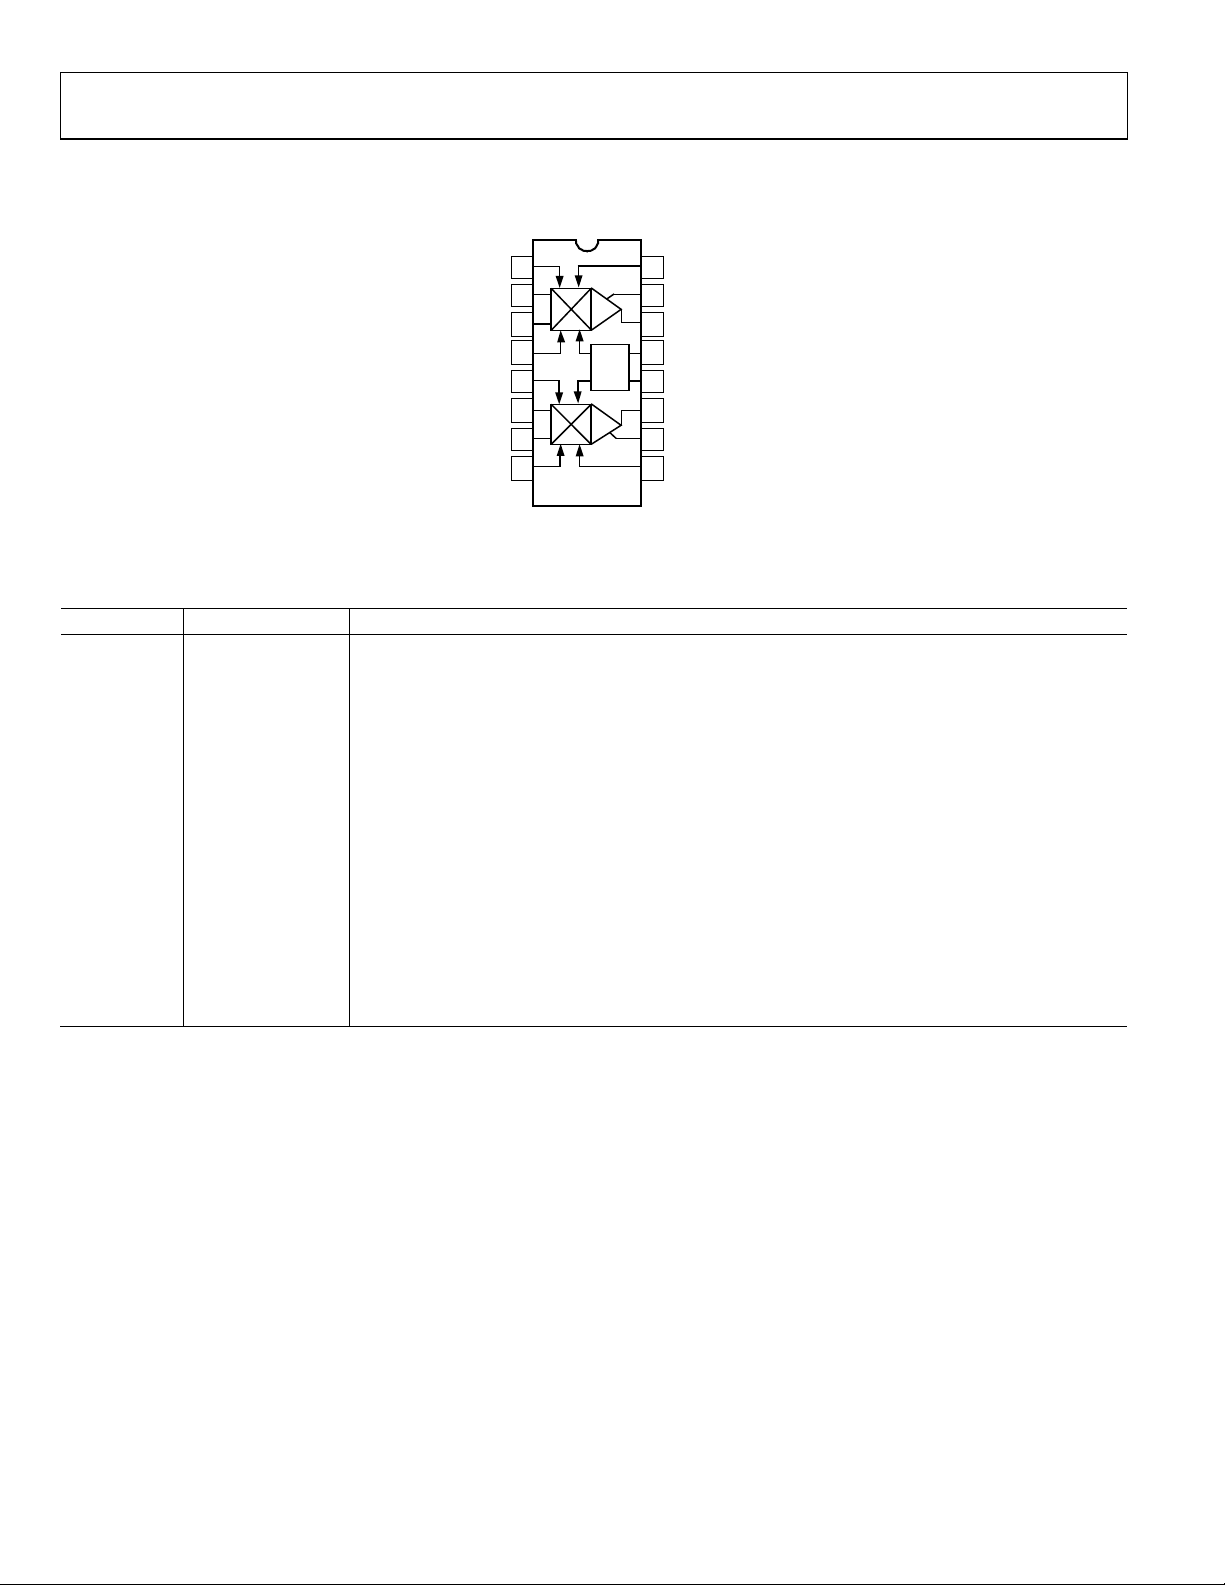
AD600/AD602
A
A
PIN CONFIGURATION AND FUNCTION DESCRIPTIONS
C1LO
A1HI
1LO
GAT1
GAT2
2LO
A2HI
C2LO
1
2
3
4
5
6
7
8
+
–
–
+
AD600/
AD602
A1
REF
A2
C1HI
16
A1CM
15
A1OP
14
VPOS
13
VNEG
12
11
A2OP
10
A2CM
9
C2HI
00538-002
Figure 2. Pin Configuration
Table 3. Pin Function Descriptions
Pin No. Mnemonic Description
1 C1LO CH1 Gain-Control Input Low. Positive voltage reduces CH1 gain.
2 A1HI CH1 Signal Input High. Positive voltage increases CH1 output.
3 A1LO CH1 Signal Input Low. Usually connected to CH1 input ground.
4 GAT1 CH1 Gating Input. A logic high shuts off the CH1 signal path.
5 GAT2 CH2 Gating Input. A logic high shuts off the CH2 signal path.
6 A2LO CH2 Signal Input Low. Usually connected to CH2 input ground.
7 A2HI CH2 Signal Input High. Positive voltage increases CH2 output.
8 C2LO CH2 Gain-Control Input Low. Positive voltage reduces CH2 gain.
9 C2HI CH2 Gain-Control Input High. Positive voltage increases CH2 gain.
10 A2CM CH2 Common. Usually connected to CH2 output ground.
11 A2OP CH2 Output.
12 VNEG Negative Supply for Both Amplifiers.
13 VPOS Positive Supply for Both Amplifiers.
14 A1OP CH1 Output.
15 A1CM CH1 Common. Usually connected to CH1 output ground.
16 C1HI CH1 Gain-Control Input High. Positive voltage increases CH1 gain.
Rev. F | Page 6 of 32
Page 7
AD600/AD602
–
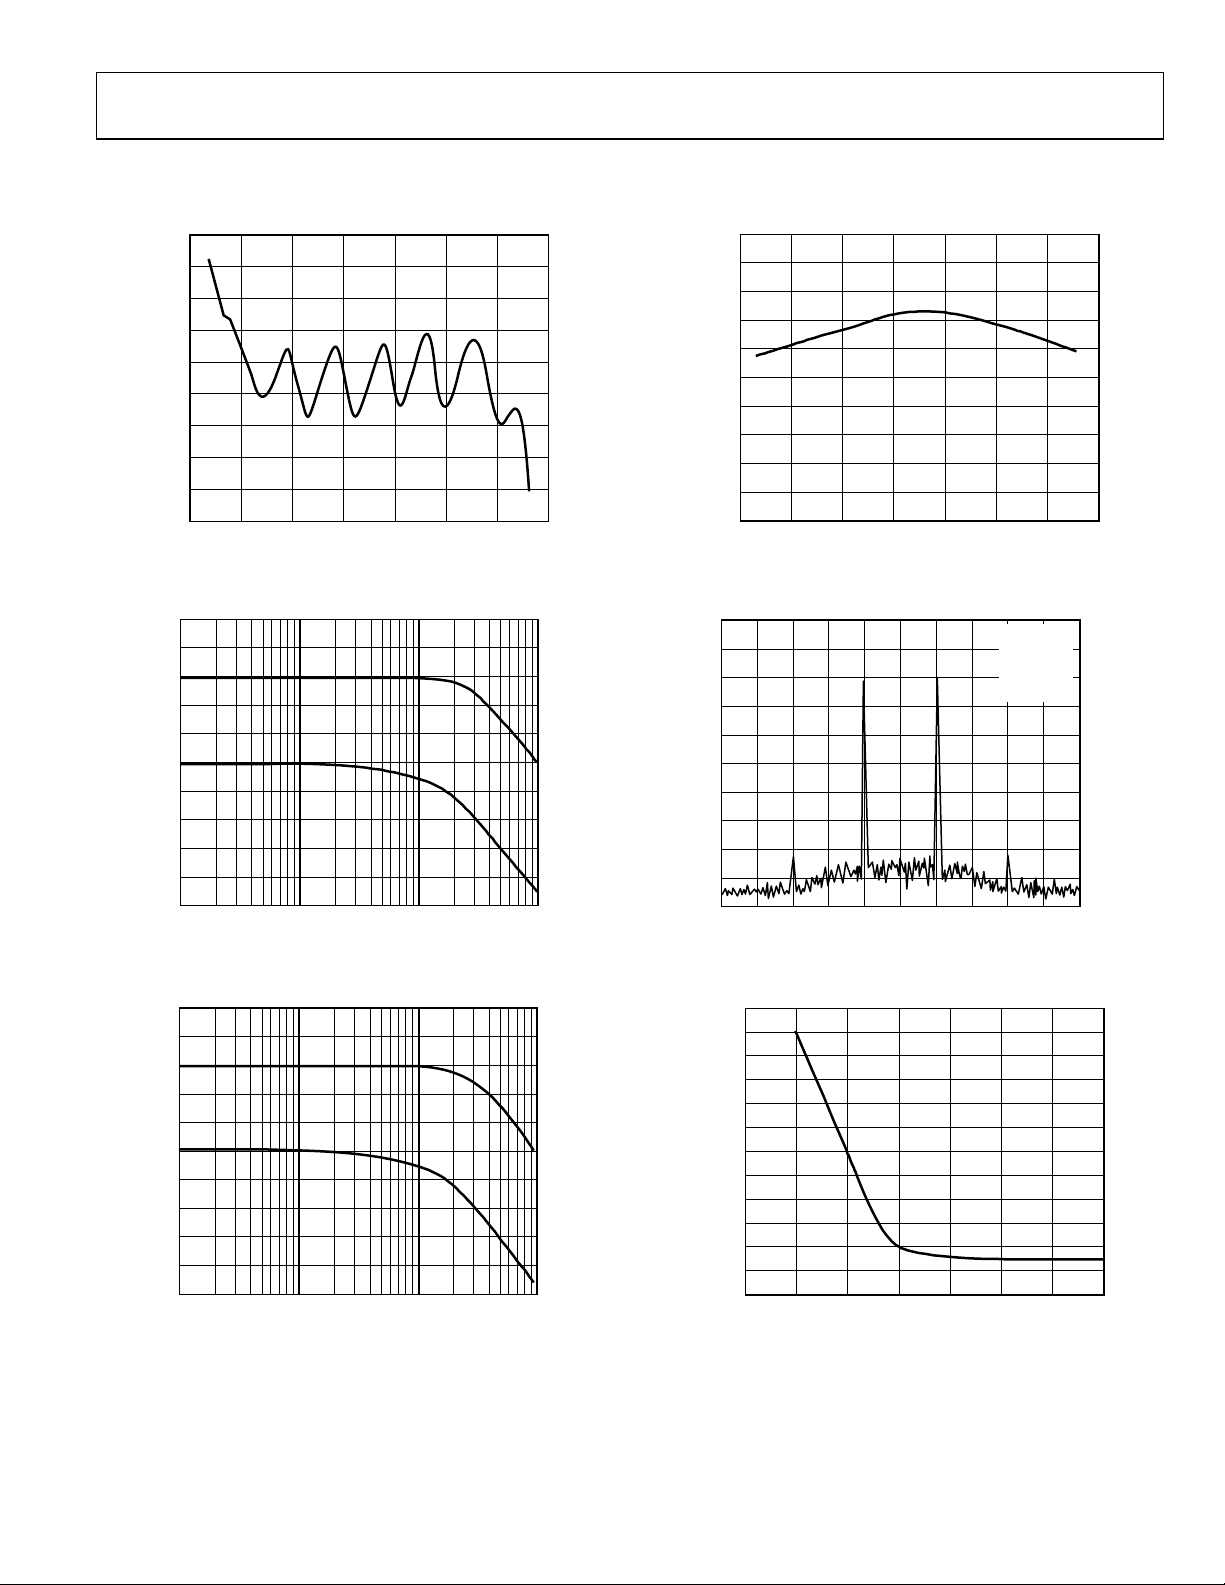
TYPICAL PERFORMANCE CHARACTERISTICS
10.0
9.8
9.6
9.4
9.2
9.0
8.8
GROUP DELAY (ns)
8.6
8.4
8.2
8.0
–0.7 0.5
GAIN CONTROL VOLTAGE (V)
Figure 6. AD600 and AD602 Typical Group Delay vs. V
VG=0V
10dB/DIV
CENTER
FREQ 1MHz
10kHz/DIV
00538-006
0.7–0.5 0.30.1–0.1–0.3
C
–0.05
–0.15
GAIN ERROR (dB)
–0.25
–0.35
–0.45
20dB
17dB
0.45
0.35
0.25
0.15
0.05
GAIN CONTROL VOLTAGE (V)
Figure 3. Gain Error vs. Gain Control Voltage
00538-003
0.7–0.5–0.7 0.50.30.1–0.1–0.3
0°
–45°
–90°
FREQUENCY (Hz)
Figure 4. AD600 Frequency and Phase Response vs. Gain
10dB
7dB
0°
–45°
–90°
100k 1M 10M 100M
FREQUENCY (Hz)
Figure 5. AD602 Frequency and Phase Response vs. Gain
00538-004
100M1M100k 10M
Figure 7. Third-Order Intermodulation Distortion, V
= 2 V p-p, RL = 500 Ω
OUT
0538-007
1.0
–1.2
–1.4
–1.6
–1.8
–2.0
–2.2
–2.4
–2.6
–2.8
–3.0
NEGATIVE OUTPUT VOLTAGE LIMIT (V)
538-005
00
–3.2
–3.4
50
0
LOAD RESISTANCE (Ω)
20001000500200100
00538-008
Figure 8. Typical Output Voltage vs. Load Resistance
(Negative Output Swing Limits First)
Rev. F | Page 7 of 32
Page 8
AD600/AD602
102
101
100
99
98
97
96
95
INPUT IMPEDANCE (Ω)
94
93
92
100k 1M 10M 100M
Figure 9. Input Impedance vs. Frequency
6
5
4
3
2
1
0
–1
–2
OUTPUT OFFSETVOLTAGE (mV)
–3
–4
–0.5–0.7 0.5
Figure 10. Output Offset Voltage vs. Gain Control Voltage
(Control Channel Feedthrough)
GAIN = 40dB
GAIN = 20dB
GAIN = 0dB
FREQUENCY (Hz)
AD600
AD602
–0.3 –0.1 0.1 0.3
GAIN CONTROL VOLTAGE (V)
0.7
50mV
100
90
OUTPUTINPUT
10
0%
5V 100ns
00538-012
00538-009
Figure 12. Gating Feedthrough to Output, Gating Off to On
50mV
100
90
OUTPUTINPUT
10
0%
5V 100ns
00538-013
00538-010
Figure 13. Gating Feedthrough to Output, Gating On to Off
1V VOUT
100
90
OUTPUT
UTINP
10
0%
1V VC
1µs
0538-011
Figure 11. Gain Control Channel Response Time. Top: Output Voltage, 2 V
Maximum, Bottom: Gain Control Voltage V
= ±625 mV
C
Rev. F | Page 8 of 32
1V
100
90
OUTPUTINPUT
10
0%
100mV
500ns
Figure 14. Transient Response, Medium and High Gain
538-01400
Page 9
AD600/AD602
T
R
T
10
500mV
100
90
OUTPUTINPU
10
0%
1V 200ns
Figure 15. Input Stage Overload Recovery Time
100
90
OUTPUT
10
0%
INPUT
200mV 500ns
Figure 16. Output Stage Overload Recovery Time
100
90
OUTPUT
10
0%
INPUT
1V 500ns
Figure 17. Transient Response Minimum Gain
1V
500mV
00538-015
00538-016
00538-017
AD600: G = 20dB
5
AD602: G = 10dB
BOTH: V
0
–5
–10
–15
CMRR (dB)
–20
–25
–30
–35
–40
1k 10k 100k 1M 10M 100M
= 100mV rms
CM
V
=±5V
S
R
= 500Ω
L
T
= 25°C
A
AD600
AD602
FREQUENCY (Hz)
Figure 18. CMRR vs. Frequency
20
10
0
–10
–20
–30
PSRR (dB)
–40
–50
–60
–70
–80
100k 1M 10M 100M
AD600
AD602
FREQUENCY (Hz)
AD600: G = 40dB
AD602: G = 30dB
BOTH: R
= 500Ω
L
VIN=0V
R
=50Ω
S
Figure 19. PSRR vs. Frequency
10
AD600: CH1 G = 40dB, VIN = 0
0
–10
–20
–30
ALK (dB)
–40
OSS
–50
C
–60
–70
–80
–90
100k 1M 10M 100M
CH2 G = 20dB, V
AD602: CH1 G = 30d B, V
CH2 G = 0dB, V
BOTH: V
CROSSTALK = 20 log
= 1V rms1, RS = 50Ω
OUT
= 500Ω
R
L
= 100mV
IN
= 0
IN
= 316mV
IN
CH1 V
OUT
CH2 V
IN
AD600
FREQUENCY (Hz)
AD602
Figure 20. Crosstalk Between A1 and A2 vs. Frequency
00538-018
00538-019
00538-020
Rev. F | Page 9 of 32
Page 10
AD600/AD602
THEORY OF OPERATION
The AD600/AD602 have the same general design and features.
They comprise two fixed gain amplifiers, each preceded by a
voltage-controlled attenuator of 0 dB to 42.14 dB with independent
control interfaces, each having a scaling factor of 32 dB per volt.
The AD600 amplifiers are laser trimmed to a gain of 41.07 dB
(×113), providing a control range of −1.07 dB to +41.07 dB
(0 dB to +40 dB with overlap). The AD602 amplifiers have a gain
of 31.07 dB (×35.8) and provide an overall gain of −11.07 dB to
+31.07 dB (−10 dB to +30 dB with overlap).
The advantage of this topology is that the amplifier can use
negative feedback to increase the accuracy of its gain. In
addition, because the amplifier does not have to handle large
signals at its input, the distortion can be very low. Another
feature of this approach is that the small-signal gain and phase
response, and thus the pulse response, are essentially
independent of gain.
Figure 21 is a simplified schematic of one channel. The input
attenuator is a 7-stage R-2R ladder network, using untrimmed
resistors of nominally R = 62.5 , which results in a characteristic
resistance of 125 ± 20%. A shunt resistor is included at the
input and laser trimmed to establish a more exact input
resistance of 100 ± 2%, which ensures accurate operation
(gain and HP corner frequency) when used in conjunction with
external resistors or capacitors.
GAT1
SCALING
REFERENCE
C1HI
V
G
C1LO
GAIN CONTROL
INTERFACE
0dB
–12.04dB
A1HI
A1LO
Figure 21. Simplified Block Diagram of a Single Channel of the AD600/AD602
–6.02dB
500Ω
R-2R LADDER NETWORK
The nominal maximum signal at input A1HI is 1 V rms (±1.4 V
peak) when using the recommended ±5 V supplies, although
operation to ±2 V peak is permissible with some increase in HF
distortion and feedthrough. Each attenuator is provided with a
separate signal LO connection for use in rejecting common
mode, the voltage between input and output grounds. Circuitry
is included to provide rejection of up to ±100 mV.
PRECISION PASSIVE
INPUT ATTENUATOR
–18.06dB
–22.08dB
–30.1dB
–36.12dB
–42.14dB
62.5Ω
GATING
INTERFACE
RF2
2.24kΩ (AD600)
694Ω (AD602)
RF1
20Ω
FIXED-GAIN
AMPLIFIER
41.07dB (AD600)
31.07dB (AD602)
A1OP
A1CM
The signal applied at the input of the ladder network is
attenuated by 6.02 dB by each section; thus, the attenuation to
each of the taps is progressively 0 dB, 6.02 dB, 12.04 dB, 18.06 dB,
24.08 dB, 30.1 dB, 36.12 dB, and 42.14 dB. A unique circuit
technique is employed to interpolate between these tap points,
indicated by the slider in Figure 21, providing continuous
attenuation from 0 dB to 42.14 dB.
To understand the AD600/AD602, it helps to think in terms of
a mechanical means for moving this slider from left to right; in
fact, it is voltage controlled. The details of the control interface
are discussed later. Note that the gain is exactly determined at
all times and a linear decibel relationship is guaranteed automatically between the gain and the control parameter that
determines the position of the slider. In practice, the gain
deviates from the ideal law by about ±0.2 dB peak (see Figure 28).
Note that the signal inputs are not fully differential. A1LO, A1CM
(for CH1), A2LO, and A2CM (for CH2) provide separate access
to the input and output grounds. This recognizes that, even when
using a ground plane, small differences arise in the voltages at
these nodes. It is important that A1LO and A2LO be connected
directly to the input ground(s). Significant impedance in these
connections reduces the gain accuracy. A1CM and A2CM
should be connected to the load ground(s).
NOISE PERFORMANCE
An important reason for using this approach is the superior
noise performance that can be achieved. The nominal resistance
seen at the inner tap points of the attenuator is 41.7 (one third of
125 ), which, at 27°C, exhibits a Johnson noise spectral density
(NSD) of 0.84 nV/√Hz (that is, √4kTR), a large fraction of the
total input noise. The first stage of the amplifier contributes
another 1.12 nV/√Hz, for a total input noise of 1.4 nV/√Hz.
The noise at the 0 dB tap depends on whether the input is
short-circuited or open-circuited. When shorted, the minimum
NSD of 1.12 nV/√Hz is achieved. When open, the resistance of
00538-021
100 at the first tap generates 1.29 nV/√Hz, so the noise
increases to 1.71 nV/√Hz. This last calculation would be important
if the AD600 were preceded, for example, by a 900 resistor to
allow operation from inputs up to ±10 V rms. However, in most
cases, the low impedance of the source limits the maximum
noise resistance.
Rev. F | Page 10 of 32
Page 11

AD600/AD602
It is apparent from the foregoing that it is essential to use a low
resistance in the design of the ladder network to achieve low
noise. In some applications, this can be inconvenient, requiring
the use of an external buffer or preamplifier. However, very few
amplifiers combine the needed low noise with low distortion at
maximum input levels, and the power consumption required to
achieve this performance is quite high (due to the need to
maintain very low resistance values while also coping with large
inputs). On the other hand, there is little value in providing a
buffer with high input impedance because the usual reason for
this—the minimization of loading of a high resistance source—
is not compatible with low noise.
Apart from the small variations just mentioned, the SNR at the
output is essentially independent of the attenuator setting,
because the maximum undistorted output is 1 V rms, and the
NSD at the output of the AD600 is fixed at 113 × 114 nV/√Hz,
or 158 nV/√Hz. Therefore, in a 1 MHz bandwidth, the output
SNR is 76 dB. The input NSD of the AD600/AD602 is the same
but, because of the 10 dB lower gain in the AD602’s fixed
amplifier, its output SNR is 10 dB better, or 86 dB in a 1 MHz
bandwidth.
GAIN-CONTROL INTERFACE
The attenuation is controlled through a differential, high
impedance (15 MΩ) input, with a scaling factor that is laser
trimmed to 32 dB per volt, that is, 31.25 mV/dB. Each of the
two amplifiers has its own control interface. An internal band
gap reference ensures stability of the scaling with respect to
supply and temperature variations and is the only circuitry
common to both channels.
When the differential input voltage V
slider is centered, providing an attenuation of +21.07 dB,
resulting in an overall gain of +20 dB (= –21.07 dB + +41.07 dB).
When the control input is −625 mV, the gain is lowered by
+20 dB (= +0.625 × +32) to 0 dB; when set to +625 mV, the
gain is increased by +20 dB to +40 dB. When this interface is
overdriven in either direction, the gain approaches either
−1.07 dB (= −42.14 dB + +41.07 dB) or +41.07 dB (= 0 +
+41.07 dB), respectively.
The gain of the AD600 can be calculated by
Gain (dB) = 32 V
where V
is in volts.
G
+ 20 (1)
G
For the AD602, the expression is
Gain (dB) = 32 V
Operation is specified for V
+ 10 (2)
G
in the range from −625 mV dc to
G
+625 mV dc. The high impedance gain-control input ensures
minimal loading when driving many amplifiers in multiplechannel applications. The differential input configuration
provides flexibility in choosing the appropriate signal levels
and polarities for various control schemes.
= 0 V, the attenuator
G
For example, the gain-control input can be fed differentially to
the inputs or single-ended by simply grounding the unused
input. In another example, if the gain is controlled by a DAC
providing a positive-only, ground-referenced output, the gain
control LO pin (either C1LO or C2LO) should be biased to a
fixed offset of 625 mV to set the gain to 0 dB when gain control
HI (C1HI or C2HI) is at zero and to set the gain to 40 dB when
at 1.25 V.
It is a simple matter to include a voltage divider to achieve other
scaling factors. When using an 8-bit DAC with an FS output of
2.55 V (10 mV/bit), a 1.6 divider ratio (generating 6.25 mV/bit)
results in a gain setting resolution of 0.2 dB/bit. The process of
cascading the two sections of an AD600 or AD602 when various
options exist for gain control is explained in the Achieving 80 DB
Gain Range section.
SIGNAL-GATING INPUTS
Each amplifier section of the AD600/AD602 is equipped with a
signal-gating function, controlled by a TTL or CMOS logic
input (GAT1 or GAT2). The ground references for these inputs
are the signal input grounds A1LO and A2LO, respectively.
Operation of the channel is unaffected when this input is LO or
left open-circuited. Signal transmission is blocked when this
input is HI. The dc output level of the channel is set to within a
few millivolts of the output ground (A1CM or A2CM), and
simultaneously the noise level drops significantly. The reduction
in noise and spurious signal feedthrough is useful in ultrasound
beam-forming applications, where many amplifier outputs are
summed.
COMMON-MODE REJECTION
A special circuit technique provides rejection of voltages
appearing between input grounds (A1LO and A2LO) and
output grounds (A1CM and A2CM). This is necessary because
of the op amp form of the amplifier, as shown in Figure 21.
The feedback voltage is developed across the RF1 resistor
(which, to achieve low noise, has a value of only 20 ). The
voltage developed across this resistor is referenced to the input
common, so the output voltage is also referred to that node.
For zero differential signal input between A1HI and A1LO, the
output A1OP simply follows the voltage at A1CM. Note that the
range of voltage differences that can exist between A1LO and
A1CM (or A2LO and A2CM) is limited to about ±100 mV.
Figure 18 shows the typical common-mode rejection ratio vs.
frequency.
ACHIEVING 80 dB GAIN RANGE
The two amplifier sections of the X-AMP can be connected in
series to achieve higher gain. In this mode, the output of A1
(A1OP and A1CM) drives the input of A2 via a high-pass
network (usually just a capacitor) that rejects the dc offset.
The nominal gain range is now –2 dB to +82 dB for the AD600
or −22 dB to +62 dB for the AD602.
Rev. F | Page 11 of 32
Page 12

AD600/AD602
There are several options in connecting the gain-control inputs.
The choice depends on the desired SNR and gain error (output
ripple). The following examples feature the AD600; the
arguments generally apply to the AD602, with appropriate
changes to the gain values.
SEQUENTIAL MODE (MAXIMUM SNR)
In the sequential mode of operation, the SNR is maintained at
its highest level for as much of the gain control range as
possible, as shown in Figure 22. Note here that the gain range is
0 dB to 80 dB. Figure 23, Figure 24, and Figure 25 show the
general connections to accomplish this. Both gain-control
inputs, C1HI and C2HI, are driven in parallel by a positive-only,
ground-referenced source with a range of 0 V to 2.5 V.
A1
–40.00dB
85
80
75
70
65
60
55
SNR (dB)
50
45
40
35
30
V
G
-022
00538
3.00–0.5 2.52.01.51.00.5
Figure 22. SNR vs. Control Voltage Sequential Control (1 MHz Bandwidth)
An auxiliary amplifier that senses the voltage difference
between input and output commons is provided to reject this
common voltage.
A2
–41.07dB
INPUT
0dB
VC = 0V
–40.00dB
C1HI C1LO
V
G1
V
O1
= 0.592V
41.07dB
1.07dB
–42.14dB
C2HI C2LO
V
G2
VO2 = 1.908V
41.07dB
OUTPUT
0dB
00538-023
Figure 23. AD600 Gain Control Input Calculations for Sequential Control Operation (A)
A2
–1.07dB
41.07dB
V
G2
V
= 1.908V
O2
OUTPUT
40dB
00538-055
INPUT
0dB
VC = 1.25V
A1
–0.51dB
–0.51dB
C1HI C1LO
V
G1
VO1 = 0.592V
41.07dB
40.56dB
–41.63dB
C2HI C2LO
Figure 24. AD600 Gain Control Input Calculations for Sequential Control Operation (B)
V
G2
VO2 = 1.908V
A2
38.93dB
41.07dB
OUTPUT
80dB
00538-056
INPUT
0dB
VC = 2.5V
A1
0dB
0dB
C1HI C1LO
V
G1
VO1 = 0.592V
41.07dB
41.07dB
–2.14dB
C2HI C2LO
Figure 25. AD600 Gain Control Input Calculations for Sequential Control Operation (C)
Rev. F | Page 12 of 32
Page 13

AD600/AD602
The gains are offset such that the gain of A2 is increased only
after the gain of A1 has reached its maximum value (see Figure 26).
Note that, for a differential input of −700 mV or less, the gain of
a single amplifier (A1 or A2) is at its minimum value of −1.07 dB;
for a differential input of +700 mV or more, the gain is at its
maximum value of +41.07 dB. Control inputs beyond these
limits do not affect the gain and can be tolerated without damage or
foldover in the response. See the Specifications section for more
details on the allowable voltage range. The gain is now
Gain (dB) = 32 V
where V
GAIN
(dB)
is the applied control voltage.
C
+41.07dB
+20dB
+1.07dB
0
–2.14
Figure 26. Explanation of Offset Calibration for Sequential Control
0
(3)
C
A1 A2
–0.56dB
0.625
20
*
GAIN OF FSET O F 1.07dB, OR 33.44mV
+40.56dB
*
*
809.1295.0
1.25
40
1.875
60
2.5
80
+38.93dB
–1.07dB
V
(V)
C
82.14
When VC is set to zero, VG1 = −0.592 V and the gain of A1 is
1.07 dB (recall that the gain of each amplifier section is 0 dB for
V
= 625 mV); meanwhile, VG2 = −1.908 V, so the gain of A2 is
G
−1.07 dB. The overall gain is thus 0 dB (see Figure 23). When
V
= 1.25 V, VG1 = 1.25 V – 0.592 V = 0.658 V, which sets the
C
gain of A1 to 40.56 dB, while V
= 1.25 V – 1.908 V = −0.658 V,
G2
which sets the gain of A2 at −0.56 dB. The overall gain is now
40 dB (see Figure 24). When V
= 2.5 V, the gain of A1 is 41.07 dB
C
and the gain of A2 is 38.93 dB, resulting in an overall gain of 80
dB (see Figure 25). This mode of operation is further clarified
by Figure 27, which is a plot of the separate gains of A1 and A2
and the overall gain vs. the control voltage. Figure 28 is a plot of
the gain error of the cascaded amplifiers vs. the control voltage.
00538-024
PARALLEL MODE (SIMPLEST GAIN-CONTROL INTERFACE)
In this mode, the gain-control voltage is applied to both inputs
in parallel—C1HI and C2HI are connected to the control
voltage, and C1LO and C2LO are optionally connected to an
offset voltage of 0.625 V. The gain scaling is then doubled to
64dB/V, requiring only 1.25 V for an 80 dB change of gain. In
this case, the amplitude of the gain ripple is also doubled, as is
shown in Figure 29, and the instantaneous SNR at the output of
A2 decreases linearly as the gain is increased (see Figure 30).
LOW RIPPLE MODE (MINIMUM GAIN ERROR)
As shown in Figure 28 and Figure 29, the output ripple is
periodic. By offsetting the gains of A1 and A2 by half the
period of the ripple, or 3 dB, the residual gain errors of the two
amplifiers can be made to cancel. Figure 31 shows the much
lower gain ripple when configured in this manner. Figure 32
plots the SNR as a function of gain; it is very similar to that in
the parallel mode.
Rev. F | Page 13 of 32
Page 14

AD600/AD602
R
R
90
80
70
60
50
OVERALL G AIN (dB)
40
30
20
10
–10
A1
COMBINED
V
C
A2
Figure 27. Plot of Separate and Overall Gains in Sequential Control
5
4
3
2
1
0
–1
OR (dB)
–2
–3
GAIN ER
–4
–5
–6
–7
–8
V
C
2.0 2.5
Figure 28. Gain Error for Cascaded Stages—Sequential Control
5
4
3
2
1
0
–1
–2
GAIN ERROR (dB)
–3
–4
–5
–6
0.2 0.4 0.6
0–0.1 1.21.00.8
V
C
Figure 29. Gain Error for Cascaded Stages—Parallel Control
75
70
65
60
55
50
SNR (dB)
45
40
35
538-025
00
3.00–0.5 2.52.01.51.00.5
30
0.20
V
C
1.21.00.80.60.4
1.4
00538-028
Figure 30. SNR for Cascaded Stages—Parallel Control
1.2
1.0
0.8
0.6
0.4
0.2
OR (dB)
0.0
–0.2
GAIN ER
–0.4
–0.6
–0.8
538-026
00
3.00–0.5 1.51.00.5
–1.0
–1.2
0.2 0.8
0.1
0
00538-029
1.3
V
C
1.21.11.00.90.70.60.50.40.3
Figure 31. Gain Error for Cascaded Stages—Low Ripple Mode
80
75
70
65
60
55
SNR (dB)
50
45
40
00538-027
35
V
C
8-030
0053
1.40.20 1.21.00.80.60.4
Figure 32. SNR vs. Control Voltage—Low Ripple Mode
Rev. F | Page 14 of 320
Page 15

AD600/AD602
T
A
APPLICATIONS INFORMATION
The full potential of any high performance amplifier can be
realized only by careful attention to details in its applications.
The following pages describe fully tested circuits in which many
such details have already been considered. However, as is always
true of high accuracy, high speed analog circuits, the schematic
is only part of the story; this is no less true for the AD600/
AD602. Appropriate choices in the overall board layout and the
type and placement of power supply decoupling components
are very important. As explained previously, the input grounds
A1LO and A2LO must use the shortest possible connections.
The following circuits show examples of time-gain control for
ultrasound and sonar, methods for increasing the output drive,
and AGC amplifiers for audio and RF/IF signal processing
using both peak and rms detectors. These circuits also illustrate
methods of cascading X-AMPs for either maintaining the
optimal SNR or maximizing the accuracy of the gain-control
voltage for use in signal measurement. These AGC circuits can
be modified for use as voltage-controlled amplifiers in sonar
and ultrasound applications by removing the detector and
substituting a DAC or other voltage source for supplying the
control voltage.
TIME-GAIN CONTROL (TGC) AND TIME-VARIABLE GAIN (TVG)
Ultrasound and sonar systems share a similar requirement: both
need to provide an exponential increase in gain in response to a
linear control voltage, that is, a gain control that is linear in dB.
Figure 33 shows the AD600/AD602 configured for a control
voltage ramp starting at −625 mV and ending at +625 mV for a
gain-control range of 40 dB. The polarity of the gain-control
voltage can be reversed, and the control voltage inputs, C1HI
and C1LO, can be reversed to achieve the same effect. The gaincontrol voltage can be supplied by a voltage output DAC, such
as the AD7244, which contains two complete DACs, operates
from ±5 V supplies, has an internal reference of +3 V, and
provides ±3 V of output swing. As such, it is well suited for use
with the AD600/AD602, needing only a few resistors to scale
the output voltage of the DACs to the levels needed by the
AD600/AD602.
CONTROLVOL
+625mV
0dB 40dB
V
G
–625mV
GE,
A1
GAIN
C1LO
A1HI
A1LO
GAT1
GAT2
A2LO
A2HI
C2LO
VOLTAGE-OUTPUT
DAC
1
2
+
3
–
4
5
–
6
7
+
8
AD600 OR
AD602
A1
A2
REF
V
G
C1HI
16
A1CM
15
A1OP
14
VPOS
13
VNEG
12
A2OP
11
A2CM
10
C2HI
9
+5V
–5V
Figure 33. The Simplest Application of the X-AMP Is as a TGC or TVG Amplifier
in Ultrasound or Sonar (Only A1 Connections Shown for Simplicity)
INCREASING OUTPUT DRIVE
The AD600/AD602 output stage has limited capability for
negative-load driving capability. For driving loads less than
500 , the load drive can be increased by approximately 5 mA
by connecting a 1 k pull-down resistor from the output to the
negative supply (see Figure 34).
DRIVING CAPACITIVE LOADS
For driving capacitive loads of greater than 5 pF, insert a 10
resistor between the output and the load. This lowers the
possibility of oscillation.
GAIN-CONTROL
VOLT AGE
C1LO
1
V
IN
A1HI
A1LO
GAT1
GAT2
A2LO
A2HI
C2LO
2
3
4
5
6
7
8
+
–
–
+
A1
REF
A2
AD600/
AD602
Figure 34. Adding a 1 kΩ Pull-Down Resistor Increases the X-AMP Output
Drive by About 5 mA (Only A1 Connections Shown for Simplicity)
C1HI
16
A1CM
15
A1OP
14
VPOS
+5V
13
VNEG
12
A2OP
11
A2CM
10
C2HI
9
1kΩ
–5V
ADDED
PULL-DOW
RESISTOR
00538-031
N
00538-032
Rev. F | Page 15 of 32
Page 16

AD600/AD602
V
V
REALIZING OTHER GAIN RANGES
Larger gain ranges can be accommodated by cascading
amplifiers. Combinations built by cascading two amplifiers
include −20 dB to +60 dB (using one AD602), −10 dB to +70 dB
(using ½ of an AD602 followed by ½ of an AD600), and 0 dB to
80 dB (using one AD600). In multiple-channel applications,
extra protection against oscillation can be provided by using
amplifier sections from different packages.
ULTRALOW NOISE VCA
The two channels of the AD600 or AD602 can operate in
parallel to achieve a 3 dB improvement in noise level, providing
1 nV/√Hz without any loss of gain accuracy or bandwidth.
In the simplest case, as shown in Figure 35, the signal inputs,
A1HI and A2HI, are tied directly together. The outputs, A1OP
and A2OP, are summed via R1 and R2 (100 each), and the
control inputs, C1HI/C2HI and C1LO/C2LO, operate in
parallel. Using these connections, both the input and output
resistances are 50 . Thus, when driven from a 50 source and
terminated in a 50 load, the gain is reduced by 12 dB, so the
gain range becomes –12 dB to +28 dB for the AD600 and −22 dB
to +18 dB for the AD602. The peak input capability remains
unaffected (1 V rms at the IC pins, or 2 V rms from an
unloaded 50 source). The loading on each output, with a
50 load, is effectively 200 because the load current is
shared between the two channels, so the overall amplifier still
meets its specified maximum output and distortion levels for a
200 load. This amplifier can deliver a maximum sine wave
power of 10 dBm to the load.
GAIN-CONTRO L
VOLTAGE
V
G
–+
C1LO
1
A1HI
2
+
A1LO
3
GAT1
IN
GAT2
A2LO
A2HI
C2LO
4
5
6
7
8
–
–
+
AD600 OR
AD602
A1
REF
A2
Figure 35. An Ultralow Noise VCA Using the AD600 or AD602
C1HI
16
A1CM
15
A1OP
14
VPOS
13
VNEG
12
A2OP
11
A2CM
10
C2HI
9
+5V
–5V
100Ω
100Ω
V
OUT
50Ω
LOW NOISE, 6 dB PREAMPLIFIER
In some ultrasound applications, a high input impedance
preamplifier is needed to avoid the signal attenuation that
results from loading the transducer by the 100 input resistance
of the X-AMP. High gain cannot be tolerated because the
peak transducer signal is typically ±0.5 V, whereas the peak
input capability of the AD600 or AD602 is only slightly more
than ±1 V. A gain of 2 is a suitable choice. It can be shown that,
if the preamplifier’s overall referred-to-input (RTI) noise is the
same as that due to the X-AMP alone (1.4 nV/√Hz), the input
noise of nX2 preamplifier must be √(3/4) times as large, that is,
1.2 nV/√Hz.
+5
R1
49.9Ω
R2
174Ω
1µF
R4
42.2Ω
V
IN
R5
42.2Ω
1µF
R7
174Ω
R8
49.9Ω
Figure 36. A Low Noise Preamplifier for the AD600/AD602
An inexpensive circuit using complementary transistor types
chosen for their low r
determined by the ratio of the net collector load resistance to
the net emitter resistance. It is an open-loop amplifier. The gain
is ×2 (6 dB) only into a 100 load, assumed to be provided by
the input resistance of the X-AMP; R2 and R7 are in shunt with
this load, and their value is important in defining the gain. For
small-signal inputs, both transistors contribute an equal trans-
00538-033
conductance that is rendered less sensitive to signal level by the
emitter resistors, R4 and R5. They also play a dominant role in
setting the gain.
1µF
Q1
MRF904
R3
562Ω
–5V
INPUT
GROUND
+5V
R6
562Ω
Q2
MM4049
1µF
–5V
is shown in Figure 36. The gain is
bb
0.1µF
0.1µF
OUTPUT
GROUND
100Ω
R
OF X-AMP
IN
00538-034
Rev. F | Page 16 of 32
Page 17

AD600/AD602
V
This is a Class AB amplifier. As VIN increases in a positive
direction, Q1 conducts more heavily and its r
becomes lower
e
while Q2 increases. Conversely, increasingly negative values of
V
result in the re of Q2 decreasing, while the re of Q1 increases.
IN
The design is chosen such that the net emitter resistance is
essentially independent of the instantaneous value of V
,
IN
resulting in moderately low distortion. Low values of resistance
and moderately high bias currents are important in achieving
the low noise, wide bandwidth, and low distortion of this
preamplifier. Heavy decoupling prevents noise on the power
supply lines from being conveyed to the input of the X-AMP.
Table 4. Measured Preamplifier Performance
Measurement Value Unit
Gain (f = 30 MHz) 6 dB
Bandwidth (−3 dB) 250 MHz
Input Signal for 1 dB Compression 1 V p-p
Distortion
VIN = 200 mV p-p HD2 0.27 %
HD3 0.14 %
VIN = 500 mV p-p HD2 0.44 %
HD3 0.58 %
System Input Noise 1.03 nV/√Hz
Spectral Density (NSD)
(Preamp Plus X-AMP)
Input Resistance 1.4 kΩ
Input Capacitance 15 pF
Input Bias Current ±150 µA
Power Supply Voltage ±5 V
Quiescent Current 15 mA
+5
R3
46.4kΩ
R4
3.74kΩ
C1HI
16
A1CM
15
A1OP
14
VPOS
13
VNEG
12
A2OP
11
A2CM
10
C2HI
9
C4
0.1µF
+5V DEC
–5V DEC
100Ω
RF
INPUT
C1LO
A1HI
A1LO
GAT1
GAT2
A2LO
A2HI
C2LO
1
2
+
–
–
+
A1
REF
A2
AD600
3
4
5
6
7
8
Figure 37. This Accurate HF AGC Amplifier Uses Three Active Components
R1
100pF
LOW NOISE AGC AMPLIFIER WITH 80 dB GAIN RANGE
Figure 37 provides an example of the ease with which the
AD600 can be connected as an AGC amplifier. A1 and A2 are
cascaded, with 6 dB of attenuation introduced by the 100
Resistor R1, while a time constant of 5 ns is formed by C1 and
the 50 of net resistance at the input of A2. This has the dual
effect of lowering the overall gain range from 0 dB to +80 dB to
−6 dB to +74 dB and introducing a single-pole, low-pass filter
with a −3 dB frequency of about 32 MHz. This ensures stability
at the maximum gain for a slight reduction in the overall
bandwidth. The C4 capacitor blocks the small dc offset voltage
at the output of A1 (which may otherwise saturate A2 at its
maximum gain) and introduces a high-pass corner at about
8 kHz, useful in eliminating low frequency noise and spurious
signals that can be present at the input.
+5V
VG´
C1
1µF
C3
15pF
AD590
C2
806Ω
1%
300µA
(AT 300K)
RF
OUTPUT
+5V DEC
–5V DEC
DECOUPLING NET W O RK
Q1
2N3904
+
R2
V
PTAT
–
+5V
FB
FB
–5V
POWER SUPPLY
0.1µF
0.1µF
00538-035
Rev. F | Page 17 of 32
Page 18

AD600/AD602
A simple half-wave detector is used based on Q1 and R2. The
average current into Capacitor C2 is the difference between the
current provided by the AD590 (300 µA at 300 K, 27°C) and the
collector current of Q1. In turn, the control voltage, V
time integral of this error current. When V
(thus the gain) is
G
stable, the rectified current in Q1 must, on average, balance
exactly the current in the AD590. If the output of A2 is too small
to do this, V
ramps up, causing the gain to increase until Q1
G
conducts sufficiently. The operation of this control system follows.
First, consider the particular case where R2 is zero and the
output voltage, V
, is a square wave at, for example, 100 kHz,
OUT
well above the corner frequency of the control loop. During the
time V
is negative, Q1 conducts. When V
OUT
OUT
cut off. Because the average collector current is forced to be
300 A and the square wave has a 50% duty-cycle, the current
when conducting must be 600 A. With R2 omitted, the peak
value of V
about 700 mV) or 2 V
would be just the VBE of Q1 at 600 A (typically
OUT
p-p. This voltage, thus the amplitude at
BE
which the output stabilizes, has a strong negative temperature
coefficient (TC), typically –1.7 mV/°C. While this may not be
troublesome in some applications, the correct value of R2
renders the output stable with temperature.
To understand this, first note that the current in the AD590 is
closely proportional to absolute temperature (PTAT). In fact,
this IC is intended for use as a thermometer. For the moment,
assume that the signal is a square wave. When Q1 is conducting,
V
is the sum of VBE and a voltage that is PTAT and that can
OUT
be chosen to have an equal but opposite TC of the base-toemitter voltage. This is actually nothing more than the band gap
voltage reference principle thinly disguised. When R2 is chosen
so that the sum of the voltage across it and the V
to the band gap voltage of about 1.2 V, V
is stable over a wide
OUT
range of temperatures, provided that Q1 and the AD590 share the
same thermal environment.
Because the average emitter current is 600 A during each halfcycle of the square wave, a resistor of 833 would add a PTAT
voltage of 500 mV at 300 K, increasing by 1.66 mV/°C. In
practice, the optimum value of R2 depends on the transistor
used and, to a lesser extent, on the waveform for which the
temperature stability is to be optimized; for the devices shown
and sine wave signals, the recommended value is 806 . This
resistor also serves to lower the peak current in Q1, and the
200 Hz LP filter it forms with C2 helps to minimize distortion
due to ripple in V
. Note that the output amplitude under sine
G
wave conditions is higher than for a square wave because the
average value of the current for an ideal rectifier would be
0.637 times as large, causing the output amplitude to be 1.88 V
(= 1.2/0.637), or 1.33 V rms. In practice, the somewhat nonideal
rectifier results in the sine wave output being regulated to about
1.275 V rms.
, is the
G
is positive, it is
of Q1 is close
BE
An offset of 375 mV is applied to the inverting gain-control
inputs C1LO and C2LO. Therefore, the nominal –625 mV to
+625 mV range for V
is translated upward (at VG´) to –0.25 V
G
for minimum gain to +1 V for maximum gain. This prevents
Q1 from going into heavy saturation at low gains and leaves
sufficient headroom of 4 V for the AD590 to operate correctly
at high gains when using a 5 V supply.
In fact, the 6 dB interstage attenuator means that the overall
gain of this AGC system actually runs from –6 dB to +74 dB.
Thus, an input of 2 V rms would be required to produce a
1 V rms output at the minimum gain, which exceeds the 1 V rms
maximum input specification of the AD600. The available gain
range is therefore 0 dB to 74 dB (or X1 to X5000). Because the
gain scaling is 15.625 mV/dB (because of the cascaded stages),
the minimum value of V
´ is actually increased by 6 × +15.625 mV,
G
or about 94 mV, to −156 mV, so the risk of saturation in Q1 is
reduced.
The emitter circuit of Q1 is somewhat inductive (due to its
finite f
and base resistance). Consequently, the effective value of
t
R2 increases with frequency. This results in an increase in the
stabilized output amplitude at high frequencies, but for the
addition of C3, determined experimentally to be 15 pF for the
2N3904 for maximum response flatness. Alternatively, a faster
transistor can be used here to reduce HF peaking. Figure 38
shows the ac response at the stabilized output level of about
1.3 rms. Figure 39 demonstrates the output stabilization for the
sine wave inputs of 1 mV rms to 1 V rms at frequencies of 100 kHz,
1 MHz, and 10 MHz.
3dB
AGC OUTPUT CHANGE (dB)
0.1
Figure 38. AC Response at the Stabilized Output Level of 1.3 V rms
1
FREQUENCY (MHz)
10
100
00538-036
Rev. F | Page 18 of 32
Page 19

AD600/AD602
A
V
These problems can be eliminated using an AD636 as the
detector element in an AGC loop, in which the difference
between the rms output of the amplifier and a fixed dc reference
+0.2
0
–0.2
TIVE OUTPUT (dB)
–0.4
REL
0.001 0.01 0.1 1
Figure 39. Output Stabilization vs. rms Input for
Sine Wave Inputs at 100 kHz, 1 MHz, and 10 MHz
INPUT AMPLITUDE (V rms)
100kHz
1MHz
10MHz
00538-037
While the band gap principle used here sets the output
amplitude to 1.2 V (for the square wave case), the stabilization
point can be set to any higher amplitude, up to the maximum
output of ±(V
− 2) V that the AD600 can support. It is only
S
necessary to split R2 into two components of appropriate ratio
whose parallel sum remains close to the zero-TC value of
806 Ω. Figure 40 shows this and how the output can be raised
without altering the temperature stability.
5
R2A
300µA
(AT 300K)
Q1
2N3904
R2B
+
R2 = R2A || R2B ≈ 806Ω
V
PTAT
–
RF
OUTPUT
00538-038
AD590
TO AD600 PIN 16
TO AD600 PIN 11
Figure 40. Modification in Detector to Raise Output to 2 V rms
1µF
15pF
C2
C3
WIDE RANGE, RMS-LINEAR dB MEASUREMENT SYSTEM (2 MHz AGC AMPLIFIER WITH RMS DETECTOR)
Monolithic rms-dc converters provide an inexpensive means to
measure the rms value of a signal of arbitrary waveform; they
can also provide a low accuracy logarithmic (decibel-scaled)
output. However, they have certain shortcomings. The first of
these is their restricted dynamic range, typically only 50 dB.
More troublesome is that the bandwidth is roughly proportional
to the signal level; for example, when the AD600/AD602 are
used in conjunction with the AD636, as shown in Figure 41, the
AD636 provides a 3 dB bandwidth of 900 kHz for an input of
100 mV rms but has a bandwidth of only 100 kHz for a 10 mV rms
input. Its logarithmic output is unbuffered, uncalibrated, and
not stable over temperature. Considerable support circuitry,
including at least two adjustments and a special high TC
resistor, is required to provide a useful output.
Rev. F | Page 19 of 32
are nulled in a loop integrator. The dynamic range and the
accuracy with which the signal can be determined are now
entirely dependent on the amplifier used in the AGC system.
Because the input to the rms-dc converter is forced to a
constant amplitude, close to its maximum input capability, the
bandwidth is no longer signal dependent. If the amplifier has an
exactly exponential (linear-dB) gain-control law, its control
voltage, V
, is forced by the AGC loop to have the general form
G
V
()
rmsIN
VV 10log=
SCALEOUT
(4)
V
REF
Figure 41 shows a practical wide dynamic range rms-responding
measurement system using the AD600. Note that the signal
output of this system is available at A2OP, and the circuit can be
used as a wideband AGC amplifier with an rms-responding
detector. This circuit can handle inputs from 100 μV to 1 V rms
with a constant measurement bandwidth of 20 Hz to 2 MHz,
limited primarily by the AD636 rms converter. Its logarithmic
output is a loadable voltage accurately calibrated to 100 mV/dB
or 2 V per decade, which simplifies the interpretation of the
reading when using a DVM and is arranged to be −4 V for
an input of 100 μV rms, 0 V for 10 mV, and +4 V for a 1 V rms
input. In terms of Equation 4, V
is 10 mV and V
REF
SCALE
is 2 V.
Note that the peak log output of ±4 V requires the use of ±6 V
supplies for the dual op amp U3 (AD712), although lower
supplies suffice for the AD600 and AD636. If only ±5 V supplies
are available, it is necessary to either use a reduced value for
V
(say 1 V, in which case the peak output would be only
SCALE
±2 V) or restrict the dynamic range of the signal to about 60 dB.
As in the previous case, the two amplifiers of the AD600 are
used in cascade. However, the 6 dB attenuator and low-pass
filter found in Figure 21 are replaced by a unity gain buffer
amplifier, U3A, whose 4 MHz bandwidth eliminates the risk of
instability at the highest gains. The buffer also allows the use of
a high impedance coupling network (C1/R3) that introduces a
high-pass corner at about 12 Hz. An input attenuator of 10 dB
(0.316×) is now provided by R1 + R2 operating in parallel with
the input resistance of 100 Ω of the AD600. The adjustment
provides exact calibration of the logarithmic intercept, V
REF
, in
critical applications, but R1 and R2 can be replaced by a fixed
resistor of 215 Ω if very close calibration is not needed because
the input resistance of the AD600 (and all other key parameters
of it and the AD636) is already laser trimmed for accurate
operation. This attenuator allows inputs as large as ±4 V to be
accepted, that is, signals with an rms value of 1 V combined
with a crest factor of up to 4.
Page 20

AD600/AD602
V
C1
0.1µF
CAL
INPUT
1V rms
MAX
(SINEWAVE)
0dB
R1
115Ω
R2 200Ω
133kΩ
U3A
1/2
AD712
V
G
15.625mV/dB
C1LO
1
A1HI
2
+
A1LO
3
GAT1
4
R3
GAT2
A2LO
A2HI
C2LO
R4
3.01kΩ
5
6
7
8
–
–
+
R5
16.2kΩ
U1
AD600
A1
REF
A2
C1HI
16
A1CM
15
A1OP
14
VPOS
13
VNEG
12
A2OP
11
A2CM
10
C2HI
9
Figure 41. The Output of This Three-IC Circuit Is Proportional to the Decibel Value of the rms Input
The output of A2 is ac-coupled via another 12 Hz high-pass
filter formed by C2 and the 6.7 k input resistance of the
AD636. The averaging time constant for the rms-dc converter
is determined by C4. The unbuffered output of the AD636 (at
Pin 8) is compared with a fixed voltage of 316 mV set by the
positive supply voltage of 6 V and the R6 and R7 resistors. V
REF
is proportional to this voltage, and systems requiring greater
calibration accuracy should replace the supply-dependent
reference with a more stable source.
Any difference in these voltages is integrated by the U3B
op amp, with a time constant of 3 ms formed by the parallel
sum of R6/R7 and C3. If the output of the AD600 is too high,
V rms is greater than the setpoint of 316 mV, causing the output
of U3B—that is, V
noninverting). A fraction of V
—to ramp up (note that the integrator is
OUT
is connected to the inverting
OUT
gain-control inputs of the AD600, causing the gain to be
reduced, as required, until V rms is exactly equal to 316 mV, at
which time the ac voltage at the output of A2 is forced to be
exactly 316 mV rms. This fraction is set by R4 and R5 such that
a 15.625 mV change in the control voltages of A1 and A2—
which would change the gain of the cascaded amplifiers by
1 dB—requires a change of 100 mV at V
. Note here that,
OUT
because A2 is forced to operate at an output level well below its
capacity, waveforms of high crest factor can be tolerated
throughout the amplifier.
rms
+6V
DEC
–6V
DEC
C2
2µF
–6V
DEC
AF/RF
OUTPUT
C4
4.7µF
1
V
2
NC
3
–V
4
C
dB
5
BUF OUT
6
BUF IN
7
NC = NO CONNECT
IN
AD636
S
AV
+V
U2
NC
NC
NC
COM
I
OUT
+6V DEC
14
S
13
12
11
10
9
R
L
8
1/2
AD712
R7
56.2kΩ
R6
3.16kΩ
+316.2mV
U3B
C3
1µF
+100mV/dB
0V = 0dB (AT 10mV rms)
+6V
FB
+6V
DEC
–6V
DEC
FB
–6V
POWER SUPPLY
DECOUPLING
NETWORK
V
OUT
0.1µF
0.1µF
00538-039
To check the operation, assume that an input of 10 mV rms is
applied to the input, which results in a voltage of 3.16 mV rms
at the input to A1, due to the 10 dB loss in the attenuator. If the
system operates as claimed, V
(and, hence, VG) should be 0.
OUT
This being the case, the gain of both A1 and A2 is 20 dB, and
the output of the AD600 is therefore 100 times (40 dB) greater
than its input, which evaluates to 316 mV rms, the input
required at the AD636 to balance the loop. Finally, note that,
unlike most AGC circuits that need strong temperature
compensation for the internal kT/q scaling, these voltages, and
thus the output of this measurement system, are temperature
stable, arising directly from the fundamental and exact
exponential attenuation of the ladder networks in the AD600.
Typical results are presented for a sine wave input at 100 kHz.
Figure 42 shows that the output is held close to the setpoint of
316 mV rms over an input range in excess of 80 dB.
450
425
400
375
350
325
(mV)
300
OUT
V
275
250
225
200
175
150
10µ 100µ 101100m10m1m
INPUT SIGNAL (V rms)
Figure 42. RMS Output of A2 Held Close to the Setpoint 316 mV
for an Input Range of over 80 dB
00538-040
Rev. F | Page 20 of 32
Page 21

AD600/AD602
R
A
This system can, of course, be used as an AGC amplifier in
which the rms value of the input is leveled. Figure 43 shows the
decibel output voltage. More revealing is Figure 44, which
shows that the deviation from the ideal output predicted by
Equation 1 over the input range 80 V to 500 mV rms is within
±0.5 dB, and within ±1 dB for the 80 dB range from 80 V to
800 mV. By suitable choice of the input attenuator, R1 + R2, this
can be centered to cover any range from a low of 25 mV to
250 mV to a high of 1 mV to 10 V, with appropriate correction
to the value of V
. Note that V
REF
is not affected by the
SCALE
changes in the range. The gain ripple of ±0.2 dB seen in this
curve is the result of the finite interpolation error of the
X-AMP. Note that it occurs with a periodicity of 12 dB, twice
the separation between the tap points (because of the two
cascaded stages).
5
4
3
2
1
(V)
0
OUT
V
–1
–2
–3
–4
–5
10µ 100µ 101100m10m1m
INPUT SIGNAL (V rms)
Figure 43. The Decibel Output of the Circuit in Figure 41 Is Linear over an
80 dB Range
2.5
2.0
1.5
1.0
0.5
OR (dB)
0
–0.5
OUTPUT ER
–1.0
–1.5
–2.0
–2.5
10µ 100µ 101100m10m1m
INPUT SIGNAL (V rms)
Figure 44. Data from Figure 42 Presented as the Deviation
from the Ideal Output Given in Equation 4
00538-041
00538-042
This ripple can be canceled whenever the X-AMP stages are
cascaded by introducing a 3 dB offset between the two pairs of
control voltages. A simple means to achieve this is shown in
Figure 45: the voltages at C1HI and C2HI are split by ±46.875 mV,
or ±1.5 dB. Alternatively, either one of these pins can be offset
by 3 dB and a 1.5 dB gain adjustment made at the input
attenuator (R1 + R2).
C1HI
U1
AD600
NC = NO CONNECT
16
15
14
13
12
11
10
–6V
DEC
9
A1CM
A1OP
VPOS
VNEG
A2OP
A2CM
C2HI
10kΩ
+6V DEC
–6V DEC
–46.875mV
78.7Ω 78.7Ω
–6V DEC
C2
2µF
+46.875mV
+6V
DEC
10kΩ
3dB OFF SET
MODIFICATION
NC
NC
V
1
2
NC
3
–V
4
C
5
dB
6
BUF OUT
7
BUF IN
IN
S
U2
AV
D636
Figure 45. Reducing the Gain Error Ripple
The error curve shown in Figure 46 demonstrates that, over the
central portion of the range, the output voltage can be maintained
close to the ideal value. The penalty for this modification is
higher errors at the extremities of the range. The next two
applications show how three amplifier sections can be cascaded
to extend the nominal conversion range to 120 dB, with the
inclusion of simple LP filters of the type shown in Figure 37.
Very low errors can then be maintained over a 100 dB range.
2.5
2.0
1.5
1.0
0.5
0
–0.5
OUTPUT ERROR (dB)
–1.0
–1.5
–2.0
–2.5
10µ 100µ 101100m10m1m
INPUT SIGNAL (V rms)
00538-044
Figure 46. Using a 3 dB Offset Network Reduces Ripple
100 dB TO 120 dB RMS RESPONDING CONSTANT BANDWIDTH AGC SYSTEMS WITH HIGH ACCURACY DECIBEL OUTPUTS
The next two applications double as both AGC amplifiers and
measurement systems. In both, precise gain offsets are used to
achieve either a high gain linearity of ±0.1 dB over the full
100 dB range or the optimal SNR at any gain.
00538-043
Rev. F | Page 21
of 32
Page 22

AD600/AD602
INPUT
1V rms
MAX
(SINEWAVE)
R13
3.01kΩ
C1LO
A1HI
A1LO
GAT1
GAT2
A2LO
A2HI
C2LO
1
2
+
3
–
4
5
–
6
7
+
8
U1 AD600
+5V
FB
+5V
DEC
–5V
DEC
FB
–5V
POWER SUPPLY
DECOUPLING
NETWORK
Q1
2N3906
11.3kΩ
A1
A2
0.1µF
0.1µF
R14
301kΩ
R12
REF
16
15
14
13
12
11
10
9
+5V DEC
C1HI
A1CM
A1OP
VPOS
VNEG
A2OP
A2CM
C2HI
R15
19.6kΩ
R16
6.65kΩ
+5V
DEC
–5V
DEC
R6
10kΩ
C1
0.1µF
R1
133kΩ
C2
0.1µF
R4
133kΩ
–2dB
–62.5mV
R7
127Ω
Figure 47. RMS Responding AGC Circuit with 100 dB Dynamic Range
100 dB RMS/AGC SYSTEM WITH MINIMAL GAIN ERROR (PARALLEL GAIN WITH OFFSET)
Figure 47 shows an rms-responding AGC circuit that can be
used equally well as an accurate measurement system. It accepts
inputs of 10 V to 1 V rms (−100 dBV to 0 dBV) with generous
overrange. Figure 48 shows the logarithmic output, V
is accurately scaled 1 V per decade, that is, 50 mV/dB, with an
intercept (V
= 0) at 3.16 mV rms (−50 dBV). Gain offsets of
LOG
±2 dB were introduced between the amplifiers, provided by the
±62.5 mV introduced by R6 to R9. These offsets cancel a small
gain ripple that arises in the X-AMP from its finite interpolation
error, which has a period of 18 dB in the individual VCA
sections. The gain ripple of all three amplifier sections without
this offset (in which case, the gain errors simply add) is shown
in Figure 49; it is still a remarkably low ±0.25 dB over the
108 dB range from 6 V to 1.5 V rms. However, with the gain
offsets connected, the gain linearity remains under ±0.1 dB over
the specified 100 dB range (see Figure 50).
LOG
, which
U3A
1/4
AD713
R5
1.58kΩ
C3
220pF
0dB
R8
127ΩR910kΩ
R2
487Ω
U3B
+2dB
+62.5mV
–5V
DEC
Figure 48. V
R3
200Ω
1/4
AD713
+5V–5V
C5
22µF
1
V
IN
U4
AD636
2
NC
–V
3
S
C
4
AV
5
dB
6
BUF OUT
7
BUF IN
5
4
3
2
1
0
–1
–2
LOGARITHMIC OUTPUT (V)
–3
–4
–5
1µ 10µ 101100m10m1m100µ
Plotted vs. VIN for Figure 47’s Circuit Showing 120 dB AGC Range
LOG
C1LO
A1HI
A1LO
GAT1
GAT2
A2LO
A2HI
C2LO
+V
COM
I
1
2
+
3
–
4
5
–
6
7
+
8
U2 AD600
14
S
NC
13
NC
12
NC
11
10
R
9
L
8
OUT
+316.2mV
INPUT SIGNAL (V rms)
A1
REF
A2
R11
46.4kΩ
R10
3.16kΩ
U3C
NC = NO CONNECT
16
15
14
13
12
11
10
9
+5V DEC
C6
4.7µF
AD713
C1HI
A1CM
A1OP
VPOS
VNEG
A2OP
A2CM
C2HI
1/4
C4
2µF
+5V
DEC
–5V
DEC
V
OUT
V
LOG
00538-045
00538-046
Rev. F | Page 22 of 32
Page 23

AD600/AD602
R
R
2.0
1.5
1.0
0.5
0.1
OR (dB)
0
–0.1
–0.5
GAIN ER
–1.0
–1.5
–2.0
1µ 10µ 101100m10m1m100µ
Figure 49. Gain Error for Figure 41 Without the 2 dB Offset Modification
2.0
1.5
1.0
0.5
0.1
OR (dB)
0
–0.1
–0.5
GAIN ER
–1.0
–1.5
–2.0
1µ 10µ 101100m10m1m100µ
Figure 50. Adding the 2 dB Offsets Improves the Linearization
INPUT SIGNAL (V rms)
INPUT SIGNAL (V rms)
00538-047
00538-048
The maximum gain of this circuit is 120 dB. If no filtering were
used, the noise spectral density of the AD600 (1.4 nV/√Hz)
would amount to an input noise of 8.28 μV rms in the full
bandwidth (35 MHz). At a gain of one million, the output noise
would dominate. Consequently, some reduction of bandwidth is
mandatory and, in the circuit of Figure 47, it is due mostly to a
single-pole, low-pass filter R5/C3 that provides a −3 dB
frequency of 458 kHz, which reduces the worst-case output
noise (at V
) to about 100 mV rms at a gain of 100 dB. Of
AGC
course, the bandwidth (and therefore the output noise) could be
further reduced, for example, in audio applications, merely by
increasing C3. The value chosen for this application is optimal
in minimizing the error in the V
output for small input signals.
LOG
The AD600 is dc-coupled, but even miniscule offset voltages at
the input would overload the output at high gains; thus, highpass filtering is also needed. To provide operation at low
frequencies, two simple 0s at about 12 Hz are provided by
R1/C1 and R4/C2; the U3A and U3B (AD713) op amp sections
are used to provide impedance buffering because the input
resistance of the AD600 is only 100 Ω. A further 0 at 12 Hz is
provided by C4 and the 6.7 kΩ input resistance of the AD636
rms converter.
The rms value of V
is generated at Pin 8 of the AD636; the
LOG
averaging time for this process is determined by C5, and the
value shown results in less than 1% rms error at 20 Hz. The
slowly varying V rms is compared with a fixed reference of
316 mV, derived from the positive supply by R10/R11. Any
difference between these two voltages is integrated in C6, in
conjunction with the U3C op amp, the output of which is V
LOG
A fraction of this voltage, determined by R12 and R13, is
returned to the gain control inputs of all AD600 sections.
An increase in V
lowers the gain because this voltage is
LOG
connected to the inverting polarity control inputs.
In this case, the gains of all three VCA sections are varied
simultaneously, so the scaling is not 32 dB/V but 96 dB/V or
10.42 mV/dB. The fraction of V
required to set its scaling to
LOG
50 mV/dB is therefore 10.42/50 or 0.208. The resulting fullscale range of V
is nominally ±2.5 V. This scaling allows the
LOG
circuit to operate from ±5 V supplies.
Optionally, the scaling can be altered to 100 mV/dB, which
would be more easily interpreted when V
is displayed on a
LOG
DVM by increasing R12 to 25.5 kΩ. The full-scale output of
±5 V then requires the use of supply voltages of at least ±7.5 V.
A simple attenuator of 16.6 ± 1.25 dB is formed by R2/R3
and the 100 Ω input resistance of the AD600. This allows the
reference level of the decibel output to be precisely set to 0 for
an input of 3.16 mV rms and thus center the 100 dB range
between 10 μV and 1 V. In many applications, R2/R3 can be
replaced by a fixed resistor of 590 Ω. For example, in AGC
applications, neither the slope nor the intercept of the
logarithmic output is important.
A few additional components (R14 to R16 and Q1) improve the
accuracy of V
at the top end of the signal range (that is, for
LOG
small gains). The gain starts rolling off when the input to the
first amplifier, U1A, reaches 0 dB. To compensate for this nonlinearity, Q1 turns on at V
~ 1.5 V and increases the feedback
LOG
to the control inputs of the AD600s, thereby needing a smaller
voltage at V
to maintain the input to the AD636 to the
LOG
setpoint of 316 mV rms.
120 dB RMS/AGC SYSTEM WITH OPTIMAL SNR (SEQUENTIAL GAIN)
In the last case, all gains are adjusted simultaneously, resulting
in an output SNR that is always less than optimal. The use of
sequential gain control results in a major improvement in SNR,
with only a slight penalty in the accuracy of V
penalty in the stabilization accuracy of V
increase the gain of the earlier stages first (as the signal level
decreases) and maintain the highest SNR throughout the
amplifier chain. This can be easily achieved with the AD600
because its gain is accurate even when the control input is
overdriven. That is, each gain control window of 1.25 V is
used fully before moving to the next amplifier to the right.
and no
LOG
. The idea is to
AGC
.
Rev. F | Page 23 of 32
Page 24

AD600/AD602
Figure 51 shows the circuit for the sequential control scheme.
R6 to R9 with R16 provide offsets of 42.14 dB between the
individual amplifiers to ensure smooth transitions between the
gain of each successive X-AMP, with the sequence of gain
increase being U1A, then U1B, and then U2A. The adjustable
attenuator provided by R3 + R17 and the 100 input resistance
of U1A, as well as the fixed 6 dB attenuation provided by R2
and the input resistance of U1B, are included both to set V
0dB
ADJUST
INPUT
R17
115Ω
R3
200Ω
C1LO
A1HI
A1LO
GAT1
GAT2
A2LO
A2HI
C2LO
1
2
+
3
–
4
5
–
6
7
+
8
U1 AD600
A1
REF
A2
C1HI
16
A1CM
15
A1OP
14
VPOS
13
VNEG
12
A2OP
11
A2CM
10
C2HI
9
+6V
DEC
–6V
DEC
LOG
to
0.1µF
133kΩ
C2
0.1µF
133kΩ
read 0 dB when V
is 3.16 mV rms and to center the 100 dB
IN
range between 10 µV rms and 1 V rms input. R5 and C3
provide a 3 dB noise bandwidth of 30 kHz. R12 to R15 change
the scaling from 625 mV/decade at the control inputs to
1 V/decade at the output. At the same time, R12 to R15 center
the dynamic range at 60 dB, which occurs if the V
equal to 0. These arrangements ensure that the V
of U1B is
G
still fits
LOG
within the ±6 V supplies.
C1LO
A1HI
A1LO
GAT1
GAT2
A2LO
A2HI
C2LO
1
2
+
3
–
4
5
–
6
7
+
8
A1
REF
A2
U2 AD600
1/4
AD713
C3
R2
100Ω
U3B
1/4
AD713
C1
R1
R4
R5
5.36kΩ
0.001µF
U3A
C1HI
16
A1CM
A1OP
VPOS
VNEG
A2OP
A2CM
C2HI
C4
2µF
+5V
DEC
–5V
DEC
V
OUT
15
14
13
12
11
10
9
+6V
FB
+6V
DEC
–6V
DEC
0.1µF
0.1µF
FB
–6V
POWER SUPPLY
DECOUPLING
NETWORK
+6V DEC
R15
5.11kΩ
R14
7.32kΩ
+6V
R13
866Ω
R6
3.4kΩ
R12
1kΩ
R7
1kΩ
R8
294Ω
R9
1kΩ
–6V
DEC
R16
287Ω
NC
NC
V
1
2
NC
–V
3
4
C
5
dB
6
BUF OUT
BUF IN
7
IN
AD636
S
AV
C5
22µF
U4
+V
NC
NC
NC
COM
I
OUT
+6V DEC
14
S
13
12
11
10
9
R
L
8
+316.2mV
R11
56.2kΩ
R10
3.16kΩ
NC = NO CONNECT
4.7µF
U3C
AD713
C6
V
1/4
LOG
00538-049
Figure 51. 120 dB Dynamic Range RMS Responding Circuit Optimized for SNR
Rev. F | Page 24 of 32
Page 25

AD600/AD602
R
Figure 52 shows V
5
4
3
2
1
0
–1
–2
LOGARITHMIC OUTPUT (V)
–3
–4
–5
1µ 10µ 101100m10m1m100µ
Figure 52. V
INPUT SIGNAL (V rms)
Is Linear over the Full 120 dB Range
LOG
to be linear over a full 120 dB range.
LOG
00538-050
Figure 53 shows the error ripple due to the individual gain
functions bounded by ±0.2 dB (dotted lines) from 6 V to 2 V.
The small perturbations at about 200 V and 20 mV, caused by
the impracticality of matching the gain functions perfectly, are
the only sign that the gains are now sequential. Figure 54 is a
plot of V
that remains very close to its set value of 316 mV rms
AGC
over the full 120 dB range.
To compare the SNRs in the simultaneous and sequential
modes of operation more directly, all interstage attenuation was
eliminated (R2 and R3 in Figure 47 and R2 in Figure 51), the
input of U1A was shorted, R5 was selected to provide a 20 kHz
bandwidth (R5 = 7.87 k), and only the gain control was
varied, using an external source. The rms value of the noise was
then measured at V
and expressed as an SNR relative to
OUT
0 dBV, which is almost the maximum output capability of the
AD600. Results for the simultaneous mode can be seen in
Figure 55. The SNR degrades uniformly as the gain is increased.
Note that, because the inverting gain control was used, the gain
in this curve and in Figure 56 decreases for more positive values
of the gain-control voltage.
2.0
1.5
1.0
0.5
0.2
OR (dB)
0
–0.2
–0.5
GAIN ER
–1.0
–1.5
–2.0
1µ 10µ 101100m10m1m100µ
INPUT SIGNAL (V rms)
Figure 53. Error Ripple Caused by the Individual Gain Functions
1
00538-05
Rev. F | Page 25 of 3
400
350
300
GAIN ERROR (mV)
250
200
1µ 10µ 101100m10m1m100µ
Figure 54. V
INPUT SIGNAL (V rms)
Remains Close to Its Setpoint of
AGC
00538-052
316 mV rms over the Full 120 dB Range
90
VC SCALE = 10.417mV/dB
80
70
60
50
40
SNR (dB)
30
20
10
0
–625.0–833.2
(mV)
V
C
625.0416.6208.30–208.3–416.6
833.2
00538-053
Figure 55. SNR vs. Control Voltage for Parallel Gain Control (See Figure 47)
In contrast, the SNR for the sequential mode is shown in Figure 56.
U1A always acts as a fixed noise source; varying its gain has no
influence on the output noise. This is a feature of the X-AMP
technique. Therefore, for the first 40 dB of control range
(actually slightly more, as is explained later), when only this
VCA section has its gain varied, the SNR remains constant.
During this time, the gains of U1B and U2A are at their
minimum value of −1.07 dB.
90
VC SCALE = 31.2 5mV/dB
80
70
60
50
40
SNR (dB)
30
20
10
0
–0.558–1.183 3.1922.5671.9421.3170.6920.067
VC (V)
Figure 56. SNR vs. Control Voltage for Sequential Gain Control (See Figure 51)
2
3.817
00538-054
Page 26

AD600/AD602
For the next 40 dB of control range, the gain of U1A remains
fixed at its maximum value of 41.07 dB and only the gain of
U1B is varied, while that of U2A remains at its minimum value
of −1.07 dB. In this interval, the fixed output noise of U1A is
amplified by the increasing gain of U1B, and the SNR
progressively decreases.
Once U1B reaches its maximum gain of 41.07 dB, its output
also becomes a gain-independent noise source; this noise is
presented to U2A. As the control voltage is further increased,
the gains of both U1A and U1B remain fixed at their maximum
value of 41.07 dB, and the SNR continues to decrease. Figure 56
clearly shows this because the maximum SNR of 90 dB is
extended for the first 40 dB of input signal before it starts to roll off.
This arrangement of staggered gains can be easily implemented
because, when the control inputs of the AD600 are overdriven,
the gain limits to its maximum or minimum values without side
effects. This eliminates the need for awkward nonlinear shaping
circuits that have previously been used to break up the gain
range of multistage AGC amplifiers. The precise values of the
AD600’s maximum and minimum gain (not 0 dB and +40 dB
but −1.07 dB and +41.07 dB) explain the rather odd values of
the offset values that are used.
The optimization of the output SNR is of obvious value in AGC
systems. However, in applications where these circuits are
considered for their wide range logarithmic measurement
capabilities, the inevitable degradation of the SNR at high gains
need not seriously impair their utility. In fact, the bandwidth of
the circuit shown in Figure 47 was specifically chosen to improve
measurement accuracy by altering the shape of the log error
curve at low signal levels (see Figure 53).
Rev. F | Page 26 of 32
Page 27

AD600/AD602
0
OUTLINE DIMENSIONS
0.800 (20.32)
0.790 (20.07)
0.780 (19.81)
16
1
0.100 (2.54)
BSC
0.210 (5.33)
MAX
0.150 (3.81)
0.130 (3.30)
0.115 (2.92)
0.022 (0.56)
0.018 (0.46)
0.014 (0.36)
0.070 (1.78)
0.060 (1.52)
0.045 (1.14)
CONTROLLING DIMENSIONSARE IN INCHES; MILLIMETER DIMENSIONS
(IN PARENTHESES) ARE ROUNDED-OFF INCH EQUIVALENTS FOR
REFERENCE ON LY AND ARE NOT APPROPRIATE FOR USE IN DES IGN.
CORNER LEADS MAY BE CONFIGURED AS WHOL E OR HALF L E ADS.
Figure 57. 16-Lead Plastic Dual In-Line Package [PDIP]
0.005 (0.13) MIN
PIN 1
.200 (5.08)
MAX
0.200 (5.08)
0.125 (3.18)
0.023 (0.58)
0.014 (0.36)
9
0.280 (7.11)
0.250 (6.35)
0.240 (6.10)
8
0.060 (1.52)
0.015
(0.38)
0.015 (0.38)
MIN
SEATING
PLANE
0.005 (0.13)
MIN
COMPLIANT TO JEDEC STANDARDS MS-001-AB
GAUGE
PLANE
MAX
0.325 (8.26)
0.310 (7.87)
0.300 (7.62)
0.430 (10.92)
MAX
Narrow Body (N-16)
Dimensions shown in inches and (millimeters)
0.098 (2.49) MAX
16
1
0.100 (2.54) BSC
0.840 (21.34) MAX
9
8
0.070 (1.78)
0.030 (0.76)
0.310 (7.87)
0.220 (5.59)
0.060 (1.52)
0.015 (0.38)
0.150
(3.81)
MIN
SEATING
PLANE
15°
0°
0.320 (8.13)
0.290 (7.37)
0.015 (0.38)
0.008 (0.20)
0.195 (4.95)
0.130 (3.30)
0.115 (2.92)
0.014 (0.36)
0.010 (0.25)
0.008 (0.20)
073106-B
CONTROLLING DIMENSIONS ARE IN INCHES; MILLIMETER DIMENSIONS
(IN PARENTHESES) ARE ROUNDED-OFF INCH EQUIVALENTS FOR
REFERENCE ONLY AND ARE NOT APPROPRIATE FOR USE IN DESIGN.
Figure 58. 16-Lead Ceramic Dual In-Line Package [CERDIP]
(Q-16)
Dimensions shown in inches and (millimeters)
Rev. F | Page 27 of 32
Page 28

AD600/AD602
C
0.30 (0.0118)
0.10 (0.0039)
OPLANARITY
0.10
10.50 (0.4134)
10.10 (0.3976)
BSC
9
7.60 (0.2992)
7.40 (0.2913)
8
10.65 (0.4193)
10.00 (0.3937)
2.65 (0.1043)
2.35 (0.0925)
SEATING
PLANE
8°
0°
0.33 (0.0130)
0.20 (0.0079)
5
0
.
7
5
0
.
2
16
1
1.27 (0.0500)
0.51 (0.0201)
0.31 (0.0122)
CONTROLLING DIMENSIONS ARE I N M I LLIMETE RS ; INCH DIMENSIONS
(IN PARENTHESES) ARE ROUNDED-OFF MILL IMETER EQUIVALENTS FOR
REFERENCE ONLY AND ARE NOT APPROPRIATE FOR USE IN DES I GN.
COMPLIANT T O JE DEC S TANDARDS MS-013-AA
(
0
.
0
2
(
0
.
0
0
9
5
)
45°
9
8
)
1.27 (0.0500)
0.40 (0.0157)
032707-B
Figure 59. 16-Lead Standard Small Outline Package [SOIC_W]
Wide Body (RW-16)
Dimensions shown in millimeters and (inches)
Rev. F | Page 28 of 32
Page 29

AD600/AD602
ORDERING GUIDE
Model Gain Range Temperature Range Package Description Package Option
AD600AQ 0 dB to 40 dB −40°C to +85°C 16-Lead CERDIP Q-16
AD600AR 0 dB to 40 dB −40°C to +85°C 16-Lead SOIC_W RW-16
AD600AR-REEL 0 dB to 40 dB −40°C to +85°C 16-Lead SOIC_W RW-16
AD600AR-REEL7 0 dB to 40 dB −40°C to +85°C 16-Lead SOIC_W RW-16
AD600ARZ1 0 dB to 40 dB −40°C to +85°C 16-Lead SOIC_W RW-16
AD600ARZ-R7
AD600ARZ-RL
AD600JN 0 dB to 40 dB 0°C to 70°C 16-Lead PDIP N-16
AD600JNZ
AD600JR 0 dB to 40 dB 0°C to 70°C 16-Lead SOIC_W RW-16
AD600JR-REEL 0 dB to 40 dB 0°C to 70°C 16-Lead SOIC_W RW-16
AD600JR-REEL7 0 dB to 40 dB 0°C to 70°C 16-Lead SOIC_W RW-16
AD600JRZ
AD600JRZ-R7
AD600JRZ-RL
AD600SQ/883B
AD602AQ −10 dB to +30 dB −40°C to +85°C 16-Lead CERDIP Q-16
AD602AR −10 dB to +30 dB −40°C to +85°C 16-Lead SOIC_W RW-16
AD602AR-REEL −10 dB to +30 dB −40°C to +85°C 16-Lead SOIC_W RW-16
AD602AR-REEL7 −10 dB to +30 dB −40°C to +85°C 16-Lead SOIC_W RW-16
AD602ARZ
AD602ARZ-R7
AD602ARZ-RL
AD602JCHIPS DIE
AD602JN −10 dB to +30 dB 0°C to 70°C 16-Lead PDIP N-16
AD602JNZ
AD602JR −10 dB to +30 dB 0°C to 70°C 16-Lead SOIC_W RW-16
AD602JR-REEL –10 dB to +30 dB 0°C to 70°C 16-Lead SOIC_W RW-16
AD602JR-REEL7 −10 dB to +30 dB 0°C to 70°C 16-Lead SOIC_W RW-16
AD602JRZ
AD602JRZ-R7
AD602JRZ-RL
AD602SQ/883B3 −10 dB to +30 dB −55°C to +125°C 16-Lead CERDIP Q-16
1
Z = RoHS Compliant Part.
2
Refers to AD600/AD602 military data sheet. Also available as 5962-9457201MEA.
3
Refers to AD600/AD602 military data sheet. Also available as 5962-9457202MEA.
1
0 dB to 40 dB −40°C to +85°C 16-Lead SOIC_W RW-16
1
0 dB to 40 dB −40°C to +85°C 16-Lead SOIC_W RW-16
1
0 dB to 40 dB 0°C to 70°C 16-Lead PDIP N-16
1
0 dB to 40 dB 0°C to 70°C 16-Lead SOIC_W RW-16
1
0 dB to 40 dB 0°C to 70°C 16-Lead SOIC_W RW-16
1
0 dB to 40 dB 0°C to 70°C 16-Lead SOIC_W RW-16
2
0 dB to 40 dB −55°C to +125°C 16-Lead CERDIP Q-16
1
−10 dB to +30 dB −40°C to +85°C 16-Lead SOIC_W RW-16
1
−10 dB to +30 dB −40°C to +85°C 16-Lead SOIC_W RW-16
1
−10 dB to +30 dB −40°C to +85°C 16-Lead SOIC_W RW-16
1
−10 dB to +30 dB 0°C to 70°C 16-Lead PDIP N-16
1
−10 dB to +30 dB 0°C to 70°C 16-Lead SOIC_W RW-16
1
–10 dB to +30 dB 0°C to 70°C 16-Lead SOIC_W RW-16
1
−10 dB to +30 dB 0°C to 70°C 16-Lead SOIC_W RW-16
Rev. F | Page 29 of 32
Page 30

AD600/AD602
NOTES
Rev. F | Page 30 of 32
Page 31

AD600/AD602
NOTES
Rev. F | Page 31 of 32
Page 32

AD600/AD602
NOTES
©2008 Analog Devices, Inc. All rights reserved. Trademarks and
registered trademarks are the property of their respective owners.
D00538-0-10/08(F)
Rev. F | Page 32 of 32
 Loading...