


Operations manual
00809-0800-3104, Rev AA
April 2022
Rosemount™ 3410 Series Gas Ultrasonic Flow
meters
Model 3418

Safety and approval information
This Rosemount product complies with all applicable European directives when properly installed in accordance with the
instructions in this manual. Refer to the EU declaration of conformity for directives that apply to this product. The EU declaration
of conformity, with all applicable European directives, and the complete ATEX Installation Drawings and Instructions are available
on the internet at www.emerson.com or through your local Emerson support center.
Information affixed to equipment that complies with the Pressure Equipment Directive, can be found on the internet at http://
www.emerson.com.
For hazardous installations in Europe, refer to standard EN 60079-14 if national standards do not apply.
Other information
Full product specifications can be found in the product data sheet. Troubleshooting information can be found in the user manual.
Product data sheets and manuals are available from the Emerson website at http://www.emerson.com.
Return policy
Follow Emerson procedures when returning equipment. These procedures ensure legal compliance with government
transportation agencies and help provide a safe working environment for Emerson employees. Emerson will not accept your
returned equipment if you fail to follow Emerson procedures. Return procedures and forms are available on our web support site
at Emerson.com, or by phoning the Emerson Customer Service department.
Emerson Flow customer service
Email:
• Worldwide: http://flow.support@emerson.com
• Asia-Pacific: http://APflow.support@emerson.com
Telephone:
North and South America
United States 800 522 6277 U.K. 0870 240 1978 Australia 800 158 727
Canada +1 303 527 5200 The Netherlands +31 (0) 704 136 666 New Zealand 099 128 804
Mexico +41 (0) 41 7686 111 France 0800 917 901 India 800 440 1468
Argentina +54 11 4837 7000 Germany 0800 182 5347 Pakistan 888 550 2682
Brazil +55 15 3413 8000 Italy 8008 77334 China +86 21 2892 9000
Europe and Middle East Asia Pacific
Central & Eastern +41 (0) 41 7686 111 Japan +81 3 5769 6803
Russia/CIS +7 495 981 9811 South Korea +82 2 3438 4600
Egypt 0800 000 0015 Singapore +65 6 777 8211
Oman 800 70101 Thailand 001 800 441 6426
Qatar 431 0044 Malaysia 800 814 008
Kuwait 663 299 01
South Africa 800 991 390
Saudi Arabia 800 844 9564
UAE 800 0444 0684
2

Operations manual Contents
00809-0800-3104 April 2022
Contents
Chapter 1 Startup...................................................................................................................... 5
1.1 Checklist......................................................................................................................................5
1.2 Cybersecurity and network communications............................................................................... 6
Chapter 2 Communications........................................................................................................7
2.1 Setup meter communications..................................................................................................... 7
Chapter 3 Optional feature keys...............................................................................................15
3.1 General overview of the Optional feature keys...........................................................................15
3.2 Configure optional keys............................................................................................................. 16
Chapter 4 Measurement.......................................................................................................... 17
4.1 Flow measurement....................................................................................................................17
4.2 Signal processing.......................................................................................................................19
4.3 Acquisition mode.......................................................................................................................21
4.4 Chord gas and sound velocity measurements............................................................................ 21
4.5 Volumetric flow rate values........................................................................................................26
4.6 Rosemount 3410 Series gas flow meter characterizations......................................................... 31
Chapter 5 Configurations......................................................................................................... 33
5.1 Calibrate and configure the meter............................................................................................. 33
5.2 Calibrate analog inputs and outputs.......................................................................................... 45
5.3 Calibrate meter factors.............................................................................................................. 49
5.4 Configure frequency outputs.....................................................................................................54
5.5 Configure digital input/outputs................................................................................................. 56
5.6 Outputs test mode.................................................................................................................... 57
5.7 Configure meter corrections......................................................................................................58
5.8 Configure temperature and pressure......................................................................................... 59
5.9 Configure Gas Chromatograph parameters............................................................................... 62
Chapter 6 Directory..................................................................................................................79
6.1 Archive logs............................................................................................................................... 79
6.2 Smart Meter Verification..........................................................................................................120
Chapter 7 Commands.............................................................................................................127
7.1 Tools commands..................................................................................................................... 127
Appendix A Conversion factors................................................................................................. 145
A.1 Conversion factors per unit of measurement........................................................................... 145
Appendix B Miscellaneous equations........................................................................................ 147
B.1 K-Factor and Inverse K-Factor.................................................................................................. 147
B.2 Calculation of Chord "L" dimension...........................................................................................148
Rosemount Model 3418 GUSM 3

Contents Operations manual
April 2022 00809-0800-3104
Appendix C Troubleshooting comm., mech., and elec............................................................... 149
C.1 Communications troubleshooting...........................................................................................149
C.2 Mechanical/Electrical troubleshooting.....................................................................................150
Appendix D Flow Rate charts.....................................................................................................153
D.1 Summary charts for Flow rate..................................................................................................153
Appendix E Write-protected configuration...............................................................................157
E.1 Parameters for Write-protected configuration.........................................................................157
Appendix F Engineering drawings............................................................................................ 167
F.1 Rosemount™ 3410 Series engineering drawings.......................................................................167
4 Emerson.com/Rosemount

Operations manual Startup
00809-0800-3104 April 2022
1 Startup
1.1 Checklist
During meter startup, have the following equipment and information on hand:
Meter startup checklist
Site pipe and ID drawings with elevations
Site wiring diagrams
Rosemount Gas Ultrasonic Meter calibration data
Rosemount Gas Ultrasonic Meter manuals
Information and manuals for all other flow instrumentation - flow computers, pressure
and temperature transmitter data sheets, and wiring
Shutoff and control valve information, specifications, operation and setup data.
Ethernet (Cat 5 cables) or serial cables to link the laptop to the meter
Field service representative's telephone numbers for major components; valves, meter,
flow computer, communication gear, transmitters, site designers or integrators.
Check all ultrasonic meter wiring.
Check the settings of any bit switches on transmitter I/O cards.
Start MeterLink
Establish flow in the meter (at lease 3 feet per second to ensure good thermal mixing)
Save the meter configuration file - your "As Found" record of the meter. In MeterLink
select Tools → Edit/Compare Configuration.
Click the Read button and select File Save.
Open File → Program Settings and customize MeterLink™ user preferences.
Open Meter → Monitor and check the measurement paths or chords and that they agree
with each other to approximately 0.2%.
Check for alarms, open Meter → Monitor and click Check Status.
Check for good signal strength (usually shown as "SNR") or, Signal to Noise Ratio.
Check for reasonably correct flow profile
From the Logs/Reports menu, click Maintenance Logs/Reports, collect and save a
Maintenance Log to record the initial performance of your meter (this is your "as Found"
record).
™
™
From the Meter → Field Setup Wizard menu. Make any configuration adjustments, such
as setting the frequency output variable and frequency full scale.
Save another Maintenance Log (this is your "As Left" record).
Rosemount Model 3418 GUSM 5

Startup Operations manual
April 2022 00809-0800-3104
1.2 Cybersecurity and network communications
The 3410 electronics TCP/IP communications should be configured to mitigate
cybersecurity risks as follows:
1. MeterLink uses either FTP or HTTP protocols for Archive and Smart Meter
Verification log collection. It is recommended to disable the FTP protocol and leave
the HTTP protocol enabled. Both can be disabled for additional security, but log
collection will not be possible in this configuration.
2. Telnet port should be left disabled. This port is not required for any
communications to field devices or MeterLink.
3. Enabling the physical Write Protect switch will prevent metrology configuration
changes and firmware upgrades. It will also prevent enabling TCP/IP protocols such
as FTP, HTTP, and Telnet.
This transmitter:
1. Is not intended to be directly connected to an enterprise or to an internet facingnetwork without a compensating control in place.
2. Should be installed following industry best practices for cybersecurity.
6 Emerson.com/Rosemount

Operations manual Communications
00809-0800-3104 April 2022
2 Communications
2.1 Setup meter communications
After the installation of your Rosemount Ultrasonic Meter, install MeterLink™ on your PC or
laptop as described in the MeterLink Software for Gas and Liquid Ultrasonic Flow Meters Quick
Start Manual (00809-0100-7630) for your operating system ( Windows® 7 or Windows® 8,
Windows® 10), then configure the meter.
The MeterLink Software for Gas and Liquid Ultrasonic Flow Meters Quick Start Manual
(00809-0100-7630) is made available with the meter.
The MeterLink installation program is available for download from the Emerson website:
emerson.com/en-us/catalog/meterlink.
2.1.1
MeterLink utilities
MeterLink™ provides the following utilities to configure the meter's flow measurement
units, meter output parameters, communications settings, output tests and logs and
reports file management.
Field Setup Wizard
• Startup
• General
• Frequency/Digital Output Sources
• Frequency Outputs
• Meter Digital Outputs
• Analog Outputs
• HART® Outputs
• Meter Corrections
• Temperature and Pressure
• Gas Chromatograph Setup
• Gas Chromatograph Component Data
• AGA8
• Continuous Flow Analysis
• Alarm Limits
• Local Display
Tools
• Edit/Compare Configuration
• Waveform Viewer
Rosemount Model 3418 GUSM 7

Communications Operations manual
April 2022 00809-0800-3104
• SOS Calculator
• Outputs Test
• Transducer Swap-Out
• Transducer Type
• Velocity Estimation
• Locate Meter
• Baseline Wizard
• Program Download
• Warm Start Meter
• Communications Analyzer
Log/Reports
• Maintenance Logs and Reports
• Trend Maintenance Logs
• Meter Archive Logs
• Smart Meter Verification
• Create PDF from XML SMV Report
• Compare Excel® Meter Configurations
Calibration
• Analog Inputs Wizard
• Meter Factors
• Flow Calibration
• Zero Calibration
Setup the meter directory
Setup the connection properties for your meter. By default, the meter directory contains
only one record named New Meter, that is defaulted to connect to a Rosemount Gas
Ultrasonic meter configured as shipped from the factory.
Create a new meter record
Procedure
1. Select Insert, Insert Duplicate, or Add from the File pull-down menu to create a
new record.
2. Setup the record by entering a Meter Name, Short Desc, Meter Type, and select the
connection type(s) checkboxes Direct, Ethernet and Ethernet 2.
3. For each connection type selected, a button will be enabled at the bottom of the
dialog with the same name. Click these buttons to edit the connection properties
for that connection method. After choosing the connection properties, click OK
accept the changes or click Cancel to discard any changes and close the dialog.
8 Emerson.com/Rosemount

Operations manual Communications
00809-0800-3104 April 2022
a) Direct connection - to connect to the meter directly through one of the serial
ports on the meter using one of the serial ports on your computer. Click
Direct to set the following parameters.
• Protocol: TCP/IP is a read-only field and is the only protocol MeterLink
uses.
Note
Rosemount Ultrasonic meters still support Modbus ASCII and Modbus
RTU when talking to other applications or devices.
• Comms Address: Enter the communication address that is configured in
the meter hardware. The default address for meters from the factory is
32. For Rosemount Ultrasonic meters the valid range is from 1 to 247.
• Port: Select the available driver from the list of those installed on your
machine.
Note
For Windows® 7, you cannot use the Communications cable between two
computers at this time and must use the Rosemount Direct Connection
driver.
• Baud Rate: Select the serial port baud rate from the drop-down list for
which the meter hardware is configured. The default Baud Rates is 19200.
• Check Box labeled Route IP packets to connection to configure MeterLink
to automatically connect to both Transmitter heads of DualConfiguration meters when data sharing is enabled. This requires
Ethernet connection between the two heads.
b) Ethernet connection - Set the following properties to configure the
Rosemount ultrasonic meter hardware for Ethernet connectivity.
NOTICE
It is strongly recommended that the meter be configured using an
independent (off- network) single host computer. After configuration of the
meter, the DHCP option should be disabled.
• IP Address: Enter the IP Address for the meter's Ethernet port.
The factory set IP Address is 172.16.17.200 for Rosemount Gas Ultrasonic
meters or you can use 192.168.135.100 if DHCP is enabled in the meter
(see DHCP below for more details).
Dynamic Host Configuration Protocol (DHCP): Business PCs are usually
configured to work in a network environment where a DHCP server
assigns an IP address to each computer when they connect to the
network.
If a PC is configured to obtain an IP address from a DHCP server and it is
going to connect through the Ethernet Cable (1-360-01-596) to a
Rosemount meter that is not connected to a network, then the DHCP
server in the meter must be enabled so it can assign an IP address to the
PC when it connects.
Rosemount Model 3418 GUSM 9

Communications Operations manual
April 2022 00809-0800-3104
The DHCP server can be enabled on the meter by setting the DHCP switch
on the CPU module to the ON position.
When connecting to a meter with DHCP enabled, use the IP address of
192.168.135.100 to connect to the meter. In this mode you can create
just one Meter Directory record with this IP address to connect to all your
meters with DHCP enabled. When the connection is made, select to use
the Meter Name in the meter instead of the Meter Directory Name in
order to keep all log files and configurations separate from each meter.
Click OK to accept the changes or click Cancel to discard any changes and
return to the Meter Directory dialog box.
Meter groups
This dialog, available from the Meter Directory dialog, allows you to manage meter groups
for filtering the list of meters in the Connect to Meter dialog, exporting to other
MeterLink™ users and for filtering the list of meters in MeterLink™ Net Monitor’s main
window. There is a predefined meter group for “All meters,” otherwise meters can be
grouped together in any way that is useful to you, e.g. meters for geographic regions, or
meters that require daily monitoring.
User-defined meter groups can be added, edited and deleted in the dialog. The left side
displays a list of meter groups. The right side displays all available meters (meter directory
records) in the currently selected group and allows meters to be added to or removed
from the currently selected group using a checkbox next to each meter.
Ethernet initial connection steps
Procedure
1. Power up the meter.
2. Shutdown the PC.
3. Plug the Ethernet adapter cable Phoenix end into the meter Field Connection Board
connector J8 and connect the RJ-45 end into the PC Ethernet connector.
4. Enable the Ethernet LAN connector DHCP server on the CPU Module by moving the
DHCP (switch-1) to the ON position (see direction arrow on the CPU Module label).
5. Power up (boot) the PC and log in to the initial Windows logon prompt.
6. Verify the Ethernet connection status by the CPU Module “LINK” LED which should
be on solid green.
7. Launch MeterLink and create a new meter record.
Import a meter record
Procedure
1. Select File → Import from the Meter Directory drop-down menu or click Import.
2. The Import Meter Directory File dialog which allows you to select a meter
directory .DAT file to import the file into the currently used meter directory file.
If an identical meter record already exists and a duplicate is trying to be imported,
MeterLink inserts the duplicate meter record. The Import button performs the
same operation.
10 Emerson.com/Rosemount

Operations manual Communications
00809-0800-3104 April 2022
Export a meter record
Use the Export command to save the current meter directory to file. Select File → Meter
Directory from the Meter Directory drop-down menu or click Export.
Procedure
1. Enable the meter directory record checkbox you want to export or click Select All.
2. Click OK to begin exporting the meter record(s). Use the Export Meter Directory File
dialog to save the exported record to the default folder (C:\Ultrasonic Data) or enter
another location.
3. Click Save. If you have an existing METER_DIRECTORY_EXPORT.DAT file, you are
prompted to change the file name or replace the file. If changing the file name,
keep the .DAT extension to maintain functionality when importing the file to the
new machine.
4. Copy the exported file to the new machine.
5. Use the Import command to select this file and import it into the Meter directory.
Important
Due to limitations in the Microsoft® Dial-Up Networking, not all of the directory
information for Direct and Modem connection can be exported to the
METER_DIRECTORY.DAT file for Rosemount Ultrasonic meters. It will be able to
export the meter names, Comms Address, Interface, and Telephone numbers. It will
still be necessary to recheck the connection properties and verify the
communication parameters such as COM port, data bits, and parity are configured
correctly.
Connect to the meter
Procedure
1. From the menu bar, select Meter → Connect or click , the Connect icon, on the
toolbar.
2. The Connect to Meter dialog box displays a list of meters setup in MeterLink. Click
Direct, Ethernet next to the Meter Name to establish a connection with your
Rosemount Ultrasonic meter.
Collect “As Found” logs and reports
Use the MeterLink Logs/Reports menu and collect and save the logs and reports for a
historical record of the meter at several velocities within the operating range of the meter.
This will establish a baseline to be used for the trending of the meter diagnostics. Save the
following logs and reports for the "As Found" settings (factory default).
• Maintenance log
• System log
• Save your meter's configuration file
• Use the Tools → Edit/Compare Configuration menu to display the dialog. Enable the
View All or Metrology radio button and click Read.
Rosemount Model 3418 GUSM 11
Communications Operations manual
April 2022 00809-0800-3104
The All View displays the meter's extended configuration parameters. Grayed out
values are read-only, but help describe the configuration. The Metrology View displays
the path dimensions, pipe diameter, transducer delay parameters, zero flow calibration
coefficients, and flow calibration coefficients.
— Click the question mark icon, , for the data point to display additional information.
• Click Save to save the configuration file. By default, the file is saved to the Data Folder
setup in File → Program Settings.
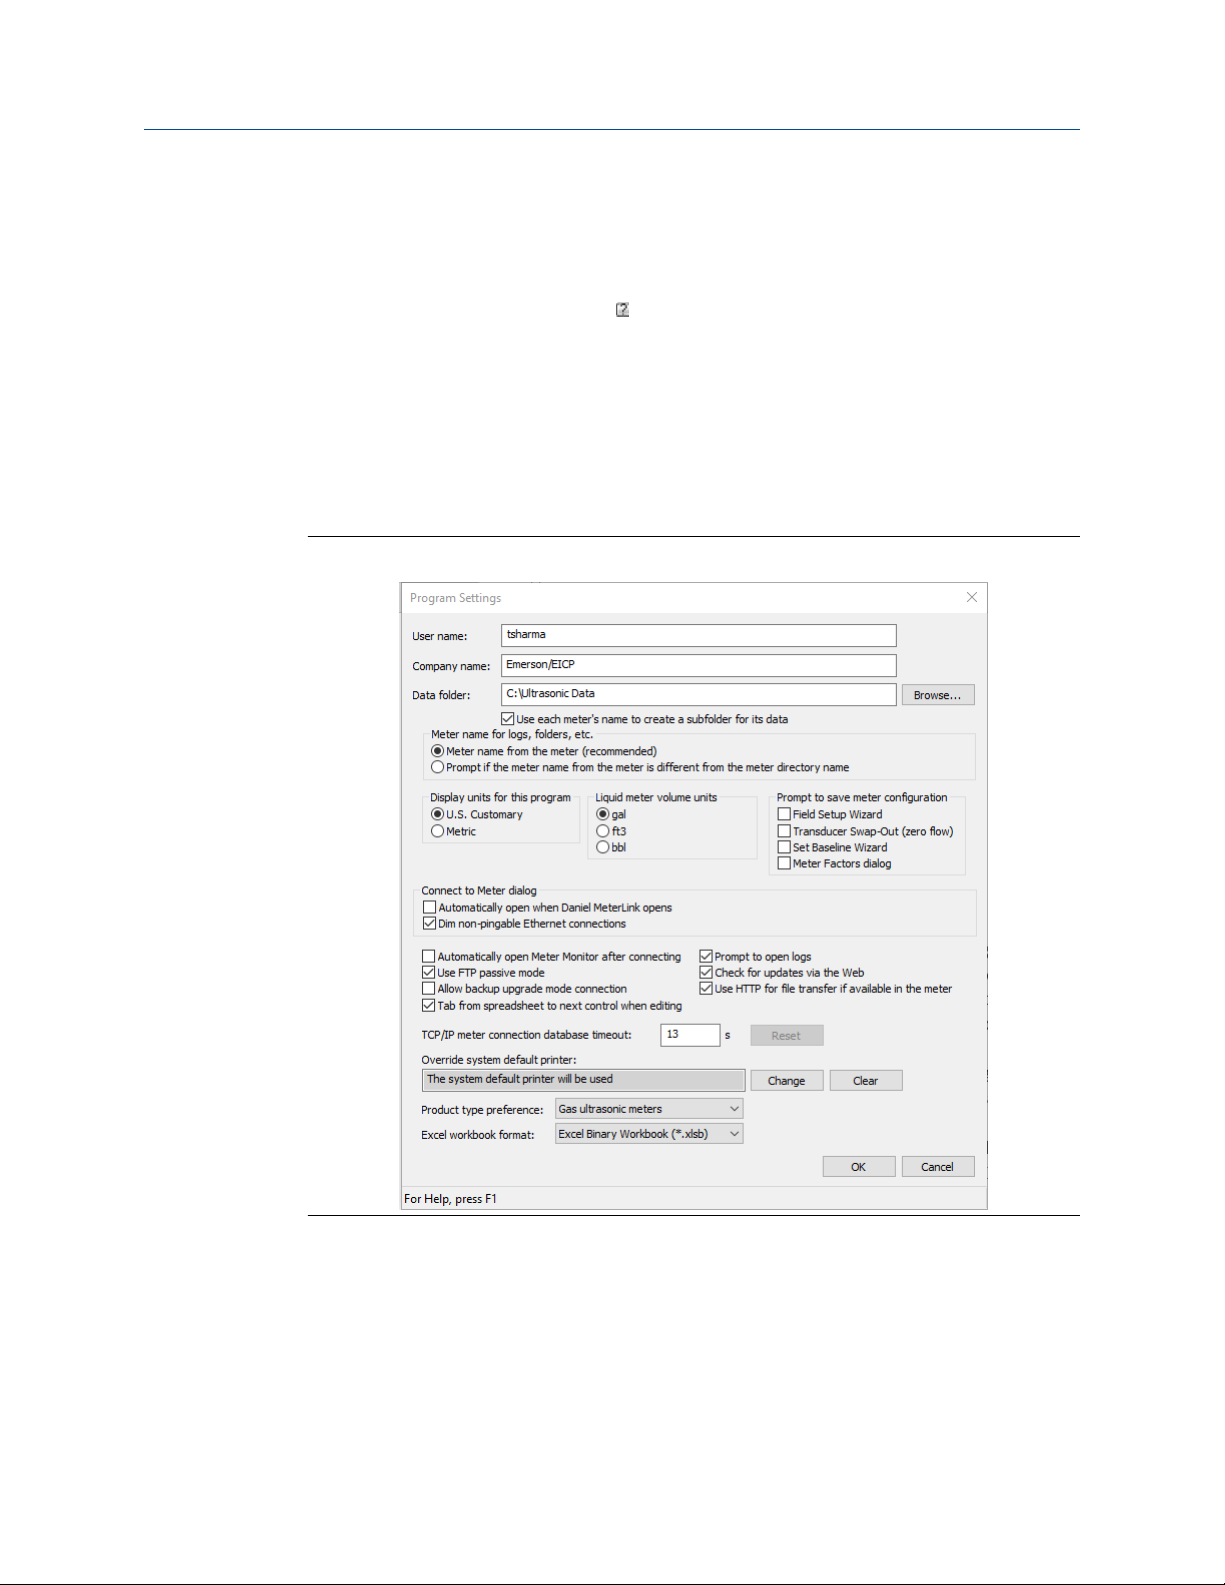
Customize MeterLink settings
Open MeterLink and access File → Program Settings, then input the desired settings for
your meter. Your user name and company name is included on reports and logs generated
with MeterLink.
Figure 2-1: Program Settings
• User name
• Company name
• Data folder (where meter's data is stored)
• Select the checkbox to create a subfolder with the meter's name under Data folder for
saving and opening files for your meter
12 Emerson.com/Rosemount

Operations manual Communications
00809-0800-3104 April 2022
• Display units (of measurement); U.S. Customary or Metric for necessary unit
conversions read by the meter
• Meter volume units; gal, cubic feet, or bbl
• Prompt to save meter config (configuration) prompts you to save a copy of the meter
configuration after writing changes to the meter
• Run Connect dialog automatically after connecting
• Run Meter Monitor automatically after connecting
• Run Meter Monitor summary or detailed view after connecting
• Use FTP passive mode (client - server port communications)
• Allow backup upgrade mode connection - used to download firmware to Rosemount
Ultrasonic meters
• Tab from spreadsheet to next control instead of next cell
• TCP/IP meter connection database timeout - amount of time MeterLink waits to
respond to a request for data from the meter database (default 13 seconds)
• Override system default printer - used to change printer
2.1.2
• Product type preference - meter type you will most often connect, gas or liquid
HTTP file transfer
• Use HTTP for file transfer if available in the meter.
— A checkbox is enabled when selected.
— MeterLink uses HTTP protocol for file transfer with meter if it is supported by
firmware.
— Rosemount 3410 Series Firmware v1.50 and later supports HTTP protocol for file
transfer for Program Download, Collect Archive Logs, Collect XML SMV Report and
cache database configuration XML file when connecting to meter for the first time.
— Alternatively, Rosemount 3410 Series Firmware also supports FTP protocol for file
transfer for Program Download, Collect Archive Logs, Collect XML SMV Report and
cache database configuration XML file when connecting to meter for the first time.
Setup Modbus communications
Rosemount 3410 Gas Ultrasonic Flow Meters support RS-232 or RS-485 4-wire or 2-wire
half duplex serial interface to an external system (e.g., flow computer) using Modbus ACSII
protocol with the following parameters:
Setting
Value
Baud rate 19200
Data bits 7
Stop bits 1
Parity even
Rosemount Model 3418 GUSM 13

Communications Operations manual
April 2022 00809-0800-3104
Setting Value
Protocol Modbus ACSII
Refer to your flow computer user manual to set I/O settings required to allow serial
communication with the Rosemount 3410 Gas Ultrasonic Flow Meters.
The Rosemount 3410 Gas Ultrasonic Flow Meters supports ASCII and RTU Modbus
communication. For ASCII Modbus, both 7E1 and 7O1 are supported. For RTU Modbus,
8N1 is supported. The communication ports provide automatic protocol detection - only
the baud rate and Modbus ID need to be specified. Also, refer to the Rosemount website
and select the Product page for the model of your meter:
emerson.com/en-us/automation/emerson
14 Emerson.com/Rosemount

Operations manual Optional feature keys
00809-0800-3104 April 2022
3 Optional feature keys
3.1 General overview of the Optional feature keys
Rosemount 3410 Series Gas Ultrasonic Flow Meters offer many industry-leading features
including Chapter 21-compliant data log access, gas chromatograph (GC) interface,
AGA10 sound velocity calculation (with comparison to measured sound velocity) and
Continuous Flow Analysis diagnostics.
With Mark XX v1.50 Firmware or later, features keys will be generated on meter start up
and this enables all optional features available. All keys are unique to the CPU board's serial
number, so a key from one meter will not work in another meter.
The Continuous Flow Analysis optional feature is enabled via a software "key" value that is
specific to the meter's CPU Board. This software feature key consists of 16 characters
divided into four hyphen-separated, 4-character groups (such as 1234-5678-90AB-CDEF).
This dialog is only available while connected to a meter with firmware that contains option
keys to enable.
3.1.1
3.1.2
In MeterLink, access the Key Manager to view key statuses, add keys or change the key
values.
Obtaining optional keys
If you do not have a valid key to enter to enable a feature, you must have the CPU board
serial number available, which displays in the Meter → Key Manager dialog and the Meter
Menu → Meter Information dialog, when you contact Rosemount to obtain the key. The
keys can be given verbally over the phone or they can be e-mailed in a Key file for easy
entry.
• E-mail: tech.service@emersonprocess.com
• Web: http://www.emerson.com/en-us/support
• Also see, MeterLinkHelp → Technical_Support
GC interface key
The optional GC interface feature allows the meter to read gas property data (composition
and heating value) from a Rosemount gas chromatograph.
The meter can use the gas composition data to:
1. Calculate AGA8 compressibilities for converting volumetric flow rate and volumes
to standard (base) condition
2. Calculate AGA8 density for calculating mass rate and mass totals
3. To optionally calculate the AGA10 sound velocity (see AGA10 key (sound velocity
calculation)). The meter uses the GC-reported gas heating value to calculate the
energy rate and totalized energy rate values. This feature is enabled/disabled via the
GCKey data point.
Rosemount Model 3418 GUSM 15

Optional feature keys Operations manual
April 2022 00809-0800-3104
3.1.3 AGA10 key (sound velocity calculation)
The optional AGA10 sound velocity calculation feature allows the meter to calculate the
predicted sound velocity based upon the gas composition and compare this value to the
measured average sound velocity. The gas composition can be either specified via data
points or optionally read live from a GC (see above). This feature is enabled or disabled via
the AGA10Key data point.
3.1.4 Continuous Flow Analysis (CFA) key
The Continuous Flow Analysis key enables all optional features and provides extensive
diagnostics for the meter's operational health.
3.2 Configure optional keys
Procedure
1. Open MeterLink and connect to your meter.
2. Use the Meter Menu drop-down list and click Key Manager. MeterLink displays the
Key Manager dialog.
3. Enter the key you obtained in the appropriate field in the Key Manager dialog.
The field turns yellow indicating a change was made and the status will be updated.
When at least one change is made and none of the keys are Invalid, the Write to
Meter button is enabled so the changes can be written to the meter.
The Status column indicates if the key you entered is a Valid key.
4. Click Write to Meter to write the keys to the meter. After the keys are written
successfully, the Key Manager dialog closes.
If for any reason, one or more keys were not written successfully, before the Key
Manager closes, a message displays stating which keys could not be written to the
meter. This could occur if communications to the meter is lost between entering
the Key Manager dialog and clicking Write to Meter.
5. If desired, on the Field Setup Wizard-Startup page, enable the View Gas
Chromatograph setup and View Continuous Flow Analysis setup checkboxes to
display these pages later in the Field Setup Wizard. The Gas Chromatograph Setup
page provides the serial port configuration option to collect live gas compositions.
The Continuous Flow Analysis Setup page allows you to configure the SOS
comparison, liquid detection, abnormal profile detection, blockage detection, and
internal bore buildup detection features.
16 Emerson.com/Rosemount
Operations manual Measurement
00809-0800-3104 April 2022
4 Measurement
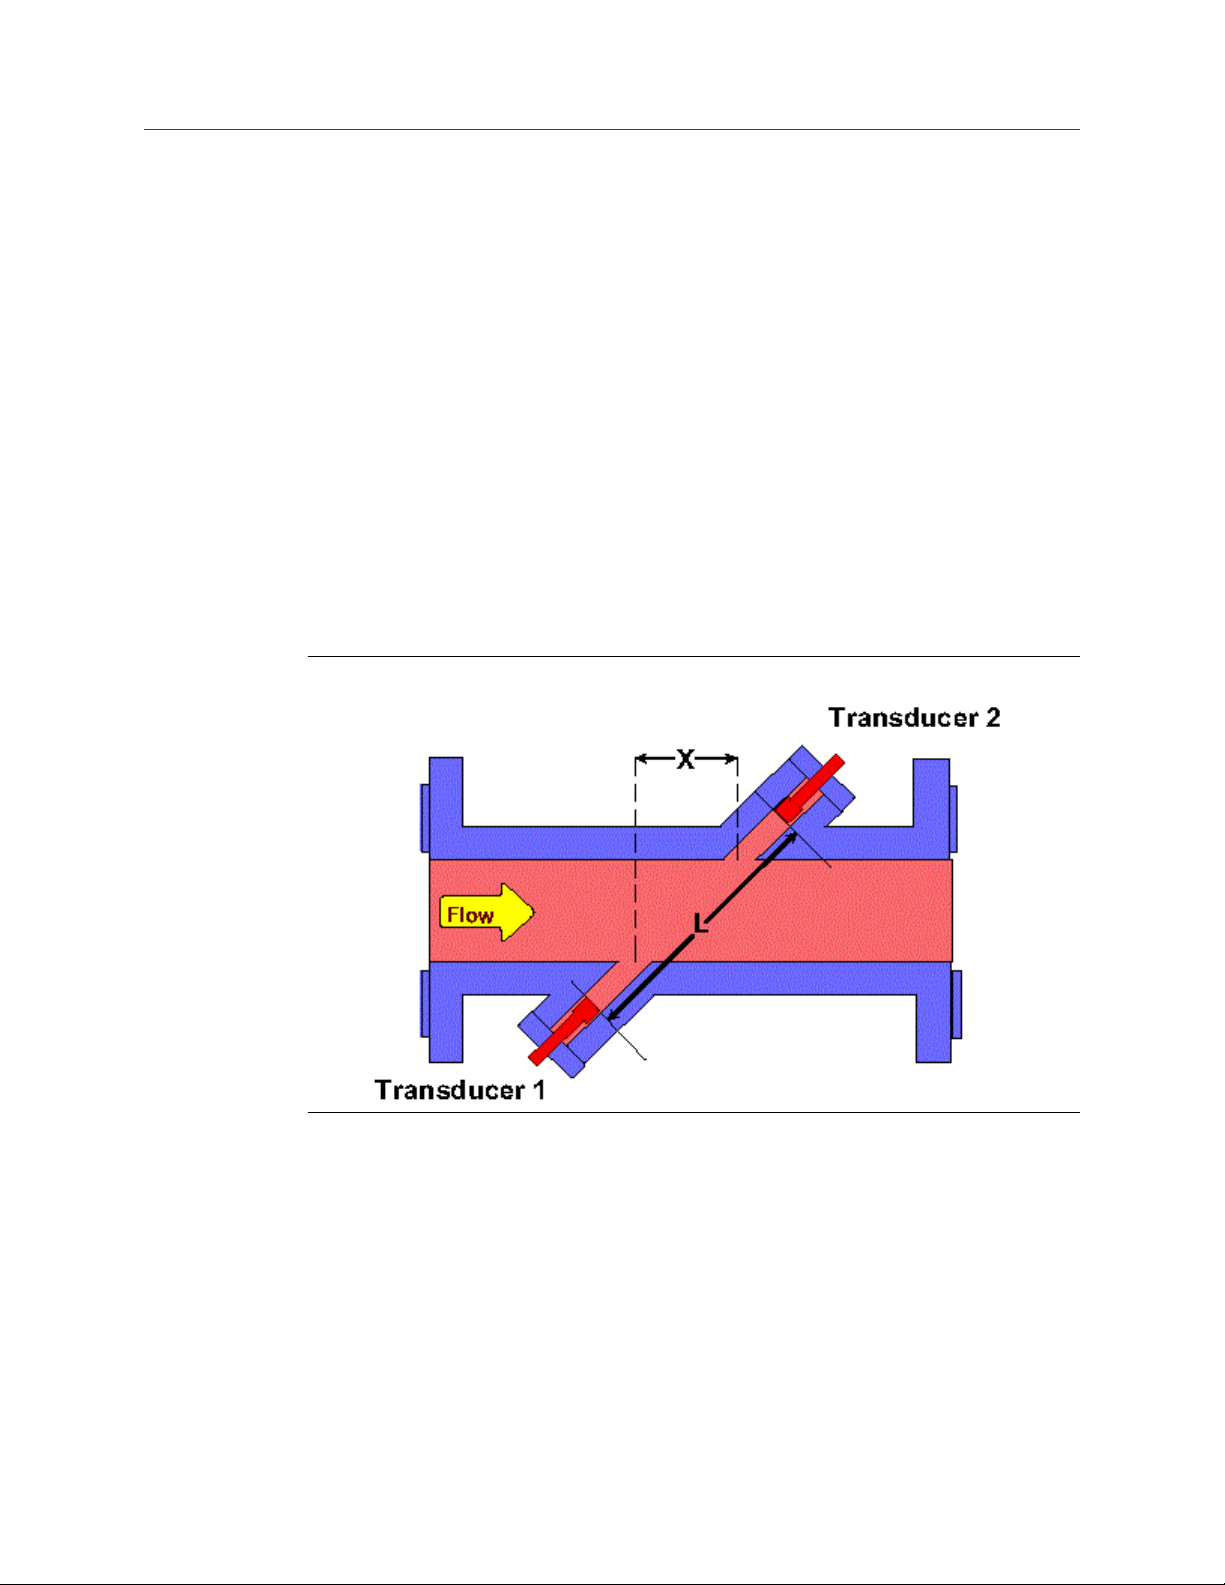
4.1 Flow measurement
Rosemount 3410 Gas Ultrasonic Flow Meters measure the transit times of ultrasonic
pulses passing through the medium on two parallel planes. The measurement paths (also
referred to as "chords") are angled to the pipe axis, and each chord has two transducers
acting alternately as transmitter and receiver as shown in Figure 4-1. This permits the
transit times to be measured both with and against the flow (upstream and downstream).
The transducers are mounted on the meter body at accurately known locations for each
pipe size so the distance L between opposing transducers and the angle are precisely
defined for the measurement path.
The 3418 combines the power of two interlocked 4-path British Gas design meters in one
flowmeter body. The second set of chords is the mirror image of the first, which allows the
meter to cancel out the effects of swirl and cross flow.
4.1.1
Figure 4-1: Direct path transit-time measurement principle
Transducer timing control
The following terms are used in explaining the effects of transducer timing control, the
performance of batch data collection and calculation updates in Rosemount 3410 Gas
Ultrasonic Flow Meters.
Rosemount Model 3418 GUSM 17

Measurement Operations manual
April 2022 00809-0800-3104
Figure 4-2: Signal Analyzer - update rate, stack size, filter and emission rate
Terminology
• Sequence - a complete cycle of firing all enabled transducers in a single round of
transducer operation.
• Stacking - the process of modifying a sequence so that each individual transducer is
fired "x" times (where x equals the stack size) before the next transducer in the
sequence is fired.
• Stack size - the multiple of times each transducer is fired before the next transducer
within the sequence is fired. (When stacking is absent or disabled, the stack size is
actually 1, because each enabled transducer is fired once during the sequence. When
stacking is applied or enabled, it is applied increments of 2, 4, 8, and 16 and are the
only stack size choices, so that each enabled transducer is fired 2, 4, 8, or 16 times
before the next transducer in the sequence is fired.)
• Emission rate - the time elapsed before the next transducer in a sequence is fired,
regardless of stack size (minimum emission rate is 2 milliseconds with the Filter ON or
OFF). We recommend the default Filter setting, which is the OFF position.
• Stack emission rate - the time elapsed before a single transducer is re-fired when
stacking is enabled (minimum stack emission rate is 2 milliseconds with the Filter OFF).
• Chords inactive or active - the exclusion or inclusion of a chord-forming pair of
transducers in the sequence of transducer operation.
• Update time - the time elapsed, in seconds, between each processing, or recalculation
of data that is collected from sequences of transducer firings.
• Batch period, or batch cycle - synonymous with Update time, as defined above.
18 Emerson.com/Rosemount

Operations manual Measurement
00809-0800-3104 April 2022
• Sample - refers to one point on the waveform as in samples per cycle. The data that is
collected from one Sequence of transducer operation. (This term is displayed in the
MeterLink™ Signal Analyzer screen, and is nearly synonymous with Sequence, as
defined above. That is, Samples/update, as displayed in the MeterLink™ Signal Analyzer
Wizard, could be interpreted as Sequences/update.) This shows the average number of
new samples collected during an update period.
4.2 Signal processing
The signal at the receiving transducer is amplified, digitized and processed digitally to
provide accurate transit time measurement.
A measure of the signal "quality" is the signal-to-noise ratio (SNR). The higher the SNR, the
better the signal. In general there are two types of noise: "white" noise and "colored" noise.
White noise is noise that occurs across the frequency spectrum and is asynchronous to the
transmitted signal. Colored noise is concentrated around a particular frequency and can
be synchronous with the transmitted signal. The meter provides two methods for
improving the received signal waveform SNR by reducing the noise energy: Stacking and
Filtering.
4.2.1
4.2.2
Stacking
Stacking is a method of firing a transducer multiple times and averaging the received
signals on a point-by-point basis.
Stacking is effective on asynchronous noise such as is typically seen with valve noise. This
method is not useful for removing synchronous noise and should not be used when there
is a great deal of signal "jitter." Meters are configured by default with a stack size of 1 (no
stacking).
Care should be taken when turning on stacking and it is recommended to consult with
Emerson Customer Support if you are unsure of how stacking a signal can affect the
meter's operation. Refer to Technical Support under the Help menu of MeterLink for
contact information.
The number of consecutive times to fire each transducer is specified via the StackSize data
point. Available stack sizes are 1 (None), 2, 4, 8, and 16. A stack size of 1 selects no
stacking (i.e., stacking disabled). Stacking is only available when the standard update rate
is selected (see Batch update period).
Filtering
Filtering applies a bandpass filter that removes noise that is above and below the
transducer frequency.
Filtering is effective on noise outside of the frequency passband of the filter (e.g., filtering
works on any noise outside of the passband of the filter).
Filtering is enabled/disabled via the Filter data point (TRUE=enable filtering, FALSE=disable
filtering). Meters are configured by default with filtering disabled. The minimum emission
rate for the gas meter is 2 milliseconds with the filter ON or OFF. We recommend the
default Filter setting, which is the OFF position.
Rosemount Model 3418 GUSM 19

Measurement Operations manual
April 2022 00809-0800-3104
Care should be taken when enabling/disabling filtering and it is recommended to consult
with Flow Lifecycle Services for Rosemount products if you are unsure of how this change
can affect the meter's operation. Refer to Technical Support under the Help menu of
MeterLink™ for contact information.
4.2.3 Batch cycle processing
Batch update period
Calculation updates performed by the meter, for deriving volume and velocity, are based
on batches of data samples collected from sequences of transducer firings. The batch
update period is dependent upon the user specified batch update period
(SpecBatchUpdtPeriod) and the stack size (StackSize) as shown in Table 4-1. The
Standard batch update period is the default. The actual batch update period is readable via
the BatchUpdatePeriod data point.
Table 4-1: Actual meter update period
Stack size
1 (None) 2 4 8 16
SpecBatchUpdtPeriod
Rapid
(250 ms)
0.25 sec N/A N/A N/A N/A
4.2.4
Standard
(1000 ms)
Emission rates
The emission rate is the period between firing two different transducers. The stacked
emission rate is the period between consecutive firings of a single transducer when
stacking is used (i.e., the stack size is not set to None).
The actual emission rates used (readable via the EmRateActual and StackEmRateActual
data points) are functions of the desired emission rates, meter type, firing sequence, stack
size, and pipe diameter.
1 sec 1 sec 1.5 sec 3 sec 5 sec
Smoothing
The Rosemount 3410 Series Gas Ultrasonic Flow Meter applies a method for smoothing
the output (particularly the frequency output) by averaging times collected from past
batch periods with new times for the current batch period.
Smoothing can be applied in the following increments: 0 (i.e., smoothing is disabled), 20,
40, 60, or 80%.
For example, setting Smoothing to 20% means that of the samples used for the current
update, 20% will be from previously collected samples and 80% will be from the newly
collected samples. Thus, if eight new samples are collected, then those eight samples
along with the last two previous samples would be used together for the current update
period calculations.
Meters are configured by default for Smoothing of 0% (only new samples are used for the
Current Update period).
20 Emerson.com/Rosemount

Operations manual Measurement
00809-0800-3104 April 2022
4.3 Acquisition mode
Rosemount 3410 Gas Ultrasonic Flow Meters have two modes of normal operation:
Acquisition and Measurement. The Acquisition mode is used to acquire the ultrasonic
signals. This mode is entered when power is applied to the meter.
Once the ultrasonic signals are acquired, the Measurement mode is entered and the flow
velocity is measured. The meter remains in the Measurement mode as long as at least one
chord is operational.
If while in the Measurement mode all chords fail, then the meter re-enters the Acquisition
mode. If the VelHold data point is set to a value greater than zero, then, while in the
Acquisition mode, the meter holds the average weighted flow velocity to the last good
value for up to the VelHold number of batches before setting the velocity to zero. The
VelHold default value is 0.
The Acquisition mode uses the chords' "L" dimensions (LA…LH as appropriate to the meter
type) and the specified minimum and maximum sound velocities (SSMin and SSMax)
determines the signal search range. MinHoldTime and MaxHoldTime are also used to
determine the signal search range. The meter uses the more restrictive of SSMin/
MaxHoldTime and SSMax/MinHold time.
4.3.1
Re-acquisition
When fewer than MinChord (default 1) chords are good, then the meter re-enters the
Acquisition mode. If MinChord is set to the number of active chords, the meter will
reacquire on the first time a chord is failed for a batch.
Note that failed for a batch is different from hard failed. A chord fails for a batch when PctGood[A1..H2] is less than MinPctGood.
Hard fails occur after AlarmDef number of batches in a row.
4.4 Chord gas and sound velocity measurements
At each batch update period, each firing path's transit time measurements are averaged.
The average (mean) value for each path is available via data points MeanTmA1...
MeanTmH2 (as appropriate for the meter type).
NOTICE
The data point names often use a "short-hand" way of identifying the receiving transducer.
The last two characters identify the chord (A...H) and the transducer (1=upstream,
2=downstream). For example, MeanTmA1 is the mean transit time for the chord A
upstream transducer.
The difference between a chord's average upstream transit time and average downstream
transit time is the average delta time. The chord's average times and the chord "X" and "L"
dimensions are used to calculate the gas velocity and sound velocity measured by the
chord as shown in Equation 4-1 and Equation 4-2.
Rosemount Model 3418 GUSM 21
Measurement Operations manual
April 2022 00809-0800-3104
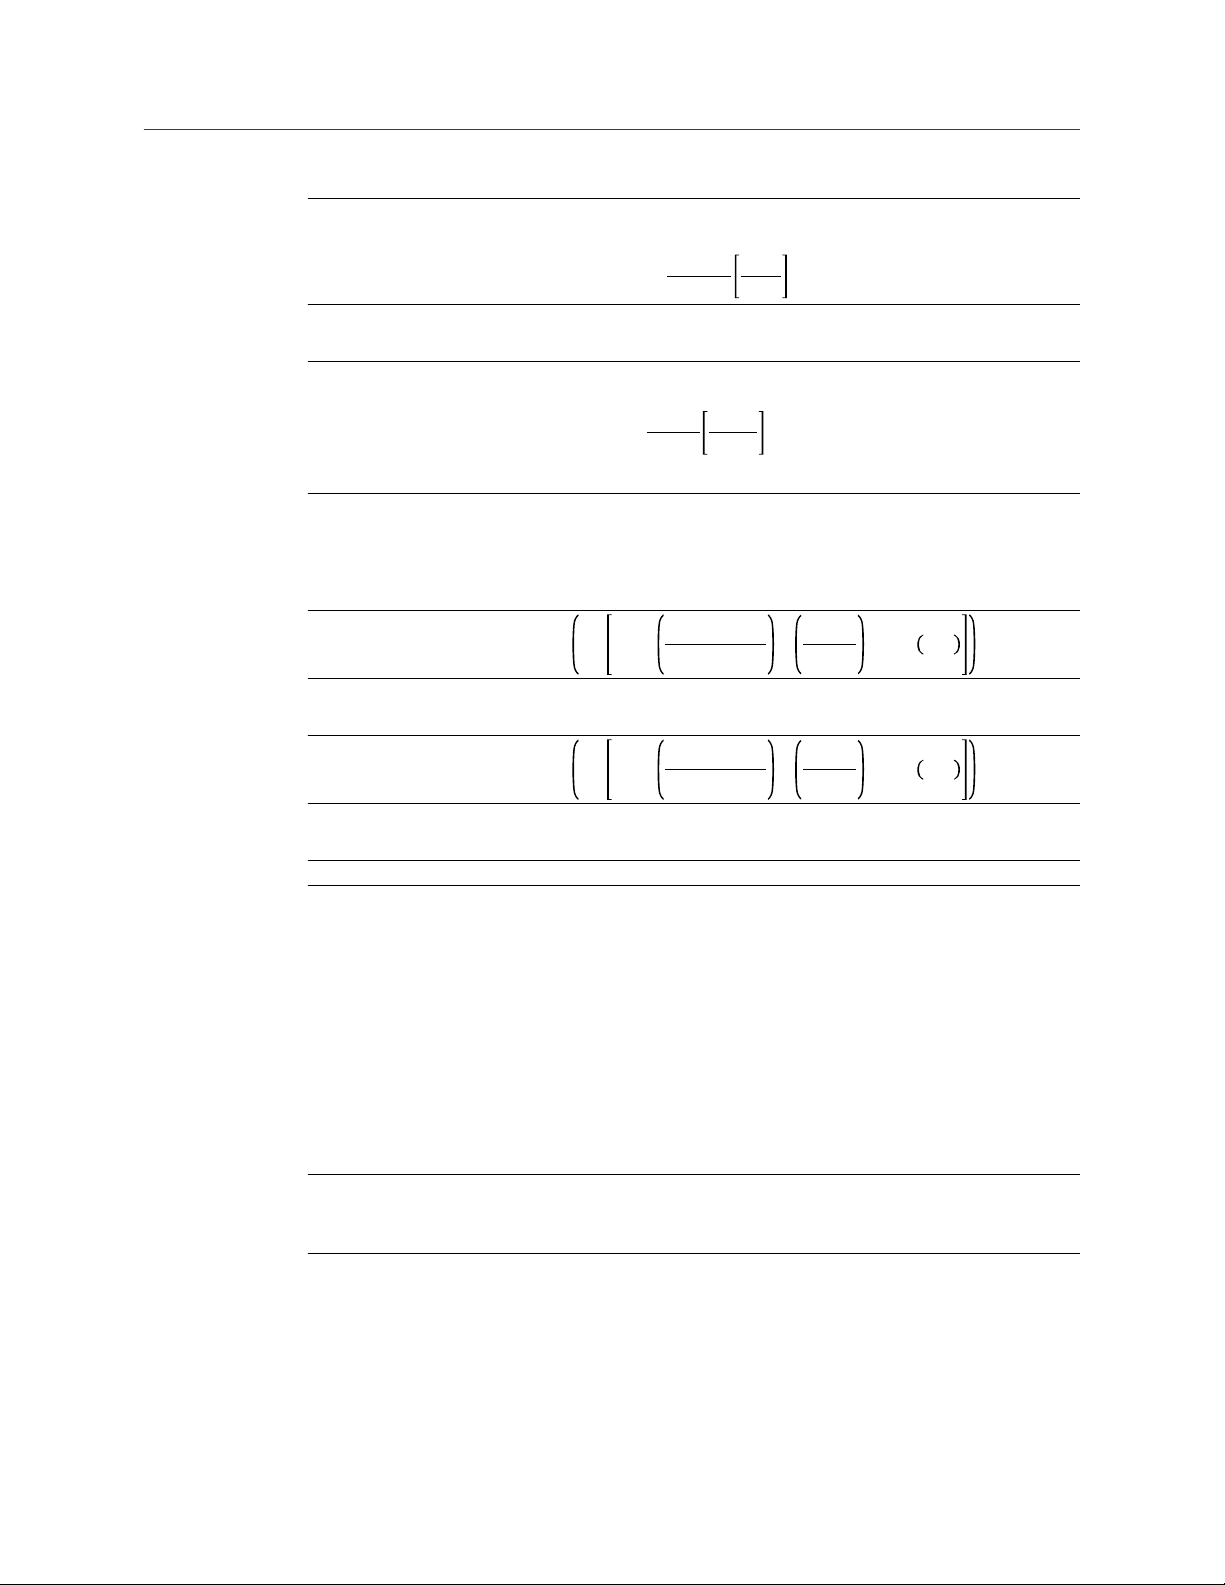
Equation 4-1: Chord Gas Velocity
2
V
chord
L
=
2X
chord
chord
t1‐t
t1t
2
2
and
Equation 4-2: Chord Sound Velocity
C
chord,classic
C
=C
chord
L
=
chord,classic
t1+t
chord
2
t1t
2
2
×PortAngleFactor
where the PortAngleFactor is a dimensionless factor that is dependent upon the chord port
angle with respect to the meter body:
For 60 degree port angles,
PortAngleFactor= 1+ 0.5•
2
V
chord
2
C
chord,classic
•
2
X
chord
2
L
chord
•tan260°
For 75 degree port angles,
PortAngleFactor= 1+ 0.5•
2
V
chord
2
C
chord,classic
•
2
X
chord
2
L
chord
•tan275°
For all other port angles,
PortAngleFactor=1
where
V
= chord average gas velocity (m/s) (FlowVelA ... FlowVelH)
chord
C
= chord average sound velocity (m/s) (SndVelA ... SndVelH)
chord
L
= chord "L" dimension (m) (LA ... LH)
chord
X
= chord "X" dimension (m) (XA...XH)
chord
t1 = chord average transit time in the upstream direction (s) (MeanTmA1 ...
MeanTmH1)
t2 = chord average transit time in the downstream direction (s) (MeanTmA2 ...
MeanTmH2)
Important
Note that a positive chord gas velocity indicates flow in the forward direction whereas a
negative chord gas velocity indicates flow in the reverse direction.
4.4.1
Average sound velocity
The Average Sound Velocity is calculated as the average of the active chord sound velocity
measurements as shown in the equation below:
22 Emerson.com/Rosemount

Operations manual Measurement
00809-0800-3104 April 2022
Equation 4-3: Average sound velocity
C
∑
C
ActiveChords
=
Avg
NumActiveChords
chord
where
C
= average sound velocity (m/s) (AvgSndVel)
Avg
C
= chord average sound velocity (m/s) (SndVelA... SndVelH)
chord
NumActiveChords = number of active chords
4.4.2 Optional AGA10 sound velocity calculation and comparison
The Rosemount 3410 Series Gas Ultrasonic Flow Meter offers an option to calculate the
sound velocity (using AGA10 equations and gas property data) and compare the result to
the meter- measured sound velocity on an hourly basis.
This feature is enabled via the AGA10 Key (see AGA10 key (sound velocity calculation)).
The gas property data required for using this feature can be specified via data points or
optionally read from a Rosemount GC (Configure Gas Chromatograph parameters). The
AGA8 Detail Method or GERG-2008 must be selected (via the HCH_Method data point,
Configure Gas Chromatograph parameters) in order for the AGA10 calculations to be
performed.
Every five seconds the meter updates the AGA10-calculated sound velocity. This value is
readable via the AGA10SndVel data point and the calculation status value is readable via
the AGA10SndVelStatus data point. The status values are as listed in the table below:
Table 4-2: Status of AGA speed of sound calculation
AGA10SndVelStatus value Description
0 Calculation OK (no errors)
1 Calculation not performed as the feature is not enabled .
AGA10SndVel is set to zero.
2 Calculations not performed as the AGA8 method (HCH_Method)
is not the Detail Method or GERG-2008. AGA10SndVel is set to
zero.
3 Calculations not performed as the AGA8 calculations are invalid.
AGA10SndVel is set to zero.
4 Calculations not performed due to encountered division by zero.
AGA10SndVel is set to zero.
Over the course of an hour (starting from the top of the hour), the meter calculates the
average measured sound velocity (the average of the average weighted sound velocity)
and the average AGA10-calculated sound velocity. At the end of the hour, the two
averages are compared; the comparison error (%) is readable via the SndVelCompErr data
point.
Rosemount Model 3418 GUSM 23

Measurement Operations manual
April 2022 00809-0800-3104
Note that the comparison error is only calculated at the end of the hour when there is at
least 75% of a log hour worth of valid flow data during the hour. A valid flow data means
that all of the following are true:
• no AGA10 sound velocity calculation errors occurred (i.e., AGA10SndVelStatus always
equal to 0),
• the measured average flow velocity (AvgFlow) is between the diagnostic flow analysis
limits (FlowAnalysisLowFlowLmt and FlowAnalysisHighFlowLmt), and
• the measured sound velocity was always valid (as indicated by the QMeterValidity data
point).
4.4.3 Average weighted gas flow velocity
When all active chords are non-failed, the average weighted gas flow velocity is a weighted
sum of the chord velocity measurements as shown in Equation 4-4 where the chord
weights are determined by the meter geometry.
Equation 4-4: Average weighted gas flow velocity
4.4.4
where
V
Wtd
V
AvgWtd
=
ActiveChords
V
= average weighted gas flow velocity (m/s) (AvgWtdFlowVel)
AvgWtd
= chord weight (dimensionless) (WtA ... WtH)
chord
= chord average gas velocity (m/s) (FlowVelA ... FlowVelH)
chord
∑
Wt
chordVchord
Average weighted flow velocity using chord proportions
In the event of one or more chord failure(s), the meter operation is dependent upon the
number of non-failed chords. If there is at least one operating chord, then the meter uses a
velocity estimation method described in the following paragraphs.
If all chords fail, then the meter re-enters the Acquisition mode as described in the Re-
acquisition section.
The meter partitions the velocity range (for forward and reverse flow) into ten
consecutive, non- overlapping "bins" (where the velocity range is as specified via the
MeterMaxVel data point).
The meter maintains a set of bins for each active chord where each bin contain three data
values: (1) the chord's average velocity (within the bin's velocity range), (2) the chord's
average proportion value, and (3) an indicator that the value is still the default (Is[Fwd/
Rev]Prop[A..H]DfltBin[1..10]). A chord proportion value is the ratio of the chord velocity
to the average weighted flow velocity as shown in Equation 4-5 below. The default
indicator is used to determine if a bin's velocity and proportion data values have been
updated from their initialized values. The bins are initialized with the average velocity over
the bin's range and meter-geometry-dependent proportion values. All default indicators
are initialized to TRUE. The bin data is stored in non-volatile memory.
24 Emerson.com/Rosemount

Operations manual Measurement
00809-0800-3104 April 2022
Equation 4-5: Chord proportion calculation
V
Prop
chord
=
chord
V
AvgWtd
where
Prop
V
chord
V
AvgWtd
= chord proportion (dimensionless)
chord
= chord velocity (m/s) (FlowVelA ... FlowVelH)
= average weighted gas flow velocity (m/s) (AvgWtdFlowVel)
When the meter has operated for a user-specified number of consecutive batches without
any chord failures, the meter updates each chord's data values for the bin containing the
chord velocity as shown in Equation 4-6 and sets the bin's default indicator to FALSE. The
PropUpdtBatches data point, configurable via the MeterLink Edit/Compare Configuration
screen, specifies the number of consecutive failure-free batches required for updating the
bin data (range: [1, 1000], default: 24). The NumVals data point (that determines how
quickly an average value changes) is also configurable via the Edit/Compare
Configuration screen (range: [1, 1000], default: 10).
Equation 4-6: Updating chord proportion bin data values
AvgVel
AvgProp
ChordBin
ChordBin
n+1
n+1
=
AvgVel
=
ChordBin
AvgProp
ChordBin
NumVals‐1 +V
•
n
NumVals
NumVals‐1 +Prop
•
n
NumVals
chord
chord
where
AvgVel
AvgVel
ChordBin
ChordBin
= chord bin (n+1)st average velocity (m/s)
n+1
= chord bin nth average velocity (m/s)
n
NumVals = update factor data point (dimensionless) (NumVals)
V
= chord velocity (m/s) (FlowVelA ... FlowVelH)
chord
AvgProp
AvgVel
Prop
chord
ChordBin
ChordBin
= chord proportion (dimensionless)
= chord bin (n+1)st average proportion value (dimensionless)
n+1
= chord bin nth average proportion value (dimensionless)
n
In the event of a chord failure with at least one operating chord, the meter's average
weighted flow velocity is estimated as shown in Equation 4-7.
Equation 4-7: Estimating average flow velocity using proportion values
V
chord
∑
V
AvgWtd
est
Non‐FailedChord(s)
=
InterpProp
∑
Non‐FailedChord(s)
chord
where
V
AvgWtd
V
Chord
InterProp
Rosemount Model 3418 GUSM 25
= estimated average weighted flow velocity (m/s) (AvgWtdFlowVel)
est
= (non-failed) chord velocity (m/s) (FlowVelA ... FlowVelH)
= (non-failed) chord interpolated proportion value (dimensionless)
chord

Measurement Operations manual
April 2022 00809-0800-3104
For each non-failed chord, the interpolated proportion value used in Equation 4-7 is
calculated as follows:
• If the chord's velocity is surrounded by non-default (average velocity, average
proportion) data pairs, then the interpolated proportion is the linear interpolation
between the two data pairs.
• If the chord's velocity has a non-default (average velocity, average proportion) data
pair on one side of it but not the other, then the interpolated proportion is the data pair
average proportion.
• If there are only default (average velocity, average proportion) data pairs, then the
interpolated proportion is the corresponding bin's default average proportion value.
4.5 Volumetric flow rate values
The Rosemount 3410 Series Gas Ultrasonic Flow Meter meter provides three volumetric
flow rate values: raw, (expansion-corrected and/or profile-effect corrected) flowcondition, and base- condition. Note that a positive volumetric flow rate indicates flow in
the forward direction whereas a negative volumetric flow rate indicates flow in the reverse
direction.
4.5.1
4.5.2
Raw volumetric flow rate
The "raw" volumetric flow rate is calculated from the average gas flow velocity (wetcalibration gas flow velocity) as shown in Equation 4-8.
Equation 4-8: Raw volumetric flow rate
2
Q
= V
Raw
where
Q
= “raw” volumetric flow rate (m3/h) (QMeter)
Raw
V
= wet-calibration gas flow velocity (m/s) (AvgFlow)
WetCal
π = geometric constant, pi (dimensionless) (3.14159...)
D = pipe inside diameter (m) (PipeDiam)
WetCal
πD
⋅
⋅ 3600 s/ℎ
4
Flow-condition volumetric flow rate
The flow-condition volumetric flow rate is the result of applying expansion correction and
flow- profile correction to the raw volumetric flow rate as shown in Equation 4-9 subject to
the low- flow cut-off. If the resulting value is below the low-flow cut-off value, it is set to
zero. The low-flow cut-off volumetric flow rate (QCutOff) is the specified low-flow velocity
threshold (ZeroCut) converted to a volumetric flow rate.
Equation 4-9: Flow-condition volumetric flow rate
Q
= Q
Flow
where
26 Emerson.com/Rosemount
ExpCorrPExpCorrTCorrFctr
Raw

Operations manual Measurement
00809-0800-3104 April 2022
Q
= flow-condition volumetric flow rate (m3/h) (QFlow)
Flow
Q
= “raw” volumetric flow rate (m3/h) (QMeter)
Raw
ExpCorrP = expansion correction factor due to pressure (dimensionless)
(ExpCorrPressure) calculated as shown in Equation 4-10.
ExpCorrT = expansion correction factor due to temperature (dimensionless)
(ExpCorrTemperature) calculated as shown in Equation 4-12.
CorrFctr = profile-effect correction factor (CorrectionFactor) calculated as shown in
Equation 4-11.
4.5.3 Pressure-effect expansion correction
The meter is capable of correcting the raw volumetric flow rate for the effect of pipe
expansion due to pressure changes.
Note that for the pressure-effect expansion correction factor to be calculated, the
correction must be enabled (via the EnableExpCorrPress data point) and the flowcondition pressure must be available (i.e., the EnablePressureInput data point must be set
to 'Live'(1) or 'Fixed'(2), see Configure the pressure parameters for the meter. The
pressure-effect calculation is shown in Equation 4-10. If the pressure-effect expansion
correction factor is not calculated, it is set to 1.0.
Equation 4-10: Pressure-effect expansion correction
ExpCorrP= 1 + 3 × β × P
abs, f
− P
ref
where
ExpCorrP = expansion correction factor due to pressure (dimensionless)
(ExpCorrPressure)
ß = pipe linear expansion coefficient due to temperature (MPaas-1)
(StrainPerUnitStress) calculated as shown in Equation 4-8.
P
= flow-condition absolute pressure (MPaa) (AbsFlowPressure) calculated as
abs,f
shown in Equation 4-13
P
= reference absolute pressure (MPaa) (0.101325MPaa) reference temperature for
ref
the pipe linear expansion coefficient (K)
Equation 4-11: Pressure-effect strain per unit stress
β=
2
D
out
1+υ + D
E× D
2
out
‐D
2
in
2
in
1‐2υ
where
β = pipe strain per unit stress (MPaa-1) (StrainPerUnitStress)
D
= outside diameter of the meter or pipe (m) (PipeOutsideDiameter)
out
Din = inside diameter of the meter or pipe (m) (PipeDiam)
ʋ = Poisson’s Ratio (dimensionless) (PoissonsRatio)
E = Young’s Modulus of elasticity (MPaa) (YoungsModulus)
Rosemount Model 3418 GUSM 27

Measurement Operations manual
April 2022 00809-0800-3104
4.5.4 Temperature-effect expansion correction
The meter is capable of correcting the raw volumetric flow rate for the effect of pipe
expansion due to temperature changes.
Note that for the temperature-effect expansion correction factor to be calculated, the
correction must be enabled (via the EnableExpCorrTemp data point) and the flowcondition temperature must be available (i.e., the EnableTemperatureInput data point
must be set to 'Live'(1) or 'Fixed'(2), see Temperature expansion correction . The
temperature-effect calculation is shown in Equation 4-12. If the temperature-effect
expansion correction factor is not calculated, it is set to 1.0.
Equation 4-12: Temperature-effect expansion correction
4.5.5
ExpCorrT= 1 + 3 × α × Tf− T
ref
where
ExpCorrT = expansion correction factor due to temperature (dimensionless)
(ExpCorrTemperature)
α = pipe linear expansion coefficient due to temperature (K-1) (LinearExpansionCoef)
Tf = flow-condition temperature (K) (FlowTemperature)
T
= reference temperature for the pipe linear expansion coefficient (K)
ref
(RefTempLinearExpCoef)
Base-condition volumetric flow rate
The base-condition volumetric flow rate is the result converting the flow-condition
volumetric flow rate to the base pressure-temperature condition.
This conversion requires (1) AGA8 calculations to be either performed internally (i.e., by
the meter) or externally (with the resulting compressibilities specified to the meter via the
SpecZFlow and SpecZBase data points), and (2) the flow-condition temperature and
pressure to be live or fixed. If AGA8 calculations are not performed (i.e., neither internally
nor externally) or the flow-condition temperature and/or pressure are/is not enabled, then
the base-condition volumetric flow rate is set to zero. The base-condition volumetric flow
rate is calculated as shown in Equation 4-13.
Equation 4-13: Base-condition volumetric flow rate
Q
Base
= Q
Flow
P
abs, f
P
abs, b
T
Z
b
b
T
Z
f
f
where
Q
= “raw” volumetric flow rate (m3/h) (QMeter)
Base
Q
= flow-condition volumetric flow rate (m3/h) (QFlow)
Flow
P
= flow-condition absolute pressure (MPaa) (AbsFlowPressure) calculated as
abs,b
shown in Equation 4-10.
Tb = base-condition temperature (K) (TBase)
Tf = flow-condition temperature (K) (FlowTemperature)
Zb = base-condition compressibility factor (ZBase)
28 Emerson.com/Rosemount
Operations manual Measurement
00809-0800-3104 April 2022
Zf = flow-condition compressibility factor (ZFlow)
4.5.6 Volume
The Rosemount 3410 Series Gas Ultrasonic Flow Meter provides forward and reverse
volume accumulators for each of the three volumetric flow rate values: raw, flowcondition (raw with expansion and/or profile correction), and base-condition.
Each volume accumulator is actually stored as a data pair: (64-bit unsigned integer
portion, 32-bit floating point fractional portion). For example, a volume of 12345.750 m
is stored as 12345 m3 for the integer portion and 0.750 m3 as the fractional portion. Note
that while a volumetric flow rate can be positive (indicating forward flow) or negative
(indicating reverse flow), the volume accumulators are always positive values.
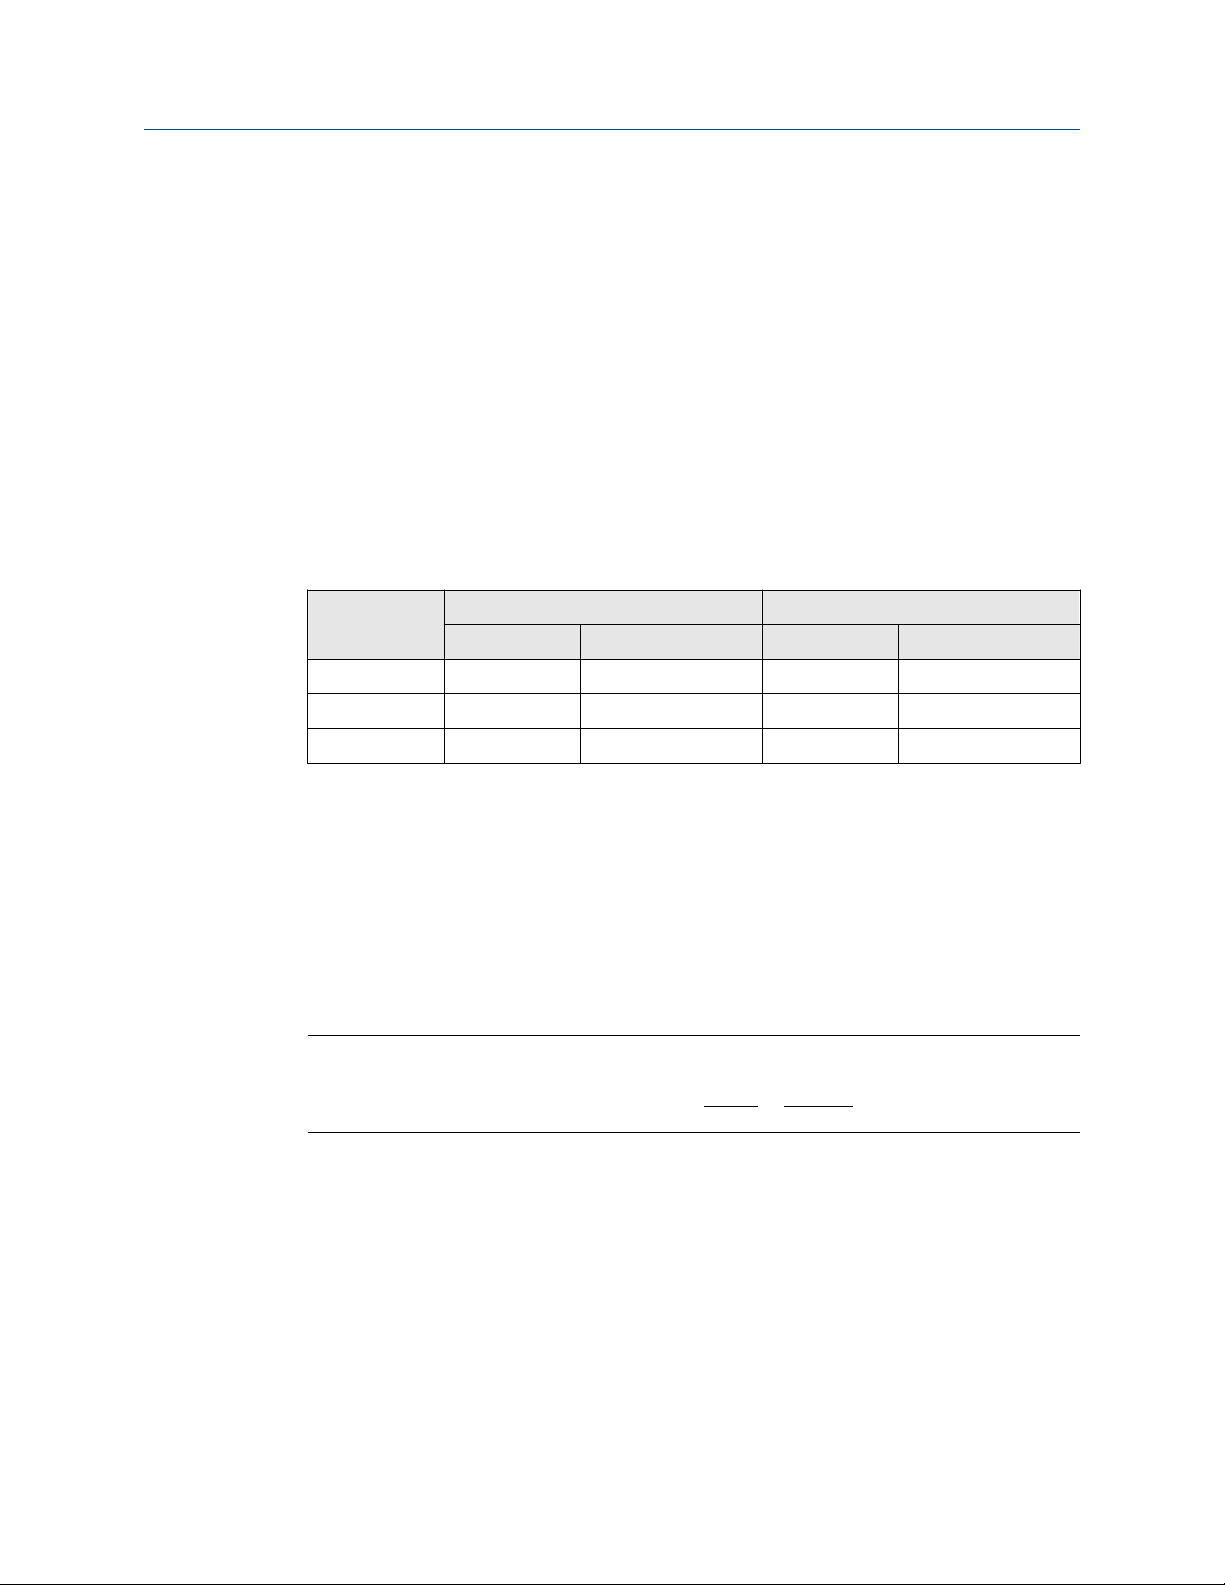
The non-volatile volume accumulator data points are as listed in the table below:
Table 4-3: Volume accumulation data points
Volumetric
flow rate type
Raw
Flow-condition
Base-condition
Forward Direction Reverse direction
Integer Fraction Integer Fraction
PosVolUncorr PosVolUncorrFrac NegVolUncorr NegVolUncorrFrac
PosVolFlow PosVolFlowFrac NegVolFlow NegVolFlowUncorr
PosVolBase PosVolBaseFrac NegVolBase NegVolBaseUncorr
4.5.7 Energy rate and totals
These calculations require that the flow-condition pressure and temperature are available
(either fixed or optional analog inputs, Flow-condition pressure and temperature, the gas
property data (composition and heating value) are available (either fixed or optionally read
from a GC, Flow-condition pressure and temperature), and the AGA8 calculations are
performed (internally by the meter or externally with the results written to the meter,
Flow-condition pressure and temperature).
3
The energy rate is calculated as shown in Equation 4-14
Equation 4-14: Energy rate
QE= Q
Base
× HV ×
1MJ
1000kJ
×
1000dm
3
1m
3
where
QE = energy rate (MJ/h) (EnergyRate)
Q
= base-condition volumetric flow rate (m3/h) (QBase)
Base
HV = "in-use" heating value (kJ/dm3) (HeatingValueInUse)
The sign of the energy rate indicates the flow direction: a positive value indicates flow in
the forward direction, a negative value indicates flow in the reverse direction.
The energy rate validity is indicated by the EnergyRateValidity data point TRUE(1)
indicates valid). The energy rate is valid if the base-condition volumetric flow rate is valid
Rosemount Model 3418 GUSM 29

Measurement Operations manual
April 2022 00809-0800-3104
(indicated by QBaseValidity where TRUE(1) indicates valid) and if the in-use gas properties
are valid (indicated by AreGasPropertiesInvalidInUse where FALSE(0) indicates valid).
The energy rate is accumulated into the corresponding direction energy total regardless of
the energy rate validity.
The forward and reverse direction energy totals are each stored in non-volatile memory as
a data pair: a 64-bit unsigned integer portion and a 32-bit floating point fractional portion.
For example, an energy total of 12345.750 MJ is stored as 12345 MJ for the integer portion
and 0.750 MJ as the fractional portion. Note that while the energy rate can be positive
(indicating forward flow) or negative (indicating reverse flow), the energy totals are always
positive values.
The non-volatile energy total data points are as listed in the table below:
Table 4-4: Energy total data points
Forward direction Reverse direction
Integer Fraction Integer Fraction
PosEnergy PosEnergyfrac NegEnergy NegEnergyFrac
4.5.8 Mass rate and totals
The Rosemount 3410 Series Gas Ultrasonic Flow Meter meter calculates the mass rate and
mass totals (forward and reverse).
These calculations requires that the flow-condition pressure and temperature are available
(either fixed or optional analog inputs, Gas properties), the gas composition is available
(either fixed or optionally read from a GC, Gas property data), and the AGA8 calculations
are performed (internally by the meter or externally with the results written to the meter,
Configure Gas Chromatograph parameters).
The mass rate is calculated as shown in Equation 4-15
Equation 4-15: Mass rate
MassRate = mass rate (kg/h) (MassRate)
Q
= flow-condition volumetric flow rate (m3/h) (QFlow)
Flow
ρ
= "in-use" flow-condition gas mass density (kg/m3) (RhoMixFlow)
Flow
The sign of the mass rate indicates the flow direction: a positive value indicates flow in the
forward direction, a negative value indicates flow in the reverse direction.
The mass rate validity is indicated by the MassRateValidity data point (TRUE(1) indicates
valid). The mass rate is valid if the flow-condition volumetric flow rate is valid (indicated by
QFlowValidity where TRUE(1) indicates valid) and if the AGA8 flow-condition calculation is
valid (indicated by AGA8FlowCalcValidity where TRUE(1) indicates valid).
MassRate = Q
Flow
× ρ
Flow
The mass rate is accumulated into the corresponding direction mass total regardless of
the mass rate validity.
The forward and reverse direction mass totals are each stored in non-volatile memory as a
data pair: a 64-bit unsigned integer portion and a 32-bit floating point fractional portion.
30 Emerson.com/Rosemount
 Loading...