

Page 1

Energy Performance Comparison of Fixed Speed, Danfoss VSH 088, and
Mechanically Modulated Compressors When Cooling and Dehumidifying
100% Outdoor Air to 55 F for 8760 Hours per Year in 8 US Cities.
Prepared May 4, 2011
S. A. Mumma, Ph.D., P.E.
Executive Summary: VSH 088 vs. Fixed Speed annual energy consumption
Energy consumption necessary to cool and dehumidify 100% outdoor air (OA) to 55 F
was modeled using hourly US weather data for eight (8) select cities. The three (3)
compressor types simulated included: fixed speed, Danfoss VSH 088 variable speed, and
mechanically modulated.
The VSH 088 performed much more energy efficiently than the fixed speed for all flow
rates and US cities analyzed, and was relatively insensitive to over sizing or geographic
location. Overall for all conditions analyzed, the VSH 088 used 37% less annual energy.
Depending upon air flow rates and location, the energy savings ranged from about 56%
to 19% compared to the fixed speed arrangement.
1
Page 2

Energy Performance Comparison of Fixed Speed, Danfoss VSH 088, and
Mechanically Modulated Compressors When Cooling and Dehumidifying
100% Outdoor Air to 55 F for 8760 Hours per Year in 8 US Cities.
Prepared May 4, 2011
S. A. Mumma, Ph.D., P.E.
Executive Summary:
VSH 088 vs. Mechanically Modulated annual energy consumption
Energy consumption necessary to cool and dehumidify 100% outdoor air (OA) to 55 F
was modeled using hourly US weather data for eight (8) select cities. The three (3)
compressor types simulated included: fixed speed, Danfoss VSH 088 variable speed, and
mechanically modulated.
The VSH 088 performed more energy efficiently than the mechanically modulated for all
flow rates and US cities analyzed. However the VSH displayed significantly better
energy performance compared to the mechanically modulated for oversized applications,
reducing energy use by as much as 50%. In the absence of over sizing, the VSH 088
used between about 10-20% less energy than the mechanical modulating arrangement.
Overall for all conditions analyzed, VSH 088 used 21% less annual energy than the
mechanically modulating.
2
Page 3
Energy Performance Comparison of Fixed Speed, Danfoss VSH 088, and
Mechanically Modulated Compressors When Cooling and Dehumidifying
100% Outdoor Air to 55 F for 8760 Hours per Year in 8 US Cities.
Prepared May 4, 2011
S. A. Mumma, Ph.D., P.E.
Objective
Compare the energy consumed by 3 compressor arrangements when cooling and
dehumidifying 100% outdoor air (OA) for eight selected US cities. The 3 compressor
arrangements included: fixed speed, Danfoss VSH 088 variable speed, and mechanically
modulated.
US Cities selected
The 8 cities selected for analysis include: Chicago IL, Raleigh NC, Denver CO,
Washington DC, Austin TX, Sacramento CA, Long Beach CA and Atlanta GA.
Compressor performance maps
The performance maps for the 3 arrangements are illustrated by the figures below:
Fixed Speed Compr essor s
14,000
12,000
10,000
8,000
6,000
Power in, Watts
4,000
2,000
57,720; 12,940
13,750; 6,470
57,720; 6,470
0
0 20,000 40,000 60,000 80,000 100,000 120,000 140,000 160,000
13,750; 0
Load, Btu/hr
144,300; 12,940
3
Page 4

Danfo ss VSH 0 08 Vari a ble Spe e d
16,000
14,000
12,000
10,000
8,000
6,000
Power in, Watts
4,000
2,000
140,749; 14,232
92,910; 9,294
y = 0. 0946x + 782. 81
4,9444,944
13,750; 2,472
2,472
0
0 20,000 40,000 60,000 80,000 100,000 120,000 140,000 160,000
0
Load, Btu/hr
2
= 0.9974
R
14,000
12,000
10,000
8,000
6,000
Power in, Watts
4,000
2,000
Mechani call y M odul a t ed
137,500; 12,500
54,000; 7,330
y = 0.0656x + 3553.2
13,750; 4,298
0
0 20,000 40,000 60,000 80,000 100,000 120,000 140,000 160,000
Load, Btu/hr
2
= 0. 9975
R
4
Page 5

The equations characterizing the compressor power input vs. load is reflected on the
figures along with the degree of fit R2. The equations were employed in the simulations.
OA Flow Rate Basis for the Selected Cities
The ASHRAE published Dehumidification Design Conditions for the 8 US cities; listed
in the table below, suggest that a common outdoor air (OA) flow rate of 2,000, 1,900, and
1,700 cfm would generally provide loads not exceeding the upper load boundary set by
the mechanically modulated compressor of 137,500 Btu/hr. The exceptions to the flow
range are the 3 dry climates of Denver, Sacramento, and Long Beach. A 4th OA cfm flow
rate was analyzed as follows: Denver, 4,200 cfm, Sacramento and Long Beach each
3,200 cfm.
5
Page 6

location Dehumidification Design conditions, ASHRAE HOF Climate Design Info
0.4% HR Gr MDB h cfm 1% HR Gr MDB h cfm 2% HR Gr MDB h cfm
Chicago 130 84 40.57 1,763 123 82 38.97 1,941 115 80 37.22 2,184
Raleigh 134 82 40.70 1,749 130 81 39.82 1,842 135 80 38.79 1,964
Denver/Boulder 96 69 31.54 3,677 90 68 30.36 4,285 85 68 29.58 4,812
DC/Baltimore 132 83 40.63 1,756 125 81 39.04 1,933 120 80 38.00 2,069
Austin 137 81 40.92 1,727 134 80 40.20 1,801 130 80 39.57 1,870
Sacramento 85 84 33.51 2,972 80 81 31.99 3,488 77 79 31.03 3,917
Long Beach 101 76 34.04 2,827 96 75 33.02 3,121 92 75 32.39 3,336
Atlanta 133 82 40.54 1,765 128 81 39.50 1,878 124 80 38.63 1,984
Note: the cfm OA flow rates presented in the table above are based on a load of 137,500 Btu/hr
6
Page 7

Basis for Uniform Performance Comparisons
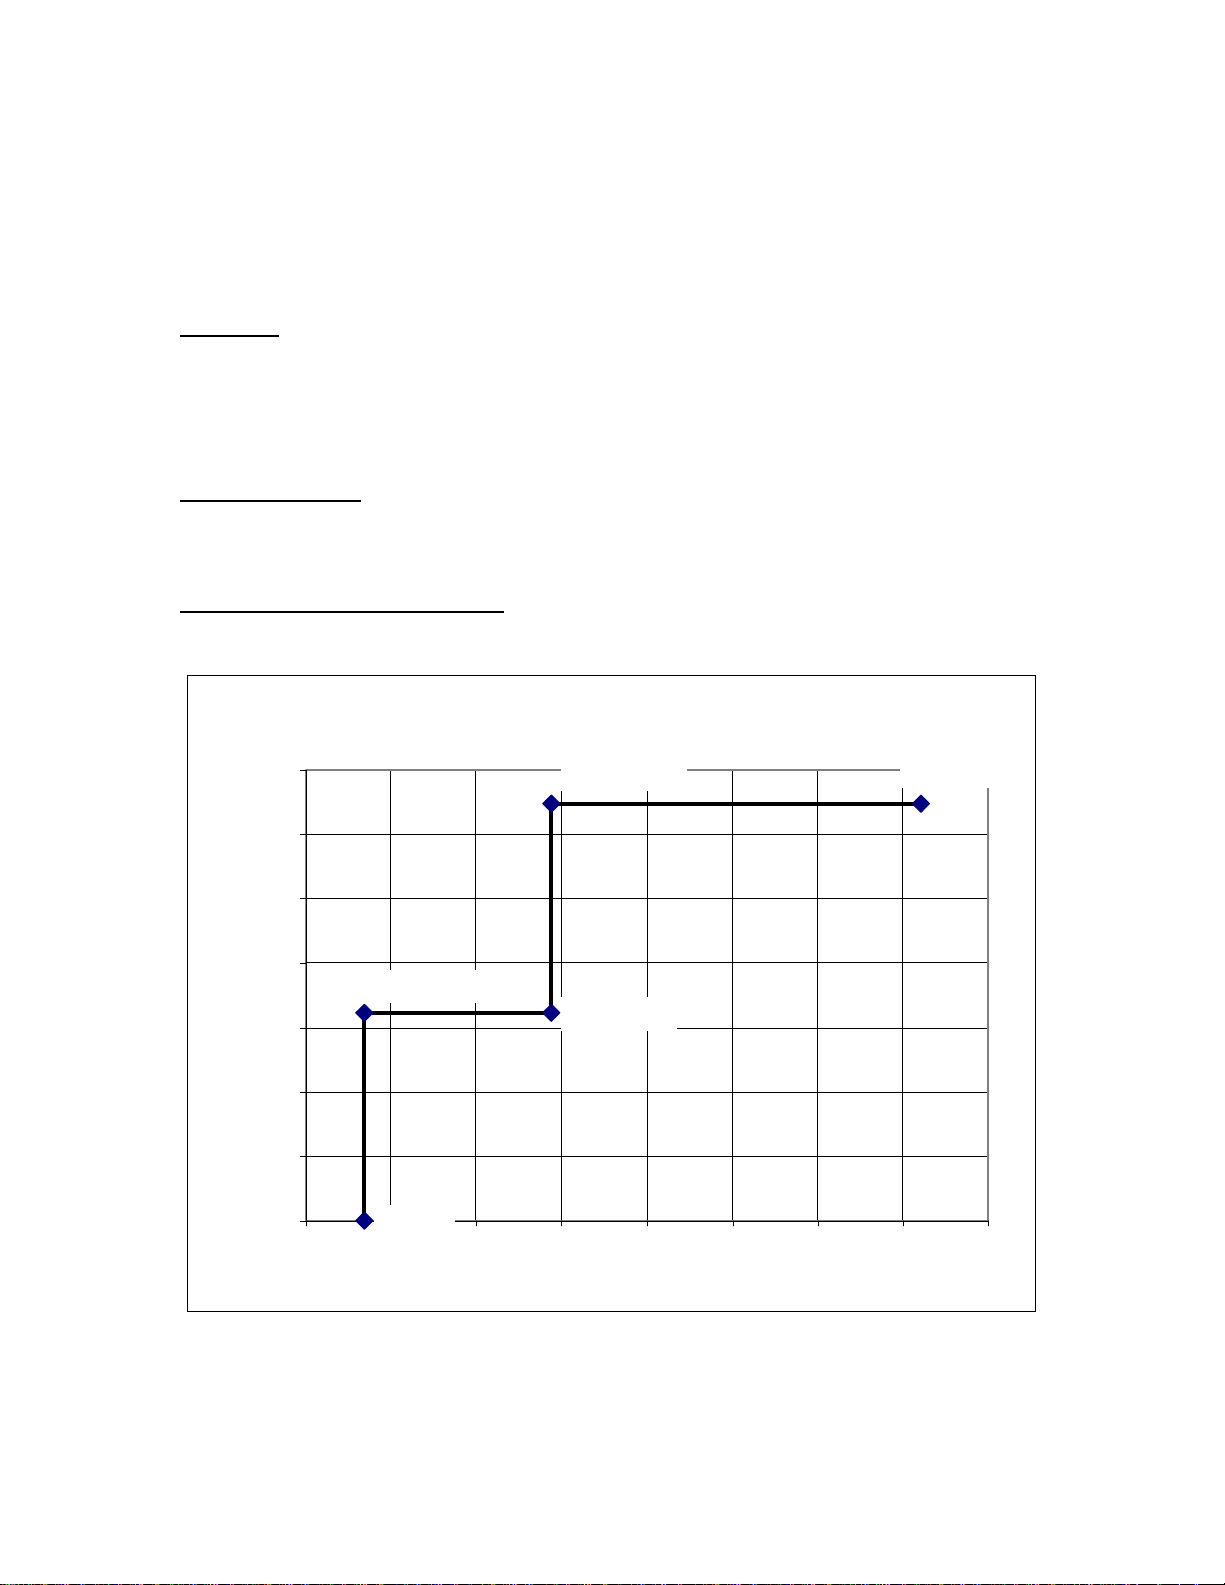
In order to make the energy use comparisons uniformly based, the upper load allowed for
each configuration was 137,500 Btu/hr (mechanically modulated upper limit) even
though both the Danfoss VSH 088 and the fixed speed arrangements had greater peak
capacities. So in the simulations, when a load exceeding 137,500 Btu/hr was
encountered, the load was limited and the power input for 137,500 Btu/hr was used as the
power consumed. To illustrate the limiting load and associated power input, the figure
below shows a case where there were some hours when the required OA load exceeded
137,500 Btu/hr. The simulated load used in the energy analysis was limited; thus limiting
the power input for such high OA enthalpy hours. The figure also shows that the
occurrences of excess load decreased as it approached the worst TMY weather data hour.
By the same token, when the OA flow rate was low for the dry locations of these
simulations, the full capacity of the compressors was never utilized. To correct this, the
additional elevated flow rates for the dry locations were simulated. These events will be
pointed out in the results.
16,000
14,000
12,000
10,000
8,000
6,000
Power in, Watts
4,000
Fixed Speed
2,000
0
0 30,000 60,000 90,000 120,000 150,000 180,000
Load, Btu/hr
VSH 08 8
Mech. Mod.
7
Page 8

Weather Data Used in the Analysis
Typical Meteorological Year (TMY) weather data was used for each of the 8 US cities
analyzed.
Results
The results of the energy simulation are presented in the table below. Columns 2 and 3
present the maximum TMY cooling condition for each location. It should be noted that
the maximum TMY enthalpy (h) for Chicago of 44.03 Btu/lbmDA is noticeably above
even the 0.4% ASHRAE dehumidification Design conditions enthalpy (h) of 40.57
Btu/lbmDA. This difference between the extreme TMY data enthalpy and the ASHRAE
Design conditions occurred for all US Cities. As a result, for all but the 3 dry locations,
even at the 1,700 cfm OA air flow required load (column 7) exceeded the actual load
(column 8) when the capacity limit of 137,500 Btu/hr was imposed. In the 3 dry US
locations, 2,000 cfm was not enough air flow to fully load the compressors. So as noted
above an air flow in excess of 2,000 cfm was simulated and presented. The actual hours
of cooling for the various cities and flow rates are presented in Column 6.
Columns 9, 10, and 11 contain the annual energy consumption for each compressor
arrangement. And columns 12, 13, and 14 present the kW/T performance metric for each
compressor arrangement. The Danfoss VSH 088 compressor energy consumption as a
percentage of the mechanically modulated arrangement is displayed in column 15.
Finally, the energy used by the Danfoss VSH 088 compressor as a percentage of that used
by the fixed speed compressors is presented in column 16.
To facilitate reading the results table, rows for alternate US cities was highlighted. There
is no other significance to the highlighting.
8
Page 9

Column # 1 2 3 4 5 6 7 8 9 10 11 12 13 14 15 16
Cell # @ Req'd Actual VSH 088 VSH 088
location
DB/WB cfm Btu/hr cooling TH TH kWh kWh kWh kW/T kW/T kW/T
Chicago 88/80.3 44.03 2,000 2,621 2,616 13,705 13,594 25,362 16,557 20,000 1.87 1.22 1.47 82.79 65.28
Chicago 1,900 2,598 2,593 12,994 12,932 24,644 15,722 19,397 1.91 1.22 1.50 81.05 63.8
Chicago 1,700 2,556 2,551 11,581 11,566 23,053 14,106 18,172 1.99 1.22 1.57 77.62 61.19
Raleigh 90/79.9 43.56 2,000 3,931 3,926 25,037 24,784 41,861 30,380 33,463 1.69 1.23 1.35 90.79 72.57
Raleigh 1,900 3,908 3,903 23,759 23,637 41,059 29,008 32,479 1.74 1.23 1.37 89.31 70.65
Raleigh 1,700 3,850 3,845 21,195 21,179 39,085 26,066 30,378 1.85 1.23 1.43 85.81 66.69
Denver 75.9/71.9 35.77 4,200 1,173 1,163 5,853 5,760 10,980 7,018 8,670 1.91 1.22 1.51 80.95 63.92
Denver 2,000 919 914 2,580 2,580 6,405 3,071 5,282 2.48 1.19 2.05 58.14 47.95
Denver 1,900 903 898 2,433 2,433 6,218 2,874 5,109 2.56 1.18 2.10 56.25 46.22
Denver 1,700 837 832 2,105 2,105 5,648 2,480 4,817 2.68 1.18 2.29 51.48 43.91
DC/Baltimore 91.9/82.1 46.03 2,000 3,255 3,250 20,517 20,106 33,955 24,631 27,379 1.69 1.23 1.36 89.96 72.54
DC/Baltimore 1,900 3,244 3,239 19,479 19,225 33,333 23,572 26,646 1.73 1.23 1.39 88.46 70.72
DC/Baltimore 1,700 3,180 3,175 17,359 17,290 31,694 21,190 24,896 1.83 1.23 1.44 85.11 66.86
Austin 90/80.1 43.79 2,000 5,743 5,738 44,535 44,041 65,231 53,659 55,061 1.48 1.22 1.25 97.45 82.26
Austin 1,900 5,723 5,718 42,308 42,108 64,273 51,382 53,539 1.53 1.22 1.27 95.97 79.94
Austin 1,700 5,680 5,675 37,855 37,833 62,481 46,401 50,174 1.65 1.23 1.33 92.48 74.26
Sacramento 104/73.8 37.37 3,200 2,674 2,664 14,085 13,948 25,395 17,055 20,442 1.82 1.22 1.47 83.43 67.16
Sacramento 2,000 2,309 2,304 8,472 8,472 19,080 10,444 14,860 2.25 1.23 1.75 70.28 54.74
Sacramento 1,900 2,261 2,256 8,049 8,049 18,614 9,974 14,526 2.31 1.24 1.80 68.66 53.58
Sacramento 1,700 2,173 2,168 7,202 7,202 17,553 9,044 13,859 2.44 1.26 1.92 65.26 51.52
Long Beach 87.1/73.5 37.12 3,200 4,276 4,266 22,483 22,380 41,919 27,480 32,783 1.87 1.23 1.46 83.82 65.55
Long Beach 2,000 3,871 3,866 13,682 13,682 30,525 16,545 24,511 2.23 1.21 1.79 67.50 54.2
Long Beach 1,900 3,814 3,809 12,998 12,998 29,613 15,579 23,972 2.28 1.20 1.84 64.99 52.61
Long Beach 1,700 3,721 3,716 11,630 11,630 27,789 14,030 22,895 2.39 1.21 1.97 61.28 50.49
Atlanta 84/79.4 43.10 2,000 4,282 4,277 27,018 26,887 46,383 33,019 36,366 1.73 1.23 1.35 90.80 71.19
Atlanta 1,900 4,268 4,263 25,652 25,589 45,633 31,467 35,295 1.78 1.23 1.38 89.15 68.96
Atlanta 1,700 4,219 4,214 22,898 22,891 43,782 28,243 32,996 1.91 1.23 1.44 85.60 64.51
max
TMY
max h SA 13,750 Hrs of Cooling cooling
Fixed
speed
VSH
088
Mech.
mod.
Fixed
speed
VSH
088
Mech.
mod.
energy
as %.
Mech
mod
energy
as %..
Fixed
speed
9
 Loading...