

Page 1
Design Guidelines
Hydraulic Fan Drive Systems
www.danfoss.com
Page 2

Design Guidelines
Hydraulic Fan Drive Systems
Revision history Table of revisions
Date Changed Rev
January 2020 Updated Appendix H with new graphs for all frame sizes 0401
July 2018 Appendix H - new graphs for some frame sizes 0303
May 2018 add notes: H1 pumps with fan drive control 0302
April 2017 Updated Appendix H chapter 0301
July 2015 Danfoss layout - Add Appendix I - RDM Fan Drives 0201
2006 - 2013 Various changes. AA up to BC
2 | © Danfoss | January 2020 AB00000019en-000401
Page 3

Design Guidelines
Hydraulic Fan Drive Systems
Contents
Introduction
Abstract................................................................................................................................................................................................5
Overview..............................................................................................................................................................................................5
Principles of Operation...................................................................................................................................................................5
Power Savings ...................................................................................................................................................................................6
Modulation Preferred Over on/off Fan Speed Control....................................................................................................... 6
Fan Drive Design
Design Considerations....................................................................................................................................................................7
Fan Drive Components
Fan Drive Element Selection........................................................................................................................................................ 8
Estimate of Maximum Input Torque to the Pump................................................................................................................8
System Design Parameters
Sizing.................................................................................................................................................................................................. 10
Sizing Equations............................................................................................................................................................................. 12
Equations.....................................................................................................................................................................................12
Variables.......................................................................................................................................................................................12
Axial Flow Fan Power Formula..................................................................................................................................................13
System Design Data Form...........................................................................................................................................................14
Engine details.............................................................................................................................................................................14
Power steering...........................................................................................................................................................................14
Fan information.........................................................................................................................................................................15
Control preference...................................................................................................................................................................15
Reservoir...................................................................................................................................................................................... 15
Fluid...............................................................................................................................................................................................16
Filtration.......................................................................................................................................................................................16
Technical Features.........................................................................................................................................................................17
Shaft Loads and Bearing Life......................................................................................................................................................17
Maximum Pump Speed............................................................................................................................................................... 17
Minimum Pump and Motor Speed..........................................................................................................................................17
Motor Starting Pressure (open circuit motors)....................................................................................................................17
Motor Free Run Pressure.............................................................................................................................................................17
Input Torque Ratings....................................................................................................................................................................18
Pump Drive Conditions................................................................................................................................................................18
Tapered Shaft and Hub Connections......................................................................................................................................18
Pump Suction..................................................................................................................................................................................18
Case Drain Pressure.......................................................................................................................................................................19
Filtration............................................................................................................................................................................................ 19
Operating Temperatures.............................................................................................................................................................19
Fluids.................................................................................................................................................................................................. 19
Mounting.......................................................................................................................................................................................... 20
Axial Thrust Motors....................................................................................................................................................................... 20
Piping................................................................................................................................................................................................. 21
Reservoir............................................................................................................................................................................................21
Cavitation and Aeration Damage.............................................................................................................................................21
Cooling...............................................................................................................................................................................................22
Pressure Protection and Ratings...............................................................................................................................................22
Bearing Life Expectancy...............................................................................................................................................................22
Glossary
Terminology.....................................................................................................................................................................................23
Appendix A-Fan Performance
Fans.....................................................................................................................................................................................................24
Fan Performance............................................................................................................................................................................24
Axial Thrust.......................................................................................................................................................................................25
Fan Laws............................................................................................................................................................................................26
Example 1.................................................................................................................................................................................... 28
Example 2.................................................................................................................................................................................... 28
©
Danfoss | January 2020 AB00000019en-000401 | 3
Page 4

Design Guidelines
Hydraulic Fan Drive Systems
Contents
Example 3.................................................................................................................................................................................... 28
Example 4.................................................................................................................................................................................... 29
Appendix B-Fan Drive Sizing Equations
Fan Drive Sizing Equations and Derivations........................................................................................................................ 30
Hydraulic System Comparisons................................................................................................................................................32
Appendix C-Fan Drive Sizing Equations, using Variable Displacement Motors
Hydraulic Systems with 2 Position, Variable Displacement Motors, Equations and Derivations..................... 34
Spreadsheet to Calculate the Optimum Minimum Displacement for 2 Position Variable Motor.................... 35
Appendix D-Pressure change due to transient flow in a passage
Pressure Change due to Transient Flow in a Passage, Equations and Derivations................................................37
Appendix E-Influence of Bypass Valve Pressure Drop in Open Circuit Systems
Appendix F1-Influence of temperature, pressure and relative humidity on specific weight of air
Influence of Temperature, Pressure and Relative Humidity on Specific Weight of Air........................................ 43
Appendix F2-Influence of Altitude on Atmospheric Pressure
Influence of Altitude on Atmospheric Pressure..................................................................................................................45
Appendix F3-Influence of generic altitude on atmospheric pressure
Influence of Generic Altitude on Atmospheric Pressure................................................................................................. 46
Appendix G-Influence of reversed fan rotation on system performance
Appendix H-System considerations for H1 fan drives with reversed fan rotation
System Considerations for H1 Fan Drives with Reversed Fan Rotation.....................................................................54
Pressure Limiter Adjusting Procedure....................................................................................................................................54
Additional Information concerning the H1 Fan Drive Controller Option..................................................................55
FDC Start and End Current..........................................................................................................................................................55
Operating Envelope for H1 Pumps with Fan Drive Control............................................................................................56
Sensitivity to Prime Mover Speed Changes (Load Sensitivity) - (J Frame as example).........................................63
H1 FDC Response Time (with Typical Fan Drive System Loading)...............................................................................66
Application startup method (to account for PL offset).................................................................................................... 66
Appendix I-System Considerations for RDM Fan Drives
System Considerations for RDM Fan Drives.........................................................................................................................68
Reversing Sequence................................................................................................................................................................ 68
Shift Rate Control......................................................................................................................................................................69
System Considerations...........................................................................................................................................................71
Zero RPM Motor Output.........................................................................................................................................................75
Reference Literature
Open Circuit Axial Piston Pumps..............................................................................................................................................76
Open/Closed Circuit Axial Piston Motors..............................................................................................................................76
Controllers........................................................................................................................................................................................ 76
System Guidelines......................................................................................................................................................................... 76
Closed Circuit Axial Piston Pumps........................................................................................................................................... 76
4 | © Danfoss | January 2020 AB00000019en-000401
Page 5
205
0
200
400
600
800
1000
1200
1400
1600
1800
2000
170(F) 175 180 185 190 195 200
F
an speed (rpm)
Engine temperatur e
9580(C) 85 90
P101 276E
Design Guidelines
Hydraulic Fan Drive Systems
Introduction
Abstract
Fan drive system sizing relies heavily on the input received from the customer. All system sizing
calculations are based on the required fan power @ trim speed data given to the hydraulic system design
engineer. This data is a statement of the fan drive motor shaft power that is required to turn a fan at the
required speed to push, or pull, a required volume of air across coolers/radiators. The usual sequence of
events is:
•
•
•
Overview
One goal of this document is to provide the reader with the equations and formulae needed to size a
hydraulic fan drive, given that they are provided with the following information:
•
•
•
•
The engine manufacturer advises the customer, or cooling system designer, of the heat dissipation
required from the cooling system, charge air cooler etc. This information is combined with the heat
rejection data for any accessories and work functions on the machine (such as : transmission cooler,
hydraulic cooler, and A/C condenser) to determine the maximum heat rejection profile for the
system.
The customer’s cooling pack manufacturer uses this data to size the cooling package and generally
recommends a fan to suit this need, providing the rated fan power, rated fan speed, and the fan
speed and static pressure required to satisfy the cooling needs of the system.
With this information, knowing the minimum engine speed at which maximum fan speed needs to
occur, the hydraulic system designer can size the hydraulic fan drive system.
Rated fan power.
Rated fan speed.
Fan speed required to meet the maximum cooling needs of the cooling system.
Engine speed at which maximum system cooling is required.
This document also provides an explanation of the terms and factors used in the derivation of the sizing
equations. In addition, the reader is provided with recommendations of simple system design solutions
that will help provide a viable system with satisfactory performance.
Principles of Operation
The vehicle’s cooling fan is driven by a hydraulic motor, which in turn, is driven by a hydraulic pump. The
hydraulic pump can be driven directly off of the engine supplied PTO (Power Take Off), or with a belt
drive. An electrically controlled proportional pressure control valve modulates the fan speed depending
on a temperature reading. In a cold condition, the fan idles with very low power consumption. During the
hot condition, the maximum fan speed is controlled by a pressure control valve, which adjusts the fan
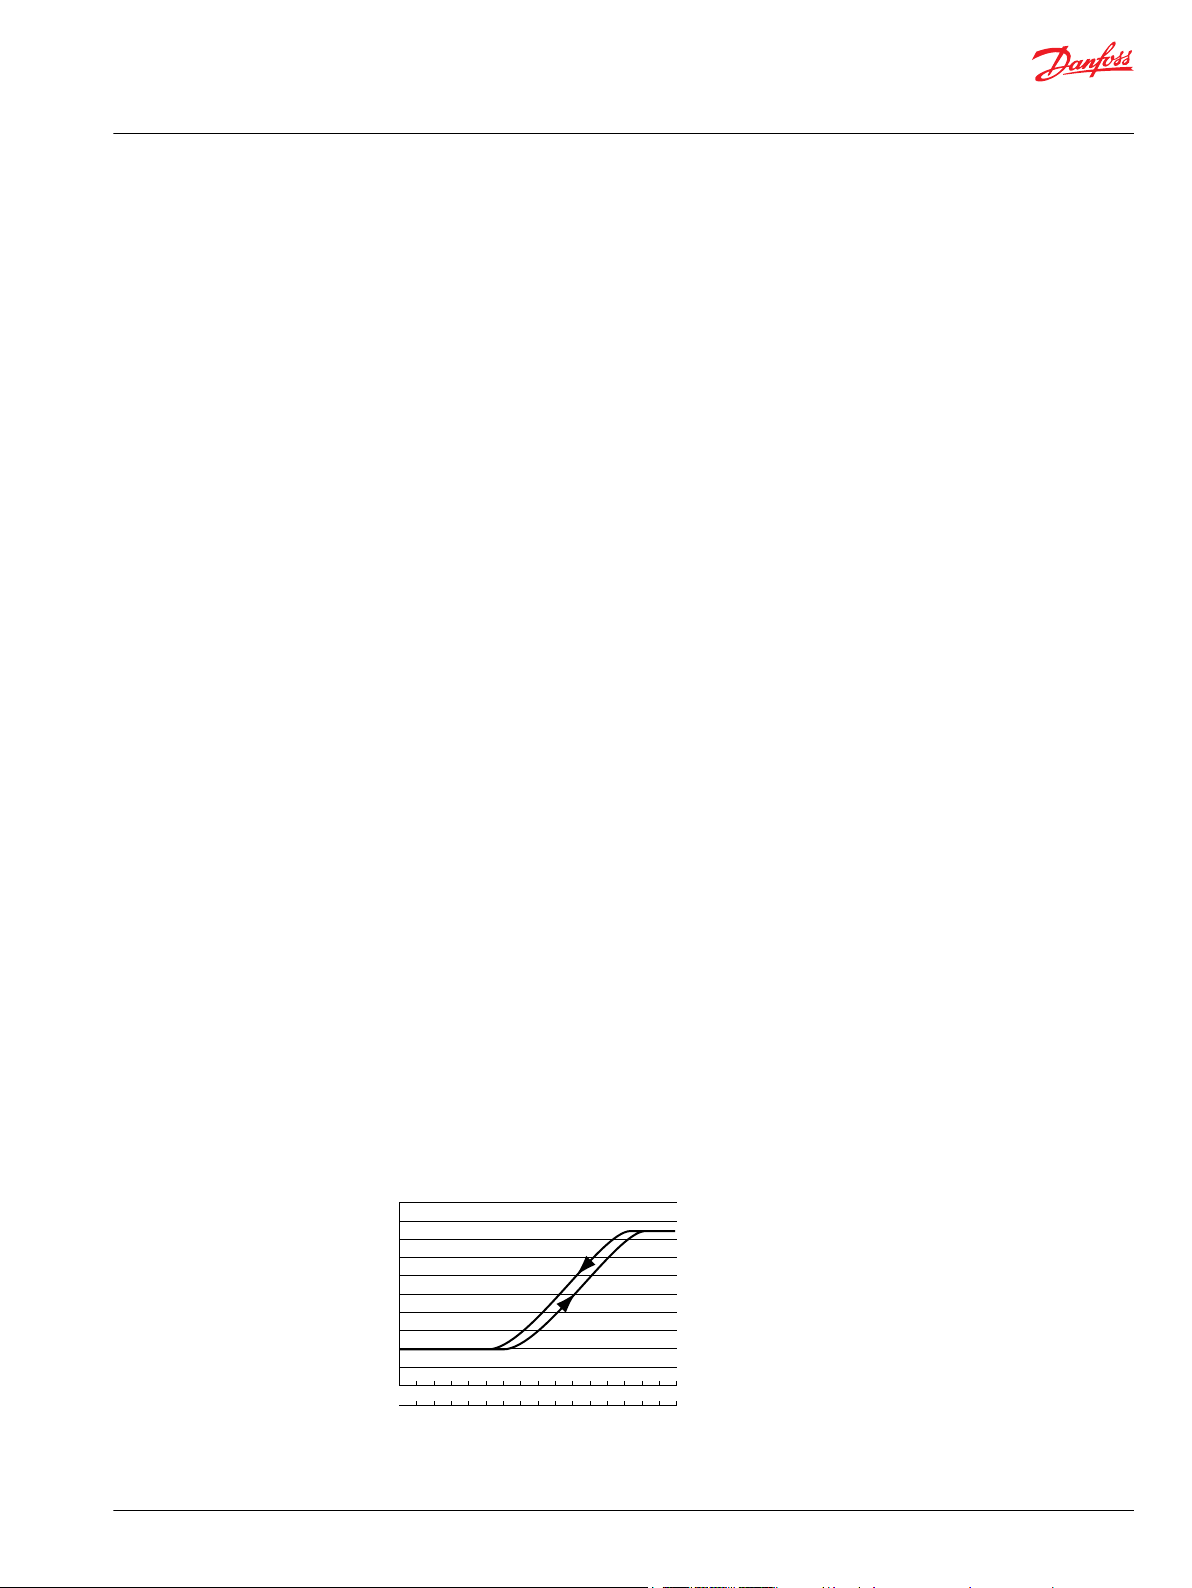
speed to meet the cooling needs of the total system. Every system has a temperature, which allows for
the most efficient performance. The electronic control system, attempts to maintain the coolant at the
optimum design temperature, which the “system integrator” selects during the design phase of the
project.
Fan speed vs engine temperature
To optimize the cooling system operation in various environmental conditions and to minimize parasitic
losses, the Danfoss modulating fan drive system enables the fan cycle to be designed to specific heat
©
Danfoss | January 2020 AB00000019en-000401 | 5
Page 6

Design Guidelines
Hydraulic Fan Drive Systems
Introduction
rejection requirements for a wide range of environmental conditions. Vehicle manufacturers have
complete control of the fan cycle by choosing the appropriate temperature limits.
The Danfoss modulating fan drive system remains at idle speed until conditions require increased fan
speeds. By regulating the pressure drop across the hydraulic motor, modulation of fan speed occurs, and
over-cooling is prevented.
Power Savings
In the fan off condition, the fan may idle at approximately 30% of rated speed, but it will only consume
about 3% of rated power. The Danfoss modulating fan drive system allows the system designer to size
the fan for the engine speed at which maximum heat rejection occurs. The fan speed will remain
essentially constant at all higher engine speeds. Consequently, the fan will not require excessive parasitic
losses as engine speed increases. In systems where the engine speed at maximum heat rejection is 80%
of the governed speed, the power savings compared to over-speeding a mechanically driven fan can be
as high as 95%.
Modulation Preferred Over on/off Fan Speed Control
Fan speed modulation occurs over a temperature range chosen by the system’s designer. This eliminates
the sudden changes in speed that cause dramatic changes in noise levels. Similarly, large accelerations of
components, which may limit the reliability for long-term operation, are eliminated. Modulation also
allows intermediate levels of cooling without unnecessary cycling of the fan between minimum and
maximum speed. The calibration temperature, operating range, and ramp times can be varied
independently by the system designer to achieve the desired level of temperature control.
6 | © Danfoss | January 2020 AB00000019en-000401
Page 7

Design Guidelines
Hydraulic Fan Drive Systems
Fan Drive Design
Design Considerations
•
•
•
•
•
•
Hydraulic fan drive system designers select components for unique combinations of engine, fan, and
application parameters. Do not exchange/change fan system components indiscriminately. Design
factors which determine the selection of the fan drive system for a particular engine, or vehicle, include:
•
•
•
•
•
•
•
Parasitic losses from excessive fan speed are high. Power consumed by a fan is proportional to fan
speed cubed (speed3).
Heat rejection to the atmosphere does not increase linearly with engine speed.
Overheating and/or over cooling the system will result in loss of efficiency and productivity.
Overheating, and/or over cooling the engine can result in increased emissions to the environment.
The proportion of operating time during which full fan speed (maximum fan power) is needed is
typically about 20% and can be as low as 5%.
Mounting the fan directly to the engine requires large fan blade tip clearances due to normal engine
vibration and movement. This leads to loss of fan performance. Mounting the fan directly to a
hydraulic motor can minimize tip clearance and boost fan performance significantly.
Engine set point and maximum heat rejection
Pump rotation
Pump input torque limitations
Maximum applied pressure and speed limits for the individual components
Fit-up and available installation space
Pump support structure requirements for individual engine mounting combinations
Specific engine and accessory temperature control limits
Fan drive element selection
Fan drive Element Design parameter Design flexibility Design champion
Engine & accessories Power, speed, total heat rejection and duty cycle Yes OEM
PTO & Gearing Engine to pump gear ratio Sometimes OEM’s choice of engine
supplier
Pump(s) Displacement, pressure, speed, fixed pump or variable pump, mounting
& drive line
Fan drive control Sensor input(s), control output, number of control elements Yes Danfoss technical
Motor(s) Displacement, pressure, speed, fixed motor or variable motor, mounting
& coupling
Fan(s) Fan rated power @ rated speed, fan diameter, number of blades, blade
pitch, proximity of blades to heat exchanger, direction of air flow
Shroud(s) Type of shroud (flat plate, short duct, venturi), blade axial position in
shroud, tip clearance
Air flow stream(s) Air flow rate & static pressure across heat exchanger(s), maximum
ambient air temperature, minimum atmospheric pressure, hot air
recirculation, baffles, louvres & obstructions
Heat exchangers Physical size, height & width, number of heat exchangers in air flow
stream, side-by-side, axial stack, materials selected, construction,
number and types of tubes, tube configuration, fin density
Yes Danfoss technical
representative, & OEM
representative, & OEM
Yes Danfoss technical
representative, & OEM
Yes OEM & cooling specialists
Yes OEM & cooling specialists
Sometimes OEM & cooling specialists
Yes OEM & cooling specialists
©
Danfoss | January 2020 AB00000019en-000401 | 7
Page 8
Engine speed (rpm )
Fa
n S
peed
(r
pm)
Engine set point
800
1000
1200
1400
1600
1800
2000
2200
600 800 1000 1200 1400 1600 1800 2000 2200
F
a
1
d
n
s
p
e
e
F
a
1
s
p
e
d
n
e
,
h
o
t
o
i
l
Ma
x
.
e
n
g
i
n
e
h
e
a
t
r
e
j
e
c
t
i
o
n
s
pe
e
d
P106 107E
(Fan Trim Speed)
Design Guidelines
Hydraulic Fan Drive Systems
Fan Drive Components
Fan Drive Element Selection
Optimizing the size of fan drive elements depends on selecting the correct components and gear ratios.
By matching these components to the fan power requirements, the required unit sizes can be quickly
determined. The pump and motor displacements, input gear ratios, engine set point, and pressure limits
can be adjusted to provide some optimization of component size. Along with the sizing equations
presented in this article, a Danfoss fan drive sizing computer tool is available to assist with sizing the
hydraulic components.
Many modulating hydraulic fan drives rely on dedicated pumps to provide flow to the fan circuit for
optimum sizing. Other circuits are available that provide additional flow for power assisted steering and
other accessory systems. In these, and many other circuits, the sizing equations and fan drive sizing tool
may still be used to select the required components. Note that the design limits for associated design
elements are not identified in this article. They may be reviewed by referring to the Danfoss technical
information for the components being considered. Machine designers should verify that all design
parameters are met for all drive line components.
While the methods described in this article may be useful, they do not represent the only approach to
sizing hydraulic components. Contact your Danfoss representative if questions of interpretation exist.
Collect the application sizing parameters as identified in the System Design Parameters chapter of this
document. Pay particular attention to the minimum engine speed at which maximum heat rejection to
the atmosphere is required. When sizing the pump for the application, the system designer should
ensure that the engine set point under hot oil condition is less than the engine speed at which maximum
heat rejection occurs. Failure to do this can result in a condition where the cooling system may not
provide adequate cooling when maximum work loading and maximum ambient conditions occur
simultaneously.
Sample graph, performance prediction will vary depending on choice of input parameters.
Estimate of Maximum Input Torque to the Pump
One of the first things that the systems designer should consider is whether the maximum pump torque
needed will exceed the input torque limitation of the pump drive. One way to calculate this is to divide
the fan power requirement by an estimate of the hydraulic system’s overall efficiency and then determine
the input torque requirement at the pump speed that is equivalent to the maximum heat rejection speed
of the engine.
Compare the estimated maximum input torque to the maximum available input torque at the pump
drive; this will determine the design margin that is available to the designer. The hydraulic system
designer should consult with the vehicle system’s designer, and/or the prime mover’s technical support
staff for assistance, if required.
8 | © Danfoss | January 2020 AB00000019en-000401
Page 9

English system
SI system
Pump torque, Tp
(lbf•in)
≈ (lbf • in)
Pfhp
0.7
•
(Ne • R)
(63025)
( )
]
[
Pump torque, Tp
(N•m)
≈ (N•m)
PfkW
0.7
•
(Ne • R)
(9549.0)
(
)
]
[
Where:
Pf
kW
(Ne • R)
R
Ne
0.7
= Max fan power, kW [hp]
= Pump speed, rpm
= Pump/Engine ratio
= Engine speed, rpm
= ηt for hydraulic system (pump and motor)
Tp
(lbf•in)
8.8507
( )
Pump torque, Tp
(N•m)
= (N•m)
Tp
(lbf•in)
12.0
(
)
Pump torque, Tp
(lbf•ft)
= (lbf•ft)
Tp
(N•m)
0.7376 •
Pump torque, Tp
(lbf•ft)
= (lbf•ft)
Tp
(N•m)
8.8507
•Pump torque, Tp
(lbf•in)
= (lbf•in)
Converting terms
Design Guidelines
Hydraulic Fan Drive Systems
Fan Drive Components
©
Danfoss | January 2020 AB00000019en-000401 | 9
Page 10
P106 108E
F
an power (kW
)
Fan speed (RPM)
40
35
30
25
20
15
10
5
0
0
500
1000
1500
2000
2500
Design Guidelines
Hydraulic Fan Drive Systems
System Design Parameters
Sizing
Fan drive system sizing relies heavily on the input received from the customer. All system sizing
calculations are based on the required fan power @ trim speed data given to the hydraulic system design
engineer. This data is a statement of the fan drive motor shaft power that is required to turn a fan at the
required speed to push, or pull, a required volume of air across coolers/radiators. The usual sequence of
events is:
•
•
•
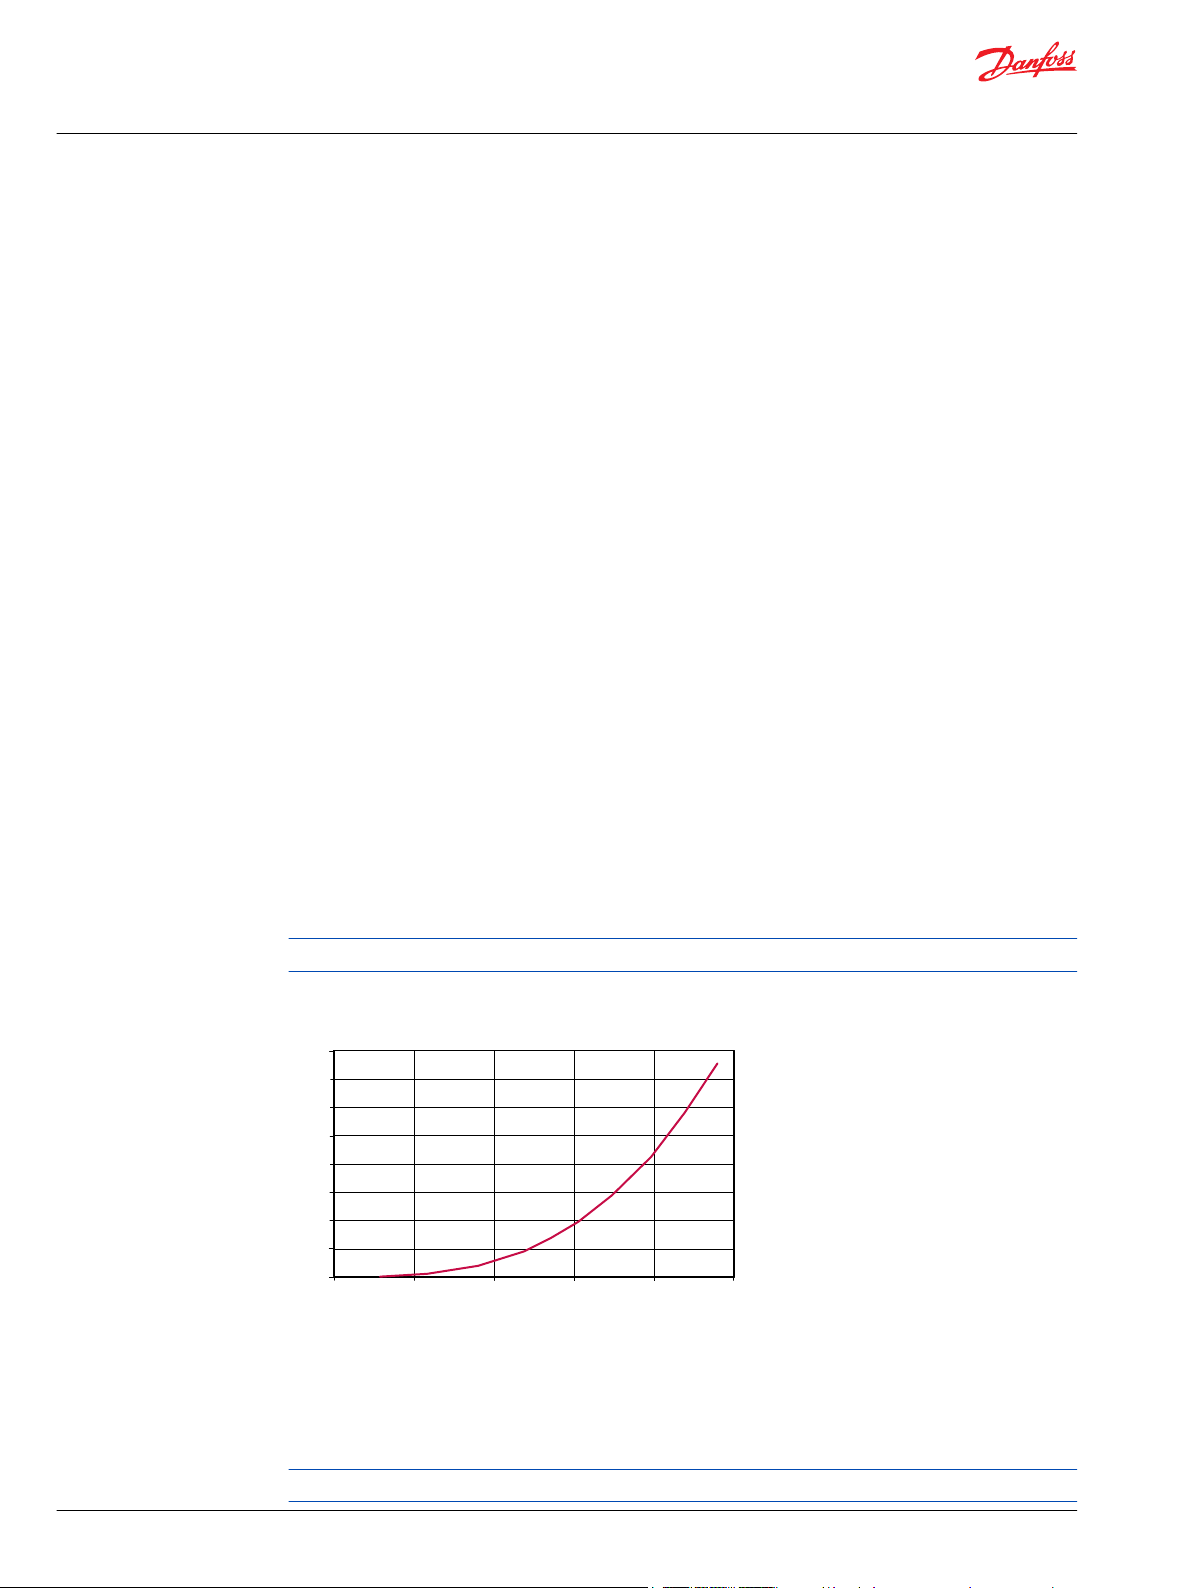
To completely understand any fan drive system is to understand the fan load characteristics. Fans are
unique in that the power to drive the fan changes with the cube of the fan speed, as follows:
Pf=k•(Nf)
Pf1 / Pf2 = (Nf1 / Nf2)
Where:
Pf = fan power (kW, hp)
Nf = fan speed (rpm)
1,2 = subscripts for two different conditions
k = Fan power coefficient
Fan power is defined as the power required to drive the shaft connected to the fan and is equal to the
output power of the motor.
The engine manufacturer advises the customer, or cooling system designer, of the heat dissipation
required from the cooling system, charge air cooler etc. This information is combined with the heat
rejection data for any accessories and work functions on the machine (such as : transmission cooler,
hydraulic cooler, and A/C condenser) to determine the maximum heat rejection profile for the
system.
The customer’s cooling pack manufacturer will then use this data to size the cooling package and will
generally recommend a fan to suit this need, providing the rated fan power, rated fan speed, and the
fan speed required to satisfy the cooling needs of the system.
With this information, knowing the minimum engine speed at which maximum fan speed needs to
occur, the hydraulic system designer can size the hydraulic fan drive system.
3
3
When a given fan speed is doubled; the required power to drive the fan increases by a factor of 8.
Fan power requirements (Example)
Fan rating = 22 kW @ 2000 rpm
10 | © Danfoss | January 2020 AB00000019en-000401
Since fan power is a function of both pressure and flow (fan speed), it follows that the relationship
between fan speed and system pressure is
∆P1 / ∆P2 = (Nf1 / Nf2 )
2
Where: ΔP = delta pressure across the hydraulic motor (bar, psid)
An accurate value of the fan rating is critical to the correct selection of components and their settings.
Page 11
P106 109E
2500
2000
1500
1000
500
0
0
500
1000
1500
2000
2500
System pressure (psi)
System pressure (bar)
Fan speed min-1(rpm)
160 bar
2300 psi
T
h
e
o
r
s
e
t
i
c
a
l
s
y
t
e
m
p
r
e
s
s
u
r
e
E
x
p
e
r
i
m
e
n
t
a
l
s
y
s
t
e
m
p
r
e
s
s
u
e
r
30
60
90
120
150
Design Guidelines
Hydraulic Fan Drive Systems
System Design Parameters
Although the cubic relationship between fan power and fan speed has been consistently verified
experimentally, it is still an approximation of the fan behavior. Therefore, to avoid significant errors in
predicting power requirements, the fan power rating should be taken at a speed representative of typical
fan operation.
For example, for a system in which the fan usually operates in a speed range of 1800-2200 rpm, a fan
rating specified at 2000 rpm will yield more accurate results than a rating specified at, say, 1500 or 2500
rpm.
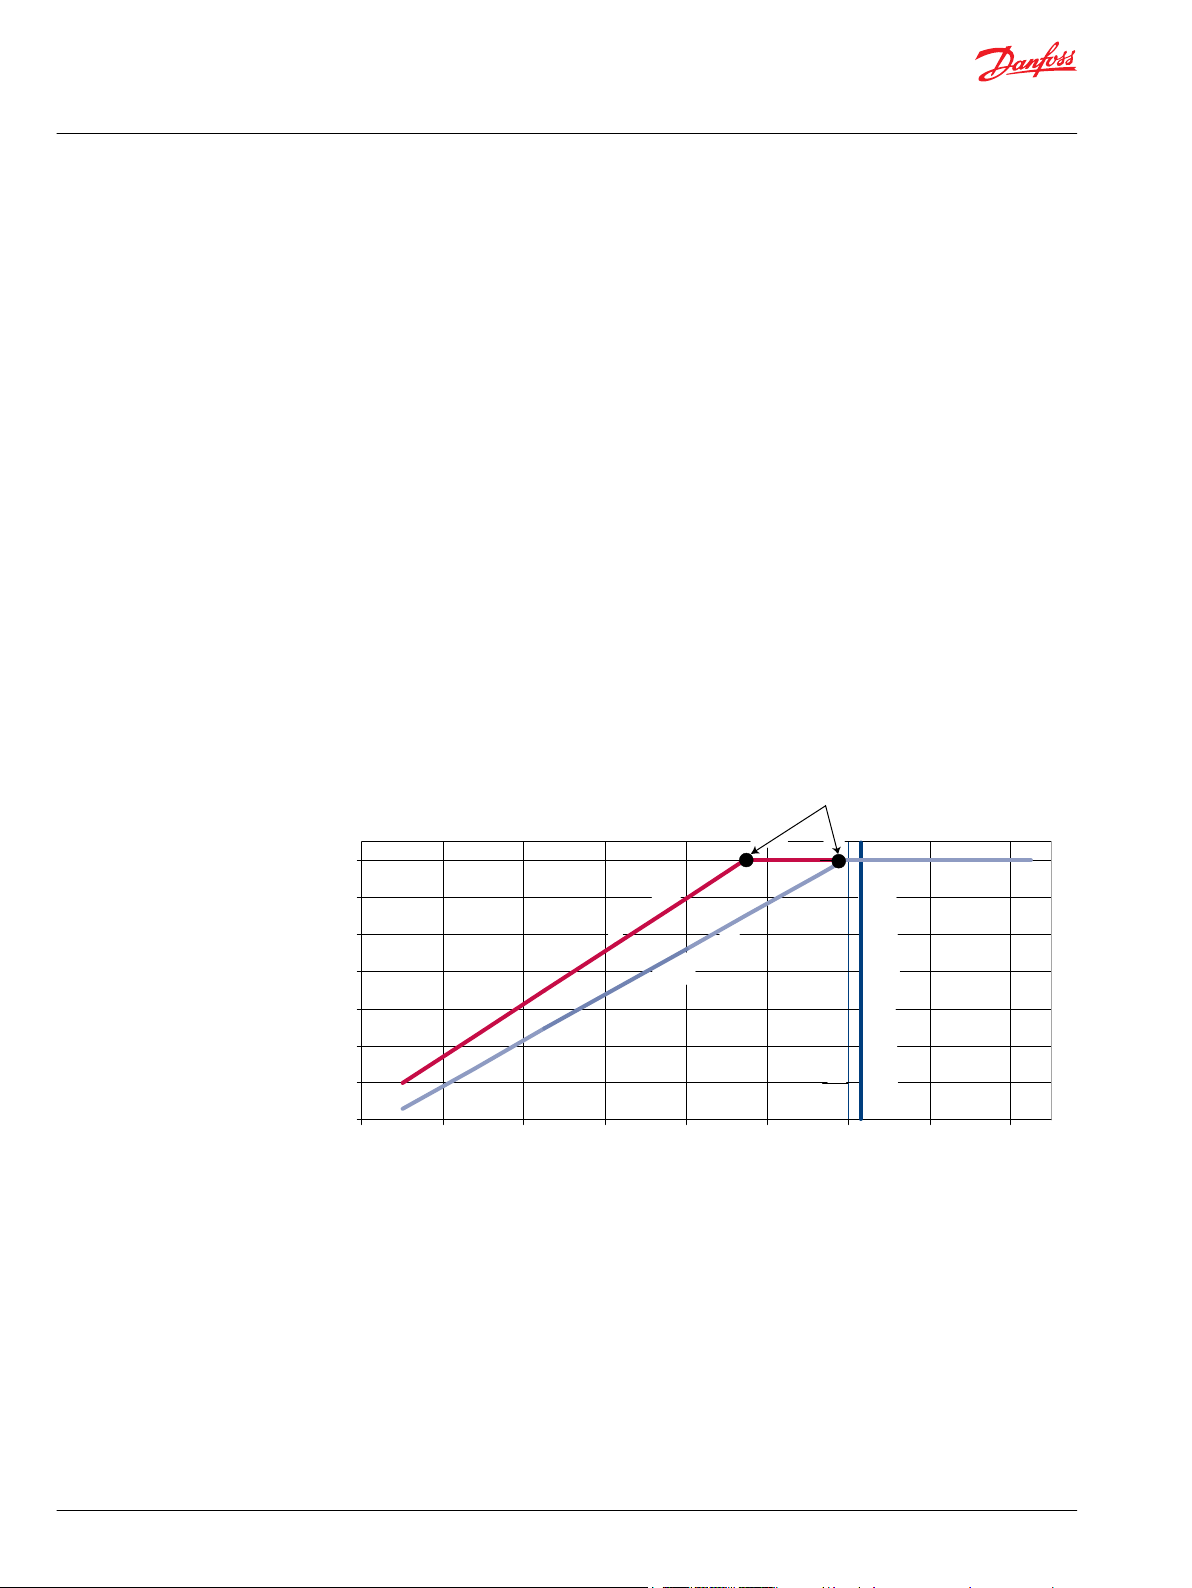
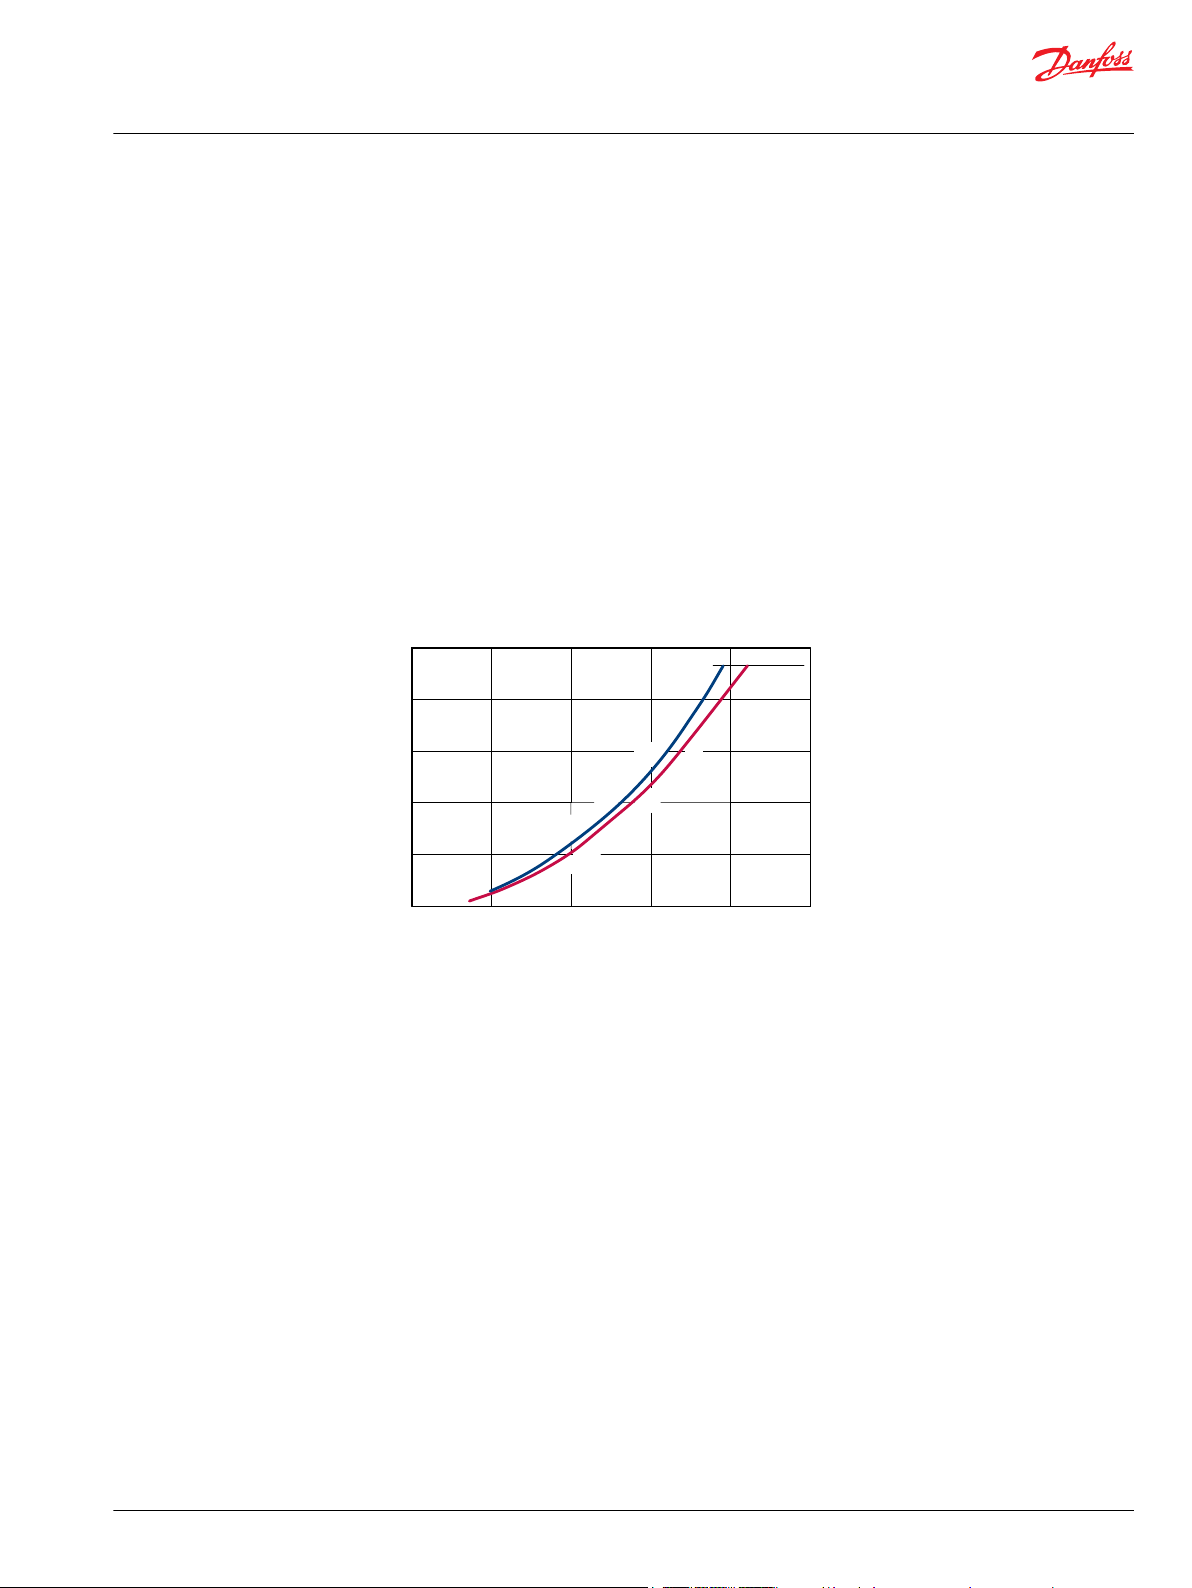
Fan curves provided by the fan manufacturer are often developed under ideal conditions. It is unlikely
that a fan will exhibit exactly the same performance in an actual application (because of: shrouding, heat
exchange airflow characteristics, and air density). Only through test data taken on the actual vehicle can a
fan’s performance characteristics be accurately determined. The curve below illustrates the differences
between predicted performance and actual performance of a fan installed in a vehicle. The system
designer/integrator is encouraged to confirm their performance predictions via test over the entire
operating speed range of the engine, and to refine their prediction model with a revised fan power
coefficient when they rerun the sizing calculations.
Fan power requirements (example)
Fan rating = 22 kW @ 2000 rpm
©
Danfoss | January 2020 AB00000019en-000401 | 11
Page 12
Based on SI units
= (l/min)
Input torque M = (N•m)
Input power P = (kW)
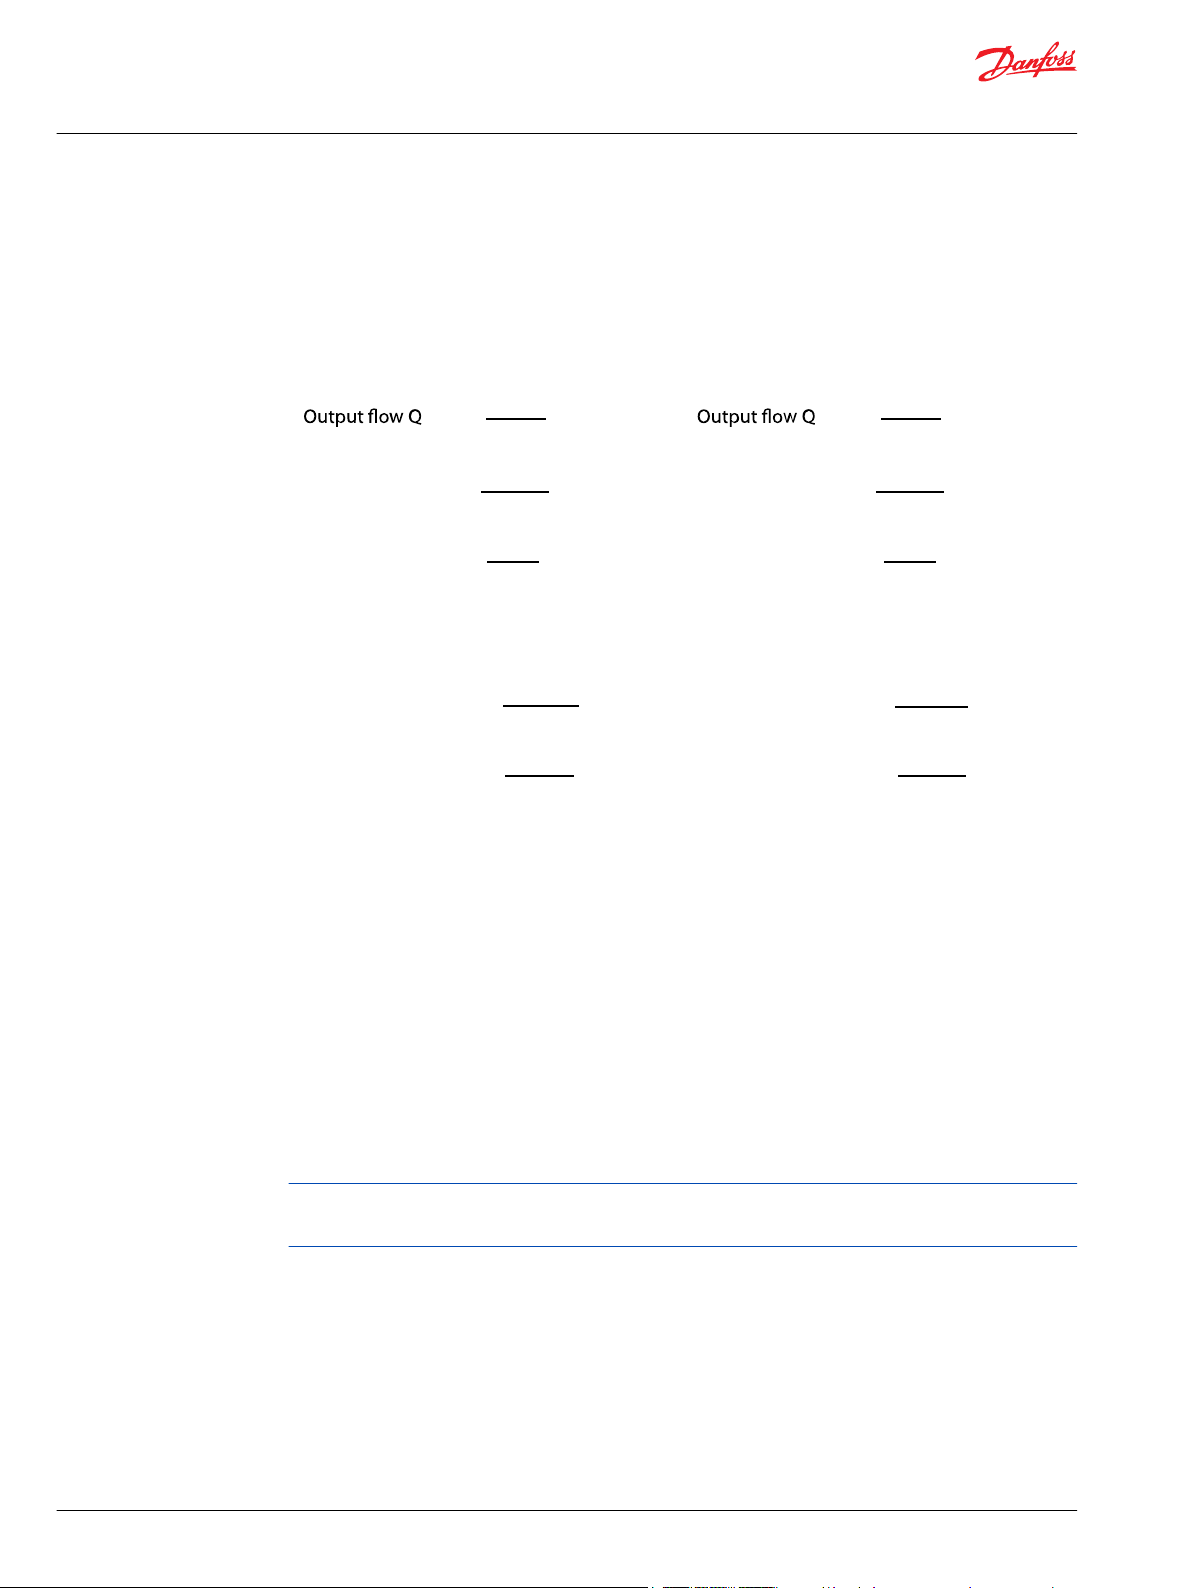
Motors
Based on SI units
Output torque M = (N•m)
Output power P = (kW)
Based on English units
= (US gal/min)
Input torque M = (lbf•in)
Input power P = (hp)
Based on English units
Output torque M = (lbf•in)
Output power P = (hp)
Vg • n • η
v
1000
Vg • ∆p
20 • π • η
m
Vg• n• ∆p
600 000 • η
m
Vg • n • η
v
231
Vg • ∆p
2 • π • η
m
Vg • ∆p • η
m
20 • π
Q • ∆p • ηt
600
Vg • ∆p • η
m
2 • π
Q • ∆p • η
t
1714
Pumps
Vg• n• ∆p
396 000 • η
m
Design Guidelines
Hydraulic Fan Drive Systems
System Design Parameters
Sizing Equations
Equations
Variables
SI units [English units]
Vg = Displacement per revolution cm3/rev [in3/rev]
pO = Outlet pressure bar [psi]
pi = Inlet pressure bar [psi]
∆p = pO - pi (system pressure) bar [psi]
n = Speed min-1 (rpm)
ηv = Volumetric efficiency
ηm = Mechanical efficiency
ηt = Overall efficiency (ηv • ηm)
SI unit formulas are based on cm3, bar, N, N•m, W.
English formulas are based on in3, psi, lbf•in, hp.
12 | © Danfoss | January 2020 AB00000019en-000401
Page 13

(N2)3 • (D2)5 • ν
2
=
(N1)3 • (D1)5 • ν
1
Pf
2
Pf
1
=
Pf
2
Pf
1
r
2
r
1
•
(
N
2
N
1
)
3
•
(
D
2
D
1
)
5
ν
2
ν
1
=
•
(
N
2
N
1
)
3
•
(
D
2
D
1
)
5
V
2
(
D
2
D
1
)
3
•
(
N
2
N
1
)
=
∆P
2
∆P
1
r
2
r
1
•
(
D
2
D
1
)
2
•
(
N
2
N
1
)
2
ν
2
ν
1
=
•
(
D
2
D
1
)
2
•
(
N
2
N
1
)
2
=
•
V
1
•
Design Guidelines
Hydraulic Fan Drive Systems
System Design Parameters
Axial Flow Fan Power Formula
Power to system parameter relationships
Pf1 = Power of fan at known condition #1
Pf2 = Power of fan at condition #2
N1 = Fan speed at condition #1
N2 = Fan speed at condition #2
D1 = Fan diameter at condition #1
D2 = Fan diameter at condition #2
ν1 = Specific weight of air at condition #1
ν2 = Specific weight of air at condition #2
r 1 = Density of air at condition #1
r 2 = Density of air at condition #2
∆P1 = Hydraulic and/or Static Pressure at condition #1
∆P2 = Hydraulic and/or Static Pressure at condition #2
V1 = Flow rate of air at condition #1
V2 = Flow rate of air at condition #2
©
Danfoss | January 2020 AB00000019en-000401 | 13
Page 14
C
L
O
C
K
W
I
S
E
C
O
U
N
T
E
R
C
L
O
C
K
W
I
S
E
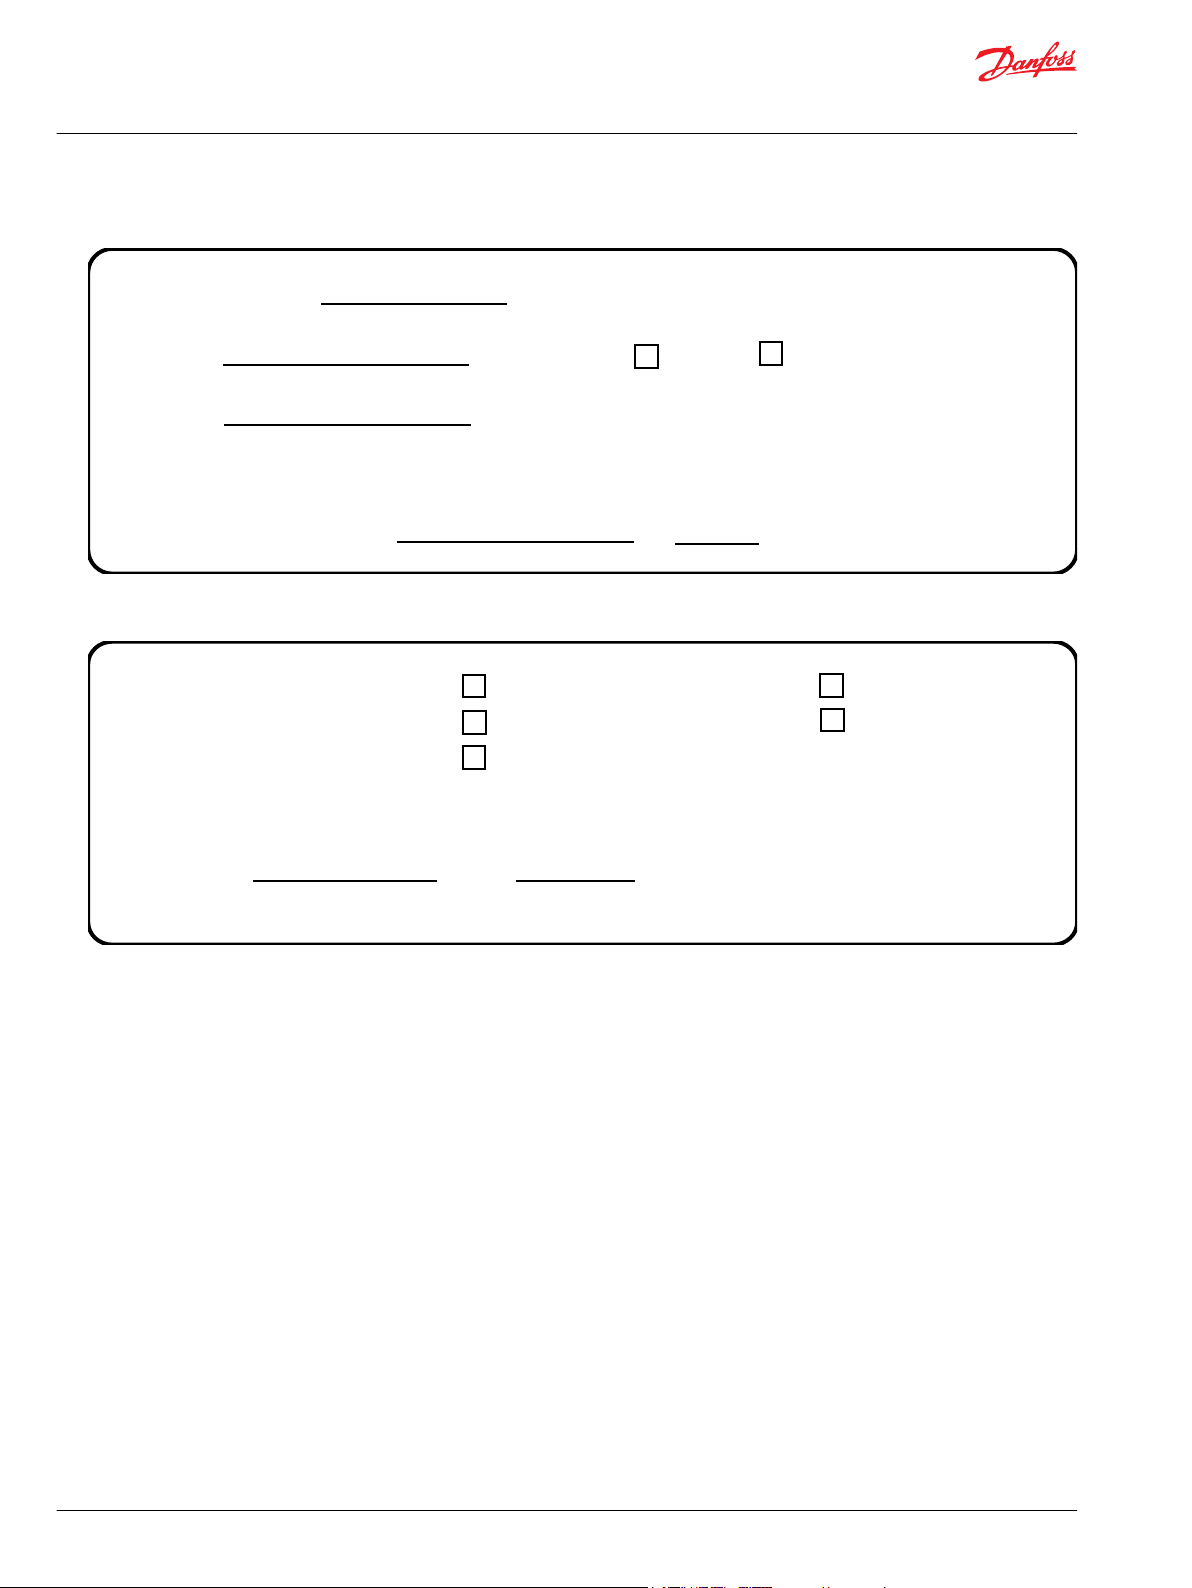
P106110
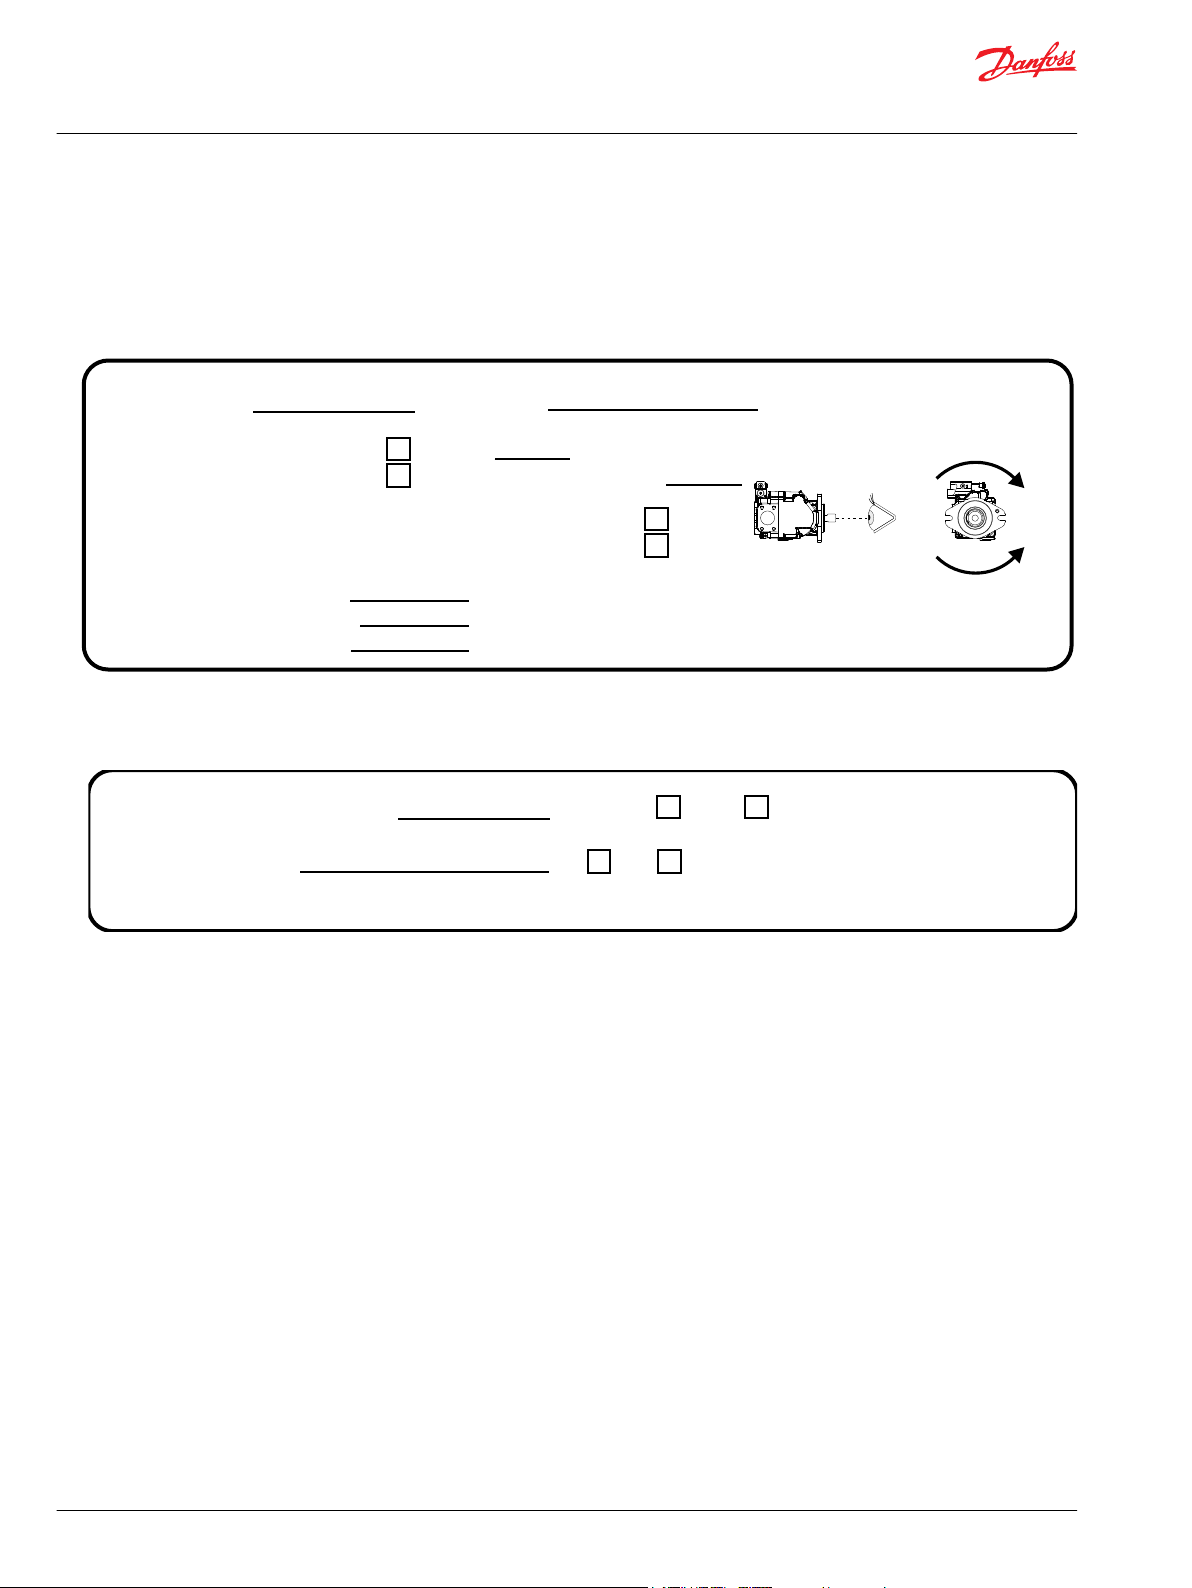
Model or Series
Belt Drive
(engine to pump)
Clockwise, Right hand
Counterclockwise, Anti-clockwise, Left hand
Manufacturer
Pump Drive
Pump Rotation
Speeds
Engine PTO
Ratio
:1
Low Idle
Governed
High Idle
RPM (rated)
RPM (rated)
RPM (max speed)
Input torque
limit:
P104 376E
US gal/min
bar
(maximum)
Controlled Flow Requirement
Steering Pressure
psi
l/min
Design Guidelines
Hydraulic Fan Drive Systems
System Design Parameters
System Design Data Form
Print this form. Fill in all the fields and check the appropriate check boxes. Fax the filled out form to your
Danfoss Power Solutions Technical Sales Representative.
Engine details
Power steering
(if applicable)
14 | © Danfoss | January 2020 AB00000019en-000401
Page 15
C
l
o
c
k
w
i
s
e
C
o
u
n
t
e
r
c
l
o
c
k
w
i
s
e
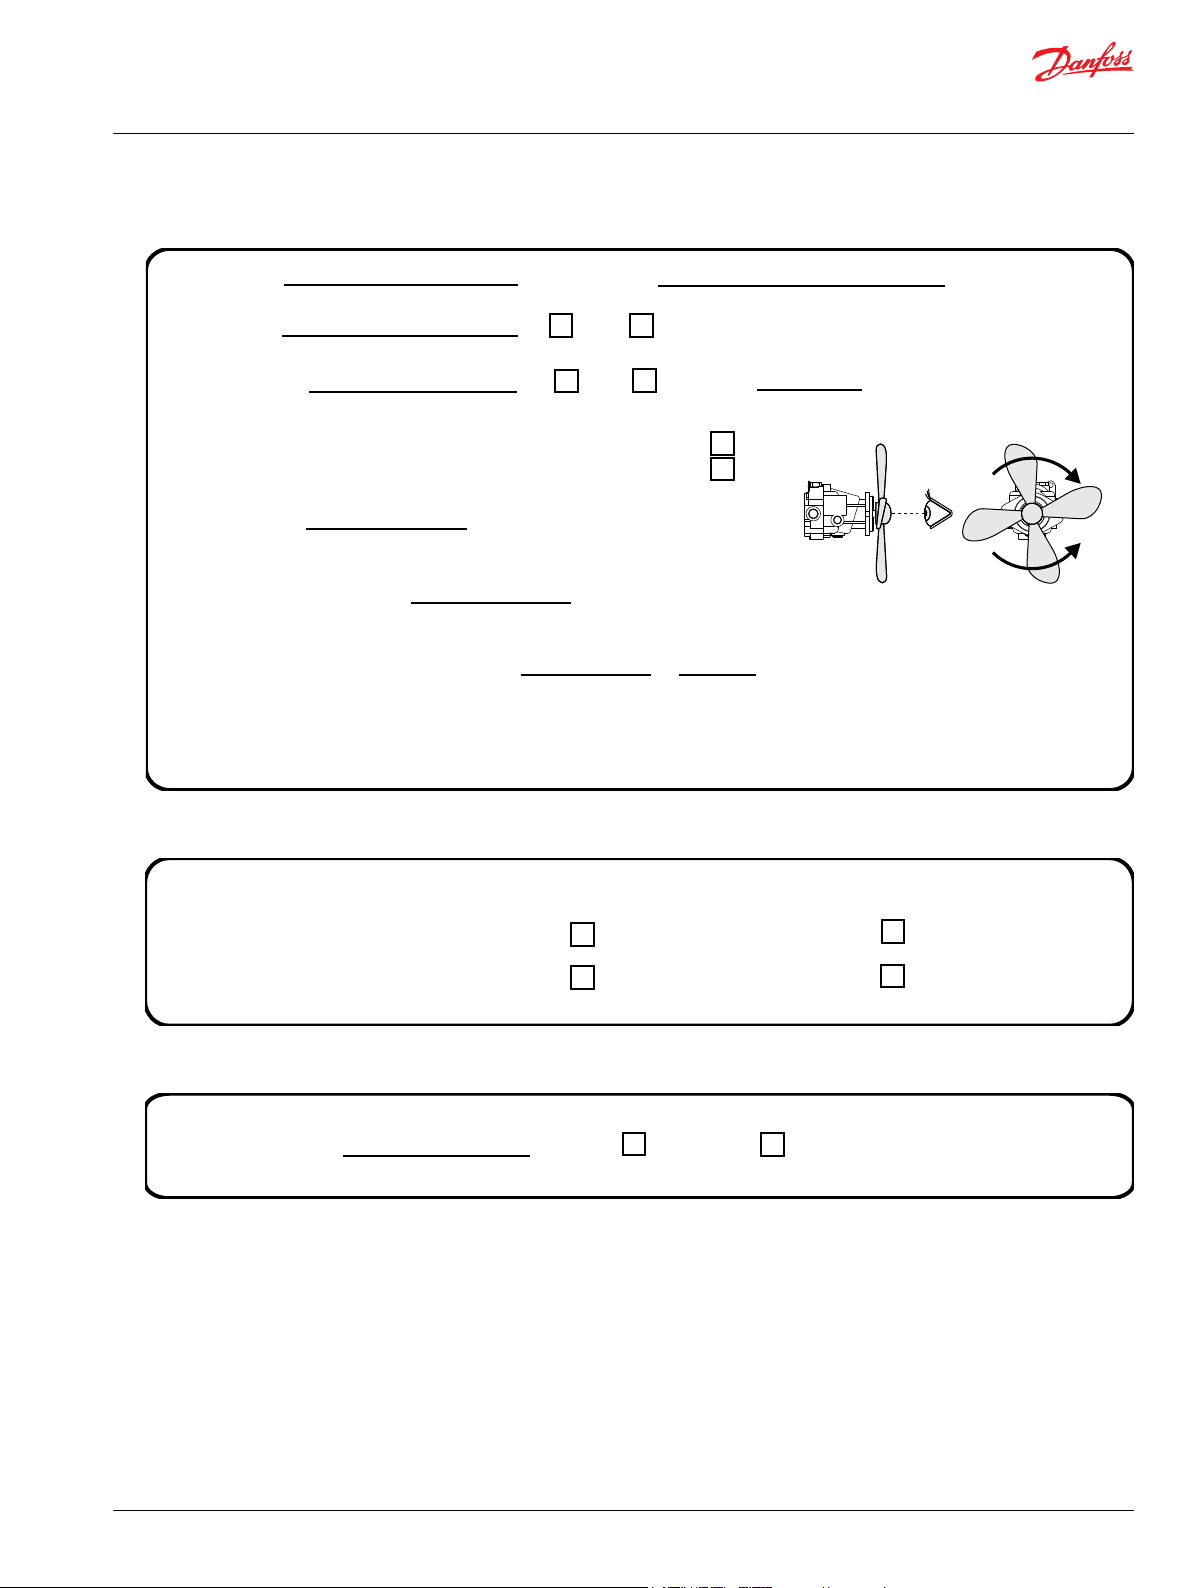
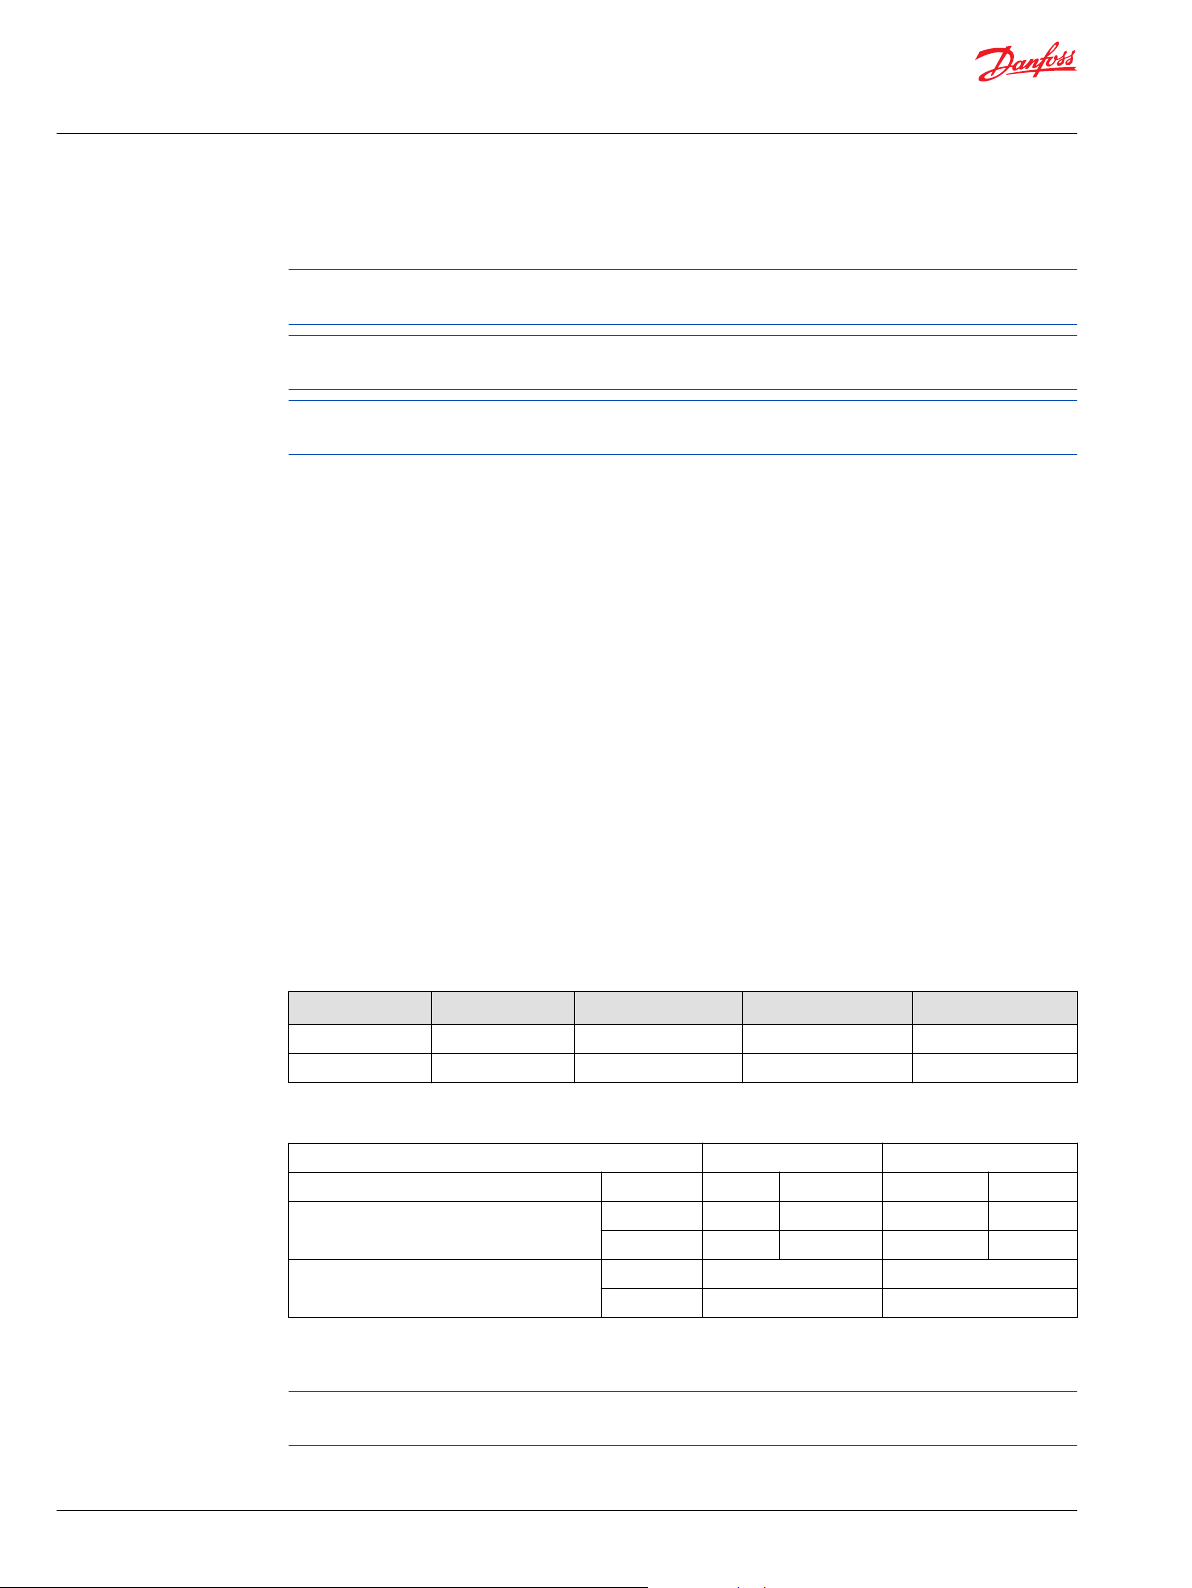
P101 344E
Model or Series
mm
Manufacturer
Fan Diameter
in
At speed
kW
Fan Input Power
HP
rpm
Fan Rotation
(viewed on motor shaft, see illustration)
Clockwise
Counterclockwise
Fan Trim Speed
rpm
Set Point at Fan Trim Speed
(engine speed where max heat load occurs)
rpm
Coolant Temperature at Fan Trim Speed
(coolant temp where max fan speed is required)
°F
°C
Note: To properly size and specify a fan drive system, fan power requirements must be stated as accurately as possible. Fan power requirements
can be determined from fan curves supplied by the manufacturer. Radiator and cooler manufacturers will supply air flow requirements based
on heat loads. Air flow information must include accurate air flow and static pressure to determine correct fan power requirements.
P104 377E
Single Input
Electro-Hydraulic Modulating Electro-Hydraulic ON/OFF
Multiple Inputs
P104 378E
US gal
Reservoir Capacity
liter
Design Guidelines
Hydraulic Fan Drive Systems
System Design Parameters
Fan information
Control preference
Reservoir
©
Danfoss | January 2020 AB00000019en-000401 | 15
Page 16
P104 379E
at 40° C [104°F]
Hydraulic Fluid Type
Viscosity
cSt
Maximum Fluid Temperature
°F
°C
SUS
at 100° C [212°F]
P104 380E
Inlet Line
Filter Position
Pressure Line
(recommended)
Return Line
Filter Rating
Full Flow
Filter Flow
Partial Flow
micron
x ratio
Note: Do not locate the filter cartridge inside the reservoir. This reduces the reservoir capacity and reduces the dwell time (the time the oil
spends in the resrevoir). It also increases the potential for damage to the hydraulic components due to aeration of the oil.
Design Guidelines
Hydraulic Fan Drive Systems
System Design Parameters
Fluid
Filtration
16 | © Danfoss | January 2020 AB00000019en-000401
Page 17

Design Guidelines
Hydraulic Fan Drive Systems
System Design Parameters
Technical Features
In this document, we introduce the equations that are used to size the components of a modulating fan
drive system. In addition to these principles, there are several other factors to consider to ensure that the
hydraulic system performs to expectations. Following are some considerations you are encouraged to
address during the design phase.
Shaft Loads and Bearing Life
For information on shaft loads and bearing life, refer to:
•
•
•
•
Maximum Pump Speed
Pump displacement, and centrifugal filling of the pumping chambers, limit maximum pump speed.
Unless otherwise specified, maximum rated pump speeds are based on operation at sea level with
hydraulic fluids having a specific gravity of 0.9 and a viscosity of 58 SUS (9 cSt) at 180° F (80° C). Speed
limits for a particular application depend on the absolute pressure and oil viscosity. Speed limits for
individual products may be found in their respective technical information bulletins. Consult a Danfoss
representative for operation outside of these published limits.
Series 45 Technical Information 520L0519
Series 40 Motors Technical Information 520L0636
Series 42 Pumps Technical Information 11022637
H1 Pumps Technical Information Manuals (see Reference Literature at the back of this manual)
Minimum Pump and Motor Speed
Volumetric efficiency limits minimum pump speed. If lower than recommended starting or operating
speeds are required, contact a Danfoss representative for assistance. Piston motors are designed for
continuous operation at low speed, and at rated pressure. Motors may be started from zero speed on fan
drives, and torque will increase with speed.
Motor Starting Pressure (open circuit motors)
No-load motor start-up pressures may range from 100 to 725 psid (7 to 50 dbar), depending on
displacement. This property of the motor is dependent on motor design parameters, the CSF (Coefficient
of Static Friction), and it is inversely proportional to motor displacement. For example: The starting
torque for any given motor is largely dependent on the pitch diameter of the pistons and the CSF. Since
torque is dependent on the product of pressure and displacement, and starting torque is essentially
constant for any given frame size; starting pressure will be dependent on displacement, in an inverse
relationship. To minimize starting pressure, select the smallest frame size for the required motor
displacement.
Besides displacement, there are several factors which also effect motor starting pressure. They include:
pressure rise rate (pressure gradient), temperature, fluid viscosity, motor return pressure (back pressure),
fan inertia, pump flow rate, and piece-to-piece variation between motors.
Motor Free Run Pressure
Free run pressure is the minimum delta pressure across the motor that is required to keep the motor
turning when there is no cooling demand. Free run pressure is dependent on motor displacement and
shaft speed.
If the delta pressure across the motor is allowed to fall below the free run pressure; the motor will stop,
and it will be necessary for the motor to go through the starting condition (start-up procedure) when
cooling is needed again. In most applications, it is desirable to initiate fan rotation when the engine starts
and prevent the motor from stopping, while the engine is running.
©
Danfoss | January 2020 AB00000019en-000401 | 17
Page 18

C
Design Guidelines
Hydraulic Fan Drive Systems
System Design Parameters
Input Torque Ratings
When applying pumps in multiple configurations, ensure the input torque limitations are met for each
section and for cumulative sections. Refer to individual product technical information bulletins for
specific product torque limits. Always ensure that any individual pump in a multiple unit does not exceed
its respective torque rating.
Torques in excess of recommended values may cause premature input shaft, or unit, failure.
Pump Drive Conditions
Most Danfoss products are available with SAE and metric, standard spline, tapered key, or cylindrical
keyed drive shafts for direct or indirect drive applications. An intermediate coupling is the preferred
method for direct drives, thereby eliminating radial and axial loading. Direct Drive (or plug-in or rigid)
spline drives can impose severe radial loads on the pump shaft when the mating spline is rigidly
supported. Increased spline clearance does not alleviate this condition. Both concentricity and angular
alignment of shafts are important to pump life. Misalignment can induce excessive side loads on bearings
and seals, causing premature failure.
Overhung load drives (chain, belt, or gear) are permissible. Contact Danfoss for assistance. The allowable
radial shaft loads are a function of the load magnitude, the load position, the load orientation, and the
operating pressure of the hydraulic pump. All external shaft loads will have an effect on bearing life and
may affect pump performance. In applications where external shaft loads cannot be avoided; optimizing
the position, orientation, and magnitude of the radial load can minimize their influence on the pump. A
tapered input shaft is recommended for applications where radial shaft loads are present. (Spline shafts
are not recommended for belt or gear drive applications, the clearance between the mating splines will
prevent accurate alignment of the drive elements and will contribute to excessive wear of the spline.) For
belt drive applications, a spring loaded belt-tensioning device is recommended to avoid excessive radial
loads on the input shaft.
Caution
Note for H1 pump with an FDC: Due to the failsafe functionality of the H1P FDC control the pump will
stroke to max. displacement in case the input signal to the pump control and the Diesel engine will be
switched off at the same time. In this situation a low loop event can occur which may damage the pump.
Therefore, it’s strictly recommended to keep the input signal to the pump control alive while switching
off the engine.
For further information please contact your Danfoss representative
Tapered Shaft and Hub Connections
Tapered shaft/hub connections provide excellent control of both axial and radial position of the drive
coupling or fan assembly. When using the tapered connection, additional effort should be used to insure
that there is adequate axial clamping load between the hub and the shaft. The designer is encouraged to
establish that there is:
Adequate clearance under the bolt/nut to insure full axial load may be applied to the taper without
•
bottoming out.
Adequate clearance between the top of the key and the bottom of the keyway in the hub.
•
Interference between the top of the key and the bottom of the keyway will prevent the hub from
seating onto the taper of the shaft. This will compromise the ability of the shaft to transmit its full
torque capacity, and may result in failure of the shaft.
Pump Suction
For maximum pump life, the inlet pressure should not drop below 0.8 bar absolute [6 in. Hg vac.] at the
pump inlet port.
For cold start conditions, inlet pressure down to 0.6 bar absolute [12 in. Hg vac.] is acceptable for short
durations. The possibility of damage due to fluid cavitation and aeration is proportional to decreases in
18 | © Danfoss | January 2020 AB00000019en-000401
Page 19

C
C
Design Guidelines
Hydraulic Fan Drive Systems
System Design Parameters
inlet pressure. In addition, oil film lubrication may be disrupted by low inlet pressure. These factors, either
singularly or combined, may contribute to a decrease in pump life. Multiple changes in either diameter or
direction can have a significant effect on the resistance to flow in inlet passages and can result in a
substantial increase in the effective length of the inlet line. For this reason, Danfoss recommends that the
inlet line contain a minimum number of adaptor fittings, tees, and elbows; as each are a source of
additional restriction and, potentially, a source of leakage.
Continuous operation with inlet pressures below 0.8 bar absolute [6 in. Hg vac.] can cause premature unit
failure. Ensure adequate flow/pressure head at the pump inlet at all times.
Case Drain Pressure
Maximum pressure limitations for both case drain and inlet passages are available by consulting the
appropriate technical information bulletin for the products being applied. Both line length and diameter
influence the pressure drop of the fluid in these passages as it flows to/from the reservoir. In addition,
both steady state flow velocity and transient conditions, which can accelerate the fluid in these passages,
must be considered when determining their correct size. Of the two design parameters: line length and
diameter, diameter has the most influence on the success of the design. Increasing line diameter can
decrease both the steady state and the transient pressure drops exponentially. For additional information
on steady state pressure drops in hydraulic passages, the reader is encouraged to consult any good text
on basic hydraulic design. For additional information on transient pressure drops, refer to Appendix D.
Introducing additional flow from external sources into these return lines can also result in transient
pressure pulses that may exceed the drain, or case pressure limits of these products. Danfoss
recommends that the bearing drain and case drain lines return directly to the reservoir and remain
dedicated to their intended function without connecting them to additional flow sources.
Caution
Filtration
Operating Temperatures
Fluids
To prevent premature wear, it is imperative that only clean fluid enters the pump and hydraulic circuit. A
filter capable of controlling the fluid cleanliness to class 22/18/13 (per ISO 4406-1999) or better, under
normal operating conditions, is recommended. At initial start up, the system can be at Class 25/22/17 but
should not be run at high speed or pressure until the Class 22/18/13 is achieved through filtration. Since
the filter must be changed at regular intervals, the filter housing should be located in an accessible area.
Appropriate filter change intervals may be determined by test or by gauges indicating excessive pressure
drop across the filter element.
For more information refer to Design Guideline for Hydraulic Fluid Cleanliness, Technical Information
520L0467.
With Buna seals and normal operating conditions, the system temperature should not exceed 82 °C [180
°F] except for short periods to 93 °C [200 °F]. With optional Viton elastomer, the system may be operated
at continuous temperatures up to 107°C [225°F] without damage to the hydraulic components.
Caution
Operation in excess of 107 °C [225 °F] may cause external leakage or premature unit failure.
A mineral based fluid is recommended that includes additives to resist corrosion, oxidation and foaming.
The oil should have a maximum viscosity commensurate with system pressure drop and pump suction
pressures. Since the fluid serves as a system lubricant, as well as transmitting power, careful selection of
the fluid is important for proper operation and satisfactory life of the hydraulic components. Hydraulic
©
Danfoss | January 2020 AB00000019en-000401 | 19
Page 20
Design Guidelines
Hydraulic Fan Drive Systems
System Design Parameters
fluids should be changed at appropriate intervals determined by test, supplier, or by change in color, or
odor, of the fluid.
Every 10°C [18°F] rise in continuous reservoir temperature over 80°C [176 °F] decreases the life of the oil
by ½.
For additional technical information on hydraulic fluids refer to Hydraulic Fluids and Lubricants 520L0463
Technical Information Bulletin and specific product technical bulletins.
For information relating to biodegradable fluids, see Danfoss publication Experience with Biodegradable
Hydraulic Fluids 520L0465 or consult the Danfoss Technical Services Department.
Mounting
The pump mount/drive should be designed to minimize axial and radial loads on the shaft. When using
an indirect (chain, belt, or gear) drive, contact Danfoss to determine permissible load limits and
orientation of the installation.
The motor mount should be designed to position the motor/fan assembly within the shroud for
optimum fan performance and to locate the leading edge of the fan blades relative to the adjacent
surface of the heat exchanger. The support structure should be constructed so that it will be robust
against forces and deflections due to shock and vibration as well as the loads applied to it by the fan and
the hydraulic plumbing that will be connected to the motor.
Axial Thrust Motors
When a fan is directly mounted onto the drive shaft of a hydraulic motor, it imparts both a radial and an
axial thrust load onto the shaft. In general, the weight of the fan is insignificant when compared to the
radial load capacity of the bearings in the motor. But, the axial thrust load must be considered carefully.
Under normal operating conditions, Danfoss motors have adequate axial thrust capacity for most fans
that are applied in the industry, but they do have limitations. It is recommended that the system designer
determine the axial thrust force that will be produced by the fan and compare it to the values listed
below:
Series 40 motors external shaft load limits
Unit M25 M35/44 M46
M
e
T N [lbf] 848 [190] 966 [217] 1078 [242]
N•m [lbf•in] 29 [256] 25 [221] 24 [212]
L and K motors external shaft load limits
Frame L K
Mounting configuration SAE Cartridge SAE Cartridge
Maximum allowable external moment (Me) N•m 7.7 21.7 13.3 37.5
[lbf•in] 68 192 118 332
Maximum allowable thrust load (T) N 750 1100
lbf 169 247
Refer to Appendix-A for equations that will assist in calculating the axial thrust loads from the fan.
Calculated loads should be confirmed by test.
For shaft load limit calculations on Series 90 motors and H1B motors, contact your Danfoss
representative.
20 | © Danfoss | January 2020 AB00000019en-000401
Page 21

Design Guidelines
Hydraulic Fan Drive Systems
System Design Parameters
Piping
The choice of piping size and installation should always be consistent with minimizing maximum fluid
velocity. This will reduce system noise, pressure drops and overheating, thereby adding to cost savings
for the operation of the system. Inlet piping should be designed to prevent continuous pump inlet
pressures below 0.8 bar abs. [6 in. Hg vac.] or 0.6 bar abs. [12 in. Hg vac.] during start-up. When selecting
pipe sizing, recognize pressure drops are related to flow velocity. Danfoss recommends limiting the
maximum average mean flow velocity to 5 m/sec [15 ft/sec.] in pressure lines, and 2.5 m/sec [7 ft/sec.] in
suction lines.
In addition to limiting maximum flow velocity, it is recommended that the designer select the hoses,
fittings and integral valve elements to be compatible with the desired working pressure of the hydraulic
system. The following documents may be used to determine the working pressure ratings for the
respective system elements:
•
•
•
•
SAE J514: for working pressure ratings and fitting installation torques for - O-ring boss fittings/ports
and JIC 37º flared tubing connections
SAE J518: for working pressure ratings and bolt installation torques for SAE code 61 4-Bolt flange
fittings/ports,
SAE J517: for working pressure ratings for SAE hydraulic hose
SAE J1453: for working pressure ratings for flat face O-ring fittings.
Reservoir
The reservoir should be designed to accommodate expected maximum volume exchange during all
system operating modes and to prevent aeration of the fluid as it passes through the reservoir. Return
and inlet lines should be positioned below the reservoir low oil level and be located as far as possible
from each other. A diffuser and a baffle plate located between the pump inlet and return line is desirable
to reduce turbulence and to allow the oil to de-aerate before it re-enters the pump.
Reservoirs must be sized to ensure de-aeration of the oil before it re-enters the pump. For dwell times of
less than 90 seconds, the system designer is encouraged to verify that entrained air (bubbles) are not
included in the oil that is being transmitted from the reservoir to the pump. This may be accomplished by
placing a sight gage into the inlet line between the reservoir and the pump. Placing a variable frequency
strobe light source behind the sight gage will improve the observer’s ability to see air bubbles present in
the fluid as it passes through the inlet line.
Danfoss encourages system designers to locate the reservoir so that the oil level in the reservoir will
remain above the level of the inlet port of the pump under all conditions. By doing this, a positive head is
produced that can offset the effects of line losses and altitude on the inlet pressure available at the pump.
Danfoss also encourages system designers to consider the potential for air to be introduced into the inlet
line within the reservoir via the introduction of a vortex or whirlpool, between the surface of the oil and
the inlet port. One way to discourage a vortex is to locate a baffle between the inlet passage, or suction
strainer, and the surface of the oil. The system designer should consider the design parameters of size
and position for the baffle to ensure that a vortex cannot form if the reservoir attitude is at its extremes,
the oil level is at or below the minimum recommended capacity, or if sloshing occurs due to operation of
the machine.
Cavitation and Aeration Damage
Hydraulic oil used in the majority of systems contains about 10% dissolved air by volume. This air, under
certain conditions of vacuum within the system, is released from the oil causing air bubbles. These
entrained air bubbles collapse if subjected to pressure, and this collapse creates erosion of the adjacent
metal surfaces and degradation of the oil. Because of this, it becomes obvious that the greater the air
content within the oil, or the greater the vacuum in the inlet line, the more severe will be the resultant
damage. The main causes of over-aeration of the oil are air leaks, particularly on the inlet side of the
pump, and flow line restrictions such as inadequate pipe sizes, elbow fittings and sudden changes in flow
passage cross-sectional area. To avoid cavitation problems when using Danfoss pumps and motors, avoid
defects in plumbing and construction, maintain pump inlet pressure and rated speed requirements, and
ensure reservoir size and follow recommended guidelines.
©
Danfoss | January 2020 AB00000019en-000401 | 21
Page 22

C
Design Guidelines
Hydraulic Fan Drive Systems
System Design Parameters
When entrained air entering the pump is pressurized at the pump outlet, it is forced into solution in the
oil as the bubbles collapse. This super-saturated solution of dissolved air and oil will release its air when
the pressure is released. Symptoms of this condition can be observed by oil / foam escaping from the fill
port of the reservoir when the system is shut down.
Cooling
Depending on duty cycle and reservoir/line construction, an oil-cooler may be required. The oil-cooler
size is based on typical power losses in the hydraulic circuit. The oil cooler is usually placed in the return
line to the reservoir.
Pressure Protection and Ratings
The pump, as well as other system components, has pressure limitations. Thus a relief valve, or pressure
limiting device, must be installed in the system, and its setting must be consistent with the product
ratings. Refer to the relevant Danfoss technical bulletins for this information.
Failure to install a relief valve or over-pressure protection may result in premature unit failure.
Caution
Bearing Life Expectancy
All Danfoss piston pumps and motors utilize anti-friction, rolling element bearings, and journal bearings,
which have an oil film maintained at all times between the bearing surfaces. If this oil film is sufficiently
sustained through proper system maintenance and the product’s operating limits are adhered to, a long
bearing life can be expected.
A B10 type life expectancy number is generally associated with rolling element bearings. Bearing life is a
function of speed, system pressure, and other system parameters such as oil viscosity and oil cleanliness.
22 | © Danfoss | January 2020 AB00000019en-000401
Page 23

Design Guidelines
Hydraulic Fan Drive Systems
Glossary
Terminology
Trim speed is the maximum fan speed required at the full-on condition. This is equal to, or greater than,
the fan speed required to meet the maximum cooling needs of the cooling system.
Engine set point is the engine speed at which trim speed should occur, and is provided by the cooling
system designer. This is equal to, or less than, the engine speed at which maximum system cooling is
required.
Fan power at trim is the power that needs to be generated at the motor shaft to drive the fan at trim
speed.
Fan rating is the value by which different types of fans can be compared. Usually designated as X power
@ Y rpm and equates back to an air volume (mass flow rate) that can be moved per minute at the Y rpm.
To assist with the sizing exercise, Danfoss has developed a sizing tool to perform the necessary
calculations. Within the sizing tool, worksheets are provided for both fixed displacement pump/fixed
displacement motor, and variable displacement pump/fixed displacement motor hydraulic systems. The
sizing tool has been provided to your Danfoss representative.
Refer to the data sheets on pages in the System Design Parameters chapter. When the data on these
sheets is complete, calculations can be made to determine the most suitable pump/motor/controller
combination for the application based on:
•
•
•
•
•
•
Pump drive available (torque, shaft, mounting flange, overall space envelope)
System pressure required
Additional flow/pressure required from the pump, (for example: steering flow)
Control type requested by the customer
Limiting operating parameters of the fan drive family products
Fit (space envelope)
Contact your Danfoss representative for a report of the performance prediction generated by the fan
drive sizing tool.
For systems using axial piston pumps, refer to AE Note 2010-02 for sizing calculations. Contact your
Danfoss representative for access to AE Note 2010-02.
©
Danfoss | January 2020 AB00000019en-000401 | 23
Page 24

English system
Theoretical hp = [hp]
ft3
min
( )
•
(Total pressure, [in H20])
(6356)
Theoretical power = [watts]
m3
sec
( )
•
(Total pressure, [Pa],
(1.0)
N
[
]
m2
)
SI system
Design Guidelines
Hydraulic Fan Drive Systems
Appendix A-Fan Performance
Fans
Fans are generally divided into two classifications:
•
•
The typical axial flow fan is commonly referred to as a propeller fan, and is customarily used for free
delivery, or against low resistance. They are usually mounted within a circular ring or shroud with a
circular opening.
Fan Performance
Fan performance is a measure of volume, total pressure, static pressure, speed, power input, mechanical
efficiency, and static efficiency, at a stated density. Some useful definitions are:
Volume delivered by a fan is the number of cubic feet of air per minute (or, cubic meters per second),
expressed at fan inlet conditions.
Total pressure is the rise of pressure from fan inlet to fan outlet.
Velocity pressure is the pressure corresponding to the average velocity, determined from the volume of
airflow at the fan outlet area.
Static pressure is the total pressure diminished by the fan’s velocity pressure. Static pressure is a
measure of the fan’s performance and is reported by the fan manufacturer in their technical literature.
Static pressure is also a measure of the resistance to the flow of air thru the heat exchanger.
Power output is expressed in horsepower (or, kilowatts) and is based on fan volume and fan total
pressure.
Power input is expressed in horsepower (or, kilowatts) and is the measured power delivered to the fan
shaft.
Mechanical efficiency of a fan is the ratio of power output to power input.
Static efficiency of a fan is the mechanical efficiency multiplied by the ratio of static pressure to the total
pressure.
The theoretical power required to move a quantity of air may be determined by the following formula:
Centrifugal or radial flow - in which the air flows radially thru the impeller within a scroll type of
housing
Axial flow - in which the air flows axially thru the impeller within a cylinder or ring.
Pressure and power both vary with air density.
Fan efficiencies may be determined by the following formulae:
24 | © Danfoss | January 2020 AB00000019en-000401
Page 25

English system
ft3
min
•
(Total pressure, [in H20])
(6356.0)
m3
sec
•
(Total pressure, [Pa],
(Power input, [watts])
N
m2
)
SI system
(Horsepower input)
(
)
[ ]
[
]
(
)
English system
ft3
min
•
(Static pressure, [in H20])
(6356.0)
m3
sec
•
(Static pressure, [Pa],
(Power input, [watts])
N
m2
)
SI system
(Horsepower input)
(
)
[ ]
( )
[ ]
English system
ft3
min
•
(Static pressure, [in H20])
(6356.0)
m3
sec
•
(Static pressure, [Pa],
(Power input, [watts])
N
m2
)
SI system
(Horsepower input)
(
)
[ ]
( )
[ ]
Design Guidelines
Hydraulic Fan Drive Systems
Appendix A-Fan Performance
Mechanical efficiency, based on total pressure is applicable for fans operating with high outlet velocity
pressure relative to the static pressure, typical of centrifugal fans.
Axial Thrust
Static efficiency, based on static pressure is applicable to fans with high static pressure relative to the
velocity pressure. Static pressure and static efficiency are used more often than mechanical efficiency and
total pressure. When a fan operates against no resistance, the static efficiency becomes zero and is
meaningless.
Total pressure = static pressure + velocity pressure
Velocity pressure is proportional to air velocity.
©
Danfoss | January 2020 AB00000019en-000401 | 25
Page 26

English system
Velocity pressure =
V
V =
ft
min
4005
)2,
(
[in H20]
[
]
Velocity pressure =
Pa,
N
(V2 • )
SI system
m2
V =
m
sec
2
,
= Density of air,
Kg
m3
[
]
[
]
[ ]
English system
Axial thrust = , [N]
π • Total pressure • (Fan diameter)
2
SI system
Total pressure,
4
Pa,
N
m2
Fan diameter, [m]
Axial thrust =
π • Total pressure • (Fan diameter)
2
Total pressure,
(27.68)•4
Fan diameter, [inches]
[in H20]
[
]
[
]
[
]
, [lbf ]
Design Guidelines
Hydraulic Fan Drive Systems
Appendix A-Fan Performance
Four inches H2O = 1000 Pa
Fan Laws
The performance characteristics of fans of all types follow certain laws, which are useful in predicting the
effect upon performance of certain changes in the conditions of operation, or the size of the equipment
due to limitations of space, power, and/or speed. In the following categories, Q = air flow, and Pres. =
static, velocity, or total pressure. The categories pertaining to fan size apply only to fans, which are
geometrically similar, i.e., those in which all of the dimensions are proportional to some linear dimension
identified as size.
1.
Variation in fan speed:
26 | © Danfoss | January 2020 AB00000019en-000401
Constant air density – Constant system
a.
Q: Varies as fan speed
b.
Pres: Varies as square of fan speed
c.
Power: Varies as cube of fan speed
2.
Variation in fan size:
Constant tip speed – Constant air density
Constant fan proportions – Fixed point of rating
Page 27

Design Guidelines
Hydraulic Fan Drive Systems
Appendix A-Fan Performance
3.
4.
5.
6.
a.
Q: Varies as square of fan diameter
b.
Pres: Remains constant
c.
rpm: Varies inversely as fan diameter
d.
Power: Varies as square of fan diameter
Variation in fan size:
At constant rpm – Constant air density
Constant fan proportions – fixed Point of rating
a.
Q: Varies as cube of fan diameter
b.
Pres: Varies as square of fan diameter
c.
Tip speed: Varies as fan diameter
d.
Power Varies as fifth power of diameter
Variation in air density: (Refer to Appendix F)
Constant volume – Constant system
Fixed fan size – Constant fan speed
a.
Q: Constant
b.
Pres: Varies as density (SI), specific weight (English)
c.
Power: Varies as density (SI), specific weight (English)
Variation in air density: (Refer to Appendix F)
Constant pressure – Constant system
Fixed fan size – Variable fan speed
a.
Q: Varies inversely as square root of density (SI), specific weight (English)
b.
Pres: Constant
c.
rpm: Varies inversely as square root of density (SI), specific weight (English)
d.
Power: Varies inversely as square root of density (SI), specific weight (English)
Variation in air density: (Refer to Appendix F)
Constant weight of air – Constant system
Fixed fan size – Variable fan speed
a.
Q: Varies inversely as density (SI), specific weight (English)
b.
Pres: Varies inversely as density (SI), specific weight (English)
c.
rpm: Varies inversely as density (SI), specific weight (English)
d.
Power: Varies inversely as square of density (SI), specific weight (English)
Fan laws at a glance
Variation in fan speed Variation in fan size Variation in air density
Fan laws Fan law #1 Fan law #2 Fan law #3 Fan law #4 Fan law #5 Fan law #6
Parameters Constant air density &
constant system
Q, Air volume, (flow rate) Varies as fan speed Varies as square of
©
Danfoss | January 2020 AB00000019en-000401 | 27
Constant tip speed &
constant air density
Constant tip
proportions & fixed
point of rating
fan diameter
Constant rpm &
constant air
density
Constant fan
proportions &
fixed point of
rating
Varies as cube of
fan diameter
Constant
volume &
constant
system
Fixed fan size &
constant fan
speed
Constant Varies
Constant
pressure &
constant
system
Fixed fan
size &
variable fan
speed
inversely as
square root
of density or
specific
weight
Constant weight of
air & constant
system
Fixed fan size &
variable fan speed
Varies inversely as
density or specific
weight
Page 28

Design Guidelines
Hydraulic Fan Drive Systems
Appendix A-Fan Performance
Fan laws at a glance (continued)
Variation in fan speed Variation in fan size Variation in air density
Fan laws Fan law #1 Fan law #2 Fan law #3 Fan law #4 Fan law #5 Fan law #6
Pressure Varies as square of fan
speed
rpm Constant Varies inversely as
Power Varies as cube of fan
speed
Tip Speed N/A N/A Varies as fan
Remains constant Varies as square of
fan diameter
Constant Constant Varies
fan diameter
Varies square of fan
diameter
Varies as 5th
power of diameter
diameter
Varies as
density or
specific weight
Varies as
density or
specific weight
Varies inversely
as 4th power of
diameter
N/A
Constant Varies inversely as
density or specific
weight
Varies inversely as
inversely as
square root
of density or
specific
weight
Varies as
inversely as
square root
of density or
specific
weight
density or specific
weight
Varies as inversely
as square of density
or specific weight
Example 1
A fan delivers 12,000 cfm at a static pressure of 1 in. H2O when operating at a speed of 400 rpm and
requires an input of 4 hp. If in the same installation, 15,000 cfm are required, what will be the speed, static
pressure, and power?
Using fan law 1:
Speed = 400 * {15,000/12,000} = 500 rpm
Static pressure = 1 * {500/400}2 = 1.56 in. H2O
Power = 4 * {500/400}3 = 7.81 hp
Example 2
A fan delivers 12,000 cfm at 70 °F and normal barometric pressure (density = 0.075 lb per cubic foot) at a
static pressure of 1 in. H2O when operating at 400 rpm, and requires 4 hp. If the air temperature is
increased to 200 °F (density = 0.0602 lb per cubic foot) and the speed of the fan remains the same, what
will be the static pressure and power?
Using fan law 4:
Static pressure = 1 * {0.0602/0.075} = 0.80 in. H2O
Power = 4 * {0.0602/0.075} = 3.20 hp
Example 3
If the speed of the fan in example 2 is increased to produce a static pressure of 1 in. H2O at 200 °F, as at 70
°F, what will be the speed, capacity, and static power?
Using fan law 5:
Speed = 400 * SQRT {0.0705/0.0602} = 446 rpm
Capacity = 12,000 * SQRT {0.075/0.0602} = 13,392 cfm (measured at 200°F)
Power = 4 * SQRT {0.075/0.0602} = 4.46 hp
28 | © Danfoss | January 2020 AB00000019en-000401
Page 29

Design Guidelines
Hydraulic Fan Drive Systems
Appendix A-Fan Performance
Example 4
If the speed of the fan in the previous examples is increased to deliver the same weight of air (same
cooling capacity) at 200°F as at 70°F, what will be the speed, capacity, static pressure, and power?
Heat transfer is determined by the mass, or weight, of the air presented to the heat exchanger, or
radiator.
Using fan law 6:
Speed = 400 * {0.075/0.0602} = 498 rpm
Capacity = 12,000 * {0.075/0.0602} = 14,945 cfm (measured at 200 F)
Static Pressure = 1 * {0.075/0.0602} = 1.25 in. H2O
Power = 4 * {0.075/0.0602}2 = 6.20 hp
The fan laws may be combined to give other overall values. One useful combination is the product of
Laws 1 and 3, which gives the following relationships:
•
•
•
Capacity (flow rate of air) varies as the ratio of size cubed, times the ratio of the rpm.
Pressure varies as the ratio of size squared, times the ratio of the rpm squared.
Power varies as the ratio of the size to the fifth power, times the ratio of the rpm cubed.
Centrifugal fans produce pressure from two independent sources: from the centrifugal force created by
rotating the enclosed air column, and from the kinetic energy imparted to the air by virtue of its velocity
leaving the impeller. The energy imparted to the air depends on the velocities and is dependent on the
curvature of the fan blades. Therefore, for fans with forward curved blades, the energy per pound of air
rises rapidly with an increase of air delivery. For fans with backward curved blades, the energy per pound
of air may decrease with air delivery (flow rate). For fans with straight blades, the energy per pound of air
is roughly constant, regardless of air delivery (flow rate). A unique characteristic of centrifugal fans is that
the maximum power required by the fan is found at maximum delivery. Or, otherwise stated, the
minimum power required by the fan is found at zero delivery, or under stall conditions.
Axial-flow fans develop none of their static pressure by centrifugal force; all of the static pressure is
derived from the change in velocity in passing thru the impeller and its conversion into static pressure.
They are inherently high velocity fans and are very dependent on the shape of the blade. Since any
particular shape of blade can only be correct for a narrow range of capacity at constant speed, the
performance curves for individual fan blade shapes are unique and vary significantly from manufacturer,
to manufacturer. To absorb energy, the air must be given a tangential motion in passing thru the
impeller; as with the centrifugal fan, the pressure rises generally from free delivery to no delivery, but may
drop significantly when the capacity decreases below a certain volume. The drop in pressure is indicative
that a stall condition occurs and the blades cease to function in the normal manner.
Fan manufacturers generally agree that the tip clearance around the fan’s blades is significant and will
contribute to the performance, delivery, and operating efficiency of the fan. Likewise, the type of shroud
that surrounds the fan, the axial position of the fan within the shroud, and the clearance between the
leading edge of the fan and the cooler can contribute significantly to the performance, operating
efficiency, and noise of operation of the fan. The system designer is advised to consult with both the fan
and cooler manufacturer for these specific design elements for the system under consideration.
©
Danfoss | January 2020 AB00000019en-000401 | 29
Page 30

Pf = Rated fan power, [kW]
Nr = Rated fan speed, [rpm]
Nfr = Fan speed, [rpm]
1. Pf ≡ Cf • Nfr3 ≡ , [kW]
Tfr • Nfr
9549
2. Tfr = , [N•m]
∆P = Pressure drop across hydraulic motor, [bar]
∆P • Dm • ntm
20π
Tfr = Rated fan torque, [N•m]
Dm ≡ Motor displacement,
cm3
rev
Dm = (Motor displacement,
in3
rev
• (2.54
cm
in
)
3
cm3
rev
n
tm
kW
rpm
3
n
vm
n
vp
3. Pf = , [kW]
(∆P • Nf • Dm • ηtm)
(20π •9549)
4. Qm =
Nf • Dm
(1000.0 • ηvm)
L
min
5. Nf • Dm =
(20π • 9549.0)
(∆P • ηtm)
cm
3
min
(Cf • Nf3) •
6. Qm =
(20π •9549.0)
(∆P • ηtm • 1000 • ηvm)
(Cf • Nf3) •
L
min
Re-arranging #5. above,
7. Nf = , [rpm]
(600,000 • Cf)
∆P • Dm • ηtm
√
And also,
8. Qm =
(600,000 • Cf)
∆P • Dm3 • ηtm
√
(1,000 • ηvm)
L
min
Likewise,
9. Dm =
Nf2 • 600,000 • Cf
∆P • n
tm
cm3
rev
[
]
[
]
[
]
[
]
[
]
[
]
[
]
[
]
[ ]
[ ]
[
]
(
),
,
,
,
,
,
10. ∆P =
Cf • Nf2 • 600,000
Dm • η
tm
[ ]
and,
, [bar]
Design Guidelines
Hydraulic Fan Drive Systems
Appendix B-Fan Drive Sizing Equations
Fan Drive Sizing Equations and Derivations
Fan drive sizing equations - SI system
30 | © Danfoss | January 2020 AB00000019en-000401
Page 31

Pf = Rated fan power, [hp]
Nfr = Rated fan speed, [rpm]
Nf = Fan speed, [rpm]
1. Pf ≡ Cf • Nfr3 ≡
Tfr • Nfr
63,025
2. Tfr = , [lbf•in]
∆P = Pressure drop across hydraulic motor, [psid]
∆P • Dm • ηtm
2π
Tfr = Rated fan torque, [lbf • in]
Dm = Motor displacement,
in3
rev
Dm ≡
in3
rev
η
tm
hp
rpm
3
η
vm
η
vp
3. Pf = , [hp]
(∆P • Nf • Dm • ηtm)
(2π • 63025)
4. Qm = , [US gal/min]
Nf • Dm
(231 • ηvm)
5. Nf • Dm =
(2π • 63,025)
(∆P • ηtm)
in
3
min
(Cf • Nf3) •
6. Qm =
(2π • 63,025)
(∆P • ηtm • 231 • ηvm)
(Cf • Nf3) •
Re-arranging #5. above,
7. Nf = , [rpm]
(396,000 • Cf)
∆P • Dm • ηtm
√
And also,
8. Qm = , [US gal/min]
(396,000 • Cf)
∆P • Dm3 • ηtm
√
(231 •ηvw)
[
]
, [
]
[
]
[
]
[ ]
(Motor Displacement,
(2.54
cm3
rev
[
]
)
cm
in
[
]
)
3
, [hp]
, [US gal/min]
,
Likewise,
9. Dm = ,
Nf2 • 396,000 • Cf
∆P • η
tm
in3
[
]
rev
[ ]
10. ∆P = , [psid]
Cf • Nf2 • 396,000
Dm • η
tm
[ ]
and,
Design Guidelines
Hydraulic Fan Drive Systems
Appendix B-Fan Drive Sizing Equations
For charge pump sizing equations, refer to the product specific Technical Information manuals, and
Systems Applications manuals.
Fan drive sizing equations - English system
©
Danfoss | January 2020 AB00000019en-000401 | 31
Page 32

SI system
From equ ation 7,
Nf2 =
(600,000 • Cf)
∆P • Dm • η
tm
Therefore at condition 1:
Nf2 =
(600,000 • Cf)
∆P1 • Dm • η
tm
1
and at condition 2:
Nf2 =
(600,000 • Cf)
∆P2 • Dm • η
tm
2
Then,
Nf
1
Nf
2
2
2
=
∆P
1
∆P
2
Nf2 = Nf
1
• √
∆P
2
∆P
1
English system
From equ ation 7,
Nf2 =
(396,000 • Cf)
∆P • Dm • η
tm
Therefore at condition 1:
Nf2 =
(396,000 • Cf)
∆P1 • Dm • η
tm
1
and at condition 2:
Nf2 =
(396,000 • Cf)
∆P2 • Dm • η
tm
2
Then,
Nf
1
Nf
2
2
2
=
∆P
1
∆P
2
Nf2 = Nf
1
• √
∆P
2
∆P
1
[
]
[
]
[
]
[
]
[
]
[
]
Nf2 = Nf
1
• √
∆P
2
∆P
1
Nf2 = 2000
• = 663 rpm √
310
2822
Nf2 = Nf
1
• √
∆P
2
∆P
1
Nf2 = 663
• = 753 rpm √
400
310
Design Guidelines
Hydraulic Fan Drive Systems
Appendix B-Fan Drive Sizing Equations
For charge pump sizing equations, refer to the product specific Technical Information manuals, and
Systems Applications manuals.
Therefore, comparing equations 7 thru 10 on the previous pages, for any given combination of fan
configuration and motor displacement, there is a unique relationship between system pressure, motor
flow, and motor speed.
Hydraulic System Comparisons
One application of the sizing equations is to use them to relate the fan speed/pressure relationship from
one condition to another.
If the theoretical trim pressure is 2822 psid at a fan speed of 2000 rpm, what is the fan speed at a
minimum standby pressure of 310 psid?
If the minimum standby pressure suddenly changes from 310 psid, to 400 psid, due to the external
circuit, what is the resulting fan speed?
32 | © Danfoss | January 2020 AB00000019en-000401
The graph below illustrates this quadratic relationship between fan system delta pressure and fan speed.
The graph is normalized by dividing the individual operating parameters of pressure and speed by the
trim pressure and trim speed of the fan so that the curve is representative of all fan systems.
Page 33

0.0000
0.2000
0.4000
0.6000
0.8000
1.0000
1.2000
1.4000
1.6000
1.8000
2.0000
0.0000 0.2000 0.4000 0.6000 0.8000 1.0000 1.2000 1.4000 1.6000
Fan speed ratio (dimensionless)
Press.Ratio
y = x
2
Fa
n
pr
essure
ra
tio
,
(dimensionless)
P106 119E
0.0000
0.2000
0.4000
0.6000
0.8000
1.0000
1.2000
1.4000
1.6000
1.8000
2.0000
0.0000 0.2000 0.4000 0.6000 0.8000 1.0000 1.2000 1.4000 1.6000
Fan speed ratio (dimensionless)
Power Ratio
y
3
=
x
Fa
n
po
wer
ra
tio
(dimensionless)
P106 120E
Design Guidelines
Hydraulic Fan Drive Systems
Appendix B-Fan Drive Sizing Equations
Consequently, the curve converges on the coordinates of (1.000, 1.000) for both the fan pressure ratio
and the fan speed ratio.
Pressure ratio vs fan speed ratio
Power ratio vs fan speed ratio
On examination of the curve, one can see:
To increase fan speed 10% above the trim speed we would need to increase the delta pressure across
•
the motor by 21%
To reduce fan speed below 32% of the trim speed we would need to reduce the delta pressure across
•
the motor by more than 90%.
©
Danfoss | January 2020 AB00000019en-000401 | 33
Page 34

SI system
Assume Qm = Qp,
Nf • Dm
η
vm
=
Np • Dp • η
vp
Therefore:
11. Nf =
Np • Dp • ηvp • η
vm
Dm
=
(Ne • R) • Dp • η
vp
• η
vm
Dm
Ne = Engine spee d, rpm (In this case, Ne = engine low idle speed.)
R = Engine-pump gear ratio, no dimension.
Combining e q. 1. and eq. 11.,
12. Pf = Cf • Nf3 =
∆P • Dm • η
tm
600,000
•
Ne • R • Dp • η
vp
• η
vm
Dm
, [kW]
13. Nf =
∆P • Ne • R • Dp • η
tm • ηvp • ηvm
600,000 • Cf
, [rpm]
1/3
14.
Ne • R • Dp • η
vp • ηvm
Dm
Combining equ ation 11 and equ ation 13,
3
∆P • Ne • R • Dp • η
tm • ηvp • ηvm
600,000 • Cf
=
Solving for Dm,
15. Dm =
• (Ne • R • Dp • η
vp • ηvm
)
2
,
∆P •η
tm
600,000 • Cf
1/3
in3
rev
[
]
[
]
[
]
[
]
[
]
[
]
Design Guidelines
Hydraulic Fan Drive Systems
Appendix C-Fan Drive Sizing Equations, using Variable Displacement Motors
Hydraulic Systems with 2 Position, Variable Displacement Motors, Equations and Derivations
Some systems may require additional cooling when the engine is at the low idle speed. A system with a
fixed displacement motor may require additional pump flow to accomplish this. If the pump flow is
limited, there is the possibility of providing additional cooling by utilizing a variable displacement motor
in the hydraulic circuit. For normal operation, the variable displacement motor is held in the maximum
displacement position in order to minimize the operating pressure for any given cooling requirement.
But, when the engine is at the low idle speed, the control system can command the motor to its
minimum displacement position to take full advantage of the flow that is available from the pump. In
both conditions, the fan speed is modulated in response to the temperature of the coolant to satisfy the
cooling needs of the system.
If you would like to determine the optimum minimum displacement for a variable motor, which would
provide the maximum fan speed when, the engine speed is at low idle and the system pressure is at the
trim pressure setting:
The following analysis assumes that the bypass flow around the motor is zero.
SI system
34 | © Danfoss | January 2020 AB00000019en-000401
Page 35

English system
Assume Qm = Qp,
Nf • Dm
η
vm
=
Np • Dp • η
vp
Therefore:
11. Nf =
Nf • Dp • ηvp • η
vm
Dm
=
(Ne • R) • Dp • η
vp
• η
vm
Dm
Ne = Engine spee d, rpm (In this case, Ne = engine low idle speed.)
R = Engine/pump gear ratio, no dimension.
Combining e q. 1. and eq. 11.,
12. Pf = Cf • Nf3 =
∆P • Dm • η
tm
396,000
•
Ne • R • Dp • η
vp
• η
vm
Dm
, [hp]
13. Nf =
∆P • Ne • R • Dp • η
tm • ηvp • ηvm
396,000 • Cf
, [rpm]
1/3
14.
Ne • R • Dp • η
vp • ηvm
Dm
Combining e q. 11. and eq. 13.,
3
∆P • Ne • R • Dp • η
tm • ηvp • ηvm
396,000 • Cf
=
Solving for Dm,
15. Dm =
• (Ne • R • Dp • η
vp • ηvm
)
2
,
∆P •η
tm
396,000 • Cf
1/3
in3
rev
[
]
[
]
[
]
[
]
[ ]
[
]
[
]
Design Guidelines
Hydraulic Fan Drive Systems
Appendix C-Fan Drive Sizing Equations, using Variable Displacement Motors
English system
This is the optimum minimum motor displacement at which the fan speed will be maximum for the given
pump flow at engine idle and at the system’s trim pressure. An ExcelTM spreadsheet has been developed
to calculate the optimum minimum displacement for the variable displacement motor. Consult your
Danfoss representative for assistance.
Spreadsheet to Calculate the Optimum Minimum Displacement for 2 Position Variable Motor
Spreadsheet calculator tool (example)
Rated fan power, hp 40 Input data only in second column:
Rated fan speed, rpm 2400 Optimum displ.
Desired fan trim speed, rpm 2600
Trim pressure, Psig 3205
Motor displ., cc/rev 44
Motor torque eff 90%
Cf = hp_fan/Nf^3 2.89E-09
Engine idle speed, rpm 700
Engine: pump ratio, _:1 1
Pump displ, cc/rev 55
Pump displ, In^3/rev 3.36
Dm =
In^3/rev
1.230
cc/rev
20.15
©
Danfoss | January 2020 AB00000019en-000401 | 35
Page 36

Fan rated power = 40 hp
Fan rated speed = 2400 rpm
0
500
1000
1500
2000
2500
3000
3500
4000
4500
5000
44 42 40 38 36 34 32 30 28 26 24 22 20 18 16 14 12 10 8
Motor displacement, cm³/rev
Mo
tor shaf
t speed
, ( rp m )
Free shaf t speed at eng .idle,RPM
Fan trim speed at max trim press , RPM
Optimum minimum displacemen t
for variable motor is defined at the
intersec tion of the two cur ves.
Fan speed for fan motor operating at maximum
displacement with the pump speed at engine idle .
Fan speed for fan motor operatin g
at optimum displacement with th e
pump speed at engine idle .
P106121
Design Guidelines
Hydraulic Fan Drive Systems
Appendix C-Fan Drive Sizing Equations, using Variable Displacement Motors
Spreadsheet calculator tool (example) (continued)
Motor vol eff 96%
Pump vol eff 96%
This relationship is illustrated in the graph below.
The curve described by the square data points represents the speed of the motor shaft as a function
•
of motor displacement when the pump’s displacement is constant, and the pump’s input speed is at
the engine idle speed.
The curve described by the triangular data points represents the speed of the motor shaft as a
•
function of the fan power coefficient, the trim pressure and the motor’s displacement.
For the system parameters that have been chosen, the optimum minimum motor displacement for
•
the variable motor will be found at the intersection of these two curves.
Variable motor shaft speed vs. displacement
36 | © Danfoss | January 2020 AB00000019en-000401
Page 37

P
1
P
2
d
A
L
P106 118E
∆P = (P1 – P2), psid
a , in/sec
2
Fluid acceleration in L length of conduit
L = 1 ft Length of conduit
A, in
2
Area of conduit
m, lbf-sec2/in
4
Fluid mass within the L length of conduit
S.G. = 0.861
Q = V • A, in3/sec Flow rate (in3/sec = GPM x 3.85)
V, ft/sec
D, in Diameter of the conduit
F, lbf Force
r
g Acceleration of gravity
γ
γ/g = r
t Time interval, seconds
D Pump displa ceme nt
F = ∆P • A, lbf = m • a = rf • Q • V,
∆P • A = rf • Q • V = r •
L • A
t
• V
∆P • A = rf •
L • A
t
•
Q
A
∆P = rf •
L • Q
t • A
and, rf = S.G. • r
H20
(
)
(
)
(
)
Therefore:
∆P =
1.43 E-3
t • d
2
(
)
S.G.
(
)
L
(
)
Q
(
)
, Psid
Design Guidelines
Hydraulic Fan Drive Systems
Appendix D-Pressure change due to transient flow in a passage
Pressure Change due to Transient Flow in a Passage, Equations and Derivations
Flow passage
©
Danfoss | January 2020 AB00000019en-000401 | 37
Page 38

SI system
∆P
L
, = (2.122E - 7) •
S.G. • Q
t • d
2
bar
meter
L
min
L = length, [m]
d = diame ter, [m]
and,
∆P
L
, = (0.2122) •
S.G. • Q
t • d
2
bar
meter
when:
d = diame ter, [mm]
also,
∆P
L
, = (2.122E - 4) •
S.G. • N • D
t • d
2
bar
meter
when:
d = diame ter, [mm]
D = displaceme nt,
cm
3
Rev
∆N
t
, average ac celerationa =
rpm
sec
,
English system
∆P
L
, = (5.4996E - 3) •
S.G. • Q
t • d
2
psid
ft
L = length, [ft]
d = diame ter, [in]
∆P
L
, = (3.7189E - 3) •
Q
t
psid
ft
when:
S.G. = 0.861
∆N
t
, a =
rpm
sec
when:
D = displaceme nt,
in
3
rev
A = 1 in
2
∆P
L
• a, = (2.3808E - 3) •
S.G. • D
d
2
psid
meter
= average ac celeration
(
)
[
]
[ ]
(
)
[
]
(
)
[
]
[
]
[
]
[
]
[
]
[
]
(
)
[
]
(
)
[
]
(
)
N = speed, [rpm]
and,
∆P
L
, = (2.122E - 4) •
S.G. • D • a
d
2
bar
meter
(
)
[
]
when:
d = diame ter, [mm]
D = displaceme nt,
cm
3
Rev
[
]
Design Guidelines
Hydraulic Fan Drive Systems
Appendix D-Pressure change due to transient flow in a passage
38 | © Danfoss | January 2020 AB00000019en-000401
Page 39

Motor
Inlet
Motor
Outlet
Mo
tor
Drain
P103122
PV=
+ δP
V
Q
V
+
δ
V
QM+δ
M
PM= + δP
M
QΣ+ δ
Σ
P
Σ
+δ
Σ
P106 123E
P
V0
P
M0
Design Guidelines
Hydraulic Fan Drive Systems
Appendix E-Influence of Bypass Valve Pressure Drop in Open Circuit Systems
In applications where the system is sized close to the maximum limits of fan speed, motor speed, or
component pressure ratings, it may be necessary to determine the influence of the bypass valve’s
pressure-flow characteristics on the system. In a typical circuit, there will be a rise in pressure across a
component with an increase in flow. This is normal, and the system’s designer is encouraged to check
whether this characteristic will have an adverse effect on the system and its components.
In this section, we will determine the effect of the pressure rise with flow characteristic of the bypass
valve on the change in trim speed of the fan and the trim pressure across the hydraulic motor. In most
pressure regulating valves there is a range of flows where the pressure rise is either linear, or nearly linear,
with increases in flow. This is illustrated below for an electro-hydraulic proportional pressure control.
Adjacent to each of the characteristic curves is a coefficient, which is the nominal slope of each curve.
With this coefficient and other system parameters that are described below: the system designer can
determine the change in trim speed and trim pressure with increases in engine speed above the engine
set point that has been selected.
For the purposes of this derivation, the basic modulating fan drive circuit may be simplified as shown
below:
Basic modulating fan drive circuit
As can be seen in the simplified schematic, all of the pump flow, QS goes thru either the bypass valve, QV,
©
Danfoss | January 2020 AB00000019en-000401 | 39
or the fan motor, QM. At the initial condition for our derivation, the flow thru the bypass valve is zero and
all of the pump flow is passing thru the motor. This is the trim point, when the engine is at the engine set
point. Above the trim point, a portion of the flow will pass thru the motor and the remaining flow will
pass thru the bypass valve. The proportion of the flow going thru each will be determined by the
pressure-flow characteristics of the valve and the pressure-flow relationship of the motor-fan that is
determined by the fan laws.
Page 40

QS0 = QV0 + Q
M0
@t = 0, QV0 = 0.0
\QS0 = Q
M0
\dQS = dQV + dQ
M
QS0 + dQS = Q
V0
+ dQV + QM0 + dQ
M
From the g raph of ∆Pv vs ∆Qv,
PV = P0 + Kp • dQ
V
Kp ≡
From the fan l aws,
∆Pv
∆Qv
,
Q
2
Q
1
,
P
2
P
1
=
2
Therefore, dPm = ,
2
P
0
Q
M0
+ dQ
M
Q
M0
- P
0
dPm ≡ dPV, therefore:
dPV = P0 • ,
2
Q
M0
+ dQ
M
Q
M0
- 1
dP
V
P
0
= ,
2
Q
M0
+ dQ
M
Q
M0
- 1
Expanding the right side of the equ ation,
,
2
1 + 2
dQ
M
Q
M0
- 1
dP
V
P
0
= +
dQ
M
Q
M0
,
2
2
dQ
M
Q
M0
If «
dQ
M
Q
M0
Then,
dP
V
P
0
= , 2
dQ
M
Q
M0
Since, dPV =Kp • dQV = Kp • (dQS - dQM),
Therefore,
Kp
P
0
(dQS - dQM) = 2
dQ
M
Q
MO
,
Expanding,
Kp • dQS = P0 • + Kp • dQM, 2
dQ
M
Q
M0
Kp • dQS = • {2P0 + Kp • QM0},
dQ
M
Q
M0
Then , dQM =
Kp • dQS • Q
M0
(2P0 + Kp • QM0)
,
Therefore, dNM =
dQ
M
D
M
,
Likewise;
(dQV) = (dQS - dQM),
dQV = dQS •
Kp • Q
M0
(2P0 + Kp • QM0)
, 1-
Then ,
dPV = Kp • dQS •
Kp • Q
M0
(2P0 + Kp • QM0)
1-
Summarizing then:
dQ
S
thru the mo tor at the engine set point,
QM0, the mo tor displaceme nt, DM, the
initial trim pressure, P0, and the bypass
we can de termine the inc rease in fan
speed, dNM, above the theo retical trim
speed, NM0.
dNM =
Kp • dQS • Q
M0
DM • (2P0 + Kp • QM0)
Likewise, we can de termine the change
in pressu re across the fan mo tor, dPV, as
shown.
This is valid for dQM ≤ 0.5 • dQ
M0
(
)
(
)
( ) (
)
[
]
(
)
[
[
]
(
)
(
)
(
)
(
)
[ ]
[
]
(
)
(
)
(
)
[
]
[
]
(
)
(
)
{
}
{
}
{
}
{
}
[
]
dPV = Kp • dQS •
Kp • Q
M0
(2P0 + Kp • QM0)
1-
[
]
{
}
N = R • Ne
P
δQ
Σ
δQ
M
δQ
V
Q
M0
Q
P
E
n
g
i
n
e
t
r
i
m
s
pe
e
d
Bypass valve and fan motor flow vs. pump
flow
Design Guidelines
Hydraulic Fan Drive Systems
Appendix E-Influence of Bypass Valve Pressure Drop in Open Circuit Systems
40 | © Danfoss | January 2020 AB00000019en-000401
Page 41

40
50
60
70
80
90
100
110
120
130
140
150
160
170
180
190
200
210
220
230
240
250
260
270
0 10 2 0 30 40 50 60 70
Bypass Flow (l/min)
K
P
Y
=
1
.
0
0
K
0
P
W
=
1
.
0
K
P
U
=
0
.
9
3
K
=
0
.
8
1
P
S
7
K
7
P
Q
=
0
.
6
K
=
0
.
5
8
P
O
K
P
M
=
0
.
5
3
K
=
P
I
0
.
5
2
K
P
F
=
0
.
3
8
P106 124E
D
Pr
essure (bar)
Design Guidelines
Hydraulic Fan Drive Systems
Appendix E-Influence of Bypass Valve Pressure Drop in Open Circuit Systems
Pressure vs. flow diagram for Comatrol PRV10 valve identification
Y, W, U, etc. - Refer to electro-hydraulic proportional valve nomenclature code in 520L0588 Comatrol
Cartridge Valves Technical Information.
©
Danfoss | January 2020 AB00000019en-000401 | 41
Page 42

40
50
60
70
80
90
100
110
120
130
140
150
160
170
180
190
200
210
220
230
240
250
260
270
0 10 20 30 40 50 60
70
80
90
100
Bypass Flow (l/min)
P106 125E
K
=
0
.
4
7
5
P
W
K
=
0
.
2
1
3
P
M
K
=
0
.
2
1
3
P
O
Pr
essure (bar)
K
=
0
.
4
0
0
P
U
K
=
0
.
3
7
5
P
S
K
=
0
.
2
5
0
P
Q
K
=
0
.
2
0
0
P
I
K
=
0
.
1
2
5
P
F
Design Guidelines
Hydraulic Fan Drive Systems
Appendix E-Influence of Bypass Valve Pressure Drop in Open Circuit Systems
Pressure vs. flow diagram for Comatrol PRV12 valve identification
W, U, S, etc. - Refer to electro-hydraulic proportional valve nomenclature code in 520L0588 Comatrol
Cartridge Valves Technical Information.
42 | © Danfoss | January 2020 AB00000019en-000401
Page 43

0
1
2
3
4
5
0 50 100 150
Ambientt emperature, ºF
Satur
ated
va
por
pr
essur
e,
In.
Hg
P106 155E
Design Guidelines
Hydraulic Fan Drive Systems
Appendix F1-Influence of temperature, pressure and relative humidity on specific weight of air
Influence of Temperature, Pressure and Relative Humidity on Specific Weight of Air
Where:
ν = Specific Weight of Air, lbf/ft3
P = Standard Barometric Pressure, in Hg
RH = Relative Humidity, (%/100)
Pvs = Saturation Water-Vapor Pressure, in Hg
T = Temperature, °F
H = Altitude, ft.
Standard barometric pressure varies with altitude
P = (1.34955E-8)H2 - (1.07145E-3)H + 29.92, In. Hg
Accurate within +0.0/- 0.5 In. Hg from - 1000 to 15000 ft
Saturated water vapor pressure vs ambient temperature, ºF
y = 4E-06x3 - 0.0005x2 + 0.0343x - 0.5782
Temperature, vs pressure (in. Hg)
Temp., ºF Pvs, in. Hg
40 0.2478
42 0.2671
44 0.2891
©
Danfoss | January 2020 AB00000019en-000401 | 43
46 .03119
48 0.3363
50 0.3624
52 0.3905
54 0.42
56 0.4518
58 0.4854
Page 44

Design Guidelines
Hydraulic Fan Drive Systems
Appendix F1-Influence of temperature, pressure and relative humidity on specific weight of air
Temp., ºF Pvs, in. Hg
60 0.5214
62 0.5597
64 0.6004
66 0.6438
68 0.6898
70 0.7387
72 0.7906
74 0.8456
76 0.904
78 0.9657
Temp., ºF Pvs, in. Hg
80 1.032
82 1.101
84 1.175
86 1.253
88 1.335
90 1.421
92 1.513
94 1.609
96 1.711
98 1.818
Temp., ºF Pvs, in. Hg
100 1.932
102 2.0528
104 2.1786
106 2.3109
108 2.4502
110 2.5966
112 2.7505
114 2.9123
116 3.0821
118 3.3606
Temp., ºF Pvs, in. Hg
120 3.4474
122 3.6436
124 3.8492
126 4.0649
128 4.2907
130 4.5272
44 | © Danfoss | January 2020 AB00000019en-000401
Page 45

Design Guidelines
Hydraulic Fan Drive Systems
Appendix F2-Influence of Altitude on Atmospheric Pressure
Influence of Altitude on Atmospheric Pressure
Atmospheric Properties:
Altitude Atmospheric
Meters Feet
0 0 14.696 29.92 760
30 98 14.64 29.80 757
60 197 14.58 29.69 754
90 295 14.52 29.57 751
120 394 14.47 28.45 748
150 492 14.41 29.34 745
180 591 14.35 29.22 742
210 689 14.30 29.11 739
240 787 14.24 28.99 736
270 886 14.18 28.88 734
300 984 14.13 28.76 731
330 1083 14.07 28.65 728
360 1181 14.02 28.54 725
390 1280 13.96 28.43 722
420 1378 13.91 28.32 719
450 1476 13.85 28.20 716
480 1575 13.80 28.09 714
510 1673 13.74 27.98 711
540 1772 13.69 27.87 708
570 1870 13.64 27.76 705
600 1969 13.58 27.65 702
900 2953 13.06 26.59 675
1200 3937 12.55 25.56 649
1500 4921 12.07 24.57 624
1800 5906 11.60 23.63 600
2100 6890 11.16 22.71 577
2400 7874 10.73 21.84 555
2700 8858 10.31 20.99 533
3000 9843 9.91 20.18 513
3300 10827 9.53 19.40 493
3600 11811 9.16 18.65 474
3900 12795 8.81 17.93 456
4200 13780 8.47 17.24 438
4500 14764 8.14 16.58 421
6000 19685 6.69 13.61 346
pressure, Psia
@ 32 deg F
Absolute pressure
Inches Mercury
Absolute pressure
millimeters Mercury
©
Danfoss | January 2020 AB00000019en-000401 | 45
Page 46

Atmospher
ic
pr
essur
e,
In.
Hg
.
Altitude,ft
35
30
25
20
15
10
5
0
0
5000
10000
15000
20000
25000
30000
35000
y = 30.262e
-4E-05x
R = 0.999
2
P
r
e
s
s
u
e
n
r
I
.
H
g
.
E
x
p
o
n
e
t
a
l
P
e
s
u
e
g
.
)
n
i
(
r
s
r
I
n
.
H
P106 154E
Design Guidelines
Hydraulic Fan Drive Systems
Appendix F3-Influence of generic altitude on atmospheric pressure
Influence of Generic Altitude on Atmospheric Pressure
Atmospheric pressure vs altitude
Data showing atmospheric pressure vs altitude
Data from ASHRAE Guide: Calculated
Altitude, ft. Pressure in. Hg
pressure
in. Hg
-1000 31.02 31.50 0.48
-500 30.47 30.87 0.40
0 29.921 30.26 0.34
500 29.38 29.66 0.28
1000 28.86 29.08 0.22
5000 24.89 24.78 -0.11
10000 20.58 20.29 -0.29
15000 16.88 16.61 -0.27
20000 13.75 13.60 -0.15
25000 11.1 11.13 0.03
30000 8.88 9.11 0.23
35000 7.04 7.46 0.42
40000 5.54 6.11 0.57
45000 4.36 5.00 0.64
50000 3.436 4.10 0.66
Error = calculated - given
pressure
in. Hg
46 | © Danfoss | January 2020 AB00000019en-000401
Page 47

Do you need a
reversing fan?
No
Yes
No
Yes
Acceptable
Acceptable
Acceptable
Not Acceptable
Not Acceptable
Input fan & engine data
into Fan Drive Sizing Tool
Output pump and
motor displacement
and pressure setting
Will complete
reverse cycle last
longer than 30
seconds?
Determine fan
performance data in both
forward and reverse
directions of operation
Fans operating in reverse may
produce significantly different
results than those operating in
the forward direction
If the fan speed in reverse is equal
to the forward speed, the fan flow
rate through the cooler will be
reduced
* Use the original output from the
Fan Sizing Tool
* Calculate “New” max. ambient
temperature for max. heat rejection
in reverse fan direction
If the desired fan power in reverse is equal to
the power in the forward direction; the fan
speed will increase, the air flow rate will increase,
but the heat rejection will be less than the
forward direction of rotation
If the desired heat rejection and max. ambient
temperature for reverse rotation is equal to
the forward direction, the air flow will be the
same. The fan speed will increase and the
power required to rotate the fan may increase
significantly.
* Determine the new fan performance data for
reverse rotation and input into the
Fan Drive Sizing Tool.
* Determine new pump and motor
displacement and/or pump drive ratio, and
pressure settings for both forward and reverse
directions of rotation.
* Use new pump and motor displacements in
the Fan Drive Sizing Tool, recalculate fan
drive system performance in the forward
direction.
* Determine the new fan performance data for
reverse rotation and input into the
Fan Drive Sizing Tool.
* Determine new pump and motor
displacement and/or pump drive ratio.
*Use new pump and motor displacements in
the Fan Drive Sizing Tool, recalculate fan
drive system performance in the forward
direction.
* Calculate “New” max. ambient temperature for
max. heat rejection in reverse fan direction.
P108 352E
Design Guidelines
Hydraulic Fan Drive Systems
Appendix G-Influence of reversed fan rotation on system performance
In applications where it is necessary to change the direction of fan rotation, most fans will have reduced
performance. Some fans are designed for equal, or similar, performance in the reverse direction, but this
is not typical of many axial flow fans that are installed in vehicles today. Some fan blade designs have
significantly different efficiencies depending on their direction of rotation and pitch angle (angle of
attack). In this instance, we’re using the term “efficiency” to indicate that the fan does not produce the
same amount of air flow at the same speed; and/or it requires more power to produce the same amount
of air flow as in the forward direction of rotation.
The cooling system designer is encouraged to consult with their fan supplier for performance
characteristics specific to their fan; based on the speed of operation, static pressure drop, and direction of
rotation. Using this information, it is possible to validate whether the fan will meet the specific needs of
the cooling system. Given this information, the system designer can investigate the effect of these
changes and determine if corrective actions need to be introduced.
The following is a guide to some of the characteristics that one could encounter when reversing the
direction of a fan. For these purposes, the fan is assumed to be operating at its design “trim” speed and at
the desired maximum “static” operating pressure across the cooler when in the forward direction.
©
Danfoss | January 2020 AB00000019en-000401 | 47
Page 48

Design Guidelines
Hydraulic Fan Drive Systems
Appendix G-Influence of reversed fan rotation on system performance
Baseline: Fan operating in Forward Direction at 2600 RPM
1.
The Flow Rate for a given fan speed is determined by the intersection of the Fan’s Flow/StaticPressure Curve for that speed and the Cooler’s Resistance Pressure vs Airflow characteristic curve.
2.
The power required to turn the fan at that speed (airflow & static pressure) is located directly above
this intersection point on the Fan Flow Rate vs Fan Power Curve at constant RPM. The magnitude of
the fan power is determined by the secondary Y-Axis in the upper right hand corner of the graph.
Condition 1: Fan operating in Reverse Direction at 2600 RPM
1.
The Flow Rate for 2600 RPM in the reverse direction is less than that produced by the fan at 2600 RPM
in the forward direction of rotation. Since the air flow rate is less, the static pressure across the cooler
is also reduced.
2.
The power required to turn the fan at the same speed, but in reverse direction, is less than that
required in the forward direction of rotation. The fan is producing less flow at a lower static pressure;
thus a lower power requirement.
48 | © Danfoss | January 2020 AB00000019en-000401
Page 49

Design Guidelines
Hydraulic Fan Drive Systems
Appendix G-Influence of reversed fan rotation on system performance
Condition 2: Fan operating in Reverse Direction at approximately the same input power level (by increasing the
fan speed in reverse)
1.
The fan is producing less flow, even though the fan speed is now 2810 RPM in the reverse direction of
rotation.
2.
The power required to turn the fan at 2810 RPM, in reverse direction, is approximately the same as
that required to turn the fan at 2600 RPM in the forward direction of rotation. The fan is still
producing less flow at a lower static pressure. (Fan efficiency is reduced in the reverse direction.)
Condition 3: Fan operating in Reverse Direction at approximately the same flow rate (by increasing the fan
speed in reverse)
1.
The fan is producing approximately the same flow rate, even though the fan speed is now 3060 RPM
in the reverse direction of rotation.
2.
The fan requires more power at the same flow rate and static pressure, because the fan is less efficient
in the reverse direction of rotation.
©
Danfoss | January 2020 AB00000019en-000401 | 49
Page 50

Design Guidelines
Hydraulic Fan Drive Systems
Appendix G-Influence of reversed fan rotation on system performance
System Response to Reversed Fan Rotation:
“Cooling Effectiveness” is proportional to the cooling capacity of the cooler; i.e., the ratio is greater
•
than one when the
Temperature (System Design Temperature). When the ratio is greater than 1.0, the cooler will not
require as much air flow to satisfy the cooling needs of the system. Therefore, the Fan Power
requirement will be less than at the “design” maximum ambient temperature.
At the “design” Maximum Ambient Temperature, reducing the air flow rate thru the cooler has an
•
equivalent effect of reducing the “Cooling Effectiveness” of the cooler; as such, the two concepts may
be equated.
Therefore, as the air flow rate thru the cooler is reduced (Cooling Effectiveness ≤ 1.0); a new “T
•
” can be calculated, which will define a new upper limit of ambient temperature where the cooler
Amb
will still satisfy the maximum heat load.
The new “T
Temperature.
Actual Amb
Actual Amb
” temperature will be lower than the original Design Maximum Ambient
ient Temperature is less than the original design Maximum Ambient
Actual
50 | © Danfoss | January 2020 AB00000019en-000401
Page 51

( )
( )
( )
( )
( ) ( )
( )
CCCCT
TT
Q
Q
TT
Therefore
CT
CT
Q
Q
Let
T
TT
TT
and
Q
Q
then
QQ
IF
TTQ
TTQ
TTCm
and
TTCm
Coolant
Maximum
Coolant
MaxAmbient
Coolant
A
Maximum
MaxAmbient
MaxAmbientCoolant
ActualAmbCoolant
Maximum
Maximum
A
CoolantMaximum
CoolantA
Coolant
p
Coolant
p
A
º65.40º50º1001
8424.0
1
º100*
8424.0
1
*
,
º50
º100
,0.1
tionHeat Rejec
tionHeat Rejec
: LetAnd
rd RPM Forwa2600at Flow
se RPM Rever2600at Flow
8424.0
:
bemust Tnew the therefore1.0,bemust
,0.1
and ,0.1
tionHeat Rejec
tionHeat Rejec
*
*
tionHeat Rejec
tionHeat Rejec
**tionHeat Rejec
**tionHeat Rejec
Revin Amb ActualNew
Revin Amb ActualNew
Actual
Ambient Actual Maximum
Maximum
ctual
Actual
Revin ActualAmb
Actual
Actual
Maximum
ctual
Ambient Actual Maximum
Amb ActualActual
Maximum
ctual
Ambient Actual MaximumMaximumMaximum
Amb ActualActualctual
=−−−=
−=−
=
=
≡
==
≤≥
−
−
≤
≤≡
−
−
=
−=
−=
.
.
Design Guidelines
Hydraulic Fan Drive Systems
Appendix G-Influence of reversed fan rotation on system performance
Derivation:
©
Danfoss | January 2020 AB00000019en-000401 | 51
Suggested Guidelines for Reversing Fan Drive Systems:
IF the desire is to keep the fan speed in the reverse direction the same as in the forward direction:
This will occur automatically, IF the fan drive system is flow limited by pump speed, or displacement; but
not IF the system is pressure limited.
Page 52

Design Guidelines
Hydraulic Fan Drive Systems
Appendix G-Influence of reversed fan rotation on system performance
The heat rejected by the cooling system will be less than in the forward direction of rotation,
•
The power to drive the fan in reverse will be less than in the forward direction,
•
The Torque to turn the fan, and therefore the delta pressure across the hydraulic motor, will be
•
proportional to the power ratio, since the fan speed is the same.
IF the desire is to keep the fan power in the reverse direction the same as in the forward direction:
The Heat Rejection by the system will still be less than in the forward direction, but better than when
•
maintaining constant fan speed, (HR α Speed Ratio)
The fan speed in reverse will be greater than in the forward direction. The Torque to turn the fan (and
•
hydraulic delta pressure) will be less than in the forward direction, (Power to turn the fan is the same,
but the speed is greater.)
This condition may define the maximum pump displacement or speed required to satisfy the flow
•
requirements of the fan system, since the flow required to rotate the fan will be larger in the reverse
direction than in the forward direction.
Be sure to validate these conditions with the fan supplier. The new speed requirement may exceed
•
the maximum speed limit.
Tip speed is proportional to the fan rotational speed and internal stresses in the fan are proportional to
the square of the fan speed.
IF the desire is to keep the fan flow rate in the reverse direction the same as in the forward direction:
The Heat Rejection by the system will be the same as in the forward direction,
•
The Power required to rotate the fan in the reverse direction will be greater than in the forward
•
direction of rotation, because the fan is less efficient in the reverse direction of rotation,
The fan speed in reverse will be greater than in the forward direction. The Torque to turn the fan (and
•
hydraulic delta pressure) may be greater than in the forward direction, (Power to turn the fan is
greater, and the speed is greater.)
This condition may define the maximum pump displacement required to satisfy the flow
•
requirements of the fan system, since the flow required to rotate the fan will be larger in the reverse
direction than in the forward direction.
Be sure to validate these conditions with the fan supplier. The new speed requirement may exceed
•
the maximum speed limit.
Tip speed is proportional to the fan rotational speed and internal stresses in the fan are proportional to
the square of the fan speed.
52 | © Danfoss | January 2020 AB00000019en-000401
Page 53

Design Guidelines
Hydraulic Fan Drive Systems
Appendix G-Influence of reversed fan rotation on system performance
Performance Summary: (For Reference Only)
©
Danfoss | January 2020 AB00000019en-000401 | 53
Page 54

Design Guidelines
Hydraulic Fan Drive Systems
Appendix H-System considerations for H1 fan drives with reversed fan rotation
System Considerations for H1 Fan Drives with Reversed Fan Rotation
As stated in Appendix G, in applications where it is necessary to change the direction of fan rotation,
most fans will have reduced performance. For fan systems using H1 pumps with the H1 Fan Drive Control
Valve, the control valve receives a command from the PLUS+1® Controller to regulate fan speed by
changing pump displacement. When the pump speed is at the design set point, fan speed required for
the desired cooling capacity is determined by the pump’s displacement.
In many systems, the fan’s speed at this condition may be close to its maximum design speed. If the
pump speed increases beyond the set point and the pump is commanded to maximum displacement;
then the fan speed will increase in proportion to the pump speed ratio and the delta pressure across the
fan motor will increase in proportion to the square of the pump speed ratio.
To prevent this from happening, the system designer is encouraged to limit the maximum fan speed in
each direction of rotation by adjusting the set pressure of the Pressure Limiters for both directions of
rotation.
Pressure Limiter Adjusting Procedure
For the forward direction of rotation, determine the delta pressure across the fan motor when it’s at the
maximum desired fan speed and power; this is the forward design pressure. Adjust the pressure limiter
setting to be equal to the forward design pressure plus 20 bar (to account for piece-to-piece variation
within the cooling system) for the forward direction of rotation.
For the reverse direction of rotation, determine the delta pressure across the fan motor when it’s at the
maximum desired fan speed and power; this is the reverse design pressure, (consult with the fan and
cooler manufacturer to determine the desired fan speed and power for the fan when it is rotating in the
reverse direction, reference Appendix G). Adjust the pressure limiter setting to be equal to the reverse
design pressure plus 20 bar (to account for piece-to-piece variation within the cooling system) for the
reverse direction of rotation.
When the pump arrives at the OEM’s production line, it will have a nominal PL setting of 150 bar and may
have a High Pressure Relief Valve setting of 250 bar, 300 bar, 350 bar, or 400 bar. depending on order
code selected. The PL must be re-adjusted to ensure that the fan reaches the desired fan speed to satisfy
the cooling needs of the system. It may be necessary to replace the HPRV with a valve that has a higher
pressure setting. To replace the valves, follow the recommended procedures that are available in Service
Documents 520L0848 or 520L0958.
The HPRV setting must be greater than the PL setting by at least 30 bar after the PL has been re-adjusted.
When adjusting the pressure limiters, follow the recommended adjustment procedure that is available in
Service Document 520L0848 or 520L0958, or after stopping the prime mover and ensuring that the fan
has stopped rotating.
Verify that the pressure limiter settings will not cause the fan speed to exceed the manufacturer’s
maximum speed limitation when the engine’s speed is at its No Load High Idle (NLHI) condition and
during periods of positive acceleration between the design set point and NLHI. Make adjustments
accordingly. Refer to the graphs on pages 58-59 for typical representative behavior of fan speed changes
when the engine is accelerating.
In the event of sudden engine speed increases, when the fan is operating close to the Pressure Limiter
and High Pressure Relief Valve settings, then it is possible for the fan speed to exceed the design trim
speed by approximately 10% (System delta pressure will exceed the setting of the High Pressure RV by
approximately 20%.) Consequently, the system integrator needs to take this into consideration when
sizing the fan and hydraulic components.
Pump and motor life are influenced by both speed and pressure. Contact your Danfoss technical
representative for an analysis of the systems’ duty cycle to determine if it will meet the desired life goals.
54 | © Danfoss | January 2020 AB00000019en-000401
Page 55

A
B
MA
S
M3
C2
C1
M4
M5
MB
L4
L2
M14
F00B
F00A
CW
P108 684E
Design Guidelines
Hydraulic Fan Drive Systems
Appendix H-System considerations for H1 fan drives with reversed fan rotation
Additional Information concerning the H1 Fan Drive Controller Option
H1 Pump with FDC Control - Schematic
Flow Direction vs. Signal
Pump Rotation
Clockwise (CW) as seen from shaft
Forward fan rotation Reverse fan rotation
Control current Less than 1050 mA for 12 Vdc
Less than 550 mA for 24 Vdc
System port A
flow
System port B
flow
Servo gauge port
high pressure
In (Low) Out (High) Out (High) In (Low)
Out (High) In (Low) In (Low) Out (High)
M5 M4 M5 M4
FDC Start and End Current
Typical FDC control curve in Fan Drive System, overlaid on FDC constant pressure control curves from a
representative NFP Load Valve test. In the FDC Control test, a fixed orifice is placed in the flow stream
between the A and B ports of the pump and it is sized to be equivalent to the flow/pressure relationship
of a fixed displacement motor driving a fan.
(radiator cleaning)
More than 1050 mA for 12 Vdc
More than 550 mA for 24 Vdc
Pump Rotation
Counterclockwise (CCW) as seen from shaft
Forward fan rotation Reverse fan rotation
Less than 1050 mA for 12 Vdc
Less than 550 mA for 24 Vdc
(radiator cleaning)
More than 1050 mA for 12 Vdc
More than 550 mA for 24 Vdc
©
Danfoss | January 2020 AB00000019en-000401 | 55
Page 56

0
2
-2
4
6
8
10
12
14
16
18
20
-4
-6
-8
-10
-12
-14
-16
-18
-20
Degrees
0.0
0.1
0.2
0.3
0.4
0.5
0.6
0.7
0.8
0.9
1.0
1.1
1.2
1.3
1.4
1.5
1.6
1.7
1.8
1.9
2.0
Amps
P108 678E
tc1_hyst_12volt_1800 rpm_
360dbar_50secrmp: Swangle
tc1_hyst_12volt_1800 rpm_
250dbar_50secrmp: Swangle
tc2_hyst_12volt_1800 rpm_
154.8lpm_50secrmp: Swangle
tc1_hyst_12volt_1800 rpm_
looped hoses_50secrmp: Swangle
tc1_hyst_12volt_1800 rpm_
50dbar_50secrmp: Swangle
tc1_hyst_12volt_1800 rpm_
150dbar_50secrmp: Swangle
Design Guidelines
Hydraulic Fan Drive Systems
Appendix H-System considerations for H1 fan drives with reversed fan rotation
Start and End Current
Typical, representative points on the curve are shown in the following table.
Start and End Current
Control Parameter Forward Current (mA)
(decreasing current
direction)
12Vdc Start Current (typical) 780 1300
End Current Dependent on Fan Drive System Pressure
Tolerance of End Current
Nominal Range
Operating Envelope for H1 Pumps with Fan Drive Control
56 | © Danfoss | January 2020 AB00000019en-000401
24Vdc Start Current (typical) 400 680
The Fan Drive Control (FDC) has limitations on the maximum servo delta pressure developed, compared
to other types of controls, and so there are limitations to the operating conditions which can be achieved
in the various frame size H1 pumps. Typical fan drive systems are unusual in that they achieve peak
pressure only at high flows, so it is important that FDC equipped pumps not be applied beyond the limits
defined below.
Typical limits for the operating envelope of the H1 pump family with the Fan Drive Control are shown in
the following figures. There is one figure for each H1 pump displacement. Note that the constant
pressure values are not the same for each displacement, as all are not necessarily applicable for each
displacement.
Max Current Allowed 1800
End Current Dependent on Fan Drive System Pressure
Tolerance of End Current
Nominal Range
Max Current Allowed 920
Reverse Current (mA)
(increasing current
direction)
Page 57

0
20
40
60
80
100
120
0 500 1000 1500 2000 2500 3000 3500 4000
Stroke (%)
Pump RPM
290 Bar Delta Pressure
360 Bar Delta Pressure
385 Bar Delta Pressure
400 Bar Delta Pressure
0
20
40
60
80
100
120
0 500 1000 1500 2000 2500 3000 3500 4000
Stroke (%)
Pump RPM
280 Bar Delta Pressure
300 Bar Delta Pressure
350 Bar Delta Pressure
Design Guidelines
Hydraulic Fan Drive Systems
Appendix H-System considerations for H1 fan drives with reversed fan rotation
In the following figures, the area underneath each curve represents the appropriate operating envelope
for a given system delta pressure:
H1P045 pump with CP8 valve plate and FDC
H1P053 pump with CP8 valve plate and FDC
©
Danfoss | January 2020 AB00000019en-000401 | 57
Page 58

0
20
40
60
80
100
120
0 500 1000 1500 2000 2500 3000 3500 4000
Stroke (%)
Pump RPM
290 Bar Delta Pressure
405 Bar Delta Pressure
425 Bar Delta Pressure
450 Bar Delta Pressure
0
20
40
60
80
100
120
0 500 1000 1500 2000 2500 3000 3500 4000
Stroke (%)
Pump RPM
235 Bar Delta Pressure
350 Bar Delta Pressure
360 Bar Delta Pressure
450 Bar Delta Pressure
Design Guidelines
Hydraulic Fan Drive Systems
Appendix H-System considerations for H1 fan drives with reversed fan rotation
H1P060 pump with CP17 valve plate and FDC
H1P068 pump with CP17 valve plate and FDC
58 | © Danfoss | January 2020 AB00000019en-000401
Page 59

0
20
40
60
80
100
120
0 500 1000 1500 2000 2500 3000 3500 4000
Stroke (%)
Pump RPM
300 Bar Delta Pressure
380 Bar Delta Pressure
395 Bar Delta Pressure
450 Bar Delta Pressure
0
20
40
60
80
100
120
0 500 1000 1500 2000 2500 3000 3500 4000
Stroke (%)
Pump RPM
320 Bar Delta Pressure
380 Bar Delta Pressure
450 Bar Delta Pressure
Design Guidelines
Hydraulic Fan Drive Systems
Appendix H-System considerations for H1 fan drives with reversed fan rotation
H1P069 pump with CP17 valve plate and FDC
H1P078 pump with CP17 valve plate and FDC
©
Danfoss | January 2020 AB00000019en-000401 | 59
Page 60

0
20
40
60
80
100
120
0 500 1000 1500 2000 2500 3000 3500
Stroke (%)
Pump RPM
305 Bar Delta Pressure
325 Bar Delta Pressure
380 Bar Delta Pressure
385 Bar Delta Pressure
450 Bar Delta Pressure
0
20
40
60
80
100
120
0 500 1000 1500 2000 2500 3000 3500
Stroke (%)
Pump RPM
280 Bar Delta Pressure
305 Bar Delta Pressure
340 Bar Delta Pressure
350 Bar Delta Pressure
450 Bar Delta Pressure
Design Guidelines
Hydraulic Fan Drive Systems
Appendix H-System considerations for H1 fan drives with reversed fan rotation
H1P089 pump with CP17 valve plate and FDC
H1P100 pump with CP17 valve plate and FDC
60 | © Danfoss | January 2020 AB00000019en-000401
Page 61

0
20
40
60
80
100
120
0 500 1000 1500 2000 2500 3000 3500
Stroke (%)
Pump RPM
355 Bar Delta Pressure
380 Bar Delta Pressure
410 Bar Delta Pressure
450 Bar Delta Pressure
0
20
40
60
80
100
120
0 500 1000 1500 2000 2500 3000 3500
Stroke (%)
Pump RPM
340 Bar Delta Pressure
390 Bar Delta Pressure
450 Bar Delta Pressure
Design Guidelines
Hydraulic Fan Drive Systems
Appendix H-System considerations for H1 fan drives with reversed fan rotation
H1P115 pump with CP17 valve plate and FDC
H1P130 pump with CP17 valve plate and FDC
©
Danfoss | January 2020 AB00000019en-000401 | 61
Page 62

0
20
40
60
80
100
120
0 500 1000 1500 2000 2500 3000 3500
Stroke (%)
Pump RPM
240 Bar Delta Pressure
340 Bar Delta Pressure
415 Bar Delta Pressure
435 Bar Delta Pressure
450 Bar Delta Pressure
0
20
40
60
80
100
120
0 500 1000 1500 2000 2500 3000 3500
Stroke (%)
Pump RPM
330 Bar Delta Pressure
350 Bar Delta Pressure
390 Bar Delta Pressure
410 Bar Delta Pressure
450 Bar Delta Pressure
Design Guidelines
Hydraulic Fan Drive Systems
Appendix H-System considerations for H1 fan drives with reversed fan rotation
H1P147 pump with CP17 valve plate and FDC
H1P165 pump with CP17 valve plate and FDC
62 | © Danfoss | January 2020 AB00000019en-000401
Page 63

0
20
40
60
80
100
120
0 500 1000 1500 2000 2500 3000
Stroke (%)
Pump RPM
325 Bar Delta Pressure
385 Bar Delta Pressure
450 Bar Delta Pressure
0
20
40
60
80
100
120
0 500 1000 1500 2000 2500 3000
Stroke (%)
Pump RPM
320 Bar Delta Pressure
350 Bar Delta Pressure
450 Bar Delta Pressure
Design Guidelines
Hydraulic Fan Drive Systems
Appendix H-System considerations for H1 fan drives with reversed fan rotation
H1P210 pump with CP17 valve plate and FDC
H1P250 pump with CP17 valve plate and FDC
Sensitivity to Prime Mover Speed Changes (Load Sensitivity) - (J Frame as example)
The natural NFPE behavioral characteristic of the pump tends to correct for engine/pump speed
variations which occur as a normal part of operation, and maintain the fan speed near to the level which
was produced before the engine speed change. Of course, this can only occur to the extent that the
pump can achieve its maximum displacement; beyond that, significant fan speed change will occur.
In the conditions representing an engine lugging condition (engine speed reduction less than 20%), there
was no significant reduction in fan speed; the lower pump moments at the lower pump speed allowed
the pump to increase stroke to maintain a relatively constant output flow.
In all conditions representing a throttle down condition (engine speed reduction greater than 50%), the
percent of fan speed drop was lower than the percent of pump speed drop.
©
Danfoss | January 2020 AB00000019en-000401 | 63
Curves shown below are from J frame testing, and are representative of the behavior which will be seen
on other frame sizes.
Page 64

3.0
RPM
x 10
Input speed
2.9
2.8
2.7
2.6
2.5
2.4
2.3
2.2
2.1
2.0
1.9
1.8
1.7
1.6
1.5
1.4
1.3
1.2
1.1
1.0
0.9
0.8
0.7
0.6
0.5
0.4
0.3
0.2
0.1
0.0
0
40
80
120
160
200
240
280
320
360
400
-40
-80
-120
-160
-200
-240
-280
-320
-360
-400
Bar
3
Degrees
0
2
4
6
8
10
12
14
16
18
20
-2
-4
-6
-8
-10
-12
-14
-16
-18
-20
0
1
2
3 4 5
7
8
9
10
11
12 13
14
15
16
17
18
19 20
6
Fan drive speed
Swangle
MA_MB_System_Press
M4_M5_Servo_Press
P108 679E
DBar
30
26
22
18
14
10
2
-14
-18
6
0
-2
-6
-10
-22
-26
-30
28
24
20
16
12
8
4
-4
-8
-12
-16
-20
-24
-28
Seconds
3.0
RPM
x 10
Input speed
2.9
2.8
2.7
2.6
2.5
2.4
2.3
2.2
2.1
2.0
1.9
1.8
1.7
1.6
1.5
1.4
1.3
1.2
1.1
1.0
0.9
0.8
0.7
0.6
0.5
0.4
0.3
0.2
0.1
0.0
0
40
80
120
160
200
240
280
320
360
400
-40
-80
-120
-160
-200
-240
-280
-320
-360
-400
Bar
3
Degrees
0
2
4
6
8
10
12
14
16
18
20
-2
-4
-6
-8
-10
-12
-14
-16
-18
-20
0
1
2
3 4 5
7
8
9
10
11
12 13
14
15
16
17
18
19 20
6
Fan drive speed
Swangle
M4_M5_Servo_Press
P108 680E
MA_MB_System_Press
DBar
30
26
22
18
14
10
2
-14
-18
6
0
-2
-6
-10
-22
-26
-30
28
24
20
16
12
8
4
-4
-8
-12
-16
-20
-24
-28
Seconds
Design Guidelines
Hydraulic Fan Drive Systems
Appendix H-System considerations for H1 fan drives with reversed fan rotation
Prime Mover Speed Change (2500 - 2000 - 2500 rpm)
Prime Mover Speed Change (2500 - 1000 - 2500 rpm)
64 | © Danfoss | January 2020 AB00000019en-000401
Page 65

3.0
RPM
x 10
Input speed
2.9
2.8
2.7
2.6
2.5
2.4
2.3
2.2
2.1
2.0
1.9
1.8
1.7
1.6
1.5
1.4
1.3
1.2
1.1
1.0
0.9
0.8
0.7
0.6
0.5
0.4
0.3
0.2
0.1
0.0
0
40
80
120
160
200
240
280
320
360
400
-40
-80
-120
-160
-200
-240
-280
-320
-360
-400
Bar
3
Degrees
0
2
4
6
8
10
12
14
16
18
20
-2
-4
-6
-8
-10
-12
-14
-16
-18
-20
0
1
2
3 4 5
7
8
9
10
11
12 13
14
15
16
17
18
19 20
6
Fan drive speed
Swangle
M4_M5_Servo_Press
P108 681E
MA_MB_System_Press
DBar
30
26
22
18
14
10
2
-14
-18
6
0
-2
-6
-10
-22
-26
-30
28
24
20
16
12
8
4
-4
-8
-12
-16
-20
-24
-28
Seconds
3.0
RPM
x 10
Input speed
2.9
2.8
2.7
2.6
2.5
2.4
2.3
2.2
2.1
2.0
1.9
1.8
1.7
1.6
1.5
1.4
1.3
1.2
1.1
1.0
0.9
0.8
0.7
0.6
0.5
0.4
0.3
0.2
0.1
0.0
0
40
80
120
160
200
240
280
320
360
400
-40
-80
-120
-160
-200
-240
-280
-320
-360
-400
Bar
3
Degrees
0
2
4
6
8
10
12
14
16
18
20
-2
-4
-6
-8
-10
-12
-14
-16
-18
-20
0
1
2
3 4 5
7
8
9
10
11
12 13
14
15
16
17
18
19 20
6
Fan drive speed
Swangle
M4_M5_Servo_Press
P108 682E
MA_MB_System_Press
DBar
30
26
22
18
14
10
2
-14
-18
6
0
-2
-6
-10
-22
-26
-30
28
24
20
16
12
8
4
-4
-8
-12
-16
-20
-24
-28
Seconds
Design Guidelines
Hydraulic Fan Drive Systems
Appendix H-System considerations for H1 fan drives with reversed fan rotation
Prime Mover Speed Change (2500 - 1600 - 2500 rpm)
Prime Mover Speed Change (2500 - 800 - 2500 rpm)
©
Danfoss | January 2020 AB00000019en-000401 | 65
Page 66

P108 683E
9
8
7
6
5
4
3
2
1
0
J
H
G
F
E
D
10% displacement to 90%
displacement response time
Destroke from maximum
forward to neutral
Maximum forward to
maximum reverse
Pump Frame
Response time in seconds
W
Design Guidelines
Hydraulic Fan Drive Systems
Appendix H-System considerations for H1 fan drives with reversed fan rotation
J Frame is used as an example only
In the event of sudden engine speed increases, when the fan is operating close to the Pressure Limiter
and High Pressure Relief Valve settings, then it is possible for the fan speed to exceed the design trim
speed by approximately 10% (System delta pressure will exceed the setting of the High Pressure RV by
approximately 20%.) Consequently, the system integrator needs to take this into consideration when
sizing the fan and hydraulic components.
Due to the failsafe functionality of the FDC control the pump will stroke to max. displacement in case the
input signal to the pump control and the Diesel engine will be switched off at the same time. In this
situation a low loop event can occur which may damage the pump. Therefore, it’s strictly recommended
to keep the input signal to the pump control alive while switching off the engine.
For further information please contact your Danfoss representative
H1 FDC Response Time (with Typical Fan Drive System Loading)
Warning
This control is for Fan Drive Systems only!
Use in other systems could result in unintended movement of the machine or its elements. Loss of the
input signal to this control will cause the pump to produce maximum flow. Contact Danfoss or an
authorized distributor with questions regarding the use of this product.
Application startup method (to account for PL offset)
The Pressure Limiter (PL) setting at high swashplate angles can be significantly (30 to 50 bar) lower than
the setting on the Danfoss production test stand, which is done with system ports blocked.
This effect has a strong impact on Fan Drive applications; these applications are unique in that they
always reach their peak pressure at a high swashplate angle (due to the typical fan speed/torque curve).
Since the PL is needed to limit the peak system pressure, and therefore fan speed, in a particular
application, this reduction in PL setting due to the standard factory test procedure will cause less than
66 | © Danfoss | January 2020 AB00000019en-000401
optimum cooling. Because of this behavior, the following procedure should be used to determine the
nominal value for the factory PL adjustment (nomenclature) for a new fan drive application. This will be
required if there is a desire to pre-set the Pressure Limiters at a test facility without a working fan
assembly, and prior to installing the pump onto a machine:
1. Order the FDC pump with the standard PL settings of 150 bar. Standard pump configurations are
provided with 150 bar PL settings and with the HPRV settings at 250 bar, 300 bar, 350 bar, and 400
bar.
2. Start the machine with a neutral signal to the FDC control and with the engine at its rated operating
speed. Gradually change the signal to the FDC to increase the fan speed; if the fan begins to exceed
its maximum operating speed limit, use the procedure mentioned in paragraph above or shut off the
Page 67

Design Guidelines
Hydraulic Fan Drive Systems
Appendix H-System considerations for H1 fan drives with reversed fan rotation
machine and adjust the PLs to a lower pressure setting. Repeat this for forward and reverse directions
of fan rotation; until it is assured that the PLs are limiting fan speed within acceptable levels.
This step is to ensure that the fan cannot operate above its maximum speed limit in subsequent
steps. It may be necessary to increase the pressure setting of the HPRVs. Verify that the Pressure
Limiter settings are at least 30 bar below the pump’s High Pressure Relief Valves following the
recommended installation procedure provided within Service Bulletin 520L0848 or 520L0958.
3. Adjust the PL settings to the value determined during the sizing process by following the
recommended adjustment procedure provided within Service Bulletin 520L0848 or 520L0958, or
stop the machine and ensure that the fan has stopped.
This will be a mid-range current level, not zero amps.
4. Operate the engine at its rated operating speed, and with a maximum command to the FDC. If
necessary, adjust the PLs to achieve the desired peak fan speed as above following the recommended
adjustment procedure provided within Service Bulletin 520J0848 or 520L0958 (do this for forward
and then for reverse directions of fan rotation).
5. During the Application Review process, or at “Initial Application Start” follow the instructions in steps
2 through 4. Stop the machine, then disconnect the pump system hoses from the fan drive circuit,
and block the system ports to simulate the factory test stand -“no flow” condition.
6. Start the machine with a neutral signal to the FDC, and operate at the following conditions to
simulate the factory test stand conditions: 1775 rpm pump speed, 50C - 80C oil temperature, and at
zero and full flow current to the FDC solenoid. Record the System Delta Pressure achieved for the
forward and reverse flow directions.
7. Verify that these system delta pressure settings are at least 30 bar below the pump’s High Pressure
Relief Valves (if not, stop the machine, consult Danfoss technical sales and then install the next
highest pressure level HPRVs, and repeat this test) following the recommended installation procedure
provided within Service Bulletin 520L0848 or 520L0958
The PL setting must be less than the HPRV setting.
©
Danfoss | January 2020 AB00000019en-000401 | 67
Page 68

P108918
Design Guidelines
Hydraulic Fan Drive Systems
Appendix I-System Considerations for RDM Fan Drives
System Considerations for RDM Fan Drives
These application guidelines are for open circuit systems which are equipped with the Reverse
Displacement Motor (RDM) to allow reversing of the load output direction without a directional control
valve and the system losses that go with a DCV. The RDM should only be used in open circuit systems
that regulate load speed by controlling system pressure based on the input command. A displacement,
or flow controlled pump should not be used with the RDM; due to the risk of over speeding the motor
and/or load as the direction changes. This is because the motor displacement goes from full forward
through zero to full reverse.
Reversing Sequence
The recommended reversing sequence is shown below. The load is first decelerated to the minimum
normal system speed by commanding the system to the lowest normal system pressure (low pressure
standby) and allowing the load’s speed to slow down. The RDM is then shifted to reverse and the system
pressure is then increased to achieve the desired speed. The same process is then used to return the load
to the original direction. The primary purpose of decelerating the load prior to shifting the motor is to
reduce the “flywheel” affect inherent in reversing a spinning load. This will minimize pressure spikes and
other disturbances in the system caused by feeding the energy of the rotating load back into the
hydraulic system. It will also minimize the potential for requiring oil to flow through the motor system
return line in a direction opposite that of the normal flow.
Another reason for reducing the speed and pressure in the system prior to initiating a motor reversal is to
minimize the impact of the shifting process on the life of the motor. The higher the system pressure
and/or speed is when the reversal is started, the greater the risk of wear in the swashplate bearings and a
reduction in the life of those bearings.
Reversing Sequence
If, for some reason, this ideal process can’t be achieved, based on the system requirements for a faster
load deceleration; the minimum requirement is that the system pressure setting be reduced prior to the
reversal to minimize and delay the pressure spikes in the system while the fan is reversing. The delay in
this step, between the pressure reduction signal and the reversing signal should be long enough to
ensure the pressure control responds and the fan decelerates to the minimum speed condition.
Experience to date would suggest that a 1 second delay is sufficient, but this should be verified by test.
Once the fan reversal is accomplished, the pressure can be increased to achieve the desired fan speed, or
fan acceleration time.
Since the unrestricted response time of the motor to shift from forward to reverse is approximately 350
ms, the delay required between sending the reversing signal and sending the signal to increase the
68 | © Danfoss | January 2020 AB00000019en-000401
Page 69

Design Guidelines
Hydraulic Fan Drive Systems
Appendix I-System Considerations for RDM Fan Drives
system pressure should be greater than 500 ms. A command to increase system pressure before the
motor reaches full displacement will result in higher system pressures while the fan is accelerating. A
longer delay will allow the fan to decelerate more and will minimize the pressure to fully stop the fan and
reverse its direction; but will also lead to reduced cooling capacity during the shift sequence. Likewise,
when the motor is returning to the forward direction, the minimum delay time between these two events
is 1 second, instead of the 500 ms interval above. This is because the natural shift response of the motor is
slower when returning to the forward direction.
A duty cycle that follows these recommended guidelines will result in a reversing cycle “capability” of
more than 60,000 cycles, because the motor is not actually shifting under high pressure. A duty cycle
where the motor shifts before slowing down will see higher system pressures because the load energy is
being dissipated more quickly. This will have an impact on the life of the motor kit, swashplate bearings
and shaft bearings.
Shift Rate Control
In general, the best option is to allow the motor to shift as quickly as possible when the motor is at
minimum speed. This will reduce the risk of the motor shifting under load, thus impacting the life of the
swashplate bearings. There may be systems, however, where it is desired to control the shift rate of the
motor. One example might be in systems with very high inertia loads.
If required, the reversal rate of the RDM can be controlled. The motor is equipped with an integrated shift
valve, by controlling the input signal to the motor; the rate of reversal can be controlled. The shifting of
the motor from forward to reverse happens through the range of 300-750 mA input for a 12 volt valve
and 150-375 mA for a 24 volt valve. The input current should be ramped through this range based on the
desired shift time of the motor. The return to the forward direction will happen through the range of
550-150 mA for a 12 volt valve and 275-75 mA for a 24 volt valve.
For motors with an integral shift valve, if the electrical input to the motor control can’t be regulated as
described above; there is an option to install an orifice, either in front of the shift valve, or between the
shift valve and the servo cavity. The first orifice will impact the forward-to-reverse shift without
influencing the return-to-forward shift; the second will impact both reversals.
The “non-orifice” shift time of the motor with 12 bar or greater system pressure is approximately 350
msec. An orifice of 0.8mm (0.032”) in the supply position, or an orifice of 1.3mm (0.051”) between the
control valve and servo piston, will approximately double this time. Slowing the motor’s shift rate will
reduce, if not eliminate, the initial pressure spike during the shaft reversal and will allow the load to slow
down some before the motor actually reverses into pumping mode. The pressure during the rest of the
load deceleration will be similar to the “non-orifice” system interval. The addition of either orifice will
result in a longer deceleration time interval.
The process of returning to forward is not affected by a supply orifice, but will be affected by an orifice
between the control valve orifice and the servo piston. The total time to stop the fan in this direction is
nearly the same but more time is spent at high pressure if an orifice after the control valve is used.
The preference would be to apply the motor without the orifice since this allows the motor itself to shift
at lower system pressures. If high pressure spikes, or system instability, are seen during the forward to
reverse step, the best option is introduce a supply orifice into the control circuit.
©
Danfoss | January 2020 AB00000019en-000401 | 69
Page 70

0
200
400
600
800
1000
1200
1400
1600
1800
0
50
100
150
200
250
300
2 2.5 3 3.5 4 4.5 5 5.5 6 6.5 7
RPM
Flow (lpm)
Time (sec)
P_System_A (bar) - No Orifice P_System_A (bar) - Orifice
n_RDM (LPM)-No Orifice n_RDM (LPM)-Orifice
P108919
Design Guidelines
Hydraulic Fan Drive Systems
Appendix I-System Considerations for RDM Fan Drives
Control Orifice Impact Forward to Reverse
70 | © Danfoss | January 2020 AB00000019en-000401
Page 71

RPM
Flow (lpm)
secTime ( )
P108920
0
200
400
600
800
1000
1200
1400
1600
1800
0
50
100
150
200
250
300
17 18 19 20 21 22 23 24 25
P_System_A (bar) - No Orifice
P_System_A (bar) - Orifice
n_RDM (LPM)-No Orifice
n_RDM (LPM)-Orifice
Design Guidelines
Hydraulic Fan Drive Systems
Appendix I-System Considerations for RDM Fan Drives
Control Orifice Impact Reverse to Forward
System Considerations
There are some system considerations that need to be taken into account when applying an RDM motor.
1. Anytime the RDM is used in a typical system, as shown in the schematic, a displacement reversal
command will cause the RDM to turn into a pump until the load is stopped. This will cause oil to flow
from the motor toward the pump (opposite the normal direction) with the amount of flow and length
of time depending on system parameters such as the fan inertia, fan speed at command initiation,
and reversing rate. When this happens, the motor (now operating as a pump) must be able to draw
oil in through what is normally the return flow portion of the system.
©
Danfoss | January 2020 AB00000019en-000401 | 71
Page 72

P108921
RDM Motor
Cartridge
L1
Reverse
A
B
CV #3
CV #1
CV #2
B
S
L2
M2
B
CW
Return
portion
of
system
Design Guidelines
Hydraulic Fan Drive Systems
Appendix I-System Considerations for RDM Fan Drives
RDM System Schematic
The amount of flow is a function of the motor displacement and speed so a system operating using
the recommended reversing cycle will have only a very small amount of flow in the reverse direction,
since the reversal starts at a much lower motor speed. A cycle with a high deceleration rate however,
as shown in Control Orifice Impact graphs above, will require much greater amounts of flow, since the
motor displacement is reversed at a much higher speed. Any filters, coolers, or other components
that are in the return line could cause a restriction leading to cavitation in the motor. In addition to
adding to any noise during the reversal, this could eventually lead to damage to the filter, heat
exchanger, motor, or pump - causing reduced performance, or life, of the system.
One way to reduce this concern is to have a by-pass check valve in parallel to the filter and heat
exchanger to allow free flow of oil into the motor when required. This is identified as CV #2 in the
above schematic. This would also reduce the risk of this oil flow pulling contamination from the filter
or damaging either of these components. This risk can be further minimized by adding a second
check valve, shown as CV #1 in the schematic.
Motor Flow Requirements in Pumping Mode on page 73, below, shows an example in one system of
the impact of such a by-pass valve. When comparing the “Standard Schematic” data to the “Includes
CV#2 only” data, during the first 250 msec after the motor displacement is reversed, the system
without the by-pass valve shows a much greater deficiency in make-up flow into the motor than did
the system with the by-pass valve.
72 | © Danfoss | January 2020 AB00000019en-000401
Page 73

0
50
100
150
200
250
300
0
5
10
15
20
25
30
2 2.5 3 3.5 4 4.5 5 5.5 6
F
low
(
l
pm)
Time (sec)
Motor System Flow Requirements
Forward to Reverse
-Q_System (LPM) Standard Schematic
Q_System (LPM) - Includes CV #2 only
tQ_Sys em (LPM) - Includes CV #3 only
Pred Motor Flow (lpm) - Standard Schematic
dPre Motor Flow (lpm) - Includes CV #2 only
Motor displacement is
fully reversed at this
point
Gap between blue lines gives a measure of the flow defficiency
between flow going from the motor to the pump (predicted flow)
and the make-up flow the motor is able to pull through the
return system, with the standard schematic.
Gap between blue lines gives a measure of the flow defficiency
between flow going from the motor to the pump (predicted flow)
and the make-up flow the motor is able to pull through the return
system, with the addition of check valve CV #2.
A much lower return flow is required if using check valve
CV #3 since the only flow required is to make up leakage,
once the system is pressurized.
P108916
Design Guidelines
Hydraulic Fan Drive Systems
Appendix I-System Considerations for RDM Fan Drives
Motor Flow Requirements in Pumping Mode
2. The peak value, and duration, of any pressure spike in the high pressure line will be controlled by how
quickly the load energy is put into the system and by the avenues available to the system to drain this
energy out. The avenues in a typical open circuit system would be;
Pump and motor control leakage flow
•
Pump and motor kit leakage flow
•
Pump’s ability to absorb oil by going over-center
•
Relief valves in the system
•
The characteristics of each of the above items are discussed in more detail below. By looking at the
energy in the load during the reversal initiation, the power level required to reverse the load in the
desired time and the paths available for energy dissipation; the system designer can determine if any
other actions might be required.
3. Another system consideration is the impact on the case drain system. During the time interval of the
reversal, the output flow at the motor case drain is significantly higher than under normal conditions
during the reversal process. The servo piston will force approximately 53 cc’s (3.2 in^3) of oil into the
motor case. Introducing 53 cc’s of fluid in 350ms equates to a nearly instantaneous change in the
average case flow rate of approximately 9 lpm (2.4 gpm).
Also, in a system set-up like the schematic above, there may be a surge of oil through the pump
control resulting in higher case flow leaving the pump. [Experience to date has not shown a problem
with this on S45 pumps but this should be investigated during prototype testing to ensure there are
no issues.]
4. Another system consideration is the impact on the system downstream of the motor outlet. During
the motor reversal, the flow out of the motor will quickly reduce to zero (the motor’s at zero
©
Danfoss | January 2020 AB00000019en-000401 | 73
Page 74

0
50
100
150
200
250
300
3 3.5 4 4.5 5 5.5 6 6.5 7 7.5 8
P_System_A (bar)
P_System_A (bar)
P_System_A (bar)
Standard Setup
Addition of Bypass only
Addition of Check only
P108917
Time (sec)
System Pressure (bar)
Design Guidelines
Hydraulic Fan Drive Systems
Appendix I-System Considerations for RDM Fan Drives
displacement) and then reverse direction (as discussed above). This has been shown to result in the
motor outlet pressure cycling from normal - to a vacuum - to a high level spike. The main concern for
the RDM itself is if the case-pressure rise (discussed directly above) and the outlet pressure drop - are
too severe; such that added together they may cause a problem.
Laboratory tests following the recommended reversing cycle have shown that the RDM is more
capable of handling a (“case minus return”) delta pressure pulse higher than the catalog rating, but
this value should be kept below 3 bar.
For example, a test was performed with a a S45 J open circuit pump, a K-Frame RDM motor, and a fan
inertia of 2kgm^2. System Pressure Response Characteristic on page 74 below shows a typical system
pressure response. The blue line, or “Standard Setup”, would be the base system described in the
schematic above. The red line, or “Addition of Bypass valve”, reflects adding the bypass valve, CV #2,
into the circuit. The system builds pressure more quickly and, as a consequence, slows the fan more
quickly; this brings the pressure down sooner. [This is because the RDM is able to draw more oil in
during its pumping mode, allowing the fan energy to be dissipated more quickly.]
The data in System Pressure Response Characteristic on page 74 shown by the green line represents
the “addition of check valve, CV#3”, (by itself) into the circuit between the pump and motor. It
prevents the reverse flow from going into the pump. This system then utilizes only the motor leakage
and integrated relief valve to dissipate the fan energy. As can be seen here, this results in a higher
pressure and takes the longest time to reverse the fan.
System Pressure Response Characteristic
74 | © Danfoss | January 2020 AB00000019en-000401
Page 75

W
W
Design Guidelines
Hydraulic Fan Drive Systems
Appendix I-System Considerations for RDM Fan Drives
Zero RPM Motor Output
The RDM has the ability to reach and maintain a zero shaft speed condition. This could be beneficial for
the purpose of reducing the time required for an engine to reach operating temperature, or for power
savings - when cooling is not required.
A limited amount of tests have been performed in the laboratory to verify that this condition if is
“possible”; but additional testing in the laboratory and on prototype vehicles under field conditions will
be needed to verify whether a production solution on an individual vehicle system is feasible.
Warning
With regard to the swashplate bearings, at some point in the life of the motor, there is a potential that the
motor will not return to the forward direction when the reverse command is removed. This is caused by
excessive wear of the journal bearing and there are a number of factors that influence this life. Testing to
date using the standard reversing cycle and schematic has shown have demonstrated a swashplate
bearing life exceeding 60,000 reversals. This is believed to be satifactory for most applications.
Warning
With regard to the standard reversing cycle, a loss of control signal to the pump (due to a broken wire,
corroded connection, etc.) would cause the pump to maintain maximum system pressure and motor
speed. In this instance, the RDM will be able to reverse direction, but it may not be able to return to the
forward direction, due to the high pressure and speed. As long as this does not become a standard
operating mode, it will not damage the motor. Once the pressure and speed are reduced to their normal
low pressure settings, the motor will return to the forward direction.
©
Danfoss | January 2020 AB00000019en-000401 | 75
Page 76

Design Guidelines
Hydraulic Fan Drive Systems
Reference Literature
Fan drive systems may consist of a variety of pump, motor, valve and control combinations. The product
codes shown below are for components that have been designed specifically for fan drive systems. Refer
to the literature listed below for product code information and specifications for other Danfoss
components that may be utilized in a fan drive system.
Open Circuit Axial Piston Pumps
Series 45 Axial Piston Pumps 520L0519
•
Open/Closed Circuit Axial Piston Motors
L and K Frame Variable Motors 520L0627
•
Series 40 Axial Piston Motors 520L0636
•
Series 90 Axial Piston Motors 520L0604
•
H1B Axial Piston Motors 11037153
•
Controllers
Fan Drive Control Temperature Sensors BLN-95-9063
•
Electronic Fan Drive Controller (FDC) 11005336
•
Electronic Fan Drive Controller Assembly (FDCA) 11005337
•
PLUS+1TM Controller Family 520L0719
•
System Guidelines
•
•
Closed Circuit Axial Piston Pumps
•
•
•
•
•
•
•
•
•
Design Guidelines for Hydraulic Fluid Cleanliness 520L0467
Design Guidelines for Hydraulic Fan Drive Systems 520L0926
H1 Axial Piston Pumps Basic Information 11062168
Series 42 Axial Piston Pumps 11022637
H1 045/053 Tandem Axial Piston Pumps Technical Information 11063345
H1 045/053 Single Axial Piston Pumps Technical Information 11063344
H1 089/100 Single Axial Piston Pumps Technical Information 11069970
H1 069/078 Single Axial Piston Pumps Technical Information 11062169
H1 147/165 Single Axial Piston Pumps Technical Information 11063347
H1 210/250 Single Axial Piston Pumps Technical Information L1208737
H1 115/130 Single Axial Piston Pumps Technical Information 11063346
76 | © Danfoss | January 2020 AB00000019en-000401
Page 77

Danfoss
Power Solutions GmbH & Co. OHG
Krokamp 35
D-24539 Neumünster, Germany
Phone: +49 4321 871 0
Danfoss
Power Solutions ApS
Nordborgvej 81
DK-6430 Nordborg, Denmark
Phone: +45 7488 2222
Danfoss
Power Solutions (US) Company
2800 East 13th Street
Ames, IA 50010, USA
Phone: +1 515 239 6000
Danfoss
Power Solutions Trading
(Shanghai) Co., Ltd.
Building #22, No. 1000 Jin Hai Rd
Jin Qiao, Pudong New District
Shanghai, China 201206
Phone: +86 21 2080 6201
Products we offer:
Hydro-Gear
www.hydro-gear.com
Daikin-Sauer-Danfoss
www.daikin-sauer-danfoss.com
DCV directional control
•
valves
Electric converters
•
Electric machines
•
Electric motors
•
Gear motors
•
Gear pumps
•
Hydrostatic motors
•
Hydrostatic pumps
•
Orbital motors
•
PLUS+1® controllers
•
PLUS+1® displays
•
PLUS+1® joysticks and
•
pedals
PLUS+1® operator
•
interfaces
PLUS+1® sensors
•
PLUS+1® software
•
PLUS+1® software services,
•
support and training
Position controls and
•
sensors
PVG proportional valves
•
Steering components and
•
systems
Telematics
•
Danfoss Power Solutions is a global manufacturer and supplier of high-quality hydraulic and
electric components. We specialize in providing state-of-the-art technology and solutions
that excel in the harsh operating conditions of the mobile off-highway market as well as the
marine sector. Building on our extensive applications expertise, we work closely with you to
ensure exceptional performance for a broad range of applications. We help you and other
customers around the world speed up system development, reduce costs and bring vehicles
and vessels to market faster.
Danfoss Power Solutions – your strongest partner in mobile hydraulics and mobile
electrification.
Go to www.danfoss.com for further product information.
We offer you expert worldwide support for ensuring the best possible solutions for
outstanding performance. And with an extensive network of Global Service Partners, we also
provide you with comprehensive global service for all of our components.
Local address:
Danfoss can accept no responsibility for possible errors in catalogues, brochures and other printed material. Danfoss reserves the right to alter its products without notice. This also applies to products
already on order provided that such alterations can be made without subsequent changes being necessary in specifications already agreed.
All trademarks in this material are property of the respective companies. Danfoss and the Danfoss logotype are trademarks of Danfoss A/S. All rights reserved.
©
Danfoss | January 2020 AB00000019en-000401
 Loading...