

Page 1
Fact sheet
Q
AB-QM f low checker DN 40-250 and AB-QM 4.0 DN 15-20
Verifying the flow on AB-QM valves
Flow verif ication
in an installation
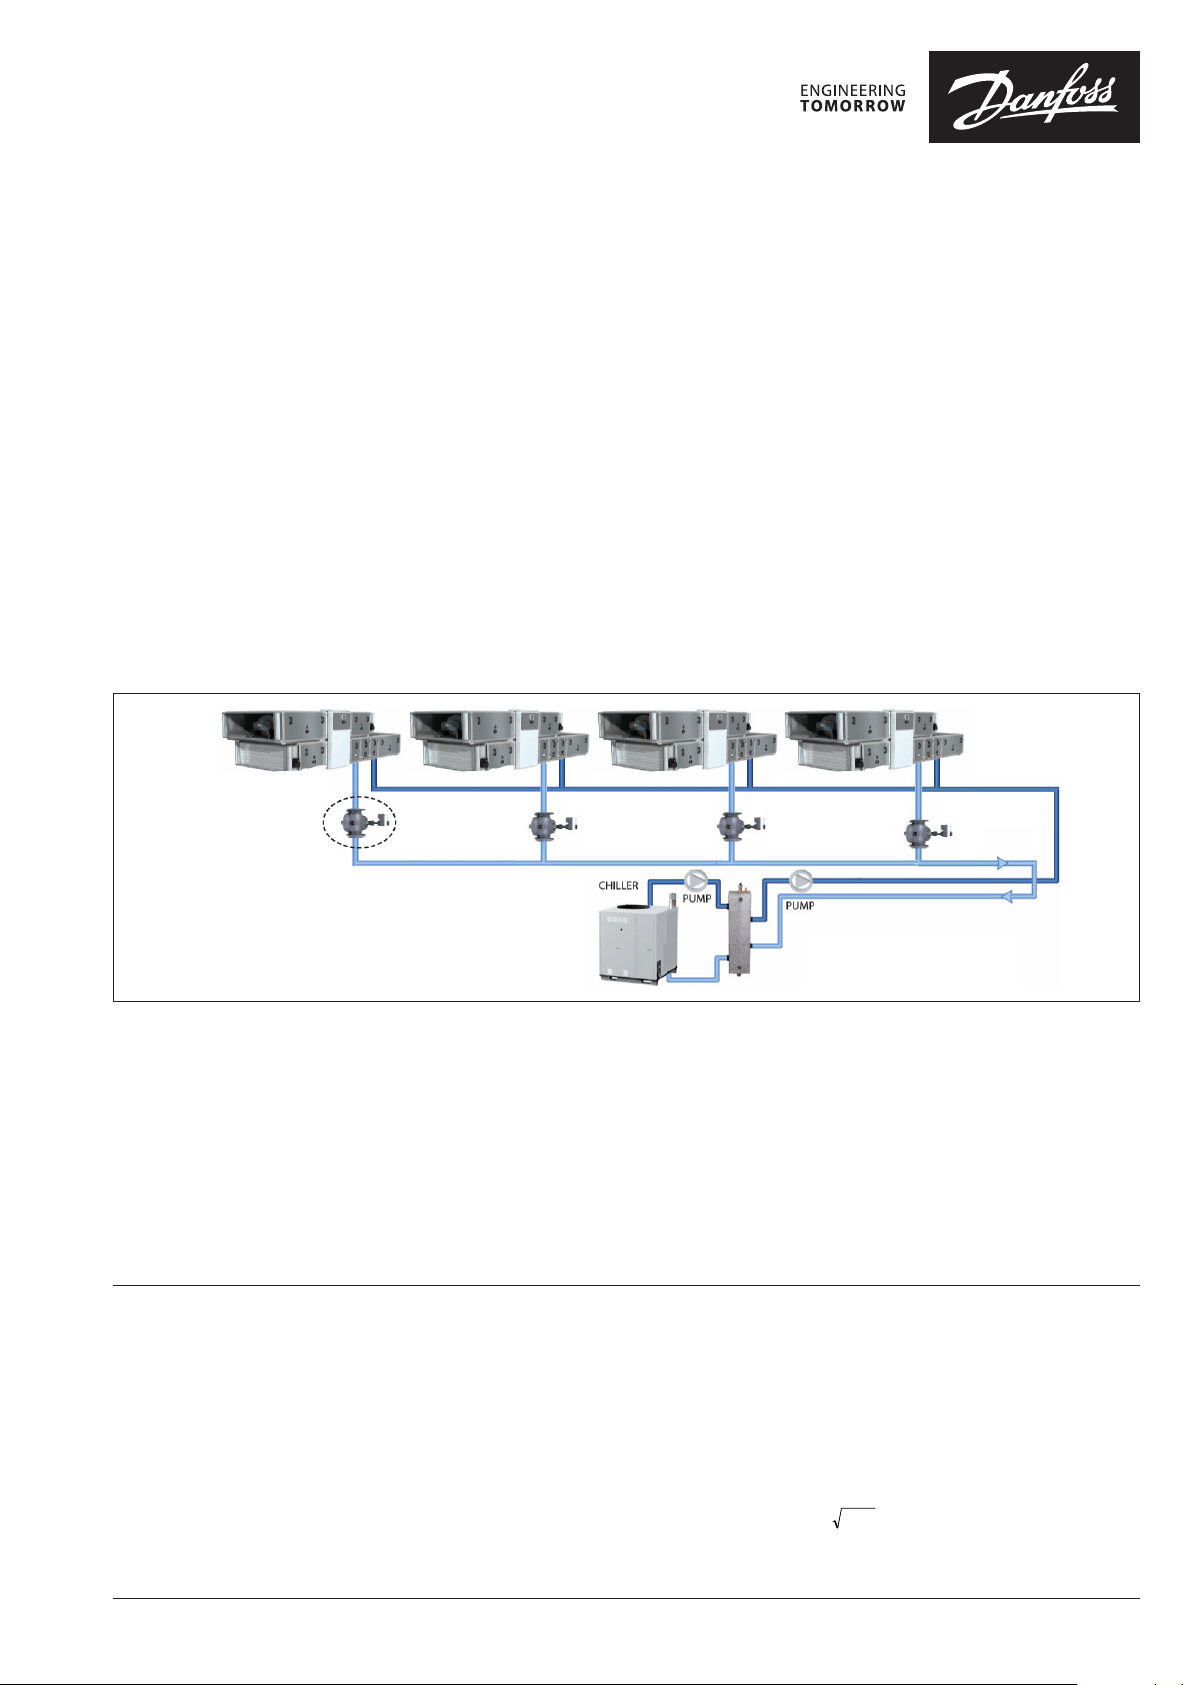
Fig. 1
To verify that an installation functions according
to the design specif ications checking only the
most critical valve in the installation is needed
(see f igure 1).
The AB-QM maintains a constant differential
pressure over the valve and any excess pressure
will automatically be throttled. If there is not
enough differential pressure the valve cannot
reach the set f low.
The valve that is furthest away from the pump or
the valve in the circuit with the highest resistance
has the lowest available differential pressure, so
if this critical valve has enough pressure it means
the other valves will also function properly.
Important:
To get a useful measurement the installation
should run on full load, so all actuators in
the installation should be opened fully. This
ensures that you are measuring under the most
unfavorable circumstances. The AB-QM’s will
have more differential pressure available when
the installation is working on partial load.
To get useful measurement the commisioning
zone should run on full load, so all actuators in
the installation should be opened fully. Please
check if coincidence factor was taken into
consideration.
Method of verif ication
AB-QM DN40-250
Method of measurement
AB-QM DN40-250
AB-QM 4.0 DN15-20
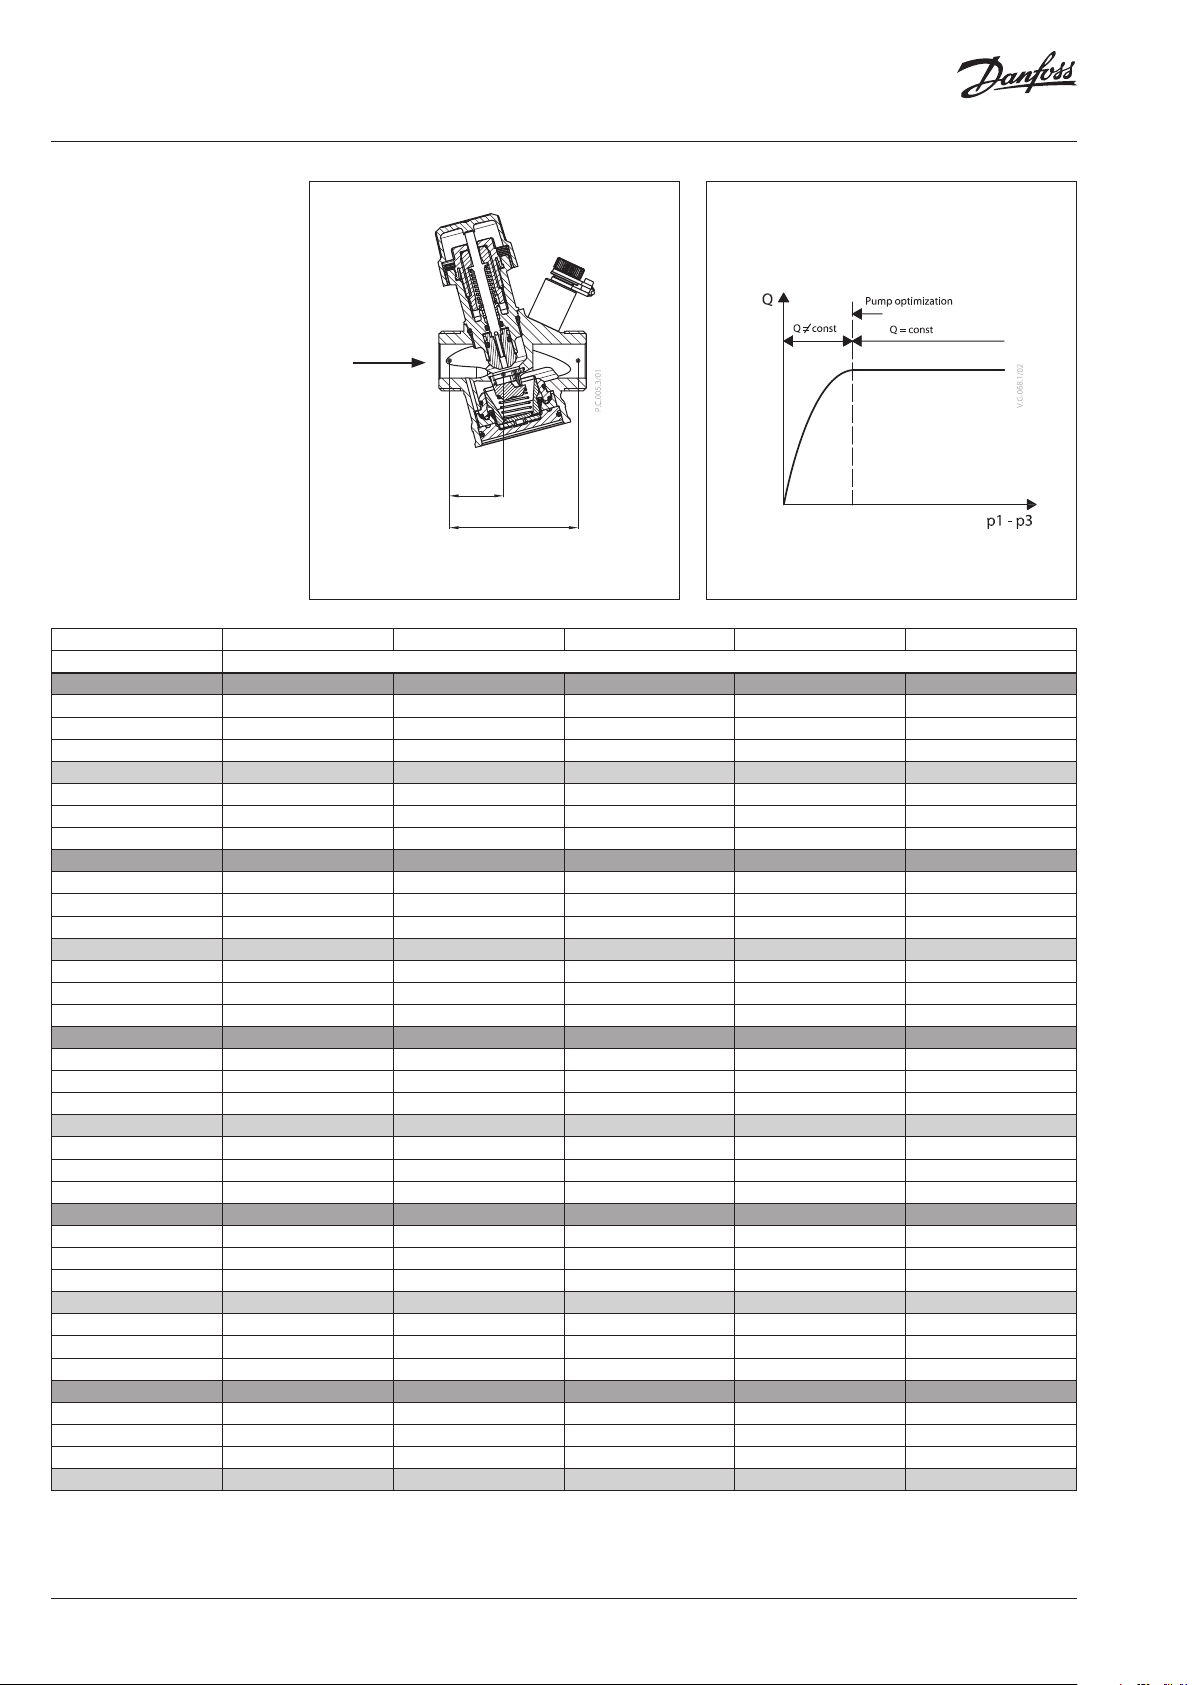
Measure the differential pressure across the
whole valve.
The test plugs are placed in such a way that
differential pressure p1−p3 (Δp) over the valve is
measured (see f igure 2).
If the measured value is below 30 kPa then there
is not enough differential pressure available for
the AB-QM to function properly. If the measured
value is above 30 kPa then the AB-QM has
enough differential pressure available and the
f low is according to the setting (see f igure 3).
Measure the differential pressure across the
control valve.
The test plugs are placed in such a way that
p1−p2 is measured (see f igure 2).
Therefore the measured differential pressure
can be used to calculate the f low directly. It’s
necessary to use the table that was derived from
statistical measurements
Since the measurements across the measuring
points are inf luenced by the dynamic pressure,
turbulences, f low patterns, internal tolerances,
setting accuracy and accuracy of the measuring
Setting the f low
DN 40-100: 1 turn=10 %
DN 125-250: 1 turn=5.0 %
Note: for more infor mation about setting p rocedure please refer
to instructio ns
equipment we believe that the total accuracy of
the measurement is lower than performance of
the valve.
Therefore we recommend not to adjust the
setting when the results are within 10 % of the
expected f low.
Calculating the f low
ΔpCv = p1−p2
pkv
CvCv
For kvCv values see tables in figure 4 and 7
© Danfoss | 2022.01 AM322356127863en-000102 | 1
Page 2
Fact sheet AB-QM f low checker DN 40-250 and AB-QM 4.0 DN15-20
AB-QM 4.0 DN 15-20
Flow
direction
p1−p2
Δp=p1−p3
∆p
min
DN 15-20
Fig. 2
Presetting
s (%)
10 0 .0 411 0.145 0.2588 0.18 0 0.4152
12. 5 0.0531 0 .180 0.34 0.240 0.5346
15 0.0 659 0.215 0.4085 0.300 0.6472
17. 5 0.0779 0.250 0.4754 0.360 0.7515
20 0.0890 0.285 0 .5426 0.420 0. 8558
22.5 0.1000 0.320 0.6095 0.490 0.9602
25 0. 1111 0.355 0 .6767 0.560 1.0645
27. 5 0.1221 0.390 0.7502 0.630 1.168 8
30 0.13 32 0.425 0.8237 0.70 0 1. 2815
32.5 0 .1442 0.460 0.8969 0.770 1. 3951
35 0.1570 0.495 0.9705 0.840 1.5023
37. 5 0 .1686 0.530 1.0407 0 .910 1.59 81
40 0.1796 0. 574 1.1076 0.980 1. 6939
42.5 0.1907 0 .618 1.174 8 1.050 1.7896
45 0.2018 0.662 1.2416 1.120 1.8854
47. 5 0 .2129 0.706 1.3165 1.19 0 1.98 12
50 0.2245 0.750 1. 3887 1.260 2.0770
52.5 0.2360 0.798 1.4579 1. 330 2.1728
55 0.2476 0 .847 1. 5274 1.400 2.2247
57. 5 0. 2592 0.895 1.59 66 1.470 2.2582
60 0.2707 0.943 1.6 657 1. 540 2. 2916
62.5 0.2823 0.992 1.7 342 1. 610 2 .3251
65 0.2939 1.04 0 1.79 1.665 2.3587
67. 5 0.3054 1.08 8 1.846 1. 720 2.3972
70 0. 3172 1.135 1.902 1.775 2.4356
72.5 0.3293 1.183 1.958 1.8 29 2. 4741
75 0. 3414 1.230 2 .0139 1.884 2 .5126
77. 5 0. 3535 1.278 2.0835 1.939 2 .5619
80 0.3655 1.325 2 .1364 1.99 6 2.6122
82.5 0.3765 1.373 2 .1756 2.054 2.6626
85 0.3876 1.420 2.217 2 2. 111 2.7245
87. 5 0.3986 1. 455 2.2722 2 .169 2.7897
90 0.4097 1. 490 2.3343 2 .2 11 3.1346
92.5 0.4226 1. 525 2.398 2.249 3.4703
95 0.4367 1.560 2.4778 2.288 3.554 4
97. 5 0.4509 1. 595 2. 5298 2.326 3.6422
100 0.4650 1.6 30 2.6 2.365 3.7300
Fig. 4 The f low is according to set ting if the calculated f low is in the range of ±10 % of the set flow.
DN 15 LF DN 15 NF DN 15 HF DN 20 NF DN 20 HF
kv
Cv
Fig. 3
(m3/h)
2 | AM322356127863en-000102 © Danfoss | 2022.01
Page 3

Fact sheet AB-QM f low checker DN 40-250 and AB-QM 4.0 DN15-20
AB-QM DN 40-100
Δp=p1−p3
p1−p2
Flow
direction
∆p
min
DN 40-100
Fig. 4
Presetting DN 40 DN 50 / DN 50H F DN 65 / DN 65HF DN 80 / DN 80HF DN 100 / DN 100HF
s (%) kvCv (m3/h)
20.0 3.40 4.60 4. 20 15. 50 19. 50
22.5 4.08 5.55 5.48 17.1 9 21.94
25.0 4.80 6. 50 6.75 18.88 24.38
27. 5 5.43 7. 45 8.03 20.56 26. 81
30.0 6.10 8.40 9.30 22.25 29.25
32.5 6 .78 9.35 10.58 23.94 31.69
35.0 7. 50 10. 30 11. 85 25.63 34.13
37. 5 8.13 11. 25 13 .13 2 7.31 36.56
40.0 8.80 12.2 0 14 .40 29.00 39.00
42.5 9.48 13.15 15.68 30.69 41.4 4
45.0 10.20 14 .10 16.95 32.38 43.88
47. 5 10. 83 15.05 18.23 34.06 46.31
50.0 11. 50 16.00 19. 50 35.75 48.75
52.5 12.18 16 .95 20.78 37. 44 51.19
55.0 12 .90 17.90 22.05 3 9.13 53.63
57. 5 13 .53 18 .85 23.33 40.81 56.06
60.0 14 .20 19.80 24.60 42. 50 58.50
62.5 14. 88 20.75 25.88 4 4.19 60.94
65.0 15. 55 21.70 27.15 45.88 63.38
67. 5 16.26 22.65 28.43 47. 56 65. 81
70.0 16.90 23.60 29.70 49.2 5 68.25
72.5 17. 58 24.55 30.98 50.94 71.81
75.0 18.25 25.50 32.25 52.63 75.38
77. 5 18 .93 26.45 33.53 54.31 78 .94
80.0 19.6 0 27. 40 34.80 56.00 82.50
82.5 20.28 28.35 36.08 57. 69 86.06
85.0 20.95 29.30 3 7.35 59. 38 89. 63
87. 5 21. 63 30.25 38.63 61. 06 9 3.19
90.0 22.30 31. 20 39.90 62.75 96.75
92.5 22.98 32.15 41.18 64.44 100 .31
95.0 23.65 33.10 42.45 66 .13 103. 88
97. 5 24. 33 34.05 43.73 6 7.81 107. 44
100.0 25.00 35.00 45.00 69.50 111. 00
Fig. 5 The f low is according to set ting if the calculated f low is in the range of ±10 % of the set flow.
Fig. 5
AM322356127863en-000102 | 3© Danfoss | 2022.01
Page 4

Fact sheet AB-QM f low checker DN 40-250 and AB-QM 4.0 DN15-20
AB-QM DN 125-250
Flow
direction
Fig. 6 Fig. 7
Presetting DN 125 / DN 125HF DN 150 / DN 150HF DN 200 / DN 200H F DN 250 / DN 250 HF
s (%) kvCv (m3/h)
20.0 40 53 57 86
22.5 45 60 66 99
25.0 49 67 75 112
27. 5 53 74 85 125
30.0 57 81 94 13 8
32.5 61 88 10 4 150
35.0 65 95 113 163
37. 5 69 101 122 176
40.0 73 108 132 189
42.5 77 115 141 202
45.0 82 12 2 151 215
47. 5 86 12 9 160 227
50.0 90 13 6 17 0 240
52.5 94 143 179 253
55.0 98 15 0 188 266
57. 5 102 157 198 279
60.0 106 163 207 292
62.5 110 170 217 304
65.0 114 17 7 226 317
67. 5 119 184 235 330
70.0 123 191 245 343
72.5 127 198 254 356
75.0 131 205 264 369
77. 5 135 212 273 381
80.0 139 219 283 394
82.5 143 225 292 407
85.0 147 232 301 420
87. 5 152 239 311 433
90.0 156 246 320 446
92.5 160 253 330 458
95.0 164 260 339 471
97. 5 168 267 348 484
100.0 172 274 358 497
102. 5 176 281 367 510
105.0 180 287 377 523
107.5 184 294 386 535
110 .0 189 3 01 396 548
Fig. 7 The f low is according to set ting if the calculated f low is in the range of ±10 % of the set flow.
Δp=p1−p3
p1−p2
DN 125-250
∆p
min
© Danfoss | DCS-SGDPT/SI | 2022.014 | AM322356127863en-000102
 Loading...