

Cytek Biosciences Aurora User Manual
Aurora™ User’s Guide

Copyrights
©2017, Cytek Biosciences Inc. All rights reserved. No part of this publication may be reproduced, transmitted, transcribed, stored in retrieval systems, or translated into any language or computer language, in any form or by any means:
electronic, mechanical, magnetic, optical, chemical, manual, or otherwise, without prior written permission from Cytek
Biosciences.
The information in this guide is subject to change without notice. Cytek Biosciences reserves the right to change its products and services at any time to incorporate the latest technological developments. Although this guide has been prepared with every precaution to ensure accuracy, Cytek Biosciences assumes no liability for any errors or omissions, nor
for any damages resulting from the application or use of this information. Cytek Biosciences welcomes customer input
on corrections and suggestions for improvement.
Trademarks
Cytek, the Cytek logo, and all other trademarks are property of Cytek Biosciences. © 2017 Cytek
FCC Information
WARNING: Changes or modifications to this unit not expressly approved by the party responsible for compliance could
void the user's authority to operate the equipment.
NOTICE: This equipment has been tested and found to comply with the limits for a Class A digital device, pursuant to Part
15 of the FCC Rules. These limits are designed to provide reasonable protection against harmful interference when the
equipment is operated in a commercial environment. This equipment generates, uses, and can radiate radio frequency
energy and, if not installed and used in accordance with the instruction manual, can cause harmful interference to radio
communications. Operation of this equipment in a residential area is likely to cause harmful interference in which case
the user will be required to correct the interference at his or her own expense.
Shielded cables must be used with this unit to ensure compliance with the Class A FCC limits.
This Class A digital apparatus meets all requirements of the Canadian Interference-Causing Equipment Regulations.
Cet appareil numérique de la classe A respecte toutes les exigences du Réglement sur le matériel brouilleur du Canada.
CDRH Information
This equipment complies with CDRH Class I requirements.
Regulatory Information
For Research Use Only. Not for use in diagnostic or therapeutic procedures.
History
Revision Date Change
52-70001-0A 10/2017 Initial release

Contents
Chapter 1: Introduction 7
About this Guide . . . . . . . . . . . . . . . . . . . . . . . . . . . . . . . . . . . . . . . . . . . . . . . . . . . . . . . . . . 7
Safety . . . . . . . . . . . . . . . . . . . . . . . . . . . . . . . . . . . . . . . . . . . . . . . . . . . . . . . . . . . . . . . . . . . 7
Safety Symbols . . . . . . . . . . . . . . . . . . . . . . . . . . . . . . . . . . . . . . . . . . . . . . . . . . . . . . . . 7
General Safety . . . . . . . . . . . . . . . . . . . . . . . . . . . . . . . . . . . . . . . . . . . . . . . . . . . . . . . . 7
Electrical Safety . . . . . . . . . . . . . . . . . . . . . . . . . . . . . . . . . . . . . . . . . . . . . . . . . . . . . . . . 8
Biological Safety . . . . . . . . . . . . . . . . . . . . . . . . . . . . . . . . . . . . . . . . . . . . . . . . . . . . . . . 8
Technical Support . . . . . . . . . . . . . . . . . . . . . . . . . . . . . . . . . . . . . . . . . . . . . . . . . . . . . . . . . 8
Chapter 2: Overview 9
Cytometer Overview . . . . . . . . . . . . . . . . . . . . . . . . . . . . . . . . . . . . . . . . . . . . . . . . . . . . . 10
Fluidics . . . . . . . . . . . . . . . . . . . . . . . . . . . . . . . . . . . . . . . . . . . . . . . . . . . . . . . . . . . . . . 11
Optics . . . . . . . . . . . . . . . . . . . . . . . . . . . . . . . . . . . . . . . . . . . . . . . . . . . . . . . . . . . . . . . 14
Software Overview . . . . . . . . . . . . . . . . . . . . . . . . . . . . . . . . . . . . . . . . . . . . . . . . . . . . . . . 15
Spectral Unmixing . . . . . . . . . . . . . . . . . . . . . . . . . . . . . . . . . . . . . . . . . . . . . . . . . . . . 16
Understanding Full Spectrum Flow Cytometry . . . . . . . . . . . . . . . . . . . . . . . . . . . . 16
Reference Spectra . . . . . . . . . . . . . . . . . . . . . . . . . . . . . . . . . . . . . . . . . . . . . . . . . . . . 16
Chapter 3: Startup & Shutdown 17
Filling the Sheath and Emptying the Waste . . . . . . . . . . . . . . . . . . . . . . . . . . . . . . . . . . 17
Filling the Sheath . . . . . . . . . . . . . . . . . . . . . . . . . . . . . . . . . . . . . . . . . . . . . . . . . . . . . 17
Emptying the Waste . . . . . . . . . . . . . . . . . . . . . . . . . . . . . . . . . . . . . . . . . . . . . . . . . . . 18
Starting Up the System . . . . . . . . . . . . . . . . . . . . . . . . . . . . . . . . . . . . . . . . . . . . . . . . . . . 19
Shutting Down the System . . . . . . . . . . . . . . . . . . . . . . . . . . . . . . . . . . . . . . . . . . . . . . . . 20
Chapter 4: QC & Setup 21
Daily QC . . . . . . . . . . . . . . . . . . . . . . . . . . . . . . . . . . . . . . . . . . . . . . . . . . . . . . . . . . . . . . . . 21
Performing Daily QC . . . . . . . . . . . . . . . . . . . . . . . . . . . . . . . . . . . . . . . . . . . . . . . . . . 21
QC Report . . . . . . . . . . . . . . . . . . . . . . . . . . . . . . . . . . . . . . . . . . . . . . . . . . . . . . . . . . . 23
Instrument Setup - Reference Controls . . . . . . . . . . . . . . . . . . . . . . . . . . . . . . . . . . . . . . 25
Creating Reference Controls . . . . . . . . . . . . . . . . . . . . . . . . . . . . . . . . . . . . . . . . . . . . 25
Running Reference Controls . . . . . . . . . . . . . . . . . . . . . . . . . . . . . . . . . . . . . . . . . . . . 27
Updating Reference Controls . . . . . . . . . . . . . . . . . . . . . . . . . . . . . . . . . . . . . . . . . . . 29
Levey-Jennings Tracking . . . . . . . . . . . . . . . . . . . . . . . . . . . . . . . . . . . . . . . . . . . . . . . . . . 29
Gain Settings . . . . . . . . . . . . . . . . . . . . . . . . . . . . . . . . . . . . . . . . . . . . . . . . . . . . . . . . . 30
Alarm Ranges . . . . . . . . . . . . . . . . . . . . . . . . . . . . . . . . . . . . . . . . . . . . . . . . . . . . . . . . 30
Chapter 5: Acquisition 31
Raw vs Unmixed data . . . . . . . . . . . . . . . . . . . . . . . . . . . . . . . . . . . . . . . . . . . . . . . . . . . . . 31
Unmixing and Compensation . . . . . . . . . . . . . . . . . . . . . . . . . . . . . . . . . . . . . . . . . . . 31
iii

Setting Up an Experiment . . . . . . . . . . . . . . . . . . . . . . . . . . . . . . . . . . . . . . . . . . . . . . . . . 32
Experiment Display . . . . . . . . . . . . . . . . . . . . . . . . . . . . . . . . . . . . . . . . . . . . . . . . . . . 33
Creating a New Experiment . . . . . . . . . . . . . . . . . . . . . . . . . . . . . . . . . . . . . . . . . . . . 38
Unmixing Workflows . . . . . . . . . . . . . . . . . . . . . . . . . . . . . . . . . . . . . . . . . . . . . . . . . . . . . 42
Live Unmixing . . . . . . . . . . . . . . . . . . . . . . . . . . . . . . . . . . . . . . . . . . . . . . . . . . . . . . . . 43
Post-Acquisition Unmixing . . . . . . . . . . . . . . . . . . . . . . . . . . . . . . . . . . . . . . . . . . . . . 45
Chapter 6: Advanced Unmixing 47
Unmixing in the Analysis Workspace . . . . . . . . . . . . . . . . . . . . . . . . . . . . . . . . . . . . . . . . 47
Virtual Filters . . . . . . . . . . . . . . . . . . . . . . . . . . . . . . . . . . . . . . . . . . . . . . . . . . . . . . . . . . . . 51
Chapter 7: Library, Preferences, and Users 55
Library . . . . . . . . . . . . . . . . . . . . . . . . . . . . . . . . . . . . . . . . . . . . . . . . . . . . . . . . . . . . . . . . . 55
Fluorescent Tags . . . . . . . . . . . . . . . . . . . . . . . . . . . . . . . . . . . . . . . . . . . . . . . . . . . . . . 55
Labels . . . . . . . . . . . . . . . . . . . . . . . . . . . . . . . . . . . . . . . . . . . . . . . . . . . . . . . . . . . . . . . 56
User Settings . . . . . . . . . . . . . . . . . . . . . . . . . . . . . . . . . . . . . . . . . . . . . . . . . . . . . . . . . 57
Worksheet Templates . . . . . . . . . . . . . . . . . . . . . . . . . . . . . . . . . . . . . . . . . . . . . . . . . 58
Experiment Templates . . . . . . . . . . . . . . . . . . . . . . . . . . . . . . . . . . . . . . . . . . . . . . . . 58
Preferences . . . . . . . . . . . . . . . . . . . . . . . . . . . . . . . . . . . . . . . . . . . . . . . . . . . . . . . . . . . . . 59
Acquisition . . . . . . . . . . . . . . . . . . . . . . . . . . . . . . . . . . . . . . . . . . . . . . . . . . . . . . . . . . . 59
Worksheet . . . . . . . . . . . . . . . . . . . . . . . . . . . . . . . . . . . . . . . . . . . . . . . . . . . . . . . . . . . 60
Plot . . . . . . . . . . . . . . . . . . . . . . . . . . . . . . . . . . . . . . . . . . . . . . . . . . . . . . . . . . . . . . . . . 61
Gates . . . . . . . . . . . . . . . . . . . . . . . . . . . . . . . . . . . . . . . . . . . . . . . . . . . . . . . . . . . . . . . 62
Statistics . . . . . . . . . . . . . . . . . . . . . . . . . . . . . . . . . . . . . . . . . . . . . . . . . . . . . . . . . . . . . 63
Fonts . . . . . . . . . . . . . . . . . . . . . . . . . . . . . . . . . . . . . . . . . . . . . . . . . . . . . . . . . . . . . . . . 64
Notifications . . . . . . . . . . . . . . . . . . . . . . . . . . . . . . . . . . . . . . . . . . . . . . . . . . . . . . . . . 65
Storage . . . . . . . . . . . . . . . . . . . . . . . . . . . . . . . . . . . . . . . . . . . . . . . . . . . . . . . . . . . . . . 65
QC Setup . . . . . . . . . . . . . . . . . . . . . . . . . . . . . . . . . . . . . . . . . . . . . . . . . . . . . . . . . . . . 66
Users . . . . . . . . . . . . . . . . . . . . . . . . . . . . . . . . . . . . . . . . . . . . . . . . . . . . . . . . . . . . . . . . . . . 67
Managing Users . . . . . . . . . . . . . . . . . . . . . . . . . . . . . . . . . . . . . . . . . . . . . . . . . . . . . . 67
Use Time . . . . . . . . . . . . . . . . . . . . . . . . . . . . . . . . . . . . . . . . . . . . . . . . . . . . . . . . . . . . 68
Chapter 8: Maintenance 71
Maintenance Schedule . . . . . . . . . . . . . . . . . . . . . . . . . . . . . . . . . . . . . . . . . . . . . . . . . . . 71
Scheduled Maintenance . . . . . . . . . . . . . . . . . . . . . . . . . . . . . . . . . . . . . . . . . . . . . . . 71
Unscheduled Maintenance . . . . . . . . . . . . . . . . . . . . . . . . . . . . . . . . . . . . . . . . . . . . . 71
Cleaning the SIT . . . . . . . . . . . . . . . . . . . . . . . . . . . . . . . . . . . . . . . . . . . . . . . . . . . . . . . . . 72
Purging the Sheath Filter . . . . . . . . . . . . . . . . . . . . . . . . . . . . . . . . . . . . . . . . . . . . . . . . . 72
Removing Air Bubbles from the Flow Cell . . . . . . . . . . . . . . . . . . . . . . . . . . . . . . . . . . . . 73
Cleaning the Flow Cell . . . . . . . . . . . . . . . . . . . . . . . . . . . . . . . . . . . . . . . . . . . . . . . . . . . . 73
Decontaminating the Fluidics System . . . . . . . . . . . . . . . . . . . . . . . . . . . . . . . . . . . . . . . 74
Cleaning the External Surfaces . . . . . . . . . . . . . . . . . . . . . . . . . . . . . . . . . . . . . . . . . . . . . 75
Inspecting the Fluidics Lines . . . . . . . . . . . . . . . . . . . . . . . . . . . . . . . . . . . . . . . . . . . . . . 75
Replacing the Sheath Filter . . . . . . . . . . . . . . . . . . . . . . . . . . . . . . . . . . . . . . . . . . . . . . . . 75
Replacing the SIT . . . . . . . . . . . . . . . . . . . . . . . . . . . . . . . . . . . . . . . . . . . . . . . . . . . . . . . . 76
iv Aurora User’s Guide

Chapter 9: Troubleshooting 81
Chapter 10: Glossary 83
Chapter 11: Specifications 87
Cytometer . . . . . . . . . . . . . . . . . . . . . . . . . . . . . . . . . . . . . . . . . . . . . . . . . . . . . . . . . . . . . . 87
Optics . . . . . . . . . . . . . . . . . . . . . . . . . . . . . . . . . . . . . . . . . . . . . . . . . . . . . . . . . . . . . . 87
Fluidics . . . . . . . . . . . . . . . . . . . . . . . . . . . . . . . . . . . . . . . . . . . . . . . . . . . . . . . . . . . . . 88
Fluorescence Sensitivity . . . . . . . . . . . . . . . . . . . . . . . . . . . . . . . . . . . . . . . . . . . . . . . 88
Workstation . . . . . . . . . . . . . . . . . . . . . . . . . . . . . . . . . . . . . . . . . . . . . . . . . . . . . . . . . . . . 89
Installation Requirements . . . . . . . . . . . . . . . . . . . . . . . . . . . . . . . . . . . . . . . . . . . . . . . . 89
Chapter 12: Supplies and Replacement Parts 91
v

vi Aurora User’s Guide
Introduction
About this Guide
This manual provides information on the Aurora flow cytometer, daily workflow, SpectroFlo™
software features, cytometer specifications, and instrument maintenance. It also includes
troubleshooting tips and service information.
Safety
Safety Symbols
The Aurora is intended for research use only. Not for diagnostic or therapeutic procedures.
The following table lists symbols used throughout this guide.
1
Symbol Meaning
Caution: hazard or unsafe practice that could result in material damage,
data loss, minor or severe injury, or death
Risk of electric shock
Biological risk
General Safety
• Do not place any object on top of the instrument.
• Before turning on the cytometer, visually inspect all containers. Wear the recommended
protective laboratory attire such as protective gloves, eyewear, and lab coat.
• Purge the sheath filter if air bubbles are visible in the sheath filter, or if the plenum or sheath
container have run dry.
• Fill the sheath container as needed. Never use tap water as sheath solution.
• Do not run bleach or detergent through the sheath filter. It is difficult to remove cleaning
solutions from the sheath filter.
Chapter 1: Introduction 7

• Check the cytometer periodically for fluid leaks or crimped lines. If evidence of a leak is
detected, contact Cytek Technical Support immediately. Do not attempt to repair the
instrument.
• When performing daily QC, always select the correct bead lot number.
Electrical Safety
• Do not place liquids on top of the instrument. Any spill into the ventilation openings could
cause electrical shock or damage to the instrument.
Biological Safety
• Empty the waste container when filling the sheath container or as needed to prevent leakage.
Take care to avoid damaging the fluid level sensor in the waste tank.
• Biological samples are potentially dangerous and/or life threatening. Adhere to proper
handling procedures for samples and reagents. Wear appropriate laboratory attire such as
protective gloves, eyewear, and lab coat.
• Any instrument surface in contact with biological specimens can transmit potentially fatal
disease. Use universal precautions when cleaning the instrument or replacing parts.
• Concentrations of sodium hypochlorite higher than 10%, as well as other cleaning agents can
damage the instrument.
Technical Support
For instrument support within the US, call 1-877-92-CYTEK. Visit our website, www.cytekbio.com,
for up-to-date contact information.
When contacting Cytek, have the following information available:
• Serial number
• Any error messages
• Details of recent performance
8 Aurora User’s Guide
2
Overview
Aurora System
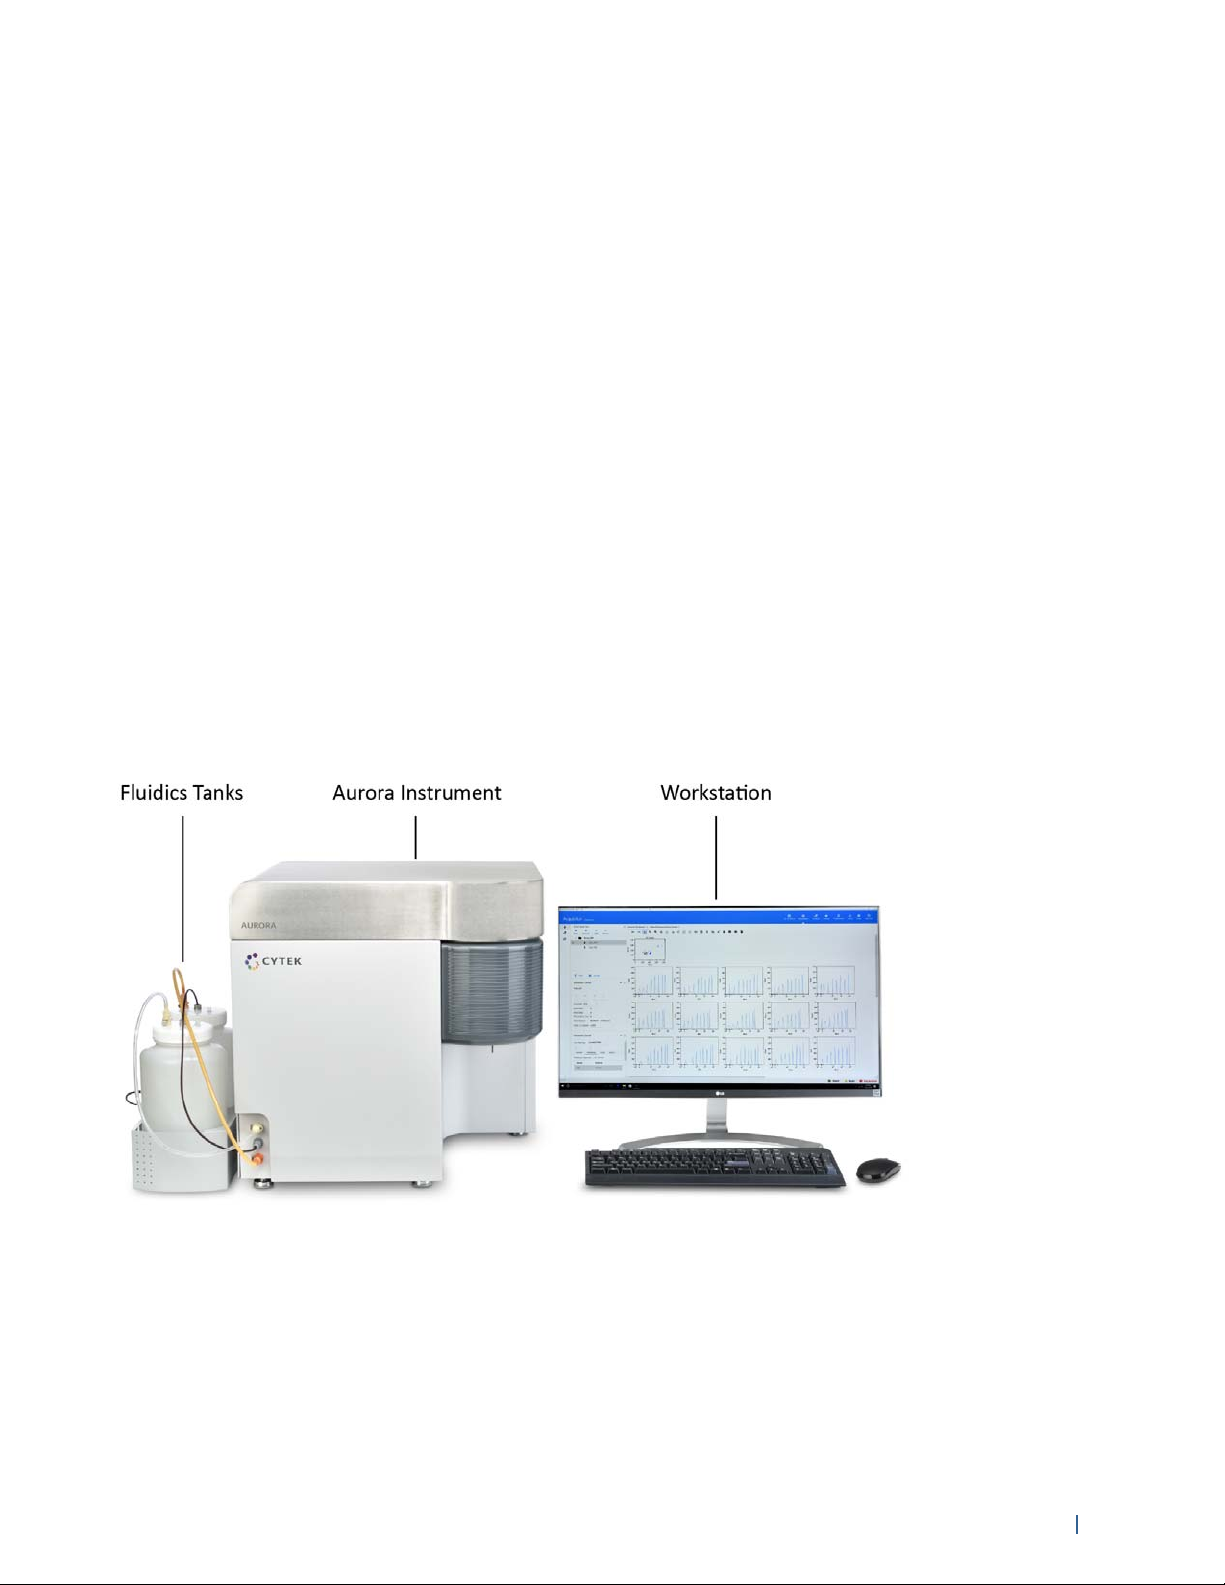
The Aurora system consists of the Aurora flow cytometer and a computer workstation running
SpectroFlo™ software for acquisition and analysis. The system also includes SpectroFlo QC beads.
The cytometer is an air-cooled, compact benchtop instrument. It is equipped with three lasers and
up to 48 detection channels for fluorescence, and up to two detection channels for scatter (FSC and
violet laser SSC). Sheath and waste fluids are contained in either 4-L tanks or 20-L cubitainers.
During operation the software notifies you when the fluid levels are getting high or low. The
pressurized fluidics system includes a plenum for storing sheath, allowing you to fill and empty the
fluids during operation.
The workstation is a dedicated USB-compatible PC with monitor, keyboard, and mouse. It runs
Microsoft® Windows® 10 Pro 64-bit operating system, which is required for SpectroFlo software.
Figure 1. Aurora System
Chapter 2: Overview 9

Cytometer Overview
SIT door
The Aurora spectral flow cytometer is an air-cooled, multi-laser, compact benchtop flow cytometer.
It is equipped with three lasers and up to 48 detection channels for fluorescence and up to two
detection channels for scatter (FSC [forward scatter] and violet laser SSC [side scatter]). Solid-state
lasers transmit light through a flow cell where particles in suspension are focused, single file for
interrogation by the laser. Proprietary, high-sensitivity, 16-channel semiconductor detector arrays
are equipped to capture the emission spectra of dyes that emit in the 400 to 900-nm wavelength
range. The resulting fluorescence and scatter are then collected and converted into electronic
signals. On-board electronics convert these signals into digital data that can be acquired and
recorded on the workstation.
The cytometer power button is located on the left side of the upper panel of the cytometer
(Figure 2). When the cytometer is powered on, the power button is illuminated.
The front panel opens on its hinges to the right to reveal the fluidics system. The top cover opens to
reveal the optics.
Front of Cytometer
Figure 2. Aurora front and left side panels
Do not place any object on top of the instrument.
Do not place liquids on top of the instrument. Fluid leaking into the cytometer could
cause electrical shock or damage to the instrument.
10 Aurora User’s Guide
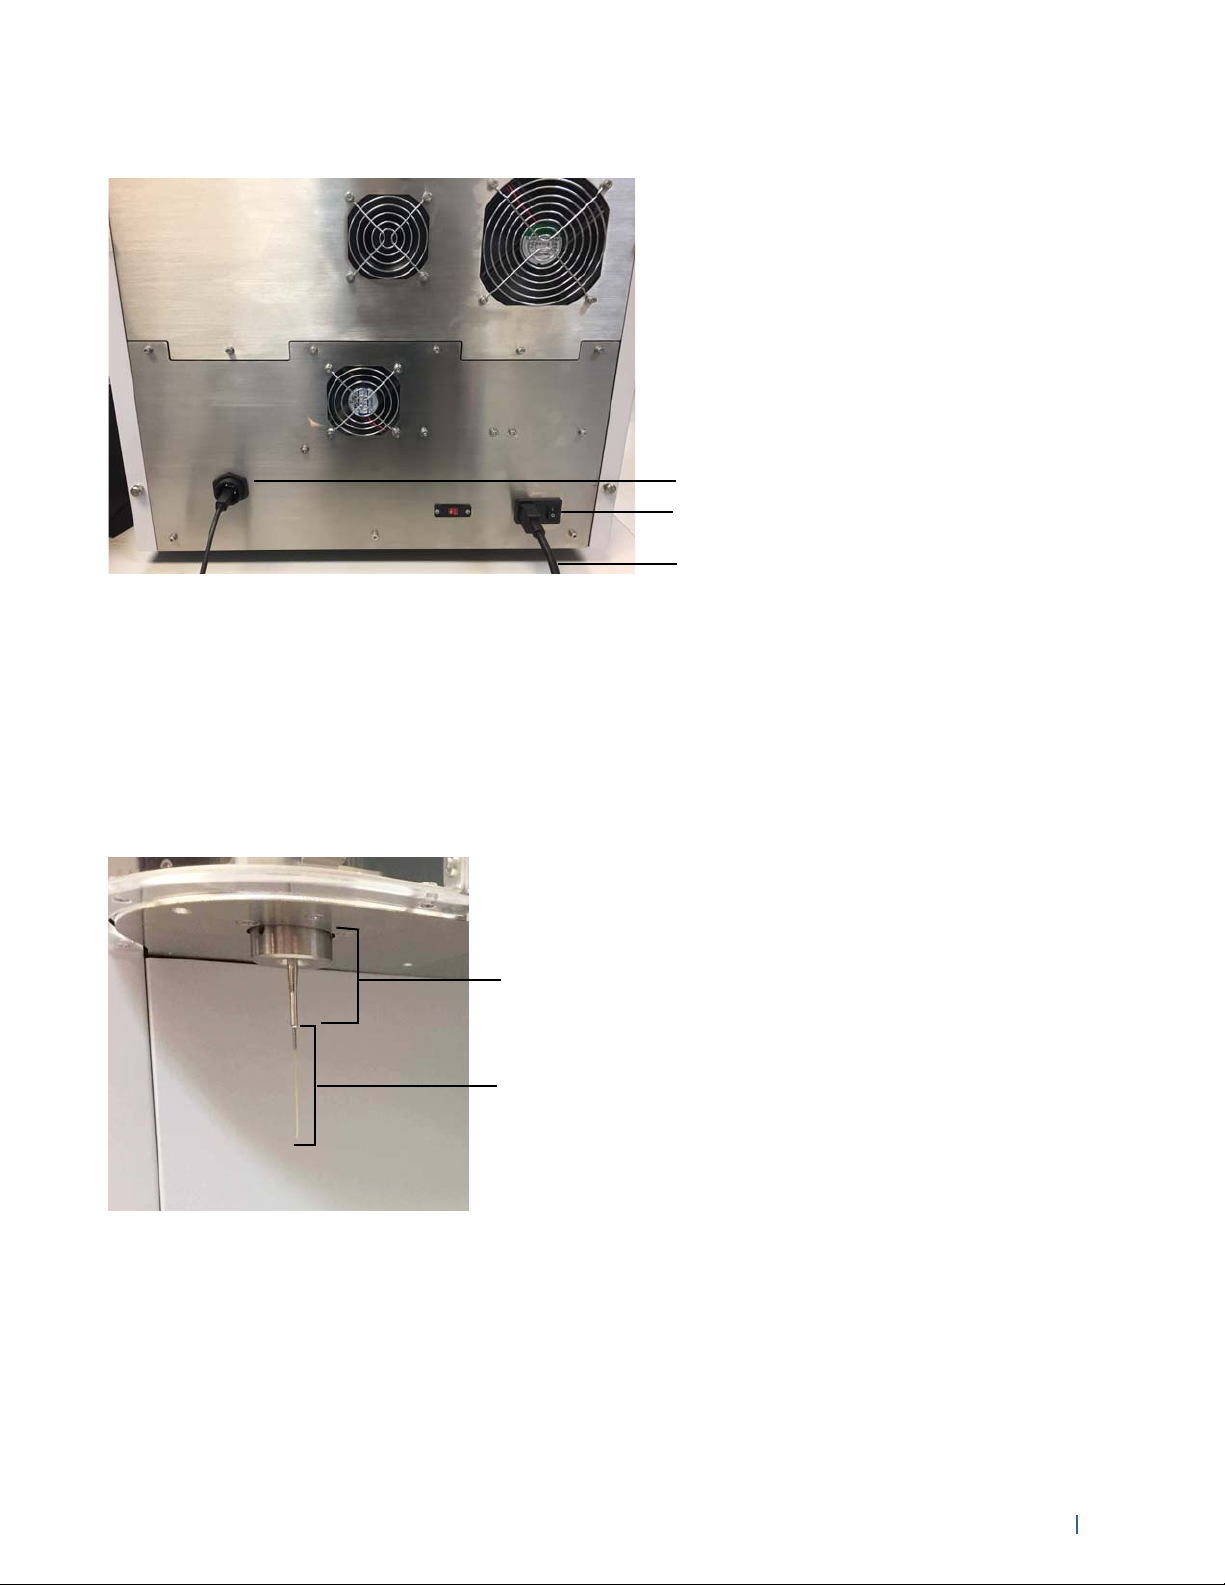
Back of Cytometer
USB connection to workstation
power cable
mains power switch
SIT
SIP
Allow 12.7 cm (5 in) between the back of the cytometer and the wall for proper ventilation.
Figure 3. Back of cytometer
Fluidics
Sample Injection Port/Sample Injection Tube
Sample, contained in a standard 12 x 75-mm tube, enters the cytometer through the sample
injection tube (SIT) that is contained within the sample injection port (SIP) [Figure 4]. The sample
tube snaps into place under the SIP requiring no additional tube retention support. The SIT extends
from the SIP during acquisition and retracts when the cytometer is not acquiring.
Figure 4. Sample injection port and sample injection tube
Fluid Containers
The Aurora draws sheath solution directly from a 20-L sheath cubitainer or the 4-L sheath tank
provided by Cytek. It expels waste into an empty 20-L cubitainer or the 4-L waste tank provided by
Cytek.
Chapter 2: Overview 11

The fluidics tanks are contained in a holding reservoir located on the left side of the cytometer
(Figure 5). The 4-L tank with the transparent fluidic line is for sheath solution. The 4-L tank with the
orange fluidic line is for waste.
Figure 5. Aurora fluidics bottles and front panel
Fluid Flow
The Aurora fluidics is driven by vacuum. An accumulator vessel is the source of vacuum for the
system. Sheath solution is drawn into and stored in the sheath plenum before passing through a
sheath filter where debris and contaminants are removed. Before reaching the flow cell, the sheath
stream passes through a degasser, which removes air bubbles. After passing the laser
interrogation point, the combination of sheath solution and sample travels to the waste container.
Sheath and waste fluid levels are monitored by sensors. The waste level sensor is located
underneath the waste tank cap. The sheath level sensor is located underneath the sheath plenum
cap. Both sensors are monitored by the software.
Figure 6. Aurora fluidics overview
12 Aurora User’s Guide
Fluidics Components
7
6
5
4
3
2
1
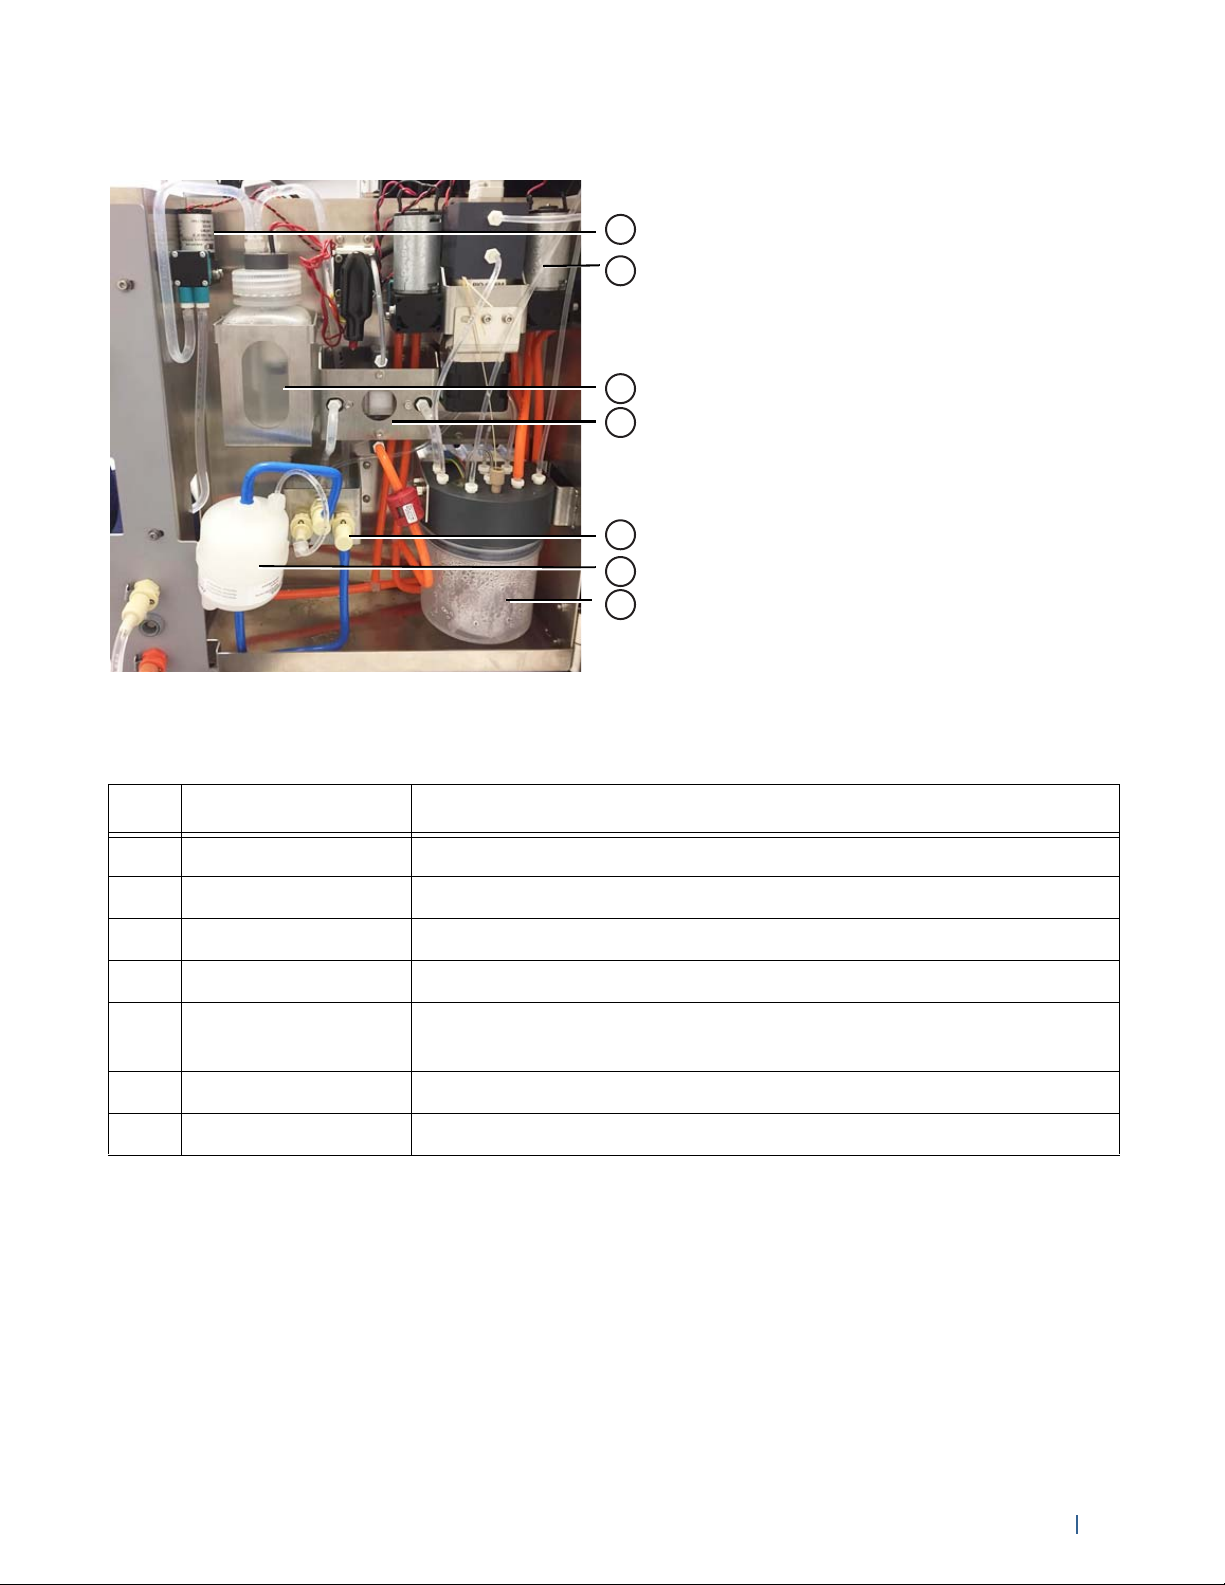
The following figure shows the fluidics components.
Figure 7. Fluidics components (inside fluidics compartment)
The following table describes the fluidics components.
No. Component Description
1 Plenum pump Pulls sheath from the sheath tank to fill the plenum
2 Vacuum pump Maintains the vacuum in the accumulator
3 Plenum Storage vessel for sheath fluid before it flows to the sheath filter
4 Degasser Removes air bubbles from the sheath fluid
5Sheath filter quick
Sheath filter fluid input, fluid output, and vent line quick-connects
connects (x3)
6 Sheath filter Filters debris and particles from the sheath fluid
7 Accumulator Vacuum source for the fluidics system
Chapter 2: Overview 13

Optics
Unlike conventional flow cytometers that direct specific bandwidths of fluorescence light into
discrete detectors or photomultiplier tubes (PMTs), the Aurora uses a solid-state, multi-channel,
narrow-beam detector array for each laser. Each array can be configured with up to 16 detectors
that are used to capture a part of the emission spectrum from each particle passing through the
laser beam. The detector channels from all three lasers are used to capture the entire emission
spectra from each fluorescent-labeled particle. Spectral deconvolution (unmixing) algorithms
calculate the contribution of the known individual fluorophore’s spectra to the total collected
signal.
Figure 8. Optical schematic
The default optical configuration has 16 channels for detection off the violet laser, 14 channels off
the blue laser, and 8 channels off the red laser. Detectors are referred to as V1–V16, B1–B14, and
R1–R8, for the violet, blue, and red lasers, respectively. The wavelengths detected by each detector
(channel) increase across the array. See the table on page 52 for details.
For excitation, a proprietary flat-top laser design enables a constant power distribution across the
width of the flow cell.
14 Aurora User’s Guide
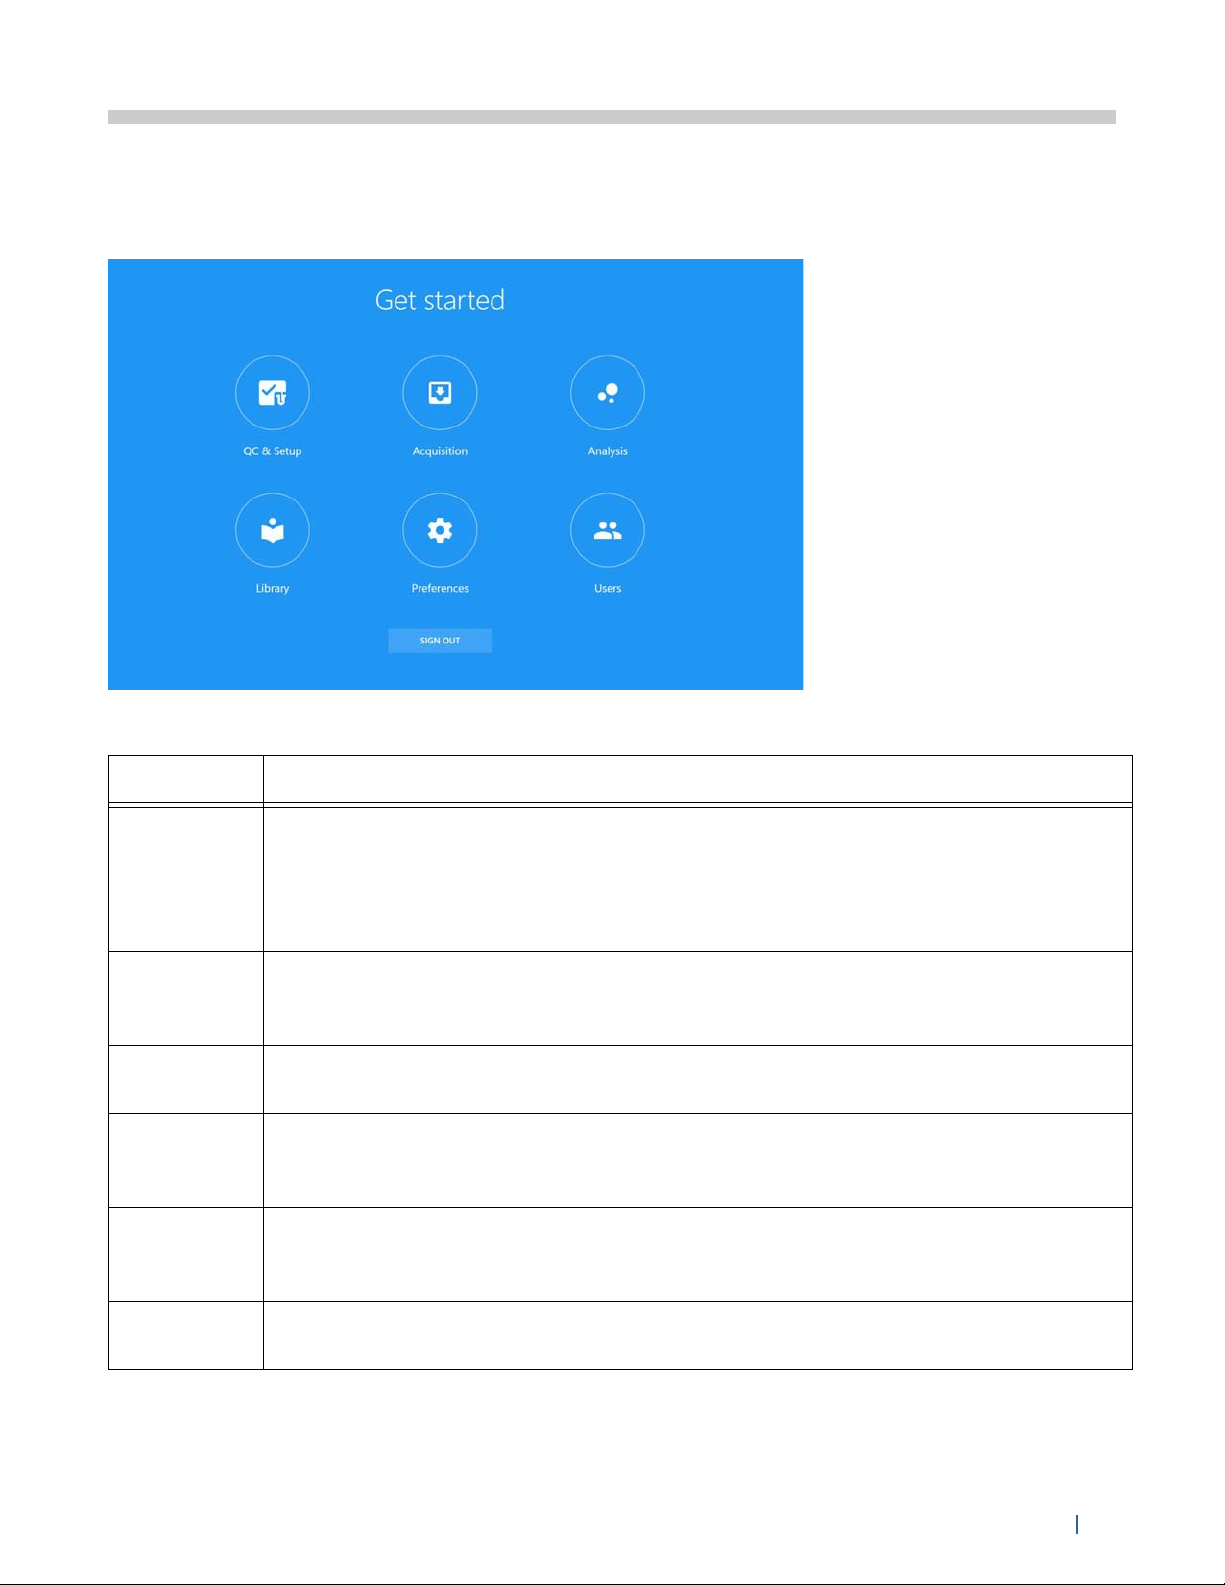
Software Overview
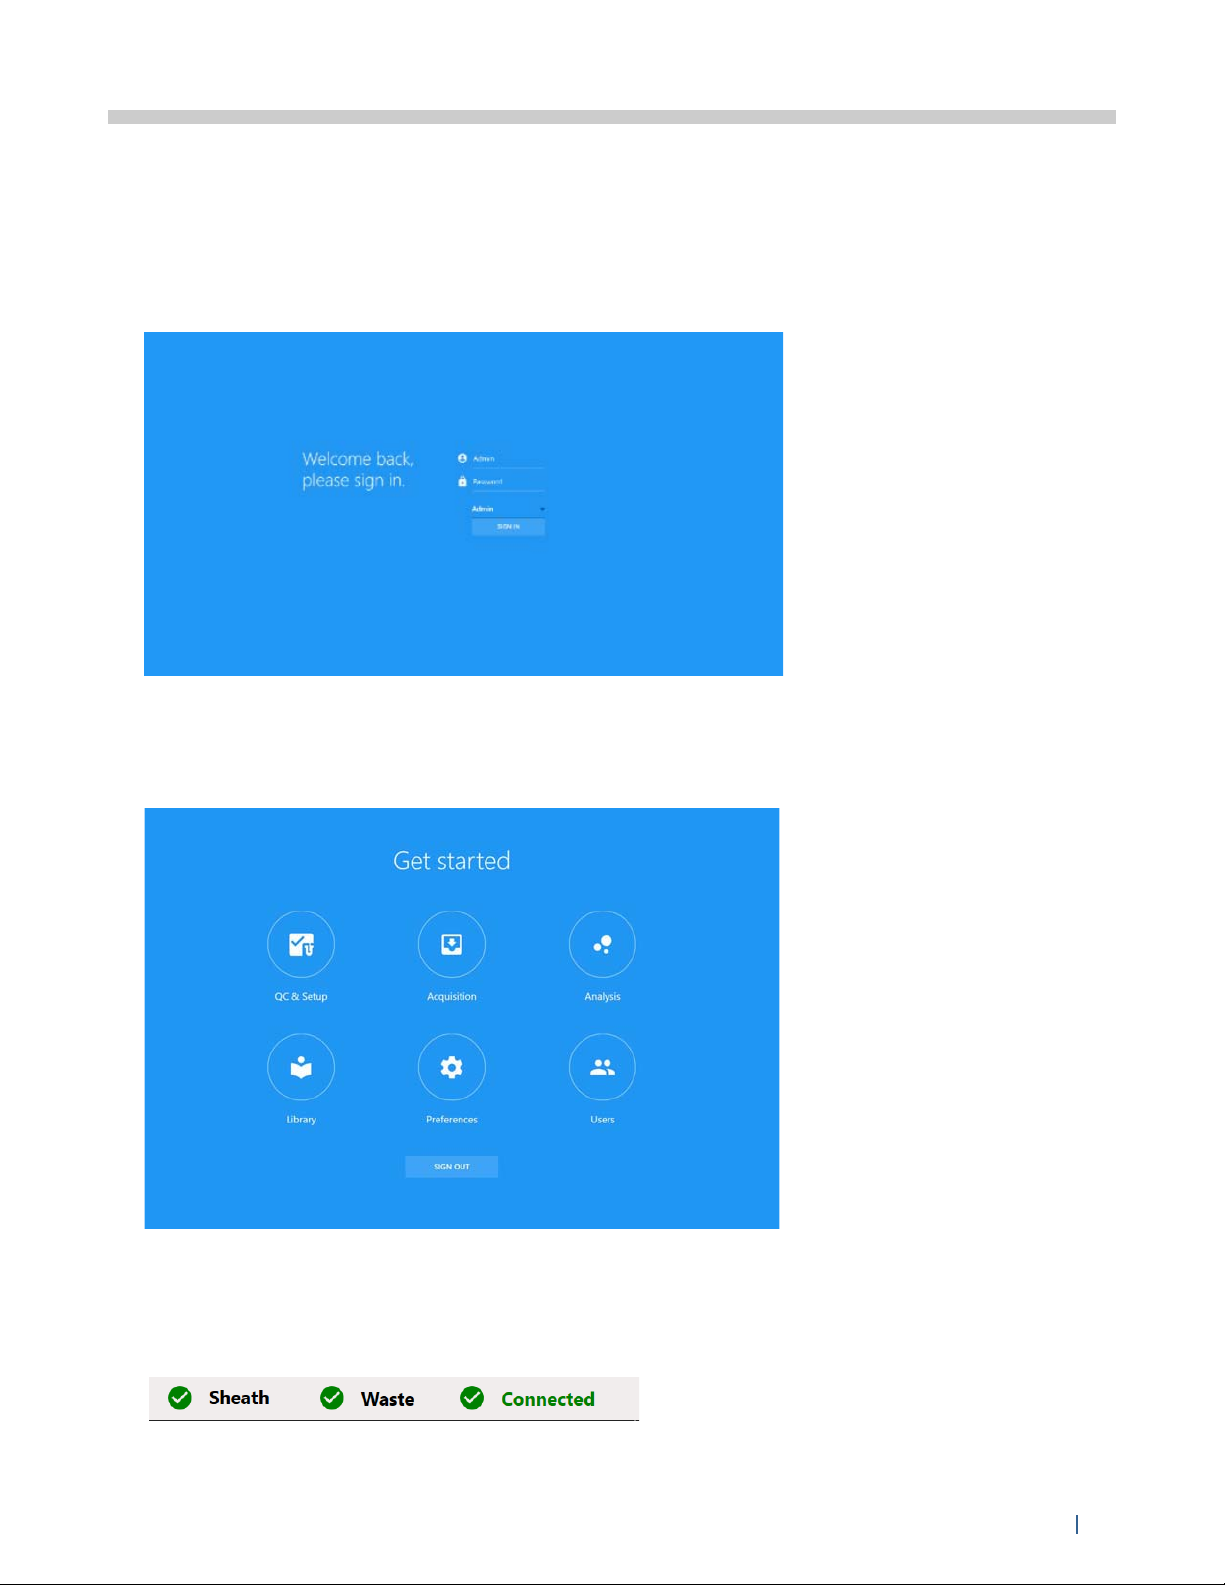
SpectroFlo software allows you to acquire and analyze samples and adjust instrument settings.
Once you log into the software, a Get started menu appears with six modules from which to
choose.
Six options provide workspaces that allow you to perform various functions.
Module Description
QC & Setup Daily QC ensures that the instrument is in optimal condition for use. Run
SpectroFlo QC beads daily to assess system performance and allow the software to
adjust settings for day-to-day variation. Levey-Jennings reports keep track of trends
in system performance. Setup allows you to create Reference Controls. See “QC &
Setup” on page 21 for more information.
Acquisition The Acquisition workspace allows you to create experiments to acquire and
analyze data. Experiments can be created through a guided wizard or created from
previously saved templates. See “Acquisition” on page 31 for more information.
Analysis Here, FCS files can either be unmixed or compensated using virtual filters. See
“Advanced Unmixing” on page 47 for more information.
Library The Library allows you to store experiment templates, worksheet templates, user
settings, fluorescent tags, SpectroFlo QC bead information, and label information.
See “Library” on page 55 for more information.
Preferences Software preferences can be changed to customize the software. Default plot sizes,
fonts, gate colors, print layouts, statistics box table option, and more can all be
changed in the Preferences. See “Preferences” on page 59 for more information.
Users The Users workspace contains user management options and administrative
controls. See “Users” on page 67 for more information.
Chapter 2: Overview 15
Spectral Unmixing
Spectral unmixing is an important concept to understand how data is generated and analyzed
using the Aurora flow cytometer with SpectroFlo software. Spectral unmixing is used to identify the
fluorescence signal for each fluorophore used in a given experiment.
Understanding Full Spectrum Flow Cytometry
Because fluorophores emit light over a range of wavelengths, optical filters are typically used to
limit the range of frequencies measured by a given detector. However, when two or more
fluorophores are used, the overlap in wavelength ranges often makes it impossible for optical
filters to isolate light from a given fluorophore. As a result, light emitted from one fluorophore
appears in a non-primary detector (a detector intended for another fluorophore). This is referred to
as spillover. In conventional flow cytometry spillover can be corrected by using a mathematical
calculation called compensation. Single-stained controls must be acquired to calculate the amount
of spillover into each of the non-primary detectors.
The Aurora's ability to measure a fluorochrome’s full emission spectra allows the system to use a
different method for isolating the desired signal from the unwanted signal. The key to differentiate
the various fluorochromes is for those to have distinct patterns or signatures across the full
spectrum. Because the system is looking at the full range of emission of a given fluorochrome, and
not only the peak emission, two dyes with similar emission but different spectral signatures can be
distinguished from each other. The mathematical method to differentiate the signals from multiple
fluorochromes is call spectral unmixing. Just as for compensation, single-stained controls,
identified in SpectroFlo software as Reference Controls, are still necessary, as they provide the full
fluorescence spectra information needed to perform spectral unmixing.
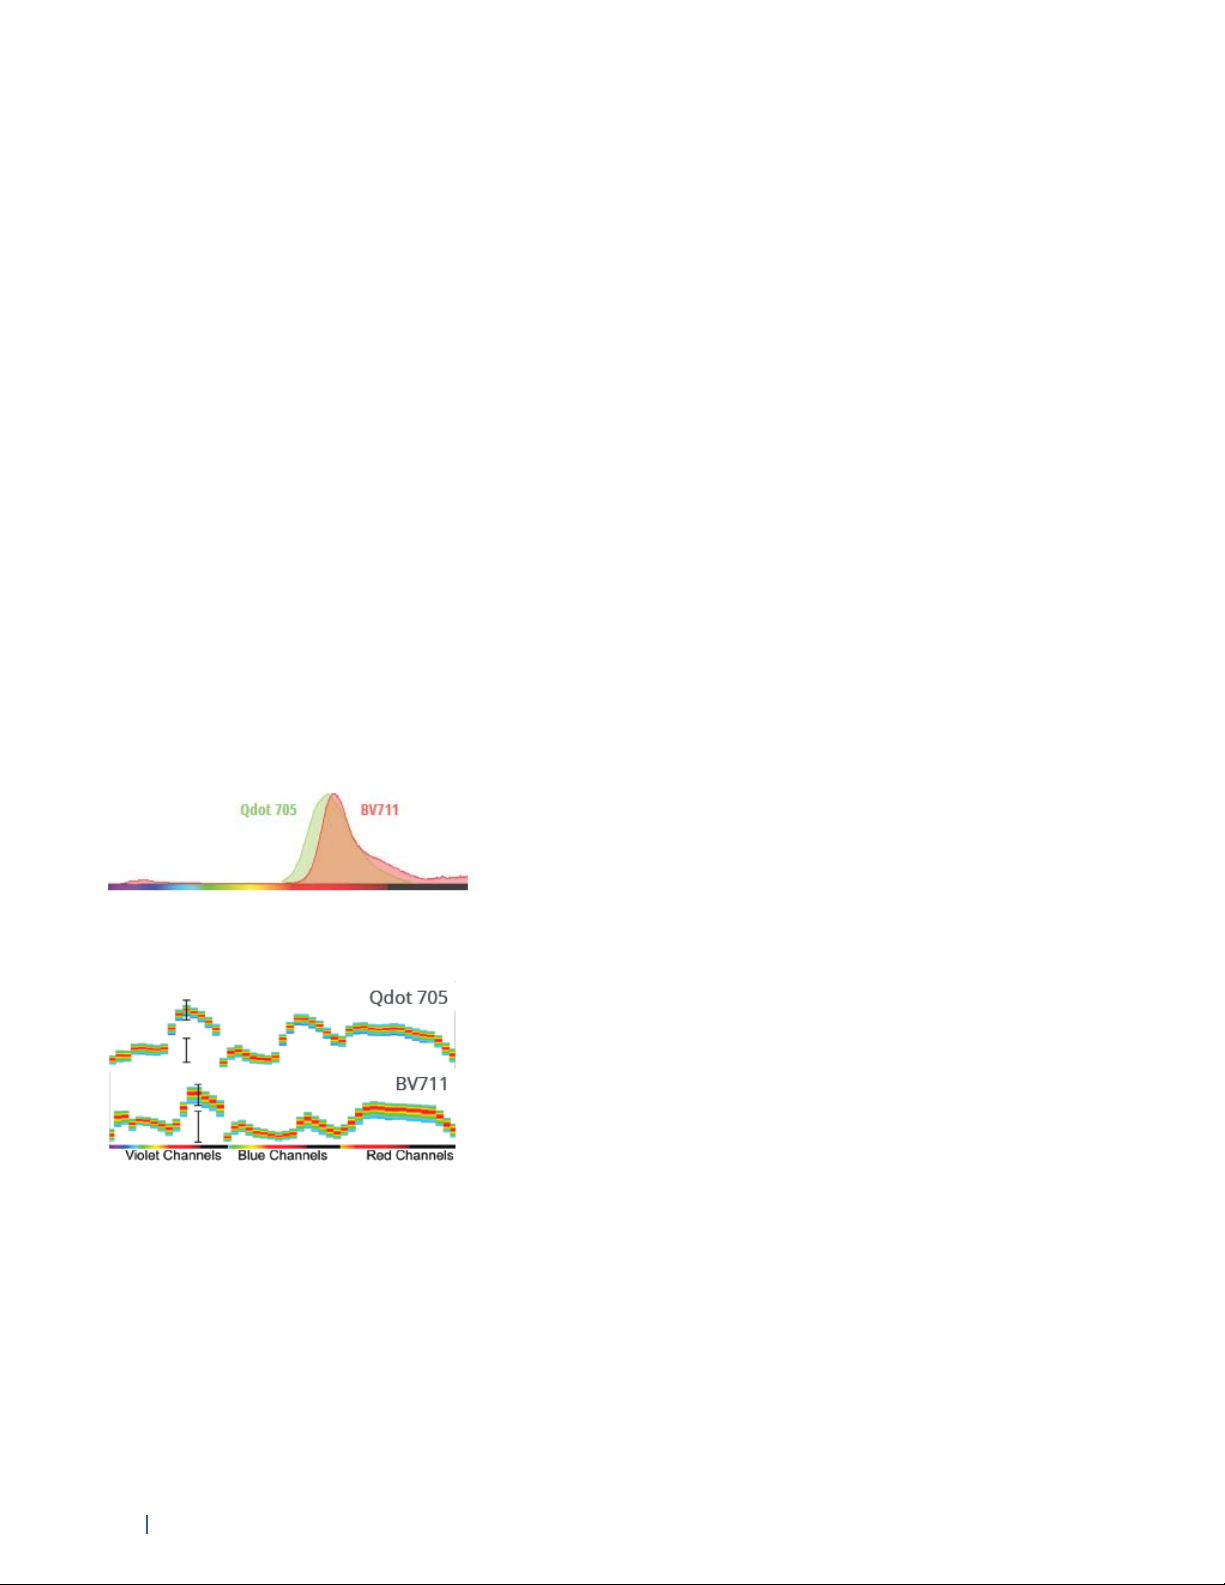
Spectrum plots from conventional spectrum viewer shows heavy overlap between Qdot 705 and BV711.
Spectrum plots from Aurora show distinct signatures for Qdot 705 and BV711.
Reference Spectra
Reference Controls, obtained by running single-stained and unstained samples, provide the
individual fluorescence spectra necessary to unmix the data. Either beads or cells can be stained
for use as Reference Controls. These controls can be acquired in the Reference Group of the
experiment during acquisition, or they can be acquired as Reference Controls in the QC & Setup
workspace. If Reference Controls are acquired in the QC & Setup workspace, they are stored and
can be used as Reference Controls for subsequent experiments.
16 Aurora User’s Guide
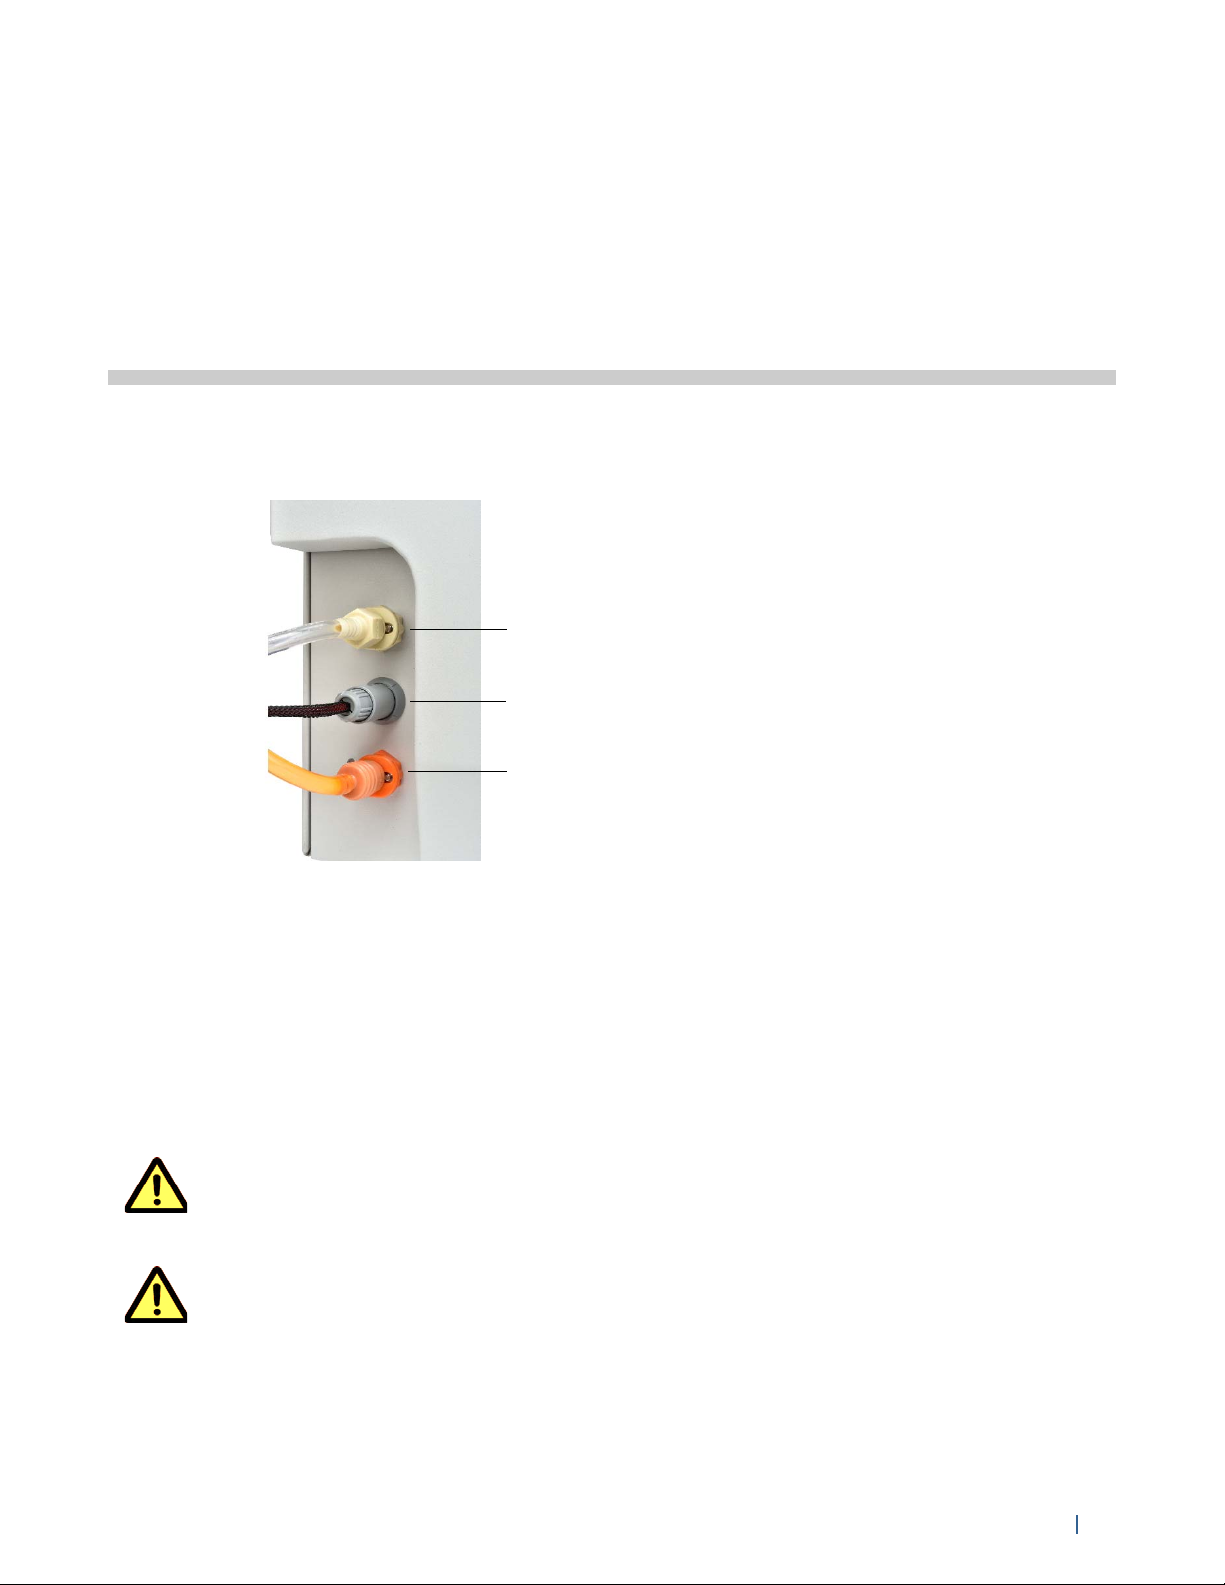
Startup & Shutdown
sheath line quick-connect
waste level sensor
waste line quick-connect
Filling the Sheath and Emptying the Waste
The color-coded sheath and waste quick-connects and the waste level sensor connector are
located at the lower-left corner of the front panel.
3
Figure 9. Sheath and waste line quick-connect and waste level sensor
Filling the Sheath
Fill the sheath container with manufacturer-provided sheath solution, MilliQ™ water, phosphatebuffered saline (PBS), or DI water.
Sheath can be drawn from either the supplied 4-L sheath tank or directly from a 20-L cubitainer.
Sheath solution can be added to the sheath container while the instrument is running. The plenum
provides 5 minutes of run time at any flow rate while the tank is being filled or replaced.
Before turning on the cytometer, visually inspect all containers. Wear the recommended
protective laboratory attire such as protective gloves, eyewear, and lab coat.
Fill the sheath container as needed. Use only the appropriate sheath solution. Never
use tap water in the sheath container.
Chapter 3: Startup & Shutdown 17
Filling Sheath into a Cytek 4-L Sheath Tank or a 20-L Cubitainer:
1 Remove the sheath fluidic line cap from the cubitainer or sheath tank lid from the Cytek sheath
tank.
2 Add the appropriate sheath solution.
3 Replace the fluidic line cap or sheath tank lid. Do not over-tighten.
4 If the cytometer is powered on and the software is connected, verify that the software sheath
indicator is green.
Emptying the Waste
Waste can be expelled into either the supplied 4-L waste tank or directly into an empty 20-L
cubitainer.
Empty the waste container when filling the sheath container or as needed to prevent
leakage. The software indicator for waste will be yellow or red when the container needs
to be emptied. Take care to avoid damaging the fluid level sensor in the waste tank.
Biological samples are potentially dangerous and/or life threatening. Adhere to proper
handling procedures for samples and reagents. Wear appropriate laboratory attire such
as protective gloves, eyewear, and lab coat during this procedure.
Always treat the contents of the waste container with bleach (10% of the total volume).
Contents of the waste container may contain biohazardous material.
Removing Waste from a Cytek 4-L Waste Tank or a 20-L Cubitainer:
1 Disconnect the waste line quick-connect from the front of the cytometer.
2 Disconnect the waste line orange quick-connect from the cubitainer cap or 4-L waste bottle.
Disconnect the waste level sensor.
The waste level sensor connector for the cubitainer is on the cubitainer cap. The waste level
sensor connector for the 4-L tank is on the front of the cytometer.
3 Remove the waste cap from the cubitainer or the lid from the 4-L waste tank, taking care not to
damage the liquid level sensor.
4 Dispose of the waste per local regulations.
5 Add 2 L of undiluted bleach to the waste cubitainer, or 400 mL of bleach to the waste tank.
6 Replace the waste cap/lid to the container. Hand-tighten the cap/lid until it is fully closed.
7 Reattach the waste line and level sensor line to the cap/lid and front of the cytometer.
8 If the cytometer is powered on and the software is connected, verify that the software waste
indicator is green.
18 Aurora User’s Guide
Starting Up the System
1 Turn on the workstation, then turn on cytometer.
NOTE: Ensure that a tube of DI water is loaded on the SIP before launching SpectroFlo
software. The tube is required for the SIT depth calibration.
2 Launch SpectroFlo software and log in.
The cytometer initialization procedure begins. Sheath fluid is flushed through the fluidics lines
to eliminate any saline buildup. The system calibrates the SIT depth and the sample flow rate.
3 Select QC & Setup from the Get Started screen.
4 Check the status indicator in the lower-right corner of the screen. Ensure the indicator for
Connected is a green checkmark. If the indicator shows the instrument is not connected, check
to ensure that the USB connection between the cytometer and workstation is plugged into the
appropriate ports. See “Back of Cytometer” on page 11.
Chapter 3: Startup & Shutdown 19

5 Check the sheath and waste level checkmark indicators. Ensure the status checkmark indicators
for sheath and waste are green before proceeding.
Fluid Indicator Meaning
Yellow sheath indicator Sheath tank is low and requires refilling (see “Filling the Sheath” on
page 17).
Red sheath indicator Sheath tank is empty and requires refilling (see “Filling the Sheath”
on page 17).
Yellow waste indicator Waste tank is nearing capacity and requires emptying (see
“Emptying the Waste” on page 18).
Red waste indicator Waste tank is full and requires emptying (see “Emptying the
Waste” on page 18).
6 The cytometer is now ready for Daily QC. See “Performing Daily QC” on page 21.
Shutting Down the System
The shutdown procedure flushes the flow cell and sample lines with bleach and DI water. The
software provides instructions during the shutdown procedure. The SIT will remain protracted
from the SIP at the end of the shutdown procedure to ensure the SIT does not dry and form clogs.
1 In the Cytometer menu from either the QC & Setup or Acquisition workspace, select Fluidics
Shutdown.
2 Place a tube containing 3 mL of 10% bleach on the SIP. Once loaded, the instrument begins
drawing in the tube contents. This takes approximately 2 minutes.
3 When prompted, remove the tube and place a tube containing 3 mL of DI water on the SIP.
Once loaded, the instrument begins drawing in the tube contents. This takes approximately
2minutes.
4 Leave the tube of DI water on the SIP. Make sure the SIT is submerged in the DI water at the end
of the Fluidics Shutdown procedure.
5 Exit SpectroFlo software by clicking the X in the upper-right corner of the application window.
6 Turn off the cytometer and workstation.
20 Aurora User’s Guide

4
QC & Setup
Daily QC
Run Daily QC using SpectroFlo QC beads prior to acquiring samples to ensure that the cytometer is
performing optimally. Daily QC assesses the instrument’s optical alignment and the system
performance drift by measuring rCVs and gain needed to place the beads at the target locations for
each detector. During QC, laser delays and area scaling factors are optimized and gain settings are
adjusted to ensure day-to-day repeatability. Upon completion of Daily QC, a QC report is generated.
QC reports can be reviewed under the Reports tab.
Performance can be tracked and charted over time in the Levey-Jennings tab. The software can be
configured to display a warning if the QC result on the QC report exceeds user-defined criteria. See
“Alarm Ranges” on page 30.
Performing Daily QC
Daily QC ensures that the instrument is performing optimally. Instrument performance is
characterized and tracked, laser delays and area scaling factors are determined, and user gain
settings are adjusted to account for day-to-day instrument variability.
1 Allow at least 30 minutes to elapse after turning on the instrument to ensure the lasers are
warmed up.
2 Load a 12 x 75-mm tube of SpectroFlo QC beads (1 drop in 0.5 mL sheath, PBS, or DI water) onto
the SIP.
The SpectroFlo QC beads are hard dyed polystyrene beads that have a single fluorescence
intensity. They can be excited by each laser and emit fluorescence in all detector channels.
Chapter 4: QC & Setup 21

3 In the QC & Setup workspace, select Daily QC.
4 Select the appropriate bead lot from the Bead Lot menu.
Each time you open a new lot number of SpectroFlo QC beads you must import the bead lot ID
into the Library so it is accessible when you run QC.
Different bead lots have different fluorescent intensities. Always select the correct bead
lot when performing Daily QC.
5 Select Start to begin the Daily QC run.
The instrument begins acquiring the QC beads. The procedure takes approximately 3 to 5
minutes to complete.
22 Aurora User’s Guide
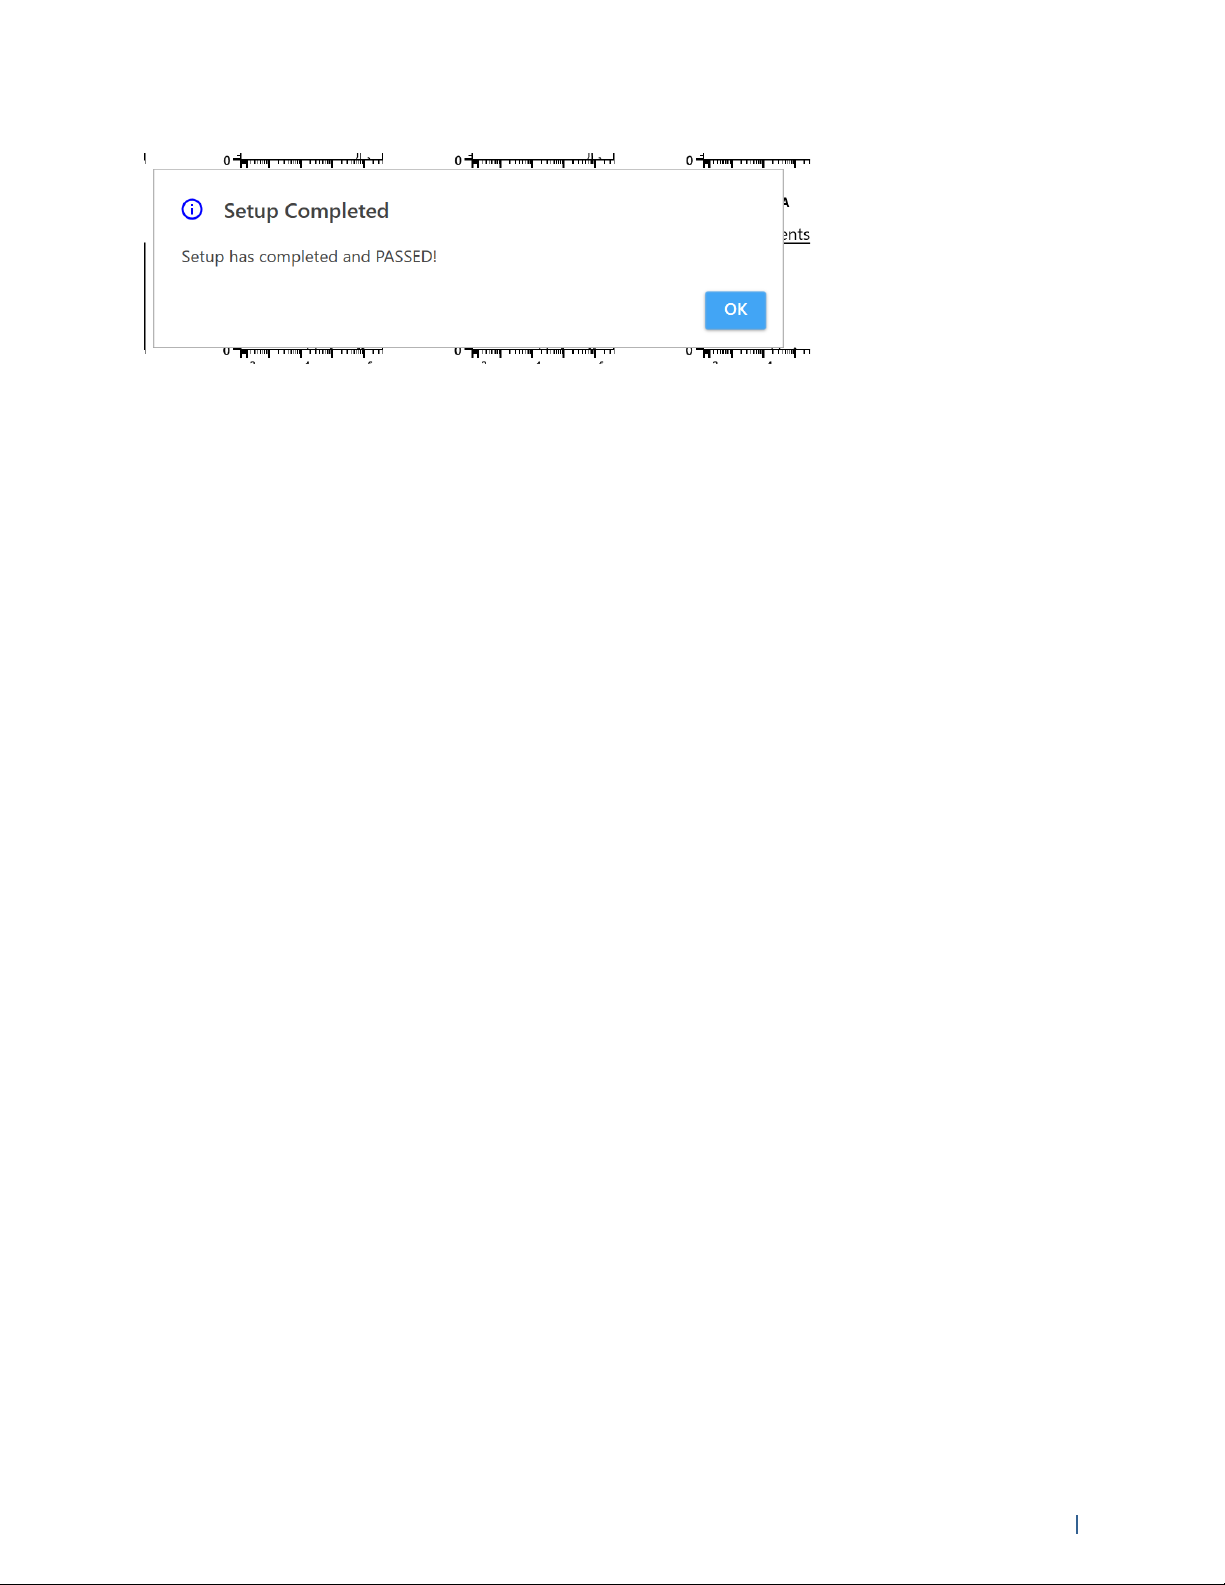
6 When Daily QC passes, the following message is displayed.
You are now ready to acquire samples.
QC Report
At the completion of the Daily QC run, a QC report is generated. The report includes the following
sections:
• The header section contains the name of the instrument, date the Daily QC was run, user who
ran the Daily QC, instrument configuration, instrument serial number, SpectroFlo QC bead lot
and expiration date, and Pass/Fail status of the run.
• The results section contains the gain, gain change, median fluorescent intensity of the daily QC
bead, %rCV, and a pass/fail indicator for each detector channel. The center wavelength of the
detector is shown in parentheses next to the detector name.
• The Laser Settings section contains the laser delays for all non-primary lasers, and area scaling
factors for all lasers and the FSC detector
Pass/Fail Criteria - The pass/fail criteria are the following:
• %rCV must not exceed 6% for the FSC channel
• %rCV must not exceed 8% for the SSC channel
• %rCV must not exceed 6% for the V3 channel
• %rCV must not exceed 6% for the B3 channel
• %rCV must not exceed 6% for the R3 channel
• Delta gain for all channels must not exceed 100 from the last Daily QC run performed by Cytek
Service personnel.
The number of reports listed in the Reports screen can be set in the Preferences. See “QC Setup” on
page 66 for more information.
Chapter 4: QC & Setup 23
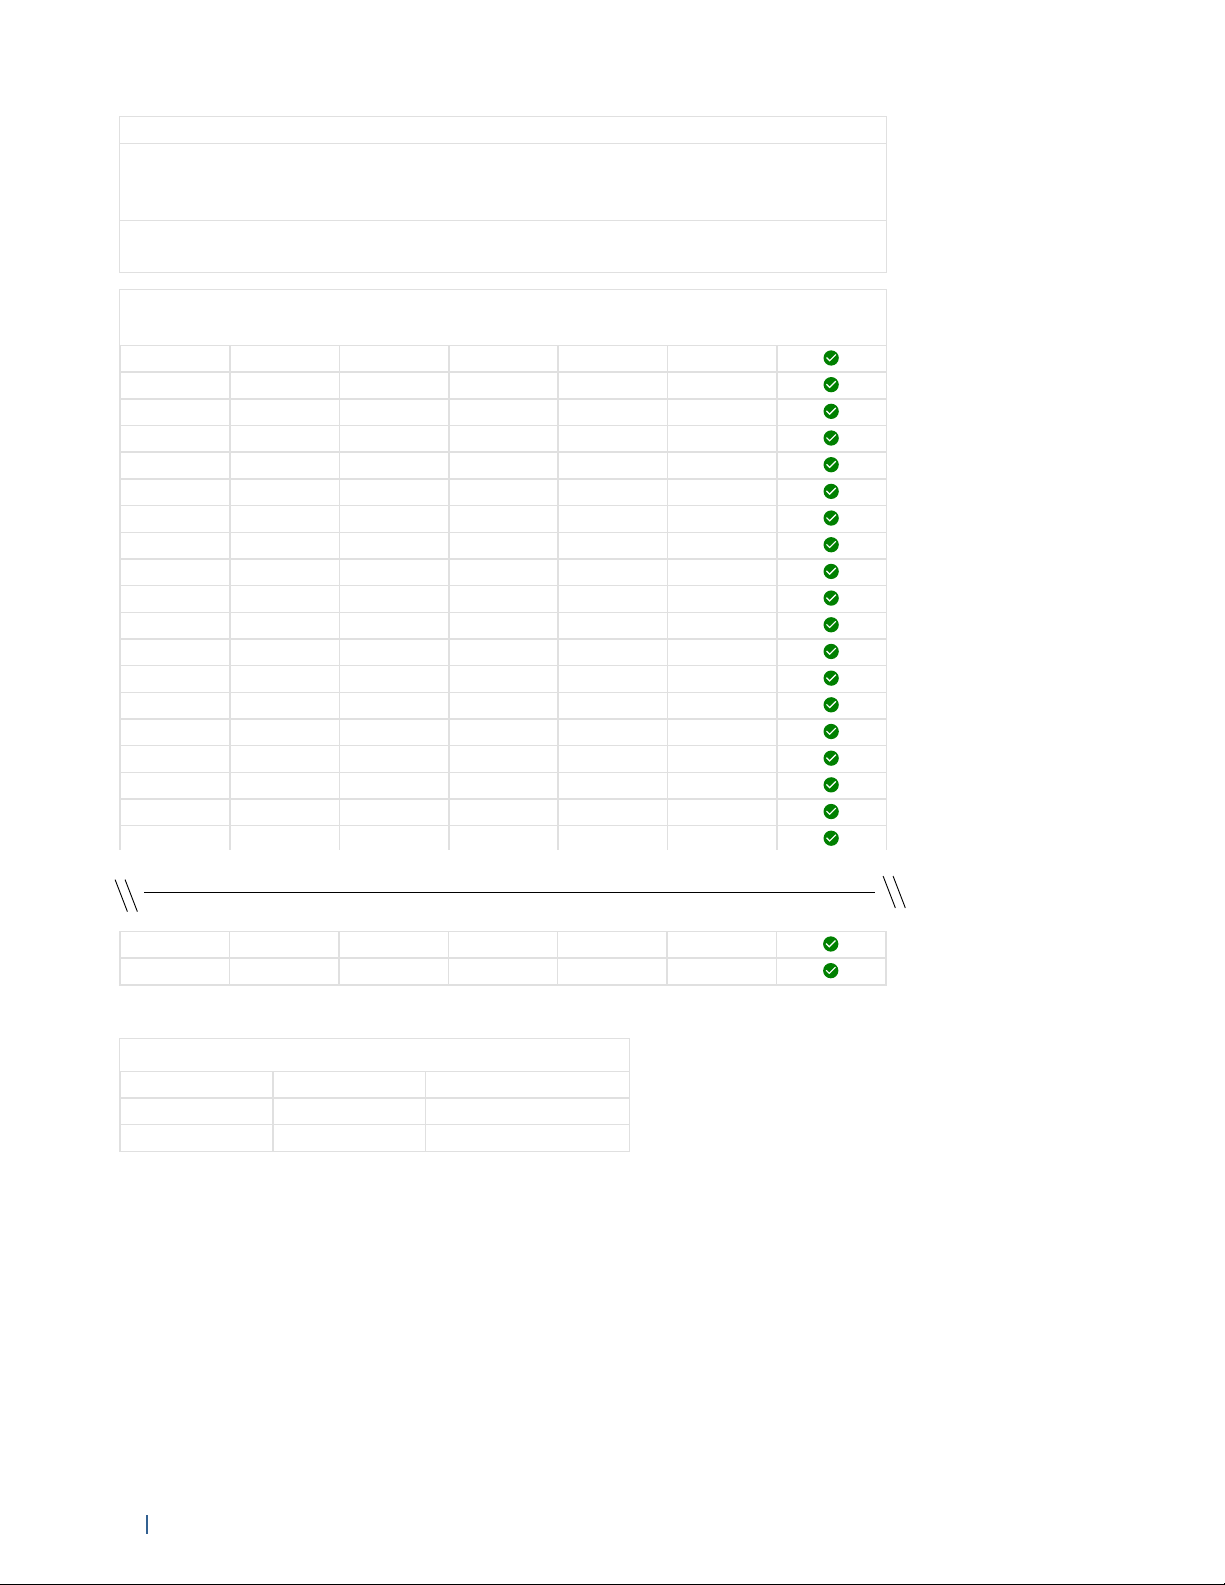
Daily QC Report
Setup Status: PASSED
Cytometer Name: My Aurora
Configuration: 3-Lasers-V16-B14-R8
Date: October 28, 2017 - 17:03 PM
User: Admin
Serial Number: R0001
QC Beads
Lot ID: 1002 Expiration Date: December 31, 2019
Laser
Detector
(nm)
Gain
Gain Change
Median
(x1000)
% rCV
Status
Blue
FSC
174
-26
1,843.2
2.57
Violet
SSC
34292,087.8
4.45
Violet
V1 (428)
38155202.2
3.96
Violet
V2 (443)
21219205.7
3.97
Violet
V3 (458)
20117202.5
4.11
Violet
V4 (473)
15319244.1
3.98
Violet
V5 (508)
19713302.0
4.04
Violet
V6 (528)
24812243.1
4.04
Violet
V7 (549)
23313182.7
4.01
Violet
V8 (571)
25619123.1
3.79
Violet
V9 (594)
25114102.5
3.80
Violet
V10 (618)
3811891.0
3.78
Violet
V11 (664)
6384672.6
3.73
Violet
V12 (692)
9745960.6
3.71
Violet
V13 (720)
5303631.5
3.75
Violet
V14 (750)
5314021.0
3.88
Violet
V15 (780)
7937510.8
5.96
Violet
V16 (812)
461354.2
7.93
Blue
B1 (508)
231214.1
2.62
Blue
B2 (528)
242
-10
38.7
2.03
Blue
B3 (549)
221
-10
94.4
1.63
Blue
B4 (571)
240
-13
134.2
1.66
Blue
B5 (594)
225-3124.6
1.62
Blue
B6 (618)
3555152.1
1.77
Blue
B7 (660)
406
-15
19.0
2.84
Blue
B8 (678)
468-147.5
1.95
Blue
B9 (697)
425428.7
2.39
Blue
B10 (717)
373
-11
24.9
3.04
Blue
B11 (738)
315
-11
15.2
3.38
Blue
B12 (760)
390
-14
9.5
5.02
Blue
B13 (783)
623
-18
9.5
5.91
Blue
B14 (812)
327-94.8
7.34
Red
R1 (660)
187-696.5
2.50
Red
R2 (678)
1,045
-14
373.5
2.91
Red
R3 (697)
73413244.0
3.14
Red
R4 (717)
291-3156.2
3.53
Red
R5 (738)
417-7156.1
3.98
Red
R6 (760)
561-597.9
4.96
Red
R7 (783)
895-979.4
5.85
Red
R8 (812)
326039.3
6.11
Laser Settings
Laser
Laser Delay
Area Scaling Factor
Violet
-24.95
1.19
Blue
0.00
1.20
Red
27.50
0.85
FSC Area Scaling Factor: 1.24
Specifications
FSC
% rCV:
< 6
(Recommended)
SSC
% rCV:
< 8
(Recommended)
V3
% rCV:
< 6
(Recommended)
B3
% rCV:
< 6
(Recommended)
R3
% rCV:
< 6
(Recommended)
All Channels
% Gain
Change:
< 100
(Recommended)
24 Aurora User’s Guide
Instrument Setup - Reference Controls
Reference Controls must be acquired and recorded to ensure accurate spectral unmixing of the
data. References are obtained by acquiring particles stained with individual fluorescent tags. Either
beads or cells can be used as single-stained controls for acquiring references. You can select
whether to create new Reference Controls or update Reference Controls already stored in the
Library.
• Reference Control - references stored and retrieved from the Library
• Reference Group - references acquired and recorded in the experiment
A step-by-step wizard guide you through recording Reference Controls.
Creating Reference Controls
To create Reference Controls you will need to define the fluorescent tags, define the controls, then
label the fluorescent tags.
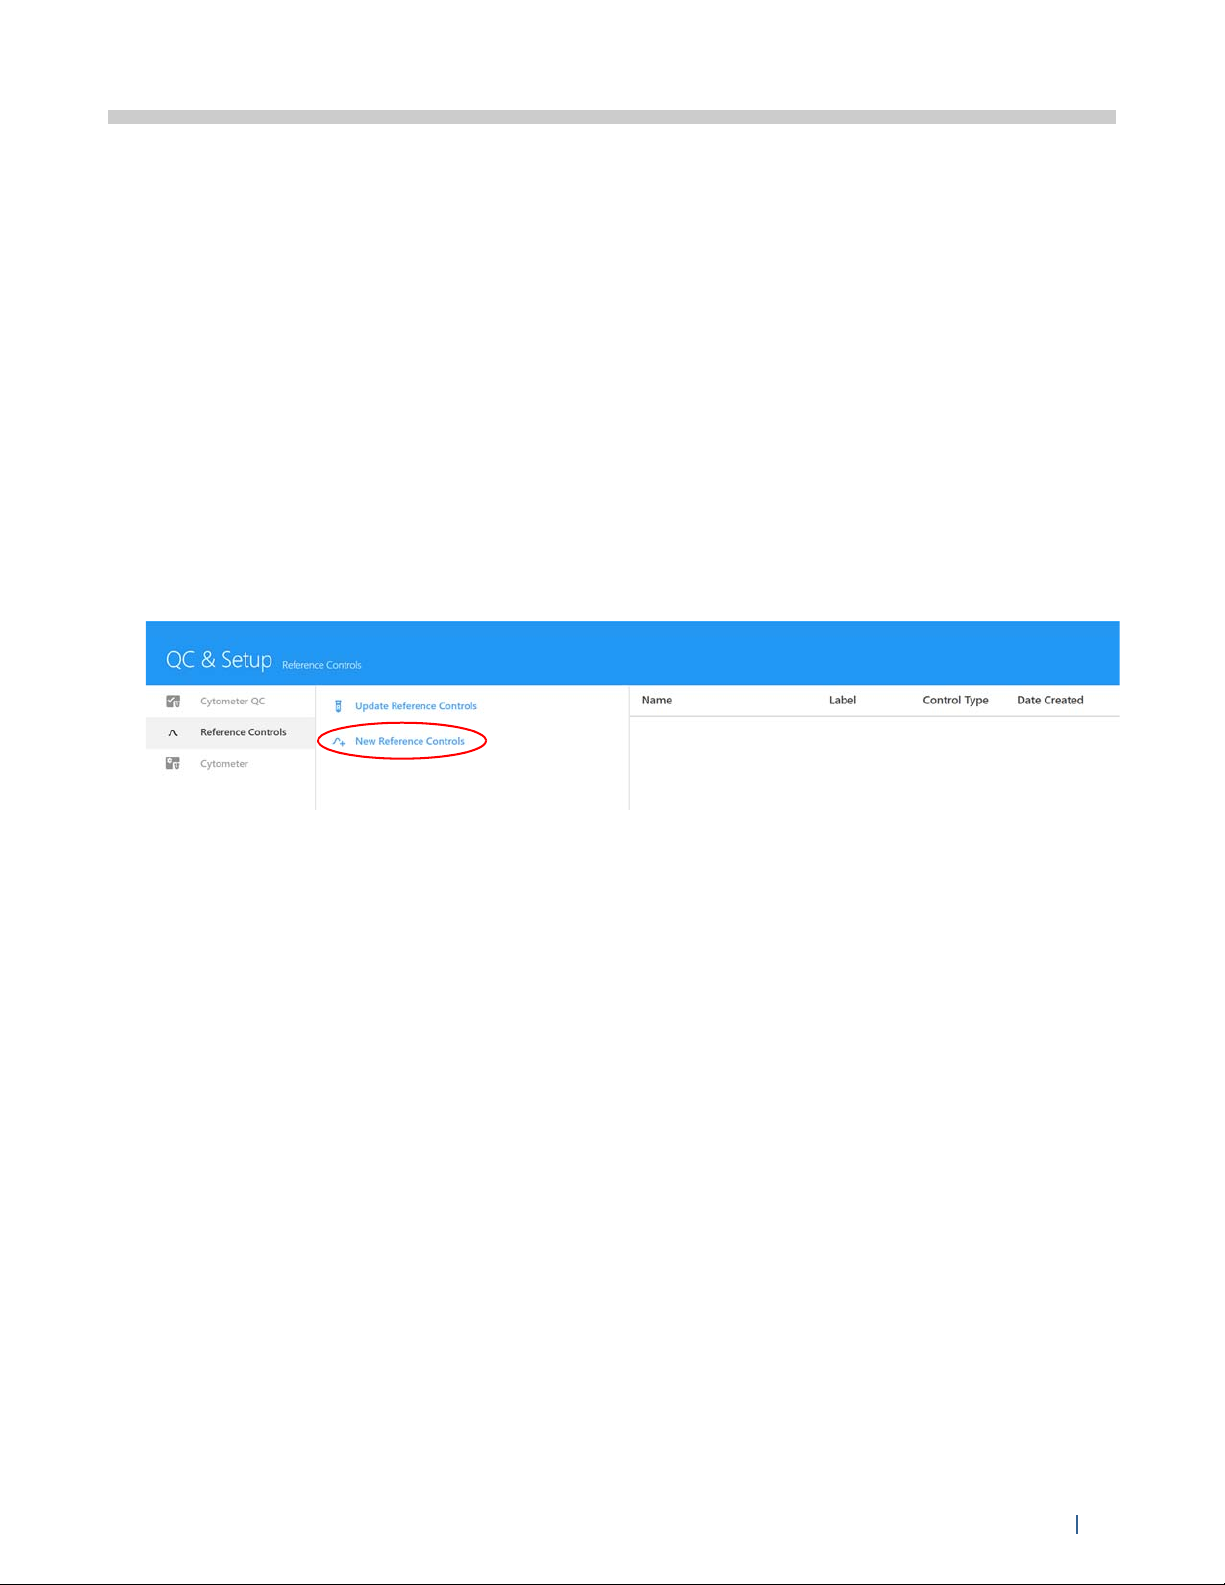
1 Select New Reference Controls from the Reference Controls tab in the QC & Setup workspace.
A wizard opens allowing you to create new Reference Controls.
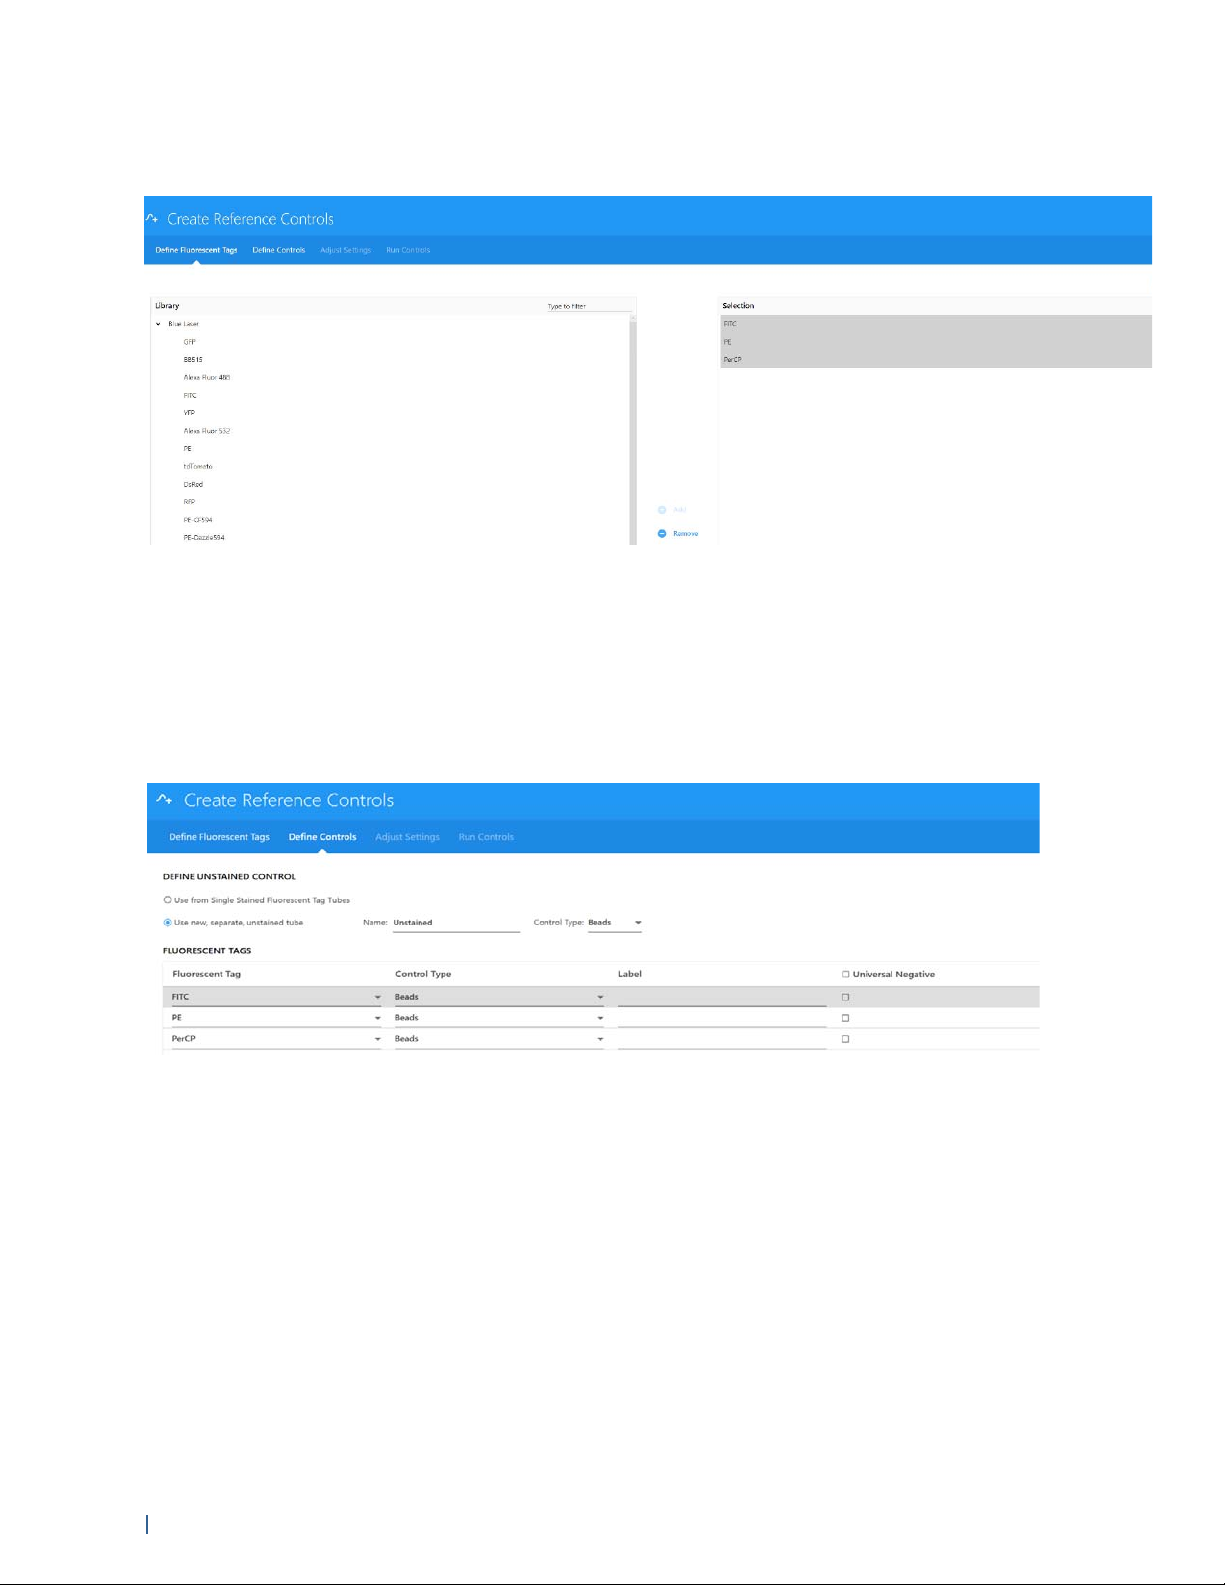
2 Select fluorescent tags. The left pane displays the fluorescent tag groups found in the Library.
• Click the arrow to the left of the fluorescent tag group name to view the fluorescent tags
associated with the group. (The default fluorescent tag groups are Blue Laser, Red Laser, and
Violet Laser and contain a list of commonly used fluorescent tags excited by their respective
lasers).
• From the expanded list of fluorescent tags, select the fluorescent tags used in the
experiment. Once selected the fluorescent tags appear in the selection pane on the right side
of the Define Fluorescent Tags window. You can select fluorescent tags by dragging and
dropping, double-clicking, or using the Add button. Multiple tags can be chosen at one time.
Confirm the tags selected, then click Next.
Chapter 4: QC & Setup 25
NOTE: The list of fluorescent tags can be edited in the Library. You can use the Library to add
fluorescent tags that are not present in the default list. See “Fluorescent Tags” on page 55 for
more information.
3 Define the control type for the fluorescent tags, as well as the unstained controls. Once the
controls have been defined, select Next.
Either beads or cells can be stained and defined as control types. This allows you to keep track
of control types. If any of the fluorescent tag controls lack a negative population and are of the
same type as the unstained control, check the Universal Negative checkbox at the right.
4 (Optional) Enter labels associated with the fluorescent tag for identification and tracking.
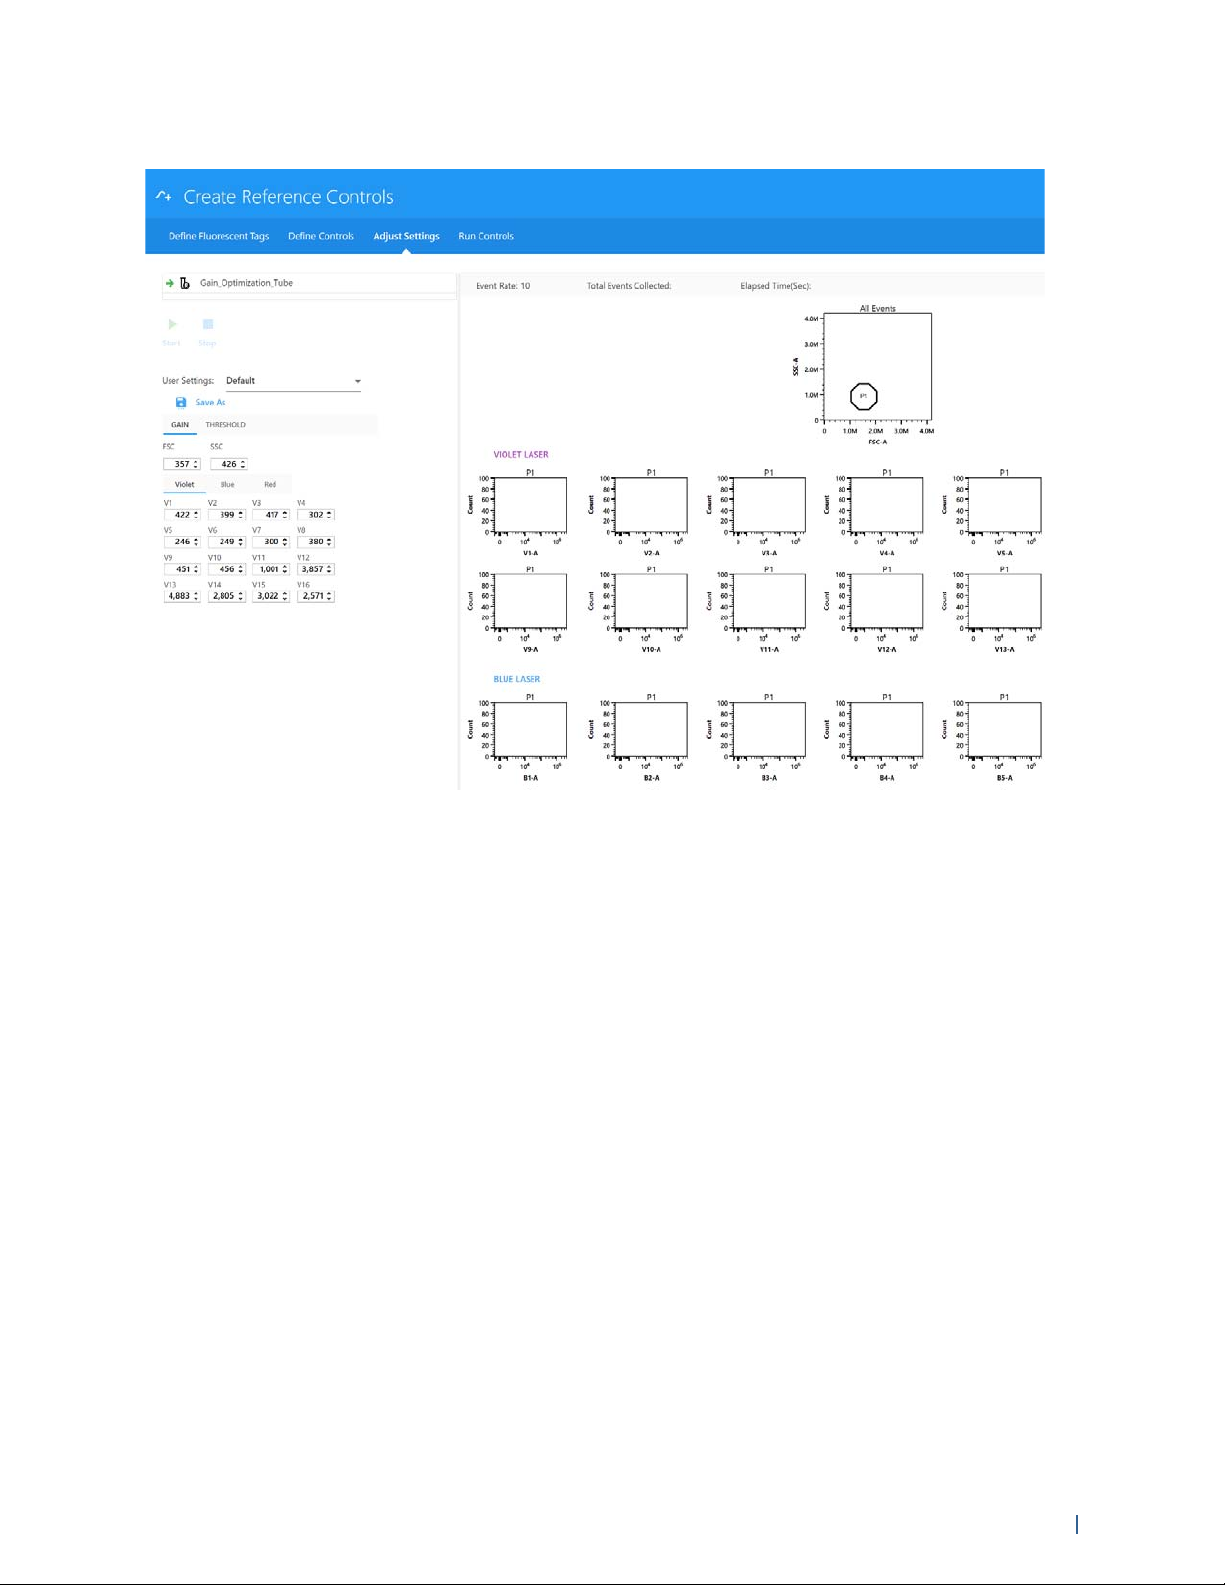
5 If necessary, adjust gain settings. Place the appropriate sample on the SIP and click Start to view
the data.
Gain settings for all channels can be selected from the User Settings drop-down menu, or they
can be individually adjusted for each channel using the detector gain spinboxes (V1-V16, B1B14, and R1–R8).
The Adjust Settings screen allows you to view the data to ensure that the positively stained
fluorescent particles are not off scale. FSC gain can be adjusted from 0-1000. SSC and detector
channel gain can be adjusted from 0-10,000. If the positive population is off-scale for any
detector channels, lower the gain setting for that channel. If the positive population is not
sufficiently separated from the negative population within a specific channel, adjust the gain
setting for that channel.
26 Aurora User’s Guide
NOTE: Dim markers may not separate from the negative population regardless of how much
the gain is increased.
6 Select Next when you are satisfied with the gain settings. Proceed to running controls.
Running Reference Controls
Once gain settings have been confirmed, unstained and Reference Controls are ready for
acquisition.
1 Place a tube of the appropriate single-stained particles on the SIP. Click Record to begin acquiring.
Make sure to follow the order listed in the left-hand panel.
Chapter 4: QC & Setup 27
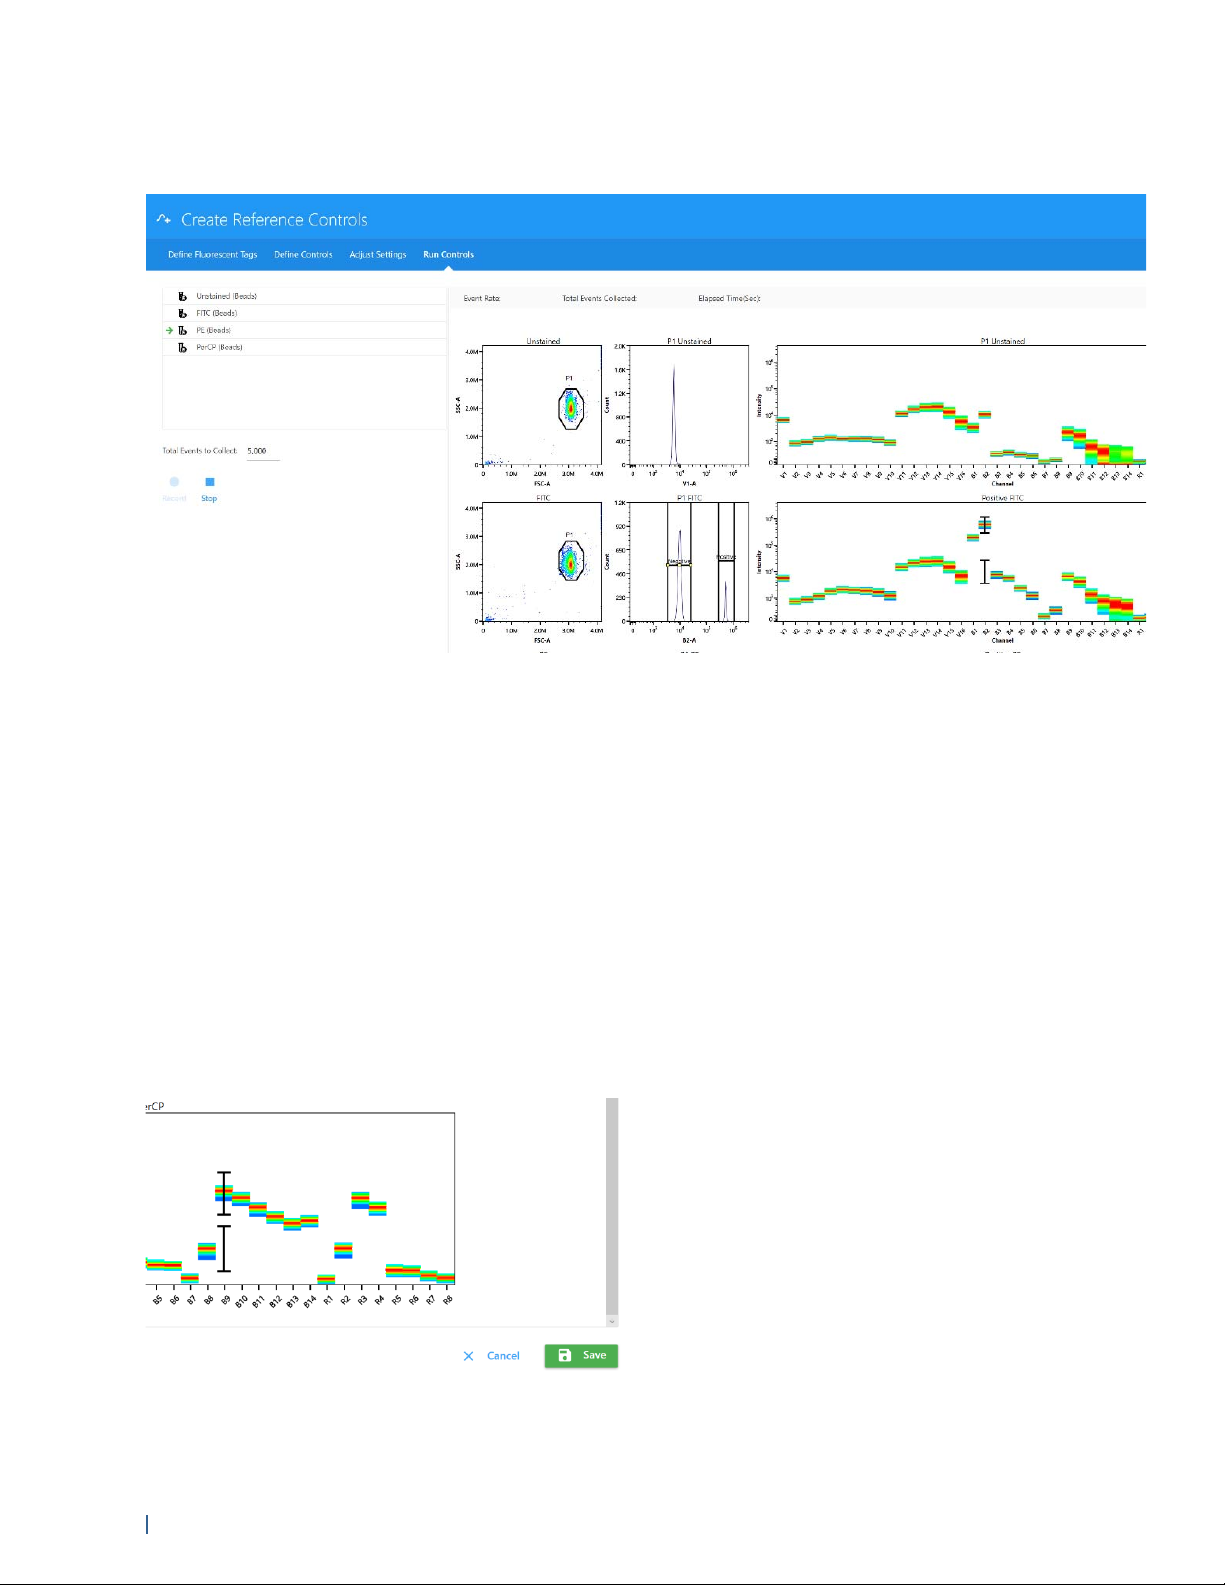
During acquisition the spectra plot for each fluorescent control is displayed. The plots show all
the channels across all lasers in the x-axis vs mean fluorescence intensity (MFI) of the
fluorescent tag.
2 During acquisition obtain spectral information by moving the polygon gate on the FSC-A vs
SSC-A plot to include the population of interest.
Hold down the Ctrl key while adjusting the gate to move the polygon gates for all the
fluorescent tags at once. The gated population appears in the histogram, which is set to the
peak emission channel of the fluorescent tag to be acquired. The emission spectrum of the
population is displayed in the spectrum plot.
Adjust the positive gate on the histogram. The software automatically displays the emission
spectrum of the positive particle in the spectrum plot. SpectroFlo software sets the default gate
on the peak emission channel. The gate can be selected manually. It is best to set the gate on
the brightest emission as this can make distinguishing the positive and negative population
easier.
Readjust the positive and/or negative gate on the histogram, if necessary.
3 Select Save to save the Reference Controls to the Library.
28 Aurora User’s Guide
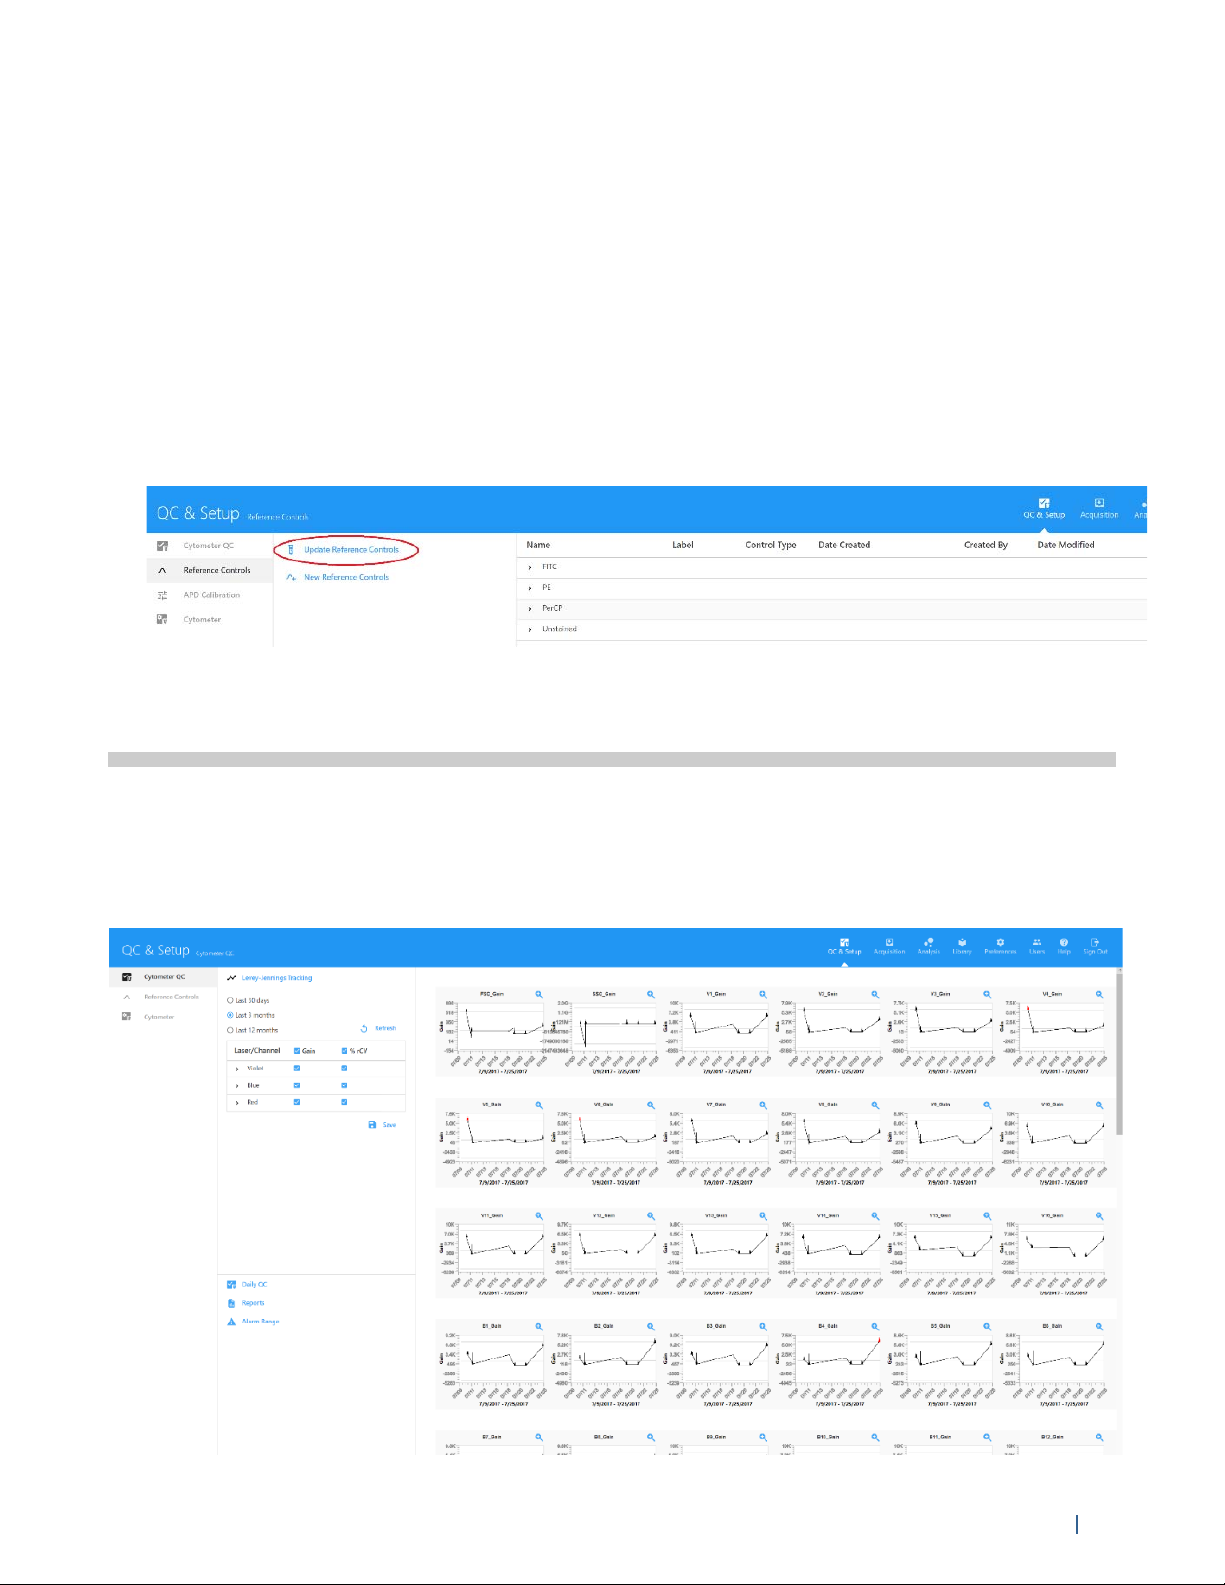
Updating Reference Controls
You may wish to update the Reference Controls if any of the following occur:
• Major service performed on the instrument
• Fluorochrome exhibiting signs of instability
• Instrument exhibiting signs of instability
The Reference Controls tab displays the Reference Controls saved in the Library. Click the arrow
next to the control name to display the details.
To Update Reference Controls:
1 Select Update Reference Controls from the Reference Controls tab in the QC & Setup workspace.
A wizard opens allowing you to update Reference Controls.
2 Follow steps 2 through 6 in “Creating Reference Controls” on page 25.
Levey-Jennings Tracking
Levey-Jennings reports track %rCV and gain for all detector channels over time, allowing you to
view the system’s performance and ensure that the system is reproducing consistent results. The
graphs in the report show you random errors or shifts and trends in the data for each parameter.
Data from the last 30 days, 3 months, or 12 months can be included in the reports.
Chapter 4: QC & Setup 29
 Loading...