

Page 1
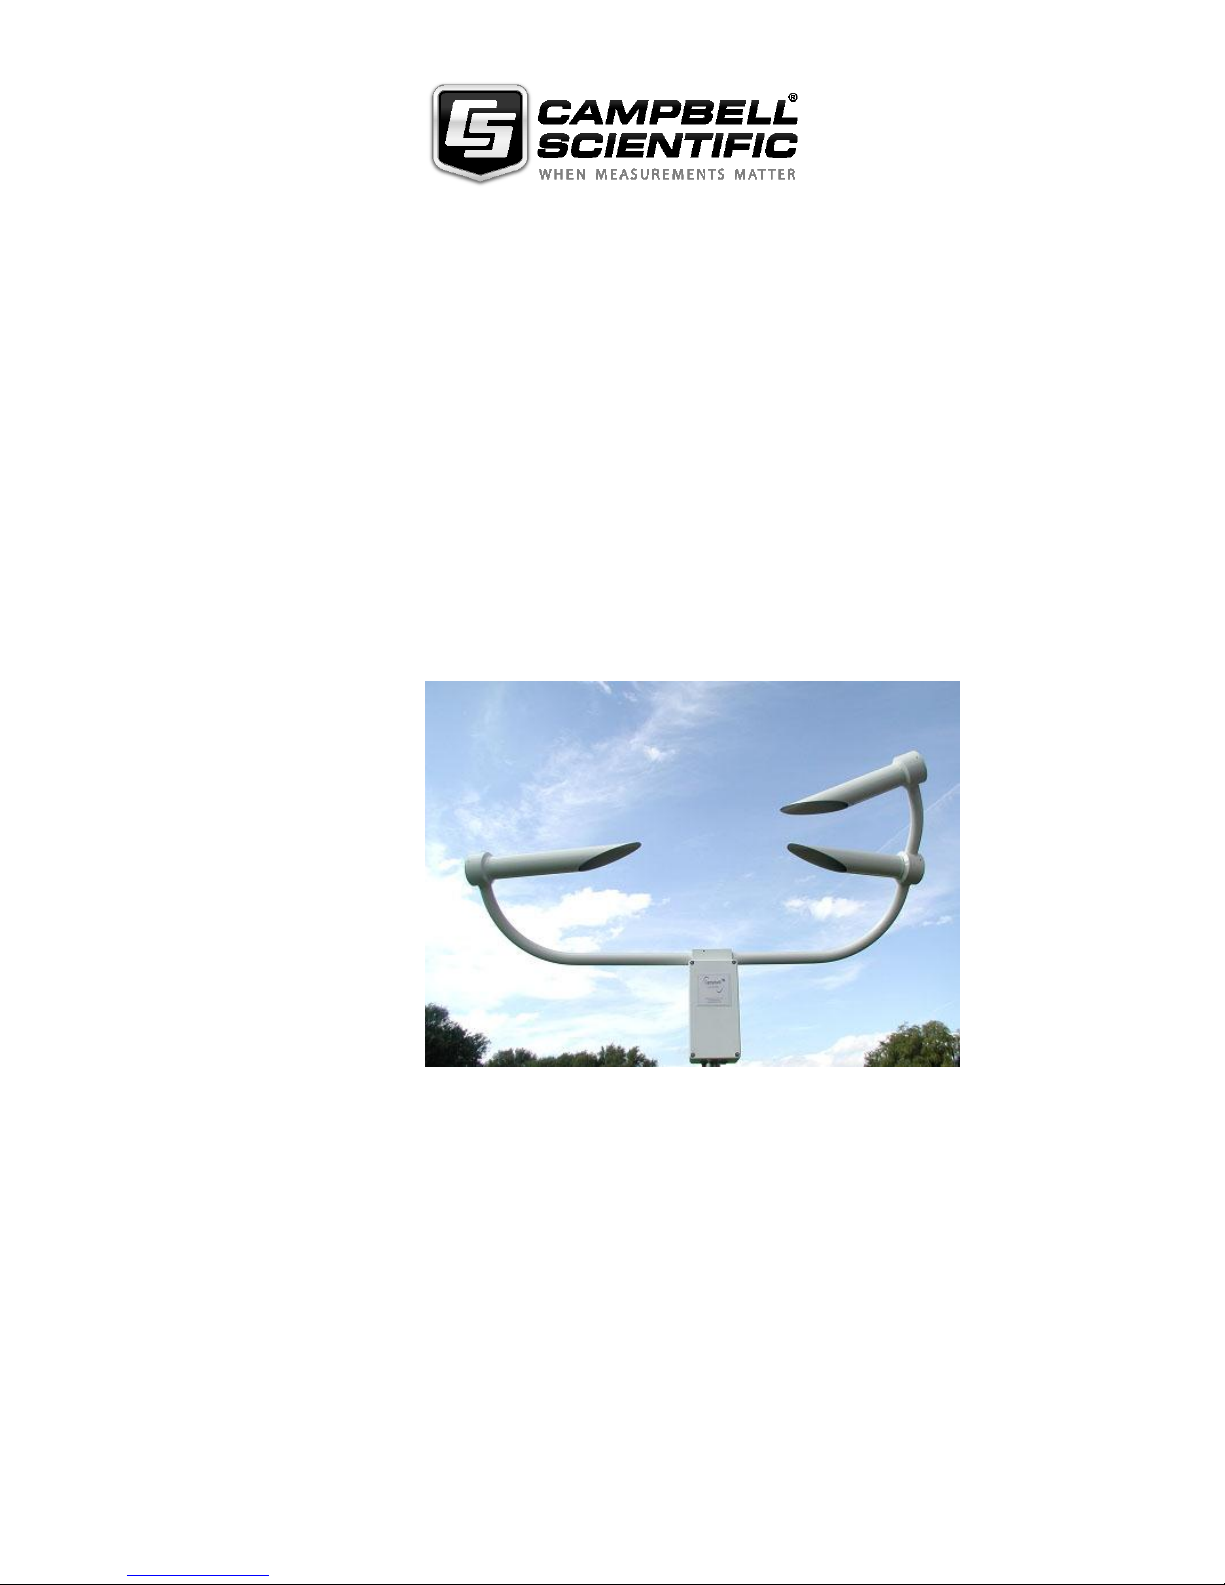
PWS100
Present Weather
Sensor
Issued: 17.11.15
Copyright © 2006-2015 Campbell Scientific Ltd.
CSL 658
USER GUIDE
Page 2

Page 3

Guarantee
This equipment is guaranteed against defects in materials and workmanship.
We will repair or replace products which prove to be defective during the
guarantee period as detailed on your invoice, provided they are returned to us
prepaid. The guarantee will not apply to:
Equipment which has been modified or altered in any way without the
written permission of Campbell Scientific
Batteries
Any product which has been subjected to misuse, neglect, acts of God or
damage in transit.
Campbell Scientific will return guaranteed equipment by surface carrier
prepaid. Campbell Scientific will not reimburse the claimant for costs incurred
in removing and/or reinstalling equipment. This guarantee and the Company’s
obligation thereunder is in lieu of all other guarantees, expressed or implied,
including those of suitability and fitness for a particular purpose. Campbell
Scientific is not liable for consequential damage.
Please inform us before returning equipment and obtain a Repair Reference
Number whether the repair is under guarantee or not. Please state the faults as
clearly as possible, and if the product is out of the guarantee period it should
be accompanied by a purchase order. Quotations for repairs can be given on
request. It is the policy of Campbell Scientific to protect the health of its
employees and provide a safe working environment, in support of this policy a
“Declaration of Hazardous Material and Decontamination” form will be
issued for completion.
When returning equipment, the Repair Reference Number must be clearly
marked on the outside of the package. Complete the “Declaration of
Hazardous Material and Decontamination” form and ensure a completed copy
is returned with your goods. Please note your Repair may not be processed if
you do not include a copy of this form and Campbell Scientific Ltd reserves
the right to return goods at the customers’ expense.
Note that goods sent air freight are subject to Customs clearance fees which
Campbell Scientific will charge to customers. In many cases, these charges are
greater than the cost of the repair.
Campbell Scientific Ltd,
80 Hathern Road,
Shepshed, Loughborough, LE12 9GX, UK
Tel: +44 (0) 1509 601141
Fax: +44 (0) 1509 601091
Email: [email protected]
www.campbellsci.co.uk
Page 4

Page 5

PLEASE READ FIRST
About this manual
Some useful conversion factors:
2
Area: 1 in
Length: 1 in. (inch) = 25.4 mm
1 ft (foot) = 304.8 mm
1 yard = 0.914 m
1 mile = 1.609 km
(square inch) = 645 mm2
Mass: 1 oz. (ounce) = 28.35 g
1 lb (pound weight) = 0.454 kg
Pressure: 1 psi (lb/in
Volume: 1 UK pint = 568.3 ml
1 UK gallon = 4.546 litres
1 US gallon = 3.785 litres
2
) = 68.95 mb
Recycling information
At the end of this product’s life it should not be put in commercial or domestic refuse
but sent for recycling. Any batteries contained within the product or used during the
products life should be removed from the product and also be sent to an appropriate
recycling facility.
Campbell Scientific Ltd can advise on the recycling of the equipment and in some cases
arrange collection and the correct disposal of it, although charges may apply for some
items or territories.
For further advice or support, please contact Campbell Scientific Ltd, or your local agent.
Campbell Scientific Ltd, Campbell Park, 80 Hathern Road, Shepshed, Loughborough, LE12 9GX, UK
Tel: +44 (0) 1509 601141 Fax: +44 (0) 1509 601091
Email: [email protected]
www.campbellsci.co.uk
Page 6

Page 7

Precautions
DANGER — MANY HAZARDS ARE ASSOCIATED WITH INSTALLING, USING, MAINTAINING, AND WORKING ON
OR AROUND TRIPODS, TOWERS, AND ANY ATTACHMENTS T O TRIP ODS AND T OWERS SUCH AS SENSORS,
CROSSARMS, ENCLOSURES, ANTENNAS, ETC. FAILURE TO PROPERLY AND COM P LE TE LY AS S E MB LE ,
INSTALL, OPERATE, USE, AND MAINTAIN TRIPODS, TOWERS, AND ATTACHMENTS, AND F AI LURE TO HEED
WARNINGS, INCREASES THE RISK OF DEATH, ACCIDENT, SERIOUS INJURY, PROPERTY DAMAGE, AND
PRODUCT FAILURE. TAKE ALL REASONABLE PRECAUTIONS TO AVOID THESE HAZARDS. CHECK WITH YOUR
ORGANIZATION'S SAFETY COORDINATOR (OR POLICY) FOR PROCE DURES AND REQUIRED PROTECTIVE
EQUIPMENT PRIOR TO PERFORMING ANY WORK.
Use tripods, towers, and attachments to tripods and towers only for purposes for which they are designed. Do not
exceed design limits. Be familiar and comply with all instructions provided in product manuals. Manuals are
available at www.campbellsci.eu or by telephoning +44(0) 1509 828 888 (UK). You are responsible for conformance
with govern i ng codes and r egulations, i ncluding safety regulations, and the i ntegrity and location of structures or land
to which towers, tripods, and any attachments are attached. Installation sites should be evaluated and approved by a
qualified engineer. If questions or concerns arise regarding installation, use, or maintenance of tripods, towers,
attachments, or electrical connections, consult with a licensed and qualified engineer or electrician.
General
• Prior to performing site or installation work, obtain required approvals and permits. Comply with all
governing structure-height regulations, such as those of the FAA in the USA.
• Use only qualified personnel for installation, use, and maintenance of tripods and towers, and any
attachments to tripods and towers. The use of licensed and qualified contractors is highly recommended.
• Read all applicable instructions carefully and understand procedures thoroughly before beginning work.
• Wear a hardhat and eye protection, and take other appropriate safety precautions while working on or
around tripods and towers.
• Do not climb tripods or towers at any time, and prohibit climbing by other persons. Take reasonable
precautions to secure tripod and tower sites from trespassers.
• Use only manufacturer recommended parts, materials, and tools.
Utility and Electrical
• You can be killed or sustain serious bodily injury if the tripod, tower, or attachments you are installing,
constructing, using, or maintaining, or a tool, stake, or anchor, come in contact with overhead or
underground utility lines.
• Maintain a distance of at least one-and-one-half times structure height, or 20 feet, or the distance
required by applicable law, whichever is greater, between overhead utility lines and the structure (tripod,
tower, attachments, or tools).
• Prior to performing site or installation work, inform all utility companies and have all underground utilities
marked.
• Comply with all electrical codes. Electrical equipment and related grounding devices should be installed
by a licensed and qualified electrician.
Elevated Work and Weather
• Exercise extreme caution when performing elevated work.
• Use appropriate equipment and safety practices.
• During installation and maintenance, keep tower and tripod sites clear of un-trained or non-essential
personnel. Take precautions to prevent elevated tools and objects from dropping.
• Do not perform any work in inclement weather, including wind, rain, snow, lightning, etc.
Maintenance
• Periodically (at least yearly) check for wear and damage, including corrosion, stress cracks, frayed cables,
loose cable clamps, cable tightness, etc. and take necessary corrective actions.
• Periodically (at least yearly) check electrical ground connections.
WHILE EVERY ATTEMPT IS MADE TO EMBODY THE HIGHEST DEGREE OF SAFETY IN ALL CAMPBELL
SCIENTIFIC PRODUCTS, THE CUSTOMER ASSUMES ALL RISK FROM ANY INJURY RESULTING FROM IMPROPER
INSTALLATION, USE, OR MAINTENANCE OF TRIPODS, TOWERS, OR ATTACHMENTS TO TRIPODS AND TOWERS
SUCH AS SENSORS, CROSSARMS, ENCLOSURES, ANTENNAS, ETC.
Page 8

Page 9

i
Contents
PDF viewers note: These page numbers refer to the printed version of this document. Use
the Adobe Acrobat® bookmarks tab for links to specific sections.
Section 1. General Information ...................................... 1
1.1 About this Manual ...................................................................................... 1
1.2 General Safety ............................................................................................ 2
1.3 Sensor Unit Safety ...................................................................................... 2
1.4 Laser Safety ................................................................................................ 2
Section 2. Product Overview ......................................... 5
2.1 Introduction ............................................................................................... 5
2.2 Specifications ............................................................................................ 6
2.2.1 Mechanical Specifications ............................................................. 6
2.2.2 Electrical Specifications ................................................................. 6
2.2.3 Optical Specifications .................................................................... 6
2.2.4 Environmental Specifications ........................................................ 7
2.2.5 CS215 Sensor Specifications ......................................................... 7
2.3 Measurement Capabilities and Limitations ............................................... 7
2.3.1 Visibility Measurements ................................................................ 7
2.3.2 Precipitation Measurements ........................................................... 7
2.3.3 Data Storage and Buffering ............................................................ 8
Section 3. Installation ..................................................... 9
3.1 Location and Orientation .......................................................................... 9
3.2 Grounding and Lightning Protection ....................................................... 10
3.2.1 Equipment Grounding .................................................................. 10
3.2.2 Internal Grounding ....................................................................... 11
3.2.3 Lightning Rod (optional) ............................................................. 11
3.2.4 Grounding Spike Kit (optional) ................................................... 11
3.3 Cable Selection ....................................................................................... 12
3.3.1 Heater Cable ................................................................................ 12
3.3.2 Power and Communication Cable ................................................ 14
3.3.3 Full duplex RS485 operation ....................................................... 15
3.4 Unloading and Unpacking ...................................................................... 16
3.4.1 Unpacking Procedure ................................................................... 16
3.4.2 Storage Information ..................................................................... 16
3.5 Installation Procedures ............................................................................ 16
3.5.1 Mounting the PWS100 .................................................................. 16
3.5.2 Optional Campbell Scientific Mount ............................................ 19
3.5.3 Connecting Cables ........................................................................ 20
3.5.4 Desiccant ....................................................................................... 20
3.5.5 Basic Wiring ................................................................................. 22
3.5.6 Communication Options ............................................................... 23
3.5.7 PWS Power Supply ....................................................................... 27
3.5.8 Start-Up Testing ............................................................................ 27
3.5.9 Initial Settings ............................................................................... 27
3.5.10 Load Factory Defaults ................................................................ 27
3.5.11 Lubricating the enclosure screws ................................................ 28
Page 10

ii
Section 4. Operation ...................................................... 29
4.1 Introduction ............................................................................................ 29
4.2 Using the Present Weather Viewer program ........................................... 29
4.3 Terminal Mode ....................................................................................... 30
4.3.1 Using the Help Command ............................................................. 31
4.3.2 Entering / Exiting the Interactive Menu System ........................... 31
4.3.3 Message Polling ............................................................................ 32
4.4 The PWS100 Menu System .................................................................... 32
4.4.1 Top Menu Options 0, 1 and 2 (Message n) ................................... 33
4.4.2 Top Menu Option 3 (Set Time and Date) ..................................... 48
4.4.3 Top Menu Option 4 (Configuration) ............................................. 49
4.4.4 Top Menu Option 5 (Password) ................................ .................... 54
4.4.5 Top Menu Option 6 (Weather and Alarm Parameters) ................. 55
4.4.6 Top Menu Option 7 (Terminal) .................................................... 59
4.4.7 Top Menu Option 8 (Info) ............................................................ 59
4.4.8 Top Menu Option 9 (Done) .......................................................... 60
4.5 Message Related Commands .................................................................. 60
4.5.1 Automatic and Polled Message Sending ....................................... 61
4.5.2 Retrieving Historical Data ............................................................ 62
4.5.3 Viewing Data Output on the Command Line ................................ 64
4.5.4 Collection of Data in Text File Format ......................................... 64
4.6 Weather Related Commands ................................................................... 64
4.6.1 Setting and Viewing Weather Parameters ..................................... 64
4.6.2 Receiving data from remote sensors ............................................. 65
4.7 System Configuration Commands ................................ ........................... 65
4.7.1 Setting System Parameters ............................................................ 65
4.8 Maintenance Commands ......................................................................... 67
4.8.1 Loading a New OS ........................................................................ 67
4.8.2 Running a Diagnostic Test ............................................................ 67
4.8.3 Running the Calibration ................................................................ 68
4.8.4 Rotating the Calibration Disc ........................................................ 68
4.9 Other Commands .................................................................................... 68
4.9.1 Setting the Time and Date .............................................................. 68
4.9.2 Resetting the System ...................................................................... 69
4.9.3 Status ............................................................................................. 69
4.10 Connecting the PWS100 to a Datalogger ............................................. 70
4.10.1 Connections ................................................................................ 70
4.10.2 Example Logger Programs.......................................................... 70
Section 5. Functional Description ............................... 75
5.1 General.................................................................................................... 75
5.2 Optical Measurement .............................................................................. 75
5.2.1 Optical Arrangement .................................................................... 75
5.3 Additional Sensor Connections ............................................................... 77
5.3.1 Using a CS215 on the PWS100 ................................................... 77
5.3.2 Using Other Sensors on the PWS100 .......................................... 78
5.4 PWS100 Control Unit ............................................................................. 78
5.5 Measurement Signal Processing ............................................................. 78
5.6 Algorithm Description ............................................................................ 79
5.6.1 Detecting and Classifying Precipitation ....................................... 79
5.6.2 Precipitation Intensity .................................................................. 81
5.6.3 Precipitation Accumulation.......................................................... 82
5.6.4 Present Weather ........................................................................... 83
5.6.5 Visibility ...................................................................................... 84
5.7 Applications ............................................................................................ 85
5.8 Internal Monitoring ................................................................................. 85
Page 11

iii
Section 6. Maintenance ................................................ 87
6.1 General .................................................................................................... 87
6.2 Cleaning .................................................................................................. 87
6.3 Calibration .............................................................................................. 88
Section 7. Troubleshooting ......................................... 89
7.1 Introduction ............................................................................................. 89
7.2 Possible Problems ................................................................................... 89
7.2.1 No response from PWS100 .......................................................... 89
7.2.2 PWS100 responds but no data output given ................................ 89
7.2.3 Ice has formed in the end of the hoods......................................... 89
7.2.4 The visibility output is clearly in error ......................................... 90
7.2.5 The sensor does not detect particles during a precipitation
event ............................................................................................ 90
7.2.6 The sensor detects particles when there are none present ............ 90
7.2.7 The OS update did not work ........................................................ 91
7.3 Contact Details for Help ......................................................................... 91
Appendix A. PWS Output Codes ............................... A-1
Appendix B. Software Flowchart ............................... B-1
Appendix C. Menu System Map ................................. C-1
Figures
2-1. PWS100 ................................................................................................... 5
3-1. Effect of structure on air flow .................................................................. 9
3-2. Attaching a lightning rod ....................................................................... 11
3-3. Enclosure wiring details......................................................................... 13
3-4. PWS100 Comms and Power Cable Connector ...................................... 15
3-5. Hardware for mounting the top of the DSP plate to a pole .................... 17
3-6. Placing the PWS100 onto the bracket ................................................... 18
3-7. PWS100 mounted to a mast or pole ...................................................... 19
3-8. Mounting the desiccant pack on the DSP cover .................................... 21
3-9. Underside of DSP enclosure .................................................................. 23
3-10. Removal of DSP cover ........................................................................ 23
3-11. Exposing the DSP board ...................................................................... 24
3-12. DSP board dip switch location ........................................................... 26
3-13. Dip switches (defaults set – 00111100) ............................................... 26
4-1. PWS100 setup menu .............................................................................. 33
4-2. Message menu ....................................................................................... 33
4-3. Message parameters and fields menu ..................................................... 34
4-4. Message interval menu .......................................................................... 34
4-5. Message mode menu .............................................................................. 35
4-6. Message field menu ............................................................................... 47
4-7. Delete message menu ............................................................................. 48
4-8. Time and date menu............................................................................... 48
4-9. Configuration menu ............................................................................... 49
4-10. PWS100 ID menu ................................................................................ 49
4-11. TRH probe menu ................................................................................. 49
4-12. Hood heater temperature menu ............................................................ 50
Page 12

iv
4-13. Dew heater mode menu ....................................................................... 50
4-14. Output mode menu .............................................................................. 50
4-15. Calibration warning screen .................................................................. 51
4-16. Calibration top menu ........................................................................... 51
4-17. Visibility only calibration process ....................................................... 52
4-18. Mounting visibility calibrator .............................................................. 52
4-19. View/adjust calibration menu .............................................................. 53
4-20. Terminal mode menu ........................................................................... 53
4-21. PSU shut down voltage menu .............................................................. 54
4-22. Password menu .................................................................................... 54
4-23. Weather parameters menu ................................................................... 55
4-24. Visibility range alarm menu................................................................. 56
4-25. Snow water content adjustment ........................................................... 57
4-26. Mixed precipitation threshold adjustment ........................................... 58
4-27. Terminal active screen ......................................................................... 59
4-28. Information menu ................................................................................ 60
4-29. Done menu........................................................................................... 60
4-30. System status information ................................................................ .... 69
5-1. Laser unit .............................................................................................. 76
5-2. Laser unit showing light sheet production (not to scale) ....................... 76
5-3. Sensor unit ............................................................................................. 76
5-4. Sensor unit showing light path extents (not to scale) ............................. 77
5-5. Block diagram of PWS100 Control Unit ............................................... 78
5-6. Signal to pedestal ratio values for different precipitation types ............. 80
6-1. Baffle removal and fitting ...................................................................... 87
Tables
3-1. Power and Communication cable connections ...................................... 14
4-1. Command set ......................................................................................... 30
4-2. Message field parameters ...................................................................... 35
4-3. Configuration defaults ........................................................................... 54
4-4. Assumed bulk density of various particle types ..................................... 56
4-5. TRH sensor types .................................................................................. 66
5-1. Precipitation intensities.......................................................................... 82
A-1. PWS100 SYNOP 4680 output codes .................................................. A-2
A-2. PWS100 NWS output codes ............................................................... A-4
A-3. PWS100 METAR codes ..................................................................... A-4
A-4. Light, moderate and heavy precipitation defined with respect
to type of precipitation and to intensity, i, with intensity
values based on a three-minute measurement period ........................ A-5
A-5. Intensity bounds for rain and drizzle................................................... A-6
A-6. Intensity bounds for rain and snow ..................................................... A-6
A-7. Intensity bounds for drizzle and snow ................................................ A-6
A-8. Intensity bounds for rain, drizzle and snow ........................................ A-6
A-9. Intensity bounds for rain, drizzle, ice pellets, hail and snow .............. A-7
A-10. Intensity bounds for ice pellets, hail and snow ................................. A-7
A-11. PWS100 precipitation size criteria ................................................... A-7
Page 13

1
Section 1. General Information
Important Safety Instructions – please request a translation or further advice if you cannot
understand this document.
Wichtige Sicherheitshinweise - bitte kontaktieren Sie uns bzgl. einer Übersetzung falls Sie
Schwierigkeiten haben Inhalte dieses Dokumentes zu verstehen.
Consignes de sécurité importantes - N'hésitez pas à demander un avis ou une traduction, si vous
ne pouvez pas comprendre ce document
Instrucciones de Seguridad Importantes – solicite por favor traducción o asesoramiento
adicional si no entiende este documento.
Istruzioni di sicurezza importanti - chieda prego una traduzione o avanti il consiglio se non
potete capire questo documento.
Instruções de segurança importantes - por favor, solicitar uma tradução ou conselho mais se
você não consegue entender este documento.
1.1 About This Manual
This manual is the operational guide and reference for the Campbell Scientific
Present Weather Sensor unit (PWS100). This manual consists of the following
sections:
Section 1 – Consists of general information on manual revisions and
safety considerations.
Section 2 – Provides a product overview with specifications of the
optical, electronic and physical aspects of the system. Advantages and
features of the system are described in detail.
Section 3 – Is a guide for installation of the PWS100 including choosing
cables, locating the sensor and assembly of the unit.
Section 4 – Describes the operation of the sensor including the sensor
command set and an introduction to the Present Weather Sensor Viewer
program.
Section 5 – Is a functional description of the PWS100, including a
description of algorithms used for particle classification.
Section 6 – Provides information on maintenance routines and cycles for
the PWS100.
Section 7 – Is a troubleshooting guide for the PWS100.
Appendix A – A list of output codes used for particle classification under
a number of different common code structures.
Appendix B – Gives software flowcharts for the PWS100 system.
Appendix C – Gives a menu system map for the PWS100.
Page 14

PWS100 Present Weather Sensor
2
1.2 General Safety
This manual provides important safety considerations for the installation,
operation and maintenance of the PWS100. These safety considerations are
classified into three levels:
Warnings alert the installer or user to serious hazards.
Ignoring these warnings could result in injury or death
and/or irrevocable damage to the sensor unit.
Cautions warn of potential hazards. Ignoring these cautions
could result in the sensor being damaged and data being lost.
Notes highlight useful information in the installation, use and
maintenance of this product. These should be followed carefully in
order to gain the maximum benefit from the use of this product.
1.3 Sensor Unit Safety
The PWS100 sensor has been checked for safety before leaving the factory and
contains no internally replaceable or modifiable parts.
Do not modify the PWS100 unit. Such modifications will
lead to damage of the unit and could expose users to
dangerous laser light levels and voltages.
In unusual failure modes and environmental conditions
the sensor hood could become hot. In normal operation
they will be at ambient temperature or slightly above.
Ensure that the correct voltage supply is provided to the
sensor.
1.4 Laser Safety
The PWS100 sensor incorporates a laser diode which is rated as a class 3B device.
This is an embedded laser where the output from the sensor unit, through the
optics, is minimised to class 1M. This classification indicates that viewing of the
beam with the naked eye is safe but looking directly into the beam with optical
instruments, e.g. binoculars can be dangerous.
From the laser head the output has the following characteristics:
Maximum pulse energy: 73 nJ
Pulse duration: 5.2 μs
Wavelength: 830 nm
EN 60825-1:2001
WARNING
CAUTION
NOTE
WARNING
WARNING
CAUTION
Page 15

Section 1. General Information
3
The sensor is marked with the following warning:
INVISIBLE LASER RADIATION
DO NOT VIEW DIRECTLY WITH OPTICAL INSTRUMENTS
CLASS 1M LASER PRODUCT
Opening the laser head unit with the power applied to the
PWS100 may expose the user to hazardous class 3B laser
radiation. To open the unit requires the use of tools and
should not be carried out except by trained personnel.
The laser should not be operated outside of the housing.
Check that the laser warning label on the sensor is still
visible and can be clearly read on an annual basis.
When installing the sensor avoid pointing the laser
housing towards areas where binoculars are in common
use.
WARNING
WARNING
Page 16

PWS100 Present Weather Sensor
4
Page 17
5
Section 2. Product Overview
2.1 Introduction
The PWS100 Present Weather Sensor is a laser based sensor capable of
determining precipitation and visibility parameters for automatic weather stations
including road, marine and airport stations. Due to its advanced measurement
technique and fuzzy logic algorithms the PWS100 can determine each individual
particle type from accurate size and velocity measurements and the structure of the
received signal.
The system can output visibility and precipitation related weather codes such as
those detailed in the World Meteorological Organisation (WMO) SYNOP code,
those used as part of a METAR weather report and those previously used by the
US National Weather Service (NWS).
Further details of precipitation can be given in terms of drop size distributions
(DSD) and particle size / velocity maps to give better indications of precipitation
intensity. Such distributions can then be used in soil erosion studies.
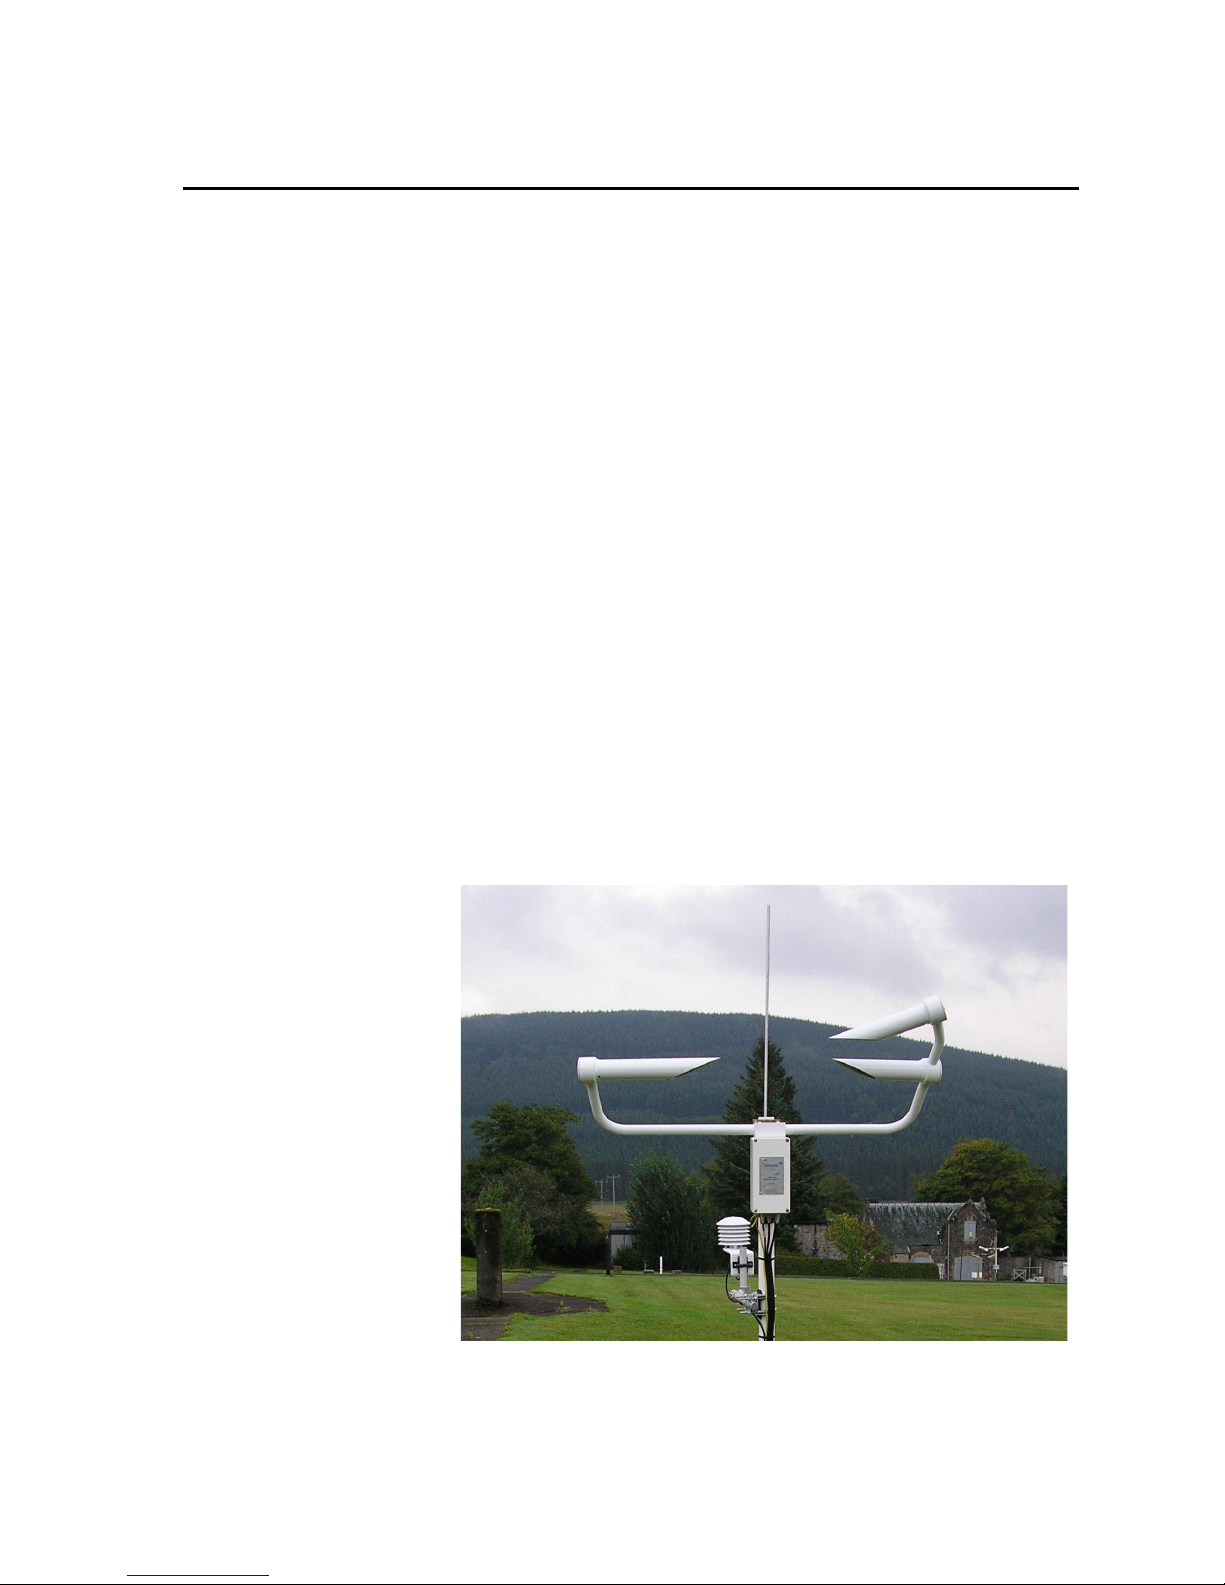
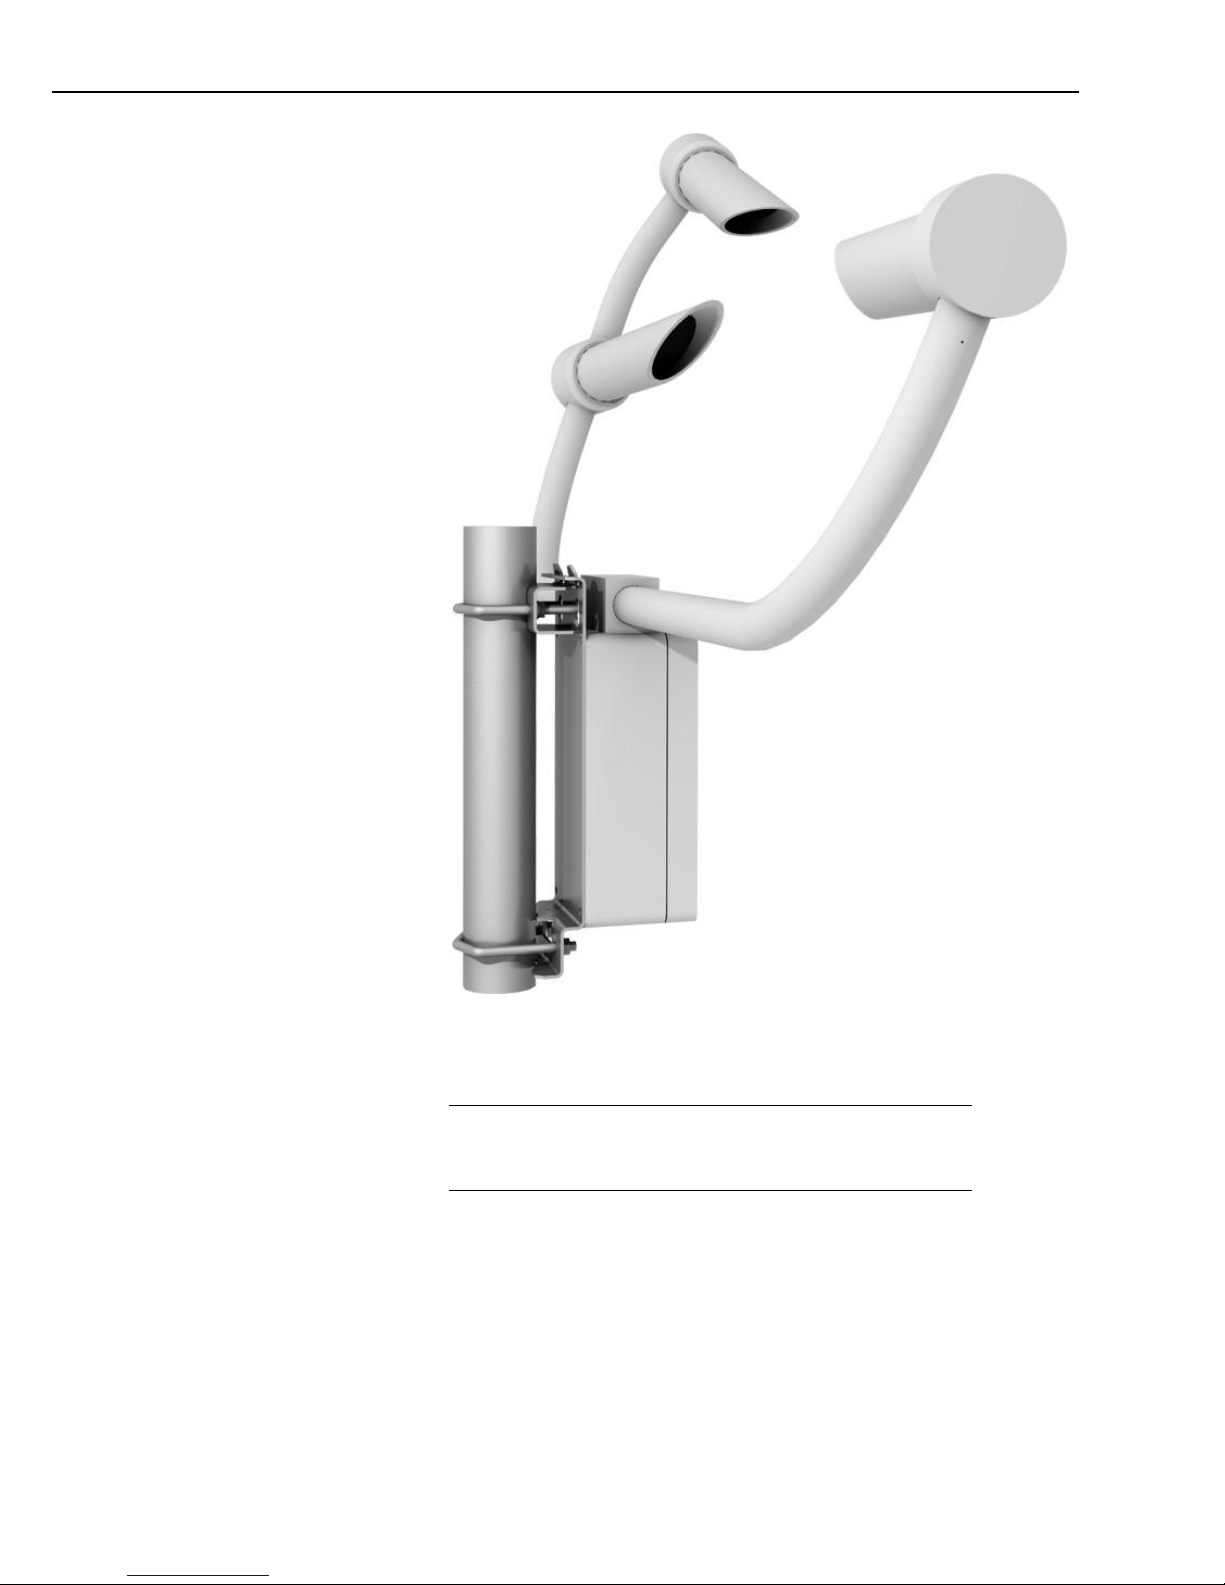
The PWS100 comprises a Digital Signal Processor (DSP) housing unit connected
to a sensor arm, comprising one laser head and two sensor heads. Each of the
sensor heads is 20 off axis to the laser unit axis, one in the horizontal plane, the
other in the vertical plane. The DSP housing is fixed via a mounting bracket to a
mast, though a tripod can be used for temporary sites. Figure 2-1 shows the
PWS100 mounted on a pole.
An optional CS215 temperature and humidity sensor is normally supplied and
plugs directly into the PWS100. That sensor is used to improve the accuracy of
weather coding by the PWS100, in particular in respect of discriminating between
snow and rain and also fog/mist and dust.
Figure 2-1. PWS100
Page 18

PWS100 Present Weather Sensor
6
2.2 Specifications
2.2.1 Mechanical Specifications
Measuring Area: nominally 40 cm2
Housing Materials: Iridite NCP conversion coated aluminium (RoHS compliant)
and hard anodised aluminium. Outer parts also coated with marine grade paint.
Weight: 8 kg Excluding mounting pole and power supply / communications
enclosure.
Dimensions: 1150 mm × 700 mm × 400 mm
Mountings: PWS mounting bracket to pole (diameter 32 mm to 52.5 mm).
2.2.2 Electrical Specifications
Power Requirements: DSP power 9 - 28 V. Current requirement (maximum at 9V
supply) 200mA with the dew heater off. 1 A with dew heaters and SDI-12 sensors.
These currents are lower at higher supply voltages as the sensor uses SMPS
technology. Optional hood heater 24 V AC or DC, 7 A.
If used with older CS215 sensors, before S/N E13405, the
maximum voltage is 16V.
It is the responsibility of the user to ensure that any local safety
regulations, regarding the use of power supplies, are adhered to.
Communication: RS-232, RS-422, RS-485. Baud rate 300 bps to 115.2 kbps
supported.
Control Unit: Custom DSP board.
EMC Compliance: Tested and conforms to BS EN 61326:1998. Class A device.
This may cause interference in a domestic environment.
2.2.3 Optical Specifications
2.2.3.1 Laser Head Specifications
Laser Source: Near-IR diode, eye safe Class 1M unit output.
Peak wavelength: 830 nm.
Modulation Frequency: 96 kHz.
Laser Head Lens Diameter: 50 mm
CAUTION
NOTE
Page 19

Section 2. Product Overview
7
2.2.3.2 Sensor Head Specifications
Receivers: Photodiode with band pass filters.
Spectral Response: Maximum spectral sensitivity at 850 nm, 0.62 A/W (0.6 A/W
at 830 nm)
Sensor Head Lens Diameter: 50 mm
Lens Check Light Source: Near-IR LED.
2.2.4 Environmental Specifications
Standard Operating Temperature Range: -25C to +50C
Optional Extended Operating Temperature Range: -40C to +70C
Relative Humidity Range: 0 to 100%
Maximum Wind speed: 60 ms
-1
IP Rating: IP 66
2.2.5 CS215 Sensor Specifications
Please refer to the CS215 sensor manual for detailed of the accuracy and
specifications of this optional probe.
2.3 Measurement Capabilities and Limitations
2.3.1 Visibility Measurements
Visibility Range: 0 to 20000 m.
Visibility Accuracy: ± 10% (0 to 10000 m)*
Measurement interval: User selectable from 10 seconds to 2 hours.
2.3.2 Precipitation Measurements
Particle Size: 0.1 mm to 30 mm*
Size Accuracy: ± 5% (for liquid particles >0.3 mm)*
Particle Velocity: 0.16 ms-1 to 30 ms-1
Velocity Accuracy: ± 5% (for particles >0.3 mm)*
Basic Types Of Precipitation Detected: Drizzle, Rain, Snow Grains, Snow Flakes,
Hail, Ice Pellets, Graupel (heavily rimed solid precipitation), Freezing Rain,
Freezing Drizzle, Mixed (combination of types above).
Rain Rate Intensity Range: 0 to 999 mmh-1 (M-P Distributed)
Rainfall Total Resolution: 0.0001 mm
Rain Total Accuracy: ± typically 10%* (accuracy will be degraded in windy
conditions, for frozen precipitation and very high rainfall rates)
DSD bin sizes: 0.1 mm (diameter) 0.1 ms-1 (velocity)
Page 20

PWS100 Present Weather Sensor
8
Data Output: Raw parameter output (particle size, particle velocity, signal peak
value, signal pedestal value), WMO SYNOP codes (4680, Wa Wa - precipitation
and obscurant type), WMO METAR codes (4678, Wa Wa - precipitation and
obscurant type), NWS code, drop size distribution (DSD) statistics, particle type
distribution, size / velocity intensity maps, precipitation rate, precipitation
accumulation, visibility range and internal checks (temperatures, lens
contamination, processing limits).
External Sensors: CS215 supported for temperature / RH measurement OR this
data can be sent to it from the controlling system from a remote sensor.
*The accuracy figures quoted are for laboratory conditions with reference particles
and visibility standards. In practice, the proportion of particles detected will fall
off significantly below about 0.5 mm diameter.
2.3.3 Data Storage and Buffering
The PWS100 has a large internal memory that is split up to store different types of
data. One buffer, the particle buffer, is used to hold raw signal data captured from
the detectors. The size of this buffer and the speed at which it can be processed is
a limit on the maximum rainfall rates the sensor can measure. For most users this
is not a limitation, if it may be please read the description below.
The particle buffer is able to hold raw data for 500 typical particles. The
processor is able to process the particles at a rate of 120 particles per second,
typically. This means if more than 120 particles per second fall through the
sample area of 40 cm2 the particle buffer will start to fill up. If the rain rate
exceeds 120 particles per second for a prolonged period the buffer could run out of
space and particles will be lost.
The fact that the processor is running behind real-time and/or particles are being
missed can be monitored in the alarm message which can be selected for data
output.
The particle processor then places data about each particle in the Large Particle
Array (LPA). The LPA is 100000 records long. It uses 5 records every 10 seconds
plus a record for every processed particle that passes through the volume. For
example if 20 particles per second are processed then 20.5 records are used per
second. Since 100000 records can be stored, the system can store 100000 / 20.5 =
4878 seconds worth of data in the LPA. The user needs to be aware of the size of
this buffer as it is used to hold data that is processed when a message is output.
The size of the buffer may become a limiting factor if a very long message
interval is selected and rainfall rates are high.
The PWS100 has the capability to store measured data in a buffer called the
message storage buffer which is 1 MByte (1000000 characters in size). All ASCII
characters including CrLf must be included in any storage calculations. This
buffer stores the user defined messages (see Section ‘4.5 Message Related
Commands’ for the types of messages available to the user). A typical message
containing 120 characters can be stored 1000000 / 120 = 8333 times which at
minute intervals for the data output would be over 138 hours’ worth of storage.
Page 21
9
Section 3. Installation
3.1 Location and Orientation
The PWS100 measures environmental variables and is designed to be located in
harsh weather conditions. However there are a few considerations to take into
account if accurate and representative data from a site are to be obtained.
The descriptions in this section are not exhaustive. Please refer to
meteorological publications for further information on locating
weather instruments.
The PWS100 should be sited in a position representative of local weather
conditions and not of a specific microclimate (unless the analysis of microclimate
weather is being sought).
To give non-microclimatic measurements the PWS100 should be sited away from
possible physical obstructions that could affect the fall of precipitation. The
PWS100 should also be positioned away from sources of heat, electrical
interference and in such a position as to not have direct light on the sensor lenses.
Whenever possible, the PWS100 should be located away from windbreaks.
Several zones have been identified upwind and downwind of a windbreak in
which the airflow is unrepresentative of the general speed and direction. Eddies
are generated in the lee of the windbreak and air is displaced upwind of it. The
height and depth of these affected zones varies with the height and to some extent
the density of the obstacle.
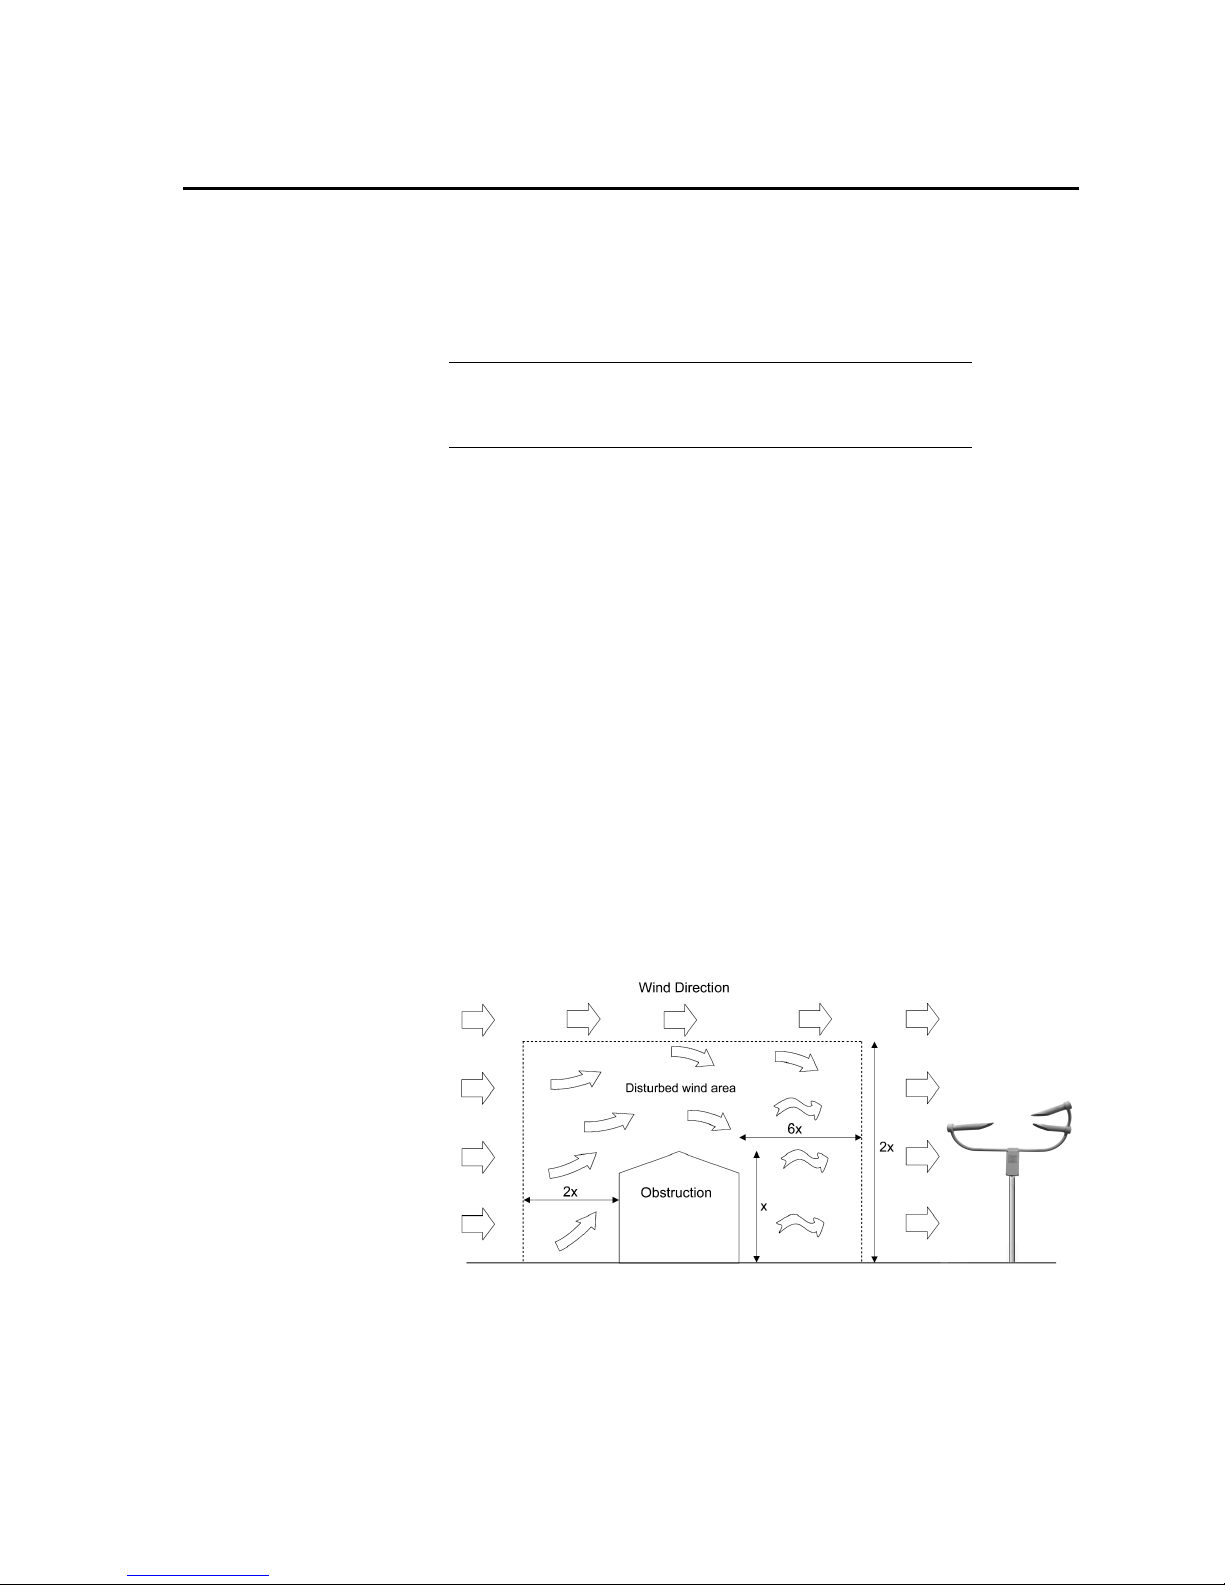
Generally, a structure disturbs the airflow in an upwind direction for a distance of
about twice the height of the structure, and in a downwind direction for a distance
of about six times the height. The airflow is also affected to a vertical distance of
about twice the height of the structure. Ideally, therefore, the PWS100 should be
located outside this zone of influence in order to obtain representative values for
the region (see Figure 3-1).
Figure 3-1. Effect of structure on air flow
NOTE
Page 22

PWS100 Present Weather Sensor
10
In order to reduce the service frequency with the unit, the PWS100 should be
placed away from sources of contamination, in the case of roadside monitoring,
larger mounting poles can be used. More regular maintenance will be required
when the instrument is placed in areas where contamination is unavoidable or
where measurements may be safety critical.
The PWS100 has good resistance to background light but it is a good idea to avoid
locations where the transmitter is pointing at a light scattering or reflecting
surface. Ideally, the horizontal sensor head should point north in the northern
hemisphere and south in the southern hemisphere but this is not critical.
High frequency light sources can lead to increased system noise and hence
erroneous weather classification so the PWS100 should be positioned in a location
where such interference is minimised. Ideally this should be a minimum of 100 m
from the nearest high frequency light source, with the sensor heads pointing away
from the light source. In any case the sensor heads should be positioned to be
away from any high frequency light source.
Avoid locations where the transmitter is pointing at a light scattering or reflecting
surface.
When installing the sensor avoid pointing the laser
housing towards areas where binoculars are in common
use.
Any risk to health is minimal as to be at any risk at all from the laser light source
the operator would need to look directly down the beam of light, so would need to
be at the same height and in exact alignment with the sensor. In addition the beam
diverges slightly so the risk decreases with distance from the sensor.
3.2 Grounding and Lightning Protection
3.2.1 Equipment Grounding
The present weather sensor must be properly grounded by taking a ground wire
with a minimum cross sectional area of 8 mm2 and maximum length of 10 m from
the brass grounding lug in the lower face of the electronics enclosure to an
adequate grounding point. The pole and foundations of a pole mounted installation
will provide some basic lightning protection and protection against radio
frequency interference.
An optional grounding/lightning protection system can
be supplied with the PWS100 which is designed to give
the system some protection against induced transients
and secondary lightning discharges. Whilst the system
does offer some protection against lightning damage, if
the present weather sensor is installed at a site where
frequent lightning strikes are likely, Campbell Scientific
recommends that you seek the advice of a specialist
lightning Protection Company.
WARNING
WARNING
Page 23
Section 3. Installation
11
3.2.2 Internal Grounding
The DSP enclosure of the unit and associated electronics are grounded through the
power cable assembly. The sensor components are in contact with each other or
have internal copper contacts.
3.2.3 Lightning Rod (Optional)
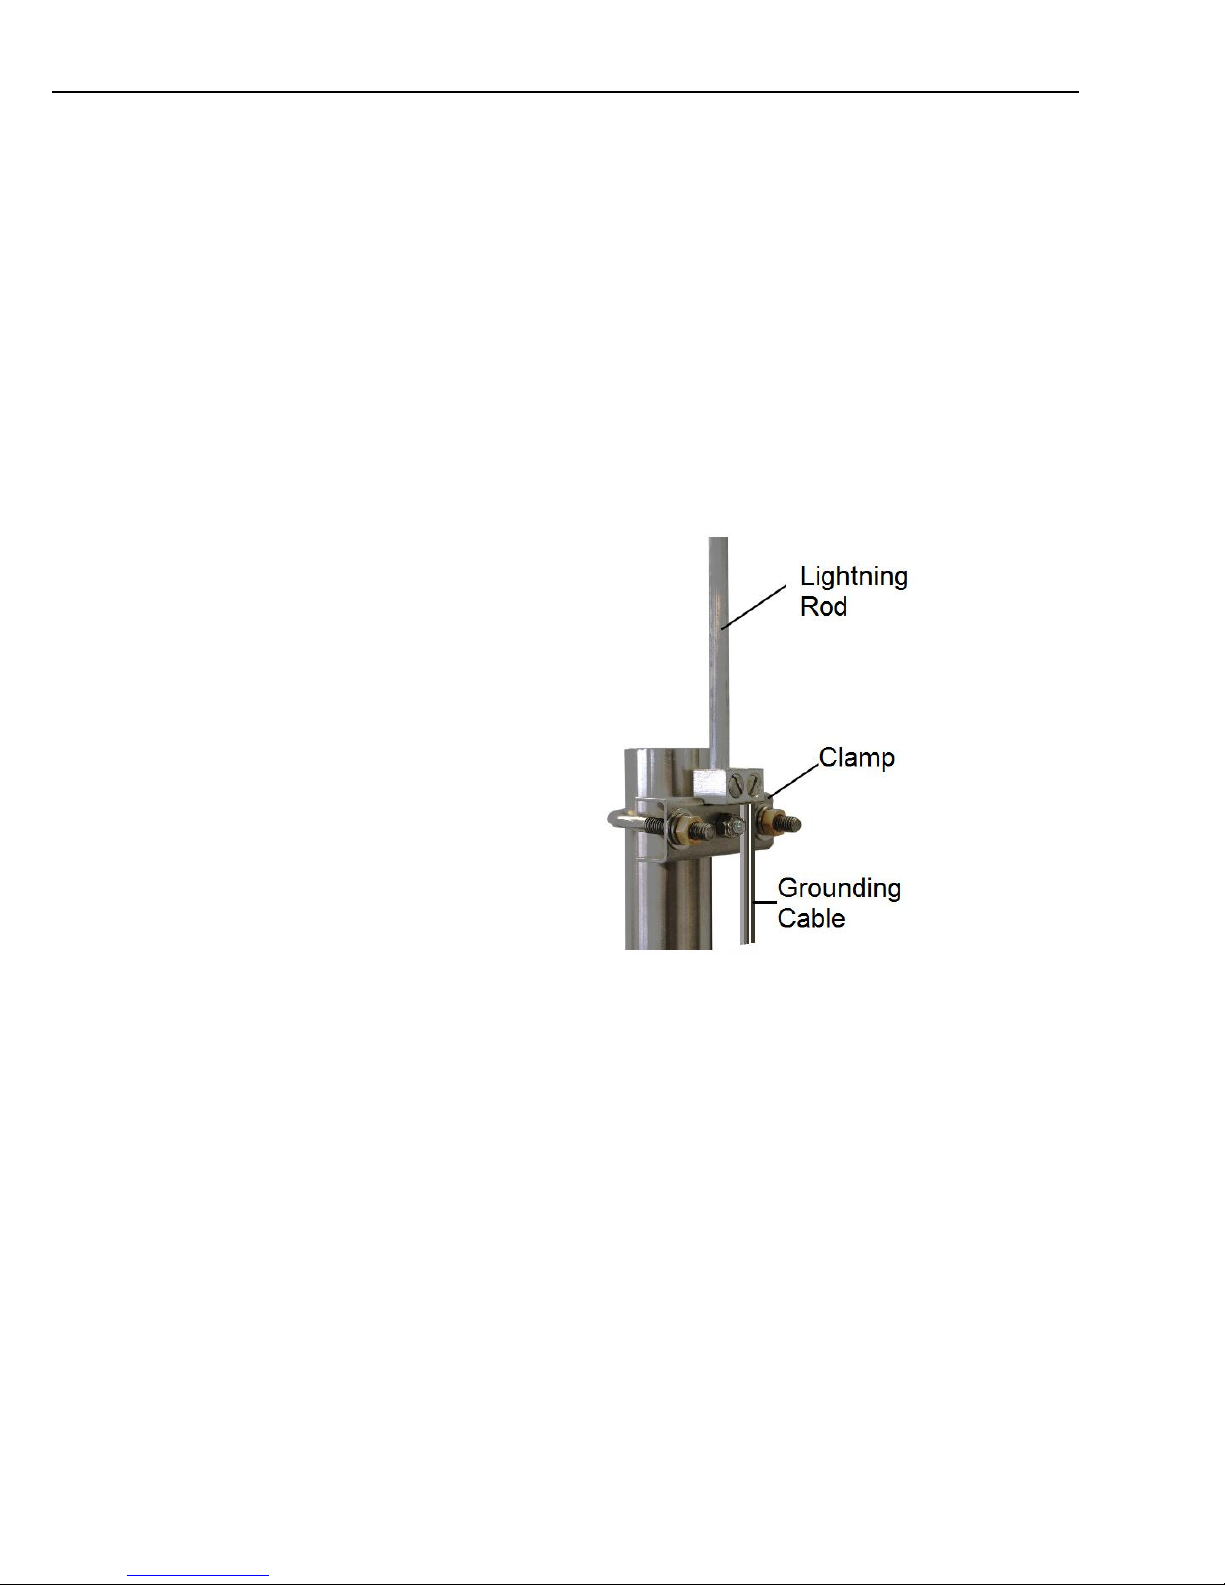
If a lightning rod is to be fitted to the PWS pole fit it as shown in Figure 3-2 using
the special clamp supplied. Connect grounding cable between the lightning rod
clamp and the clamp on a grounding spike.
It is suggested that a lightning rod is only fitted where there is significant risk of
lightning strike. During rainfall events water can accumulate and shed from the
rod into the PWS100 sensing volume and cause erroneous measurements. The rod
itself can also interfere with the passage of precipitation particles and ice
accumulation can exacerbate the situation.
Figure 3-2. Attaching a lightning rod
3.2.4 Grounding Spike Kit (Optional)
Campbell Scientific can supply a grounding kit for the PWS100 consisting of two
copper-covered steel grounding spikes, grounding wire and associated clamps and
connectors.
Install the grounding kit as follows:
1. Screw the black Allen screw into the straight brass connector and then screw
the connector onto the blunt end of one of the copper-coated grounding spikes.
Drive the spike into the ground using the Allen screw as a driving head.
Position the spike as close as possible to the base of the pole.
2. Remove the Allen screw and screw the second spike into the straight
connector. Drive the second spike into the ground leaving about 100 mm
exposed above ground. This will drive the first spike to a depth of about 2.3 m
into the ground and should provide a good ground for lightning protection
purposes.
Page 24

PWS100 Present Weather Sensor
12
If the ground type does not permit you to drive the spikes in to a
total length of 2.3 metres then drive in the two rods individually,
spaced at least 2 metres apart, and join them together using a length
of the heavy gauge grounding wire, using additional clamps
(available from Campbell Scientific).
3. A lightning rod may already have been installed on the top of the pole as
shown in Section 3.2.3. Grounding cable should be connected to the lightning
rod clamp.
4. Connect a grounding cable to the grounding lug in the lower face of the
PWS100 electronics enclosure.
5. Connect grounding cables from the enclosure and any lightning rod to the
exposed ground spike using the brass grounding-bond clamp provided. If you
had to install the spikes separately, because of ground conditions, take the
cable to the nearest spike. Try to keep the length of wires used to a minimum,
without coiling the wires.
6. Apply Waxoyl (or similar rust proofing compound) to the areas around the
lightning rod clamp, the grounding lug clamp and where the grounding cable
connects to the ground spike.
3.3 Cable Selection
Some older units were shipped with different cables. These would
have been described in the User Guide current at that time.
3.3.1 Heater Cable
The PWS100 is provided pre-wired with a default 10 m heater cable. This cable
should be grounded using the cable screen at both ends. One end is to be
connected to the power sources for the hood heaters (24V) the other is fed through
the cable gland on the base of the PWS100 DSP enclosure and fixed in the
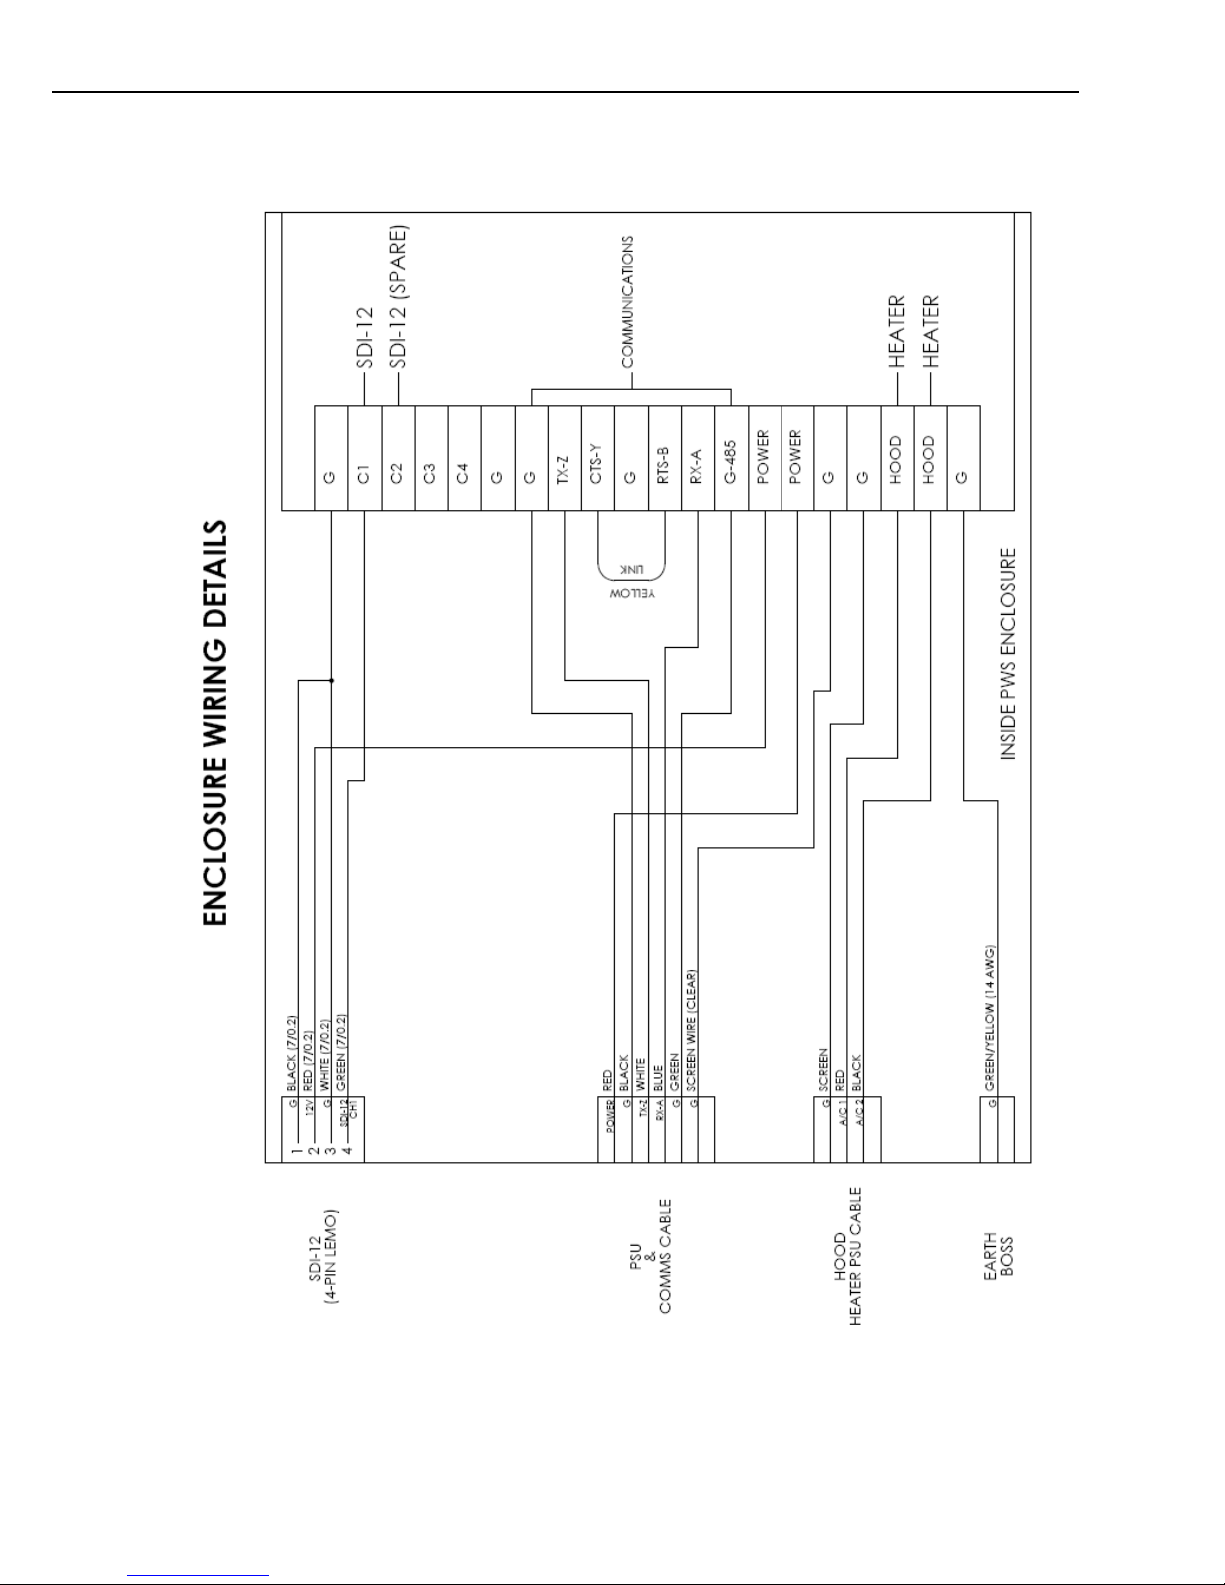
terminal strip as shown in Figure 3-3. The cable supplied is 10 m long and is the
longest of this type that can be used.
If another cable is to replace the pre-wired cable then it is normally recommended
that the same type of cable is used and the wiring colour scheme shown in
Figure 3-3 is followed to avoid confusion
However, alternative cable can be used and may be required for longer cable runs
to reduce voltage drops in the cable. Wire with larger diameter conductors may be
needed as any reduction below 24V, due to voltage drops along the cable, will
limit the heaters effectiveness.
To remove the existing cable, unscrew the cable gland until the cable is loose then
locate the individual termination points of the wires. Using a small flat blade
screwdriver, press down the tab on the top of the terminal strip at the point of the
wire connection and pull the wire from the front slot. Carry this out for all of the
wires in the cable and then pull the cable from the cable gland until free. Insert the
new (stripped) cable and insert the wires into the corresponding positions one by
one by again depressing the tab on top of the terminal strip and then securely
pushing the stripped end of the wire fully into the front slot.
NOTE
NOTE
Page 25
Section 3. Installation
13
Figure 3-3. Enclosure wiring details
Page 26

PWS100 Present Weather Sensor
14
3.3.2 Power and Communication Cable
The PWS100 is provided pre-wired with a default 10 m power and
communications cable which is terminated at one end with a 9 pin D-connector
(DB9). The D-connector can be connected directly to a PC or datalogger such as
the Campbell Scientific CR1000 using a suitable interconnecting cable such as the
SC110. If another type of connection is required then the D-connector should be
removed. The other end is fed through the cable gland on the base of the PWS100
DSP enclosure and fixed in the DSP terminal strip as shown in Figure 3-3. The
cable connections for RS-232 and RS-485 are shown in Table 3-1.
Additional RS485 cable should be twisted pair.
A USB-serial adaptor is available part number 010777.
If another cable is to replace the pre-wired cable then ensure that the correct cable
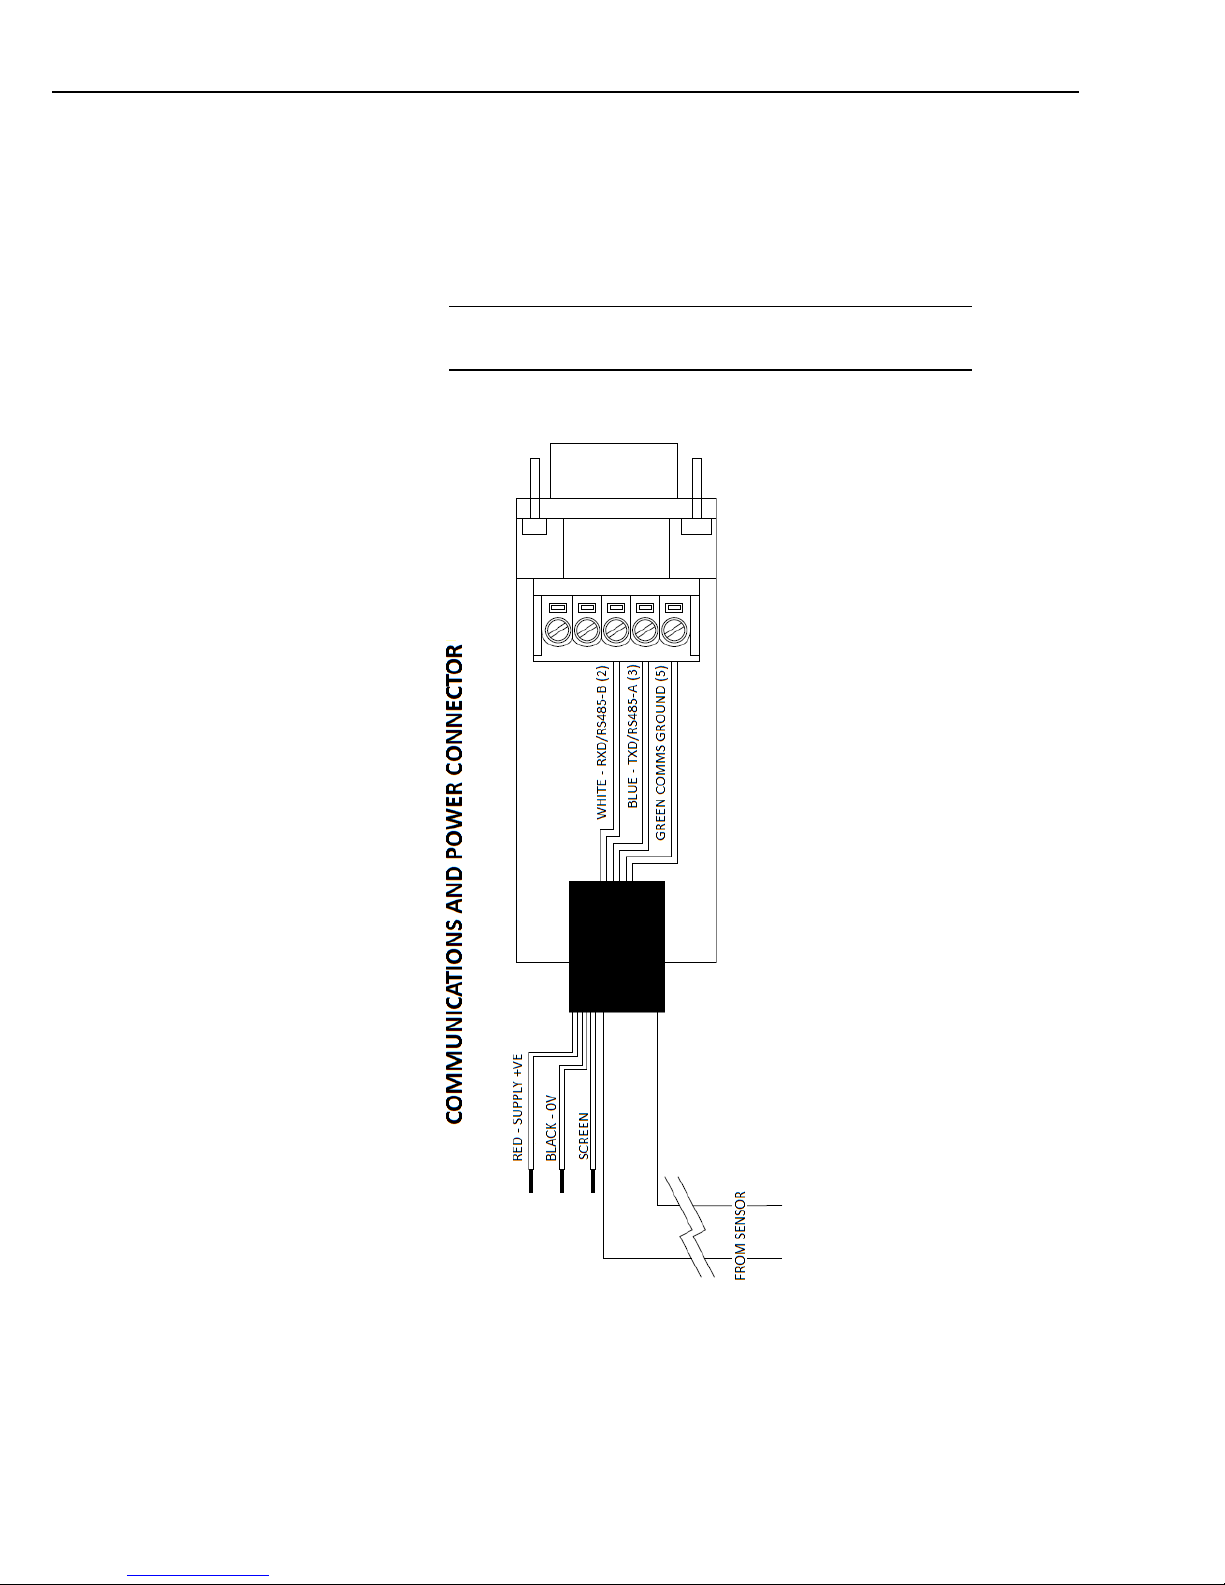
is used and the wiring colour scheme shown in Figures 3-3 and 3-4 is followed
exactly.
To remove the existing cable, unscrew the cable gland until the cable is loose then
locate the individual termination points of the wires. Using a small flat blade
screwdriver, press down the tab on the top of the terminal strip at the point of the
wire connection and pull the wire from the front slot. Carry this out for all of the
wires in the cable and then pull the cable from the cable gland until free. Insert the
new (stripped) cable and insert the wires into the corresponding positions one by
one by again depressing the tab on top of the terminal strip and then securely
pushing the stripped end of the wire fully into the front slot.
Table 3-1. Power and Communication cable connections.
Colour
PWS Terminal
RS-232
RS-485 half-duplex
Red
Power
+ve supply
+ve supply
Black
G
power and signal
ground
power and signal
ground
Green
RS485-G
-
RS485G
Blue*
RX-A
RX
-
Blue*
CTS-Y
-
RS485 (A)
White
TX-Z
TX
RS485 (B)
Screen G Ground
Ground
*Note the blue wire has to be moved to use RS485 communications
As shipped the PWS100 does not support hardware handshaking.
However if hardware handshaking is required, remove the yellow
wire link between the RTS and CTS terminals inside the PWS
enclosure. Extra cable cores will then be required and the cable
supplied will need to be replaced. See Figure 3.3.
NOTE
Page 27
Section 3. Installation
15
3.3.3 Full duplex RS485 operation
Full duplex RS485 operation is possible with the PWS100. However the supplied
cable does not have sufficient cores. To use RS485 duplex communications with
another cable the connections are as follows. `CTS-Y’ and `TX-Z’ are outputs.
`RX-A’ and `RTS-B’ are inputs. The yellow link between `CTS-Y’ and `RTS-B’
should be removed.
Dip switch 3 must be set `off’ for full duplex operation. See Section
3.5.6.
Figure 3-4. PWS100 Comms and Power Cable Connector
NOTE
Page 28

PWS100 Present Weather Sensor
16
3.4 Unloading and Unpacking
3.4.1 Unpacking Procedure
Depending on the power and mounting options selected for the PWS100 there will
be a number of boxes containing the PWS sensor unit, Optical Sensor mount, power
supply/ external communications enclosure and grounding equipment.
Handle the boxes carefully, taking care not to drop them as
the sensor can be damaged if dropped.
Unpack the boxes carefully and check the contents, ensuring that the contents
match those listed on the packing slip. Carefully remove the items and replace all
packing materials back into the empty boxes and store in case the unit is required
to be repacked for shipping.
3.4.2 Storage Information
The PWS100 should be stored between -40C to +70C in a dry place, preferably
with the enclosures securely fastened with desiccant in place. The optics should be
protected from possible accidental damage.
3.5 Installation Procedures
3.5.1 Mounting the PWS100
A pole mounting kit is supplied with the PWS100. This kit includes a DSP plate,
two brackets and suitable bolts for clamping the pole between the DSP plate and
brackets. To mount the PWS100 onto a pole:
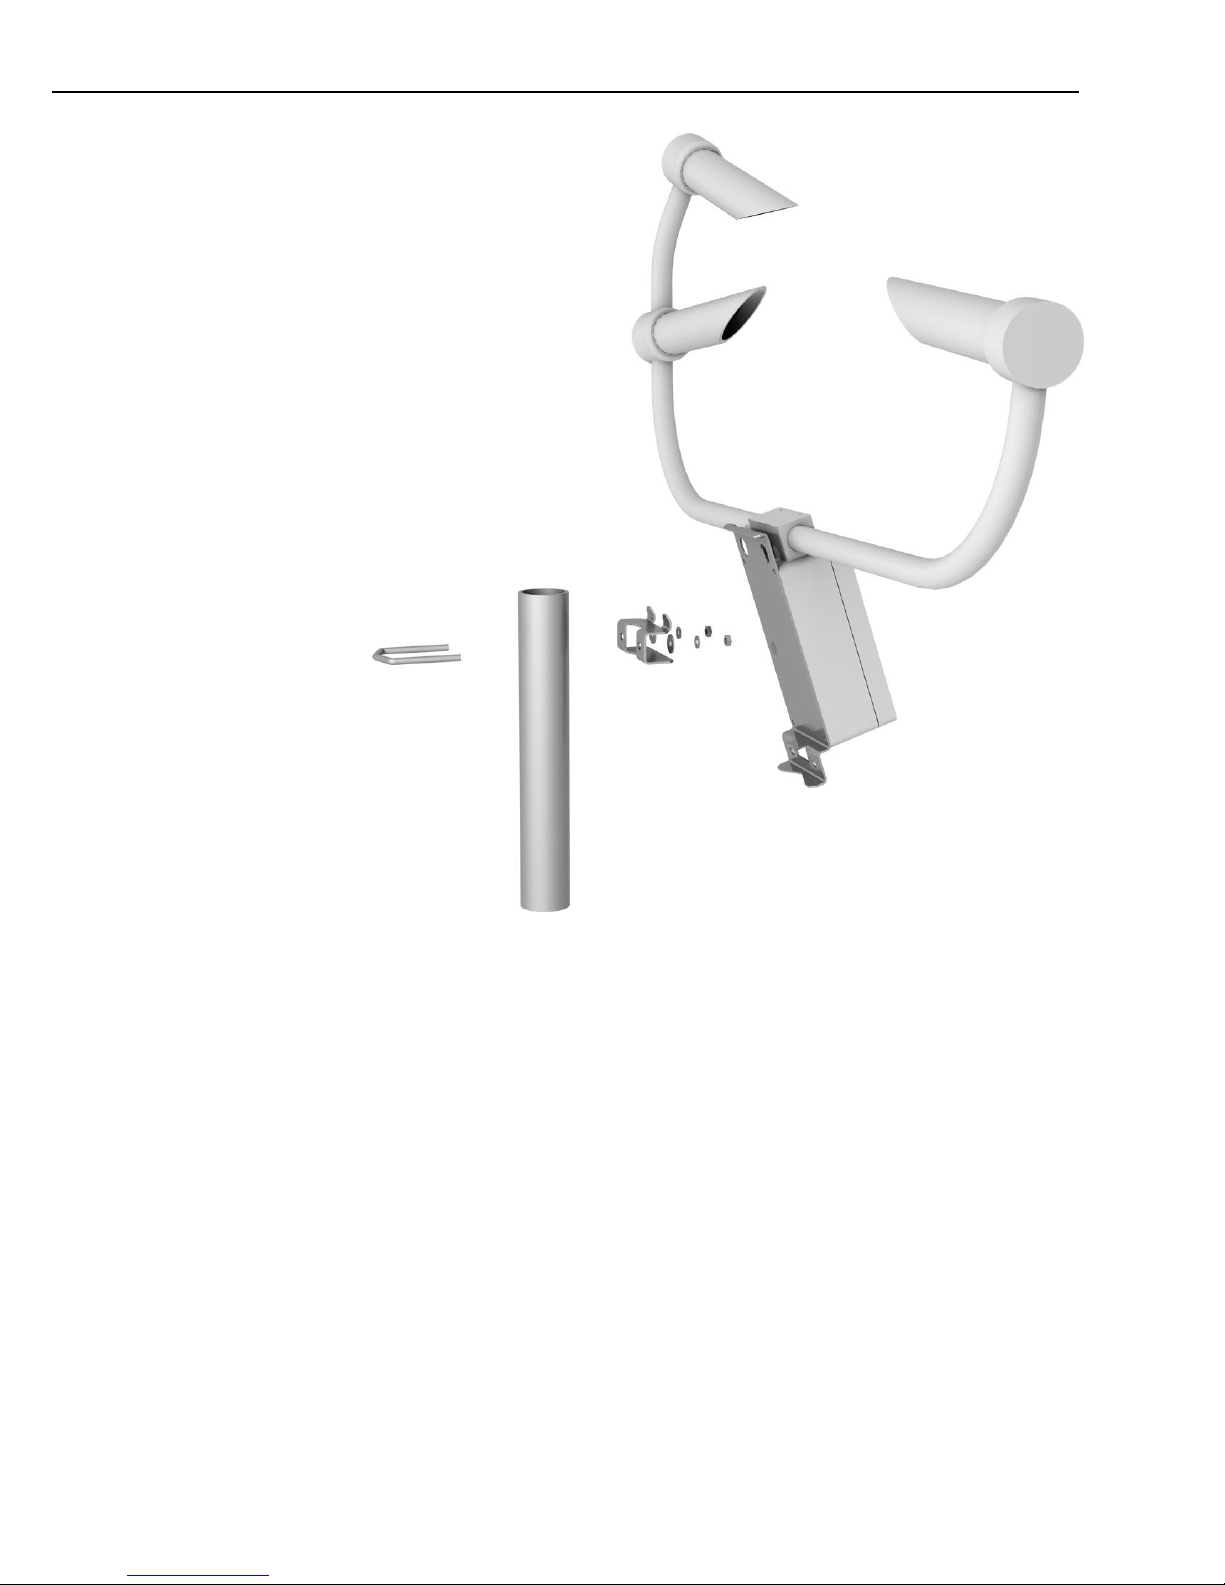
1. Fasten the bracket to the pole using one u-bolt, two flat washers, two split
washers, and two nuts (see Figure 3-5).
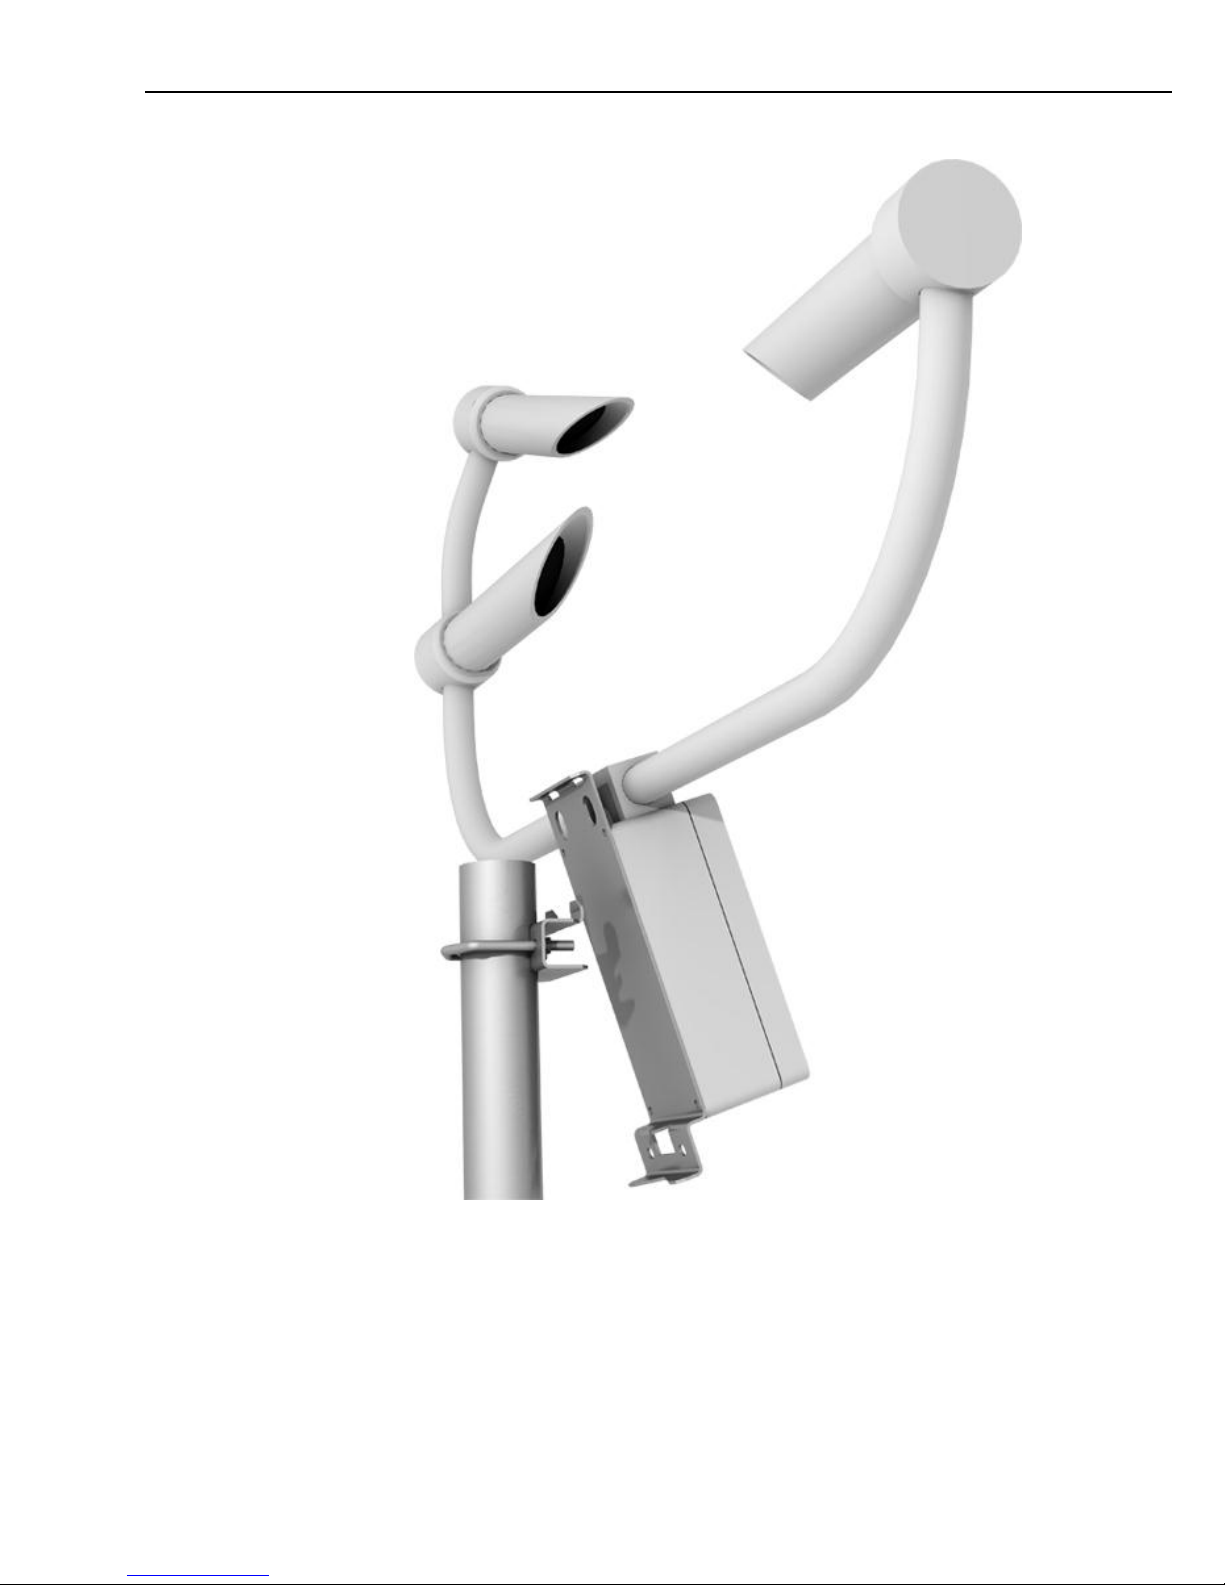
2. Place the DSP plate on the bracket. The tables of the bracket fit in the notches
at the top of the DSP plate (see Figure 3-6).
3. Fasten the bottom of the DSP plate using the remaining u-bolt, washers, and
nuts (see Figure 3-7).
4. If a power supply enclosure has been supplied with the sensor it can be
mounted on the pole, near its base using the brackets supplied with the
enclosure. Alternatively the power supply can be mounted elsewhere, e.g. on a
wall at some distance from the sensor. The power supply enclosure should be
mounted away from the sensor head to avoid wind flow disturbance or rain
drops bouncing back up into the sensor’s sensing volume.
Take care not to over tighten the nuts on the bolts, as it may be
possible to distort and/or damage the brackets or DSP plate by doing
so, and/or the nuts may seize up. Only tighten the nuts to a degree
necessary to hold the PWS100 firmly in place.
CAUTION
CAUTION
Page 29
Section 3. Installation
17
Figure 3-5. Hardware for mounting the top of the DSP plate to a pole
Where the PWS100 is to be mounted onto another type of mast please refer to the
mast manual for mounting details.
Page 30
PWS100 Present Weather Sensor
18
Figure 3-6. Placing the PWS100 onto the bracket
Page 31
Section 3. Installation
19
Figure 3-7. PWS100 mounted to a mast or pole
Ensure that the PWS100 is mounted according to Figure 3-5
through 3-7. Do not reposition, once fixings are tightened, by
forcing the arms of the unit as this can damage the unit.
3.5.2 Optional Campbell Scientific Mount
A Campbell Scientific `optical sensor mount’, part number 009354, is available.
This will put the sample volume at about 1.5 m in compliance with the WMO
`Guide to Meteorological Instruments and Methods of Observation’, 7th Edition,
Section 9.3.4.
If one is to be used follow the installation instructions below.
CAUTION
Page 32

PWS100 Present Weather Sensor
20
The mount should be installed on a concrete foundation. If one does not already
exist then a concrete foundation should be constructed at least 600 mm square and
600 mm deep. Ensure the ground consistency is not too loose and will be able to
support the mount and concrete foundation.
Drill four 12 mm diameter holes using the mount base as a template to a depth of
77 mm.
Clean the holes of all debris.
Place washers and nuts on the ends of the wedge anchors supplied (to protect the
threads during installation).
Hammer the wedge anchors into the holes until the start of the threads are below
the surface.
Tighten the nuts until about 25 mm of thread protrudes above the surface.
Remove the washers and nuts from the protruding length screw. Then lower the
mount into place.
Finally, secure the mount with the washers and nuts.
If the surface is not level and flat it may be necessary to add washers under the
base on one or more of the foundation screws.
3.5.3 Connecting Cables
The sensor unit comes with the DSP control unit fixed to the sensor arm. All
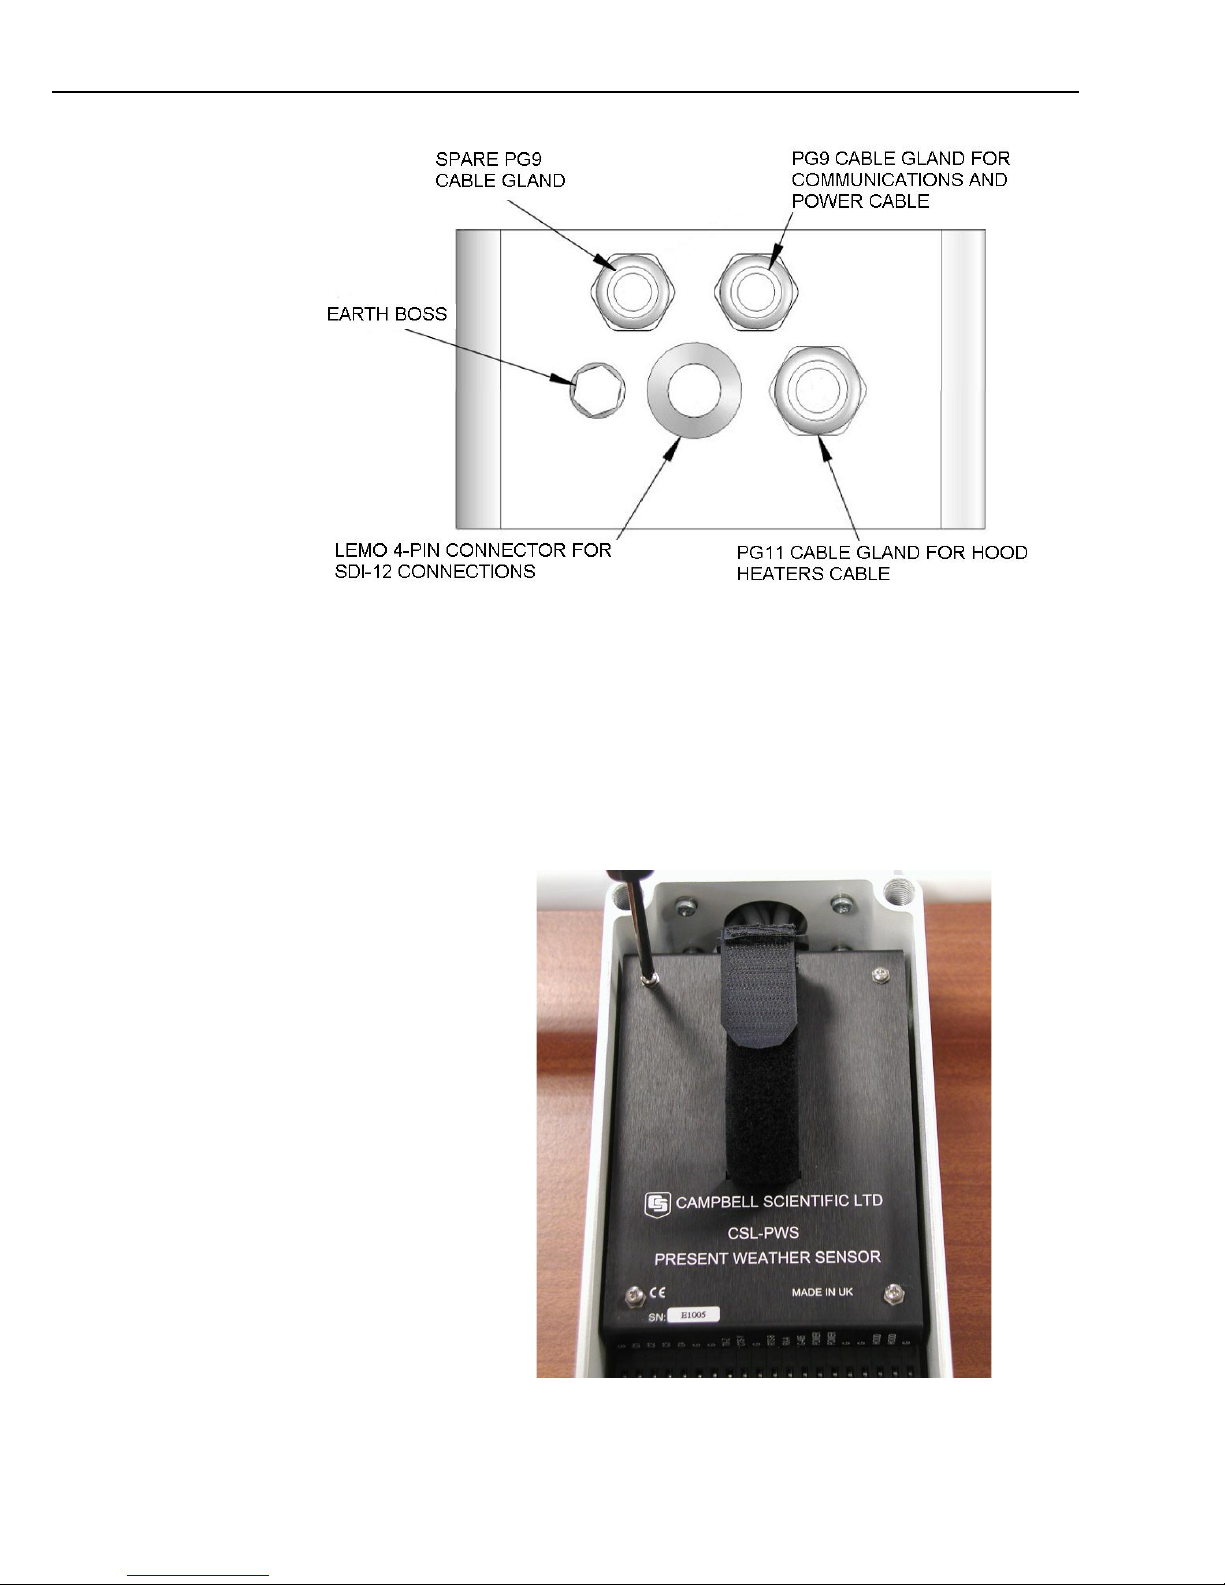
cabling between the sensor heads and the DSP unit is premade. The SDI-12
connections are wired to a LEMO socket on the lower face of the DSP housing.
This is primarily wired for the CS215 sensor but is also used for the PWS
calibrator. Power, communications and additional sensor connections are routed
through the cable glands on the lower face of the DSP housing to the DSP
terminal strip. As a factory default 10 m cables are pre-wired in the unit (these
may have been specified differently and so may be of different length on this
specific unit). The third cable gland will be sealed off by default but can be used
for further external sensor connections or a separate power cable for the hood
heaters, rather than sharing the main power cable.
There should be no need to alter any wiring within the DSP housing and the
housing cover should only be removed periodically to renew desiccant packs or if
any of the hardware switches need to be used. However if cable lengths are to be
changed then these will have to be rewired in the DSP housing (see ‘3.3.1 Power
Cable’ and ‘3.3.2 Communication Cable’ sections for further details).
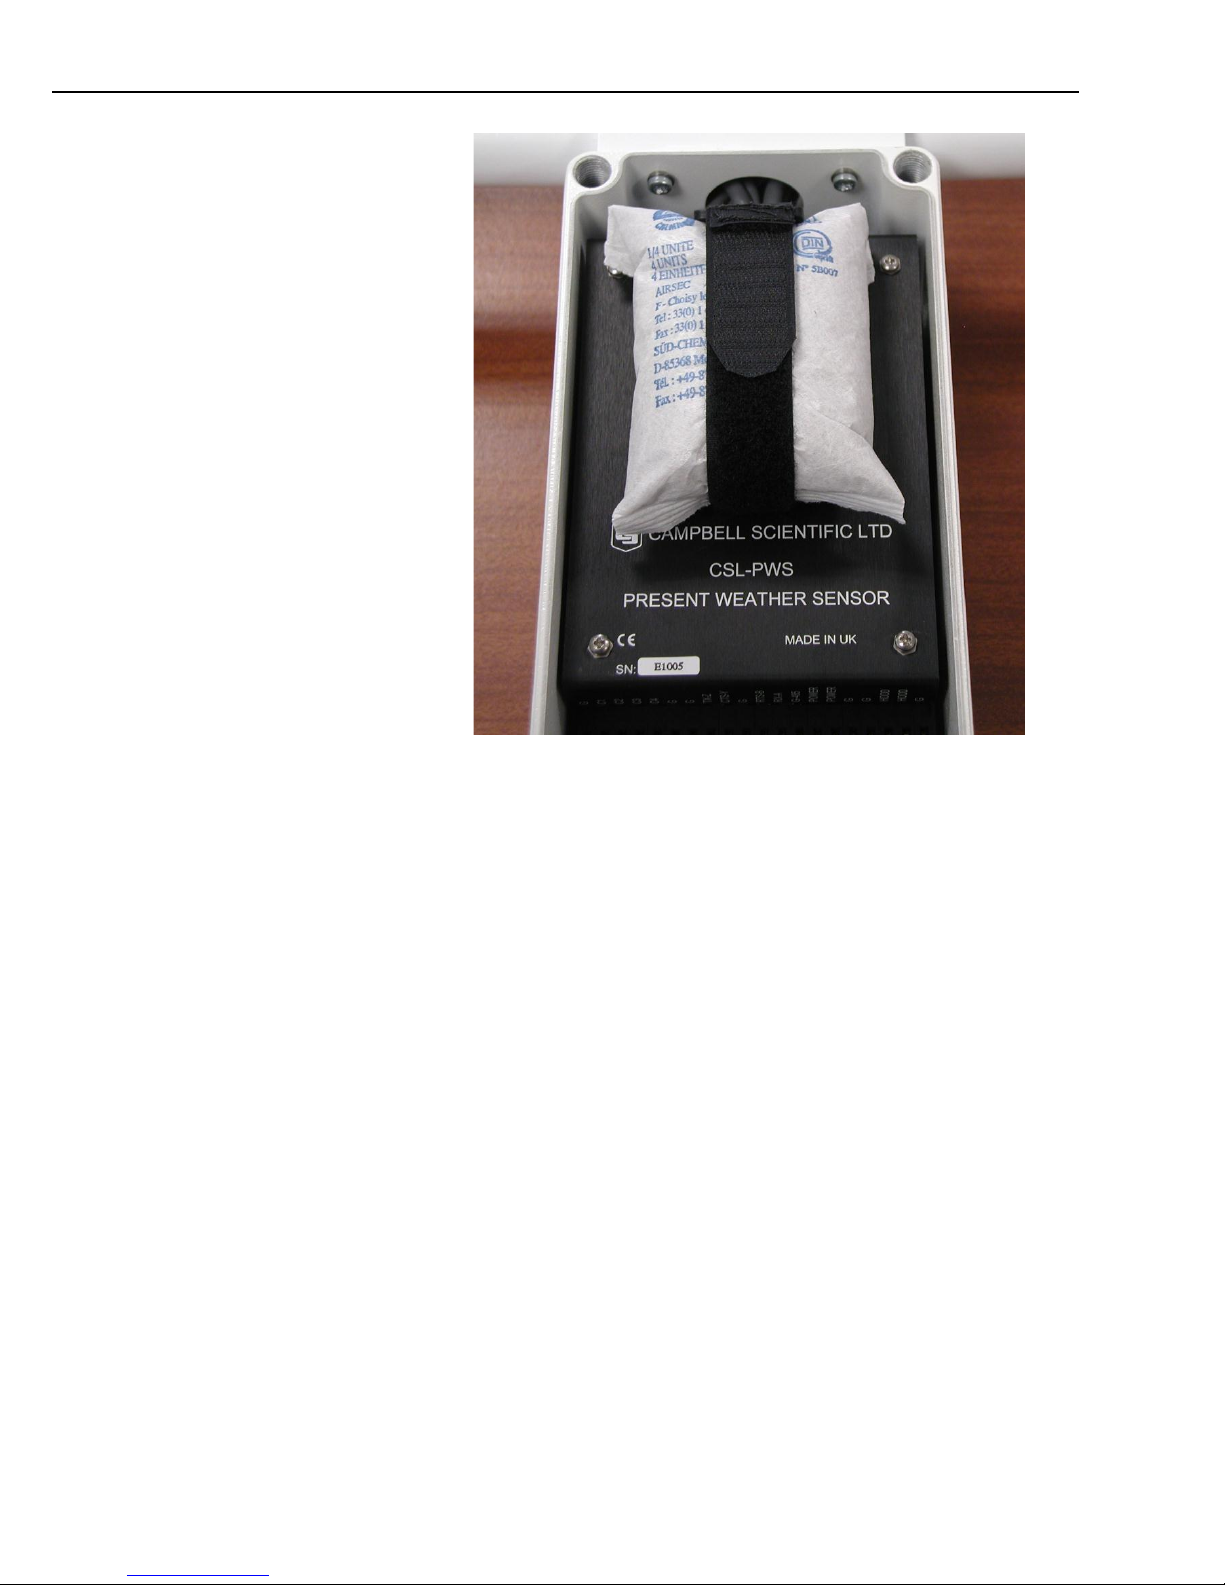
3.5.4 Desiccant
Two bags of desiccant are supplied. One is inside the enclosure, the other is
separate and sealed in a plastic bag. Desiccant use depends on your application
(see below) but for use in typical temperate conditions one bag is sufficient for a
twelve month period. The desiccant should be firmly strapped to the DSP cover
inside the PWS electronics enclosure using the strap provided and as shown in
Figure 3-8.
Page 33
Section 3. Installation
21
Figure 3-8. Mounting the desiccant pack on the DSP cover
The second bag of desiccant should be kept in the plastic shipping bag as a
replacement for when the initial bag needs to be dried out. The bags can be rotated
in this way many times. Desiccant bags can be dried out by the following method:
1. Arrange the bags on a wire tray in a single layer to allow for adequate air flow
around the bags during the drying process. The ovens inside temperature
should be room or ambient temperature (25ºC - 30ºC). A convection,
circulating, forced air type oven is recommended for this regeneration process.
Seal failures may occur if any other type of heating unit or appliance is used.
2. When placed in a forced air, circulating air, or convection oven, allow a
minimum of 4 to 5 cm of air space between the top of the bags and the next
metal tray above the bags. If placed in a radiating exposed infrared element
type oven, shield the bags from direct exposure to the heating element, giving
the closest bags a minimum of 40 cm clearance from the heat shield. Excessive
surface film temperature due to infrared radiation will cause the Tyvek
material to melt and/or the seals to fail. Seal failure may also occur if the
temperature is allowed to increase rapidly. This is due to the fact that the water
vapour is not given sufficient time to diffuse through the Tyvek material, thus
creating internal pressure within the bag, resulting in a seal rupture.
Temperature should not increase faster than 0.1ºC to 0.3ºC per minute.
3. Set the temperature of the oven to 118ºC, and allow the bags of desiccant to
reach equilibrium temperature.
Page 34

PWS100 Present Weather Sensor
22
Tyvek has a melting temperature of 121°C - 127°C.
(NON MIL-D-3464E activation or reactivation of both silica gel and Bentonite
clay can be achieved at temperatures of 104ºC).
4. Desiccant bags should be allowed to remain in the oven at the assigned
temperature for 24 hours. At the end of this period, the bags should be
immediately removed and placed in a desiccator jar or dry (0% relative
humidity) air tight container for cooling. If this procedure is not followed
precisely, any water vapour driven off during reactivation may be re-adsorbed
during cooling and /or handling.
5. After the bags of desiccant have been allowed to cool in an airtight desiccator,
they may be removed and placed in either an appropriate type polyliner tightly
sealed to prevent moisture adsorption, or a container that prevents moisture
from coming into contact with the regenerated desiccant. Some care should be
taken when re-activating desiccant bags. If heated in an oven which is too hot,
the bags may burst. If in any doubt, we recommend purchasing new desiccant
packs instead of oven drying. Failure to use or exchange the desiccant may
lead to condensation inside the enclosure. Not only will this lead to corrupted
data but, in the long term, can also cause corrosion which is expensive to
repair.
3.5.5 Basic Wiring
The PWS100 wiring block is shown on the internal layout diagram in Figure 3-3.
Connection points for power and communications are shown in the diagram.
There are two power inputs (one 24V for the hood heaters and one 12V for the
processor board) one communications connection and two SDI-12 ports for
peripheral connection. For RS-485 communications in half-duplex mode a 120 Ω
termination resistor may need to be placed across the CTS-Y and TX-Z
connections within the PWS100 and the A and B connections of the device being
connected to. This is normally not required for most installations unless electronic
noise interference is prevalent or cable runs are very long.
A 1K LEMO socket (IP66 rated) is used for connection of a peripheral (often the
CS215 temperature / relative humidity probe fitted with a LEMO plug). The cable
for any peripheral to be connected to the LEMO socket should be terminated with
the appropriate 4 pin 1K series LEMO plug. Ensure when fitting the peripheral
plug into the socket that the red tabs are aligned.
The power and communications cables are routed through two of the three cable
glands on the base of the PWS100 DSP enclosure. If power and communications
cables are replaced refer to Sections 3.3.1 and 3.3.2 for further details.
N.B. Some older units were fitted with LEMO connectors for all connections –
these can be supplied if required to special order for an extra cost.
Figure 3-9 shows the lower face of the DSP enclosure with the cable gland and
LEMO connector positions.
CAUTION
Page 35
Section 3. Installation
23
Figure 3-9. Underside of DSP enclosure
3.5.6 Communication Options
The communications options are RS-232, RS-422 and RS-485. Baud rate is
selectable between 300 bps and 115.2 kbps. The communications are set on a
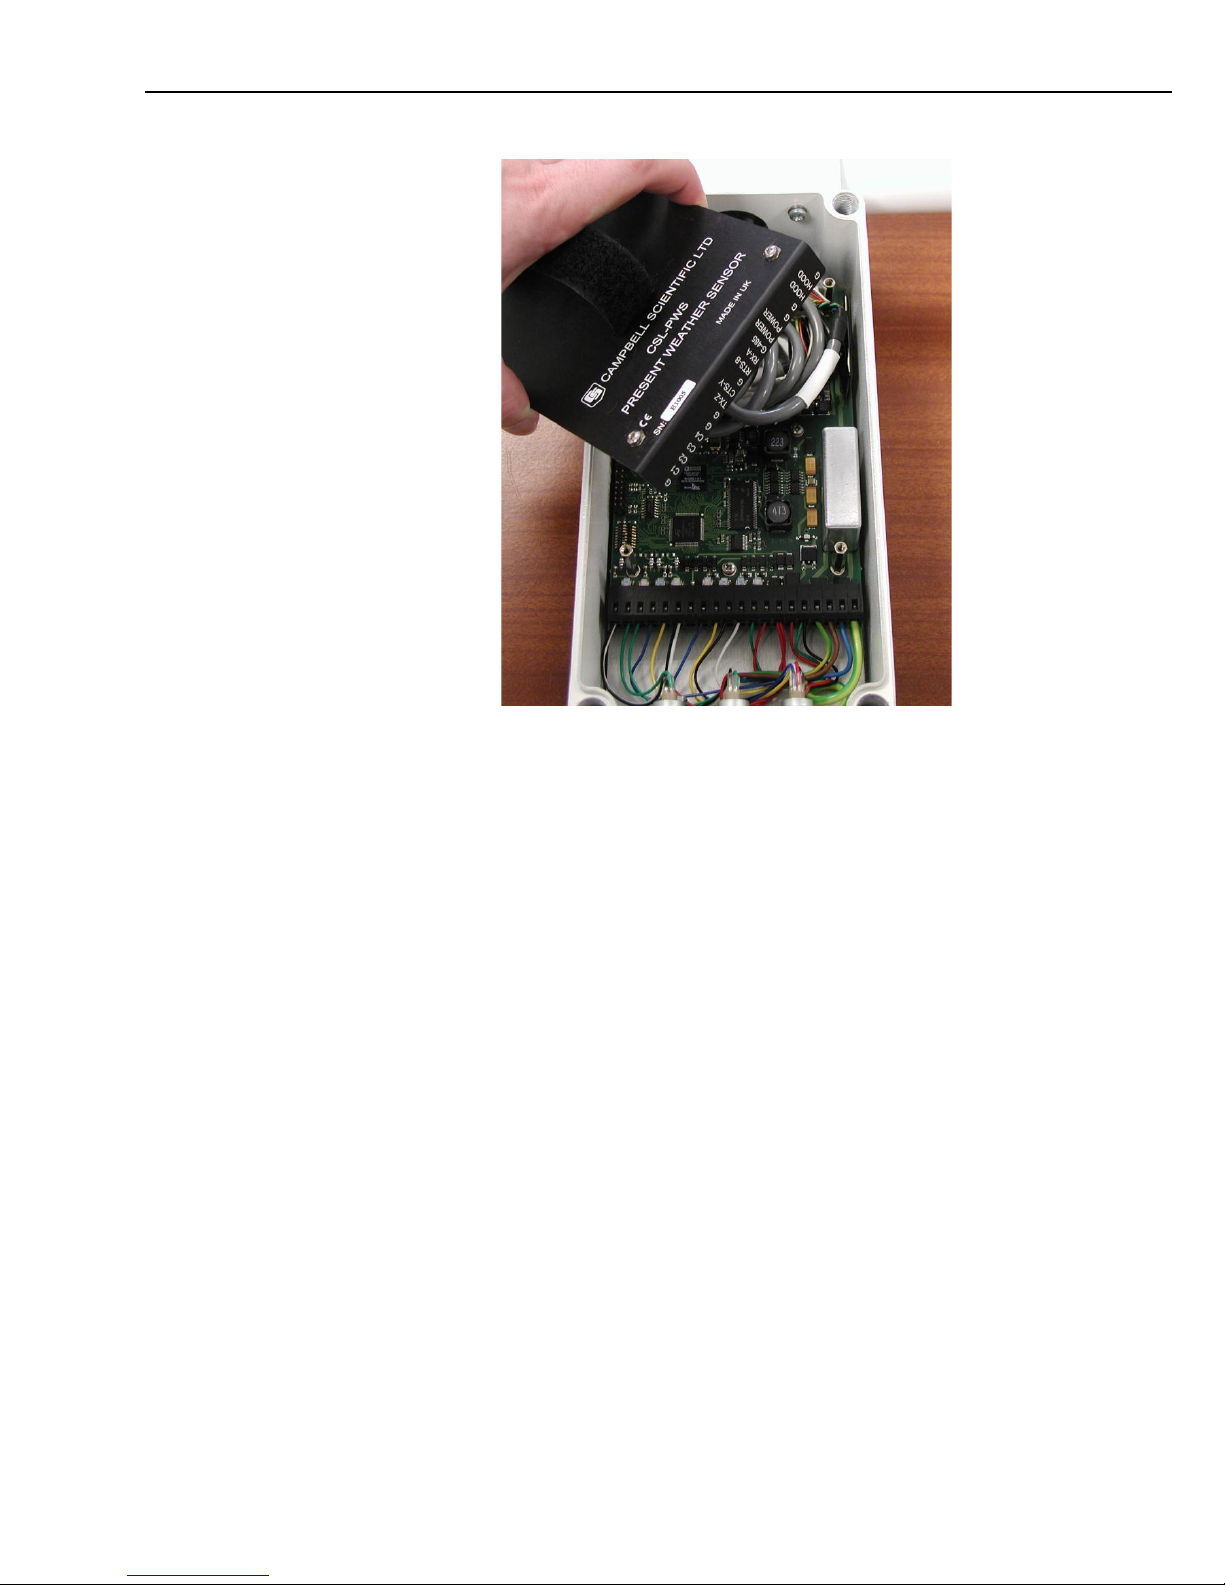
series of dip switches on the DSP board itself. To get to the board the DSP cover
must be removed as shown in Figure 3-10. Unscrew the four retaining screws and
carefully lift off to expose the board as shown in Figure 3-11.
Figure 3-10. Removal of DSP cover
Page 36
PWS100 Present Weather Sensor
24
Figure 3-11. Exposing the DSP board
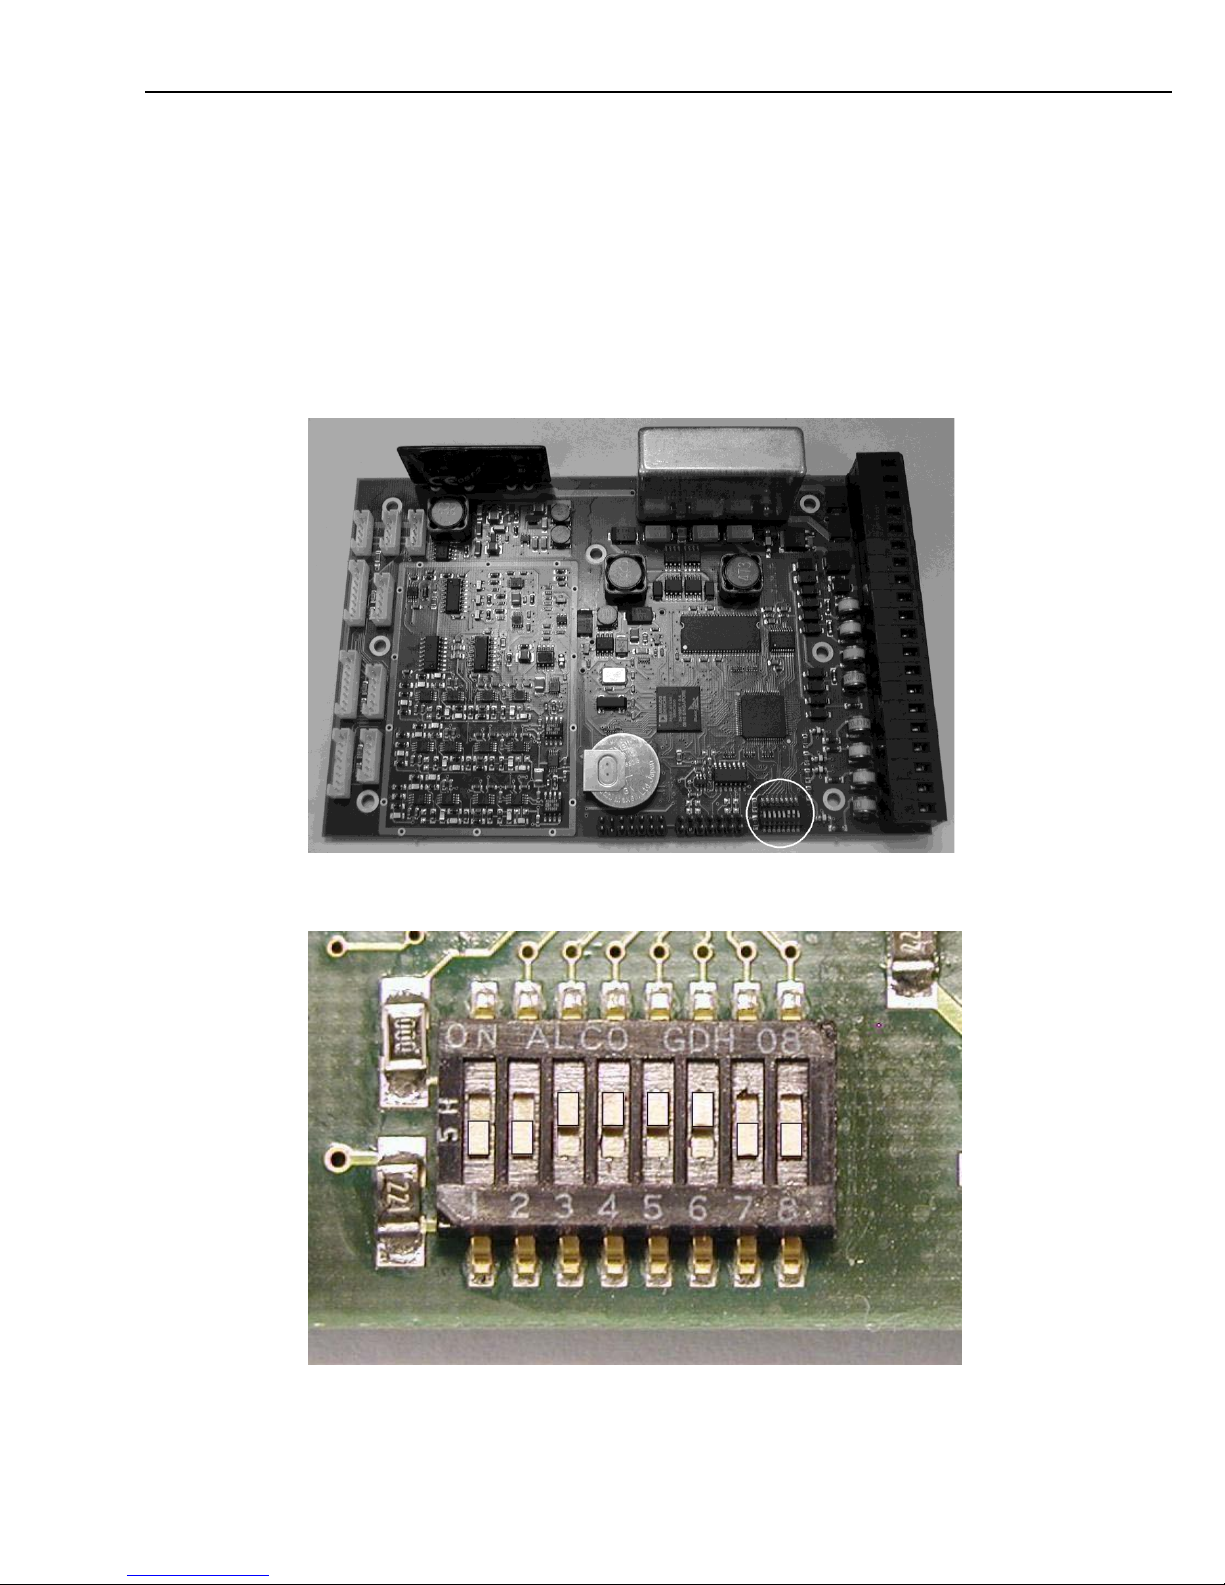
The location of the dip switches on the board is shown in Figure 3-12 and the dip
switches themselves are shown in detail in Figure 3-13. The following settings are
available:
PWS100 dip switch settings:-
0 = off; 1 = on.
switch 1 slew rate
0 slow slew rate (default)
1 fast slew rate
switch 2 communication mode
0 RS232 (default)
1 RS485 (note to use RS485 also requires a wiring change, see 3.3.2)
switch 3 duplex mode
0 full duplex
1 half duplex, default (RS485 – see 3.5.6.1 below)
Page 37

Section 3. Installation
25
switch 4-6 serial communication baud rate
switch
654 Baud Rate
000 300
001 1200
010 9600
011 19200
100 38400
101 57600
110 76800
111 115200 (default)
switch 7 reserved for future use (default off)
switch 8 load factory defaults at power up
0 normal operation (default)
1 load factory defaults
Page 38
PWS100 Present Weather Sensor
26
3.5.6.1 RS485 Half-duplex mode
In half duplex mode the transition from transmits (Tx) to receive (Rx) modes and
vice versa are subject to the following timing rules which may need to be
considered when interfacing to other devices:
The sensor waits for a gap of 1 byte period plus 10ms without receiving
data before switching from Rx to Tx and echoing/responding.
The sensor has a 1 millisecond Tx to Rx turnaround time.
Figure 3-12. DSP board dip switch location (circled)
Figure 3-13. Dip switches (defaults set - 00111100)
Page 39

Section 3. Installation
27
3.5.7 PWS Power supply
The PWS100 may be supplied with or without a power supply. The design of the
power supply sold by Campbell Scientific varies depending on locality and the
application.
A typical power supply comprises a PS200 12V supply with a 7 Ah back-up
battery. This is itself supplied by a switched mode supply taking mains input and
providing 24 VDC for power to the PS200 and hood heating.
In most cases additional information will be provided specific to the power
supply. Please refer to that documentation.
Read carefully any documentation supplied with a power
supply before installation.
The wiring within the enclosure will be clearly labelled for the connections for the
mains AC input and the outputs to which the cables of the PWS100 should be
connected.
Prior to connecting the power supply first check the local safety regulations in
regards of required isolators, fuses and earth leakage detectors for the mains
connection.
Normally a qualified electrician will be required to install
the mains cable.
The enclosure is rated for external use for electrical switch gear. To comply with
local regulations a lock may need to be fitted to the enclosure and sometimes extra
warning labels, in addition to those fitted, may need to be attached.
Check the power supply input voltage matches the mains supply to be used, e.g.
check for the 110/230 V setting. In some cases the power supply can be
reconfigured to either voltage by changing a jumper or switch setting. Recent
supplies provided by Campbell Scientific accept either voltage without
adjustment.
3.5.8 Start-Up Testing
On start-up the PWS100 will run internal diagnostic tests and check the status of
any connections to the instrument, e.g. whether the CS215 is present.
3.5.9 Initial Settings
Initially the PWS100 will be set up with a series of default programmable options.
These can be altered by entering the command mode of the sensor.
3.5.10 Load Factory Defaults
To load the factory default settings (retaining only the time, date and calibration
values) power down the sensor move dip switch 8 to position 1 and power up the
sensor. Once powered switch dip switch 8 back to position 0. This removes the
password and all other user entered values. It also resets the sensor to switch back
to the default messages, so any user defined messages will need to be reloaded.
WARNING
WARNING
Page 40

PWS100 Present Weather Sensor
28
3.5.11 Lubricating the enclosure screws
The PWS100 enclosure screws should be lubricated with a suitable anti-seize
grease (often copper loaded) to protect the threads from corrosion. This should be
reapplied when resealing the enclosure at regular intervals, normally after
replacing the desiccant. This is of particular importance if using the sensor in
corrosive or salt laden atmospheres.
Page 41

29
Section 4. Operation
4.1 Introduction
The best way of becoming familiar with the sensor is to setup the sensor and
connect it to a PC running Windows and the Campbell Scientific Present Weather
Viewer program,
This software allows easy setup of the sensor and a graphical display of the
measurements being made. It also provides an easy way of upgrading the
firmware of the sensor. It is not intended to capture or store data on a permanent
basis but is provided as a demonstration, test and setup tool. Brief details of use of
the program are described below. The program includes a more detailed multilingual help system which can be accessed from the Help menu option once the
program is running.
The PWS100 Present Weather Sensor is capable of outputting a range of data,
from single particle parameters, to codes representing those from WMO and other
standard meteorological tables. The sensor is setup with some factory defined
output messages but the user will often need to change these to meet their own
requirements. The setup can be done using either the Present Weather Viewer
program or using a terminal emulator by interacting directly with the sensor.
4.2 Using the Present Weather Viewer program
The latest copy of which can be downloaded from:
http://www.campbellsci.co.uk/downloads
Click on “Download the software” and follow the on-screen instructions.
When Present Weather Viewer is running a “Help” icon on the top left hand corner
of the screen gives access to detailed instruction on its use.
The PW viewer also provides a simple terminal emulator screen which can be used
to setup the sensor using it’s built in menu system rather than the graphical
interface the viewer provides.
To understand the operation of the sensor and the relevance of the settings in the
graphical interface it is necessary to understand the messages and configuration
options. These are discussed below within the context of setting up the sensor
using a terminal emulator.
Page 42

PWS100 Present Weather Sensor
30
4.3 Terminal Mode
In normal operating mode the sensor will respond to a number of “root”
commands, shown in Table 4-1. Those commands allow the configuration of the
sensor in a non-interactive fashion, the polling of data and also switching the
sensor into an interactive user menu mode.
They are accessed via the command TERM PWS_ID Password
Commands are entered in the format `Command Pws_ID Password
PWS_ID is the sensor ID and is only required for the following commands:
HELP
OPEN
TERM
MSEND
RSENSOR
Password is the sensor password (if set). It is only required for the following
commands:
OPEN
TERM
Terminal commands are described in more detail in Sections 4.5 to 4.9.
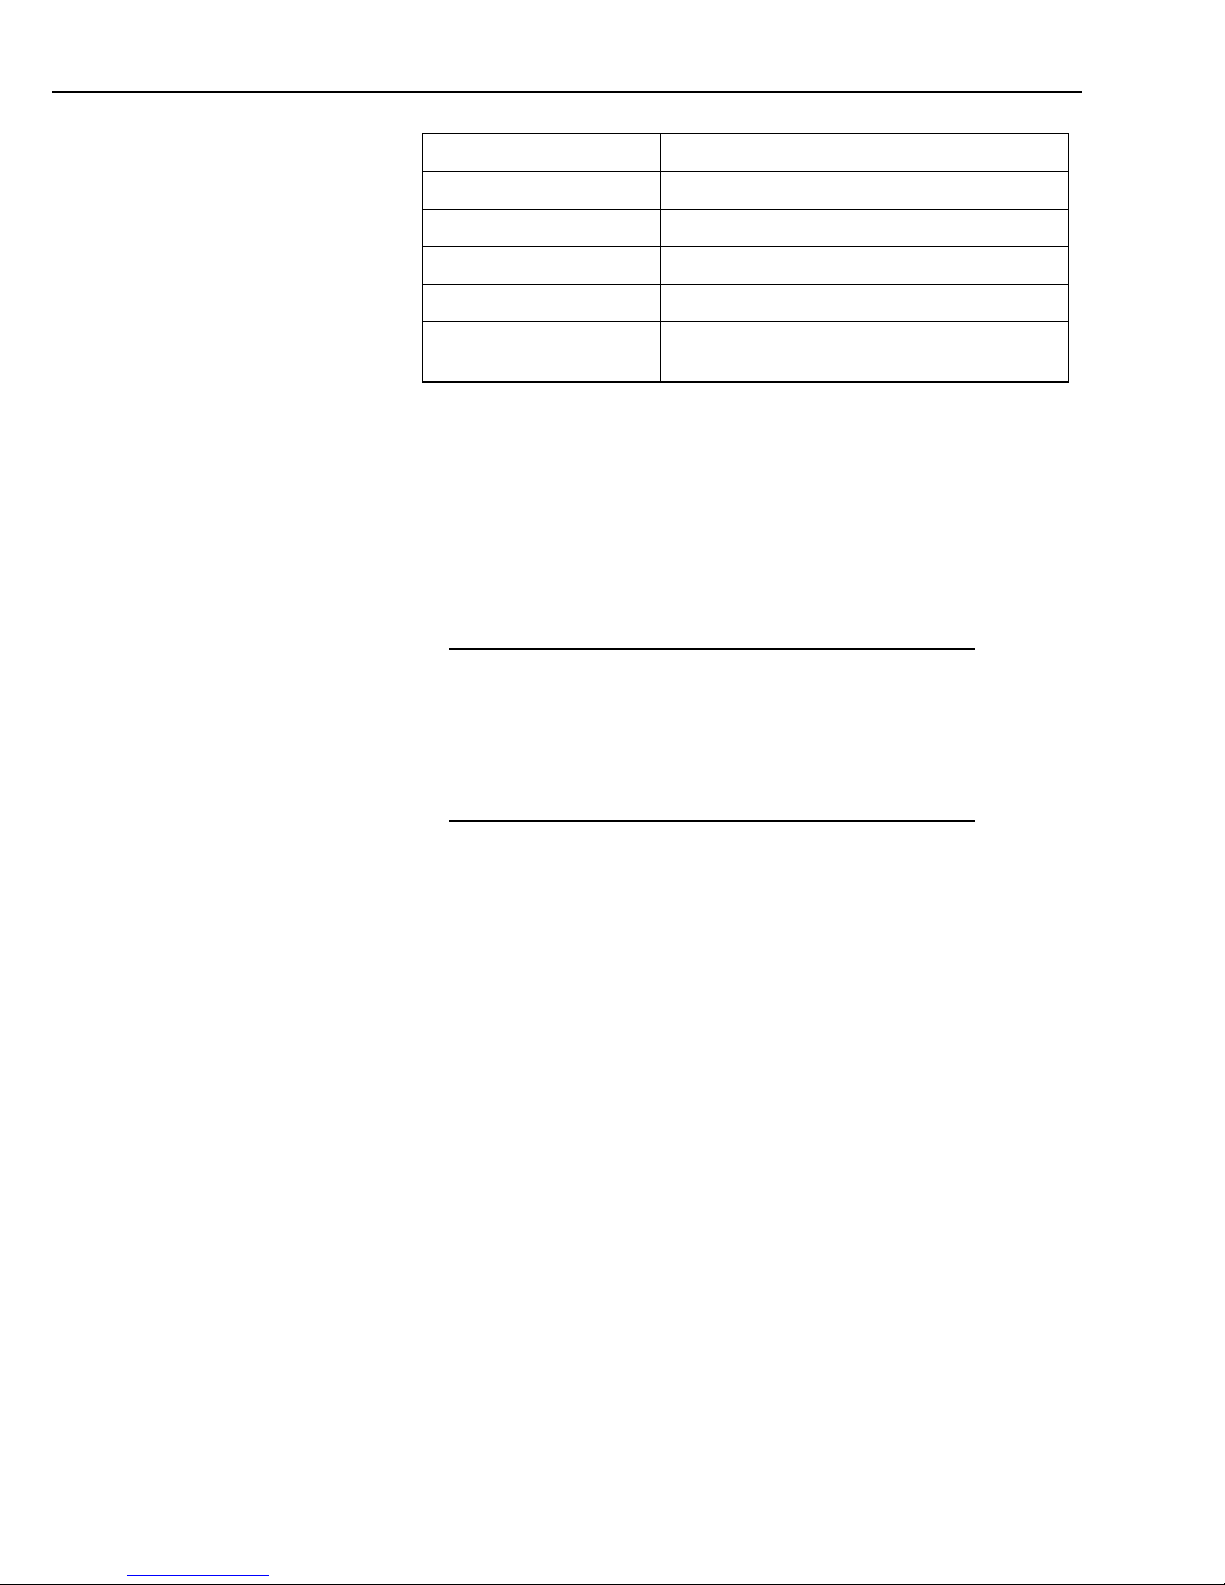
Table 4-1. Command set.
Command
Description
PASSWORD
Sets user password
HELP*
Gives a list of available commands
OPEN*
Activate setup menu
TERM*
Enter command mode
CLOSE
Exit command mode
MSEND*
Poll messages
MSET
Set message parameters
HDATA
Retrieve historical particle data from sensor
SETPARAM
Set weather parameters
FUZZY DIAG*
Extra particle information see 4.6.2 for details
CONFIG
View system configuration
SETCONFIG
Set system configuration
LOADOS
Load a new operating system
DIAGSET
Set diagnostic test parameters
DIAG
Run diagnostic test
TIME
Display or set time and date
RSENSOR
Receive remote sensor values (T oC and RH %)
Page 43
Section 4. Operation
31
RESET
Reset hardware
STATUS
View system status
CREDITS
Lists credits to PWS100 developers
XHMDATA
Historic `MSET’ data download using Xmodem
HMDATA
Output historic data to the command line
RUNDISC
Rotate the calibration disc for test / demonstration
purposes
*Commands marked with a * are available outside terminal mode.
The most commonly used commands are MSEND, HELP and OPEN.
In the descriptions which follow symbolises the pressing of the ENTER key.
Input parameters in italics should be user defined characters appropriate for the
command. Unless otherwise stated, all command parameters should be separated
by a space.
To support addressed RS485 networks each PWS100 is assigned an identifier,
shown as Pws_Id below. By default the PWS_Id is set to 0 (zero).
When operating at the root level, commands are not echoed back to
the terminal as this mode is intended primarily for polled data
collection and echoed commands will complicate the issue of
decoding the responses sent back from the sensor. Local echo can be
turned on in Hyperterminal if required. Start Hyperterminal, select
the pull-down ‘File’ menu and select ‘Properties’. Click the ‘ASCII
setup’ tab and check the ‘Echo typed characters locally’ checkbox.
4.3.1 Using the Help Command
To list available commands, the HELP command can be used as follows with the
correct PWS100 Pws_Id:
HELP Pws_Id
e.g. HELP 0
The PWS100 will respond with a list of available commands and their basic
function.
4.3.2 Entering / Exiting the Interactive Menu System
The user can enter the menu system by using the OPEN command with the correct
Pws_Id. If a password is set, then it should also be entered. The command is then
as follows:
OPEN Pws_Id Password
e.g. OPEN 0 campbell
The PWS100 will then display the SETUP menu of the menu system
NOTE
Page 44

PWS100 Present Weather Sensor
32
To close the menu system and return the PWS100 to operation, option 9
should be chosen from the SETUP menu, see Figure 4-1. At this point
either option 1 should be chosen to save changes and quit the menu
system, or option 2 should be chosen to lose changes made and quit the
menu system. Option 0 will return the user to the SETUP menu.
Changes made to the unit calibration and time and date settings
whilst in the menu system are immediate and as such will remain
changed independent of the quit option chosen from the menu.
The data storage function will not store data whilst the terminal or
menu is active. This means data will be missing during these
periods. To reduce data losses reduce the amount of time that the
terminal or menus are active.
4.3.3 Message Polling
Whilst the menu system or terminal modes are closed, it is possible to poll data
from a suitable set sensor (see Sections 4.4.1 and 4.6.1 for information on how to
set up messages for polling). In order to poll a message the MSEND command
must be used with the correct Pws_Id, stats_period & message_ID. Statistics are
calculated over the stats_period in seconds which completely overrides any period
defined within the message. The message can be either a fixed or user defined
message from 0 to 19. The command for message polling is as follows:
MSEND Pws_Id stats_period message_ID
e.g. MSEND 0 3600 10
In the example given above the PWS100 will respond with fixed message_ID 10
statistics calculated or sampled over the stats_period of 3600 seconds for the
PWS100 with a Pws_Id of 0. If the stats_period is zero then the statistics are
calculated from the last collection interval. So the polling interval controls the
interval at which statistics are calculated over, up to a maximum of 2 hours.
Setting stats_period to less than 10 seconds will result in repeated data due to the
ten seconds measurement cycle in the sensor (see Section 5.5).
4.4 The PWS100 Menu System
From the command line the use of the OPEN command, as detailed in Section
4.3.2, will initiate the menu system which can be used to set up the operation of
the PWS100.
If there is no activity for 10 minutes with the menu system open it
will automatically close.
The menu system map is shown in Appendix C. The menu is controlled by means
of numeric selections followed by the enter key. Pressing enter by itself will return
the user to the previous menu. A selection followed by the enter key will lead to
the display of a specific menu or allow a specific parameter value to be input.
Entering an incorrect selection or parameter value will return the user to the same
menu. Pressing the delete key will delete the current entry. Pressing the escape key
will clear the current entry and return to the previous menu.
NOTE
NOTE
NOTE
Page 45

Section 4. Operation
33
Entering the command line (terminal mode) from the menu system
will lead to a loss of all changes made during navigation of the menu
system.
Section 4.5 gives further details of how to set up the PWS100 with the command
set in the terminal mode (option 7 from the SETUP menu).
WELCOME TO THE PWS100 SETUP MENU
ID 0
SN 1069
(0) message 0
(1) message 1
(2) message 2
(3) set time & date
(4) configuration
(5) password
(6) weather & alarm parameters
(7) terminal (changes will be lost)
(8) info
(9) done
Make a selection:
Figure 4-1. PWS100 setup menu
4.4.1 Top Menu Options 0, 1 and 2 (Message n)
The options 0, 1 and 2 from the SETUP menu are entitled ‘message 0’, ‘message
1’ and ‘message 2’. These are used to setup the message outputs for messages with
ID 0, 1 and 2. Selecting one of these brings up the MESSAGE menu as shown in
Figure 4-2. Each message allows the user to select message intervals, modes and
fields (option 1).
MESSAGE 0
(1) edit message
(2) delete message
Make a selection:
Figure 4-2. Message menu
If option 1 is chosen from the MESSAGE menu then the system will display the
MESSAGE PARAMETERS & FIELDS menu for that message as shown in Figure
4-3. From here 19 fields can be filled in. Field 0 is the message interval. This is set
in seconds and will be the interval between which output messages are given. Field
1 is the message mode and fields 2 to 19 are output parameters which can be user
set.
NOTE
Page 46

PWS100 Present Weather Sensor
34
If building a new message this has to be done in sequence starting
with the Message interval and mode.
MESSAGE 0 PARAMETERS & FIELDS
(0) Message interval = Polled
(1) Mode = Store & Output
(2) 49 Vis range Av (m) over 10 minutes
(3) 21 SYNOP code (full)
(4) 22 METAR code
(5) 23 NWS code
(6) 24 Alarms
(7) 25 System fault status 0=ok 1&2=degraded 3=maintenance
4=laser_fault
(8) 30 Temp Av (C), RH Samp (%), Wetbulb Av (C)
(9) 31 Temp Max (C), Temp Min (C)
(10) 40 Precipitation Intensity (mm / hour)
(11) 41 Precipitation accumulation (mm)
(12) 42 Particle size distribution (300 values 0.1 to 30mm)
(13) 43 Particle Av velocity (m/s), Av size (mm)
(14) 44 Particle type distribution (d, fd, r, fr, sg, sf,
ip, h, g, e, u)
(15) 47 Size & velocity map Campbell 34x34
(16) 48 Ped ratio distribution (50 values 1.0 to 6.0)
(17) 156 Date (year, month, day)
(18) 157 Time (hours, minutes, seconds)
(19) 159 CRC16-CCITT
Make selection:
Figure 4-3. Message parameters and fields menu
Selecting field 0 brings up the MESSAGE INTERVAL menu shown in Figure 4-4.
Here the interval is input. An input of 0 means that the message is polled (i.e. will
be given when the user requests it, either manually or in an automated fashion
using a datalogger). Setting the interval to less than 10 seconds will result in
repeated data due to the ten seconds measurement cycle in the sensor (see Section
5.5).
MESSAGE 0 INTERVAL
(0) polled message
(1..21600) message interval in seconds
Enter interval 10 :
Figure 4-4. Message interval menu
From the MESSAGE PARAMETERS & FIELDS menu if field 1 is chosen then
the MESSAGE MODE menu, Figure 4-5, will be displayed. Here the options are
to store and output to the serial port (option 0) which is useful for on screen
analysis of real-time data, or store only (option 1) more useful when logging data.
NOTE
Page 47

Section 4. Operation
35
If option 1 is chosen, data can be polled from the PWS100.
MESSAGE 0 MODE
(0) store & output
(1) store only
Make selection 0 :
Figure 4-5. Message mode menu
From the MESSAGE PARAMETERS & FIELDS menu if fields 2 to 19 are
chosen then the MESSAGE FIELD menu will be displayed as shown in Figure
4-6. Here an output parameter for that message field can be chosen from a number
of different output parameters as detailed in Table 4-2 and described in Sections
4.4.1.1 to 4.4.1.37
All messages start with the message number and sensor ID e.g. 1_2 for message 1
from sensor ID2.
Table 4-2. Message Field parameters
Message Field
Parameter Output
0 – 2
User set message types
10 – 19
Fixed messages
20
Average visibility (m)
21
Present weather code (SYNOP)
22
Present weather code (METAR)
23
Present weather code (NWS)
24
Alarms
25
Fault status of PWS100
26
Present weather code (SYNOP) generic
30
Average temperature, RH%, wet bulb
31
Minimum and maximum temperature
33
Reserved
34
Reserved
40
Precipitation intensity (mmh-1)
41
Precipitation accumulation
42
Drop size distribution bin values (0.1 mm increment
per value)
Page 48
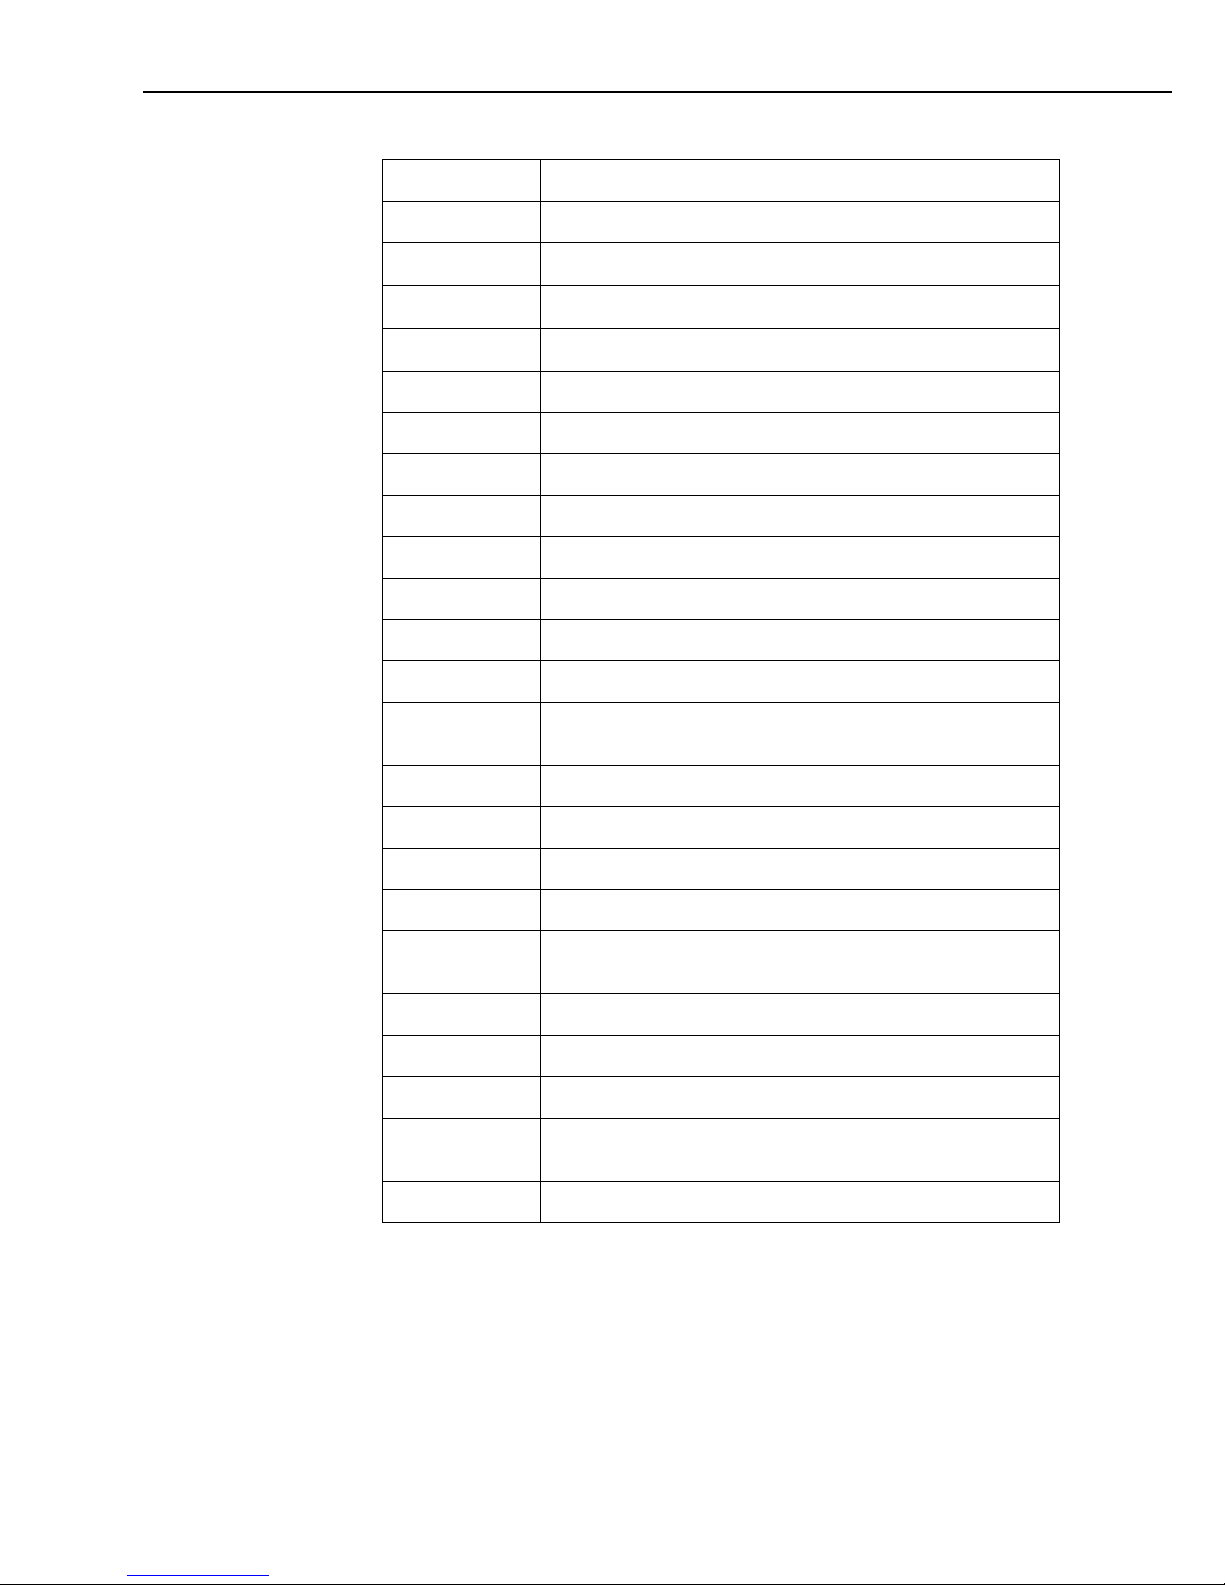
PWS100 Present Weather Sensor
36
43
Average velocity (ms-1), average size (mm)
44
Type distribution
45
Size / velocity map type 1 (20 20)
46
Size / velocity map type 2 (32 32)
47
Campbell Scientific standard size / velocity map (34 34)
48
Peak-to-Pedestal ratio distribution histogram (50 values)
49
Visibility range in metres averaged over 10 minutes
100
Internal LED temperatures: upper LED, lower LED
101
Internal detector temperatures: upper, lower
102
Laser hood temperature, laser temperature & laser current
103
DC offsets: upper, lower, laser
104
Dirty window: upper, lower, laser
105
Battery voltage, hood %, dew %
106
Upper and lower detector differential voltage (mV) and
calibrated visibility voltage (mV)
150
Device s/n, operating system and hardware versions
151
Date & time: day count (from 01/01/2007) HH MM SS
152
Product name “PWS100”
153
Statistics period (s)
154
Watchdog count, maximum particles per second, particles not
processed, time lag
155
Processing statistics
156
Year, month, day
157
Hours, minutes, seconds
158
Averaged corrected visibility voltage (mV) and average upper
head voltage (mV)
159
CRC16-CCITT Checksum
Note that user defined messages cannot make field references to other user defined
messages but can make reference to fixed messages from field 10 to 19 and all
other message fields.
4.4.1.1 Message 0 (the Default Output)
User message 0 can be set by setting the Message Field parameters as required
using other message fields from 10 upwards.
Page 49

Section 4. Operation
37
By default and after a hardware reset (see ‘3.5.10 Load Factory Defaults’) or a
software reset (see ‘4.9.2 Resetting the System’) this outputs the message fields
below (in the format as seen in the interactive menu). These fields have been used
as defaults so they give a full display of the PWS100’s capabilities when used with
the Present Weather Sensor Viewer program.
The user can delete and completely reconfigure this message as required.
(0) Message interval = 60 seconds
(1) Mode = Store & Output
(2) 49 Vis range Av (m) over 10 minutes
(3) 21 SYNOP code
(4) 22 METAR code
(5) 23 NWS code
(6) 24 Alarms
(7) 25 System fault status 0=pws_ok 1=possible_degraded_performance
2=degraded_performance 3=maintenance_required 4=laser_fault
(8) 30 Temp Av (C), RH Samp (%), Wetbulb Av (C)
(9) 31 Temp Max (C), Temp Min (C)
(10) 40 Precipitation Intensity (mm / hour)
(11) 41 Precipitation accumulation (mm)
(12) 42 Particle size distribution (300 values 0.1 to 30mm)
(13) 43 Particle Av velocity (m/s), Av size (mm)
(14) 44 Particle type distribution (fd, d, fr, r, sg, sf, ip, h, g, e, u)
(15) 47 Size & velocity map Campbell 34x34
(16) 48 Ped ratio distribution (50 values 1.0 to 6.0)
(17) 156 Date (year, month, day)
(18) 157 Time (hours, minutes, seconds)
(19) 159 CRC16-CCITT
Note that in the default message, the start and end characters (STX/ETX) are
included in the message – see “Output options” described in Section 4.4.3.
4.4.1.2 Messages 1 & 2 User Defined Messages
These user messages are set in the same way as message 0 but are cleared and do
not output as default after a master reset.
4.4.1.3 Message Field 10 To 19 Fixed Messages
No Fixed messages have been defined yet. The user cannot change the fixed
messages.
4.4.1.4 Message Field 20 Visibility Range (m)
This field will output the average visibility range (m) calculated over the
Message_Interval or stats_period defined. If the sensor is in polled mode this will
be the average since the last poll command.
4.4.1.5 Message Field 21 Present Weather Code (SYNOP)
This field will output the Present Weather Code (SYNOP) according to WMO
code table 4680 calculated over the Message_Interval or stats_period defined. To
follow WMO recommendations Message_Interval should be set to 180s.
4.4.1.6 Message Field 22 Present Weather Code (METAR)
This field will output the Present Weather Code (METAR) calculated over the
Message_Interval or stats_period defined.
4.4.1.7 Message Field 23 Present Weather Code (NWS)
This field will output the Present Weather Code (NWS) calculated over the
Message_Interval or stats_period defined.
Page 50

PWS100 Present Weather Sensor
38
4.4.1.8 Message Field 24 Alarms
This field will output the Alarms. The alarms are output as a string of 16 ‘0’s and
‘1’s delimited with spaces, for example 1 0 0 1 1 1 1 1 1 0 1 1 1 1 0 0.
Each alarm has the following definition starting from the left hand side:
1. Visibility range less than alarm 1 trigger point set by user. The factory
default is 5Km*.
2. Visibility range less than alarm 2 trigger point set by user. The factory
default is 1.5Km*.
3. Visibility range less than alarm 3 trigger point set by user. The factory
default is 0.5Km*.
4. Laser drive current greater than 80mA. This may indicate the laser is
failing or recalibration is required.
5. Power supply voltage less than 11.0V.
6. Laser window needs cleaning. There is sufficient build up on the window
that if not cleaned could reduce accuracy.
7. Upper detector window needs cleaning. There is sufficient build up on the
window that if not cleaned could reduce accuracy.
8. Lower detector window needs cleaning. There is sufficient build up on
the window that if not cleaned could reduce accuracy.
9. DC voltage of laser dirty window detector greater than 1.5V. This can be
caused by sun directly shining into lens or a pws fault.
10. DC voltage of upper detector greater than 1.5V. This can be caused by
sun directly shining into lens or a pws fault.
11. DC voltage of lower detector greater than 1.5V. This can be caused by
sun directly shining into lens or a pws fault.
12. Particle processor is unable to process all particles due to limited time and
buffer resources. Particles are missed and data could be inaccurate. This
alarm may activate when there are 120 or more particles per second going
through the volume, sustained for a period that fills all available space in
the buffers.
13. Particle processor lags real time by more than 5% of the user requested
statistics interval.
14. Particle stripper is unable to process all particles due to limited time and
buffer resources. Particles are missed and data will be inaccurate. This
alarm may activate if there are more than ~150 particles per second going
through the volume.
15. Reserved for future use, Outputs ‘0’.
16. Reserved for future use, Outputs ‘0’.
*The alarms are set based on the value of visibility at the set output interval – not on the 10
min averaged output.
4.4.1.9 Message Field 25 Fault Status of the PWS100
This field will output the fault status of the PWS100. The value output is from
0 to 4. 0 = no fault, 1 = Possible degraded performance, 2 = Degraded
performance, 3 = Maintenance required, 4 = Laser fault.
Page 51

Section 4. Operation
39
4.4.1.10 Message Field 26 Present Weather Code (SYNOP) Generic
This field will output the Present Weather Code (WMO) calculated over the
Message_Interval or stats_period defined but simplified to give generic codes, for
example 70 for `snow’.
4.4.1.11 Message Field 30 External Sensor Temperature, RH% and Wetbulb
This field will output the averaged temperature (C), sampled relative humidity
and averaged wetbulb temperature (C) calculated over the Message_Interval or
stats_period defined.
4.4.1.12 Message Field 31 External Sensor Maximum and Minimum Temperature
This field will output the maximum and minimum temperature (C) calculated
over the Message_Interval or stats_period defined.
4.4.1.13 Message Field 33 Reserved
4.4.1.14 Message Field 34 Reserved
4.4.1.15 Message Field 40 Precipitation Intensity
This field will output the precipitation intensity (mm / hour) calculated over the
Message_Interval or stats_period defined.
The PWS100 only measures particles / visibility 90% of the time so
precipitation intensity is scaled appropriately.
4.4.1.16 Message Field 41 Precipitation Accumulation
This field will output the precipitation accumulation (mm) calculated over the
Message_Interval or stats_period defined.
The PWS100 only measures particles / visibility 90% of the time so
precipitation totals are scaled appropriately.
4.4.1.17 Message Field 42 Drop Size Distribution
This field will output the drop size distribution table which is output as 300 values,
starting with the 0 - 0.1mm bin, in steps of 0.1mm up to 30mm. This is calculated
over the Message_Interval or stats_period defined.
The PWS100 only measures particles 90% of the time. Particle
numbers are NOT scaled appropriately.
4.4.1.18 Message Field 43 Average Velocity (ms-1) and Average Size (mm)
This field will output the average velocity and average size values ignoring any
particle type classifications.
4.4.1.19 Message Field 44 Type Distribution
This field will output the type distribution which is a series of 11 values for each
particle type which shows the number of each type of particle classified. The order
of the output is: drizzle, freezing drizzle, rain, freezing rain, snow grains,
snowflakes, ice pellets, hail, graupel, error, unknown.
NOTE
NOTE
NOTE
Page 52

PWS100 Present Weather Sensor
40
4.4.1.20 Message Field 45 Size / Velocity Type Map 1 (20 x 20)
This field will output a size and velocity map with the following classes:
Particle diameter class
Class
Diameter [mm]
Class width [mm]
1
=>0.00
0.24
2
=>0.24
0.12
3
=>0.36
0.14
4
=>0.50
0.25
5
=>0.75
0.25
6
=>1.00
0.25
7
=>1.25
0.25
8
=>1.50
0.25
9
=>1.75
0.25
10
=>2.00
0.50
11
=>2.50
0.50
12
=>3.00
0.50
13
=>3.50
0.50
14
=>4.00
0.50
15
=>4.50
0.50
16
=>5.00
0.50
17
=>5.50
0.50
18
=>6.00
0.50
19
=>6.50
0.50
20
=>7.00
93.00
Particle speed class
Class
Speed [m/s]
Class width [m/s]
1
=>0.0
0.2
2
=>0.2
0.2
3
=>0.4
0.2
4
=>0.6
0.2
5
=>0.8
0.2
6
=>1.0
0.4
7
=>1.4
0.4
8
=>1.8
0.4
9
=>2.2
0.4
10
=>2.6
0.4
11
=>3.0
0.4
12
=>3.4
0.8
13
=>4.2
0.8
14
=>5.0
0.8
Page 53

Section 4. Operation
41
15
=>5.8
0.8
16
=>6.6
0.8
17
=>7.4
0.8
18
=>8.2
0.8
19
=>9.0
1.0
20
=>10.0
90.0
If s[n]v[m] equals the number of particles in velocity class n and speed class m
then the output string for field 45 will be as follows:-
s[1]v[1]_s[1]v[2]_........_s[1]v[20]; s[2]v[1]_s[2]v[2]_........_s[2]v[20];........_s[20]v[1]_........_s[20]v[20]
There is a space separation between values.
4.4.1.21 Message Field 46 Size / Velocity Type Map 2 (32 x 32)
This field will output a size and velocity map with the following classes:
Particle diameter class
Class
Average Diameter
[mm]
Class width [mm]
1
0.060
0.12
2
0.180
0.12
3
0.300
0.12
4
0.420
0.12
5
0.540
0.12
6
0.665
0.13
7
0.795
0.13
8
0.925
0.13
9
1.055
0.13
10
1.185
0.13
11
1.375
0.25
12
1.625
0.25
13
1.875
0.25
14
2.125
0.25
15
2.375
0.25
16
2.750
0.50
17
3.250
0.50
18
3.750
0.50
19
4.250
0.50
20
4.750
0.50
21
5.500
1.00
22
6.500
1.00
23
7.500
1.00
24
8.500
1.00
25
9.500
1.00
Page 54

PWS100 Present Weather Sensor
42
26
11.000
2.00
27
13.000
2.00
28
15.000
2.00
29
17.000
2.00
30
19.000
2.00
31
21.500
3.00
32
=>23.000
77.00
Particle speed class
Class
Average Speed [m/s]
Class width [m/s]
1
0.05
0.1 2 0.15
0.1 3 0.25
0.1 4 0.35
0.1 5 0.45
0.1 6 0.55
0.1 7 0.65
0.1 8 0.75
0.1 9 0.85
0.1
10
0.95
0.1
11
1.10
0.2
12
1.30
0.2
13
1.50
0.2
14
1.70
0.2
15
1.90
0.2
16
2.20
0.4
17
2.60
0.4
18
3.00
0.4
19
3.40
0.4
20
3.80
0.4
21
4.40
0.8
22
5.20
0.8
23
6.00
0.8
24
6.80
0.8
25
7.60
0.8
26
8.80
1.6
27
10.40
1.6
28
12.00
1.6
Page 55

Section 4. Operation
43
29
13.60
1.6
30
15.20
1.6
31
17.60
3.2
32
=>19.20
80.8
If s[n]v[m] equals the number of particles in velocity class n and speed class m
then the output string for field 46 will be as follows:-
s[1]v[1]_s[1]v[2]_........_s[1]v[32]; s[2]v[1]_s[2]v[2]_........_s[2]v[32];........_s[32]v[1]_........_s[32]v[32]
There is a space separation between values.
4.4.1.22 Message Field 47 Campbell Scientific Standard Size / Velocity Map (34 x 34)
This field will output the standard Campbell Scientific size and velocity map with
the following classes:
Particle diameter class
Class
Diameter [mm]
Class width [mm]
1
=>0.00
0.1
2
=>0.10
0.1
3
=>0.20
0.1
4
=>0.30
0.1
5
=>0.40
0.1
6
=>0.50
0.1
7
=>0.60
0.1
8
=>0.70
0.1
9
=>0.80
0.1
10
=>0.90
0.1
11
=>1.00
0.2
12
=>1.20
0.2
13
=>1.40
0.2
14
=>1.60
0.2
15
=>1.80
0.2
16
=>2.00
0.4
17
=>2.40
0.4
18
=>2.80
0.4
19
=>3.20
0.4
20
=>3.60
0.4
21
=>4.00
0.8
22
=>4.80
0.8
23
=>5.60
0.8
24
=>6.40
0.8
25
=>7.20
0.8
26
=>8.00
1.6
27
=>9.60
1.6
28
=>11.20
1.6
Page 56

PWS100 Present Weather Sensor
44
29
=>12.80
1.6
30
=>14.40
1.6
31
=>16.00
3.2
32
=>19.20
3.2
33
=>22.40
3.2
34
=>25.60
74.4
Particle speed class
Class
Speed [m/s]
Class width [m/s]
1
=>0.00
0.1
2
=>0.10
0.1
3
=>0.20
0.1
4
=>0.30
0.1
5
=>0.40
0.1
6
=>0.50
0.1
7
=>0.60
0.1
8
=>0.70
0.1
9
=>0.80
0.1
10
=>0.90
0.1
11
=>1.00
0.2
12
=>1.20
0.2
13
=>1.40
0.2
14
=>1.60
0.2
15
=>1.80
0.2
16
=>2.00
0.4
17
=>2.40
0.4
18
=>2.80
0.4
19
=>3.20
0.4
20
=>3.60
0.4
21
=>4.00
0.8
22
=>4.80
0.8
23
=>5.60
0.8
24
=>6.40
0.8
25
=>7.20
0.8
26
=>8.00
1.6
27
=>9.60
1.6
28
=>11.20
1.6
29
=>12.80
1.6
30
=>14.40
1.6
31
=>16.00
3.2
32
=>19.20
3.2
33
=>22.40
3.2
34
=>25.60
74.4
Page 57

Section 4. Operation
45
If s[n]v[m] equals the number of particles in velocity class n and speed class m
then the output string for field 47 will be as follows:-
s[1]v[1]_s[1]v[2]_........_s[1]v[34]; s[2]v[1]_s[2]v[2]_........_s[2]v[34];........_s[34]v[1]_........_s[34]v[34]
There is a space separation between values.
4.4.1.23 Message Field 48
This field outputs a histogram which contains the number of particles counted
within the measurement period that have a given peak- to-pedestal ratio (see
Section 5.6 – this gives a measure of the number of crystalline particles). This is a
histogram of 50 bins for ratios for 1.0 to 6.0 in steps of 0.1.
Note that the ratios for particles less that 0.5 mm in size are not accurate so are not
included in this histogram. The total number of particles in this histogram can
therefore be less than the total particles detected.
4.4.1.24 Message Field 49 Visibility (m), 10 minute average
This field will output the average visibility range (m) calculated over the previous
10 minutes, independent of the message interval – this is a 10 minute rolling
average.
4.4.1.25 Message Field 100 Upper, Lower LED temperature
This field will output the sampled internal upper and lower LED temperatures
(C).
4.4.1.26 Message Field 101 Upper, Lower Detector Temperature
This field will output the sampled internal upper and lower detector temperatures
(C).
4.4.1.27 Message Field 102 Laser Hood, Laser Temperature and Laser Drive Current
This field will output the sampled internal laser hood temperature (C), laser
temperature (C) and laser drive current (mA).
4.4.1.28 Message Field 103 Laser, Upper, Lower Detector DC Voltage Offsets
This field will output the sampled internal laser dirty window detector, upper and
lower detector DC offsets (mV).
4.4.1.29 Message Field 104 Laser, Upper and Lower Dirty Window Detector
This field will output the sampled internal laser, upper and lower dirty window
detector voltage levels (mV).
4.4.1.30 Message Field 105 DSP PSU Voltage, Hood and Dew Heater % Duty
This field will output the sampled DSP PSU voltage (V), hood and dew heater
duty (0-100%)
4.4.1.31 Message Field 106 Upper, Lower Detector Differential Voltage, Calibrated
Visibility mV
This field will output the sampled upper, lower detector differential voltage (mV)
and the calibrated visibility (mV).
Page 58

PWS100 Present Weather Sensor
46
4.4.1.32 Message Field 150 Serial Number, Operating System and Hardware Version
This field will output the system serial number, operating system and hardware
version numbers.
4.4.1.33 Message Field 151 Day Count, Hours, Minutes, Seconds
This field will output the day count (from 01/01/2007), hours, minutes and
seconds.
4.4.1.34 Message Field 152 Product Name
This field will output the product name “PWS100”.
4.4.1.35 Message Field 153 Statistics Period
This field will output the statistics period in seconds.
4.4.1.36 Message Field 154 Watchdog Count, Maximum Particles Per Second, Particles Not
Processed, Time Lag
This field will output a watchdog count which indicates the number of resets of the
system due to error, the maximum number of particles stripped per second over the
measurement interval, the number of particles stripped in real time but not
processed and a time lag in seconds indicating how far behind processing has got
at some point during the measurement interval.
4.4.1.37 Message Field 155 Processing Statistics
Shows the statistical distribution of particle processing methods used on each
particle and is generally intended for debug purposes only – contact Campbell
Scientific for more details.
4.4.1.38 Message Field 156 Year, Month, Day
This field will output the year, month and day.
4.4.1.39 Message Field 157 Hours, Minutes, Seconds
This field will output hours, minutes and seconds.
4.4.1.40 Message Field 158 Averaged Corrected Visibility Voltage and Averaged Upper Head
Voltage
Shows the average voltage (mV) value corresponding to the corrected visibility
value (i.e. adjusted for atmospheric conditions) and the average mV value for the
upper head.
4.4.1.41 Message Field 159 Output a CCITT CRC-16 (checksum) of the message
This outputs a two byte checksum in hex format (four ASCII characters). This is
normally included at the end of a message to allow the validity of the message to
be checked. The CRC does not include the checksum itself or STX/ETX
characters.
Page 59

Section 4. Operation
47
4.4.1.42 Message Field Error
If “Error - message field nnn not valid” is output then this indicates the message
you have defined has an invalid field which is not in the list above. You must go
and check / re-edit your message definition.
MESSAGE 0 FIELD 20
(20) Average visibility (m)
(21) SYNOP code (full)
(22) METAR code
(23) NWS code
(24) Alarms
(25) System fault status 0=ok 1&2=degraded 3=maintenance
4=laser_fault
(26) SYNOP code (generic)
(30) Temp Av (C), RH Samp (%), Wetbulb Av (C)
(31) Temp Max (C), Temp Min (C)
(33) Reserved
(34) Reserved
(40) Precipitation Intensity (mm / hour)
(41) Precipitation accumulation (mm)
(42) Particle size distribution (300 values 0.1 to 30mm)
(43) Particle Av velocity (m/s), Av size (mm)
(44) Particle type distribution (d, fd, r, fr, sg, sf, ip,
h, g, e, u)
(999) delete field
(1000 + field number) insert field
(0) more...
Figure 4-6. Message field menu
Choosing option 0 on the MESSAGE FIELD menu will display more output
parameter options. Choosing option 999 will delete the field (note that subsequent
fields already selected shift up to fill the gap in the fields). Choosing option 1000 +
field number will insert the chosen parameter in the field selected and shift
subsequent filled fields down one field.
Also available on the MESSAGE menu is the option to delete the message (option
2). If the message is to be deleted the DELETE MESSAGE menu, Figure 4-7, will
be shown. Choosing option 1 will not delete the message and will return the user
to the previous menu; option 2 will delete the message. If a message is deleted a
new message can be created for that message ID. Messages not deleted will retain
their message ID. Therefore if all messages are set and message 1 is deleted then
messages 0 and 2 are still active and will still be output. Message 1 can be
redefined if required.
Page 60

PWS100 Present Weather Sensor
48
DELETE MESSAGE 0
(1) no
(2) yes
Make selection:
Figure 4-7. Delete message menu
4.4.2 Top Menu Option 3 (Set Time and Date)
Choosing option 3 from the SETUP menu brings up the TIME AND DATE menu,
Figure 4-8. On this menu it is possible to set the time and / or date for the
PWS100. To change the time alone enter it as hh:mm:ss, for example 16:30:00. To
change the date alone enter it as yyyy/mm/dd), for example 2007/02/04. To set the
time and date simultaneously enter both of these parameters on the same line, for
example 16:30:00 2007/02/04. Leading zeroes are not required on the values but
the colons (:) and forward slashes (/) are and a space is required between the time
and date values.
TIME & DATE
Set time using hh:mm:ss
Set date using yyyy/mm/dd
Set date & time using yyyy/mm/dd hh:mm:ss
Set time & date using hh:mm:ss yyyy/mm/dd
NOTE: Changes have immediate effect
Enter any combination of time and or date as above :
Figure 4-8. Time and date menu
Page 61

Section 4. Operation
49
4.4.3 Top Menu Option 4 (Configuration)
Choosing option 4 from the SETUP menu brings up the CONFIGURATION
menu, Figure 4-9. From this menu the basic configuration of the sensor is set.
CONFIGURATION
(1) PWS100 ID
(2) TRH probe type
(3) Reserved
(4) Reserved
(5) Hood heater temperature (C)
(6) Dew heater mode
(7) Output mode
(8) Calibration
(9) Terminal mode
(10) PSU shut down voltage
Make selection:
Figure 4-9. Configuration menu
Option 1 of the configuration menu gives the PWS100 ID menu, Figure 4-10. Here
a PWS100 ID can be set. This is effectively the station address which is required
on any communication with the PWS100. If the PWS100 is on a network with
more than one PWS100 then each station should have its own PWS100 ID. The
default PWS100 ID is zero.
PWS100 ID
(0..100) Id range
Enter ID 0 :
Figure 4-10. PWS100 ID menu
Option 2 of the configuration menu gives the TRH PROBE TYPE menu,
Figure 4-11. Choose the correct temperature / relative humidity probe that is
connected to the PWS100 from the list given.
TRH PROBE TYPE
(0) no trh fitted
(1) CS215
(2) remote trh
Make selection 1 :
Figure 4-11. TRH probe menu
Selecting probe type 2 configures to sensor to expect a temperature and humidity
reading to be sent to it from a remote system using the RSENSOR command.
Page 62

PWS100 Present Weather Sensor
50
Options 3 and 4 are reserved for future use.
Option 5 of the configuration menu gives the HOOD HEATER TEMPERATURE
menu, Figure 4-12. The value that is to be set needs to be between 0 and 50C. The
hood temperature is maintained by the system at the value set.
HOOD HEATER TEMPERATURE
(0) off
(1..50) on temperature (C)
Make selection 10 :
Figure 4-12. Hood heater temperature menu
Option 6 of the configuration menu gives the DEW HEATER MODE menu,
Figure 4-13. The dew heaters can be set to on, off or auto. Auto-mode turns the
dew heaters on except when the hood heaters are set to heat.
DEW HEATER MODE
(0) off
(1) on
(2) auto
Make selection 2 :
Figure 4-13. Dew heater mode menu
Option 7 of the configuration menu gives the OUTPUT MODE menu, Figure
4-14. This refers to the use of packetized output. The message framing is done by
using STX (ASCII character 02) and ETX (ASCII character 03); these act as start
and end delimiters. The default value is 1 (STX / ETX on). These framing
characters are useful for programmers writing code to pick up data coming from a
sensor outputting data asynchronously to the device collecting it.
Messages end with CR LF characters. The ETX character is added after these if
the output mode is set to (1).
OUTPUT MODE
(0) STX / ETX off
(1) STX / ETX on
Make selection 1 :
Figure 4-14. Output mode menu
Page 63

Section 4. Operation
51
Option 8 of the configuration menu gives the initial warning screen for the
calibration procedure, Figure 4-15. Unless the correct procedure is followed and
calibration entries are correctly input the PWS100’s performance can be seriously
degraded. In order to perform a calibration a PWS calibration unit is required
which affixes to the PWS and performs several checks of the PWS100. This unit is
connected via the LEMO socket of the PWS100 and automatically provides values
to the PWS100 system which can be used to alter the calibration.
See the PWS calibrator manual for further instructions on how to run the
calibration device. The device itself can be run at any time during the operation of
the PWS100. It then provides size, velocity and visibility calibration values which
can be checked and accepted by the user using the PWS100 menu system
described below.
In order to proceed with the calibration routine ‘confirm’ must be typed followed
by the return key.
PWS100 Calibration
CAUTION! INCORRECT ENTRIES CAN SERIOUSLY DEGRADE ACCURACY
to edit or view instrument calibration, type 'confirm' :
Figure 4-15. Calibration warning screen
Once ‘confirm’ is typed followed by the return key. The CALIBRATION top
menu, Figure 4-16, will appear. The options available to the user are 0 to view and
enter the calibration disc constants and 1 to view and adjust the PWS100
calibration and 2 for a visibility only calibration.
PWS100 Calibration
(0) view / enter calibration disc constants
(1) view / adjust PWS100 calibration
(2) visibiliy only calibration
Make selection :
Figure 4-16. Calibration top menu
Options 0 or 1 are for a calibration using the PWC100 calibration kit. Please refer
to the PWC100 calibrator manual for details. Option 2 is for a visibility only
calibration using only the PWS100 visibility calibrator. Figure 4-17 shows the
procedure to be followed from on screen commands to carry out the visibility only
calibration.
Page 64
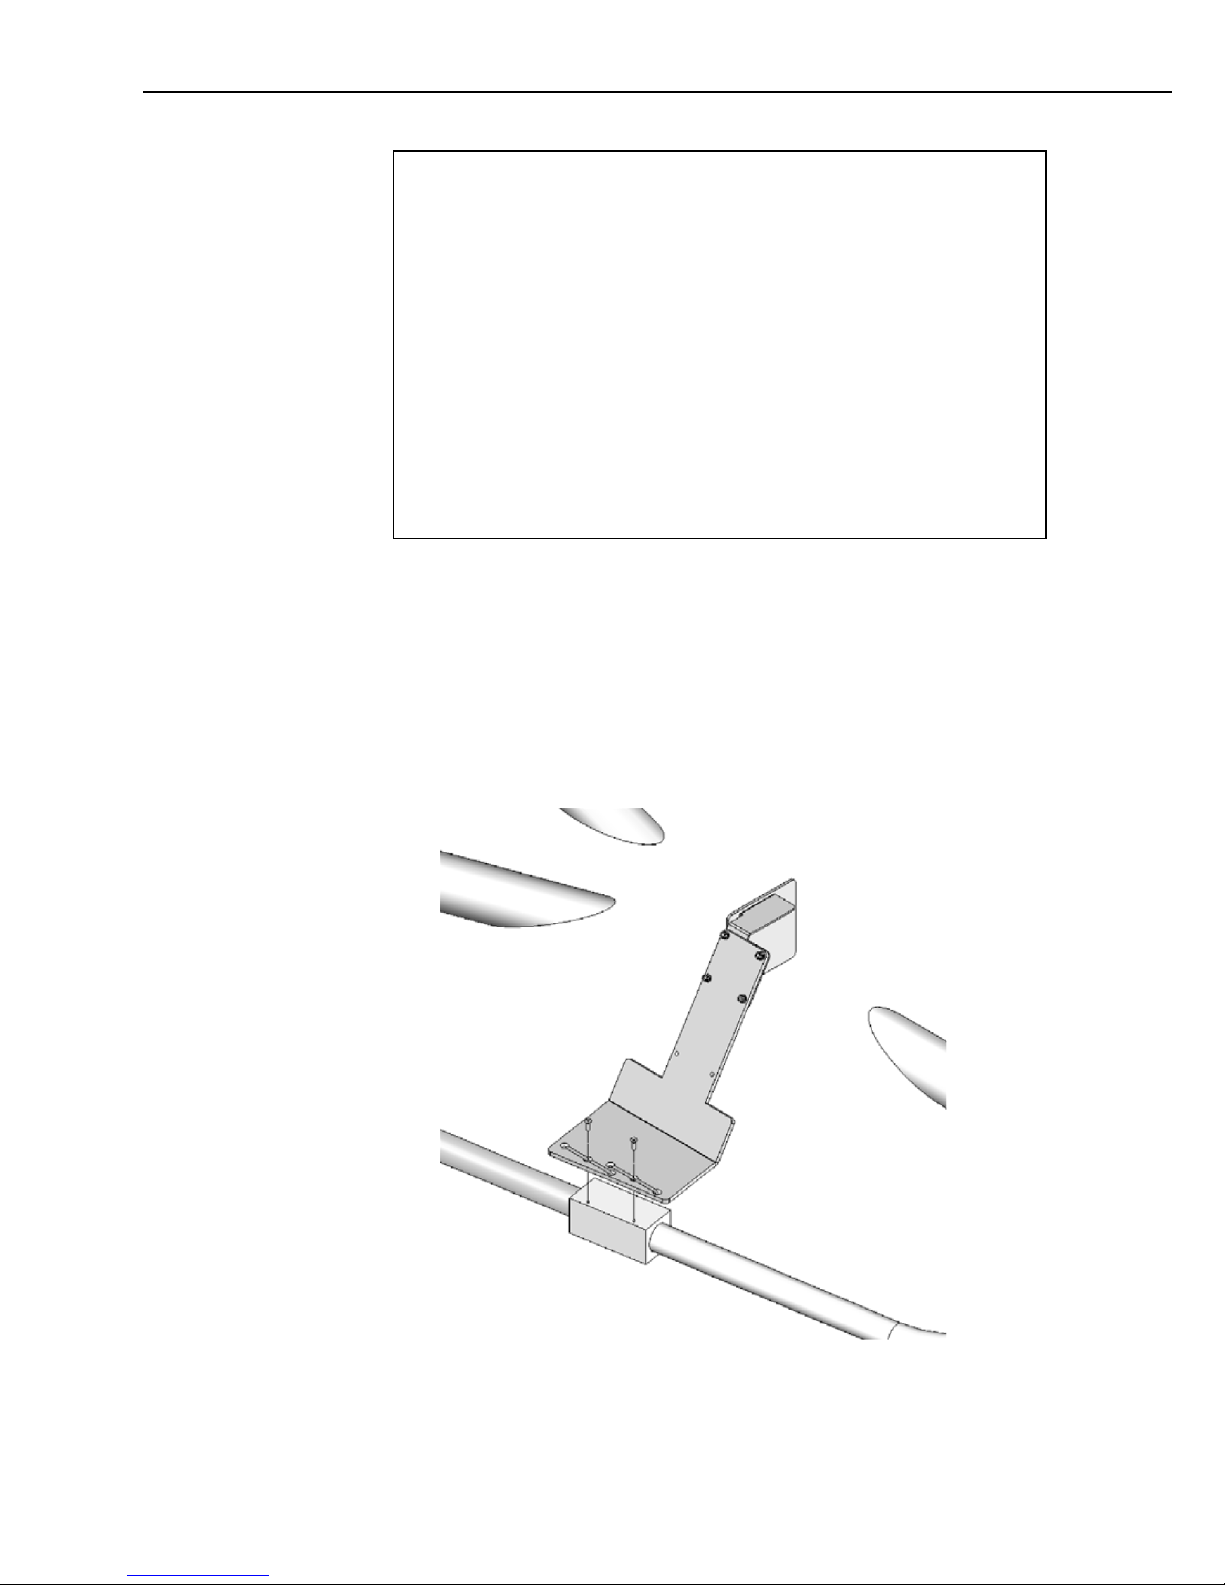
PWS100 Present Weather Sensor
52
Enter visibility calibrator plate constant (mV) 42.355 :
38.293
Place visibility blanking plug into upper sensor head, any
key to continue
wait 70 seconds for measurement...
Remove visibility blanking plug
Place visibility calibrator plate onto mount in central
position, any key to continue
wait 70 seconds for measurement...
Remove visibility calibrator plate, any key to continue
Figure 4-17. Visibility only calibration process
Finally the VIEW / ADJUST CALIBRATION menu, Figure 4-19 is shown. On
this menu the latest calibration values will be evident in the left hand column of
values headed ‘latest’. Selecting option 0 on the VIEW / ADJUST
CALIBRATION menu will return the user to the previous menu without invoking
any calibration changes. Selecting option 1 from the VIEW / ADJUST
CALIBRATION menu will allow the user to update the calibration value for
visibility.
Figure 4-18. Mounting visibility calibrator
Page 65

Section 4. Operation
53
The calibration should only be carried out during non-precipitation
conditions and during clear atmospheric conditions (>10 km
visibility).
PWS100 View / Adjust calibration
Latest results from calibrator date 27:5:2009
latest target--range calibration date
Velocity_Centre 4.983 4.900 5.100 22:4:2009
Velocity_Left 4.983 n/a n/a n/a
Velocity_Right 4.984 n/a n/a n/a
Size_Centre 2.158 2.108 2.258 22:4:2009
Visibility (mV) 36.554 32.590 39.832 6:4:2009
Visibility Offset (uV) -1.574 -3.000 3.000 n/a
(0) no change
(1) adjust calibration (THIS WILL TAKE IMMEDIATE EFFECT)
Make selection :
Figure 4-19. View / adjust calibration menu
Option 9 of the configuration menu gives the TERMINAL MODE menu, Figure
4-20. Choose whether CRC16-CCITT checksum verification is required.
When terminal mode is set to 1 all terminal commands need a CRC.
For example “open 0;d2d5” a semi-colon is used to indicate start of
CRC in 4 byte ASCII hex. Once the menu is opened menu
commands do not need a CRC and will be ignored if one is added.
The CRC is calculated either from the start of a new line or after a
[STX] up to but not including the semi-colon. ETX can follow the
CRC if required. The valid CRC can be read back for any command
if the CRC after the semi-colon is replaced with four `?’. For
example “open 0;????” the response will be
[CRLF]CRC>D2D5<CRC[CRLF] so d2d5 is the CRC.
TERMINAL MODE
(0) CRC16-CCITT off
(1) CRC16-CCITT on
Make selection 0 :
Figure 4-20. Terminal mode menu
Option 10 of the configuration menu gives the PSU SHUT DOWN VOLTAGE
menu, Figure 4-21. Enter the PSU input voltage level below which the PWS100
will enter low power mode. Enter `0.0’ to disable this feature (default).
NOTE
NOTE NOTE
Page 66
PWS100 Present Weather Sensor
54
PSU SHUT DOWN VOLTAGE
Enter 0.0 or between 9.0 and 24.0 volts 0.0 :
Figure 4-21. PSU shut down voltage menu
This feature is usually used to protect batteries from deep discharge.
There is a hysteresis of 0.9V applied. For example, if the PWS100
goes into low power mode at 10V it will return to normal operation
when the voltage rises to 10.9V. Current will be limited to about
120mA at 9V. Communications are still possible and a message
“PSU voltage too low nn.n”, where nn.n is the supply voltage, will
be output every 60 seconds.
A typical Campbell Scientific power supply will include a 7 Ah back-up battery as
described in 3.5.7. A shut-down voltage of 11.5 V is appropriate if this is used.
Table 4-3. Configuration Defaults
Parameter
Default
Description
ID 0 Sensor ID = `0’
TRH 1 CS215 temperature and RH sensor fitted
- 0 Reserved
- 0 Reserved
Hood heater
10
Hood heater on below 10 degrees
Dew heater
2
Dew heater automatic
Output
1
STX/ETX characters applied to output
Terminal mode
0
CRC16-CCITT checking on incoming commands off
PSU shutdown
0.0
No supply voltage shutdown applied
These default settings are restored by a hardware reset (see 3.5.10).
4.4.4 Top Menu Option 5 (Password)
Choosing option 5 from the SETUP menu brings up the PASSWORD menu,
Figure 4-22. Pressing enter deletes the password. To set a password type up to 10
alpha-numeric characters and press enter.
PASSWORD
10 alpha numeric chars max (0..9,a..z,A..Z)
Enter only deletes password
Enter password :
Figure 4-22 Password menu
NOTE
Page 67

Section 4. Operation
55
4.4.5 Top Menu Option 6 (Weather and Alarm Parameters)
Choosing option 6 from the SETUP menu brings up the WEATHER AND
ALARM PARAMETERS menu, Figure 4-23. This menu allows for the setup of
the visibility range alarms, snow water content factor and the mixed precipitation
thresholds.
WEATHER PARAMETERS
(1) visibility range alarm 1 = 5000
(2) visibility range alarm 2 = 1500
(3) visibility range alarm 3 = 500
(4) snow water content = 1.00
(5) mixed liquid & liquid precipitation threshold = 0.5
(6) mixed liquid & solid precipitation threshold = 0.1
(7) mixed solid & liquid precipitation threshold = 0.9
(8) mixed solid & solid precipitation threshold = 0.5
(9) visibility SYNOP mist RH% threshold = 95.0
(10) visibility METAR mist/haze RH% threshold = 80.0
(11) visibility METAR fog/haze RH% threshold = 95.0
(12) SYNOP snow_flake to snow_grain weighting = 1.00
(13) drizzle probability weighting = 1.00
(14) freezing drizzle probability weighting = 1.00
(15) rain probability weighting = 1.00
(16) freezing rain probability weighting = 1.00
(17) snow grain probability weighting = 1.00
(18) snow flake probability weighting = 1.00
(19) ice pellet probability weighting = 1.00
(20) hail probability weighting = 1.00
(21) graupel probability weighting = 1.00
Make a selection:
Figure 4-23. Weather parameters menu
There are three visibility alarms each of which is set separately by selecting 1, 2 or
3, followed by enter on the WEATHER PARAMETERS menu. Selection of one
of the visibility range alarms brings up the individual alarm menu, Figure 4-24.
Select an alarm range from 0 to 20 000 m. These alarms are triggered and stored in
the sensor and can be output as part of a message or used as flags as part of a
monitoring system.
Page 68

PWS100 Present Weather Sensor
56
VISIBILITY RANGE ALARM 1
Alarm = vis range < limit 0..20000m
Enter alarm limit 5000 :
Figure 4-24. Visibility range alarm menu
The snow water content scaling factor (SWCF) can be adjusted by choosing option
4 on the WEATHER PARAMETERS menu. This will bring up a line asking for a
value.
Depending on atmospheric conditions likely to be encountered, a wide range of
snow water content figures can be observed dependant on the bulk density of the
particle. Particle bulk density depends on the structure of the particle e.g. whether
it is dendritic, columnar or plate-like as the surrounding air or encapsulated air
occupies some of the particle space. The conversion from a measurement of size
(which in itself is not precise for irregular snowflakes) to water content can at best
be considered approximate.
The PWS100 assumes a relationship between snow flake size and bulk density
published in the literature (Brandes, E. A., K. Ikeda, G. Zhang, M. Schönhuber,
and R. M. Rasmussen, 2007: A statistical and physical description of hydrometeor
distributions in Colorado snow storms using a video disdrometer. J. Appl. Meteor.,
46, 634−650). That equation and the values it assumes for other identified particle
types are given in Table 4-4. The equation for snowflakes has the scaling factor
for snow water content that can be adjusted to suit local conditions. Entering a
value of 1 assume this relationship is correct, e.g. if the snow at the site of
installation is typically more dense and wet (as is common in temperate climates) a
higher scaling factor may be needed.
Table 4-4. Assumed bulk density of various particle types.
Particle Type
Bulk Density assumed
Liquid
1.0 g cm-3
Graupel
0.6 g cm-3
Snow grain
0.4 g cm-3
Ice pellet
0.7 g cm-3
Hail
0.8 g cm-3
Snow Flake
SWCF* 0.178*D
-0.922
g cm
-3
(D is the flake diameter in mm)
This figure should not be confused with equivalent water to snow depth
calculations which require further knowledge of packing structures, wind effects,
ground temperature, ground type and a myriad of other parameters related to snow
depth. The ratio of water accumulation to snow depth will be lower than the snow
water content figure and is typically in the order of 0.1 (i.e. the snow pack is 10
times deeper than the water accumulation of the melted snow pack).
Page 69

Section 4. Operation
57
Changing the snow water content parameter will also affect the
determination of precipitation intensity, which is defined by water
equivalent precipitation rates. See 5.6.2 and Appendix A for more
details.
WEATHER PARAMETERS
(1) visibility range alarm 1 = 5000
(2) visibility range alarm 2 = 1500
(3) visibility range alarm 3 = 500
(4) snow water content = 1.00
(5) mixed liquid & liquid precipitation threshold = 0.5
(6) mixed liquid & solid precipitation threshold = 0.1
(7) mixed solid & liquid precipitation threshold = 0.9
(8) mixed solid & solid precipitation threshold = 0.5
(9) visibility SYNOP mist RH% threshold = 95.0
(10) visibility METAR mist/haze RH% threshold = 80.0
(11) visibility METAR fog/haze RH% threshold = 95.0
(12) SYNOP snow_flake to snow_grain weighting = 1.00
(13) drizzle probability weighting = 1.00
(14) freezing drizzle probability weighting = 1.00
(15) rain probability weighting = 1.00
(16) freezing rain probability weighting = 1.00
(17) snow grain probability weighting = 1.00
(18) snow flake probability weighting = 1.00
(19) ice pellet probability weighting = 1.00
(20) hail probability weighting = 1.00
(21) graupel probability weighting = 1.00
Make a selection: 4
enter snow water content (0 to 9999) 1.00 : 0.9
Figure 4-25. Snow water content adjustment
The mixed precipitation threshold value can be adjusted by choosing options 5-8
on the WEATHER PARAMETERS menu. This will bring up a line asking for a
value between 0 to 1. A value of 0 means there is no threshold for mixed
precipitation – a single other type of particle in a specific event will give rise to a
mixed event, therefore mixed events are highly likely; and may easily be caused
by the occasional erroneous particle classification. A value of 1 means an equal
number of two types will have to be observed to trigger a mixed event, therefore
mixed events are highly unlikely. A setting of 0.5 means that a second
precipitation type needs to be 50% or more of the most common type to be
distinguished as a mixed event.
Four thresholds are given to allow maximum flexibility and to allow the sensor to
be setup to match local observer practise (which varies).
Option 5 controls the threshold for mixed events between two types of liquid
precipitation, e.g. rain and drizzle.
Option 6 controls the threshold for mixed events when a liquid type is the
dominant particle type and a solid is the next most prevalent particle type, e.g.
when it is raining and snowflakes are detected. Observers are typically more
NOTE
Page 70

PWS100 Present Weather Sensor
58
sensitive to reporting this as a mixed event than for rain/drizzle as occasional
snowflakes are easy to see.
Option 7 controls the threshold for mixed events when a solid type is the dominant
particle type and a liquid is the next most prevalent particle type, e.g. when it is
snowing but changing to rain.
Option 8 controls the threshold for mixed events between two types of solid
precipitation, e.g. snow and snow pellets.
WEATHER PARAMETERS
(1) visibility range alarm 1 = 5000
(2) visibility range alarm 2 = 1500
(3) visibility range alarm 3 = 500
(4) snow water content = 1.00
(5) mixed liquid & liquid precipitation threshold = 0.5
(6) mixed liquid & solid precipitation threshold = 0.1
(7) mixed solid & liquid precipitation threshold = 0.9
(8) mixed solid & solid precipitation threshold = 0.5
(9) visibility SYNOP mist RH% threshold = 95.0
(10) visibility METAR mist/haze RH% threshold = 80.0
(11) visibility METAR fog/haze RH% threshold = 95.0
(12) SYNOP snow_flake to snow_grain weighting = 1.00
(13) drizzle probability weighting = 1.00
(14) freezing drizzle probability weighting = 1.00
(15) rain probability weighting = 1.00
(16) freezing rain probability weighting = 1.00
(17) snow grain probability weighting = 1.00
(18) snow flake probability weighting = 1.00
(19) ice pellet probability weighting = 1.00
(20) hail probability weighting = 1.00
(21) graupel probability weighting = 1.00
Make a selection: 8
enter solid & solid mixed precipitation threshold (0 to 1)
0.5 :
Figure 4-26. Mixed precipitation threshold adjustment
Option 9 sets the RH threshold for mist or fog to be reported instead of haze in
SYNOP messages. The default is 95%.
Option 10 sets the RH threshold for mist to be reported instead of haze in METAR
messages. The default is 80%.
Option 11 sets the RH threshold for fog to be reported instead of haze if visibility
is less than 1000 m in METAR messages. The default is 95%.
Option 12 sets a weighting factor for deciding whether a mixture of snow grains
and snowflakes should be reported as a SYNOP code for snow or snow grains. The
range is 0 to 10. If it is 0 then if any snow grains are present SYNOP code 77 will
be reported. If it is set to 10 then snow will be reported unless there are an
overwhelming number of snow grains. The default is 1.0. Changing this parameter
Page 71

Section 4. Operation
59
has no effect on reported particle type distribution or calculated accumulations or
intensities.
Options 13 to 21 set a probability weighting for each type of particle the PWS100
will use in conjunction with other parameters in it’s fuzzy logic to determine
particle type. This will affect the particle type distribution and calcualtions of
accumulation or intensity. The range is 0.0 – 1.0. If a probability weighting is set
to 0.0 then that particle type will never be reported and instead be allocated to
another possible particle or as an unknown. Calculations of accumulation, intensity
and SYNOP, METAR and NWS codes will all be affected.
Setting the probability weighting to other than defaults can have a
major effect on the performance of the PWS100. If in any doubt,
please contact Campbell Scientific.
4.4.6 Top Menu Option 7 (Terminal)
Choosing option 7 from the SETUP menu brings up the TERMINAL screen,
Figure 4-27. Pressing any key brings up the terminal as described in Section 4.3.
TERMINAL ACTIVE
Type 'menu' or 'close' when done.
For help on terminal commands see user manual
Any key to continue....
Figure 4-27. Terminal active screen
4.4.7 Top Menu Option 8 (Info)
Choosing option 8 from the SETUP menu brings up the INFORMATION menu,
Figure 4-28. This shows various parameters for the PWS100 system. The software
version shows the current operating system number which may be required in
communications with Campbell Scientific about the PWS100. The watchdog
shows errors that have occurred since the installation of the operating system or a
hardware reset. The SDI-12 values of temperature and relative humidity will be -
999.00 if no such information is available such as when no probe is connected to
the SDI-12 port. The diagnostic mode shows two values. The first value is the flag
for the fuzzy diagnostic mode (0 or 1) (see ‘4.6.2 Retrieving Historical Data’ for
more information). The second value indicates the connection status of the
calibration unit, 0 shows that the unit is not connected and 1 shows that it is
connected.
NOTE
Page 72

PWS100 Present Weather Sensor
60
INFORMATION SN 1069
Hardware ver 4
DSP ver 6
Software ver 007628-06d
Watchdog 0
Battery V, SHDN V 13.0 0.0
Pws Fault 0
TRH probe type 1
Temperature 23.23
RH% 49.91
Hood temp 25.0
Upper led temp 37.7
Lower led temp 38.0
Laser temp 25.3
Upper detector temp 29.2
Lower detector temp 28.8
Laser current 53.6
Visibility (not corrected) 12
Diagnostic mode 0 0
Output, Terminal mode 1 0
Alarms 1110000000000000 0
Any key to continue....
Figure 4-28. Information menu
4.4.8 Top Menu Option 9 (Done)
Choosing option 9 from the SETUP menu brings up the DONE menu, Figure 4-29.
Here changes made can be saved before quitting (option 1) or lost before quitting
(option 2). Alternatively option 0 returns to the main menu.
DONE
(1) save changes & quit
(2) quit & lose changes
(0) main menu
Make a selection:
Figure 4-29. Done menu
4.5 Message Related Commands
Messages can be set for a variety of output types, including fixed standard types
and user defined types. The system can be set up to send automated messages at
user defined intervals, or can be used as a user polled system.
Page 73

Section 4. Operation
61
4.5.1 Automatic and Polled Message Sending
Whilst the command mode is closed, the PWS100 will operate by sending data
output as set by the user in either automatic or polled modes (see ‘4.3.3 Message
Polling’ for a description of the manual data polling command).
To define the output parameters and fields, use the MSET command with the
Message_ID, Message_Interval, Message_Mode and Message_Fields parameters
as follows:
MSET Message_ID Message_Interval Message_Mode Message_Fields
e.g. MSET 0 3600 0 105 106
In order to ensure that output is as required, the Message_ID, Message_Interval,
Message_Mode and Message_Fields parameters must be defined.
Three Message_IDs 0, 1 and 2 can be defined to provide the scope for different
output types to be given at different time intervals, e.g. Message_ID 0 can be
defined with a 15 second interval, whereas Message_ID 1 can have a 60 second
interval. Then every 15 seconds the message defined by Message_ID 0 will be
output, additionally every 60 seconds the message defined by Message_ID 1 will
be output. Each Message_ID should be defined as a separate command.
The Message_Interval parameter must also be defined from 0 second to 32767
seconds which is the rate at which the system will display the output message and
the period which statistics are calculated over (the factory and reset default for ID
0 is 60 seconds). If the Message_Interval is 0 then it will set the message polling
mode (see ‘4.3.3 Message Polling’ for a description of the manual data polling
command). Setting the Message_interval to less than 10 seconds will result in
repeated data due to the ten seconds measurement cycle in the sensor (see Section
5.5).
The Message_Mode defines special functions and can be set to either 0 or 1.
Setting Message_Mode to 0 allows output to the serial port and stores the ‘MSET’
data history. Setting the Message_Mode to 1 prevents the output to the serial port
but stores the ‘MSET’ data. For message polling mode the Message_Mode should
be set to 0.
By default (factory set and after reset of the system) the Message_Field parameter
for message_ID 0 is set up as described in Section 4.4.1.1 which is a combination
of message types. If no message field parameters are set, then no output will be
given, thus a particular ID can be cleared by using the above method.
There are many fixed message types which are detailed elsewhere in Sections
4.4.1.1 to 4.4.1.36. Table 4-2 defines the possible message field parameters.
To view all current user messages set then leave all parameters blank as below:
MSET
The system will then output the current message in the form:
Message_ID Message_Interval Message_Mode Message_Fields
....
....
To view only the Message_ID of interest then leave all parameters blank apart
from Message_ID as follows:
Page 74

PWS100 Present Weather Sensor
62
MSET Message_ID
The system will then output the current message for that Message_ID in the form:
Message_ID Message_Interval Message_Mode Message_Fields
e.g. for ID 0 set with a 10 second interval, serial port output and parameters 105
and 106 the output will be: 0 10 0 105 106
Note that the MSET command will output the parameters for all of the
message_IDs set. e.g if additional to ID 0 set above, ID 1 is set with a time interval
of 30 seconds, serial port output and with parameter 104 set the output will be:
0 10 0 105 106
1 30 0 104
To set manual polling mode the MSET command should be of the form:
MSET Message_ID 0 0 Message_Fields
e.g. MSET 0 0 0 105 106
A minimum message interval of 10 seconds can be set for all types
of message field output. If a time is set less than 10 seconds data
values will be repeated (see Section 5.5)
4.5.2 Retrieving Historical Data
Historical data can be output by using the HDATA command. This has a
parameter, period which is the number of seconds to output going back in history.
The most recent message will be output first going back period seconds into
history. The command is:
HDATA period
If period is larger than the number of seconds stored, then only the messages
stored will be output. If no value is provided for period then all of the stored
historical data will be output. Note that this command outputs particle by particle
data (size, velocity, volume).
This function is provided for initial setup and diagnosis. It is not intended for long
term use as it has several limitations, which include the amount of data that can be
stored is limited by the system memory (see specifications) and no data is stored
whilst the system is in the terminal or system menu.
The HDATA command outputs this format:
Timestamp (seconds), datatype, value a, value b, value c
The datatype can range from 0 to 1015 currently. Low value numbers, ranging
from 0 to 99, indicate it is particle data with the coding:
0 Drizzle
1 Freezing drizzle
2 Rain
3 Freezing rain
4 Snow grain
NOTE
Page 75

Section 4. Operation
63
5 Snowflake
6 Ice pellets
7 Hail
8 Graupel
90 Error
99 Unknown particle type
For the above value a, value b and value c relate to size (diameter in mm), velocity
(ms-1) and volume (m3).
Higher codes indicate this is another type of data (stored every 10 seconds) where
values a, b, and c have different meanings as indicated below:
1000 Time stamp (in seconds from 1/1/2007)
1001 Temperature, RH and wetbulb temperature
1002 Visibility data (upper, lower and calibrated mV sample)
1010 Wetness grid value
1011 Error codes (temperature / RH error code, wetness error code)
1012 Aux sensor value
Extra information about each particle can be given from the sensor if the sensor is
set up to store such extra information. The command to enable the storage of this
extra information is:
FUZZYDIAG 1
Once this command is given then the following information will also be stored for
each particle observed:
1013 Minimum signal peak, pedestal height and signal to pedestal ratio for
detector 1
1014 Minimum signal peak, pedestal height and signal to pedestal ratio for
detector 2
1015 Polycrystalline flag (1 for polycrystalline, 0 for not polycrystalline)
To disable the storage of the above extra information (which if not required frees
up more memory to store more history of particles) use the command:
FUZZYDIAG 0
This data is part of the logical processing of each particle as the signal to pedestal
ratio value is used in one of the fuzzy logic tables to help determine particle type.
It has been shown from studies of the PWS100 signal output that snow grains and
snowflakes exhibit much smaller ratios than for drizzle and rain. This is only
possible due to the structured nature of the detection volume and the fact that
polycrystalline particles such as snow exhibit refraction and reflection of light
from multiple scattering sites as opposed to mainly refraction from what is
effectively one scattering site for liquid particles.
In terms of data storage with FUZZYDIAG enabled 5 records are used every 10
seconds (1001, 1002, 1010, 1011 and 1012) plus 4 records for every processed
particle that passes through the volume (0-99, 1013, 1014 and 1015). For example
if 20 particles per second are processed then 80.5 records are used per second.
Since 1000000 records can be stored in the LPA only 1242 seconds worth of data
can be stored as opposed to 4878 seconds with FUZZYDIAG disabled.
FUZZYDIAG will be disabled by default.
Page 76

PWS100 Present Weather Sensor
64
Three values are always given in the HDATA output however if the
particular coded output has less than three parameters the remaining
values will be zero, 1010 and 1012 are examples of this.
4.5.3 Viewing Data Output on the Command Line
A number of records (defined by the number n) of uncollected historic m data
(message data) can be output to the command line in ASCII text format in exactly
the same format as defined in the messages. To do this type:
HMDATA n
If the parameter n is omitted then all uncollected data is output. Any output
message of either interval or polled are stored in a large final output buffer and any
uncollected data can be collected using this command. See Section 4.5.4 for the
preferred method of collecting this data.
4.5.4 Collection of Data in Text File Format
A number of records (defined by the number n) of uncollected historic m data
(message data) can be collected using Xmodem 1K protocol. To do this type the
following on the command line:
XHMDATA n
If the parameter n is omitted then all uncollected data is collected. Any output
message of either interval or polled are stored in a large final output buffer and any
uncollected data can be collected using this command. This command would
normally be used for scheduled collection using a computer. The file downloaded
is a text file with messages in exactly the same format as defined in the messages.
4.6 Weather Related Commands
4.6.1 Setting and Viewing Weather Parameters
Visibility alarm limit parameters, a snow water content parameter and a mixed
precipitation threshold parameter can be viewed using the SETPARAM command.
To view these parameters, type:
SETPARAM
The PWS100 will then display three visibility alarm limit parameters, the snow
water content parameter and the mixed precipitation threshold parameters (4 in
total) on screen in the following format:
vislim1 vislim2 vislim3 snowwater mixthreshold
vislim1 = visibility limit alarm 1 limit (Default 5Km)
vislim2 = visibility limit alarm 2 limit (Default 1.5Km)
vislim3 = visibility limit alarm 3 limit (Default 0.5Km)
snowwater = snow water content (Default 1.0)
mixthresholds 1..4 = mixed precipitation thresholds (4 values)
NOTE
Page 77

Section 4. Operation
65
To set the adjustable visibility limit parameters, type:
SETPARAM vislim1 vislim2 vislim3 snowwater mixthreshold 1..4
The system will respond by displaying the new settings as described above with
SETPARAM command. Please see Section 4.4.5 for a description of the
mixthresholds and the default values.
4.6.2 Receiving data from remote sensors
Instead of using data from sensors directly connected to the PWS100, it can be
sent data from remote sources, e.g. a different temperature and humidity sensor
connected to the controlling system/datalogger. To do this the TRH sensor type
needs to be changed to the remote sensor option and the data sent to the PWS100
by the controlling system at regular intervals, e..g every minute. The RSENSOR
command is used as follows:
RSENSOR Pws_Id Temperature Humidity
Temperature should be in degrees Celsius and humidity as a percent (0-100). The
PWS100 will use the last values sent to it for its particle discrimination decisions.
4.7 System Configuration Commands
4.7.1 Setting System Parameters
The system configuration parameters can be viewed using the CONFIG command
and those capable of being set by the user are set using the SETCONFIG
command. To view the system configuration parameters, type:
CONFIG
The PWS100 will then display the configuration parameters on screen in the
following format:
Date and Time
PWS100 product identification
Serial Number
Hardware Version
Software Version
PWS100 ID
Serial Baud Rate
Interface type [RS232 / RS485] and duplex [FULL / HALF]
Auxiliary Sensor ID 1, 2…
Hood and Dew heater settings
Overrun error count
Output mode Terminal mode
Diagnostic mode
Watchdog error count
Some of these parameters are set using other commands, such as the time and date
being set using the TIME command and the various message output parameters set
using the MSET command. Other configuration parameters will only be updated
with an OS change.
An example of the output given from the CONFIG command is given below:
23/2/2007 16:30:01
Page 78

PWS100 Present Weather Sensor
66
PWS100
SN-9999
HW4
OS 007628-02c
PWS_ID 0
Baud 115200
RS232 Full Duplex
TRH 1 Wetness 0 Aux 0
Hood 10 Dew 2
OR_ERR 0
Output_Mode 1 Terminal Mode 0
Diag 0 0
WD 0
Using the SETCONFIG command will adjust system configuration parameters.
SETCONFIG allows you to change the PWS100 ID and the sensor types.
To view the current SETCONFIG parameters without changing them use
SETCONFIG.
To change the parameters use the following command:
SETCONFIG pws100_ID TRH_Sensor Reserved Reserved Hood_Set Dew_Set
Output_Mode Terminal_mode Psu_shutdown_voltage
The pws100_ID is a number from 0 to 99. This is the effectively the station
address and is required on any communication with the PWS100. On a network
with more than one PWS100 the ID must be set different for each station. The
default factory pws100_ID is zero (0).
Currently three other sensors types can be connected to the PWS100. The sensor
configured is changed by parameters TRH_Sensor (Temperature and RH%),
Wetness_Sensor & Aux_Sensor. The Wetness and Aux sensors currently should
always set to zero. Section 5 gives further details of how to connect optional
sensors. Table 4-5 gives the IDs of TRH_ sensor types. To add these to the system
put the appropriate sensor ID to the appropriate sensor parameter.
Table 4-5. TRH sensor types.
ID
Sensor Type
0
No Sensor
1
CS-215 Temperature RH%
2
Remote Temperature and RH
3-99
Reserved for future use
The Hood_Set value sets the temperature at which the hood heaters are set to
function at and can be set to 0 (off) or a temperature between 10 and 50C. The
Dew_Set value sets the temperature at which the internal dew heaters are set to
function at and can be 0 (off), 1 (on) or 2 (auto).
The Output_Mode value relates to the use of packetized output. The message
framing is done by STX and ETX (start and end) delimiters. The Output_Mode
Page 79

Section 4. Operation
67
values available are 0 = No STX / ETX or 1 = STX / ETX. The default is 1 = Send
STX / ETX. The use of STX and ETX is mainly used in multidrop systems with
many sensors on one RS-485 bus or to aid software development.
4.8 Maintenance Commands
4.8.1 Loading a New OS
A new OS can be loaded into the PWS100. A new OS may be developed and
provided by Campbell Scientific to improve the functionality of the system. The
system will check that the OS loaded is valid, however the user should ensure that
the OS is the latest OS provided by Campbell Scientific.
Save the relevant new OS file provided by Campbell Scientific in a known
directory on the PC used for communications to the PWS100.
A new operating system can be loaded with the Present Weather Viewer program,
using the option in the tools menu (see the help system for this) or it can be loaded
using a terminal program as described below.
With the PWS100 then connected to the PC use the following command to load a
new OS:
LOADOS
The system will now respond by attempting to upload the new OS using Xmodem.
Select ‘Transfer’ on the pull down menu and then select ‘Send File’. Select the
Xmodem 1k protocol and select the OS file using the ‘Browse’ button. Once
selected press the ‘Send’ button. The Xmodem file send dialogue box then opens
displaying download progress and will close automatically once the download has
completed. The OS can be seen to be being installed by a series of memory block
erasures, followed by writing of the OS and verification of the OS. The user is then
prompted to wait for 5 seconds for the OS to restart. The new OS is now installed.
Do not remove power to the unit whilst the OS is being
installed as this will cause the unit to malfunction.
Terminal PWS100 OS upload and data collection will not work
when an NL100 is used in the communications link.
4.8.2 Running a Diagnostic Test
To run a DIAG test first the fields need to be set by using the DIAGSET command
as below:
DIAGSET Stats_Period Diagnostic_Fields
The Stats_Period parameter is the period in seconds that statistics are calculated
over ranging from 0 to 32767.
The Diagnostic_Fields parameter is a list of fields required as listed in Table 4-2.
There is no restriction on the type or combination of fields that can be output.
If DIAGSET is executed with Stats_Period & Diagnostic_Fields blank then the
diagnostic field parameters will be output without changes.
WARNING
NOTE
Page 80

PWS100 Present Weather Sensor
68
Note: the diagnostic message type is 9000 and this is can be seen with both the
outputs of DIAGSET and DIAG commands.
To run diagnostic tests use the DIAG command as below:
DIAG Output_Rate
Output_Rate is the rate in seconds ranging from 0 to 32767. If Output_Rate is not
entered then the Output_Rate will be set the same as the Stats_Period.
e.g. DIAG 10
In the example above the PWS100 will output the diagnostic information with
statistics calculated over a period defined by the DIAGSET command at an output
rate of 10 seconds. This information will continue to be displayed until the key
combination ‘Ctrl + C’ is pressed, or after 10 minutes has passed.
4.8.3 Running the Calibration
The PWS100 calibration can be checked and adjusted using the optional PWC100
PWS Calibrator. Please refer to the PWC100 manual for further details of
operation of the PWC100 and mounting of the calibrator on the sensor body.
It is possible to carry out a simple visibility only calibration using the PVISC100
visibility calibrator, part number 010443 (included in the PWC100 or purchased
separately. This is described in Section 4.4.3.
4.8.4 Rotating the Calibration Disc
The command RUNDISC n will start the disc of the PWS Calibrator (if
connected) rotating at a speed n = ms-1. To start the disc spinning type the
following:
RUNDISC n
The user can then use this to test or demonstrate the PWS functions. Using the
command RUNDISC without any parameter, or n = 0.0 will stop the disc.
n can be anything between 0.0 and 7.0.
4.9 Other Commands
4.9.1 Setting the Time and Date
The time and date of the system can be observed by using the TIME command as
follows, note the set time could drift up to +/- 14 seconds a day:
TIME
yyyy/mm/dd hh:mm:ss
To change the system time and date then the command requires the time and date
in the correct format as follows:
TIME yyyy/mm/dd hh:mm:ss
Where, in the order shown in the command above, yyyy is the year, mm is the
month of the year, dd is the day of the month, hh are the hours (24 hour clock),
mm are the minutes, ss are the seconds. Leading zeros on the values are not
Page 81

Section 4. Operation
69
necessary however the colons (:) and forward slashes (/) are required and a space
is required between the day and the hour.
It is possible to set just the date or the time independently of the other. To set just
the date without altering the time the following should be used:
TIME yyyy/mm/dd
To set the time without the date being altered the following should be used:
TIME hh:mm:ss
4.9.2 Resetting the System
A “soft” system reset can be done by using the RESET command as follows:
RESET
This will terminate all current measurements and reset the system. The time, date
and calibration values will be maintained, but all other user enterable data are lost
and will need to be input again as required.
If a problem is found with the sensor first try power cycling the sensor. A soft
reset is the next level of debugging and should be tried before using a hardware
reset (see switch settings).
4.9.3 Status
The command STATUS displays system status information similar to that in
Figure 4-30 below.
PWS>status
INFORMATION SN 1069
Hardware ver 4
DSP ver 6
Software ver 007628-07
Watchdog 0
Battery V, SHDN V 15.2 0.0
Pws Fault 0
TRH probe type 1
Temperature -999.00
RH% -999.00
Hood temp 24.2
Upper led temp 39.2
Lower led temp 39.6
Laser temp 24.6
Upper detector temp 28.6
Lower detector temp 28.3
Laser current 57.5
Visibility (not corrected) 15798
Diagnostic mode 0 0
Output, Terminal mode 1 0
Alarms 0000000000000000 0
Figure 4-30. System status information
Page 82

PWS100 Present Weather Sensor
70
In this example temperature and RH% are -999 because no external t/RH sensor is
attached and no T/RH data is available to the PWS100.
The alarm characters are interpreted as follows:
The first 16 characters are the same as the message field 24, alarms, (see 4.4.1.8).
The last character is a fault code as follows: 0 = No Fault, 1 = laser hood
thermistor, 2 = laser thermistor, 3 = lower led thermistor, 4 = lower detector
thermistor, 5 = upper led thermistor, 6 = upper detector thermistor, 7 = laser dirty
window, 8 = battery voltage, 9 = upper detector DC, 10 = lower detector DC,
11 = auto calibration secondary offset, 12 = auto calibration primary offset,
13 = battery voltage, 14 = upper dirty window, 15 = lower dirty window,
16 = laser dirty window, 17 and 18 = laser current.
4.10 Connecting the PWS100 to a Datalogger
4.10.1 Connections
The PWS100 can be connected to a datalogger’s RS232 port using the supplied
RS-232 cable with a null modem between the PWS100 and the datalogger. The
connections should adhere to the EIA232F standard for RS-232 communications.
If the supplied 9 pin D-connector is removed to connect to a device without a
suitable socket for the D-connector, e.g. to COM1..4 on the terminal blocks of the
datalogger, then connect using the information supplied in Table 3-1. Please make
sure that the RTS/CTS lines are connected correctly when making up this cable as
no data will be transmitted otherwise. Normally these lines should be connected
together in the PWS enclosure or joined at the end of the cable, as it is not
necessary to use handshaking with a Campbell Scientific datalogger.
4.10.2 Example Logger Programs
Prior to writing a data logging program whether it be for a Campbell logger or
another system it is important to consider the issue of whether the sensor is to be
set to automatically transmit the data at a given interval and the logger capture it
OR the logging system poll the sensor based upon the loggers time base.
The automatic transmission system appears to be easier and may be the only way
to work where several systems need to listen in and pick up data from one sensor.
However, there will always be issues with synchronising the data transmitted by
the sensor and that stored alongside it in the logging system. The main cause of
these problems is the relative time drift between the sensor and logging system.
The simplest issue this causes is the timestamp from the sensor will drift away
from the logger, unless regularly corrected and also the data output from the sensor
will relate to different times in the logger, e.g. the sensor may output anywhere
within the loggers’ minute interval if set to one minute output interval. More
noticeable issues are that, depending on the relative gains or losses of the two
clocks that the logger will over time either receive an extra transmission from the
sensor or not get a transmission from the sensor in a given period. Apart from
accepting this as being inevitable the only solution to this is to get the sensor to
output more frequently than you need the logger to receive data and have the
logging system work with the latest transmission, but this is not always ideal or
possible.
Polling the sensor for data gives full control of the timing of measurements to the
logging system, as with the PWS100 it can be asked to output a message for a
given time up until the instant the poll command is issued. The PWS100 processes
the data in its buffer for that period and generates the message “on the fly”. Apart
Page 83

Section 4. Operation
71
from needing both transmit and receive connections to the logger the only
disadvantage of this technique is there may be a slight delay (typically less than
one second) whilst the PWS100 prepares the message in response to the poll
command.
Two simple example programs for a CR1000 Campbell Scientific datalogger are
given below. A more powerful, documented program that includes advanced setup,
CRC checks, etc, can be downloaded from:
http://www.campbellsci.co.uk/downloads
The following is an example program for the Campbell Scientific CR1000
datalogger using automated output settings (see Section 4.6.1). Note that the
aliases are set for the output as defined in the program, these should be altered to
suit the individual outputs selected. The PWS100 outputs can be set manually or
by the command line from the logger – “MSET 0 60 0 49 21 24 40 41 151”.
'CR1000 Series Datalogger
'Campbell Scientific Ltd. PWS100 Present Weather Sensor
'Example of data capture in a single message output
'automatically by a sensor connected to COM1 on the logger
'Declare General Variables
Public Temp, PWS_Bytes
'Incoming PWS100 Data buffer
Public InString As String * 500
'Final PWS100 Data - define the array large enough to match the
'number of fields in the message
Public PWS100data(11)
'Define aliases so the results are easier to identify
'Need to match the fields selected in the message
Alias PWS100data(1) = MessageID
Alias PWS100data(2) = PWSID
Alias PWS100data(3) = Visibility
Alias PWS100data(4) = PWS
Alias PWS100data(5) = NWS
Alias PWS100data(6) = Intensity
Alias PWS100data(7) = Accumulation
Alias PWS100data(8)= DayCount
Alias PWS100data(9) = Hour
Alias PWS100data(10) = Minute
Alias PWS100data(11) = Second
'Declare Constants
Const STX = &H02
Const ETX = &H03
DataTable (PWS100,True,-1)
Sample (11,PWS100data(),IEEE4)
EndTable
'Main Program
BeginProg
'Open Serial Port to the PWS100
SerialOpen (Com1,115200,3,0,10000)
Page 84

PWS100 Present Weather Sensor
72
'Commands can be included here to setup the
'sensor if it has not been preconfigured
Scan (60,Sec,0,0)
'Read the data using the STX and ETX characters as delimiters
'If a whole message is not in the serial buffer this will
'store "NAN" in the string
SerialInRecord(COM1,InString,STX,0,ETX,PWS_Bytes,01)
'If a full string has been read then parse the data and store it
If PWS_Bytes>0 Then
SplitStr (PWS100data(),InString," ",11,0)
CallTable PWS100
EndIf
NextScan
EndProg
The following is an example program for the Campbell Scientific CR1000
datalogger using polled output settings (see Section 4.6.1). The PWS100 outputs
can be set manually or by the command line from the logger – “MSET 0 0 0 49 21
24 40 41 151”.
'CR1000 Series Datalogger
'Campbell Scientific Ltd. PWS100 Present Weather Sensor
'Example of data capture in a single message that is polled
'for by the logger. The sensor is connected to COM1
'Declare variables
'Incoming PWS100 Data buffer
Public InString As String * 500
'Final PWS100 Data - define the array large enough to match the
'number of fields in the message
Public PWS100data(11)
'Define aliases so the results are easier to identify
'Need to match the fields selected in the message
Alias PWS100data(1) = MessageID
Alias PWS100data(2) = PWSID
Alias PWS100data(3) = Visibility
Alias PWS100data(4) = PWS
Alias PWS100data(5) = NWS
Alias PWS100data(6) = Intensity
Alias PWS100data(7) = Accumulation
Alias PWS100data(8)= DayCount
Alias PWS100data(9) = Hour
Alias PWS100data(10) = Minute
Alias PWS100data(11) = Second
'Declare Constants
Const CR = CHR(13)
Const LF = CHR(10)
Page 85

Section 4. Operation
73
DataTable (PWS100,True,-1)
Sample (11,PWS100data(),IEEE4)
EndTable
'Main Program
BeginProg
'Open Serial Port to the PWS100
SerialOpen (Com1,115200,3,0,10000)
'Commands can be included here to setup the sensor
'if it has not been preconfigured
Scan (60,Sec,0,0)
'Poll for message 0 from the PWS100 using msend
'In this case getting a message for the last 60 s of data
'First flush the buffer
SerialFlush (Com1)
SerialOut (Com1,"msend 0 60 0" & CR,"",0,0)
'Read in the data waiting for up to two seconds
'for the response
SerialIn (InString,Com1,200,LF,2000)
'If we received something parse the data and store
If Len(InString) >0 Then
SplitStr (PWS100data(),InString," ",11,0)
CallTable PWS100
EndIf
NextScan
EndProg
Page 86

PWS100 Present Weather Sensor
74
Page 87

75
Section 5. Functional Description
5.1 General
The PWS100 Present Weather Sensor is an optical sensor using the best of scatter
meter and disdrometer techniques to give accurate analysis of weather conditions
including precipitation classification, precipitation intensity, drop size
distributions and visibility range.
Visibility is measured using the forward scatter technique, which gives an
estimation of the meteorological optical range (MOR). The amount of scatter
detected at the sensor heads is proportional to the visibility for small fog particles.
For larger particles, which are detected as various forms of precipitation, the
PWS100 is able to give estimates of visibility using its particle discrimination as a
calibration factor.
Precipitation is detected using an optical technique, originally developed as a
method for the measurement of the size and velocity of fine particles in sprays,
which has been modified to make it applicable to the analysis of precipitation.
Individual precipitation particles are analysed using the optical arrangement
described in Section 5.2 ‘Optical Measurement’. As well as the size and velocity
measurements, the instrument also looks at the structure of the signal to provide
further parameters for particle classification. From the measurements, the volume
of particles (or water equivalent volume in the case of snow) is calculated which
gives a measurement of precipitation intensity. Drop size distributions can be
determined from data collected over set periods.
5.2 Optical Measurement
5.2.1 Optical Arrangement
The optical design is such that the system outputs a number of evenly spaced
horizontal light sheets that are parallel to each other in order to define a structured
volume that is consistent. The two sensors are at angles of 20 to the optic axis of
the light sheet generator (laser unit), one deviated through 20 in the horizontal
plane, the other 20 in the vertical plane. This defines a good-sized volume in
which to detect particles of all sizes and provide accurate statistical analysis of
events. With the PWS100 optical arrangement good signal strength from all types
of particle (drizzle, rain, snow, sleet, hail etc...) is observed.
The laser unit, as shown in Figure 5-1, comprises a laser diode and a number of
optical elements to produce the light sheet pattern as shown in Figure 5-2, which
extends some distance whilst maintaining a parallel sheet distribution. Over the
volume length there is negligible distortion to the light sheets.
Page 88
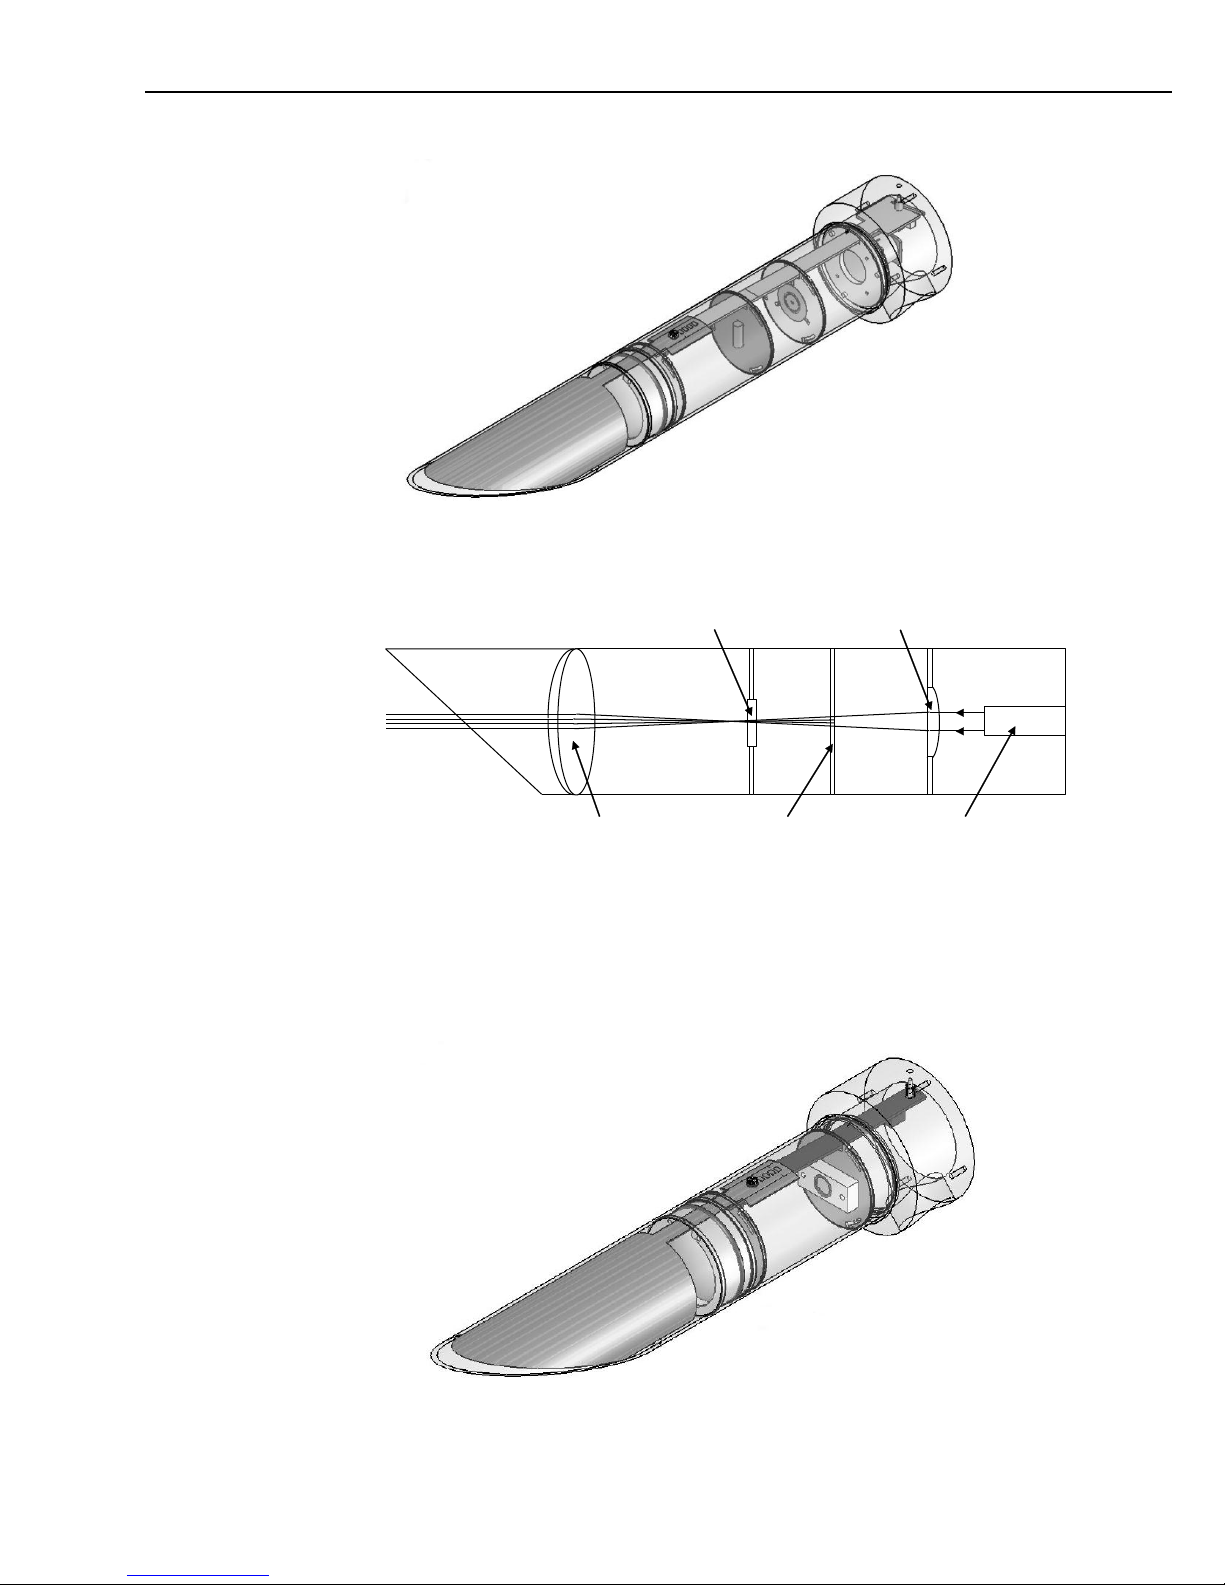
PWS100 Present Weather Sensor
76
Figure 5-1. Laser unit
Doublet lens
Rod lens
Grating
Cylindrical lens
Laser
Figure 5-2. Laser unit showing light sheet production (not to scale).
The sensor units as shown in Figure 5-3, comprise a lens, a filter tuned to the
wavelength of the laser output and a photodiode placed at the back focal length of
the lens with suitable amplification electronics. This photodiode then accepts light
from the detection volume over a finite range of angles as shown in Figure 5-4.
Figure 5-3. Sensor unit
Page 89
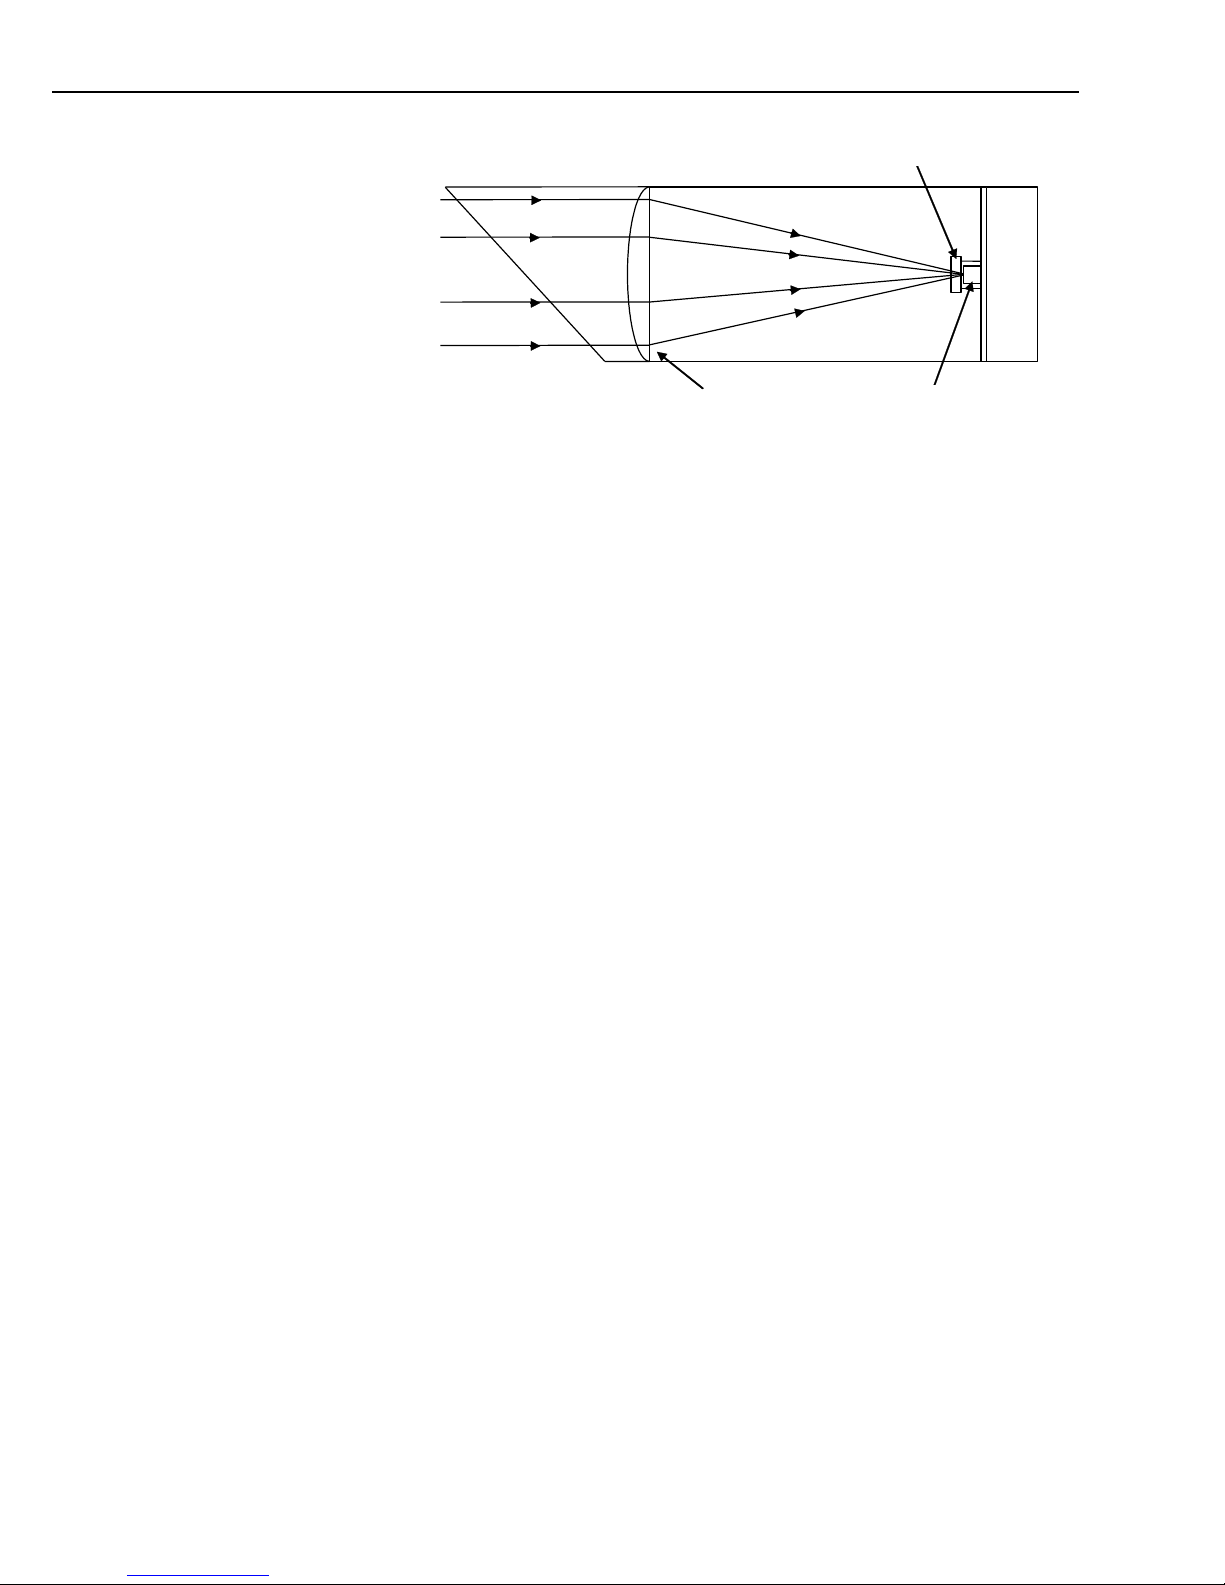
Section 5. Functional Description
77
Photodiode
Plano-convex lens
Filter
Figure 5-4. Sensor unit showing light path extents (not to scale)
5.3 Additional Sensor Connections
Although it is possible to use the PWS100 as a standalone present weather sensor,
its ability to distinguish particle types is improved when certain other sensors are
connected to the unit. In particular a temperature and RH probe provides the
system with more discriminating parameters, ensuring that solid and liquid
precipitation are more clearly identified. Though general statistics would be
enough on most occasions to determine particle types over minute or hour long
averaging periods, individual particle analysis will benefit from these extra
temperature, humidity and corresponding wet bulb temperature parameters being
incorporated into the classification algorithms. The standard PWS100 can be
ordered with a CS215 temperature and relative humidity probe, complete with
0.5 m lead terminating in a LEMO connector, or temperature and RH values can
be sent to the PWS100 from the controlling system/datalogger.
5.3.1 Using a CS215 on the PWS100
The CS215 temperature and RH probe should be connected directly to one of the
free SDI-12 connectors at the base of the DSP enclosure as shown in Figure 3-8.
The CS215 is mounted inside a radiation shield and needs to be mounted away
from the actual detection volume of the PWS100 in order to avoid any turbulence
effects in the volume that could give rise to inaccuracies in the measurement of
speed and size of particles. The bracket for the CS215 should therefore point in
the opposite direction to the mounted PWS100. Adding a CS215 improves the
precipitation type algorithm by adding three further parameters, temperature,
relative humidity and wet bulb temperature. Though wetbulb temperature is
derived from other parameters, there is plenty of evidence showing its relationship
with the precipitation type and thus it becomes a useful parameter within itself. If
no CS215 is connected then an internal, less accurate temperature measurement is
used and the sensor assumes the relative humidity is 100%. The removal of the
CS215 does not prevent the unit from working, but can lead to less accurate
particle classifications.
Note the CS215 should be “recalibrated” at the recommended interval, normally
every year, to ensure accurate measurements from it and the PWS100. In the case
of the CS215 this is most easily achieved by replacing the sensor element in situ
with a new one.
Page 90
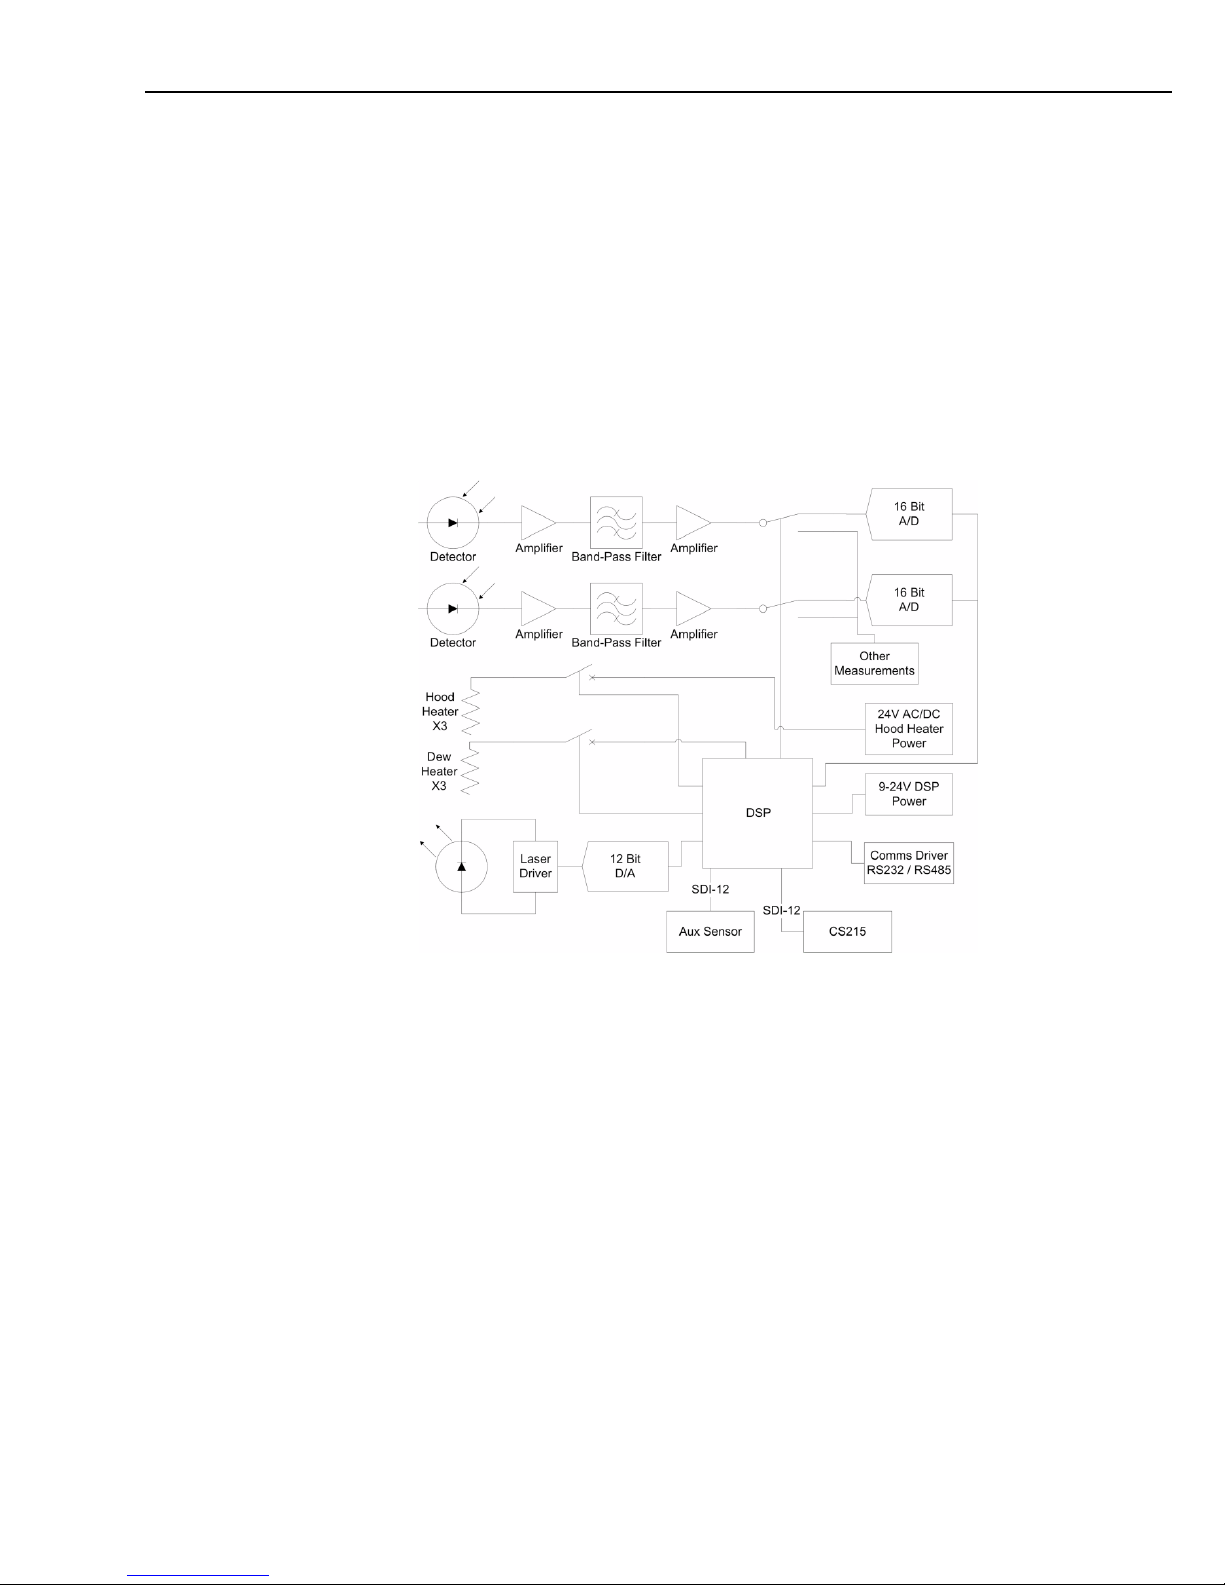
PWS100 Present Weather Sensor
78
5.3.2 Using Other Sensors on the PWS100
Starting from operating system version 4, the PWS100 can accept temperature and
humidity values sent from the controlling system, which might have access to data
from another T and RH sensor. This is enabled by selected the remote TRH sensor
type in the configuration menu and the remote system sending the data (space
separated) using the RSENSOR terminal command.
5.4 PWS100 Control Unit
The PWS100 control unit, shown in Figure 5-5 as a block diagram, is a custom
designed DSP board comprising a DSP, memory, timing circuits and analogue to
digital converter.
Figure 5-5. Block diagram of PWS100 Control Unit
The DSP board controls all of the functions of the system, including switching of
heaters when the temperature sensors in each head pass certain thresholds, laser
modulation, signal analysis and communications. The on board memory holds the
program code, data tables and data for statistical manipulation.
5.5 Measurement Signal Processing
The PWS100 has two phases of operation based around a ten second cycle. The
main phase is run for nine seconds out of every ten during which it continuously
captures data from the optical detectors and processes the data to analyse for
particles. The second phase, which runs in the remaining second is used for
making measurements from other sensors both within the sensor itself and from
the external sensors. Precipitation amounts and rates are corrected for the 90%
particle duty cycle, whilst counts of particles are not. As a result of this ten
second cycle statistical data are only updated every ten seconds.
The algorithm descriptions in this user guide give details as to how particles are
detected and used to give the outputs relevant to present weather monitoring.
Page 91

Section 5. Functional Description
79
5.6 Algorithm Description
5.6.1 Detecting and Classifying Precipitation
The PWS100 comprises one laser head and two detector heads. Each of the
detector heads is 20° off axis to the laser unit axis, one in the horizontal plane, the
other in the vertical plane. It has a structured detection volume consisting of four
sheets of light each 0.4 mm in depth with 0.4 mm spacing. The area of detection is
approximately 40 cm2 as defined by the overlap of the two detectors.
When a particle passes through the four light sheets it provides a signal
characteristic of the particle type and provides information on the velocity of the
particle.
Water particles give well defined signal peaks as they pass through the detection
layers. The time between these peaks gives the fall speed of the particle. Because
the dominant scattering mechanism for water is refraction there is a delay between
the peaks detected by the vertical and horizontal detectors. This offset represents
the time taken for a drop to fall a known fraction of its diameter and hence,
combined with the fall speed, gives its diameter. As a particle falls through the
detection volume the signal peaks are superimposed on a signal 'pedestal' as
scattering will not be totally due to the above mechanism.
The structure of the particle is to some degree given by analysis of the signal peak
to signal pedestal ratio. The signal pedestal is higher for particles with higher
crystallinity and therefore more scattering sites. Particles of water have almost no
pedestal compared to the peak signal value whereas snow can have large pedestals
compared to the peak signal value.
Particles for which the pedestal is very large (e.g. snow) may have their size
measured by the analysis of particle transit time or signal amplitude (in the same
way that present weather sensors without structured detection volumes measure
particle size).
Analysis of separate snow and rain/drizzle events has shown that there is very
little overlap in the signal peak to pedestal peak ratio for the solid and liquid
particles, though drizzle values extend further towards the snow values and snow
grains extend further towards the liquid precipitation values, whilst the larger rain
and snowflakes remain almost entirely separate. This is shown graphically in
Figure 5-6 which represents two separate events one comprising snowflakes and
snow grains (particle count on the left vertical axis) and one representing a mixed
drizzle and rain event (particle count on the right vertical axis). This particular
differentiator, only obtainable because the PWS100 has a structured detection
volume, is extremely useful in the fuzzy logic processing as described below and
further in Section 5.6.4.1.
Page 92
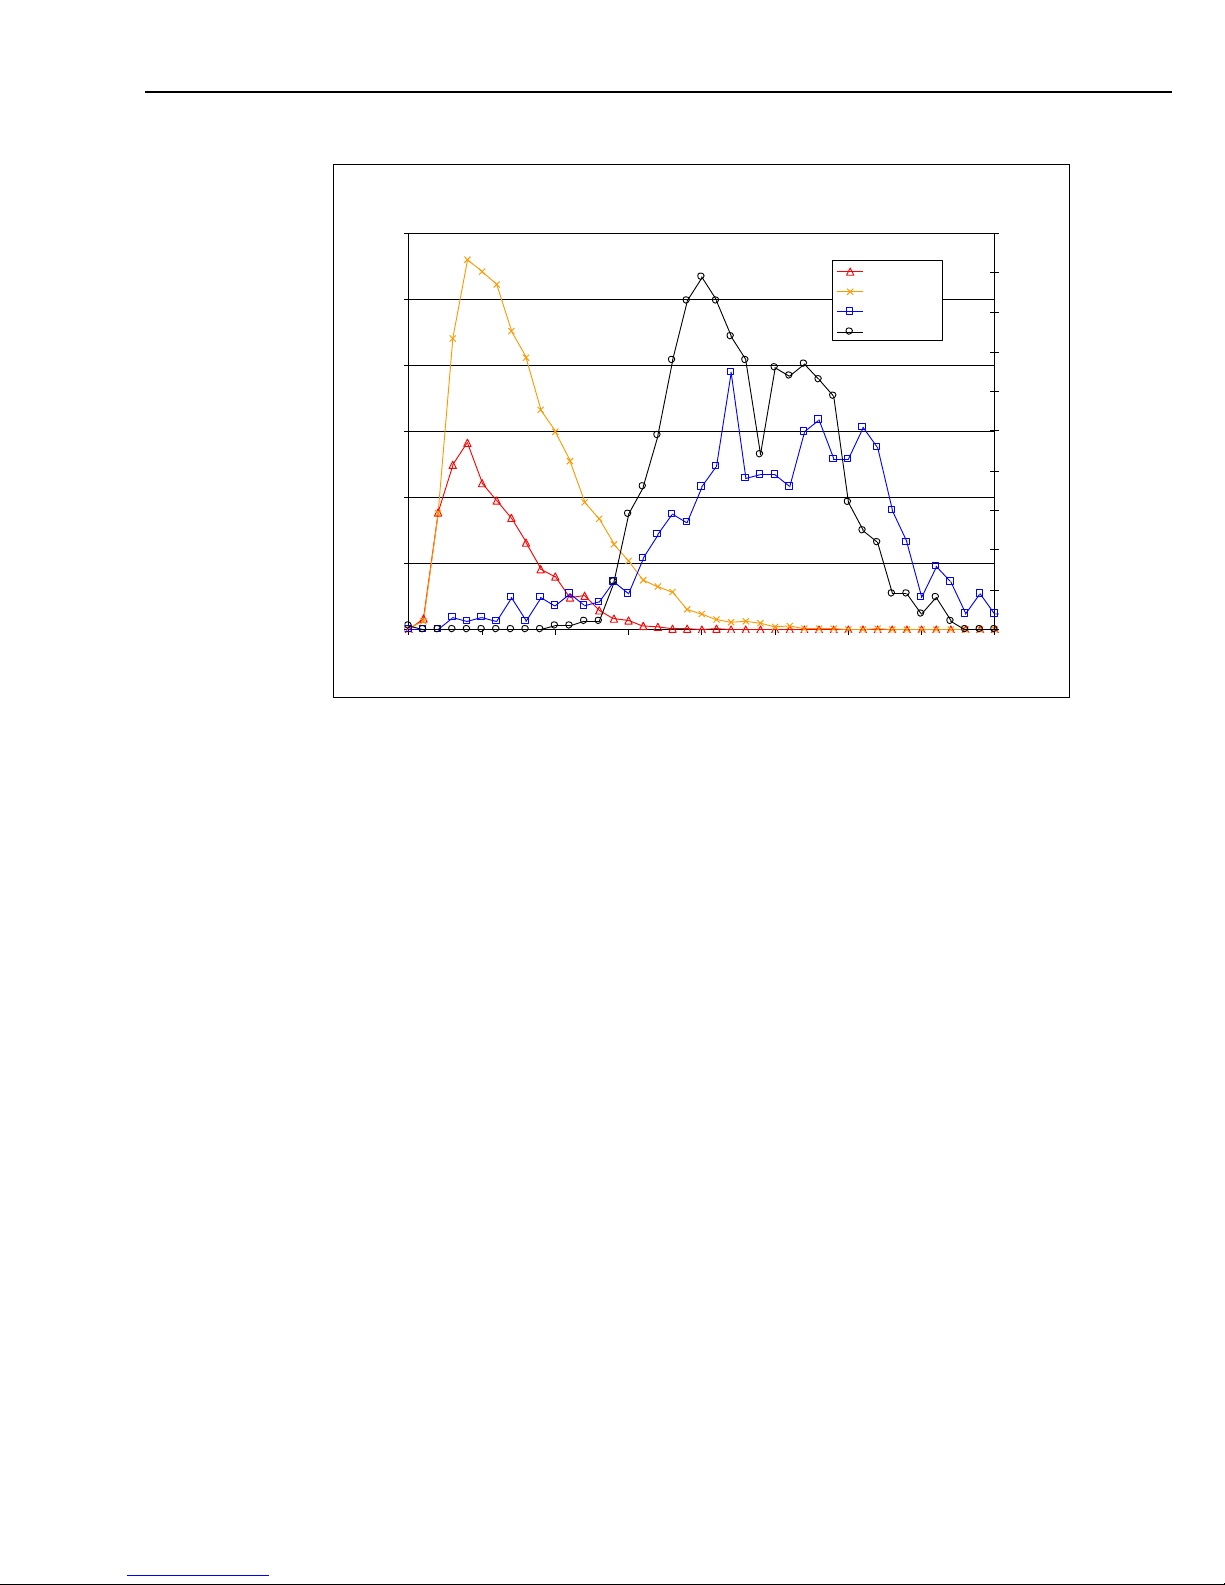
PWS100 Present Weather Sensor
80
Signal to Pedestal Ratio Analysis
0
100
200
300
400
500
600
1 1.5 2 2.5 3 3.5 4 4.5 5
Signal to Pedestal Ratio
Particle Count (Snow)
0
10
20
30
40
50
60
70
80
90
100
Particle Count (Liquid)
Snowflakes
Snow Grains
Drizzle
Rain
Figure 5-6. Signal to pedestal ratio values for different precipitation types
N.B.: The above data were collected during the sensor development. Results from production
instruments will differ. In particular the optics do not allow accurate measurement of the pedestal
ratio for true drizzle (particles <0.5 mm diameter)
Auxiliary data including values of temperature, relative humidity and derived wet
bulb temperature are used in the analysis of particles if a CS215 is connected to
the PWS100 or the data are transmitted to it. There is a complex relationship
between these parameters and the types of particles that are formed, however since
the PWS100 only measures point values, and the evolution of particle formation is
not known, the true nature of the particle type can only be estimated from such
parameters.
Processing of these data values is done by a series of fuzzy logic tables, some of
which provide certain pure logical differentiators such as the size bounds for
drizzle and rain, snow grains and snowflakes and ice pellets and hail. Through the
use of the parameters determined from the PWS100 and CS215 the fuzzy logic
tables provide a means of determining particle type. The general parameters thus
analysed in this fuzzy logic processing are size versus velocity, signal peak to
signal pedestal ratio, temperature, relative humidity and wet bulb temperature.
Each particle type from drizzle, freezing drizzle, rain, freezing rain, snow grains,
snowflakes, ice pellets, hail and graupel have a set of fuzzy logic tables covering
the above parameters. The size versus velocity tables are based on values derived
from previous studies either by Campbell Scientific Ltd. or other research
institutes and organisations (see Ellis R A et al, 2006, New Laser Technology to
Determine Present Weather Parameters, Meas. Sci. Technol., 17 1715-1722). The
fuzzy part of these tables gives a reduced fuzzy logic score off of the defined size
versus velocity curve. These values then overlap on the various tables such that a
particle could be assigned a size/velocity value of 0 for drizzle, 0.4 for rain, 0.3 for
snowflakes, 0.4 for graupel, 0.1 for ice pellet etc… The fuzzy value assigned is
always between 0 and 1. Since certain particle types are mutually exclusive then
some types will be assigned 0 based on pure logic, e.g. a particle > 0.5 mm
Page 93

Section 5. Functional Description
81
diameter will have a rain value which can be >0 whereas the drizzle value for this
type will always be 0.
Once each possible particle type has been assigned a fuzzy logic value for all of
the parameters the values are multiplied for each particle to give 9 particle type
scores between 0 and 1. The highest value is more likely to be the correct particle
and so this type is assigned to the individual particle. If two values are exactly the
same then the particle is of unknown type and is assigned a type as such.
Over the measurement period there are likely to be a number of particles falling
through the detection volume. To define a precipitation type the individual
particles are binned into 11 classes. 9 specific types, 1 unknown and 1 error.
The unknown classification is used for particles which appeared to have been
measured correctly but either have fuzzy logic classifications that are not unique
OR fall outside the realms of possibility for natural particles, e.g. they are
measuring as travelling too fast for their size, or perhaps a particle appears to be
classified as a snow flake at very high temperatures. Measurements where two
particles have overlapped in the optical path are also classified as unknown.
Unknown particles’ size and speeds measurements are excluded from statistical
calculations, but as at least one particle has definitely been detected the rainfall
intensity and total measurements are corrected by adding one extra particle with
the characteristics of the average of the good particles falling at that time.
The error classification is used for particles where various quality checks
determine the measurement to be suspect, e.g. a particle is moving upwards, the
signal to noise ratio is too small, the particle has fallen through the edge of the
measurement zone or the measurements are off scale in some way. In general
particles with the erroneous classification are not likely to be real or should not be
counted (upwards moving for instance) so these are not included in any statistics
nor is any correction made to rainfall rates or totals.
During normal measurements a small fraction of unknown or error particles will
be recorded. This is because there will always be a small fraction of the particles
which fall through the edge of the sampling volume. The proportions of these
particles can increase with the type of precipitation and weather conditions, e.g.
under heavy rainfall conditions both more unknown and error particles will be
counted. This is due to a larger proportion of particles clipping the edge of the
optical path (as they are larger) and an increased risk that two particles will pass
through the optical path at the same time. Similarly where there are very windy
conditions more particles will not fall through all four light sheets so cannot be
properly measured.
5.6.2 Precipitation Intensity
Precipitation intensity calculations are possible because of the instruments
accurate analysis of particle size. Over the defined period of time, the volume of
all particles is summed and precipitation rate output is then given as an equivalent
mmh-1 measurement. The PWS100 has exceptional sensitivity to the start and end
of precipitation events. Note though, that to avoid falsely reporting precipitation
due to insects etc, the sensor will not report the detection of particles at the start of
an event until a threshold of ~3 particles per minute is exceeded.
Measurements of both intensity and accumulation are however subject to some
assumptions as is common with most optical rain detectors. These are that all rain
particles are distorted in a similar way as they fall and also that there is a defined
cut-off area for the optical sampling volume. Those assumptions break down in
windy conditions, when accuracy can be increasingly degraded. During high
winds from critical directions the optical housing or mounting poles may also
create shadows causing under-reading.
Page 94

PWS100 Present Weather Sensor
82
In terms of an intensity output through the SYNOP and METAR and NWS codes
the intensity is calculated from the precipitation rate over the measurement period.
As heavy drizzle can give less precipitation accumulation (and thus precipitation
rate) than moderate rain for example, it is necessary to observe the precipitation
rate and also take into consideration the particle type distribution of those
particles. The following WMO standard table of intensity definitions is used to
define the intensity class of different types of precipitation.
Table 5-1. Precipitation intensities
Variable
Range
Intensity Class
Drizzle
i < 0.1 mmh-1
Light
0.1 mmh
-1
< i < 0.5 mmh-1
Moderate
i > 0.5 mmh-1
Heavy
Rain
i < 2.5 mmh-1
Light
2.5 mmh
-1
< i < 10.0 mmh-1
Moderate
i > 10.0 mmh-1
Heavy
Snow
i < 1.0 mmh-1
Light
1.0 mmh
-1
< i < 5.0 mmh-1
Moderate
i > 5.0 mmh-1
Heavy
The PWS100 defines various intensity classes for all types and combination of
types of precipitation and these are shown fully in Appendix A. Although the
WMO guidelines have been followed as far as possible with these intensity ranges
some have been added since the WMO guidelines do not cover all possible
eventualities
5.6.3 Precipitation Accumulation
Precipitation accumulation is calculated in mm over a specified time period by
summing the volume of all precipitation particles falling through the defined
volume. As mentioned above, as with most other similar optical detectors the
PWS100 will be subject to increased error and bias in windy conditions.
Accumulations of snow are based on the water content of those particles. The
snow water content scaling factor is a user definable parameter in the instrument,
see Section 4.4.5. The accumulation given will be the water equivalent depth and
not the snow depth which requires further knowledge of packing structures, wind
effects, ground temperature, ground type and a myriad of other parameters related
to snow depth. The ratio of water accumulation to snow depth will be lower than
the snow water content figure and is typically in the order of 0.1 (i.e. the snow
pack is 10 times deeper than the water accumulation of the melted snow pack).
Local conditions will dictate the values to use and since these will be different for
every location it is not possible to give accurate snow depth figures with the
PWS100. Thus only accurate snow water content values for the particles falling
through the detection volume are given.
Page 95

Section 5. Functional Description
83
5.6.4 Present Weather
Present weather covers precipitation type analysis and visibility in the PWS100
algorithms. The PWS has separate routines for these two functions along with
various housekeeping tasks to ensure that the output is as accurate as possible.
5.6.4.1 Precipitation Types
The precipitation types identified are drizzle, freezing drizzle, rain, freezing rain,
snow grains, snowflakes, ice pellets, hail and graupel. A mixture of these types
and intensity of these types gives an array of outputs that have been assigned
codes by the WMO. These are defined as the WMO SYNOP codes (4680, WaWa).
See Appendix A for the code table. Each particle is assigned a type from analysis
of particle size, velocity, signal structure and inclusion of any other weather
parameters from auxiliary instruments connected to the PWS100. The CS215
provides three additional parameters, temperature, relative humidity and wetbulb
temperature. Fuzzy logic is used to define particle type from these values as this
provides the best estimate of a particle type, allowing for grey boundaries in terms
of size and velocity measurements for example, which may help to determine
particle types during windy conditions. Standard logic can be flawed when
incorporating a number of different parameters from the signal and auxiliary
instruments as the boundaries have to be effectively black and white allowing for
no margin of error, this is highlighted by the use of temperature matrices on
certain instruments which have fixed boundaries between snow and rain. With
such non-fuzzy logic instruments all particles above a set temperature are
classified as rain, drizzle or unknown and below that temperature have to be snow
or unknown.
5.6.4.2 Visibility Types
Also by using the WMO SYNOP code table (4680) a visibility type can be
defined. These types cover mist, fog, haze and smoke. See Appendix A for details.
5.6.4.3 Weather Classes
Since the PWS100 stores historical data it can give codes relating to the conditions
during the previous hour if no event is currently taking place. Again these events
have specific WMO 4680 codes.
5.6.4.4 Weather Code Selection
Weather code selection is based on a history of particle types determined for each
particle falling through the detection volume and classified by the instrument. A
table of particle types can be called from the history over a user specified period
of time (or after a specific amount of time if the instrument runs in an automated
mode). This table will consist of 11 numbers, one for each particle type as defined
above, one for unknown type and one for errors observed from the signal (e.g. a
size out of the range specified for the instrument). Logical processing is then used
to determine the most prevalent particle type or to classify mixed types if present.
No precipitation and unknown precipitation outputs are also possible. Unknown
precipitation is classified if a certain number of the detected particles are
individually classified as unknown types.
Precipitation intensity is also given for the period specified. Output can then be
given as ascii (e.g. Heavy snow) or as any of the set output standard codes, such as
WMO SYNOP (WW73), METAR (+SN) and NWS (S+). Note that for some
output types, certain particle types are not given an individual code. In these cases
the most appropriate classification is given. METAR can support 3 or more types
in one output, NWS output is normally only reported as a single code and the
Page 96

PWS100 Present Weather Sensor
84
WMO code has mixed types incorporated into its 80 specific codes (00 to 99
available but 20 codes reserved for future allocation).
Although the PWS100 detects and classifies graupel (heavily rimed precipitation
particles), for the purposes of WMO 4680 coding graupel is classed as snow as
there is no classification codes for this type of particle. The type classification
output will still reflect the number of particles identified as snow grains,
snowflakes and graupel. The PWS100 will output snow grains and snowflakes
(snow) as separate outputs as per the WMO 4680 code tables if these are
dominant.
5.6.5 Visibility
Visibility as defined in the British Standard ‘BS 185-15:1972 Glossary of
Aeronautical and Astronautical Terms – Section 15 : Meteorology’ is “the
greatest distance at which an object of specified characteristics can be seen and
identified. At night, lights are observed and an equivalent day-light visibility is
deduced”. Because of the human perception of the environment, visibility is a
subjective measurement dependant on the contrast response of the individual
human eye. Therefore no instrument can truly measure visibility. It is only
possible to measure the immediate surroundings, selecting appropriate parameters,
which can be related to the environmental air quality and human visual perception.
The PWS100 has the ability to define an obscurant type and determine a visibility
value based on the amount of particle scatter calibrated against the type of
particles in the detection volume. The size distribution can also be used to
calibrate the visibility value if such a distribution exists in the present weather
event – i.e. available when the obscurant is drizzle, snow or some other large
particle but not when fog or mist as particle sizes are too small to enable the
distribution to be determined. When the obscurant consists of fog, mist or some
other sub-drizzle sized particles then no visibility range correction is required.
The ±10% accuracy range of the visibility output from the PWS100 is from 0 to
10,000 m with a 20,000 m cap on the total range. These accuracy figures are
quoted for fog/rain conditions in typical UK conditions with clean optics.
Accuracy will be lower in conditions of freezing precipitation and less common
conditions, e.g. dust.
As with any instrument sampling obscurants over a small portion of the range
given (including transmissometers, forward scatter meters and backscatter meters)
the output is only accurate if the scattering medium is uniformly dense over that
given range. Some time averaging may lead to better agreement with a human
observer during inconsistent events and may avoid highly variable output not
consistent with overall events. In order to reduce noise levels the visibility
measurements (raw voltage readings) are taken for 9 out of 10 seconds of time
measurement interval and then averaged. Visibility range (in metres) is then
processed in the statistical output over the required period.
Any accuracy figures quoted by any manufacturer of automated visibility sensors
will consider only uniform events over the range given, even then differences in
obscurant particle observed (including but not limited to particle density, surface
roughness and optical scatter mechanism) can lead to ± 20% errors (UK Met.
Office studies). Only by determining particle type accurately and having the added
information of particle size distribution can these errors during uniform events be
minimised. The PWS100 is capable of determining this extra information and
therefore giving the most accurate visibility estimates in uniform events.
Page 97

Section 5. Functional Description
85
Currently the PWS100 implements two separate calibrations for fog and rain
events and interpolates between them depending on the rainfall intensity. In the
future other calibrations will be added to give increase accuracy in other types of
events.
5.7 Applications
Because of the amount of information available from the sensor it is capable of
giving detailed analysis of weather conditions suitable for meteorological,
aeronautical, agricultural and transportation applications. Measurements of
visibility are applicable for aviation or roadside weather monitoring. Drop size and
velocity distributions can be used in the analysis of soil erosion, flood prediction
or as a calibration for radar instruments in meteorological studies.
5.8 Internal Monitoring
The PWS100 has a number of internal checks including temperature analysis
inside each head unit of the sensor, temperature check at the laser, dirty window
contamination checks and voltage monitoring (particularly for the laser source).
These can be select for output with the weather data, see Section 4.4 for more
details.
Page 98

PWS100 Present Weather Sensor
86
Page 99
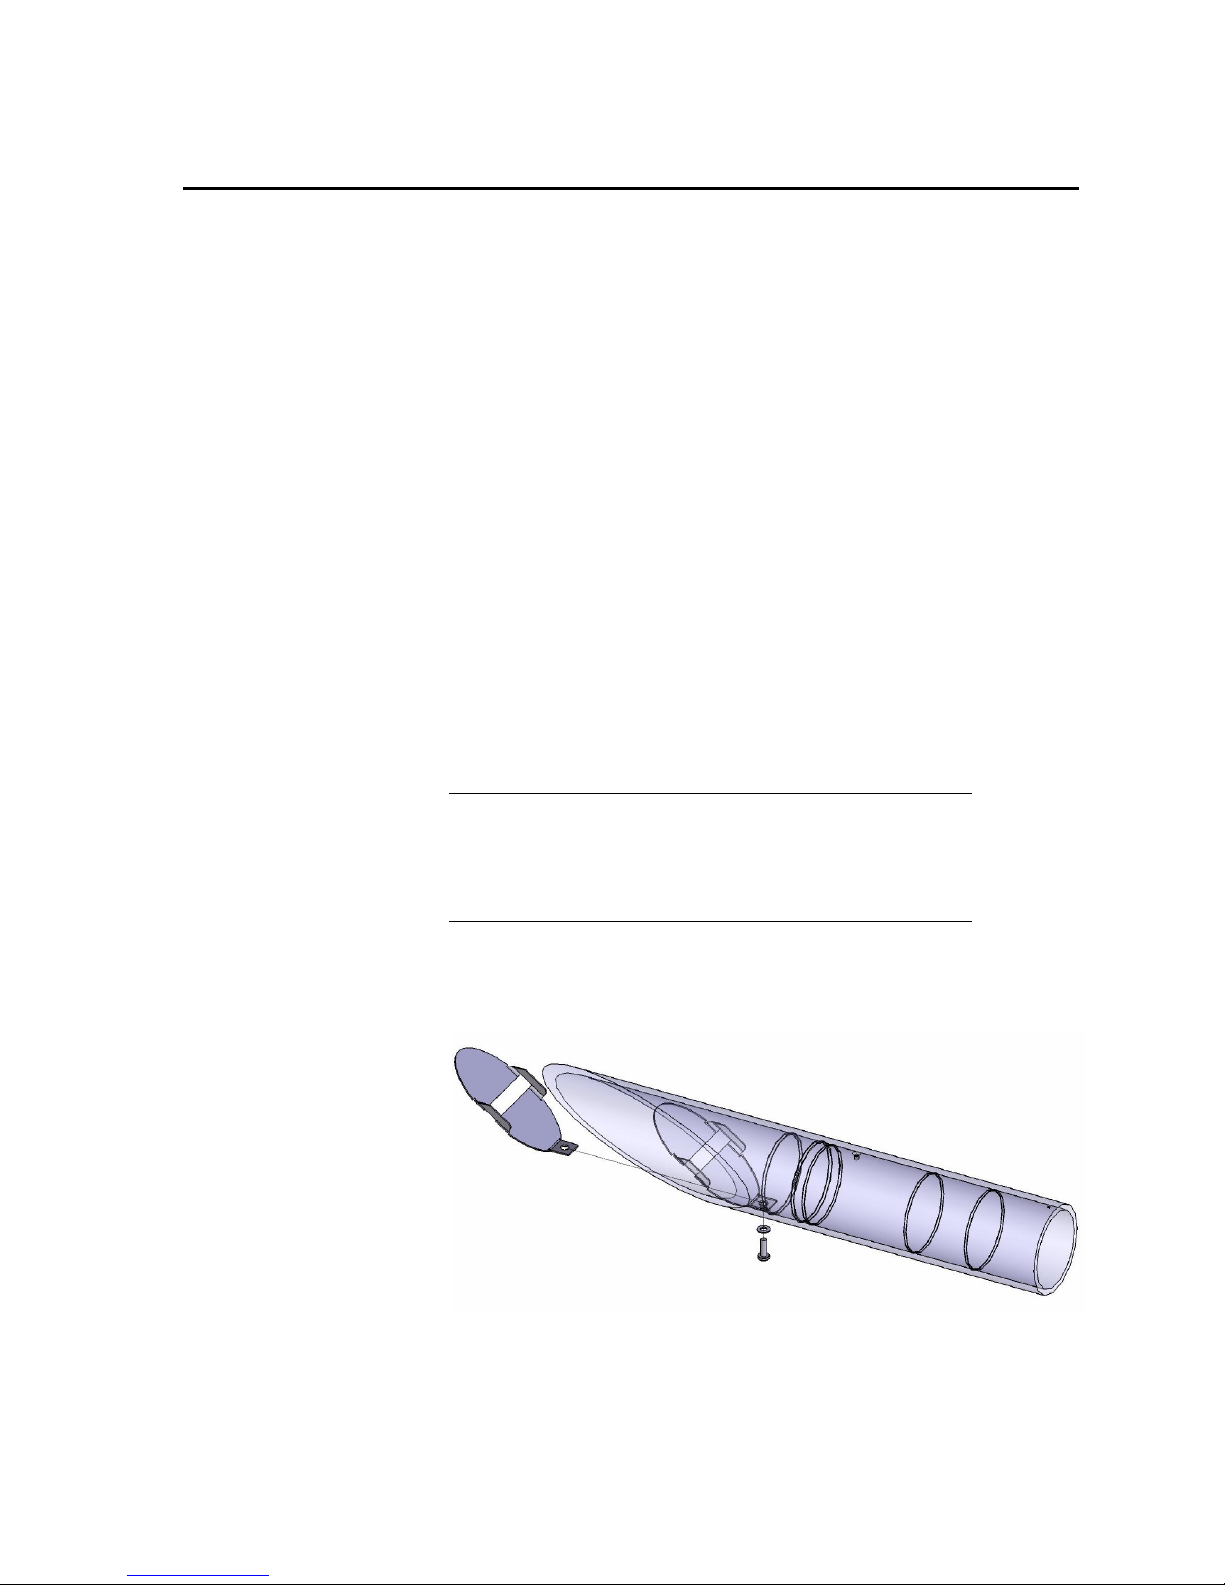
87
Section 6. Maintenance
6.1 General
The PWS100 Present Weather Sensor is a robust instrument that will provide
years of uninterrupted weather monitoring. Calibration of the instrument is carried
out at the factory and can be redone easily on site with the optional calibration kit
or carried out by Campbell Scientific if required. Only general cleaning of the
lenses is required to keep the sensor working efficiently. There are no user
serviceable parts in the optical heads. The plates at the back of the optical heads
are held in place with machine screws that should be torqued to 1 nm and should
not be disturbed.
6.2 Cleaning
Cleaning of the PWS100 will be required from time to time to ensure that the
lenses are free from contaminants. The frequency of required cleaning depends on
the exposure of the instrument to such contaminants. This will vary depending on
the site location. The PWS100 is capable of self-diagnosing dirty lenses and will
indicate in its output when the lenses are contaminated to such a degree that its
particle measurements may be affected.
We suggest 6 monthly intervals for locations not prone to contaminants and
monthly intervals for those prone to contamination (roadside or airport use). In
some cases more frequent cleaning may be required where there are high levels of
contaminants and high dependency on the instrument output.
If the lenses require cleaning, it is very important that only a
proper lens cloth or lens tissue be used. The use of
inappropriate materials to clean the lenses can permanently
damage or reduce the effectiveness of the lenses leading to
errors in measurement of precipitation and visibility.
The baffles in the front of the laser head and lower head housing are easily
removed by unscrewing the retaining screw and carefully removing it, ensuring
that the nylon washer remains with the screw, as shown in Figure 6-1.
Figure 6-1. Baffle removal and fitting
CAUTION
Page 100

PWS100 Present Weather Sensor
88
It is advisable to use air duster to blow any loose dust and dirt from the lenses as a
first step. Using a lint free lens cloth or lens tissue impregnated with a small
amount of isopropyl alcohol solvent clean the lens surface by dragging the cloth
across the lens surface being careful not to apply excessive pressure. Excessive
pressure may lead to some types of contaminant scratching the lens surface. Over
time such scratches can lead to reduced sensor accuracy.
Once clean, replace the baffle by carefully slotting it into position, being careful
not to scratch the paint coating or damage any heater element. Lock the baffle into
place using the retaining screw, ensuring that the nylon washer is in place.
6.3 Calibration
The PWS100 is fully calibrated before leaving the factory. This calibration covers
the mechanical arrangement of the system (including detection volume) as well as
setting laser power and other electronic settings. The system is self-regulating,
however it is recommended that the PWS100 is calibrated every two years.
The detection volume is calibrated using the optional PWS Calibrator PWC100
part no 010441. The particle analysis is done using the unit with a rotating disc
which has an embedded high precision ball lens. The refractive index of this ball
lens is taken into consideration when calibrating the unit. The disc is rotated at a
known speed which provides a known velocity component to the calibration and
the refraction from the known diameter ball lens to the two detectors provides a
size calibration. Visibility calibration is carried out using the second fixture which
comprises a material with known scatter parameters. Light impenetrable sensor
blocks are used to determine sensor offset and will need to be placed in the sensor
heads when required. The unit will then determine the calibration factors and
indicate if there is any problem with the optical or mechanical arrangement of the
present weather sensor. Laser power can be monitored using a commercial laser
power meter.
It is possible to carry out a simple visibility only calibration using the PVISC100
visibiilty calibrator, part number 010443 (included in the PWC100 or purchased
separately). This is described in Section 4.4.3.
Please refer to the PWS Calibrator manual for further details of its operation.
Section 4.4.3 on the menu structure also gives details of how to view and set
various calibration factors.
 Loading...