

Page 1
Page 2
Copyright © 2004 CPO Science
6/04
DataCollector designed by: Dr. Thomas C. Hsu
Thomas S. Narro
David Zucker
in conjunction with: PRI
Darren Garnier
Page 3

Table of Contents
Introduction . . . . . . . . . . . . . . . . . . . . . . . . . . . . . . . . . . . . . . . . . . . . . . . . . . . . . . . . 1
Overview . . . . . . . . . . . . . . . . . . . . . . . . . . . . . . . . . . . . . . . . . . . . . . . . . . . . . . . . . . . . . . 1
Kit Contents . . . . . . . . . . . . . . . . . . . . . . . . . . . . . . . . . . . . . . . . . . . . . . . . . . . . . . . . 5
Warnings and Precautions . . . . . . . . . . . . . . . . . . . . . . . . . . . . . . . . . . . . . . . . . . . . 6
Getting Started . . . . . . . . . . . . . . . . . . . . . . . . . . . . . . . . . . . . . . . . . . . . . . . . . . . . . 7
Features of the DataCollector . . . . . . . . . . . . . . . . . . . . . . . . . . . . . . . . . . . . . . . . . . . . . 7
Connecting the Zire Handheld . . . . . . . . . . . . . . . . . . . . . . . . . . . . . . . . . . . . . . . . . . . . . 7
Powering the DataCollector . . . . . . . . . . . . . . . . . . . . . . . . . . . . . . . . . . . . . . . . . . . . . . . 8
Connecting CPO Science Photogates . . . . . . . . . . . . . . . . . . . . . . . . . . . . . . . . . . . . . . . . 9
Connecting Other Probes & Adapters . . . . . . . . . . . . . . . . . . . . . . . . . . . . . . . . . . . . . . . 9
Setting up a Computer for use with the DataCollector . . . . . . . . . . . . . . . . . . . . . . . . . 10
Using the DataCollector . . . . . . . . . . . . . . . . . . . . . . . . . . . . . . . . . . . . . . . . . . . . . 11
Using the Zire Handheld . . . . . . . . . . . . . . . . . . . . . . . . . . . . . . . . . . . . . . . . . . . . . . . . . 11
Starting the DataCollector Application . . . . . . . . . . . . . . . . . . . . . . . . . . . . . . . . . . . . . . 11
Setting Up a New Experiment . . . . . . . . . . . . . . . . . . . . . . . . . . . . . . . . . . . . . . . . . . . . . 13
Navigating within the DataCollector Application . . . . . . . . . . . . . . . . . . . . . . . . . . . . . . 18
Application Menus . . . . . . . . . . . . . . . . . . . . . . . . . . . . . . . . . . . . . . . . . . . . . . . . . . . . . . 24
Downloading Data to a Computer . . . . . . . . . . . . . . . . . . . . . . . . . . . . . . . . . . . . 26
Mac OS 9.x and Mac OS X . . . . . . . . . . . . . . . . . . . . . . . . . . . . . . . . . . . . . . . . . . . . . . . 26
Windows . . . . . . . . . . . . . . . . . . . . . . . . . . . . . . . . . . . . . . . . . . . . . . . . . . . . . . . . . . . . . 26
Technical Information . . . . . . . . . . . . . . . . . . . . . . . . . . . . . . . . . . . . . . . . . . . . . . . 28
Analog Sensor Pinout . . . . . . . . . . . . . . . . . . . . . . . . . . . . . . . . . . . . . . . . . . . . . . . . . . . . 28
Digital Sensor Pinout . . . . . . . . . . . . . . . . . . . . . . . . . . . . . . . . . . . . . . . . . . . . . . . . . . . . 29
Accessory Information . . . . . . . . . . . . . . . . . . . . . . . . . . . . . . . . . . . . . . . . . . . . . . . . . . . 30
Software Updates and Website Information . . . . . . . . . . . . . . . . . . . . . . . . . . . . . . . . . 30
Glossary . . . . . . . . . . . . . . . . . . . . . . . . . . . . . . . . . . . . . . . . . . . . . . . . . . . . . . . . . . 31
Page 4

Page 5

1
DATACOLLECTOR HANDHELD USER’S GUIDE
Chapter 1: Introduction
The CPO Science DataCollector is a device used to view and record data from
various sensors, including analog sensors from Fourier Systems and Vernier, as
well as photogates from CPO Science.
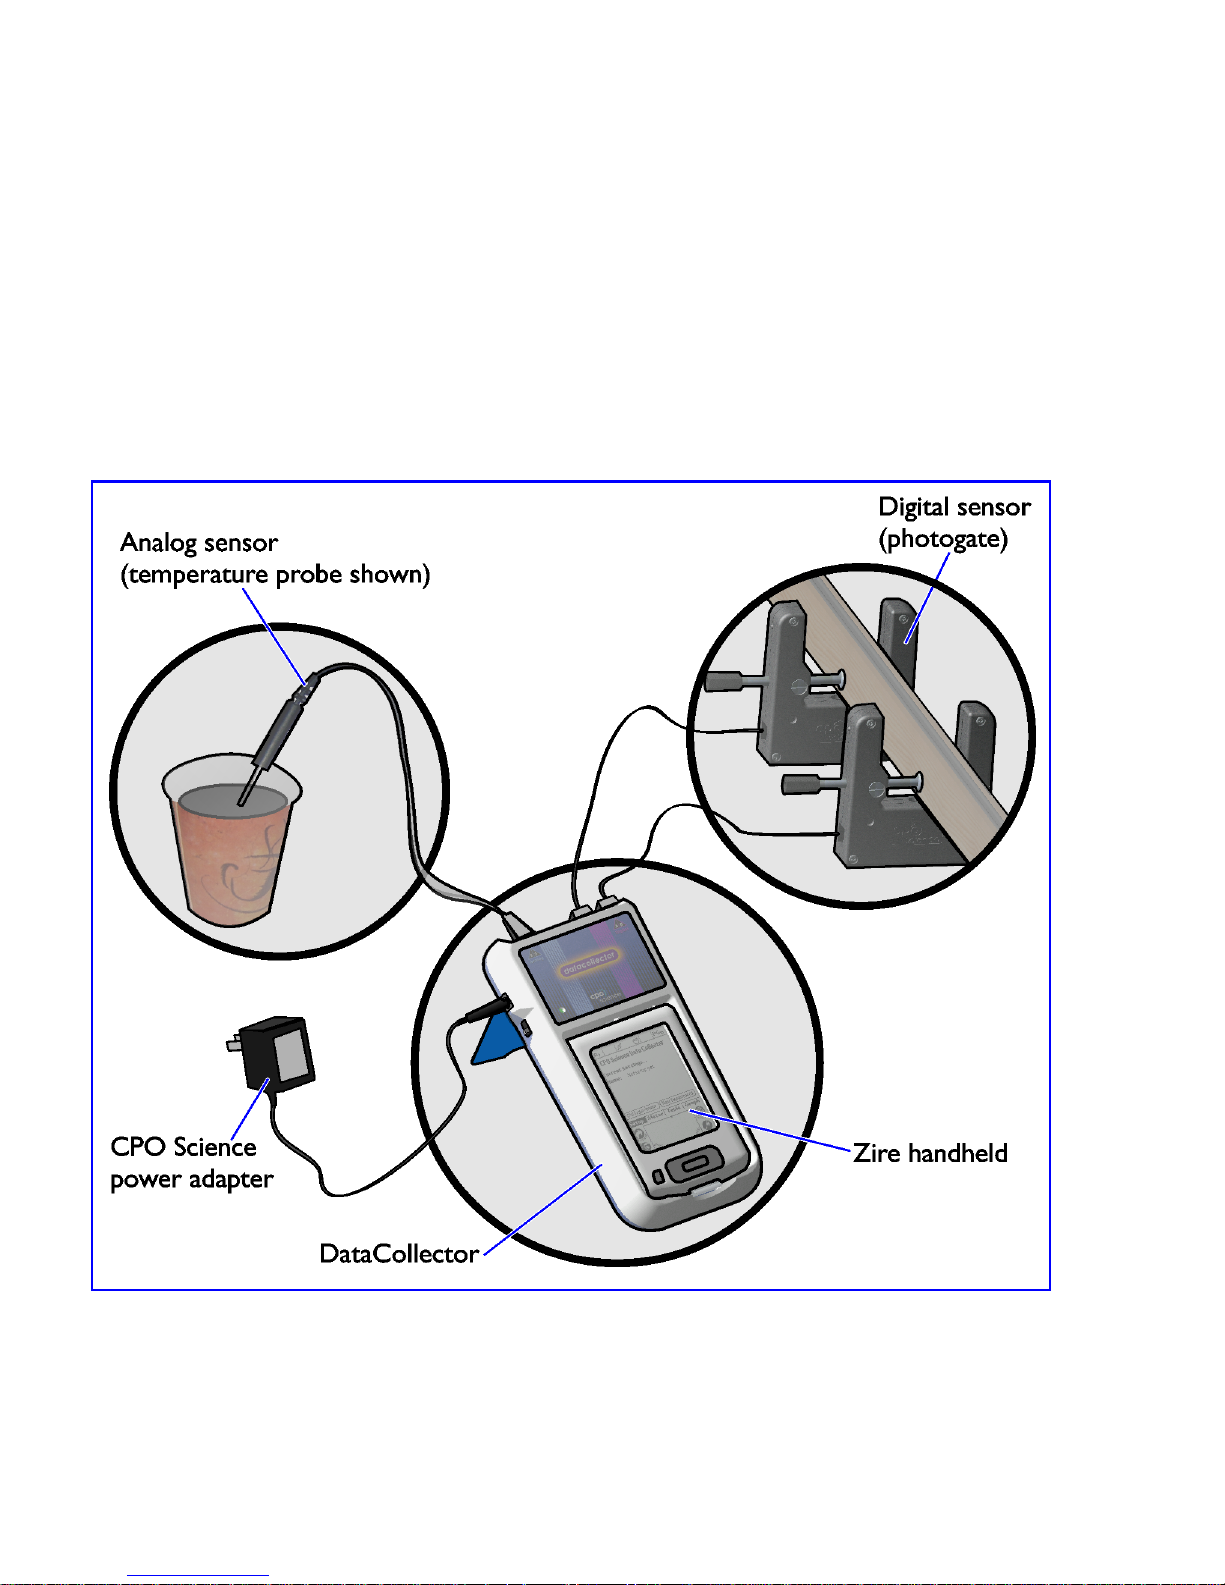
The DataCollector consists of a palmOne Zire™1 handheld computer, and a “sled”
(referred to in this manual as “the hardware”) into which the handheld fits. Sensors
plug in to the hardware. See Figure 1 on page 2.
Once data has been collected, it can be analyzed in graph or table form on the
handheld computer, or transferred to a PC (via the Palm HotSync Utility and the
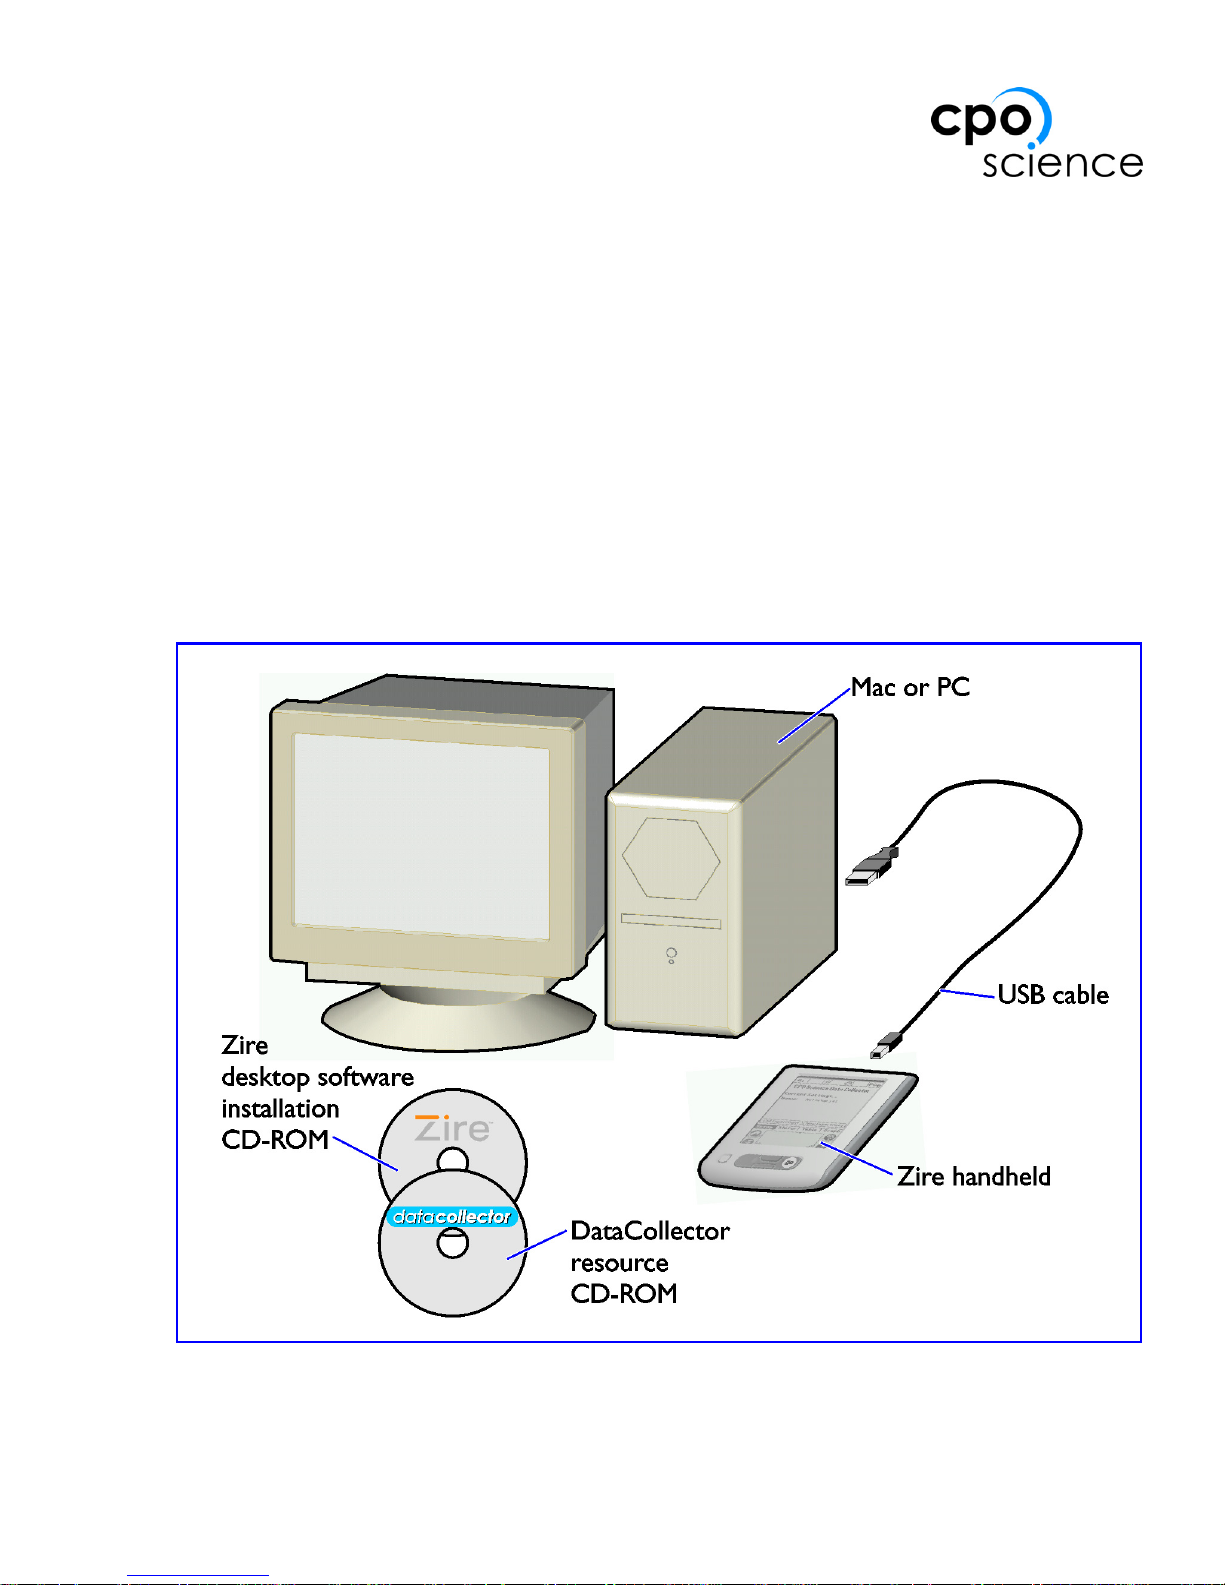
DataCollector Conduit included with your kit) for further analysis. See Figure 2 on
page 3.
Overview
Several components are involved in collecting and analyzing data with the CPO
Science DataCollector. They can be grouped according to two primary activities:
collecting data on the DataCollector and transferring data to and from the computer.
Collecting Data
Using software running on the Zire handheld, data are recorded in tabular form.
During an experiment you can:
• start and stop data collection
• view live data
• view a live graph of the data
• view the experiment name and details
1. Zire is a trademark of palmOne, Inc.
Page 6
2
Figure 1 shows the components used to collect data. They are:
• the DataCollector hardware
• the Zire handheld computer
• the CPO Science AC adapter
• analog sensors (a temperature sensor is shown)
• digital sensors (CPO Science photogates are shown)
See Table 2 on page 5 for a list of kit configurations.
Figure 1: Data Collection Components
Page 7
3
DATACOLLECTOR HANDHELD USER’S GUIDE
Transferring and Analyzing Data
Figure 2 shows the components used to transfer and analyze data. They are:
• the Zire handheld computer
• the USB synchronization cable
• a Mac or Windows-based PC
• the HotSync Manager software
• the CPO Science DataCollector conduit software
After completing an experiment, the data can be transferred to a personal computer
for further analysis and manipulation. Each experiment from the Zire handheld is
saved on the PC as a comma separated value (CSV) file, readable by Microsoft
Excel, Mathworks Matlab, and many other programs.
Figure 2: Synchronization Components
Page 8
4
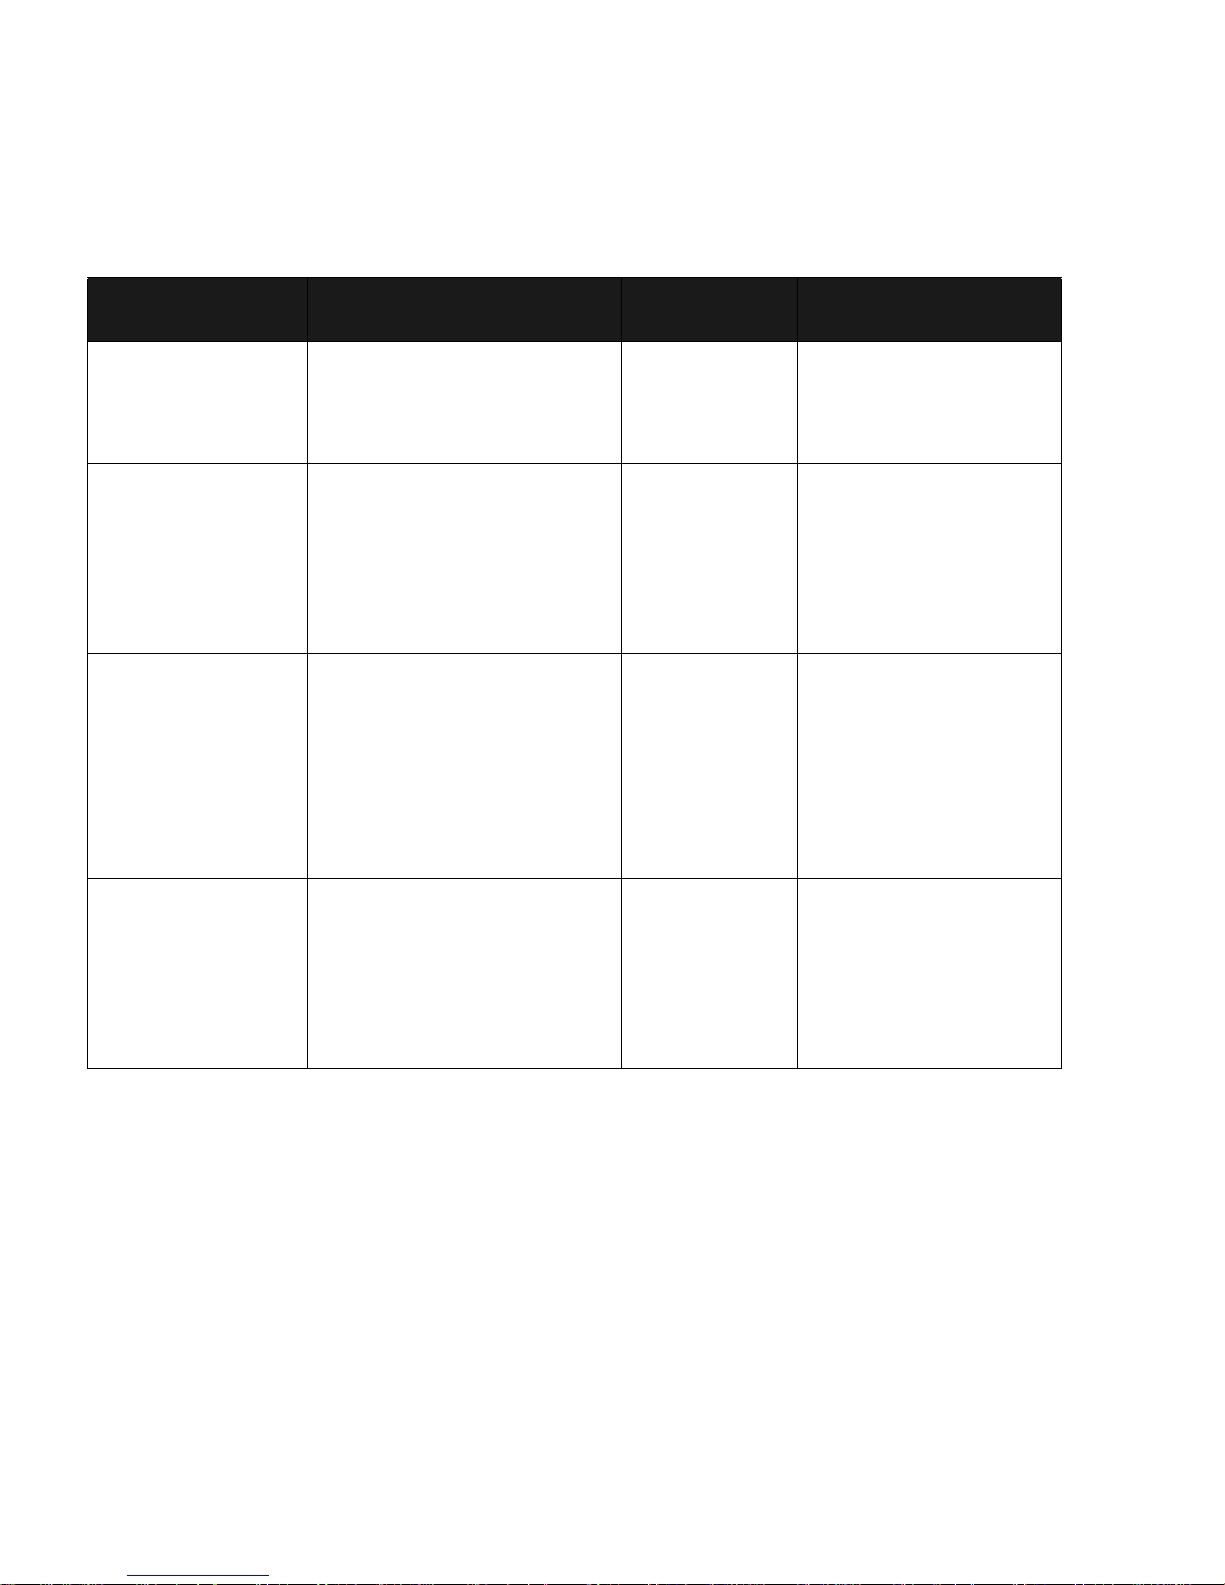
Table 1 lists the software components involved in the transfer and analysis process.
Table 1: Software Components
Software Purpose Runs on... Source
DataCollector
App
Records data from
sensors and presents
graphs and tables
Zire
Handheld
DataCollector
Resource CD-ROM
or Support Website
HotSync
Manager
Performs HotSync operation between Zire
handheld and desktop
computer through USB
cable
Desktop
Computer
Zire Desktop
Software CD-ROM
DataCollector
Conduit
Transfers experimental
data from Zire handheld
to desktop computer as
part of a HotSync operation
Desktop
Computer,
in conjunction with
HotSync
Manager
DataCollector
Resource CD-ROM
or Support Website
Data Analysis
Software (such
as Microsoft
Excel or
Matlab)
Further analyze experimental data using more
sophisticated graphical
or statistical methods
Desktop
Computer
Independent Software Vendor (not
supplied with
DataCollector)
Page 9
5
DATACOLLECTOR HANDHELD USER’S GUIDE
Chapter 2: Kit Contents
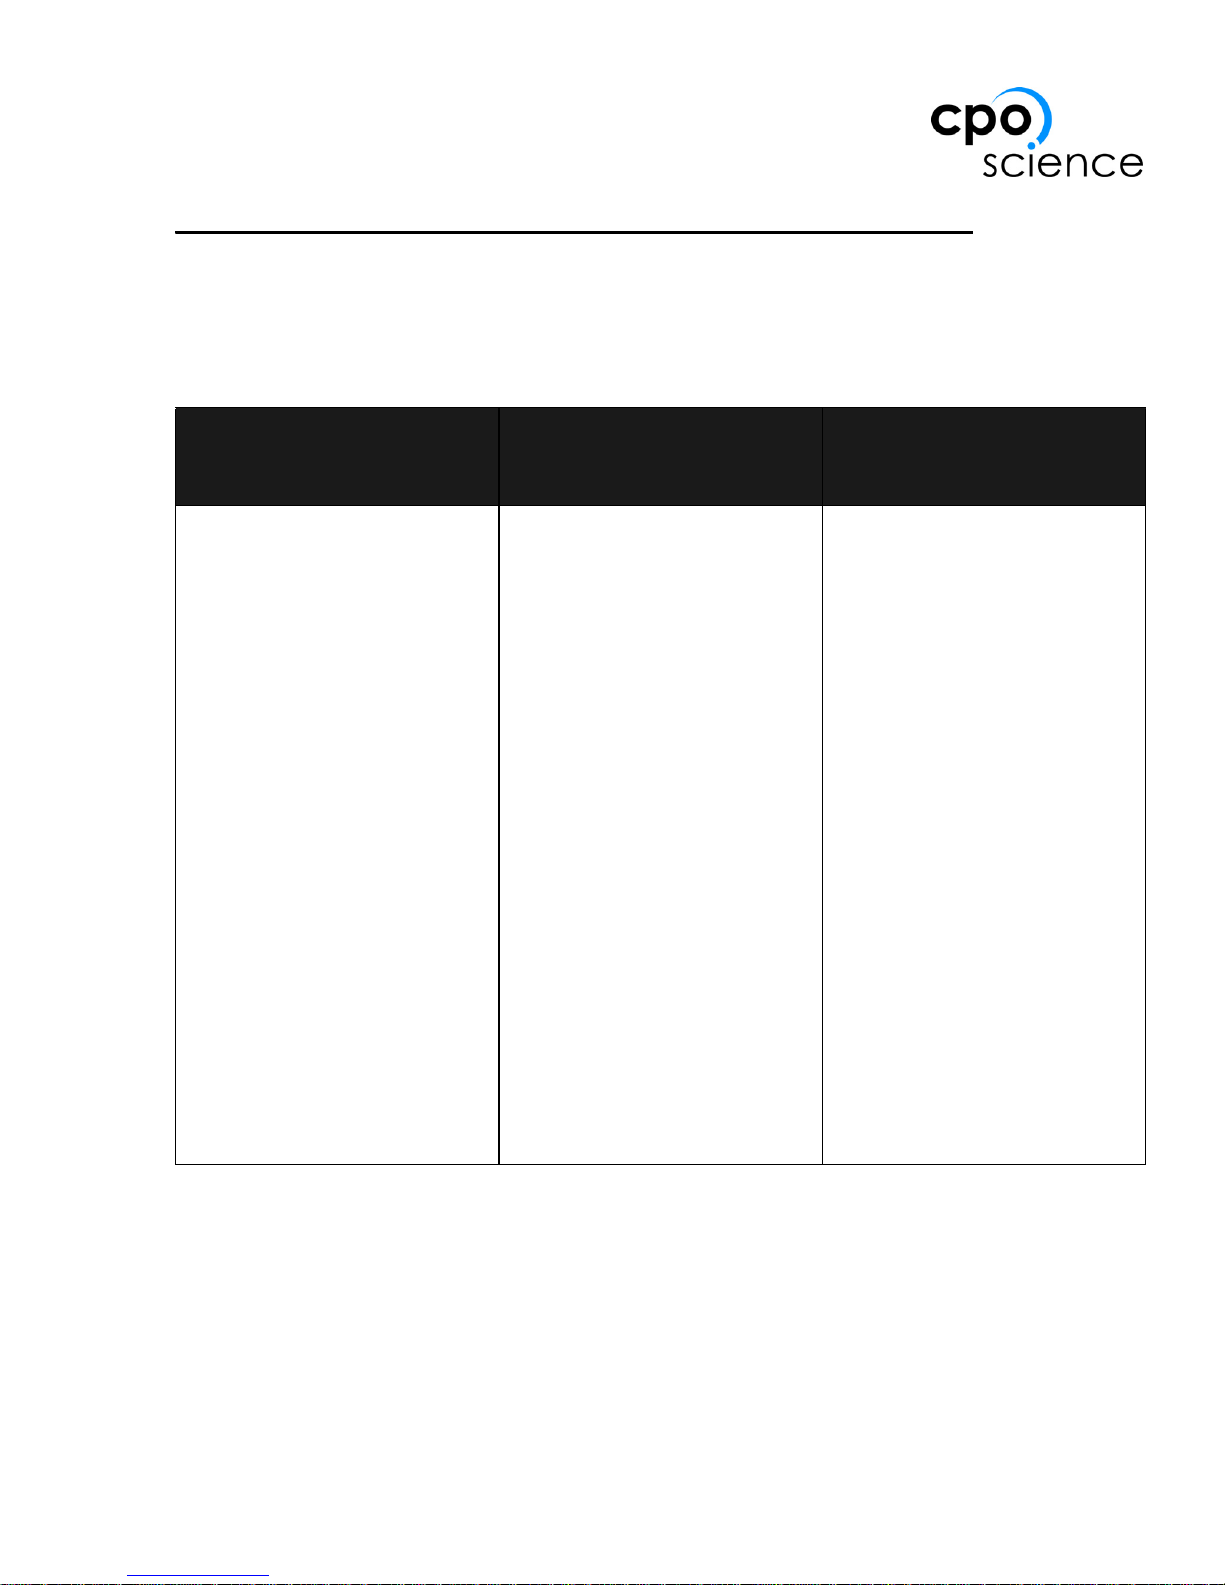
There are three different configurations of the DataCollector available. These are
summarized in Table 2 below.
Table 2: DataCollector Kits
DataCollector
Solo
DataCollector
Standard Kit
DataCollector
Starter Kit
Part #792-1500
Includes:
• 1 AC adapter
• 1 User's Guide
• 1 DataCollector
Software CD-ROM
Part #792-1503
Includes:
• 1 Hard carrying case
• 1 DataCollector Unit
• 1 AC adapter
• 1 User's Guide
• 1 Software CD-ROM
• 1 Zire handheld
• 1 Zire accessory pack
(Palm AC adapter,
software CD-ROM,
HotSync cable, etc.)
Part #792-1505
Includes:
• 1 Hard carrying case
• 1 DataCollector Unit
• 1 AC adapter
• 1 User's Guide
• 1 Software CD-ROM
• 1 Zire handheld
• 1 Zire accessory pack
(Palm AC adapter,
software CD-ROM,
HotSync cable, etc.)
• 2 CPO Science
Photogates
• 2 Telephone Cords
• 1 Voltage Probe
Page 10
6
Chapter 3: Warnings and Precautions
Please make note of the following warnings and precautions. Failure to follow
these guidelines can result in damage to your DataCollector and possibly bodily
harm.
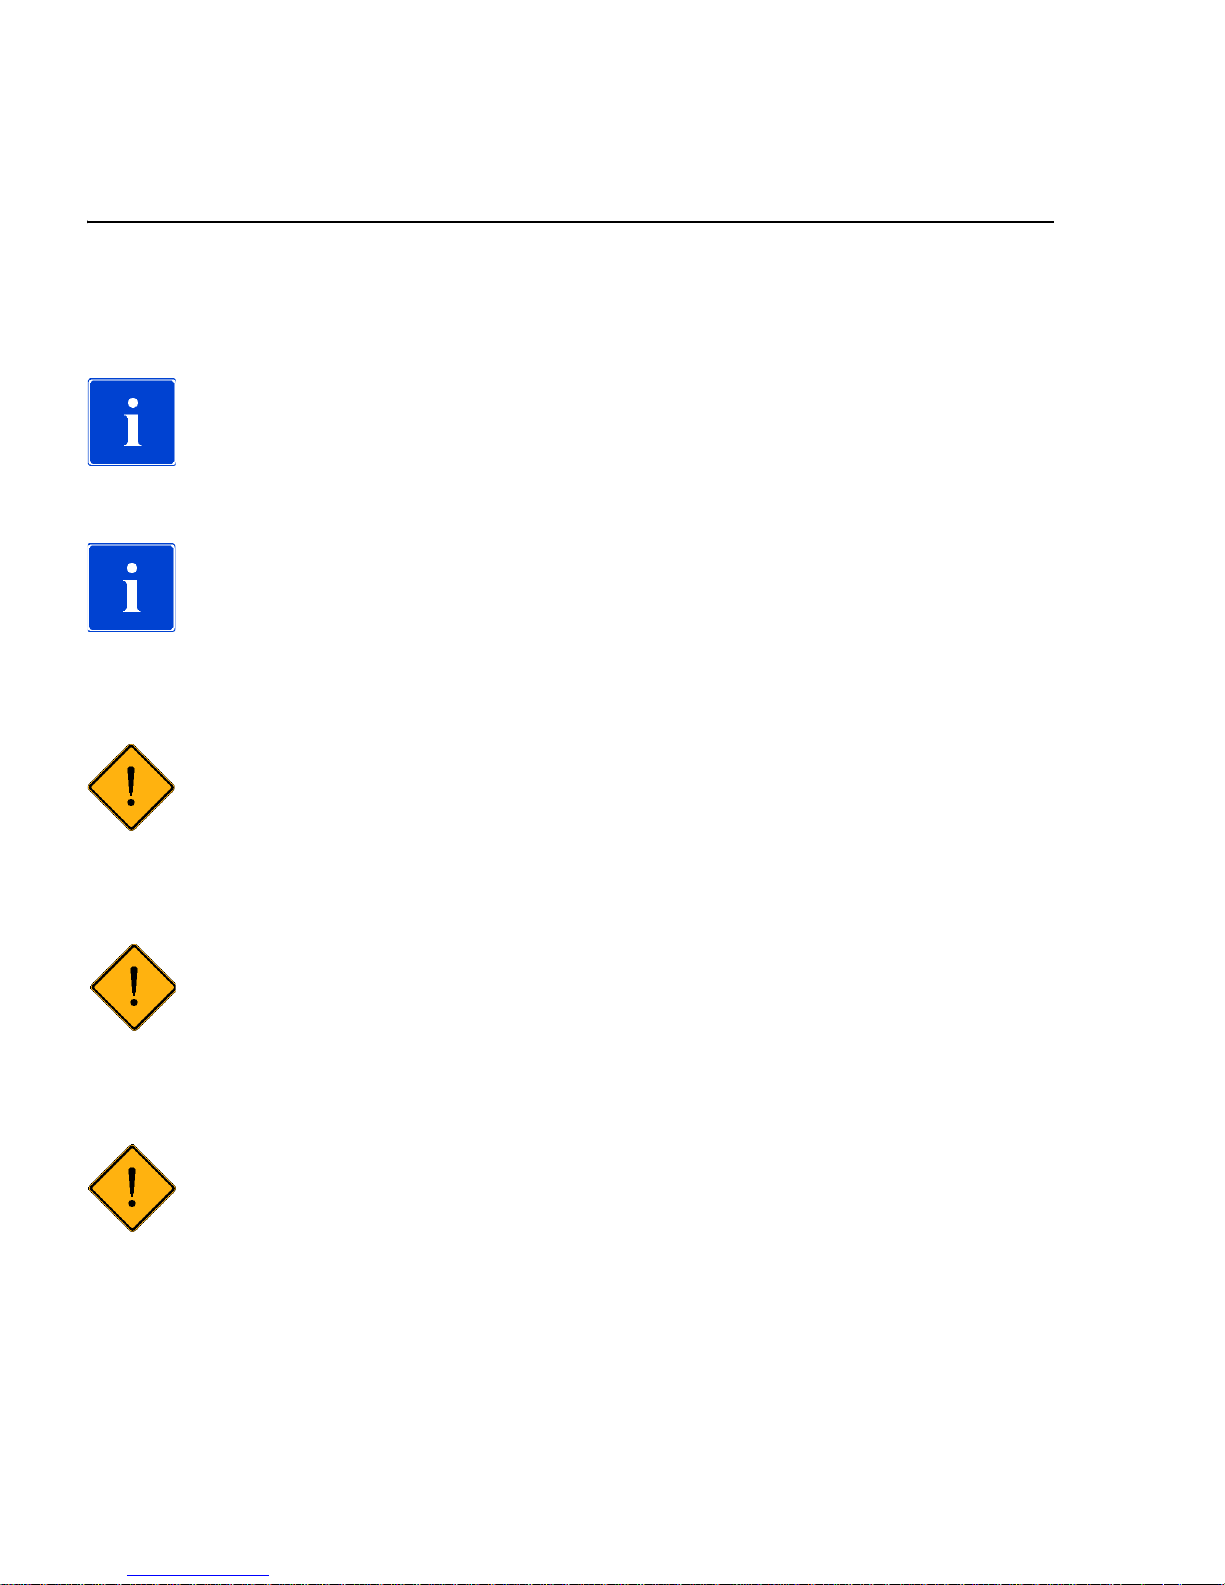
IMPORTANT: The AC adapter that comes with the Zire handheld
will not work with the DataCollector. Use only the 9V DC adapter
with the DataCollector that has the CPO Science name/logo on it.
IMPORTANT: Do not over-tighten the thumbscrew on the
photogates. Over-tightening can flex the body of the photogate
enough that the light emitter and receiver twist out of alignment,
causing the photogate to malfunction.
WARNING: Do not plug any lines from the telephone system in to
the DataCollector’s Analog or Digital ports. Telephone rings (also
present with modems) generate large voltages that can damage or
destroy the DataCollector.
WARNING: Computer data cables have the same (RJ-11) connectors and look like the telephone cords used with photogates, but
are wired differently inside. Using a data cable will ruin the
photogates.
WARNING: When using the DataCollector, be sure not to exceed
the specifications on the voltage, current or other sensor(s) being
used. This can damage the sensor or cause serious injuries.
Page 11
7
DATACOLLECTOR HANDHELD USER’S GUIDE
Chapter 4: Getting Started
Use the following diagrams and information to familiarize yourself with the CPO
Science DataCollector.
Features of the DataCollector
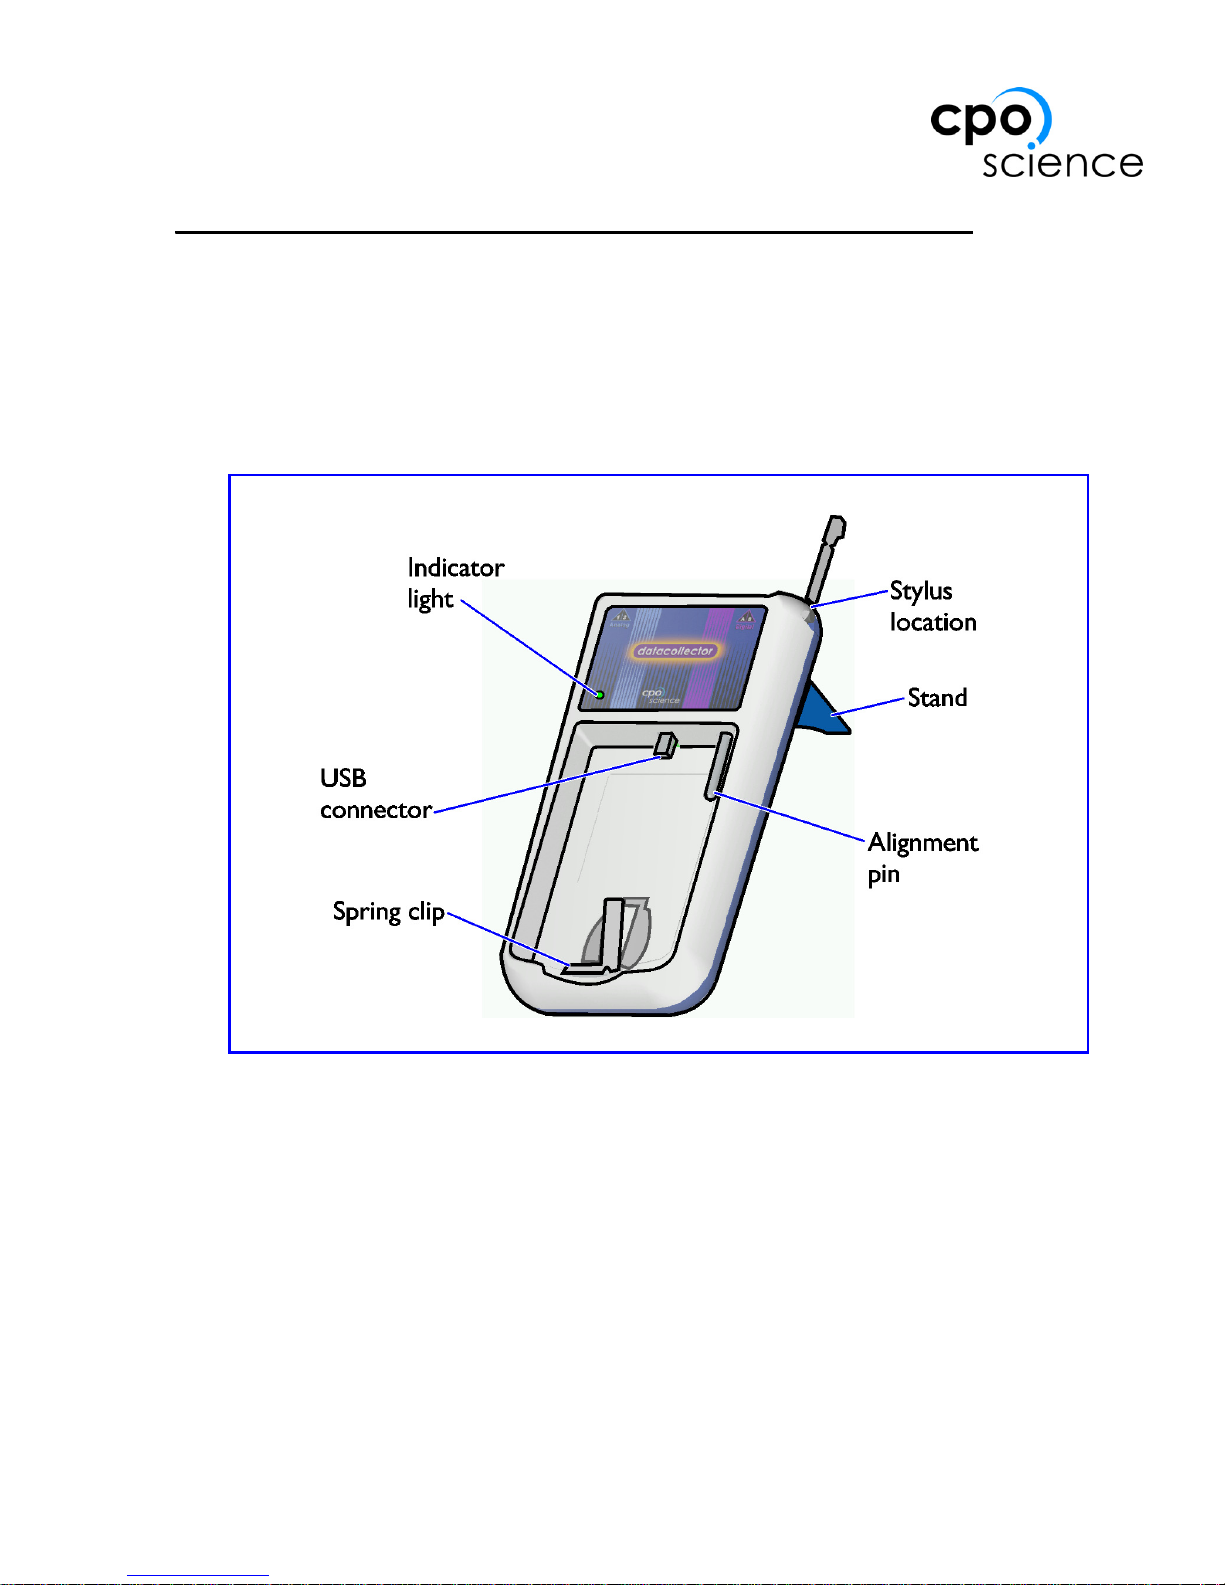
Figure 3 shows the components of the DataCollector hardware.
Figure 3: DataCollector Parts and Features
Connecting the Zire Handheld
To replace the handheld in the hardware, slide it on to the alignment pin and USB
connector, and then gently press the Zire handheld down until it snaps in place.
Avoid pressing any of the buttons.
To remove the Zire handheld from the DataCollector, gently pull back on the
spring clip until the handheld pops up. Then, gently slide it off the alignment pin
and USB connector.
Page 12
8
Powering the DataCollector
Use only the provided 9V DC, 500 mA CPO Science adapter with the DataCollector. After connecting the adapter to the power jack on the DataCollector, slide the
power switch down. The indicator should light up red.
The Zire handheld’s battery will charge when connected to a DataCollector that is
powered - the indicator must be lit for the handheld to charge.
Zire Battery Life
If you purchased a DataCollector kit with a Zire handheld, the power adapter for
the Zire handheld was included. If you purchased your Zire handheld on your own,
be sure to keep the adapter that came with it. This adapter is labelled “Palm”.
If you don’t use the Zire handheld (with or without the DataCollector hardware)
for several weeks, the battery may become run down. If this happens, and the Zire
handheld will not turn on, remove it from the DataCollector hardware and plug it
in to the Palm adapter for several hours.
Depending on how long the Zire handheld’s battery was dead, you may need to reinstall the DataCollector software. Follow the directions on the CD-ROM that
came with the DataCollector, or visit http://support.cpo.com for more information.
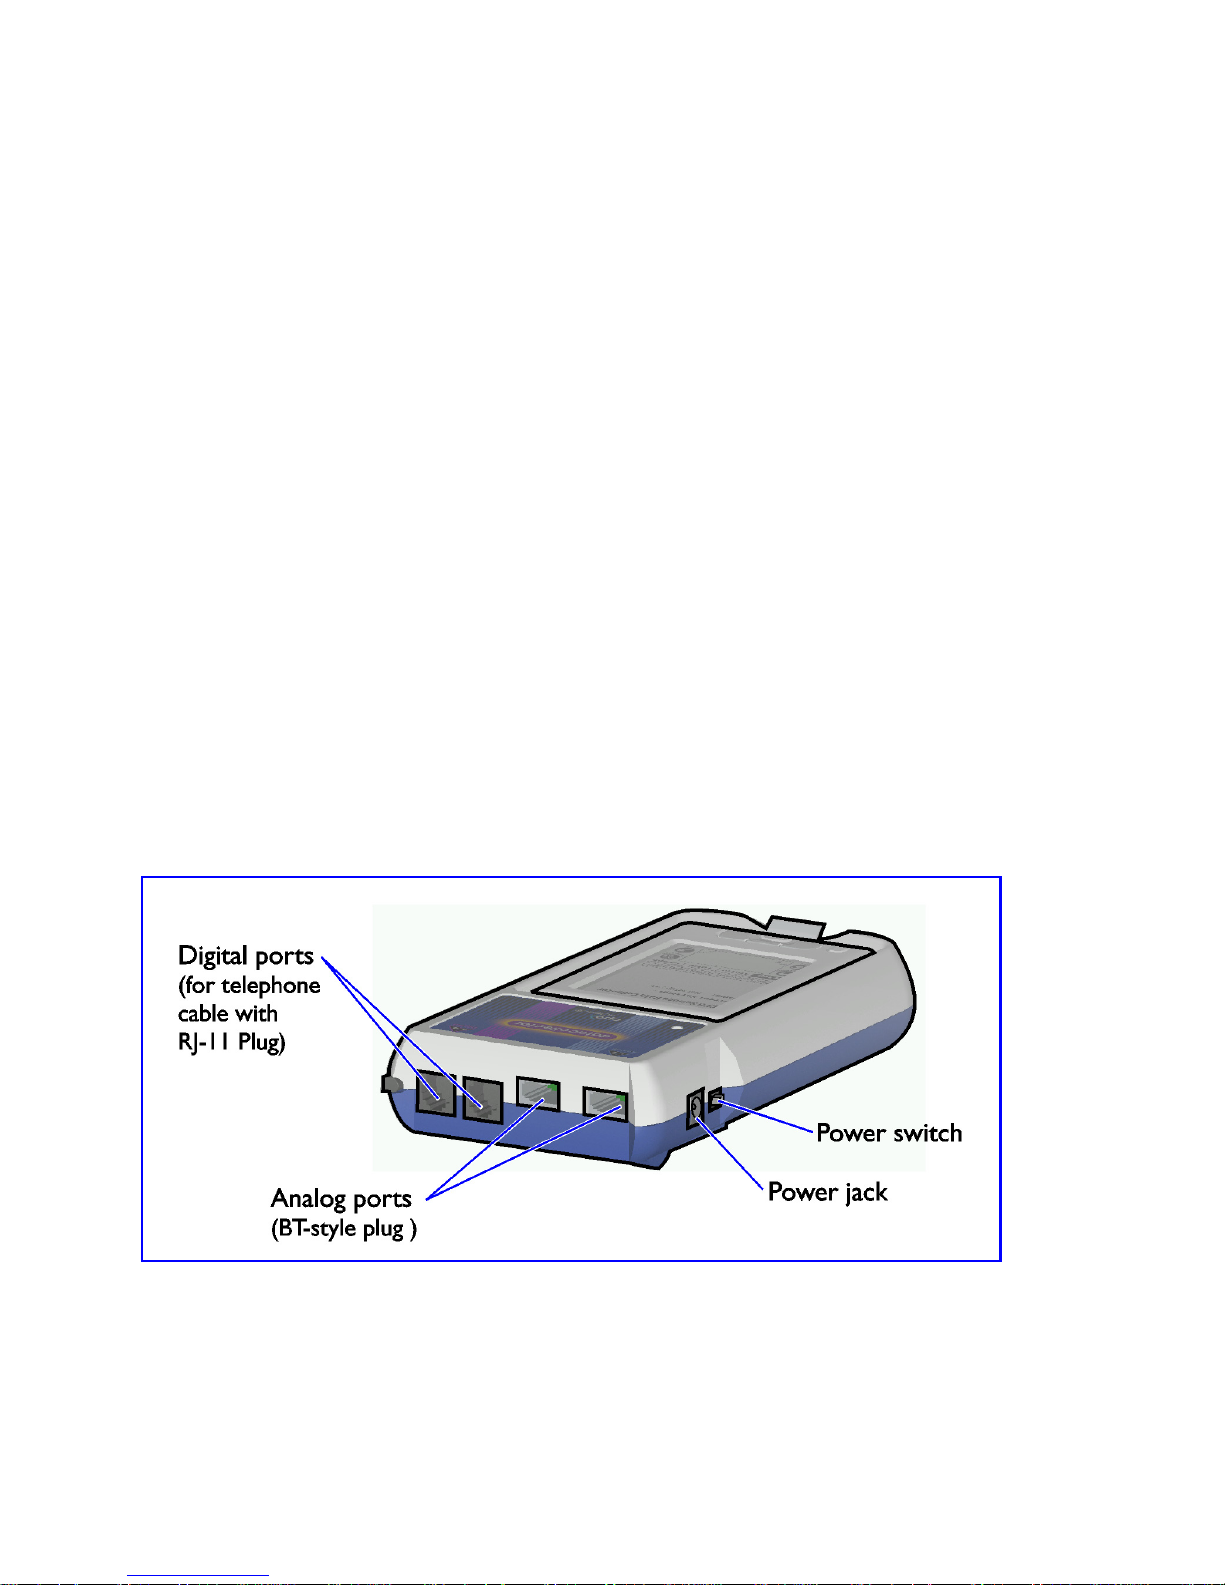
Figure 4: DataCollector Port Identification
Page 13
9
DATACOLLECTOR HANDHELD USER’S GUIDE
Connecting CPO Science Photogates
Connect CPO Science Photogates to either or both of the digital ports (shown in
Figure 4) with the telephone cords. These are the same cords and photogates used
with the CPO Science Timer.
Connecting Other Probes & Adapters
Fourier Probeware
Fourier Systems sensors can be used with the CPO Science DataCollector using
the Fourier Sensor Adapter (CPO Science Part #392-1511).
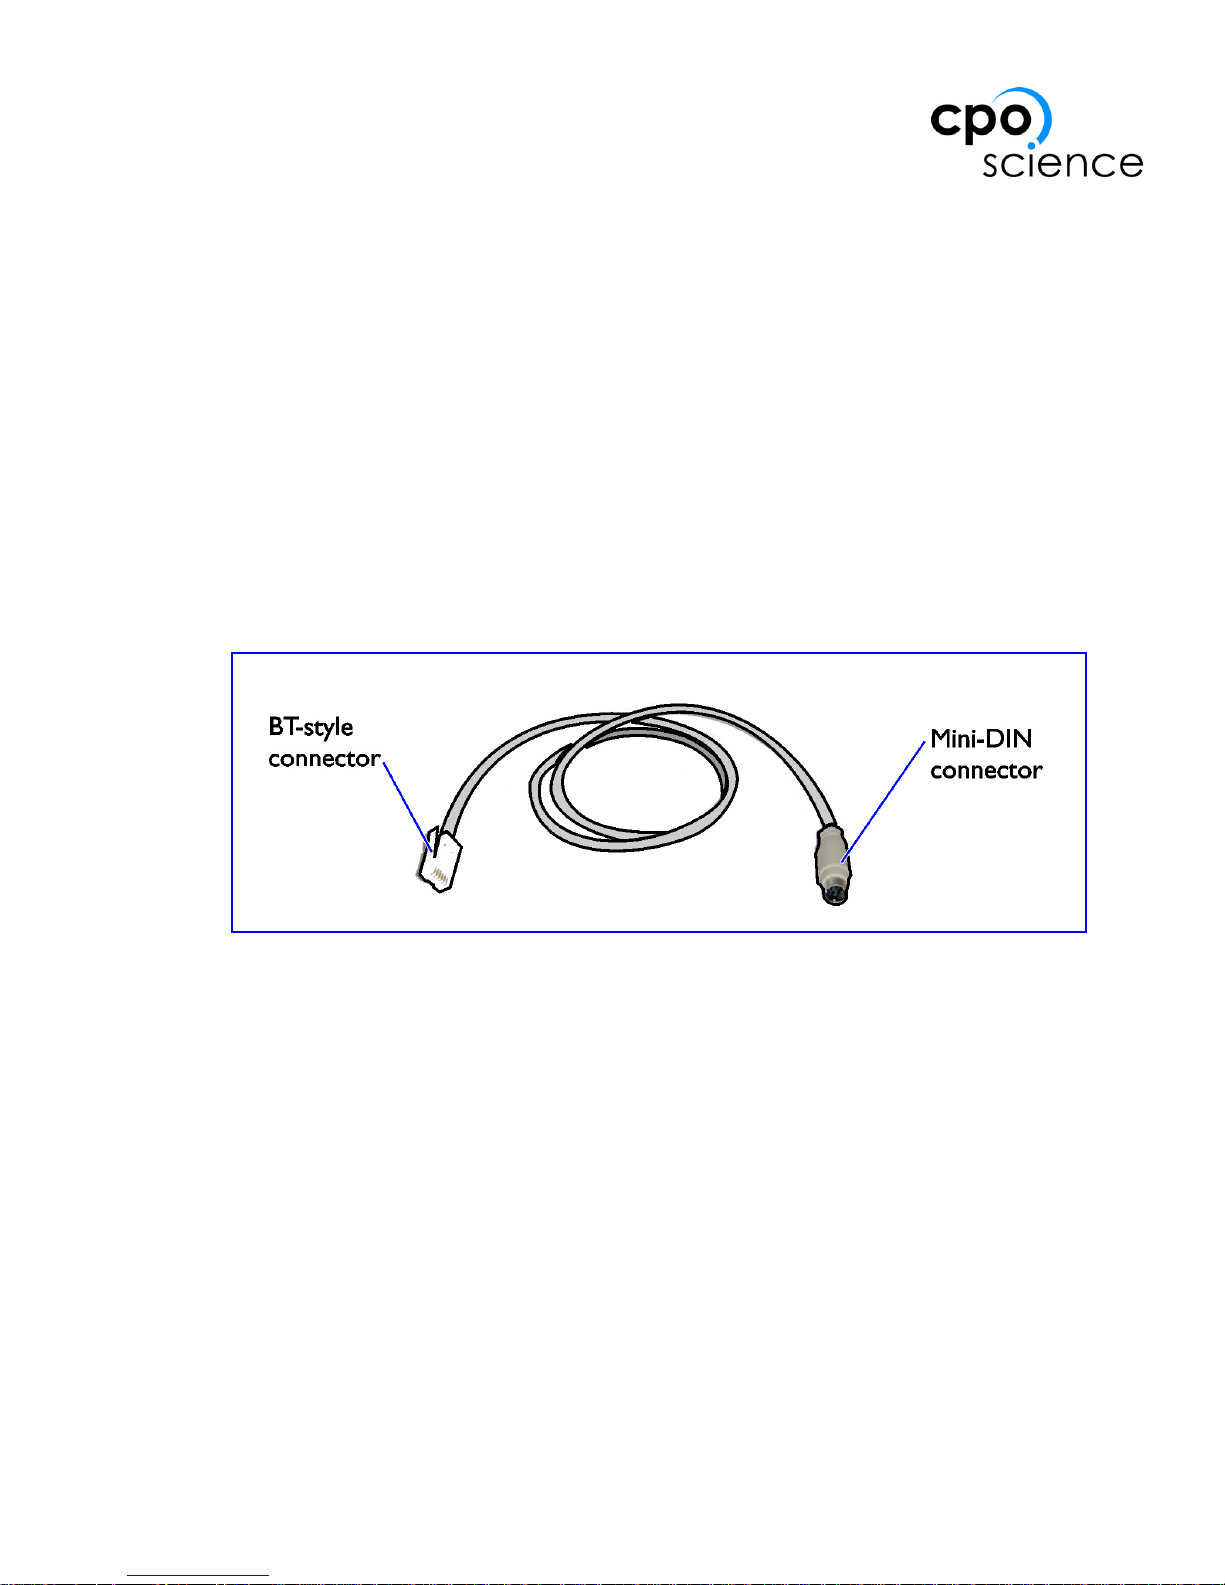
Connect the British Telecom end of the cable to either of the analog ports on the
DataCollector and the 8 pin mini-DIN end of the cable to a Fourier sensor.
Figure 5: Fourier Sensor Adapter
Vernier Probeware
Most Vernier probes with right-handed British Telecom connectors (Vernier part
numbers that end in -BTA) are supported. Plug these probes in to the analog ports
of the DataCollector, shown in Figure 4.
Pasco Probeware
Currently, most Pasco probeware is not supported. Check the CPO Science
DataCollector website for updates and adapter information.
Page 14

10
Other Photogates
To use Fourier, Vernier, or Pasco photogates with the CPO Science DataCollector,
use the adapter to be released late 2004 (CPO Science Part #392-1513). No adapter
is necessary to use CPO Science Photogates with the DataCollector.
Setting up a Computer for use with the DataCollector
CPO Science provides software that enables you to download experimental data
from the Palm Zire handheld to your personal computer. This software, called the
DataCollector Conduit, is included with each kit on the DataCollector Resource
CD-ROM.
Currently, the conduit is supported on PC's running the Microsoft Windows operating system (Windows 98, Windows NT, Windows 2000 or Windows XP) and
computers running Mac OS 9.1 and above.
The DataCollector Conduit relies on the Palm HotSync Manager, and can only be
installed after the HotSync Manager software is set up. For help with HotSync
Manager installation, refer to the documentation that came with your Zire handheld or Palm's technical support website: http://www.palmone.com/us/support/
IMPORTANT: The HotSync Manager Software must be
installed before you install the DataCollector Conduit.
Windows 98/NT/2000/XP Installation
Once you have installed the HotSync Manager software, insert the CPO Science
DataCollector Resource CD-ROM and follow the instructions that appear on your
screen to install the conduit. If the instructions do not automatically appear,
double-click on the My Computer icon on your desktop, then on the CPO Science
DataCollector CD-ROM icon, and then on the Setup Information.html icon.
Mac Installation
After installing the HotSync Manager and Palm Desktop software on your computer, insert the CPO Science Resource CD-ROM. Double-click on the CD-ROM
icon on your desktop when it appears, and then open the document called
Setup Information.html. Follow the instructions on your screen to install the
conduit.
Page 15
11
DATACOLLECTOR HANDHELD USER’S GUIDE
Chapter 5: Using the DataCollector
Using the Zire Handheld
A good way to familiarize yourself with the Zire interface is through the manual
included on the CD-ROM that came with your handheld. Specifically, Chapter 2,
titled “Exploring Your Handheld,” covers basic operations such as starting applications, tapping on buttons and menu items, and entering text.
IMPORTANT: This guide assumes you are familiar with the
basics of using the Zire handheld.
Starting the DataCollector Application
After powering on the DataCollector hardware as described in the section
“Powering the DataCollector” on page 8, start the DataCollector application on the
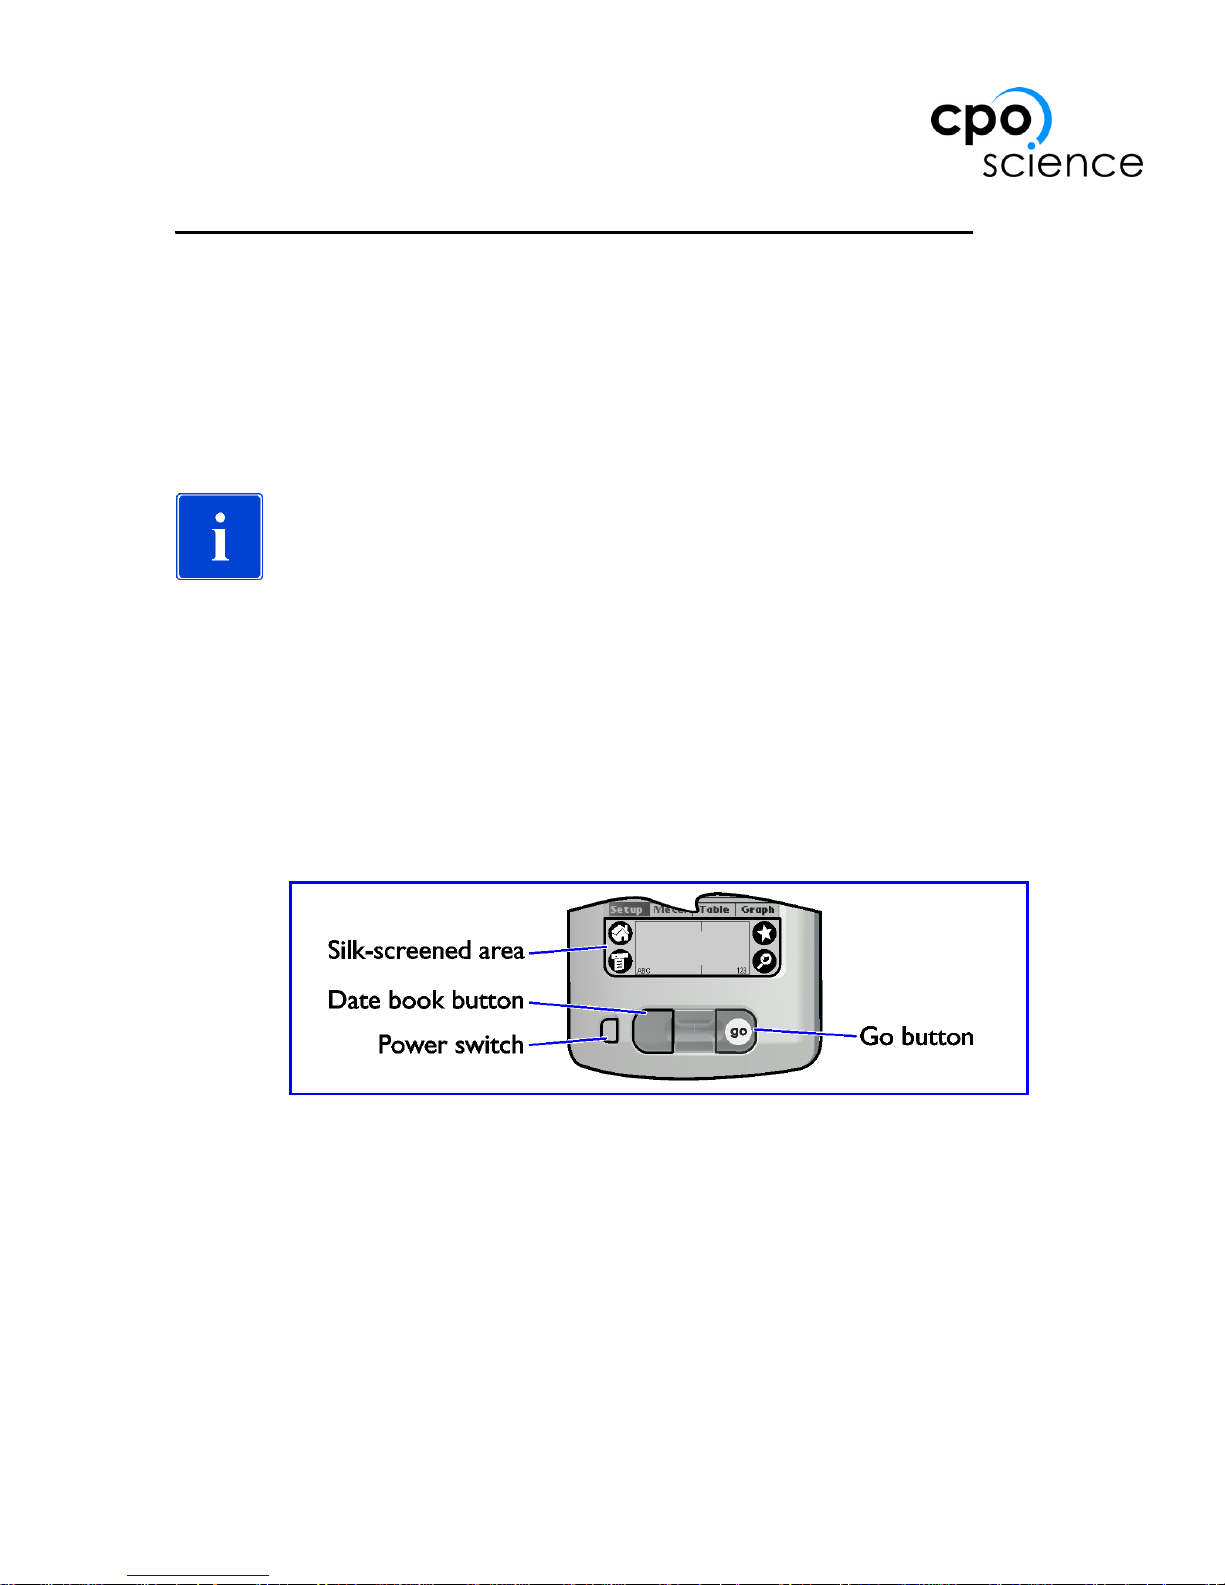
handheld by pressing the Go button (also referred to in the Zire manual as the
“Address Book” button). If you purchased the Zire handheld through
CPO Science, a Go sticker was placed on the correct button.
Figure 6: The Zire Buttons and Silk-Screened Area
Another way to start the DataCollector app is to tap the Home icon and find the
DataCollector app in the list. Then, tap on the DataCollector icon to start the application.
After starting up, the DataCollector app will attempt to communicate with the
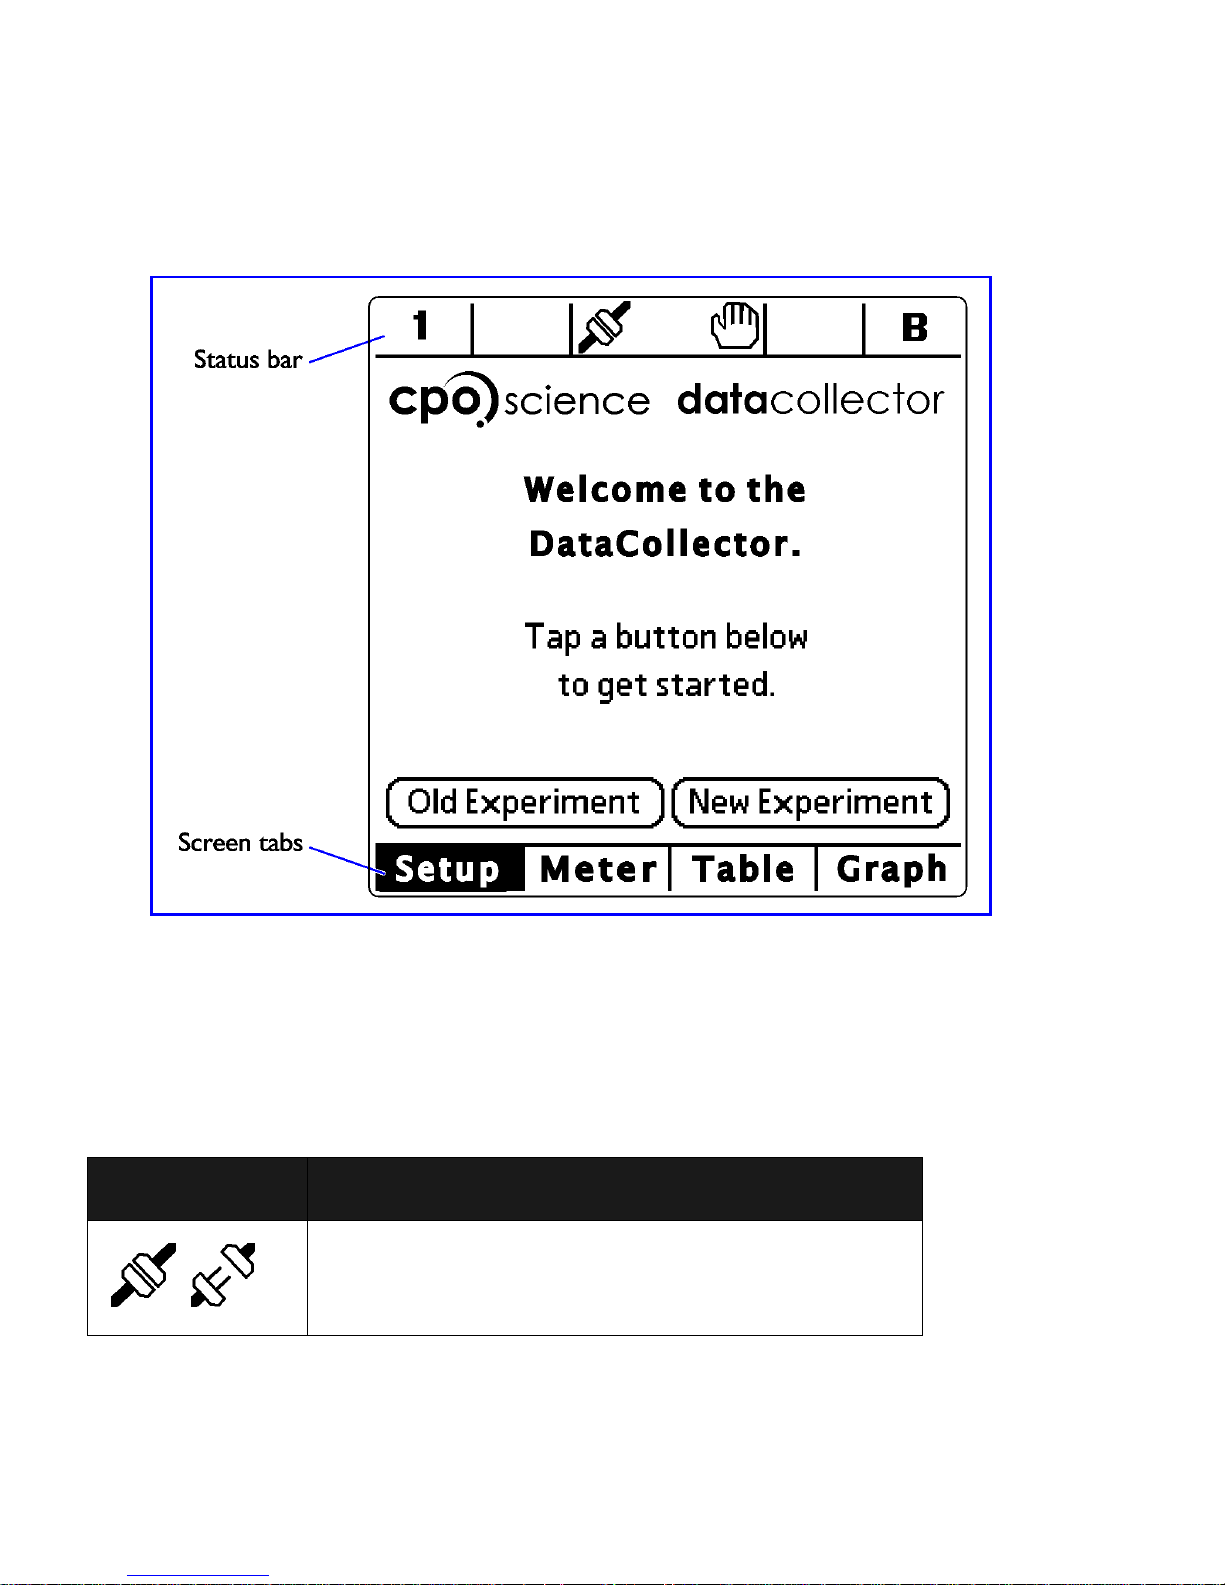
hardware. If successful, you will see the screen shown in Figure 7 on page 12.
If the attempt fails, ensure the indicator is lit, check that the handheld is seated
properly in the hardware, and tap the Connect button to try again.
Page 16
12
When you leave the DataCollector application by tapping on the Home icon (in the
silk-screened area), your data is automatically saved.
Figure 7: DataCollector Application Welcome Screen
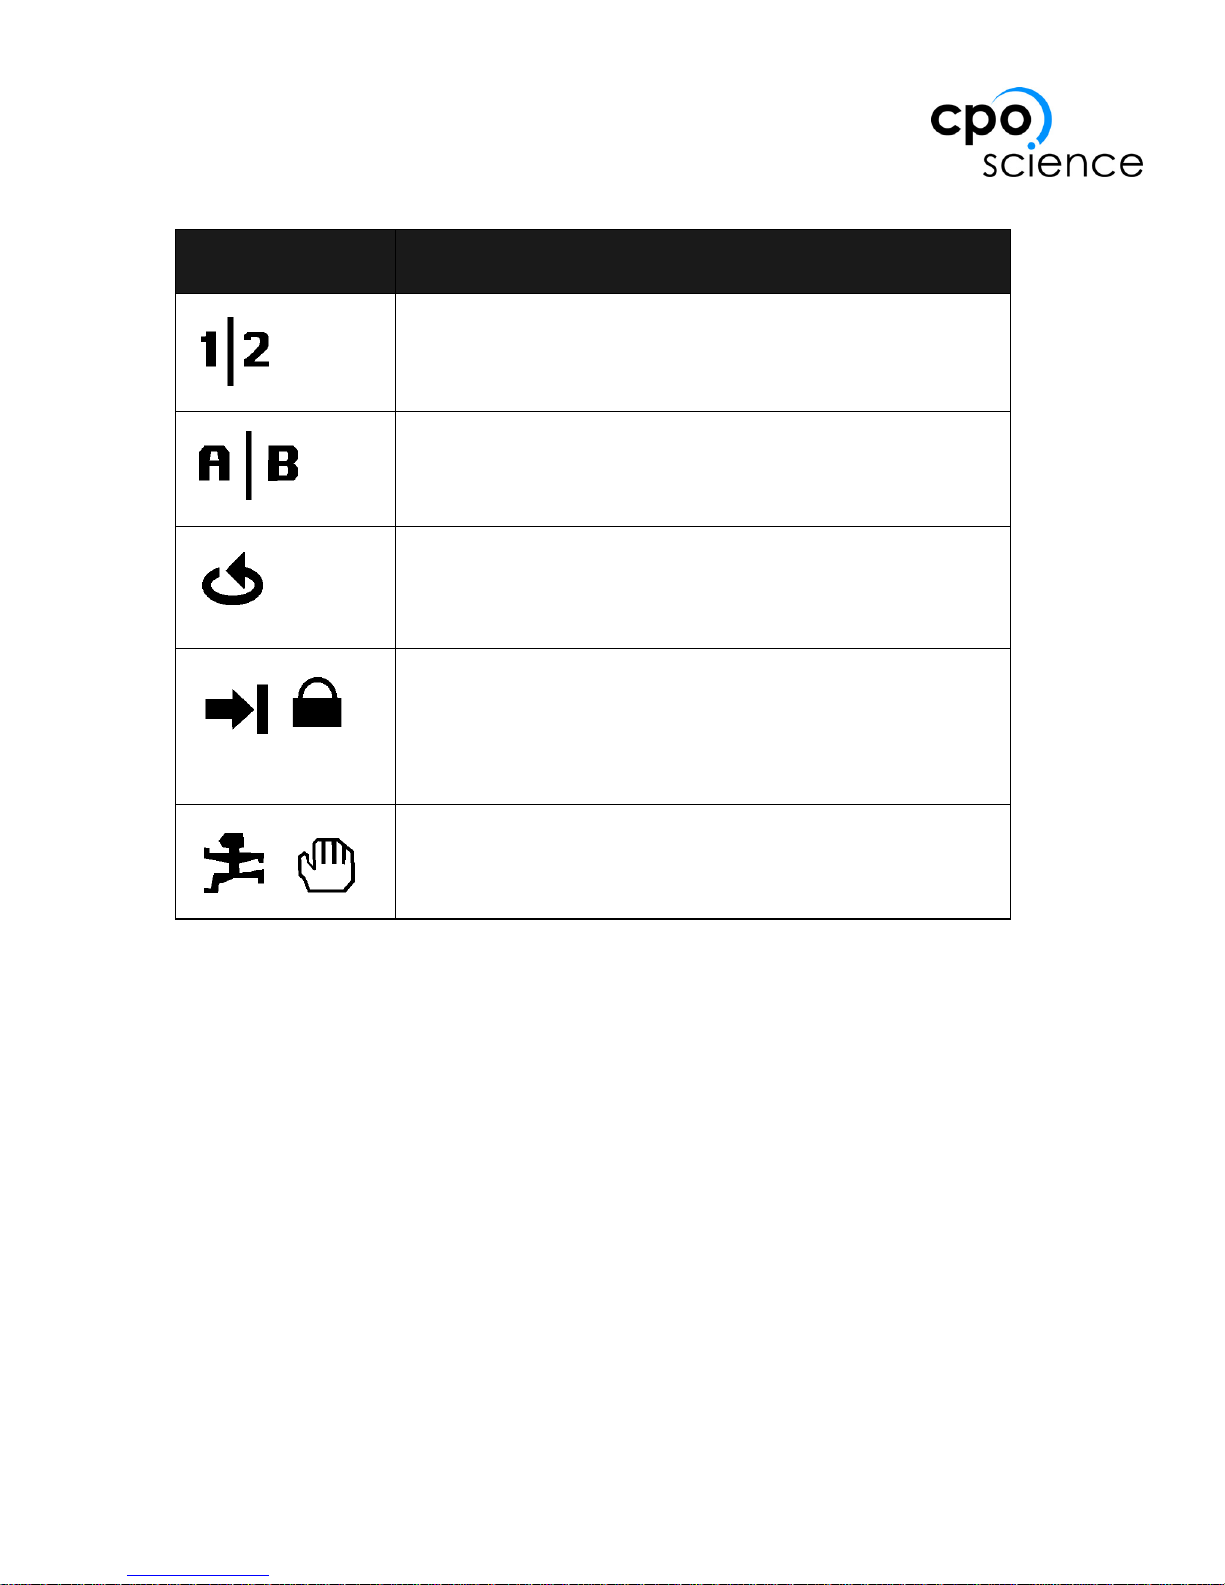
Indicators and Icons
Across the top of the DataCollector application screen is a status bar with a variety
of indicators. They are summarized in Table 3.
Table 3: DataCollector Indicators
Indicator Meaning
Indicates Zire Handheld is connected or
disconnected to hardware.
Page 17
13
DATACOLLECTOR HANDHELD USER’S GUIDE
Setting Up a New Experiment
To set up a new experiment, start the DataCollector app with Zire connected to the
hardware and the hardware powered on (the indicator should be lit). Tap the New
Experiment button on the startup screen.
There are two different types of experiments you can run with the DataCollector
app. Interval Mode experiments use photogates, or other digital sensors, to record
time intervals only. Standard Mode experiments record values from digital or ana-
log sensors on a regular basis. Refer to Table 4 on page 17 for help choosing
between the two modes.
For help in the New Experiment Setup dialog, tap the “?” icon (question mark
icon).
Indicates analog sensors connected.
Indicates digital sensors connected.
Indicates a continuous experiment. Data
collection will continue until user manually stops
experiment.
Indicates a fixed-size experiment with space for
more samples or a completed fixed-size experiment. Data collection continues until data set is
completed or user manually stops experiment.
Indicates a running experiment or a stopped one.
Table 3: DataCollector Indicators
Indicator Meaning
Page 18
14
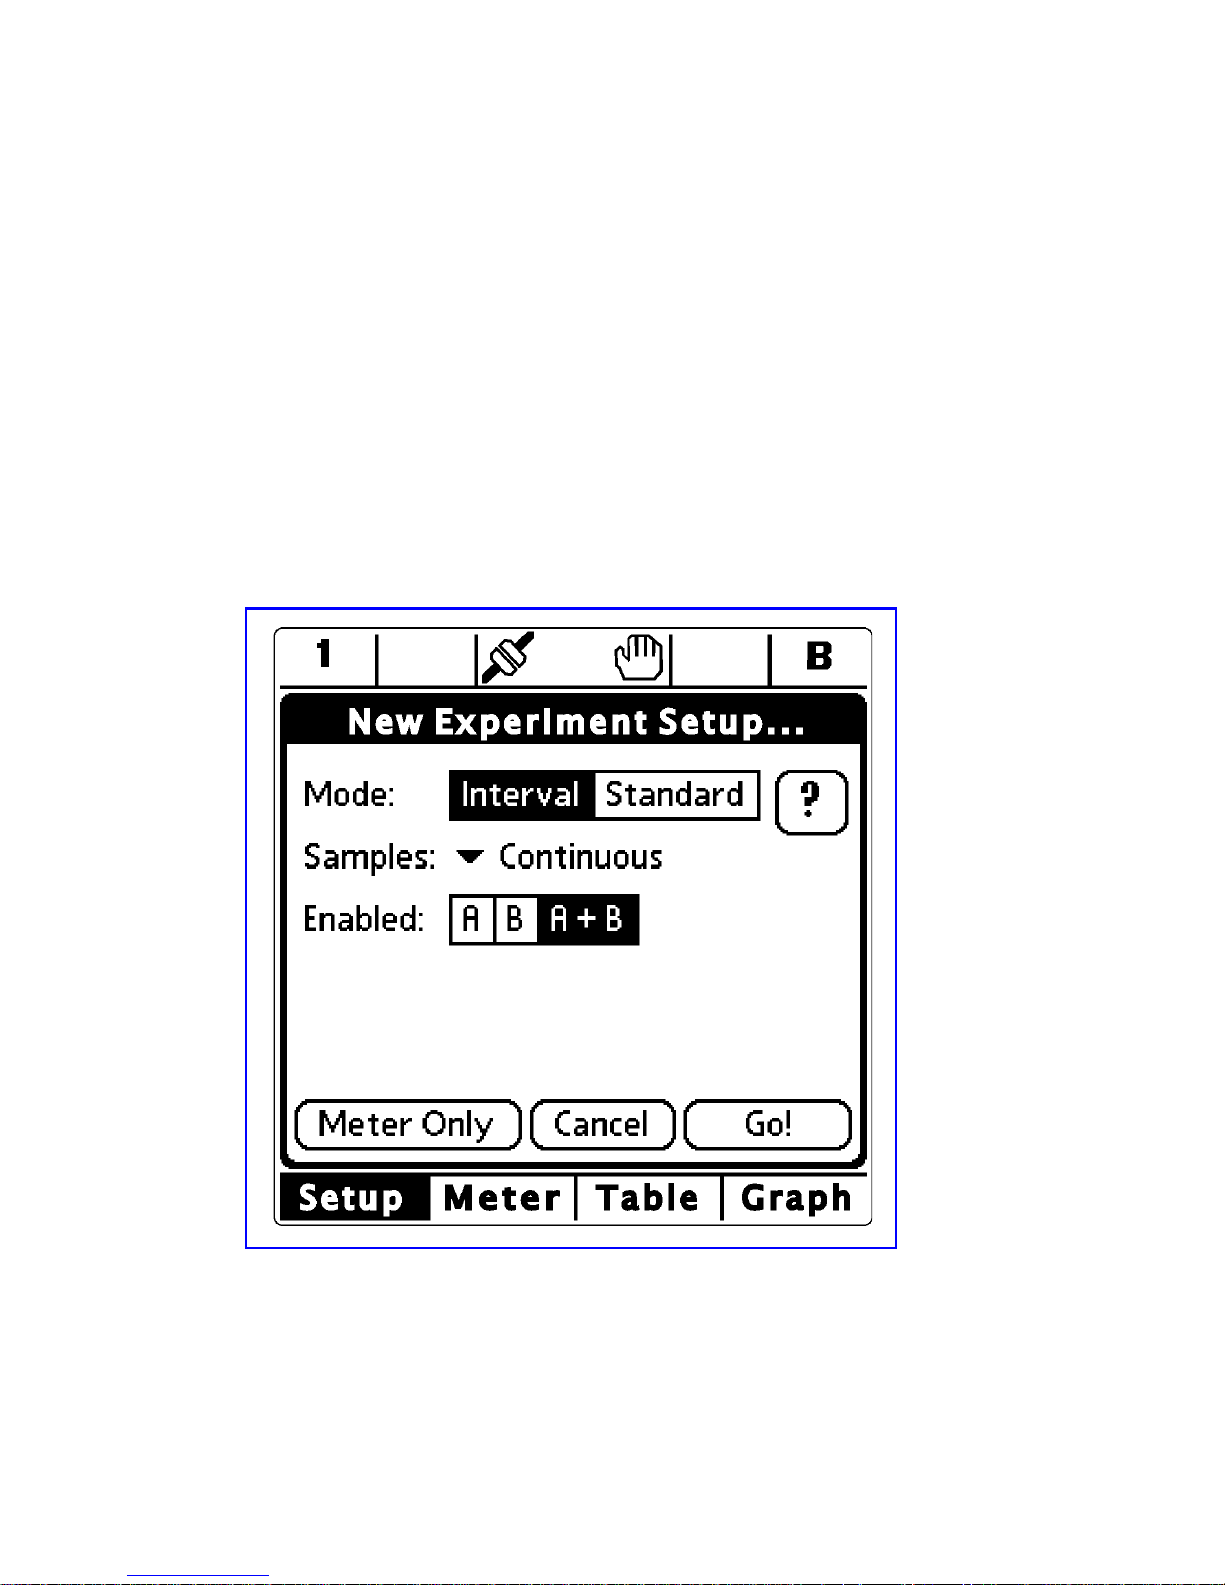
Interval Mode
Use interval mode to record time intervals with digital sensors such as photogates.
The New Experiment Setup dialog is shown in Interval mode in Figure 8.
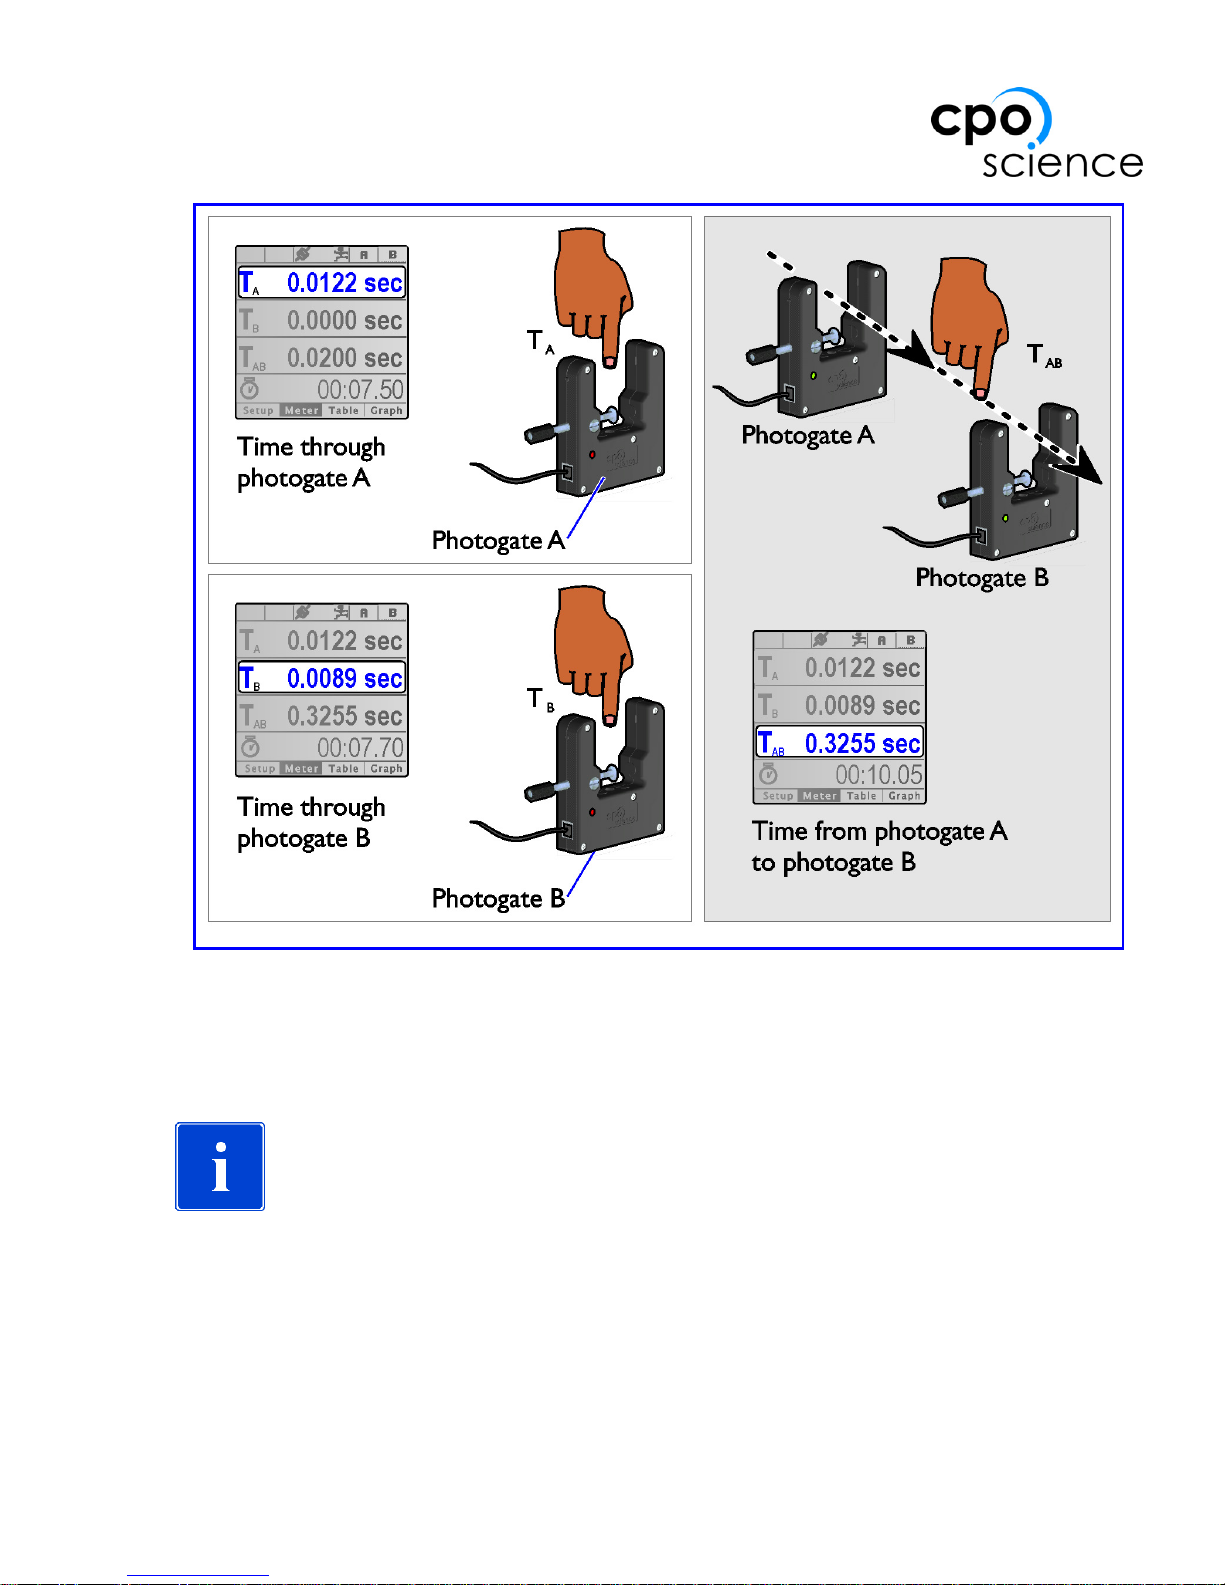
With input A enabled, the DataCollector records the time that photogate A’s beam
was interrupted - this time is labeled TA. Input B is ignored.
With input B enabled, the DataCollector records the time that photogate B’s beam
was interrupted - this time is labeled TB. Input A is ignored.
With A+B enabled, the DataCollector reports times for both photogates, as well as
the time between interrupting photogate A’s beam and photogate B’s beam. This
third time is labeled TAB.
Figure 8: The New Experiment Setup Dialog in Interval Mode
Page 19
15
DATACOLLECTOR HANDHELD USER’S GUIDE
Figure 9: Time Intervals and Photogates (A+B mode shown)
The DataCollector records data until the number of Samples has been reached.
However, if Samples is set to Continuous, the DataCollector will not stop the current experiment on it's own - stop it by pressing the 'Go' button.
IMPORTANT: In continuous mode, the experiment will
proceed until you stop it, but the DataCollector will only
record the most recent 500 data points.
Tap the Go button to start the experiment and begin recording data.
Tap Meter Only to only view live data instead (no data is recorded).
Page 20

16
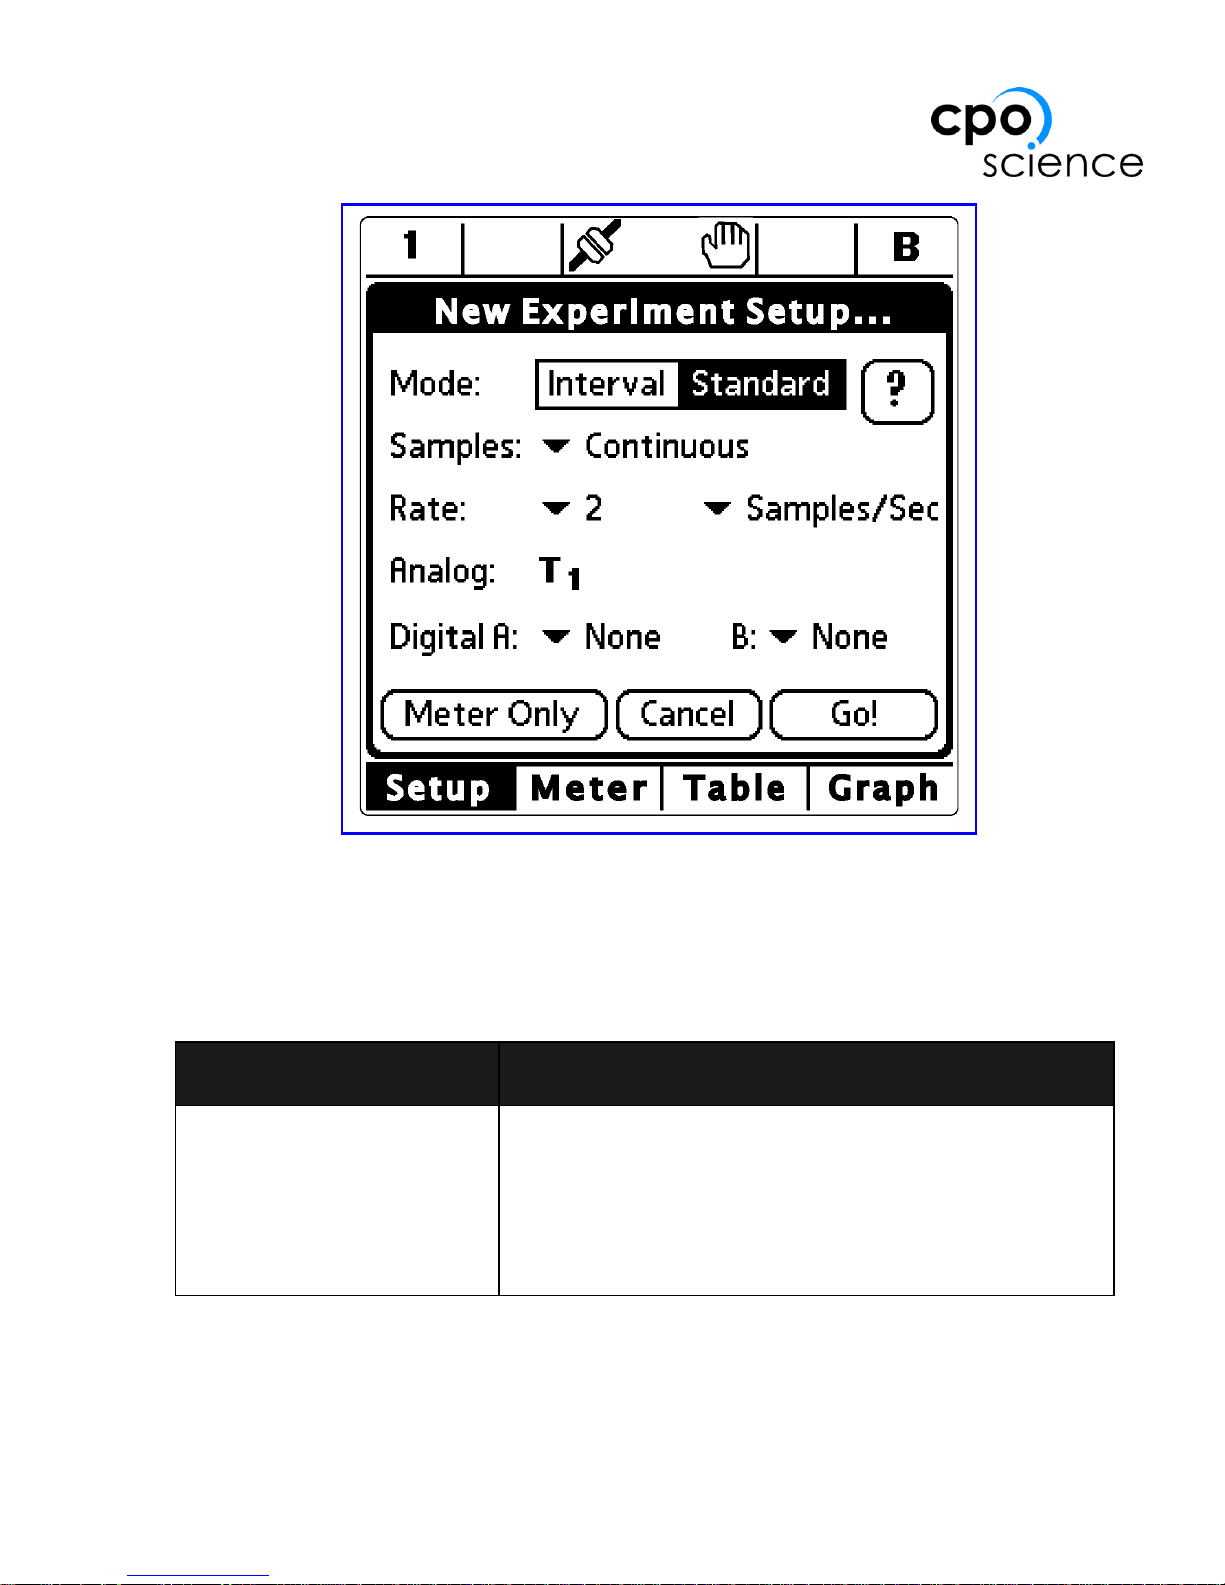
Standard Mode
Use Standard mode to make frequency, period or count measurements with digital
sensors and/or make measurements with analog sensors. The New Experiment
Setup dialog box in Standard mode is shown in Figure 10.
The DataCollector records data until the number of Samples has been reached.
However, if Samples is set to Continuous, the DataCollector will not stop the current experiment on it's own - stop it by pressing the Go button.
IMPORTANT: In continuous mode, the experiment will
proceed until you stop it, but the DataCollector will only
record the most recent 500 data points.
Use the Rate setting to control how often the DataCollector makes measurements
in Standard mode. You should set this sampling period to be larger than the typical period you will measure with any sensor. For example: to measure a pendulum
with a characteristic period of 3 seconds, set the rate to at least 5 seconds/sample.
The Analog setting shows any connected analog sensors. You can only change this
setting by plugging and unplugging sensors. Analog sensors are usually detected
automatically. In the event the DataCollector cannot determine which sensor you
have connected, a dialog box will appear on screen. Select from the list of sensors
the type of sensor you have connected, then tap OK.
The Digital settings control which digital signals the DataCollector records.
Choose freq (frequency), period, count or none for inputs A and B.
IMPORTANT: The DataCollector will record a maximum of
three (3) columns in the table. If you choose to record two digital signals (one for A and B) in Standard mode, you can only
record data from one analog sensor.
To use both analog sensors, ensure that none is selected for at least one of
Digital A or B.
Tap the Go button to start the experiment and begin recording data.
Tap Meter Only to only view live data instead (no data is recorded).
Page 21
17
DATACOLLECTOR HANDHELD USER’S GUIDE
Figure 10: The New Experiment Setup dialog in Standard Mode
Choosing A Mode
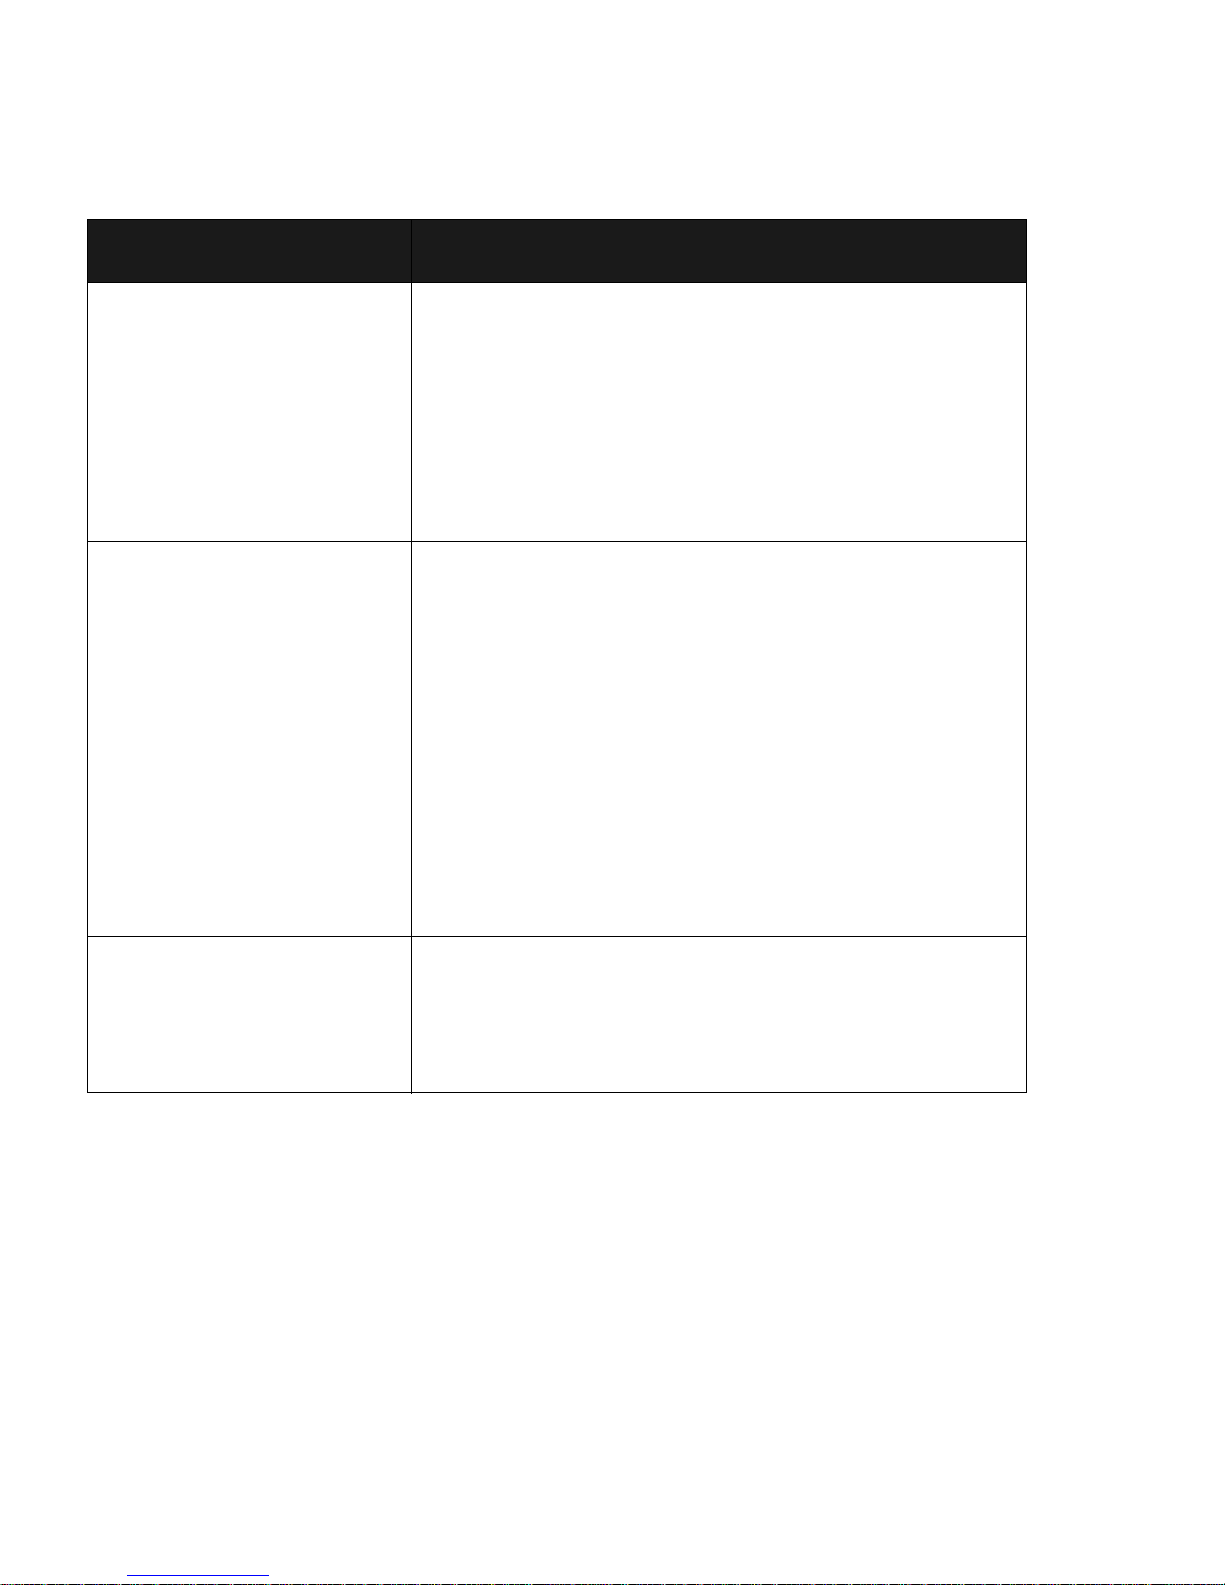
Use Table 4 to help you decide between Interval and Standard mode.
Table 4: Choosing between Interval and Standard Mode
If you want to... Just...
...measure only intervals
with photogates
Start a New Experiment of Interval type. If you
want to use only one photogate, select either A or
B from the Enabled box. To use both, select A+B.
Tap the Go button.
Page 22
18
Navigating within the DataCollector Application
You’ll see four “tabs” at the bottom of the DataCollector application screen (see
Figure 7) labelled Setup, Meter, Table and Graph. Tap on one of the tabs to switch
between screens, or use the DateBook hard button (see Figure 6 on page 11), to
toggle through the four screens.
...record frequencies,
periods, or counts with a
photogate
Start a New Experiment of Standard type. If appli-
cable, select a sampling period that is larger than
the typical period you will measure. From the
Digital list, pick the function you want for each of
digital A and B.
Tap the Go button.
...record data from one
or two analog sensors
Start a New Experiment of Standard type. Select a
sampling frequency that meets your needs.
Note: If you have something selected for both
Digital A and Digital B, data from a second
analog sensor will not be recorded. To ensure data
from the second analog sensor is recorded, make
sure the option None is selected for either
Digital A or B.
Tap the Go button.
...look at data from sensors or photogates, but
not record it
Start a New Experiment of either type, setting
other parameters as appropriate.
Tap the Meter Only button.
Table 4: Choosing between Interval and Standard Mode
If you want to... Just...
Page 23
19
DATACOLLECTOR HANDHELD USER’S GUIDE
Setup Screen
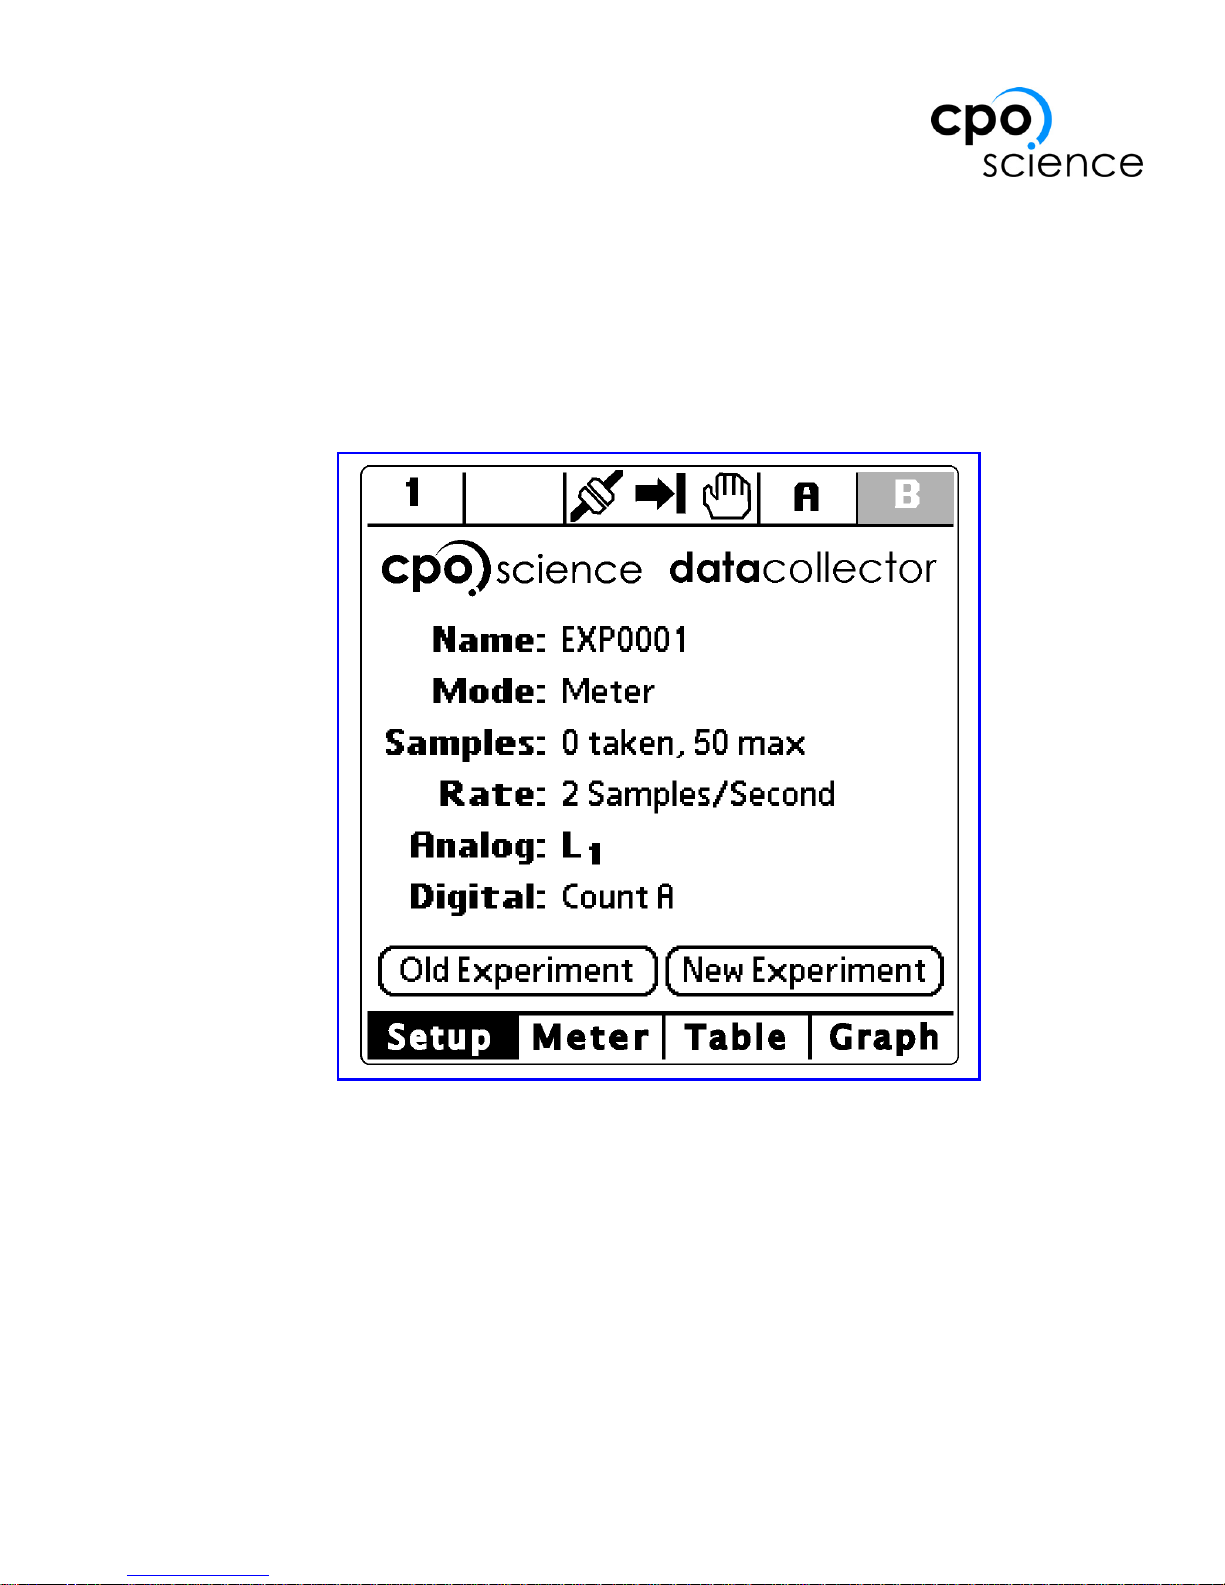
When the DataCollector application is started, a welcome message is presented
(see Figure 7 on page 12) in the Setup Screen.
As shown in Figure 11, once an experiment has been configured, the Setup Screen
displays setup information such as the experiment name, mode, number of samples, sampling rate, and the sensors connected.
Figure 11: Setup Screen showing Experiment Information
There are also two buttons available at the bottom of the Setup Screen: the New
Experiment button and the Old Experiment button. The New Experiment Setup
dialog is described in the section “Setting Up a New Experiment” on page 13.
Page 24
20
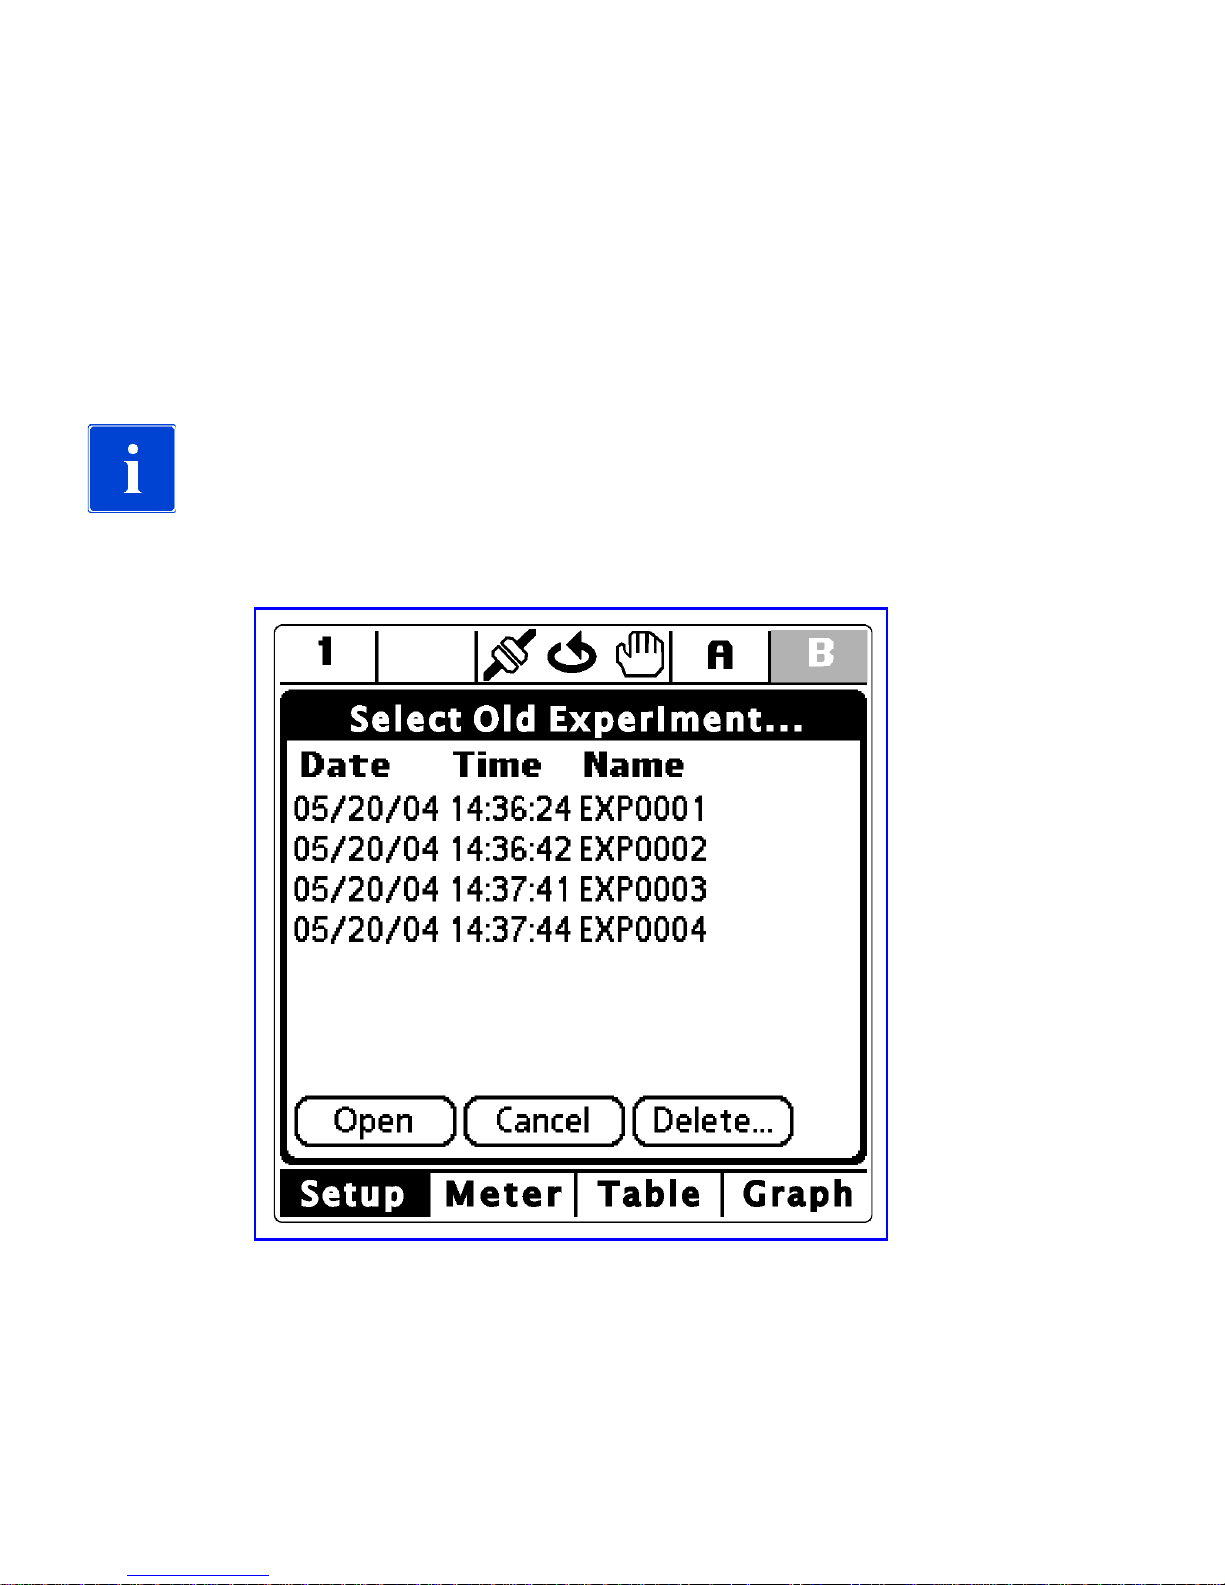
Tapping the Old Experiment button brings up a dialog box, shown in Figure 12,
that allows you to open, view and delete old experiments.
To open an old experiment, tap on an experiment row in the dialog, then tap the
Open button.
To delete an old experiment, tap on an experiment row in the dialog box, then tap
the Delete... button.
IMPORTANT: Deleting an experiment is a permanent action,
and cannot be undone.
To exit the Old Experiment dialog, tap the Cancel button.
Figure 12: Old Experiment Dialog
Page 25
21
DATACOLLECTOR HANDHELD USER’S GUIDE
Meter Screen
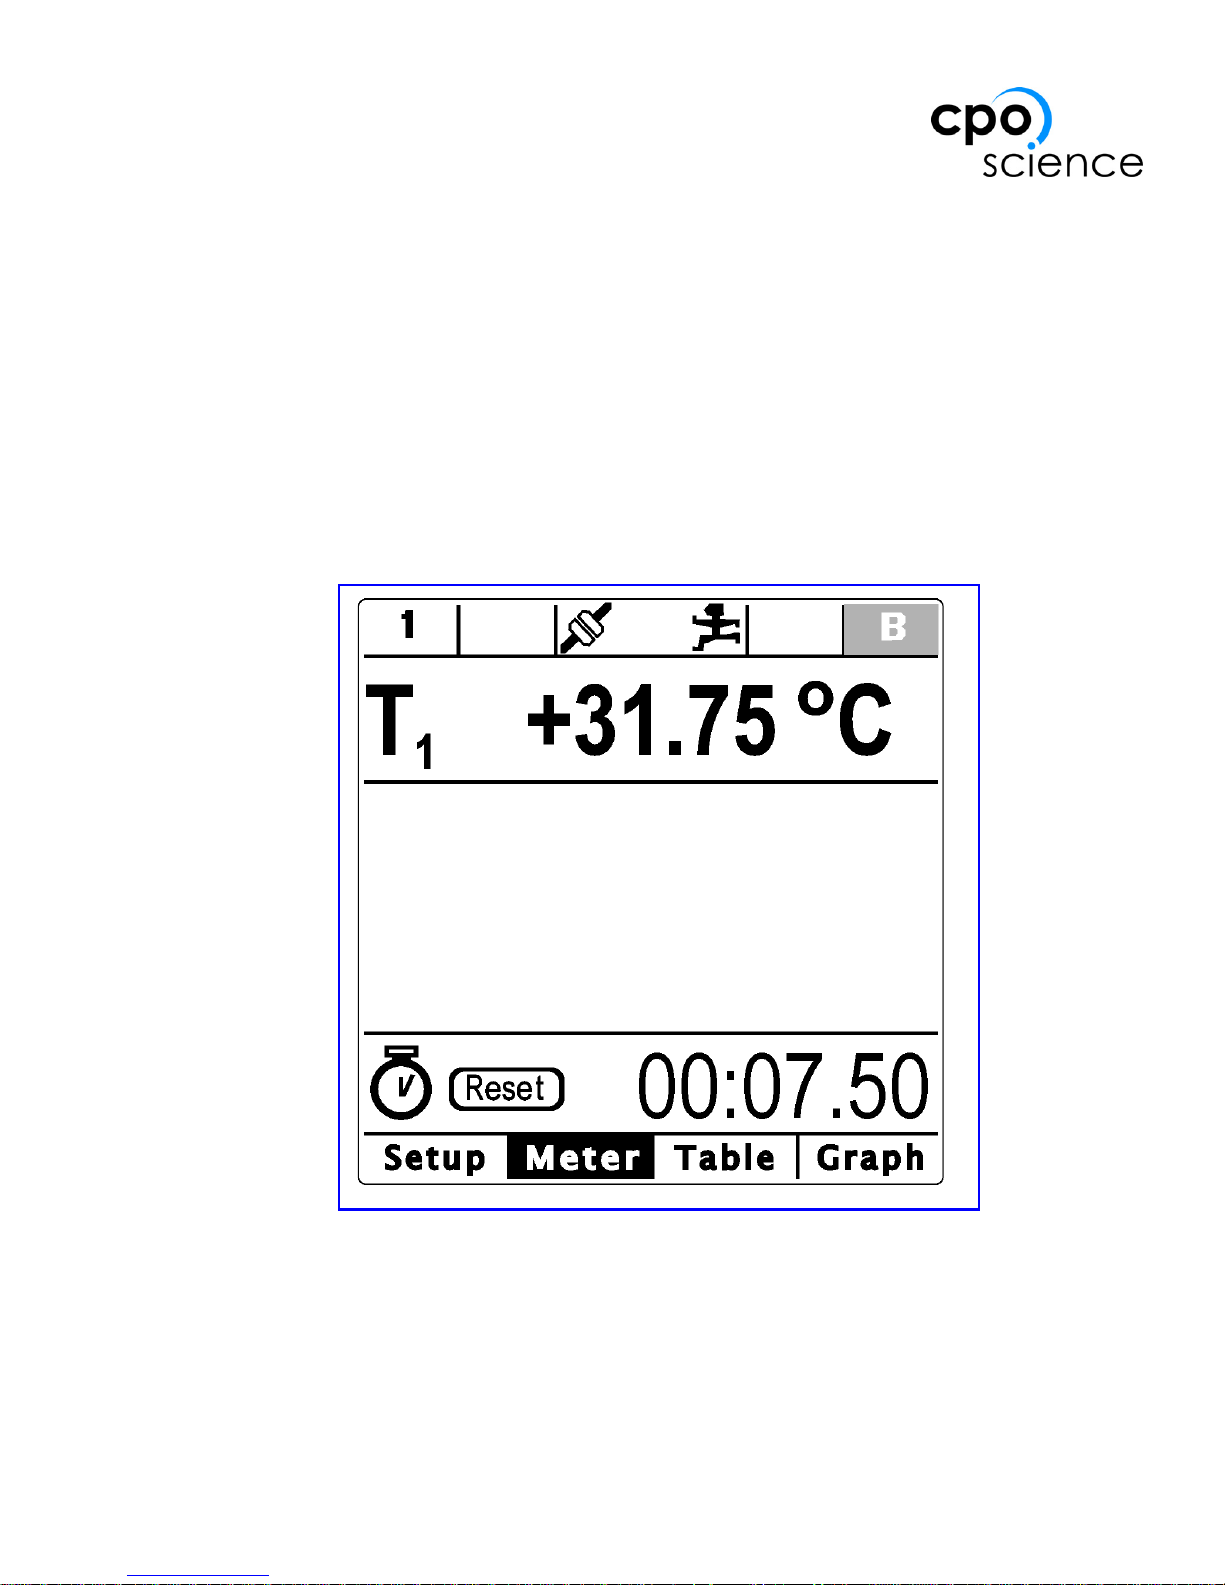
The Meter Screen displays current values for sensors included in the current exper-
iment, and also displays the experiment clock. See Figure 13.
The experiment clock runs while the experiment is running, and stops when the Go
button is pressed to stop the experiment.
In Meter Only mode, the experiment clock can be used like a stopwatch - it can be
reset to zero by tapping the Reset button.
In Interval or Meter Only mode, the information on the Meter Screen is “frozen”
and held constant when the experiment is not running (the hand icon is present).
Figure 13: Meter Screen showing Live Sensor Information
Page 26
22
Table Screen
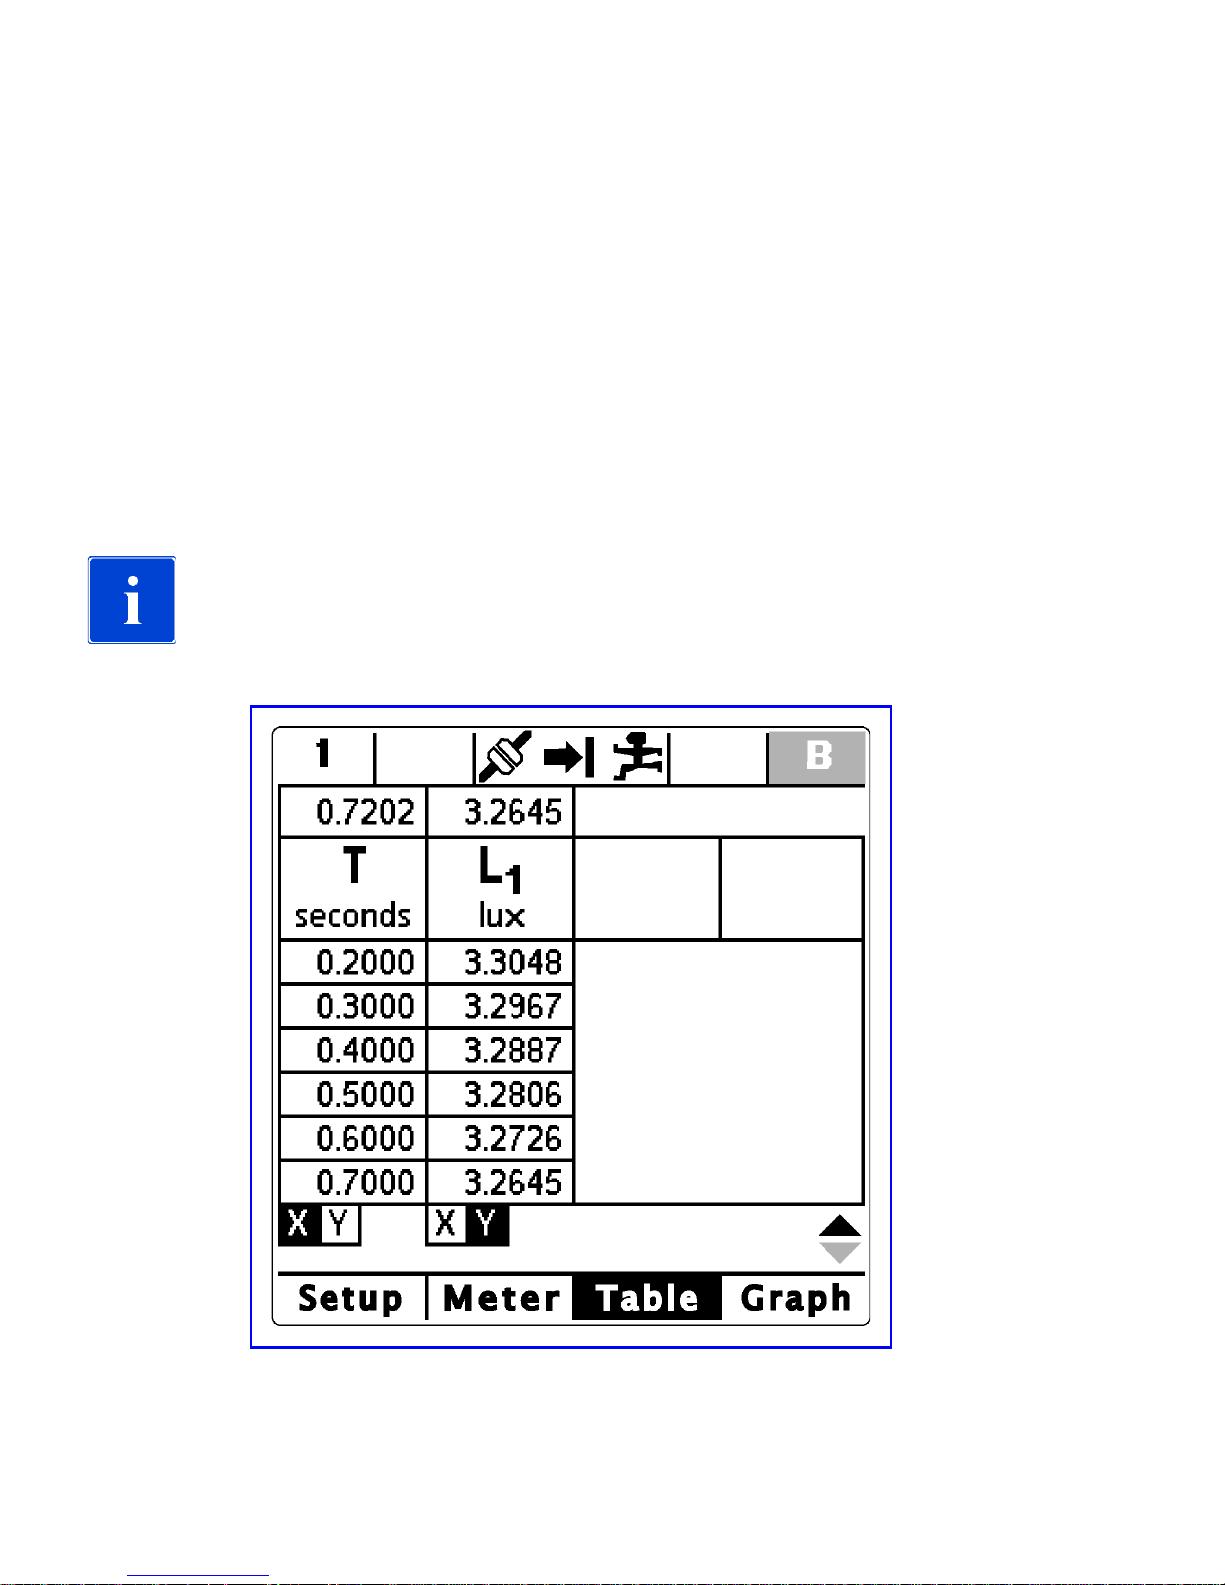
The Table Screen shows data in the current experiment. See Figure 14. If the
experiment is in-progress, data in the table is updated as it’s collected.
The single row above the header row displays live data, similar to the
Meter Screen. The rows below the header display collected data.
Use the hard scroll buttons to move up or down in the table, or tap on the small up
and down arrows in the lower right-hand corner.
To delete a row, tap on one of the cells in the row. Then, tap the menu icon, and
select Delete Point from the Edit menu.
Deleting a row is a permanent operation and cannot be
undone.
Figure 14: Table Screen
Page 27
23
DATACOLLECTOR HANDHELD USER’S GUIDE
Graph Screen
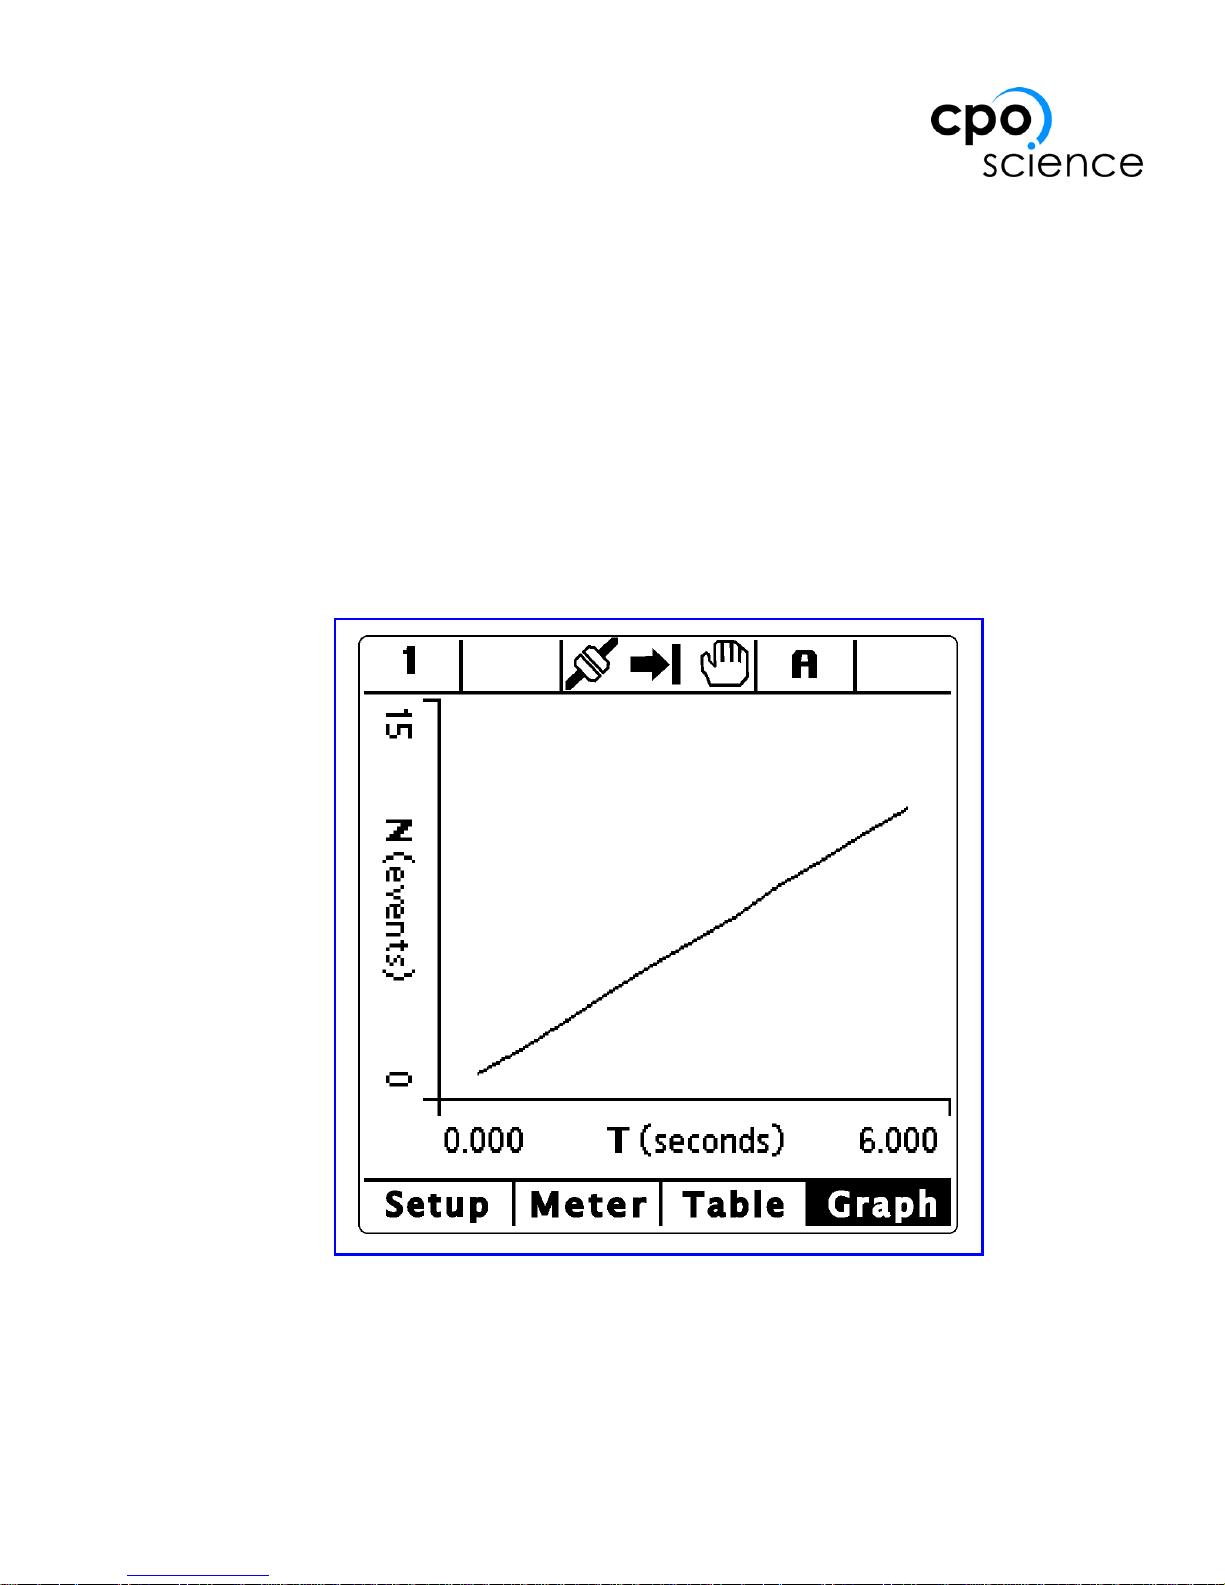
The Graph Screen displays a graph of data from the current experiment (see
Figure 15), using settings from the Table Screen.
At the bottom of each column shown in the Table Screen (see Figure 14) are two
buttons labeled X and Y. To set a column as the source for the data for the X-axis in
the graph, tap the X button below that column. Tap the Y button to use that column
as the source for Y-axis data.
If you view the graph while an experiment is in-progress, the graph will be updated
as more data is collected.
No graph appears in Meter Only mode, as no data is being collected.
Figure 15: Graph Screen
Page 28
24
Application Menus
The Options Menu
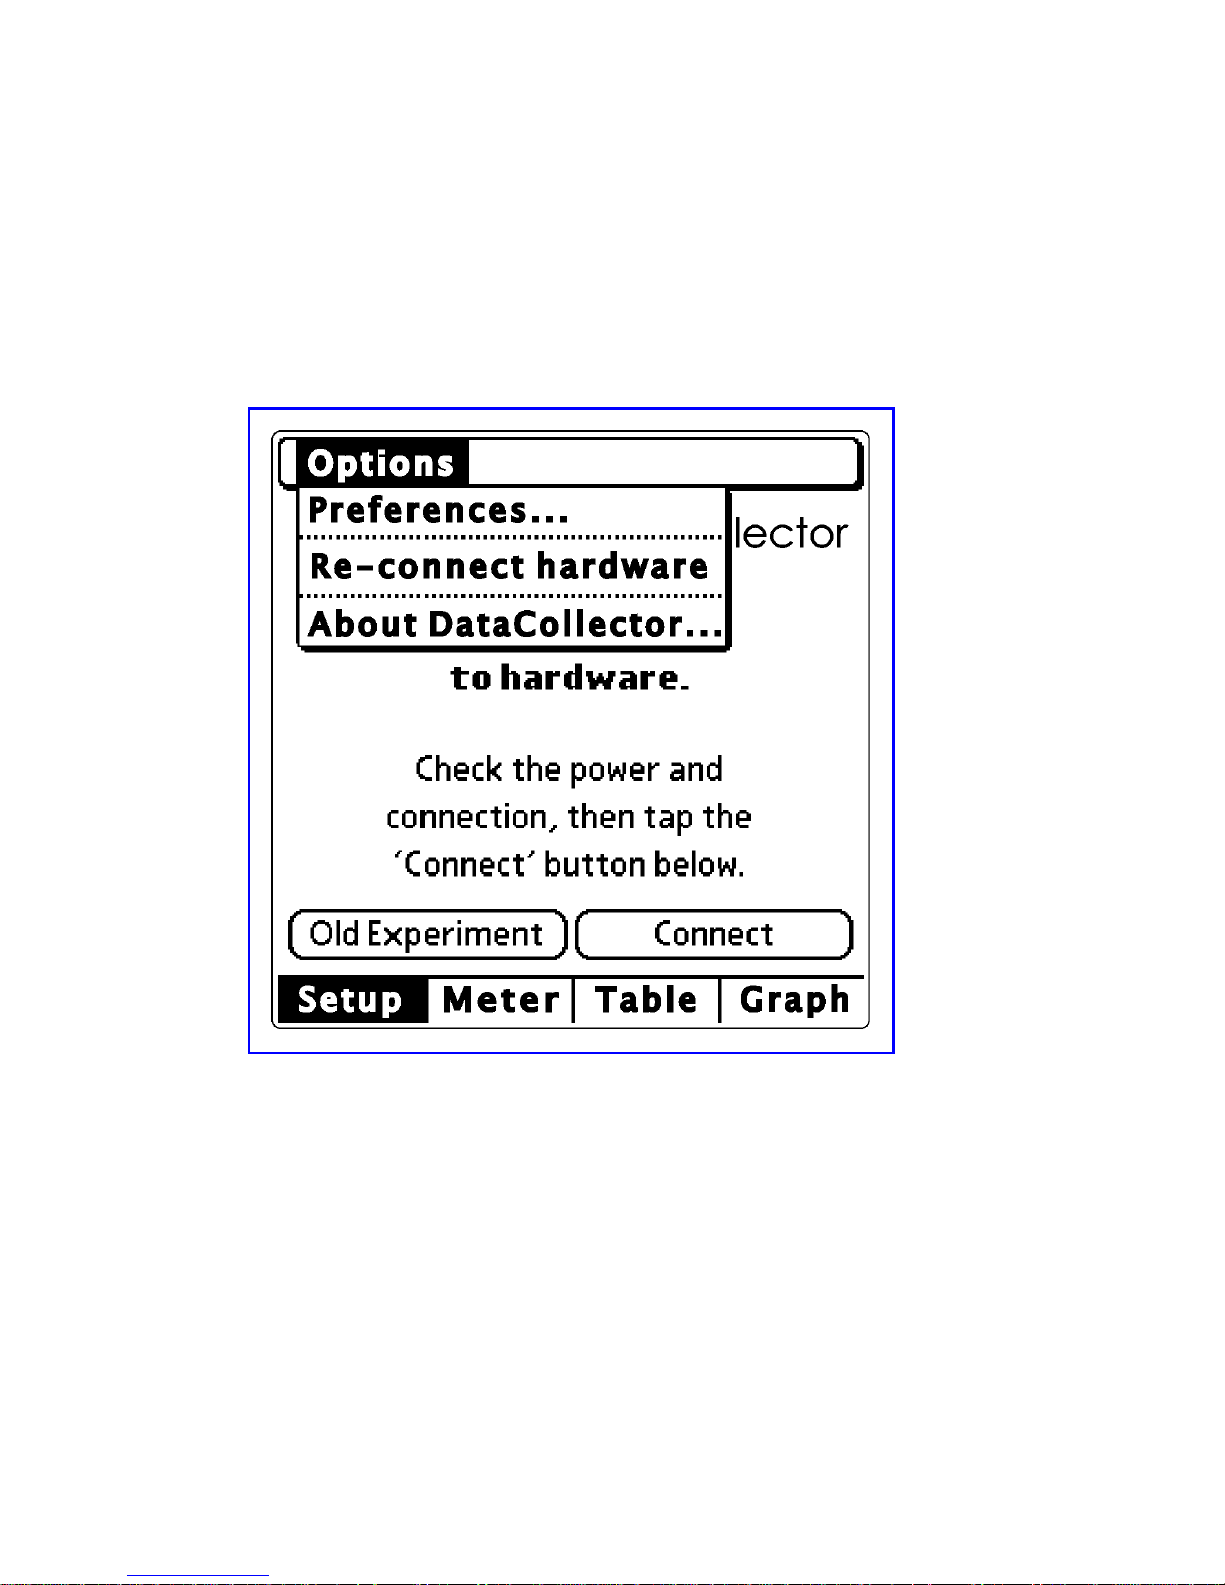
The Options menu is available in any of the four screens of the DataCollector
application. Tap the Menu icon in the silk-screened portion of the Zire, and you’ll
see the Options menu, shown in Figure 16.
Figure 16: The Options Menu
The Re-connect hardware menu item will re-establish communications with the
hardware if they are disrupted. Before re-connecting, be sure that the LED indicator is lit and the handheld is seated properly in the hardware. The
Re-connect hardware item is only shown when the hardware is not connected.
Tap the About DataCollector... menu item to see the version number for the app.
The Preferences... menu item brings up the Preferences dialog, shown in
Figure 17.
Page 29
25
DATACOLLECTOR HANDHELD USER’S GUIDE
The Preferences Dialog
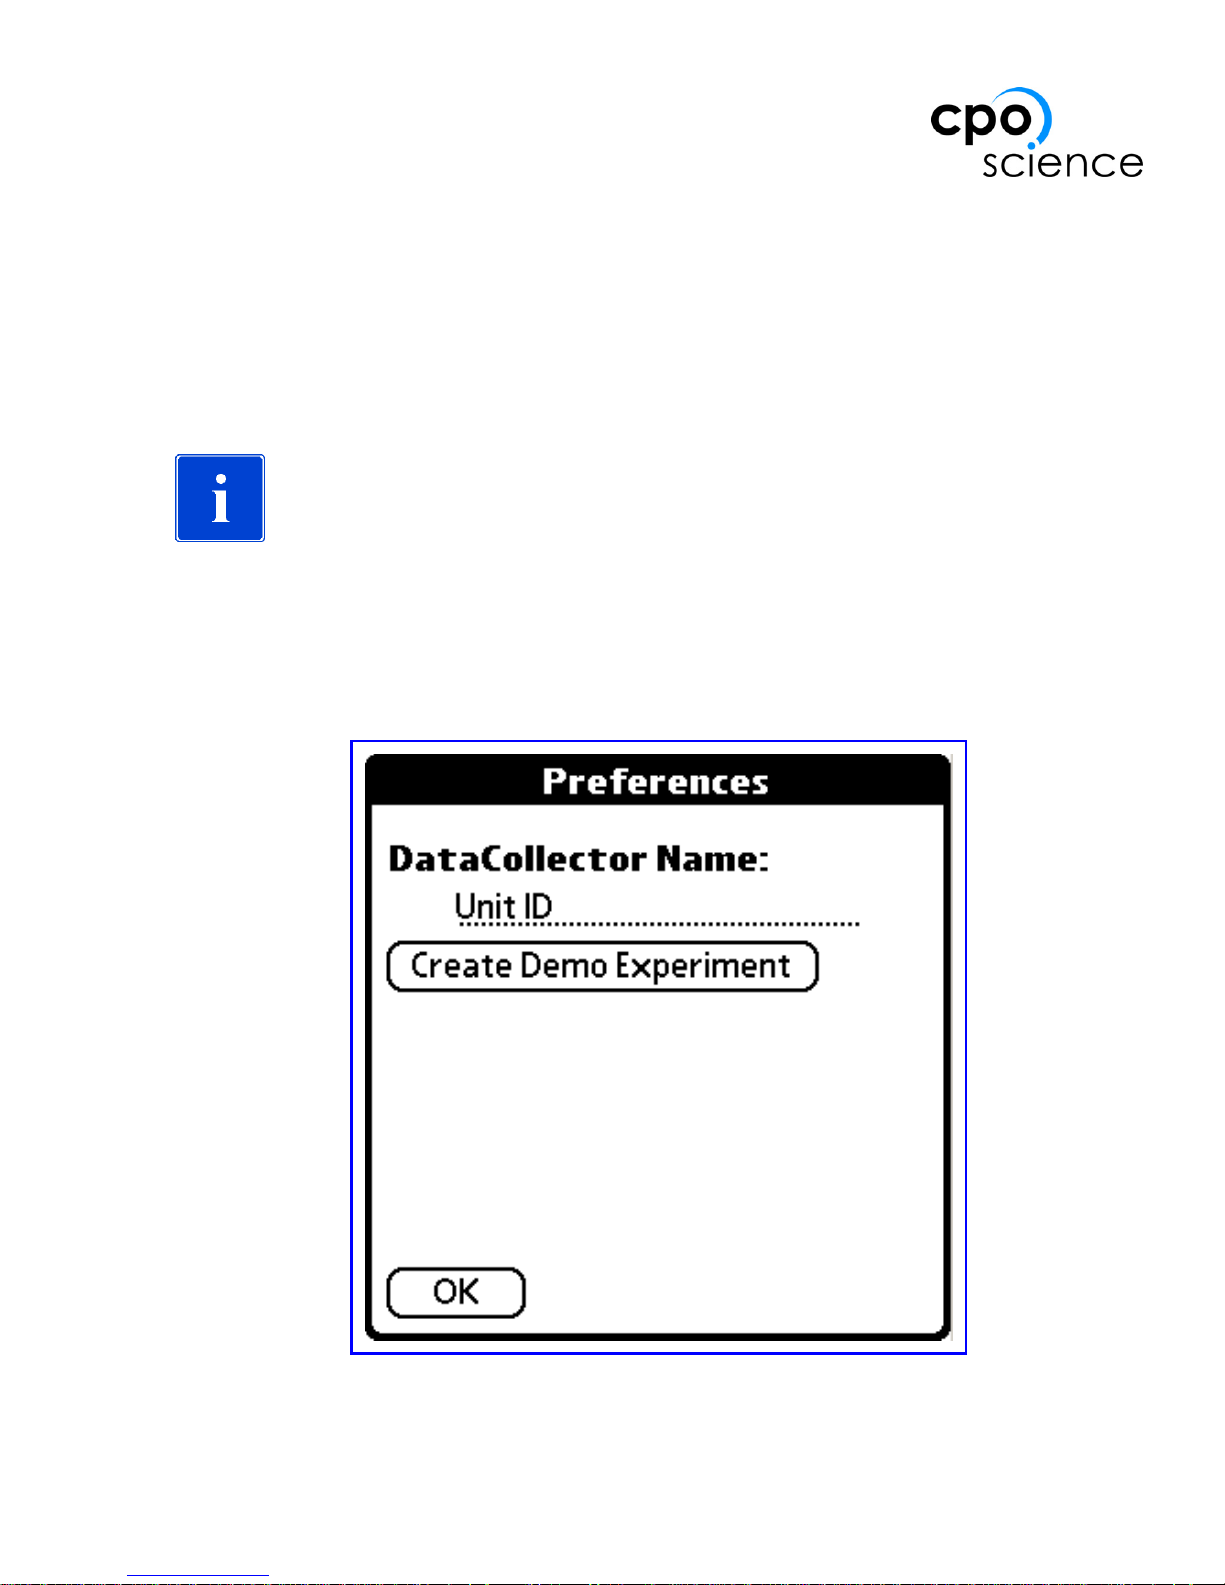
From the Preferences dialog, you can set the name of the DataCollector that is
used in downloading experimental data to a personal computer (see “Downloading
Data to a Computer” on page 26). In a classroom setting, it may be desirable to differentiate between multiple DataCollector units, and this can be accomplished
through the DataCollector Name setting. The default value for the DataCollector
Name is “Unit ID”.
You should add a number to the end of the name or replace it
completely using Graffiti (the handwriting recognition on the
Zire handheld) or by tapping the small 123 icon in the silkscreened portion of the screen.
Tap the Create Demo Experiment button to create an example experiment for
learning purposes. This experiment will have the special experiment name
“Demo Data” and will be available in the Old Experiment dialog (see page 19).
Figure 17: The Preferences Dialog
Page 30

26
Chapter 6: Downloading Data to a Computer
Experimental data from the CPO Science DataCollector can be transferred from
the Zire handheld to a personal computer via a HotSync operation. It is necessary
to install the Palm HotSync Manager software as well as the CPO Science
DataCollector Conduit before experimental data can be transferred. Please ensure
that you have installed both the Palm HotSync Manager software as well as the
DataCollector Conduit before proceeding (see the section in Chapter 3 titled
“Using the DataCollector with a Computer” for more details and installation
instructions).
To perform a HotSync operation, first remove the handheld from the hardware.
Pull back on the metal spring clip until the handheld pops up, then carefully
remove it from the alignment pin and USB connector. Connect the handheld to
your personal computer using the USB synchronization cable that came with the
Zire handheld. Finally, turn on the Zire handheld, tap the Home button, then tap
the Star button on the silk-screened area to begin the HotSync operation.
Mac OS 9.x and Mac OS X
All experiments residing on the handheld are transferred to the folder CPO Science
Experiments/Unitname in the Documents directory.
When experiment files are transferred to the directory listed above, they have file
names in the following form:
EXPxxxx_DATE_TIME.csv
Here is an example of a file name:
EXP0010_05-17-2004_11-29-50.csv
Windows
All experiments are transferred to the folder c:\CPO Science Data Collector\Data
When experiment files are transferred to the directory listed above, they have file
names in the following form:
UNITNAME_EXPxxxx_DATE_TIME.csv
Page 31
27
DATACOLLECTOR HANDHELD USER’S GUIDE
Here is an example of a file name:
Unit1_EXP0010_05-17-2004_11-29-50.csv
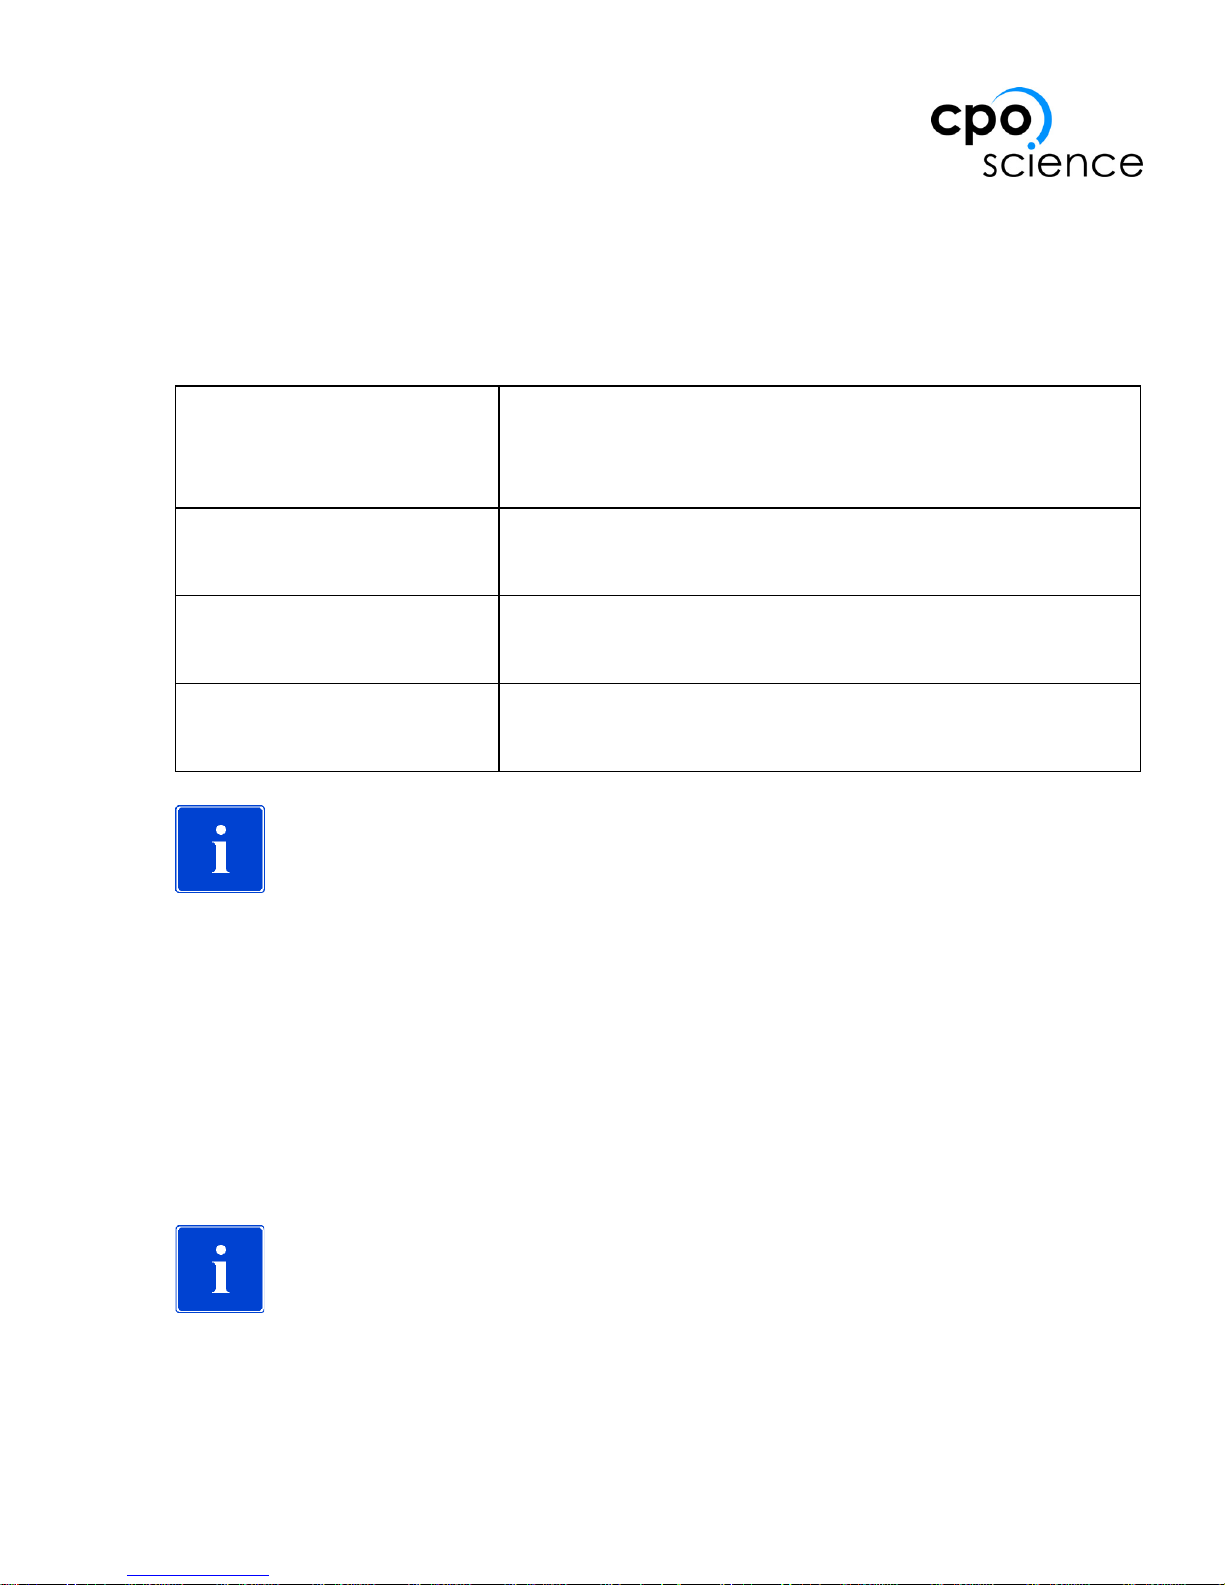
Each part of the file name has a meaning as shown in Table 5 below.
IMPORTANT: Experiments are not deleted from the Zire
after the HotSync operation. Please see the section titled
“Managing Data Sets” in Chapter 4 for information on how to
delete experiments.
The .csv extension means that the data is stored in the files as comma-separated
values. Most spreadsheet programs understand the CSV format. Microsoft Excel,
for example, can open this format directly, allowing you to quickly view and
manipulate experimental data.
Other information about the experiment such as the experiment type (Standard or
Interval), sampling frequency, number of rows and columns, and the units for each
column are also included in the CSV file.
IMPORTANT: After using the CSV file in a spreadsheet or
other data manipulation program, be sure to save your
changes to a different file or location. The CSV file will be
overwritten the next time you perform a HotSync operation
with your Zire.
Table 5: Meaning of the file name
UNITNAME The name assigned to a particular Zire handheld in
the DataCollector Preferences screen. This value is
set to “Unit ID” by default.
EXPxxxx The letters “EXP” followed by a four digit number
that increases with each experiment.
DATE The date the experiment was started, in the form of
MM-DD-YYYY.
TIME The time the experiment was started, in the form of
HH-MM-SS
Page 32
28
Chapter 7: Technical Information
The CPO Science DataCollector has the following technical specifications:
Analog Sensor Pinout
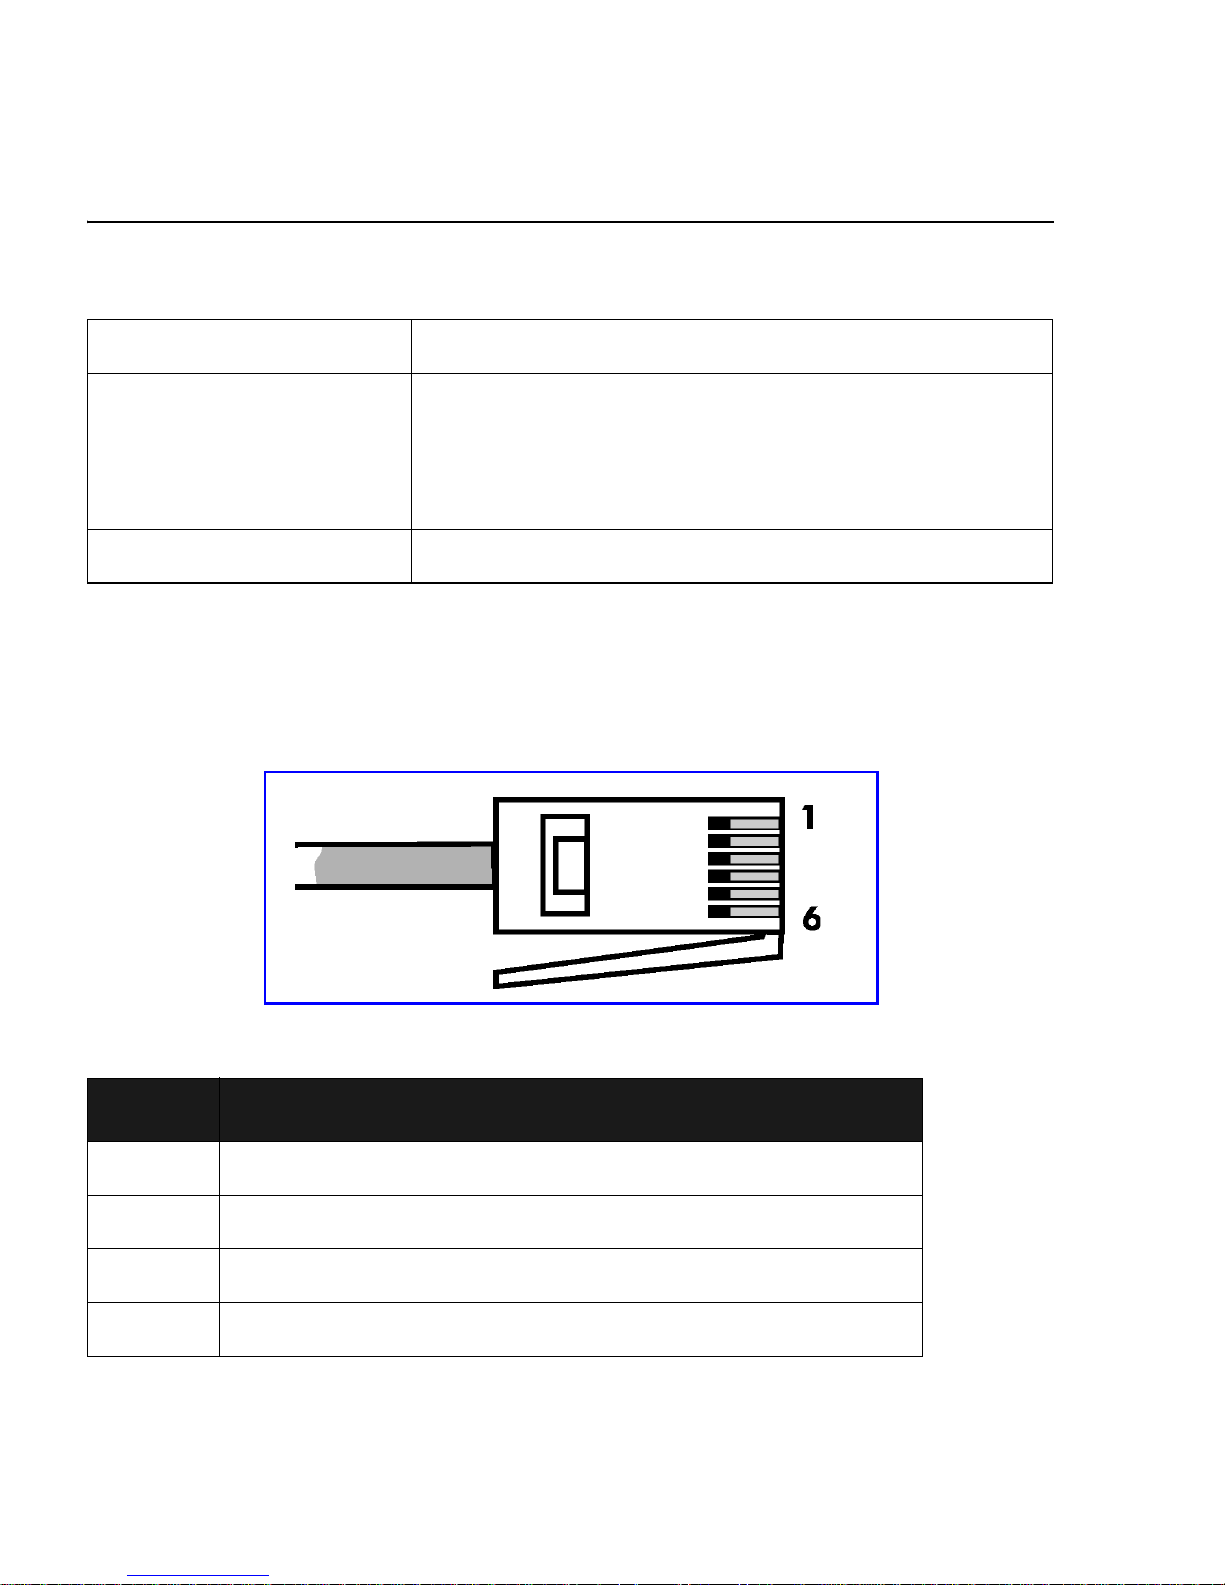
Analog sensors use right-hand British Telecom (BT631A) plugs with the following
connections:
Input voltage: 6 V DC/300 mA minimum
Sensors: 2 Analog Sensor Ports (British Telecom jacks)
2 Digital Sensor Ports (RJ-11 jacks)
See pinout descriptions below
Handheld computer: Compatible with the palmOne Zire handheld only
Table 6: Analog Sensor Pinout
Pin Connection
1 No connection
2 Ground
3 +5 V DC reference voltage (from DataCollector)
4 ID resistor
Page 33
29
DATACOLLECTOR HANDHELD USER’S GUIDE
Digital Sensor Pinout
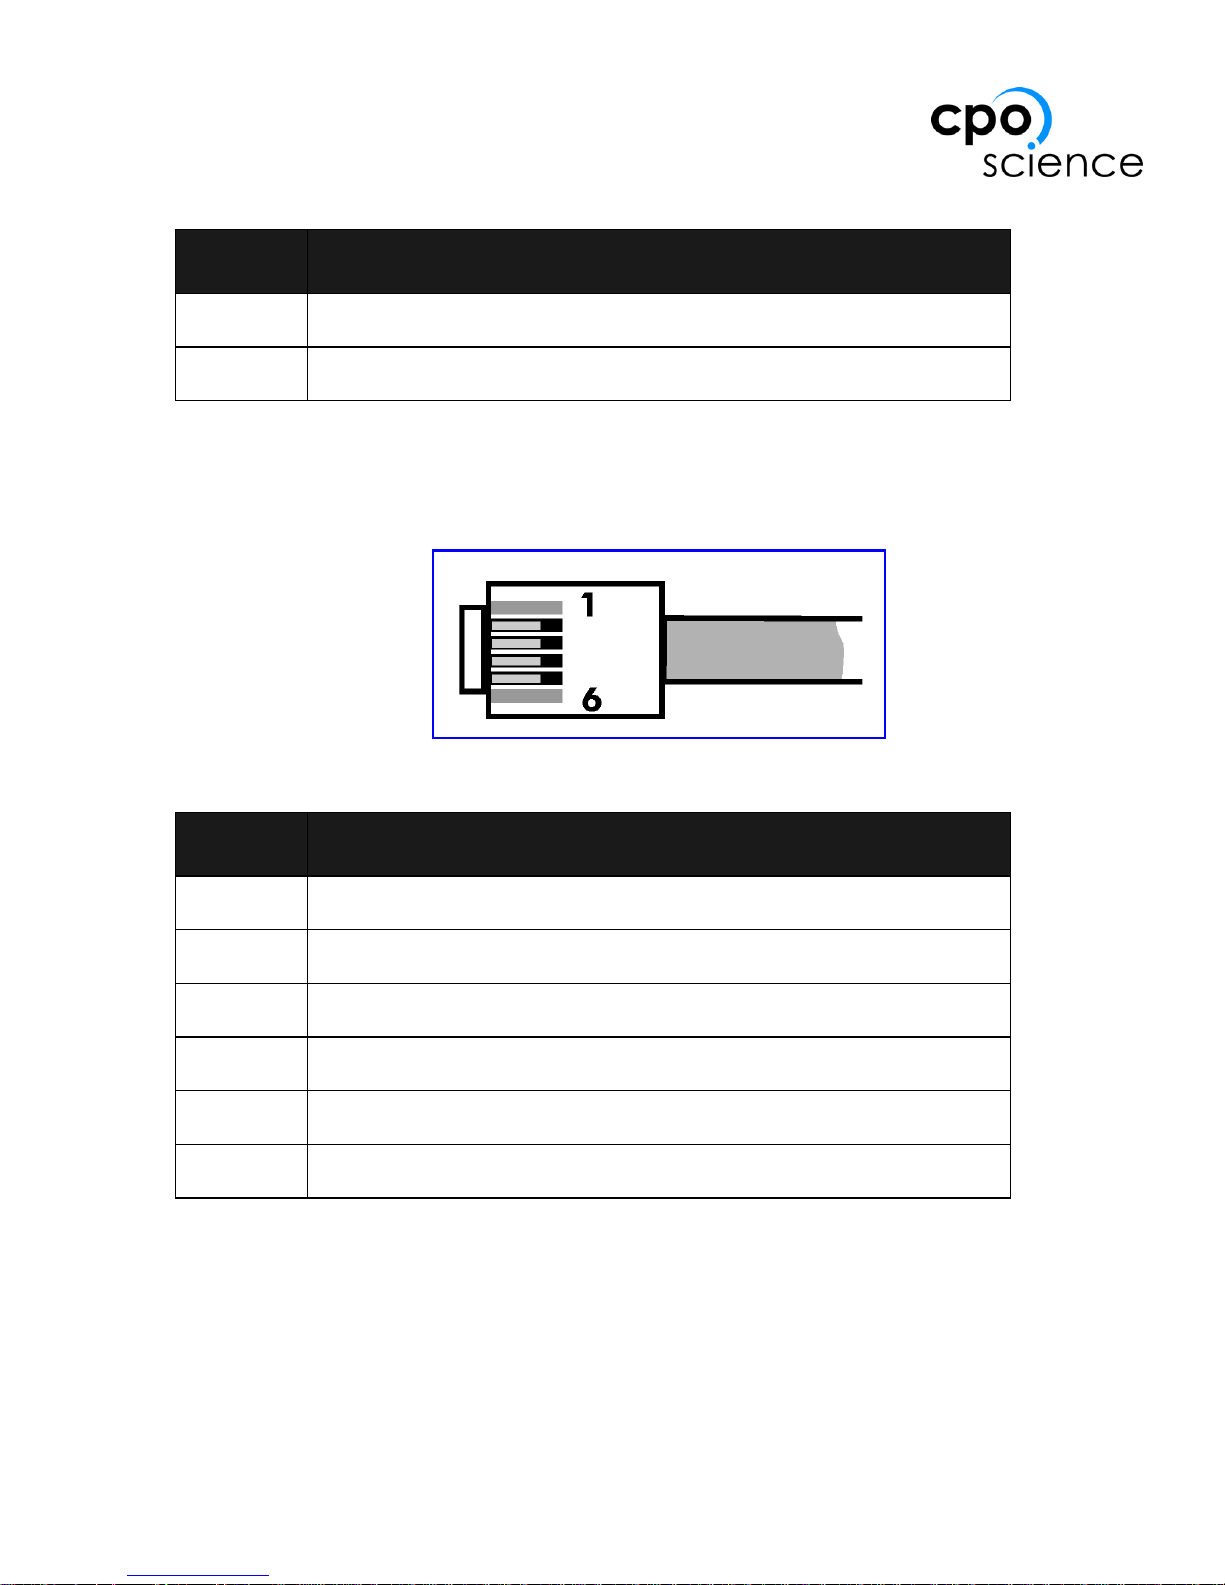
Digital sensors use telephone (RJ11) plugs with the following connections:
5 +5 V DC power supply (from DataCollector)
6 Signal output (to DataCollector)
Table 7: Digital Sensor Pinout
Pin Connection
1 No connection
2 Ground
3 Signal output (to DataCollector)
4 +5 V DC power supply (from DataCollector)
5 No connection
6 No connection
Table 6: Analog Sensor Pinout
Pin Connection
Page 34
30
Accessory Information
The DataCollector stand can simply be snapped back into place if it comes off.
You can order a replacement stylus from the palmOne web store:
http://www.palmone.com/
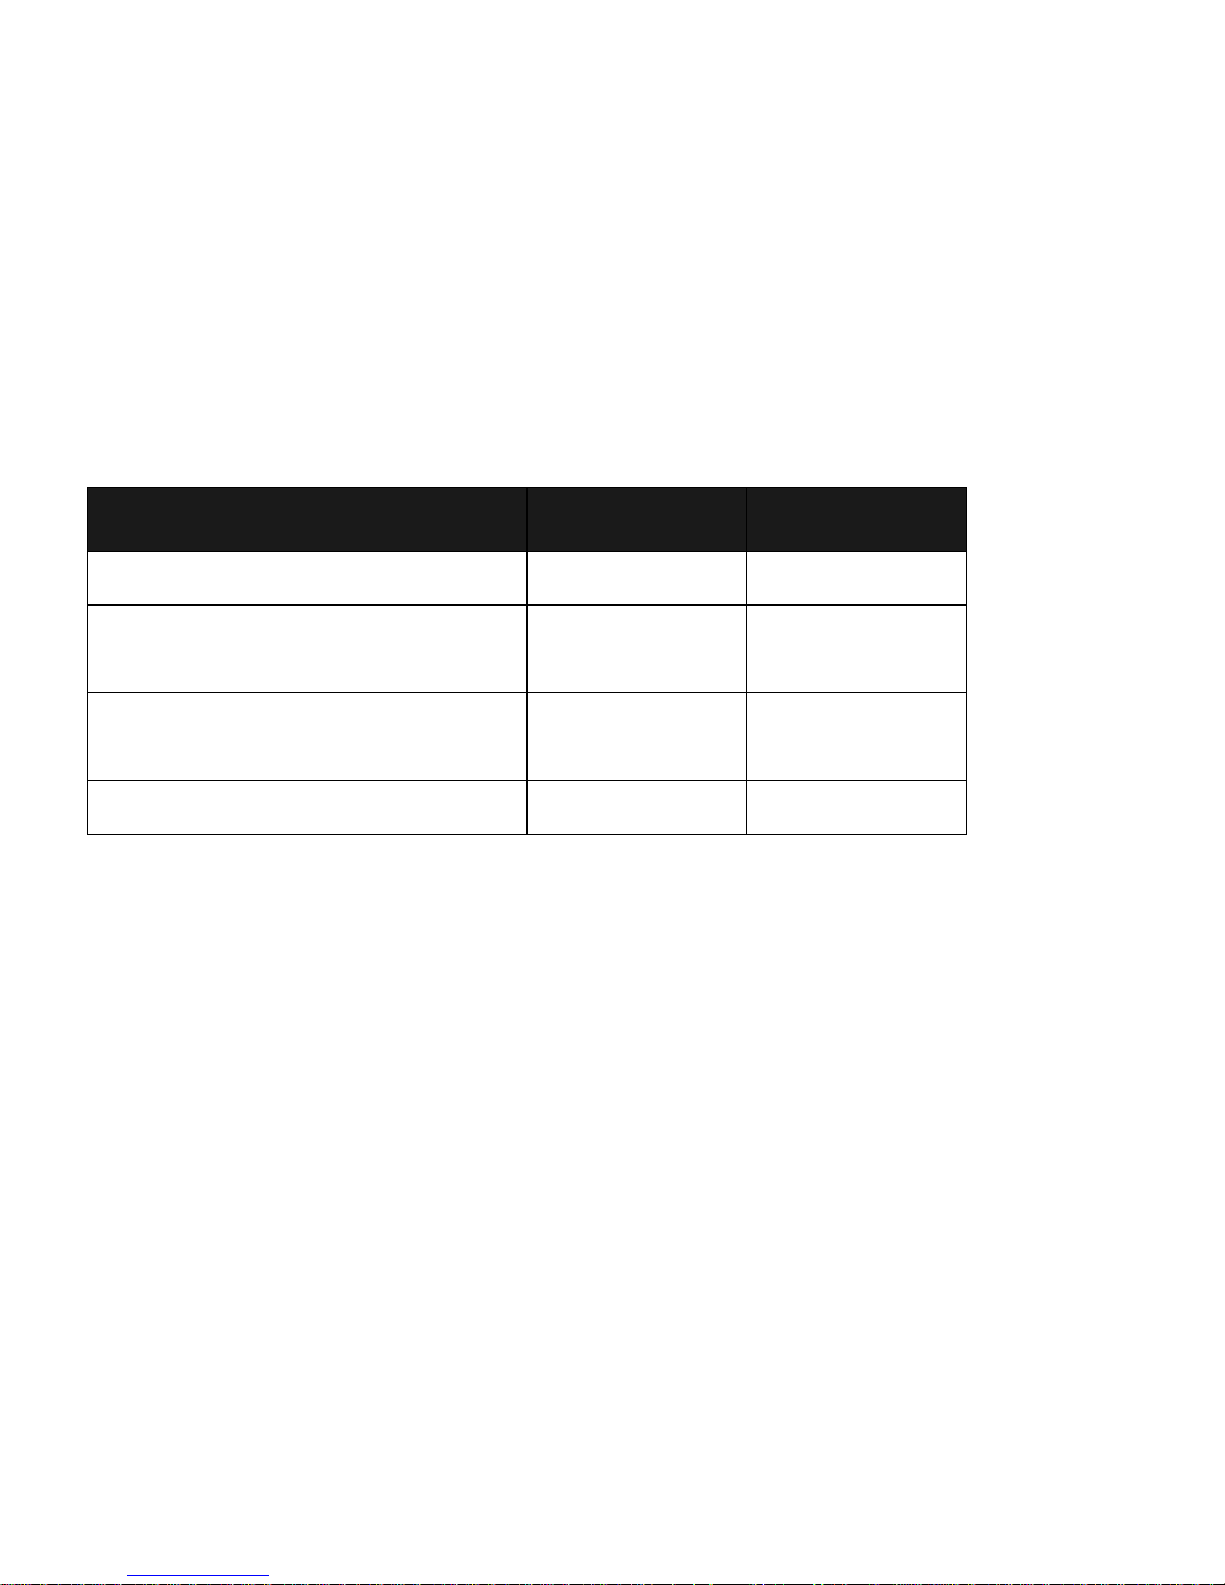
The following accessories are/will be available from CPO Science:
Software Updates and Website Information
You can find more information, such as answers to frequently asked questions and
updates to software and documentation for the CPO Science DataCollector, at the
CPO Science Support website:
http://support.cpo.com/
You can also sign up at the website to receive email when updates to the software
and documentation become available.
Table 8: Accessory List
Accessory Part No. Availability
Voltage Sensor 392-1512 Summer 2004
Adapter cable for Fourier Systems
Sensors
392-1511 Summer 2004
Adapter cable for Fourier Systems,
Vernier, and Pasco Photogates
392-1513 Fall 2004
Rechargeable Battery 392-1520 Fall 2004
Page 35

31
DATACOLLECTOR HANDHELD USER’S GUIDE
Glossary
Analog sensor . . . . . . a sensor that measures a continuous quantity, such as volt-
age, temperature, pH, etc. These sensors output a voltage from 0-5 V that
the DataCollector interprets as a value. As opposed to a Digital sensor.
App . . . . . . . . . . . . . . an application running on the Zire handheld.
Conduit . . . . . . . . . . . software running on a personal computer (on the Mac or
Windows operating system) that assists in transferring data from the Zire
handheld to the PC.
Digital sensor . . . . . . a sensor that only has two states: on and off. A photogate is
a digital sensor. As opposed to an Analog Sensor.
HotSync Manager . . . software running on a personal computer that, in
conjunction with the conduit, transfers data between the Zire handheld and
the PC.
Meter Only . . . . . . . . a type of DataCollector experiment. When running an
experiment in Meter Only mode in the DataCollector App, live values are
displayed on screen, but no data is recorded in the table.
Screen tabs . . . . . . . . four tabs at the bottom of the DataCollector App screen.
Switch between the Setup, Meter, Table, and Graph screens by tapping the
appropriate tab.
Status bar . . . . . . . . . a series of indicators at the top of the DataCollector App
screen showing which sensors are connected and the status of the current
experiment.
Page 36

Warranty Information
CPO Science warranties this instrument against defects in materials and
workmanship for a period of one year. Repair and/or replacement parts can
be obtained from CPO Science by sending the damaged or defective parts to:
CPO Science
26 Howley Street, 3rd Floor
Peabody, MA 01960
1-866-588-6951
support.cpo.com
Be sure to fill out the warranty card that came with your kit or register online
to receive important information and notification of software updates.
 Loading...