

Page 1

LEVEL MONITOR
MODEL 220
June 2017
220-M-V3.1
Page 2

Page 3

CONTENTS
1. Introduction 1
1.1 Model Number Designation 2
1.2 Intrinsic Safety Approvals 3
2. Specification 4
3. Operation 6
3.1 Display 6
3.1.1 Level Bar Graph 6
3.1.2 Contents 7
3.2 Front Panel Operation 8
3.2.1 Displaying Data 8
3.2.2 Changing Data 11
3.2.3 Timeout Condition 12
3.3 Test Mode 12
3.4 Alarms 13
3.4.1 Types of Alarms 14
3.4.2 Alarm Deadband 15
3.4.3 Alarm Action 15
3.4.4 Setting Alarms 17
3.5 Non-Linearity 18
3.6 Filtering 22
3.7 Density Correction 24
4. Programming 26
4.1 Program Steps 27
5. Signal Input 30
6. Alarm Outputs 31
Page 4

7. Installation 33
7.1 Wall Mounting 33
7.2 Panel Mount Version 34
7.3 Removing the Front Panel 35
7.4 The Main Electronics 37
7.5 Wiring 38
7.6 Maintenance 38
7.7 Terminal Designations 39
8. Intrinsic Safety Connections 40
Index 42
Page 5

Introduction
1
1. INTRODUCTION
The Model 220i Level Monitor is a microprocessor based instrument
which accepts a 4-20mA input and displays level and contents. It is
powered entirely from the 4-20mA loop and, therefore, does not require
an external power source.
Level is displayed in a bar graph as 0...100%. The contents are a 7 digit
numeric display which can be spanned in any engineering units.
The instrument is fully programmable; the user can program alarm settings,
span & zero levels and non-linear correction points. Calculation constants are
also set from the front panel and are stored in a non-volatile memory which
retains data indefinitely.
The Model 220i Rate Totaliser conforms to the EMC-Directive of the Council of
European Communities 2004/108/EC, the LVD directive 2006/95/EC and the
following standards:
EN61326:2013 Electrical equipment for measurement, control
and laboratory use – EMC requirements :
Residential, Commercial & Light Industry
Environment & Industrial Environment.
EN61010:2010 Safety requirements for electrical equipment
for measurement, control, and laboratory use.
In order to comply with these standards, the wiring instructions in Section 7.5
must be adhered to.
Page 6

Introduction
2
1.1 MODEL NUMBER DESIGNATION
The Model Number of the 220i describes the input and output options installed
and the mounting options.
220 i . 2 M
Model Mounting
220i Intrinsically Safe 1 Panel mount
version 2 Wall mount
6 2" pipe bracket
Approvals
C CSA USA/Canada approval
M ATEX/IECEx approval
Tank Conversion Software
220CSW
Page 7

Introduction
3
1.2 INTRINSIC SAFETY APPROVALS
The Model 220i is certified for use in hazardous areas and has IECEx, ATEX
and CSA US/C approvals.
The Model 220i certification details are:
IECEx Approval IECEx BVS 15.0099X
Rating Ex ia IIB T4 Gb
ATEX Approval BVS 15 ATEX E 106 X
Rating II 2G EX ia IIB T4 Gb
Ambient Temperature: Maximum ambient temperature of 60°C.
CSA U S/C Approval LR 104 840-5.
Type: Class 1, Groups C and D.
When installing in hazardous areas, the instrument will have to be
installed according to the guidelines given in Section 9 and in
accordance with standards for wiring and installation in hazardous
areas.
4-20mA Input
The input can be connected to IS circuits with the following maximum
values:
Ui = 28V
Ii = 93mA
Pi = 653mW
Relay Outputs
The outputs can be connected to IS circuits with the following
maximum
values:
Ui = 28V
Ii = 93mA
Pi = 653mW
Page 8

Specification
4
2. SPECIFICATION
General
Display: Continuously powered LCD.
Level: 30mm bar graph.
Level Span: 0...100% per full scale.
Contents: 7 digit with 4½ digit resolution, 12mm (0.5") high.
Contents Span: The units of measure (eg. litres) at full scale
of input signal. The contents span is
programmable in the range of 0.000...9,999,999.
Volume: Either "V olume" or "Contents" can be
displayed.
This is user programmable.
Decimal Points: Decimal point positions for contents
is programmable in range of 0...3
decimal points.
Signal Type: 4-20mA.
4-20mA
Resolution and Linearity: 0.05% of span.
Accuracy: 0.05% of span @ 25°C.
0.1% (typically) of span full temperature range.
Update Time: 0.5 second.
Connection: 2 wire.
Voltage Drop: 2.5V maximum.
Outputs
Type: 4 open collector output alarms suitable for
driving dc solenoids or external relays. The
outputs
provide:
1. high-high.
2. high.
3. low.
4. low-low.
Switching Power: 200mA. 30Vdc maximum.
Saturation V oltage: 0.8Vdc across the output in the "on" state.
Isolation: All outputs are separately opto-isolated.
Page 9

Specification
5
Physical
Operating Temperature: -20°C to 60°C.
Dimensions: 97mm (3.8") high x 150mm (5.9") wide x
41mm (1.6") deep (not including cable glands).
Protection: Nema 4X or IP67 standards.
Cable Entry: Cable glands.
Mounting: Universal mounting bracket is supplied as
standard.
Pipe Mounting: A galvanised metal bracket is available which
enables the instrument to be mounted on a
2"horizontal or vertical pipe.
Page 10
Operation
6
3. OPERATION
The Model 220i Level Monitor accepts a 4-20mA input signal from a level
sensor such as a pressure transmitter, ultrasonic sensor or capacitance probe.
The instrument is powered entirely from the loop and, therefore, requires no
external power or internal batteries.
The instrument is fully programmable with all operating parameters
and calculation constants programmable from the front panel (see
Section 4.1). The setup parameters are stored in a non-volatile
memory and are retained for at least 10 years in the event of a
power loss.
3.1 DISPLAY
The display of the Model 220i comprises of:
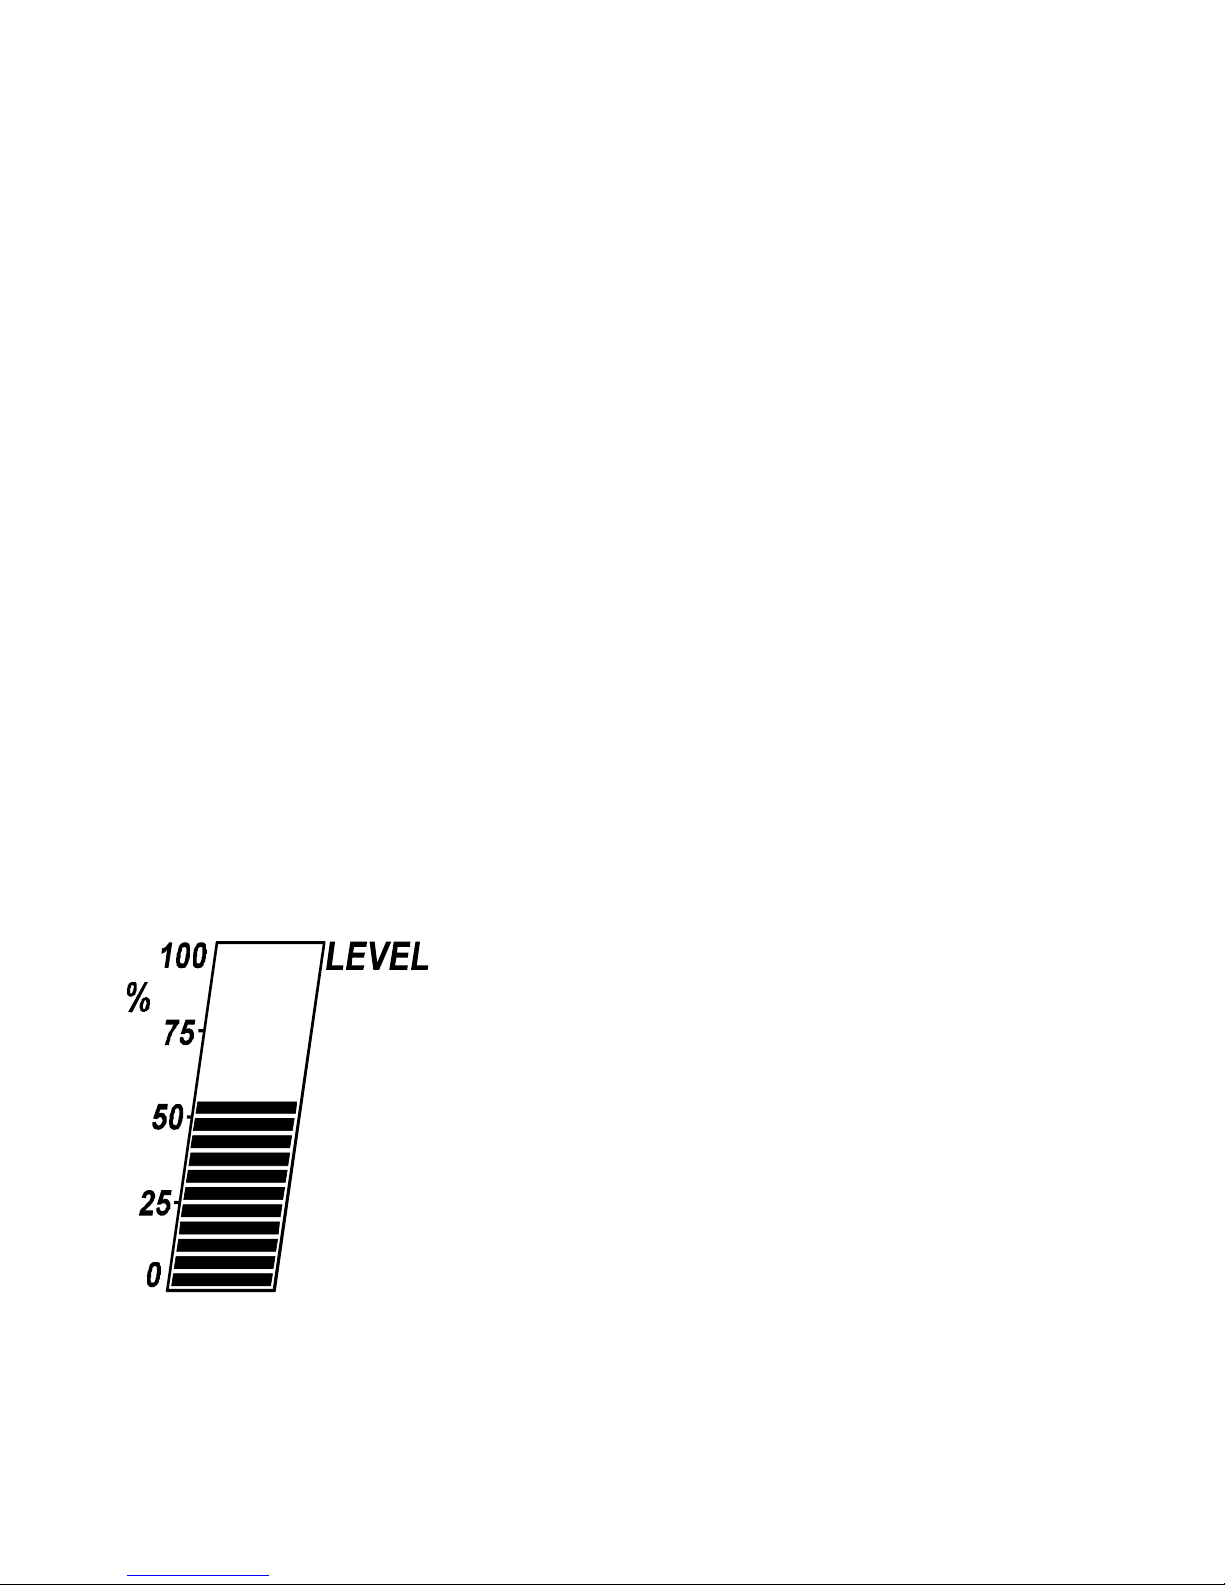
Level Bar Graph
Contents
3.1.1 Level Bar Graph
The level bar graph displays the vertical level
of liquid as a percentage.
Inputs of 4mA and 20mA can be programmed
to correspond to 0% and 100% respectively, or
can be inverted so that 4mA will correspond to
100% and 20mA will correspond to 0%.
Note that the level is corrected for density
(if applicable) as described in Section 3.7.
Page 11
Operation
7
3.1.2 Contents
The contents is a 7 digit numeric display where the span can be
programmed during setup to read in any engineering units. The contents
are displayed with 4½ resolution in respect to the maximum contents.
For example, if the maximum contents is 1234567, the display will show up
to 5 digits plus trailing zeros. At different inputs the following will be
displayed:
1234567 will be displayed as 1234500; 234567 will be displayed as 2345000.
However, if the first digit is greater than 1, then up to 4 digits only will
be displayed with trailing zeros. For example, if the maximum contents is
2345678, then at different inputs:
2345678 will be displayed as 2345000; 345678 will be displayed as 345000.
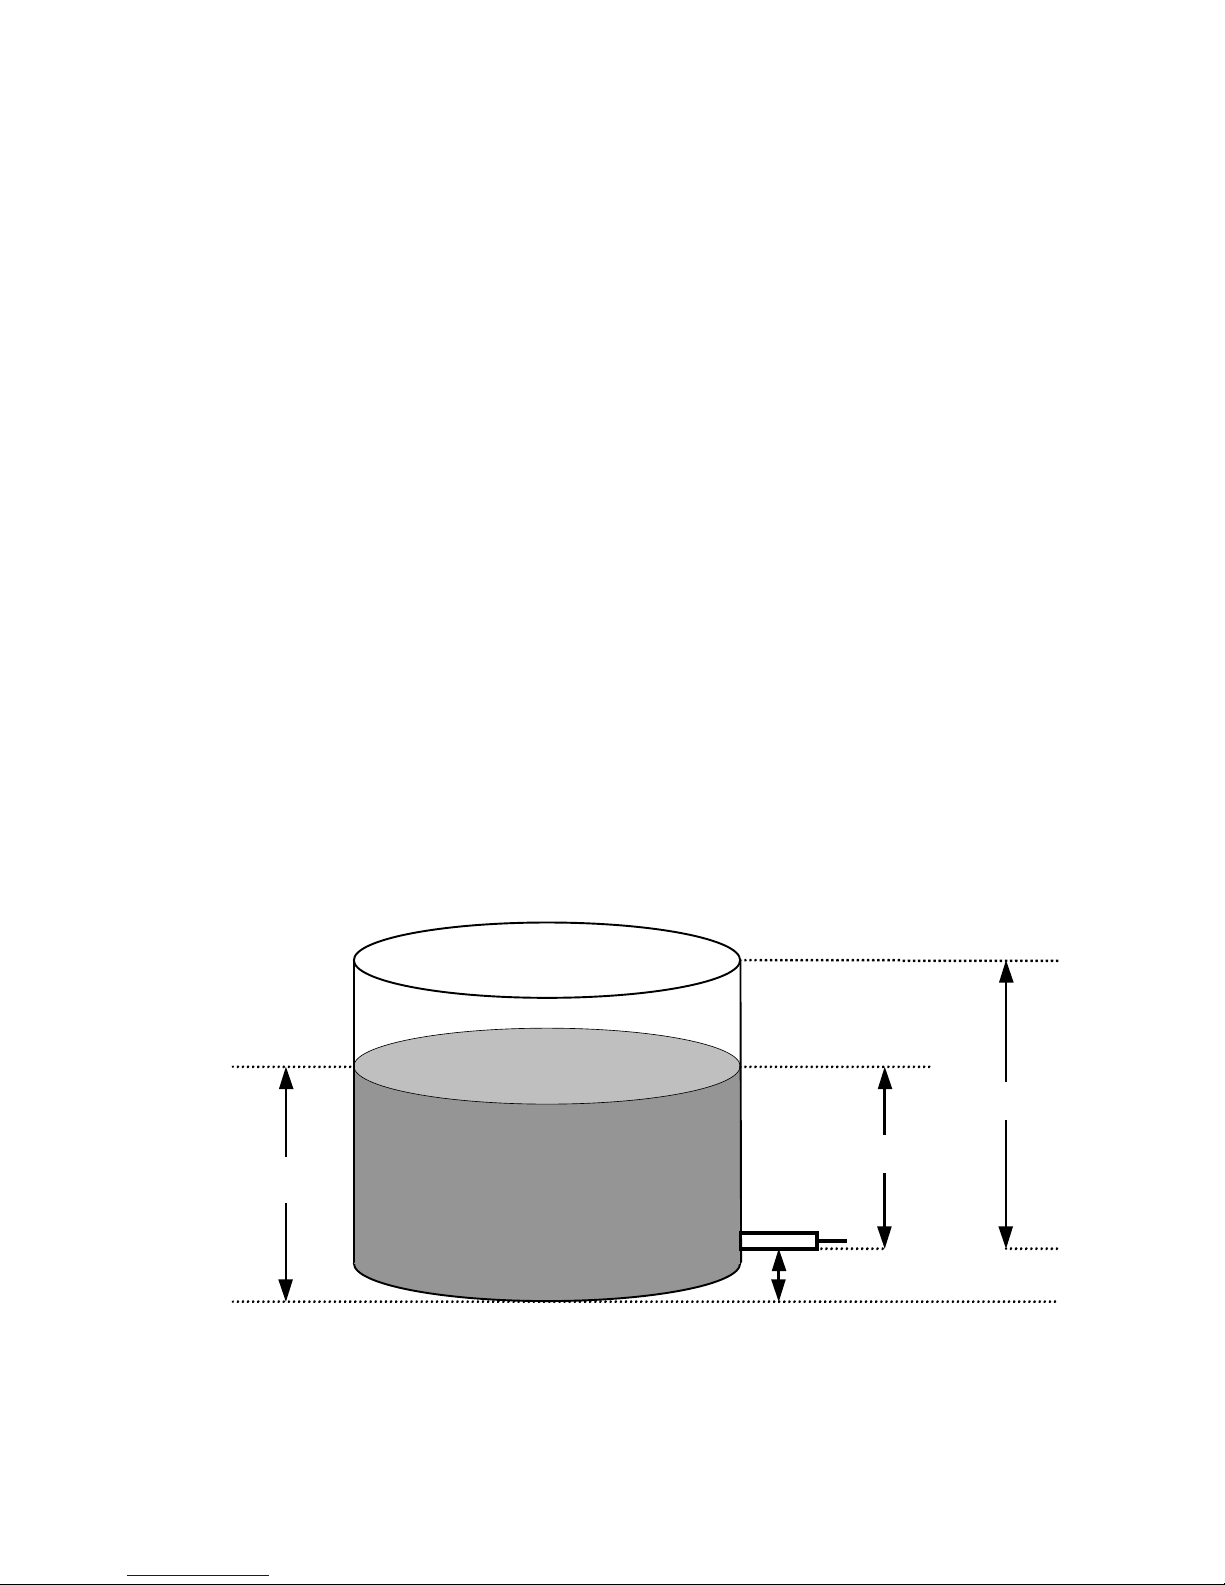
CALCULATION OF CONTENTS
For a linear tank the contents is calculated as follows:
Contents = (Span) x (% Level) + Offset
Transmitter
OFFSET
% LEVEL
SPAN
Zero
Contents
Page 12
Operation
8
3.2 FRONT PANEL OPERATION
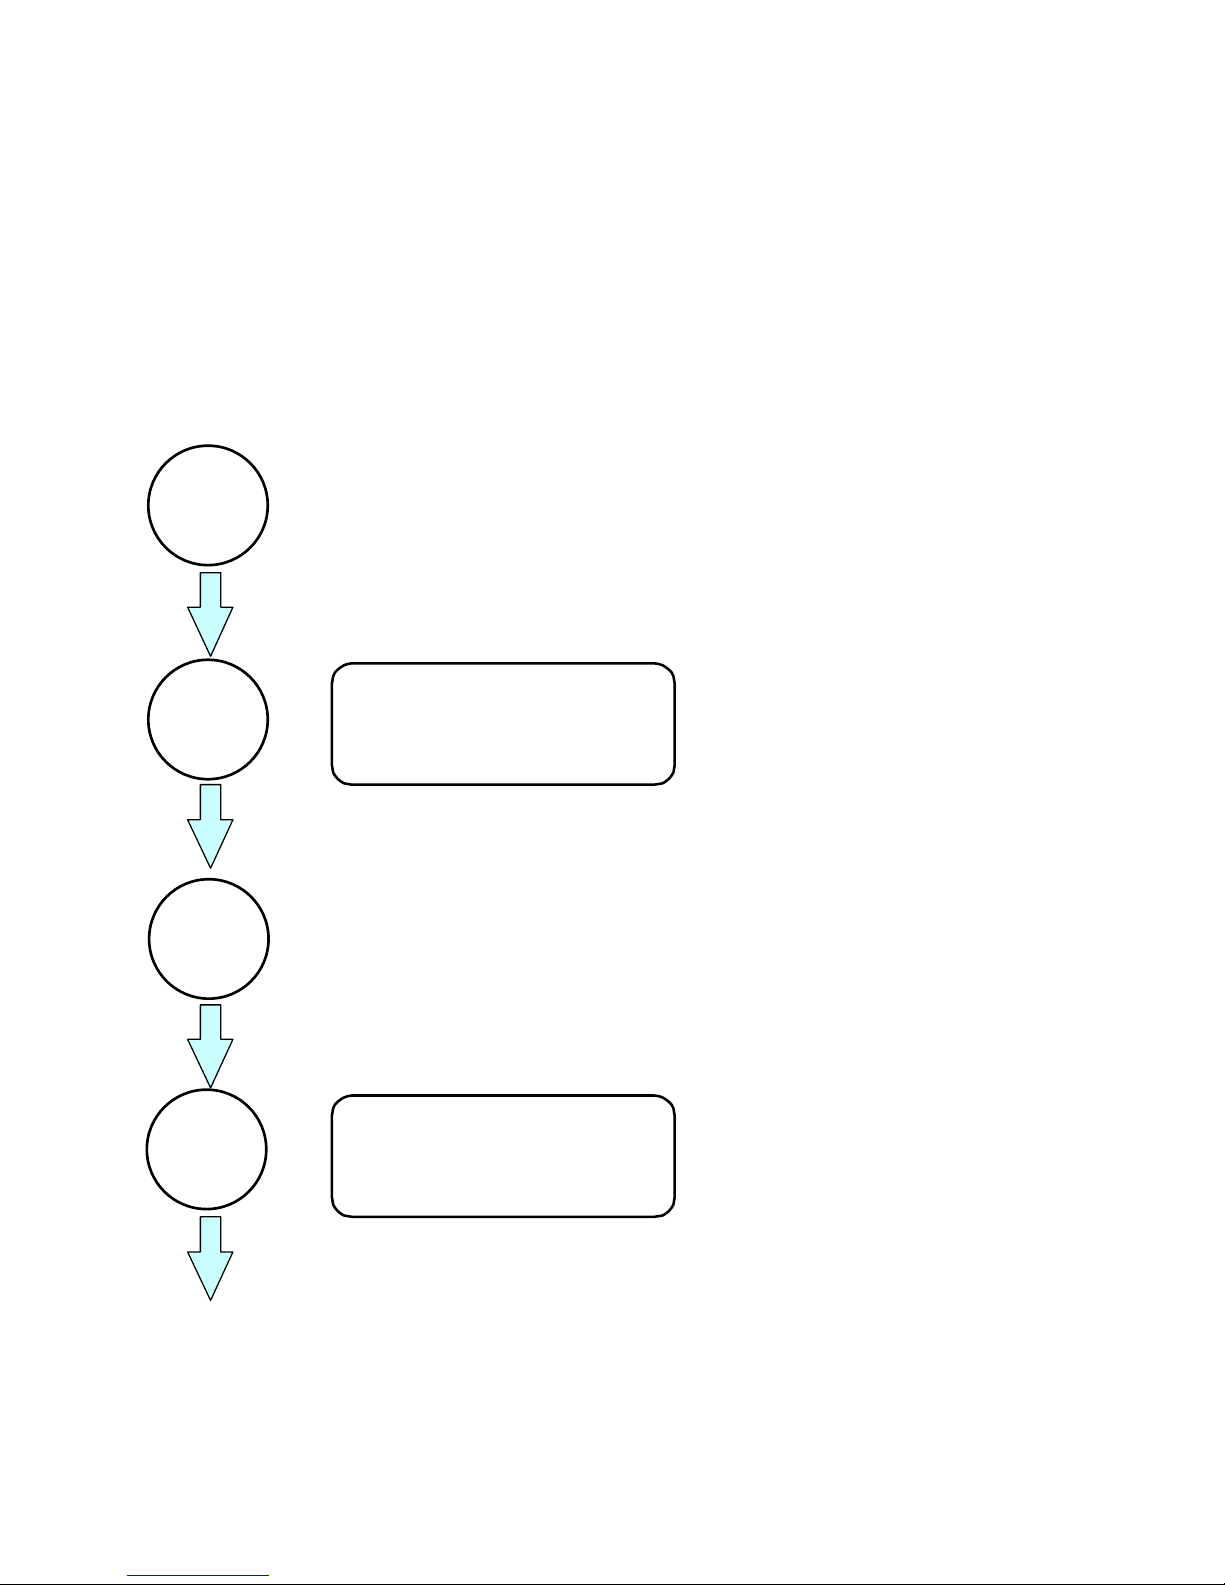
3.2.1 Displaying Data
The alarm setpoints and density correction factor can be viewed by pressing
the DISPLAY key.
Key action What you will see What this means
If there are flashing alarms on
the display they will stop
flashing.
Acknowledges alarms if
alarms are flashing on
the display.
High-high alarm.
The value of the high-high
alarm.
The high-high alarm
setpoint as a % of
maximum level or
contents value.
High alarm.
AL-HH
AL-HI
DISPLAY
DISPLAY
DISPLAY
DISPLAY
Page 13
Operation
9
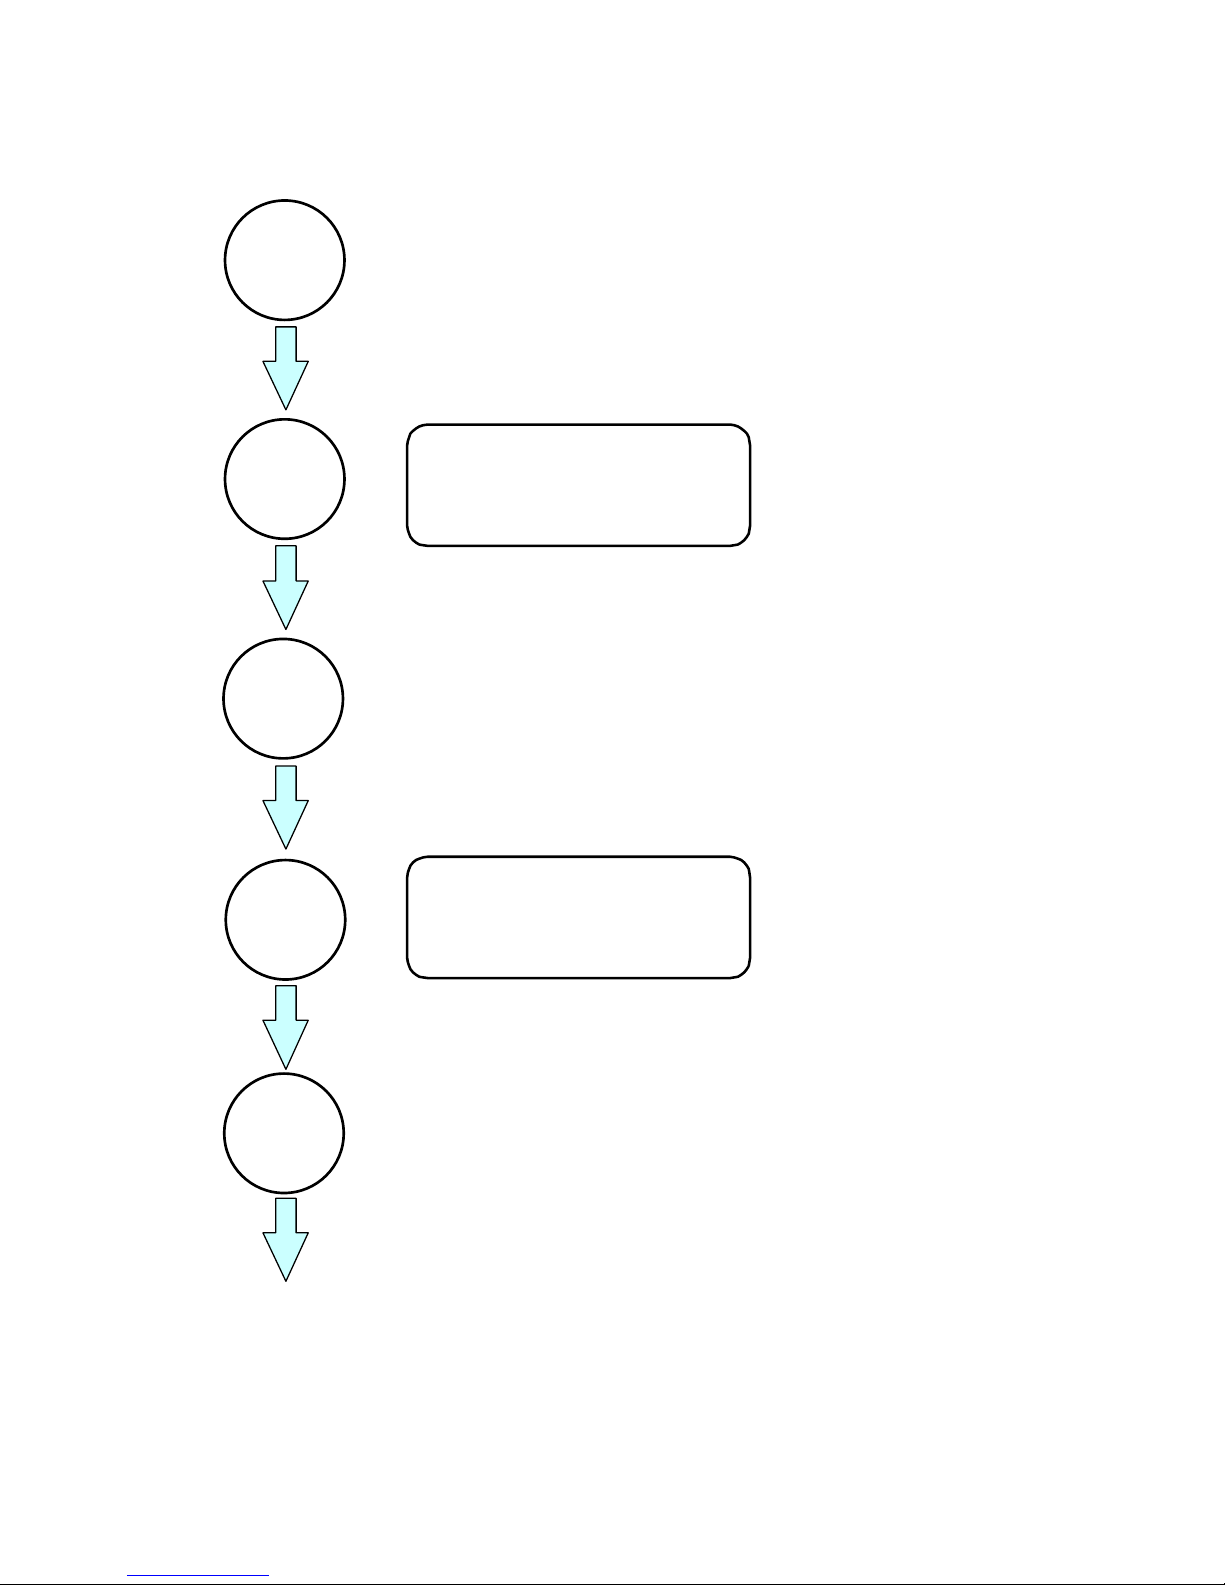
Key action What you will see What this
The value of the high alarm.
The high alarm setpoint
as a % of maximum level
or contents value.
Low alarm.
The value of the low alarm.
The low alarm setpoint
as a % of maximum level
of contents value.
Low-low alarm.
The value of the low-low
alarm.
The low alarm setpoint
as a % of maximum level
or contents value.
AL-LO
AL-LL
DISPLAY
DISPLAY
DISPLAY
DISPLAY
DISPLAY
Page 14
Operation
10
Key action What you will see What this
Density correction
The value of the density
correction factor.
A factor for those
applications where the
density of the fluid in
the tank is likely to
change (default of
1.000).
Returns to contents display.
DISPLAY
DISPLAY
DISPLAY
dc
Page 15
Operation
11
3.2.2 Changing Data
Each of the above parameters can be changed as follows:
1. Pressing the DISPLAY key consecutively until the numeric value of the
parameter to be changed appears (as described in the previous diagram).
2. This value can then be changed using the following keys:
This key steps from digit to digit, causing the
digit to flash. Only flashing digits can be
changed.
This key increments the flashing digit.
Example.
To change the high alarm setpoint to 75:
1. Press DISPLAY until the value of the high alarm appears. This will be
the value after AL-HI.
2. The first digit is flashing, this means it can be changed. Using
the key, this digit is changed to 7.
3. The key is pressed so that the second digit flashes.
4. Using the key, this digit is changed to 5.
Note that the Model 220i can be programmed so that the above parameters
cannot be changed, see Section 4.1.
Page 16

Operation
12
3.2.3 Timeout Condition
Upon entering the display mode, if no key is pressed for 10 seconds, the
display returns to the contents display with alarm acknowledgment cleared.
3.3 TEST MODE
The 220i has a test mode which can be entered by simultaneously pressing
all 3 front panel keys. There are 3 tests:
Low Test By pressing the key, the low and low-low
alarms outputs will be energised.
High Test By pressing the key, the high and high-high
alarm outputs will be energised.
Display Test By pressing the DISPLAY key, all segments of the
display will flash.
To exit the test mode all three keys are pressed simultaneously.
Page 17
Operation
13
3.4 ALARMS
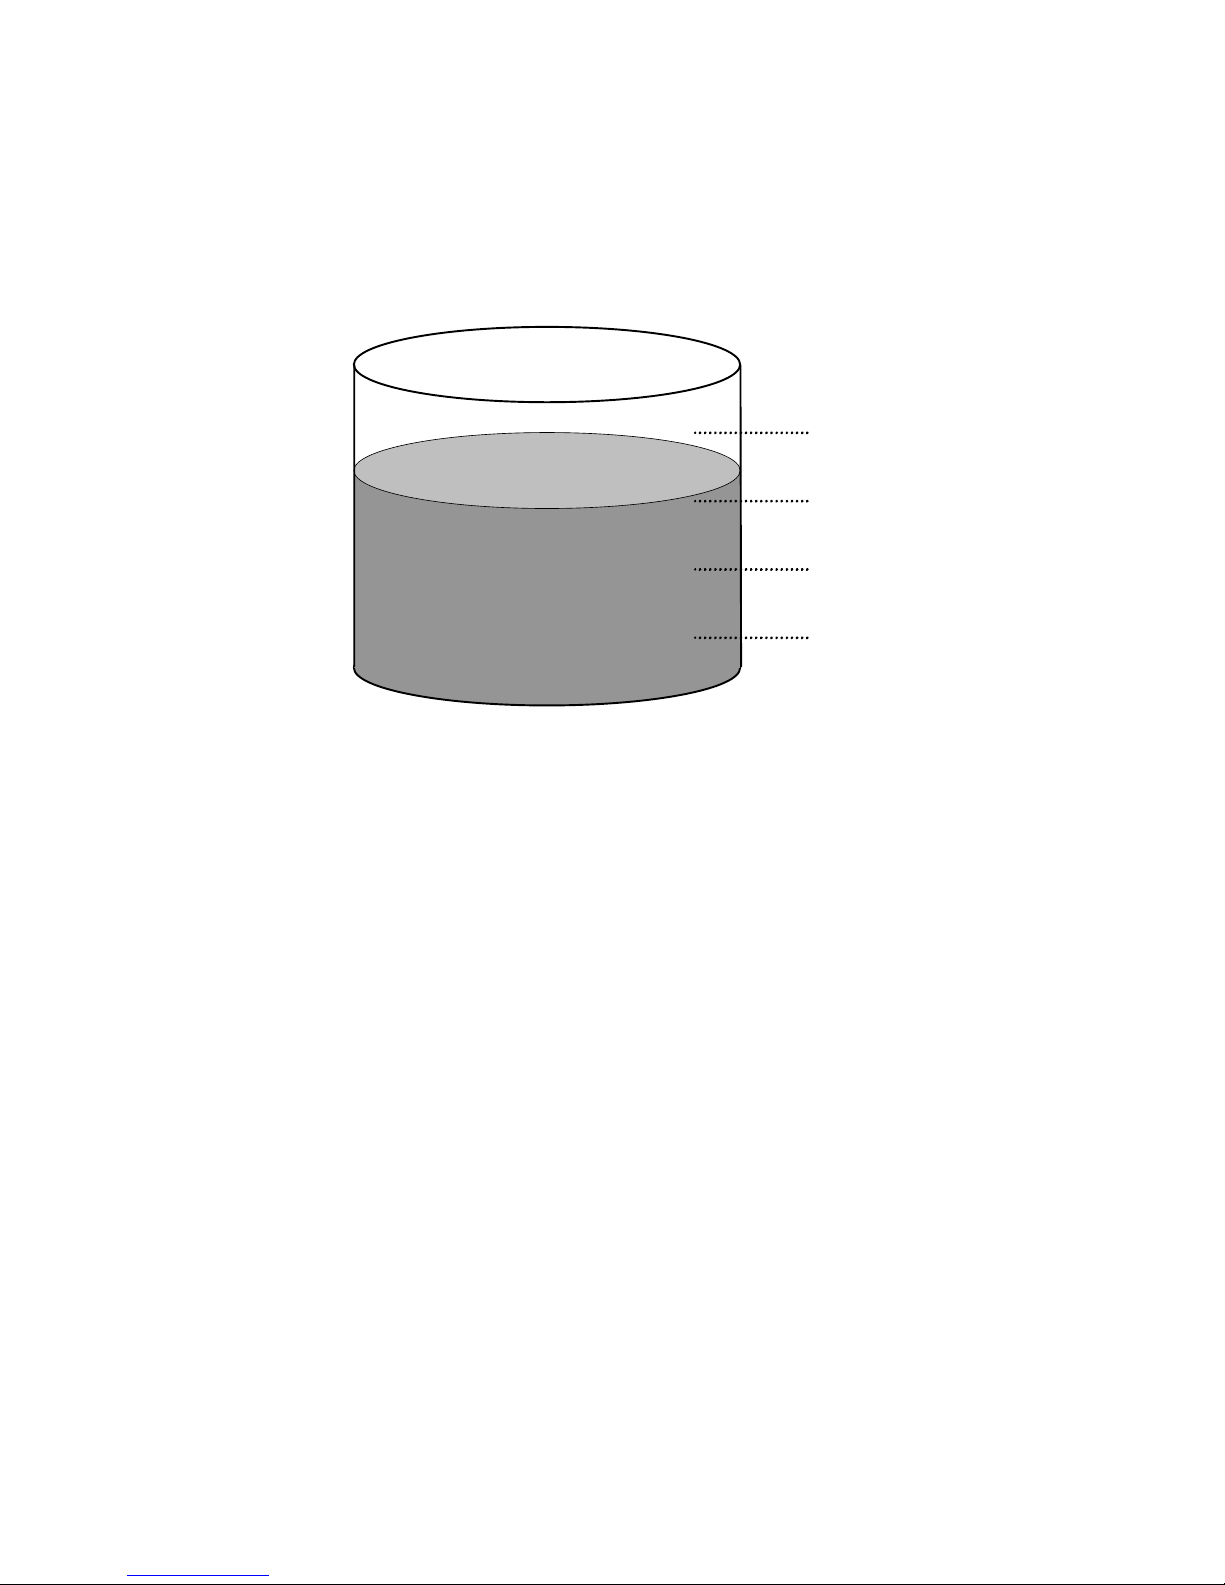
The Model 220i has 4 alarm outputs:
The alarms can be assigned to level or contents which is done
during programming (see Section 4.1). Each alarm is individually
programmed as a percentage (0-100%) of level or contents.
All of the alarms have open collector outputs and are separately isolated via
opto-isolators. The outputs are internally protected against voltage spikes
caused by relays and coils.
High-High (HH)
High (H)
Low (L)
Low-Low (LL)
Page 18

Operation
14
3.4.1 Types of Alarms
3.4.1.1 Alarm Output
The Model 220i can be programmed for the alarm outputs to operate in one of
two ways:
1. the alarm outputs can energise (switch on) during an alarm condition, or
2. the alarm outputs can de-energise (switch off) during an alarm condition.
3.4.1.2 High Alarms
The high alarms will be activated when the contents or level in the tank
increase above the high alarm setpoints. These alarms will be deactivated
when the contents or level falls below these programmed setpoints.
When setting the alarms, the high-high alarm should be set higher than the
high alarm.
3.4.1.3 Low Alarms
The low alarms will be activated when the level or contents in the tank falls
below the low alarm setpoints. These alarms will be deactivated when the
level exceeds the programmed setpoint.
Similarly, when setting the low alarms, the low-low alarm should be set below
the low alarm.
Page 19

Operation
15
3.4.2 Alarm Deadband
To prevent an alarm toggling on and off when the level is close to the
setpoint, a user programmable deadband is provided. The deadband is a
percentage (0-100%) of the maximum level or contents.
Example 1.
If the low alarm is set to 20% and the deadband is set to 5%, the alarm will
be activated when the level reaches 20%. The alarm will then stay
activated until the level increases above 25%.
Example 2.
If the high alarm and deadband are set at 80% and 5% respectively, the
alarm will be activated at 80% and will stay activated until the level falls
below 75%.
3.4.3 Alarm Action
When an alarm condition exists the Model 220i will act in the following way:
1. The appropriate alarm output will be activated.
2. The display will flash the name of the alarm.
3. In some cases these alarms may be acknowledged from the front
panel.
This will depend on whether they are programmed as continuous
or acknowledgeable alarms. This is set up during programming
(see Section 4.1).
The differences between acknowledging continuous and acknowledgeable
alarms are described in table on the following page.
Page 20

Operation
16
Acknowledgeable Alarms
Continuous Alarms
1. These alarms are acknowledged
by pressing the DISPLAY key.
1. A continuous alarm cannot be
acknowledged.
2. Once the alarm is acknowledged
the flashing on the LCD will
cease, with the alarm message
remaining solid. The message
will remain on the screen until
the alarm condition no longer
exists.
2. The flashing on the LCD cannot
be stopped and will keep
flashing until the alarm
condition no longer exists.
3. Once the alarm is
acknowledged,the alarm
output will be deactivated.
3. The alarms will only be
deactivated when the level
(or contents) is outside
alarm conditions.
Note that acknowledging the
LL alarm will also acknowledge
(and deactivate) the L alarm.
Similarly, acknowledging the HH
alarm will also acknowledge
(and deactivate) the H alarm.
Page 21

Operation
17
3.4.4 Setting Alarms
To set any of the alarms:
1. Press the DISPLAY key until the name of the alarm to be changed
appears (see Section 3.2.1).
2. Use the and keys to change the value of the alarm.
3. Press the DISPLAY key until the original level/contents screen appears.
Page 22
Operation
18
3.5 NON-LINEARITY
The Model 220i can be programmed to correct for the non-linearities in
irregular shaped tanks. These tanks have a non-linear relationship between
the height of liquid and the volume of liquid.
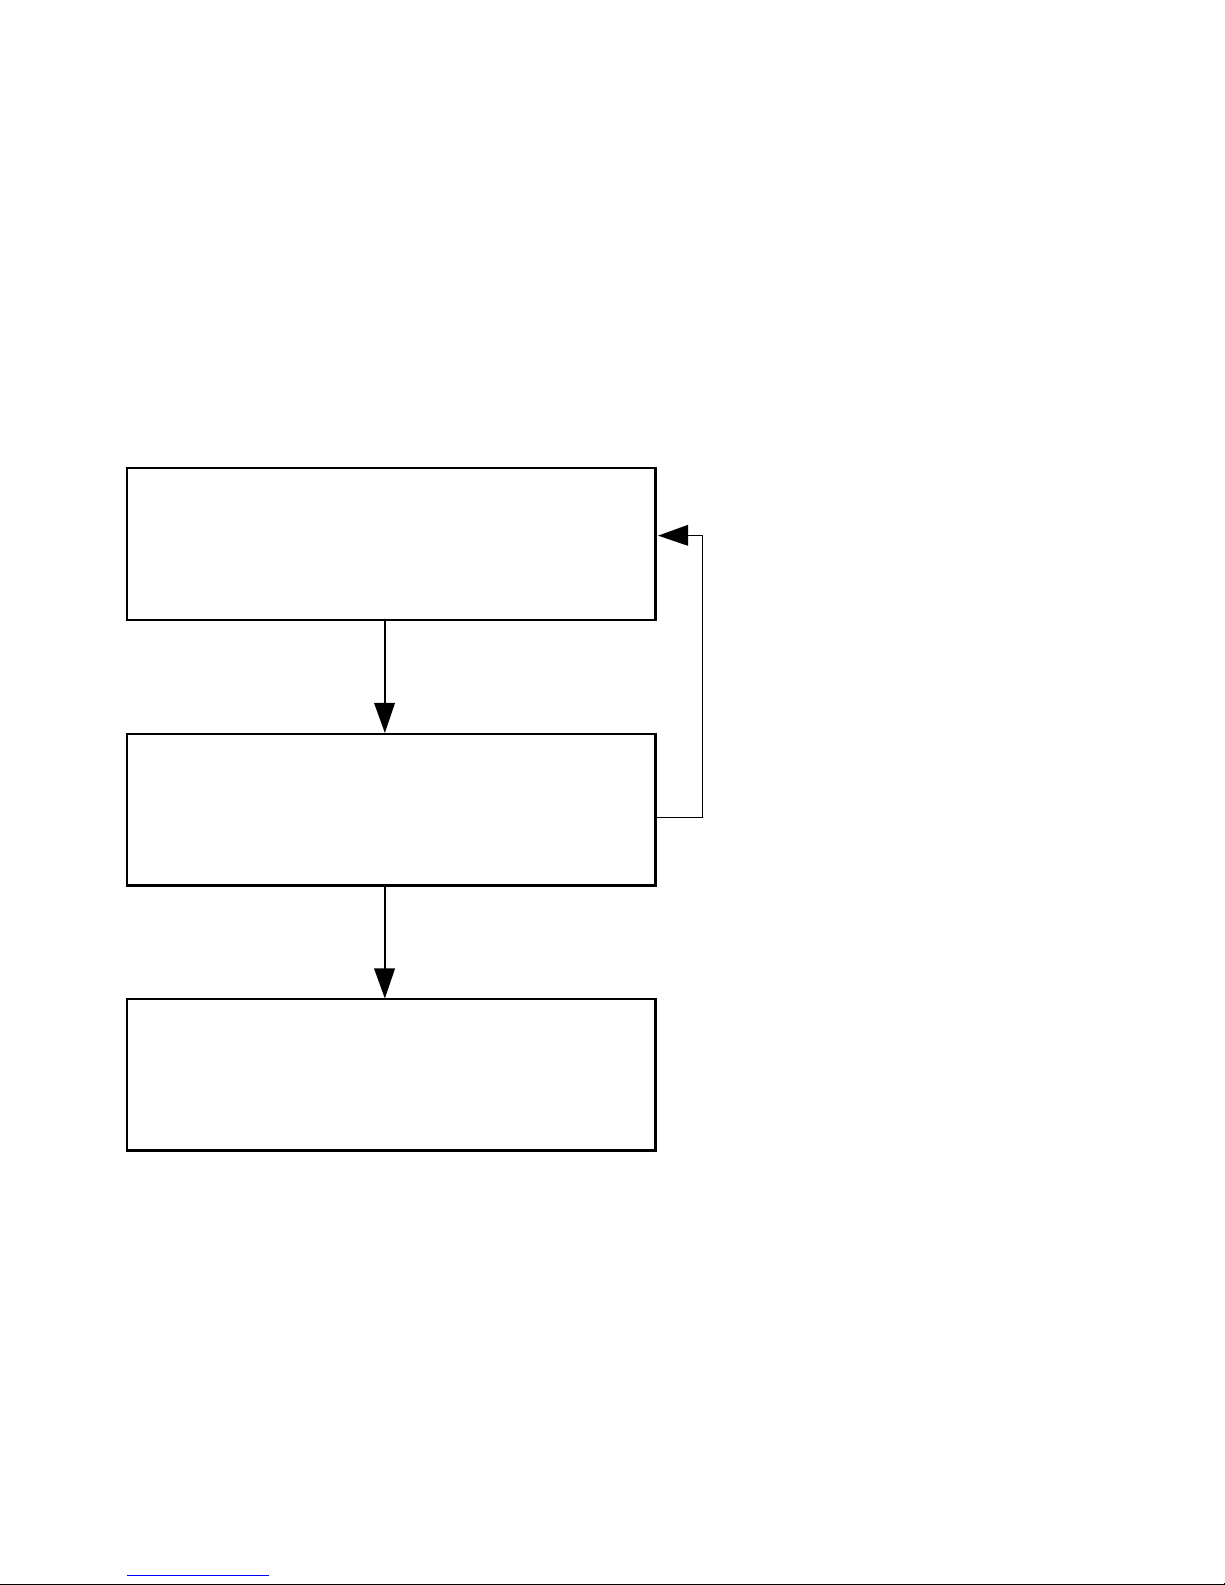
A correction table, which corrects for non-linearities between the level signal
and the volume, can be programmed during setup. This table works as
follows:
The user programs a normalised
(between 0 & 1) level (input)
signal.
The user programs the corresponding
corrected volume (output)
point,which is also normalised.
The Model 220 performs a linear
interpolation between these points to
obtain a profile of input signal versus
corrected output for the volume of the tank.
Up to 25 points can
be programmed this
way.
The number of points
programmed is user
determined and will
depend on the shape
of the tank.
Page 23

Operation
19
DETERMINING THE NON-LINEAR CORRECTION TABLE
Data on tank non-linearity is usually supplied by the tank manufacturer, in the
form of strapping tables. If this data is not available, the user will need to
determine the relationship between level and volume. This can be done
mathematically by equations, or experimentally, by conducting physical
measurements.
In either case, the data must be normalised. An example of this is shown
below:
Example.
A spherical tank has a diameter of 10m. The zero is at 0.5m and the span
is 10m. The following 15 point relationship has been determined
:
Input Volume
Normalised Inputs
for Table
Level (m)
Level T'mitter
Output
m
3
Input Output
0.5 4mA 3.796 0.000 0.000
1
1.094 17.421 0.0630 0.026
2
1.688 39.699 0.125 0.069
3
2.281 69.314 0.188 0.126
4
2.875 104.951 0.250 0.195
5
3.469 145.295 0.313 0.272
6
4.063 189.031 0.375 0.356
7
4.656 234.844 0.438 0.444
8
5.250 281.418 0.500 0.534
9
5.844 327.438 0.563 0.623
10
6.438 371.590 0.625 0.708
11
7.031 412.557 0.688 0.786
12
7.625 449.025 0.750 0.857
13
8.219 479.678 0.813 0.916
14
8.813 503.202 0.875 0.961
15
9.406 518.280 0.938 0.990
10.000 20mA 523.599 1.000 1.000
Page 24

Operation
20
Where,
So, for example, at 9.406m the normalised input is:
Similarly,
So, for example, at 9.406m the volume is 518.280m3 and the normalised output is:
Normalised Input =
Level
Level at 20mA
=
Level - (Level at Zero)
(Level at Span) - (Level at Zero)
If the Zero is > 0
Normalised Output =
Volume
Volume at 20mA
=
Volume - (Volume at Zero)
(V olume at Span) - (V olume at Zero)
If the Zero is > 0
=
(518.280 - 3.796)
(523.599 - 3.796)
= 0.990
=
(9.406 - 0.5)
10 - 0.5
= 0.938
Page 25

Operation
21
SELECTING THE NUMBER OF POINTS FOR NON-LINEAR
CORRECTION
The user can program up to 25 points. However, the values at 4mA or
20mA which are set at 0 and 1 respectively, are not programmed. It is
not always necessary to program all 25 points, as it will depend on the
shape of the tank.
Tank Conversion Software
Tank Conversion Software 220CSW can be used to calculate theoretical
non-linearity correction tables for the most commonly used tank shapes
(spherical,conical and cylindrical tanks).
The output from the program can be printed and is in a format suitable for
direct programming into the Model 220i. The program runs on a Windows 95
(or higher)operating system.
The software is only available from our website www.contrec.co.uk and can
be downloaded free of charge.
Page 26

Operation
22
3.6 FILTERING
Input fluctuations caused by tank agitation can interfere with the stability of
the level and contents readings. For this reason, the Model 220i has a
digital filter which will average out these fluctuations and enable accurate
readings.
The degree of filtering of the input signal can be adjusted, depending on
the amount of fluctuation and the particular application. Values from 1
to 99 can be programmed, where 1 corresponds to no filtering and 99
corresponds to heavy filtering. Such flexibility in filtering means that
highly accurate and stable readings can be obtained.
When programming the degree of filtering, it is advisable to start with no
filtering (the factor equals 1) and gradually increase until a steady reading is
obtained. It is important that the filtering is not too heavy because this will
cause an over damped response.
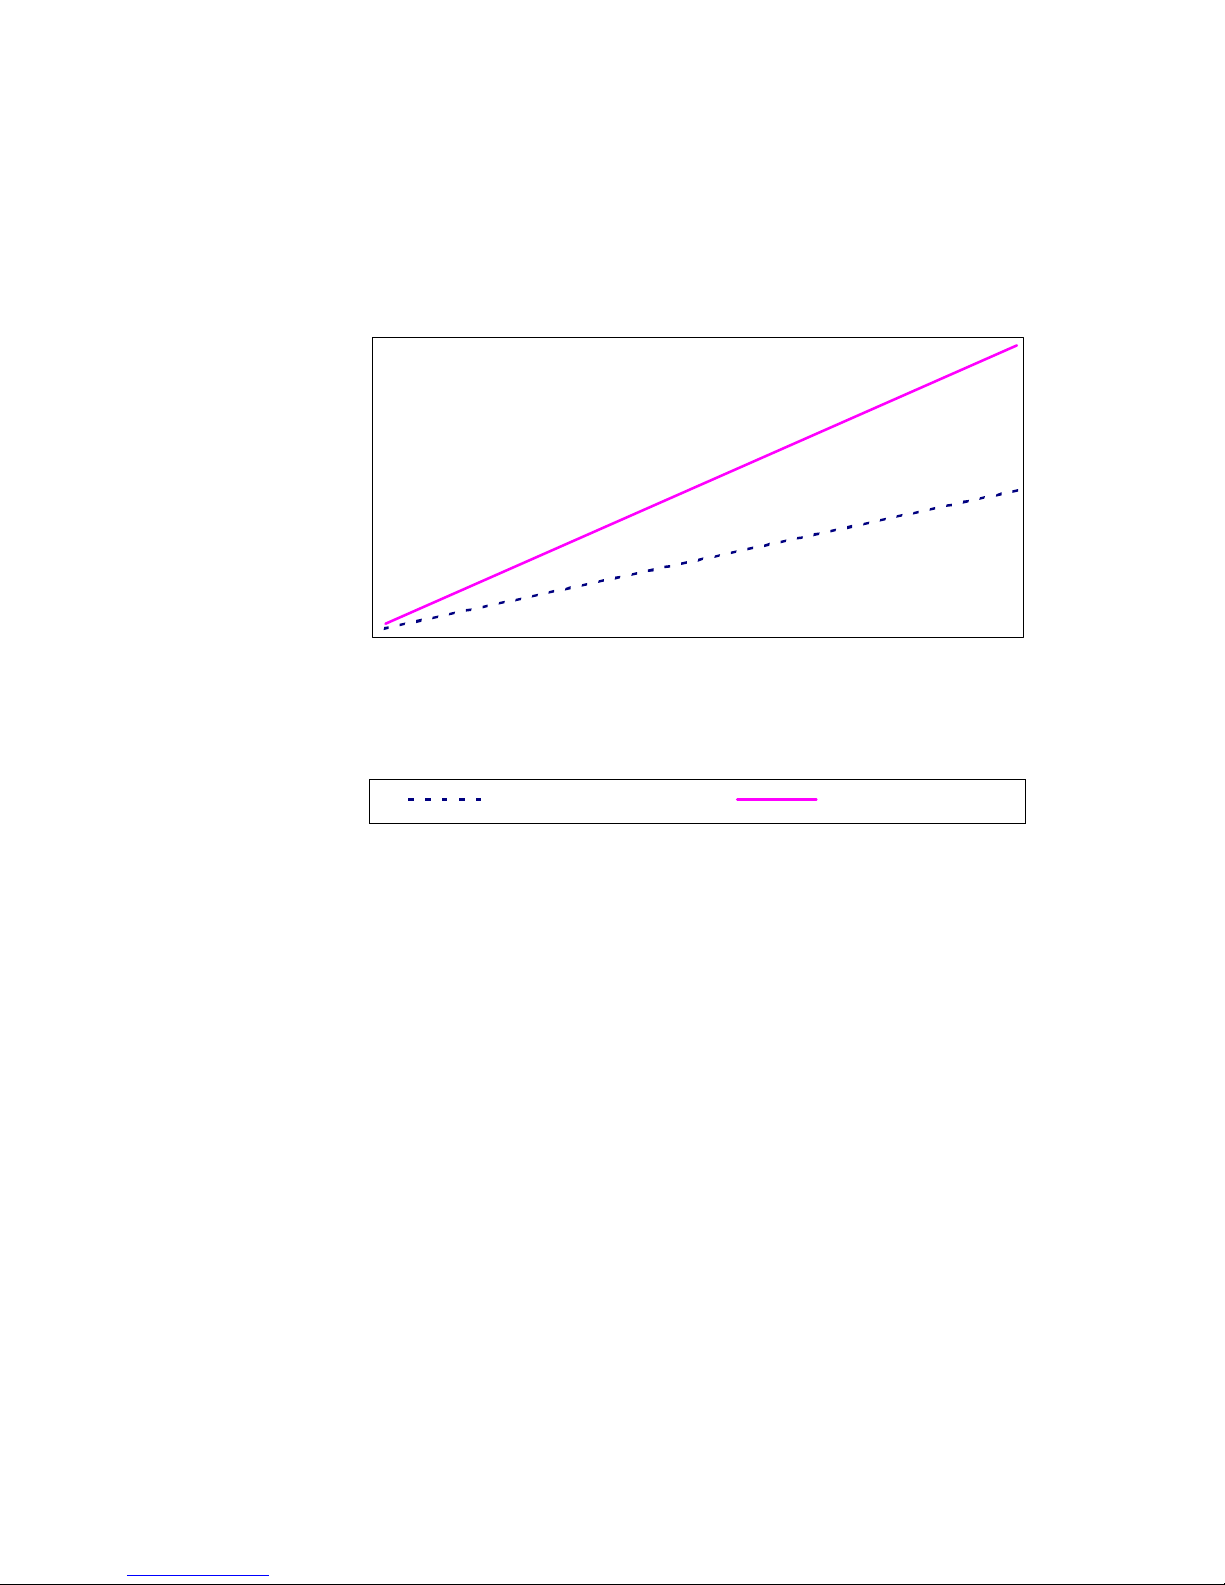
The following graph shows the time to reach 90% and 99% of a new reading
for a step change in input signal.
Page 27
Operation
23
Filter Factor vs Time to Reach New Reading
(for a step change in input signal)
0
20
40
60
80
100
120
0 10 20 30 40 50 60 70 80 90 100
Filter Factor
Time to Reach 90% and 99%
of New Reading (secs)
90% of Ne w Reading 99% of Ne w Rea din g
Page 28

Operation
24
3.7 DENSITY CORRECTION
In some cases, a pressure transmitter will be used to provide the 4-20mA
signal to the Model 220i. In these cases, a density correction factor (KD) can
be manually entered to compensate for those applications where the density
of the fluid in the tank is likely to change. This would be the case if, initially, a
particular fluid is stored in the tank and at a later stage a fluid of a different
density is stored in the tank.
The density correction factor should initially be set to 1.000 when the Model
220i is calibrated for a given tank or vessel. If, at a later stage, a fluid of
different density is stored in the tank, then it is only necessary to reprogram
the density correction factor, rather than conducting a complete recalibration
of the Model 220i.
The density correction factor is the ratio of the density of the fluid which
was originally in the tank, to the density of the new fluid.
This can be expressed as follows:
The density correction factor is then used to calculate level as:
Level = KD x Input Signal
where the input is normalised between 0% (4mA or 20mA if inverted)
and 100% (20mA or 4mA).
The level is limited to 100% so that values of K
D
which result in a level
greater
than this will be displayed as 100%.
Density Correction Factor (K D) =
Density Value at Calibration
New DensityValue
Page 29

Operation
25
Example.
A tank is initially filled with toluene, which has a density at standard
conditions of 866 kg/m3. The Model 220i and a level transmitter are
calibrated for the volume in this tank and the density correction factor (KD)
is set to 1.000.
At a later date, the tank is filled with acetone, whose density at
standard conditions is 791 kg/m3.
The density correction factor is calculated as follows:
This value of KD is then programmed during setup (see Section 3.2.2).
K
866
791
11
D
= = .
Page 30
Programming
26
4. PROGRAMMING
The Model 220i is fully programmable with all parameters being stored
in memory.
To enter the Program Mode:
Remove the lower cover strip (the dark grey strip along the bottom of the
front of the enclosure) and replace it the reverse side up. This brings a
small magnet on the inside of the cover strip in contact with a reed switch
inside the instrument. The word "Set" is then displayed.
To exit Program Mode:
The grey strip should be replaced the correct way up.
The key switch actions are as follows:
This key steps from digit to digit, causing the
digit to flash.
This key will increment a flashing digit or change
a parameter selection.
This key will step through the program sequence.
In stepping through the program sequence (using the DISPLAY key),
the parameter description is displayed first, followed by the actual
value or parameter. When a value or parameter can be changed it is
shown as flashing.
DISPLAY
Page 31

Programming
27
4.1 PROGRAM STEPS
Step Display Description
1
SET
Level
Cont
Select whether alarms are assigned to level
or contents.
Alarms are assigned to level.
Alarms are assigned to contents.
2
TYPE
NE
ND
Select whether alarms are normally energised
or normally de-energised.
Normally energised.
Normally de-energised.
3
ACT
N-AC
AC
Select type of alarm action, either continuous
on alarm condition or cancels when alarm is
acknowledged.
Continuous on alarm condition.
Acknowledged and cancelled with display key.
4
DBAND
xx.xx
Alarm deadband.
Program alarm deadband as a % of maximum
level or contents value.
5
FILT
1
to
99
The filter constant for filtering the input signal.
No filtering.
Very heavy filtering.
Page 32

Programming
28
Step Display Description
6
INPUT
N-INV
INV
Select input type; either inverted or
non-inverted.
Non-inverted (zero at 4mA).
Inverted (zero at 20mA).
7
DISP
En
Dis
Select enable or disable. This will allow
(enable) or not allow (disable) the user to
change the alarm setpoints and the density
correction factor from the DISPLAY key.
Enable the changing of alarm setpoints
and density correction factor.
Disable changing alarm setpoints and
density correction factor.
8
UNIT
Cont
Vol
Select whether the word "Contents" or
"Volume" is displayed on the LCD.
"Contents" will be displayed.
The word "Volume" will be displayed in
preference to Contents. (Note there is
no difference in operation if Volume is
selected.)
9
C-DEC
The position of the decimal point for
the contents. The user can select 0, 1,
2, or 3 decimal places.
10
C-SPAN
Span of the contents. The span can
be programmed in the range of 0.000
to 9,999,999.
Page 33

Programming
29
Step Display Description
11
C-00
The zero of the contents. The zero can
be programmed in the range of 0.000 to
9,999,999.
12
LIN
N-lin
Select whether the input signal is linear or
non-linear.
Linear.
Non-linear.
Steps 13-17 are displayed only if the input signal is non-linear.
13
No-PTS
The number of points for non-linear
correction.
The user can program up to 25 points. Note
the user does not program the values at 4mA
or 20mA, which are set at 0 and 1 respectively.
14
INP-01
Non-linear correction Input Point #01. The
input point for the first non-linear correction
point is programmed in the range of 0.000 to
0.999.
Input points must be programmed in
ascending order.
15
OUT-01
The corresponding Output Point #01 for
non-linear correction is programmed in the
range of 0.000 to 0.999.
16
INP-XXX
Non-linear correction Input Point #XX.
Subsequent input points are programmed in
the range of 0.000 to 0.999.
17
OUT-XXX
The corresponding Output Point #XX. The
corresponding output points are programmed.
18
SOFT
The software version used in the Model 220i
is displayed.
Page 34
Signal Input
30
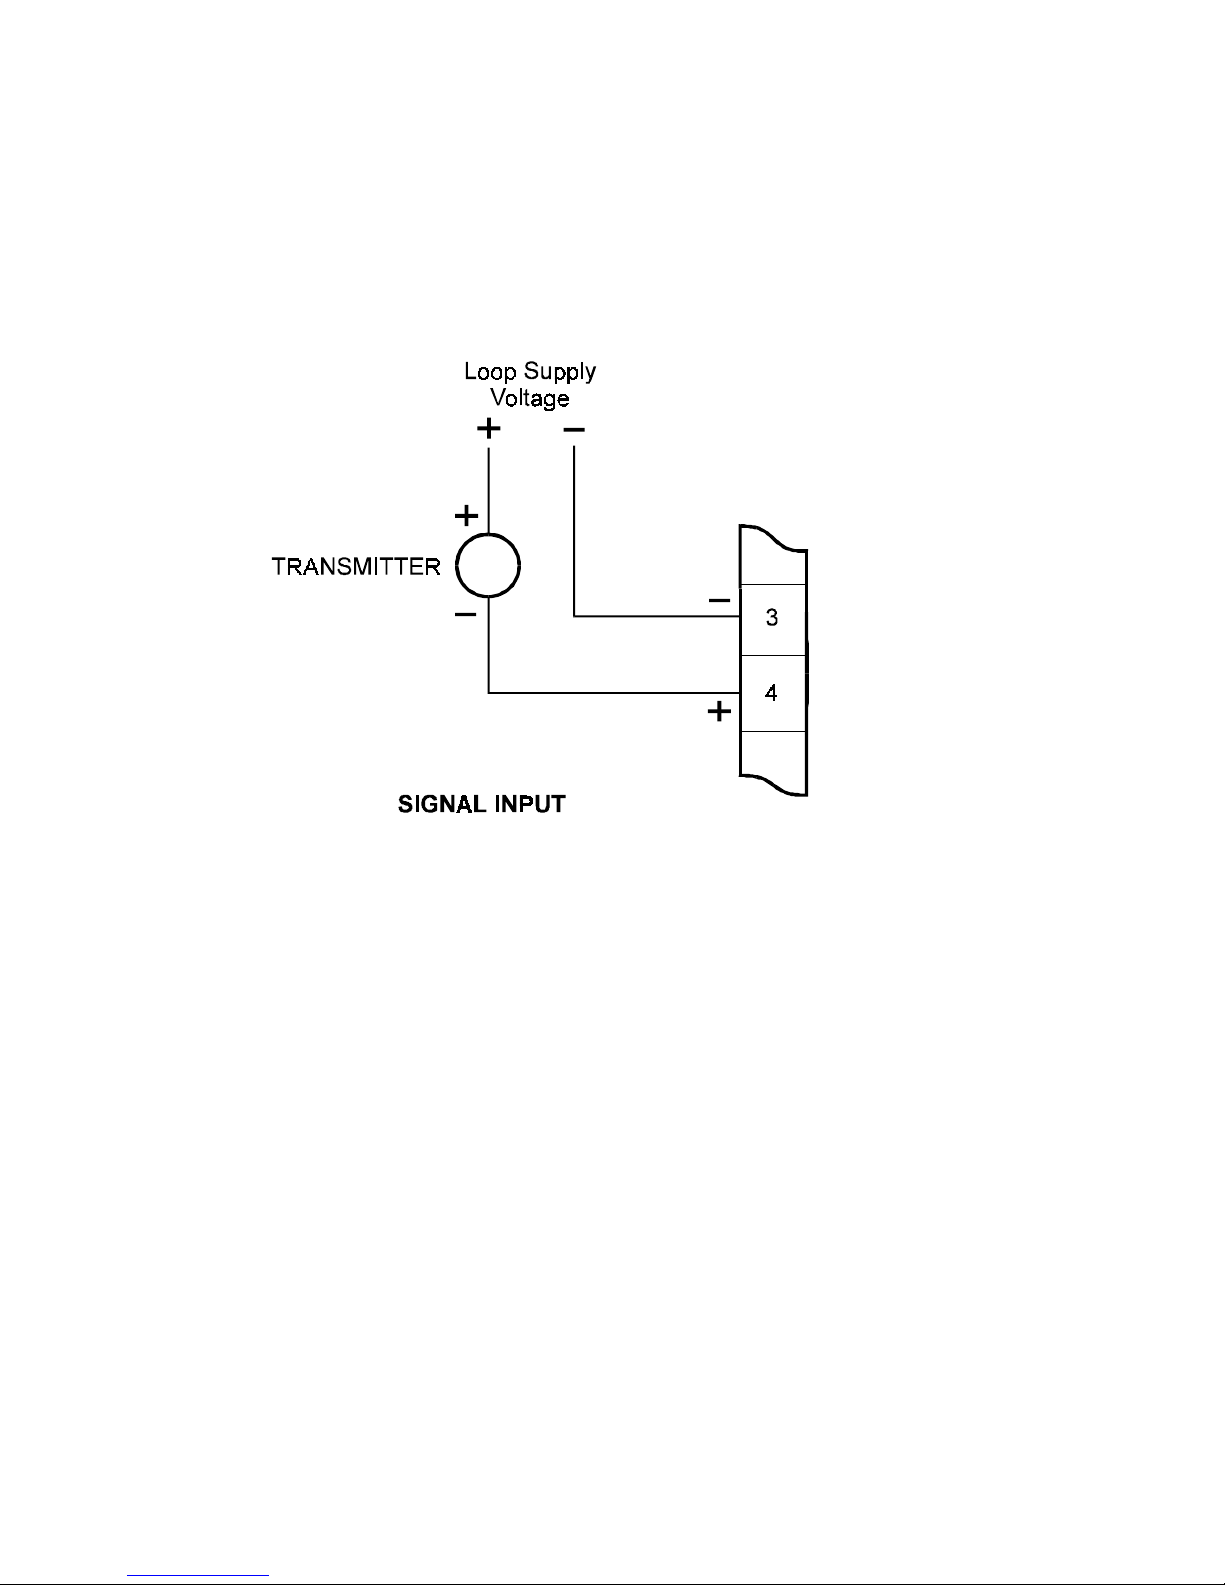
5. SIGNAL INPUT
The signal input is on terminals 3 and 4 and is connected as
follows:
Page 35

Alarm Outputs
31
6. ALARM OUTPUTS
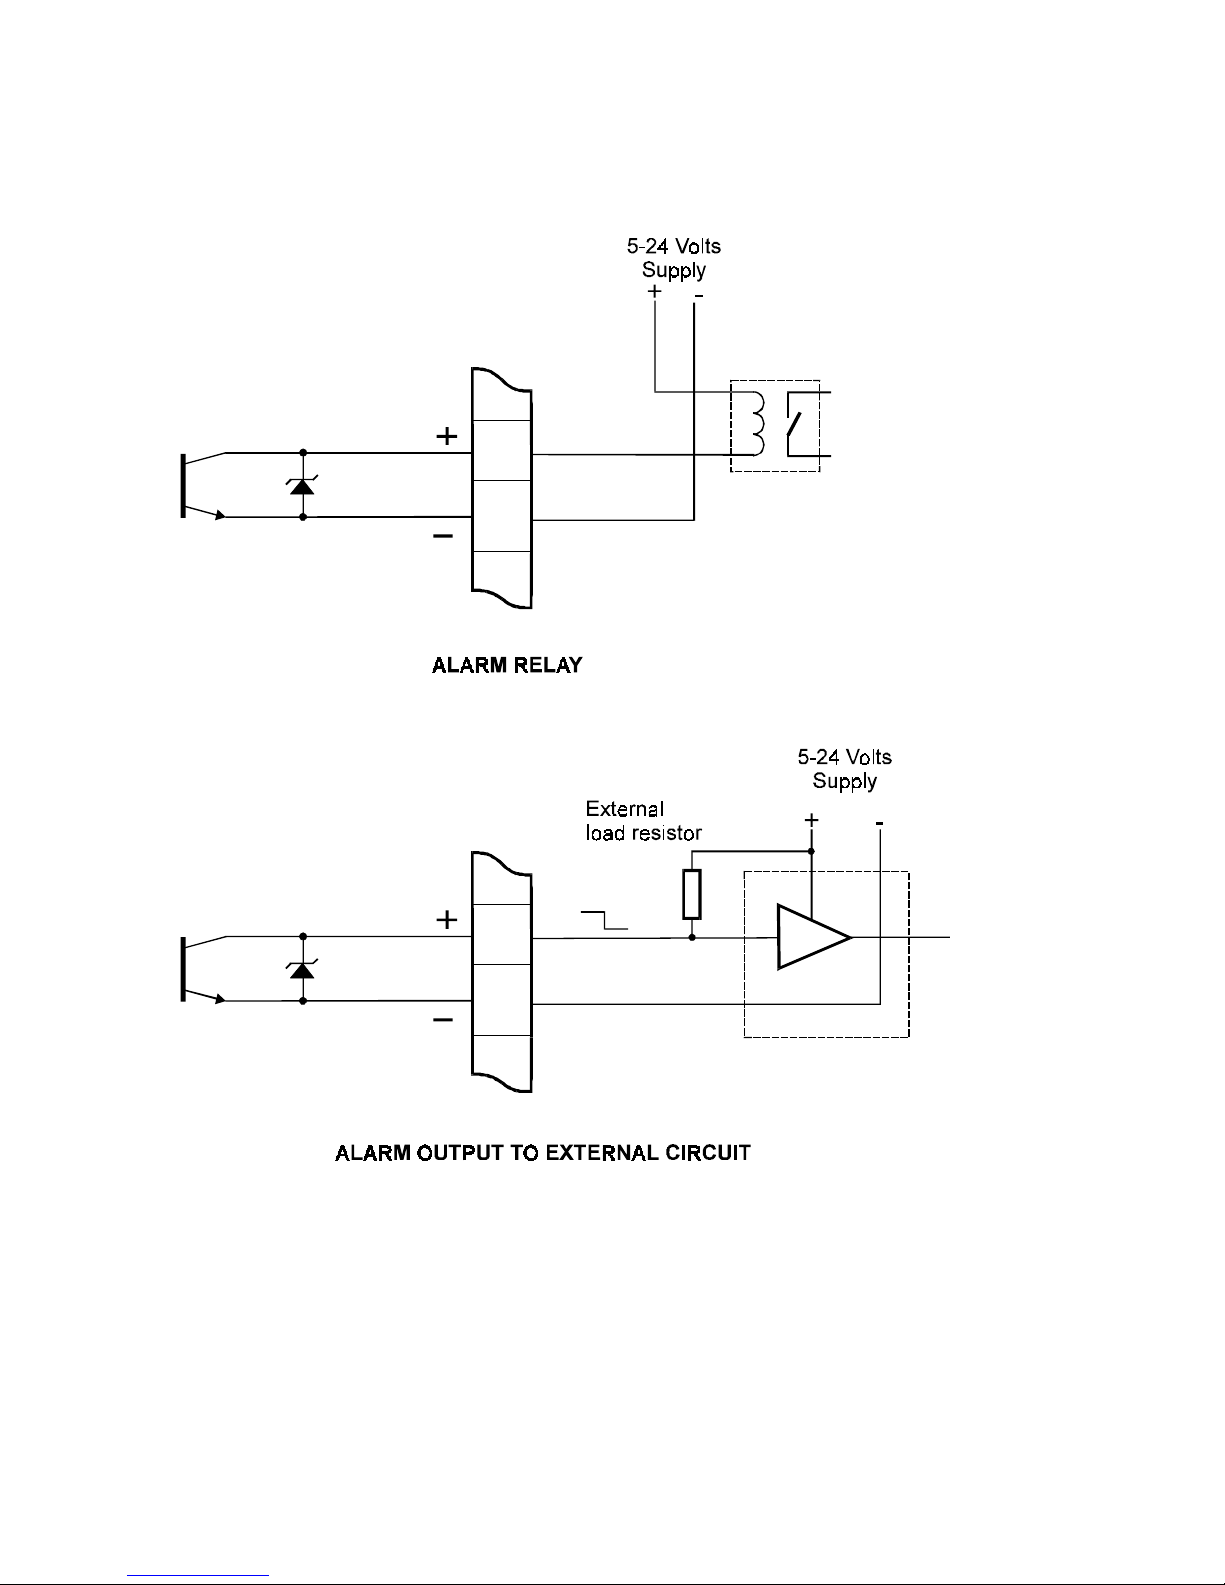
Open collector outputs are provided for high and low level alarms. The output
can sink up to 200mA and can be used to power external relays, lights or
audible alarms. The outputs are internally protected against voltage spikes.
Both outputs are separately isolated via opto-isolators.
Alarm Output Specifications
Maximum Current (sink): 200mA.
Maximum Voltage: 30Vdc.
Saturation V oltage: 0.8Vdc across outputs in energised state.
Isolation: All outputs are separately isolated via
opto-isolators.
Page 36
Alarm Outputs
32
Connections
Page 37
Installation
33
7. INSTALLATION
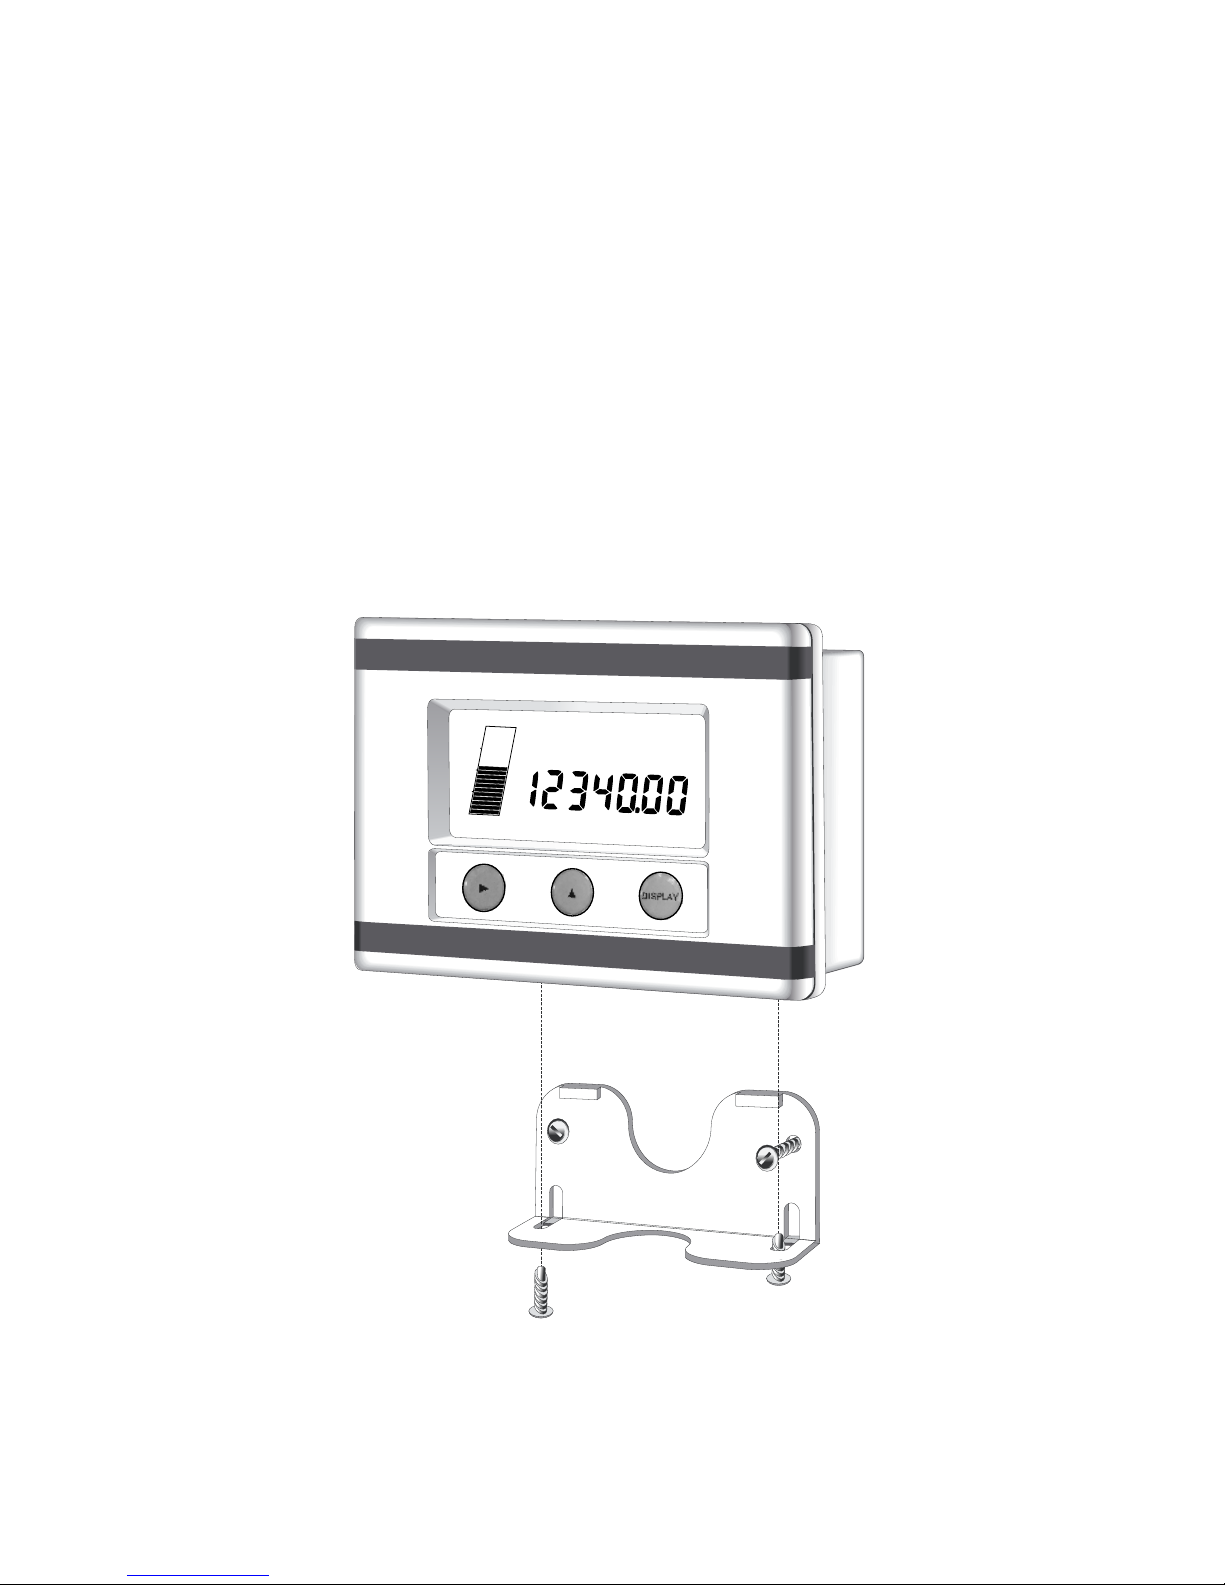
7.1 WALL MOUNTING
A wall mounting bracket is supplied with each instrument. Round head
screws should be used to attach the bracket to the wall (countersunk screws
should not be used). The bracket is mountedfirst, with the tray section at
the bottom. The instrument is then mounted on the bracket with two
screws as shown below.
LEVEL
25
50
75
100
%
0
VOLU
ALARM
Page 38
Installation
34
7.2 PANEL MOUNT VERSION
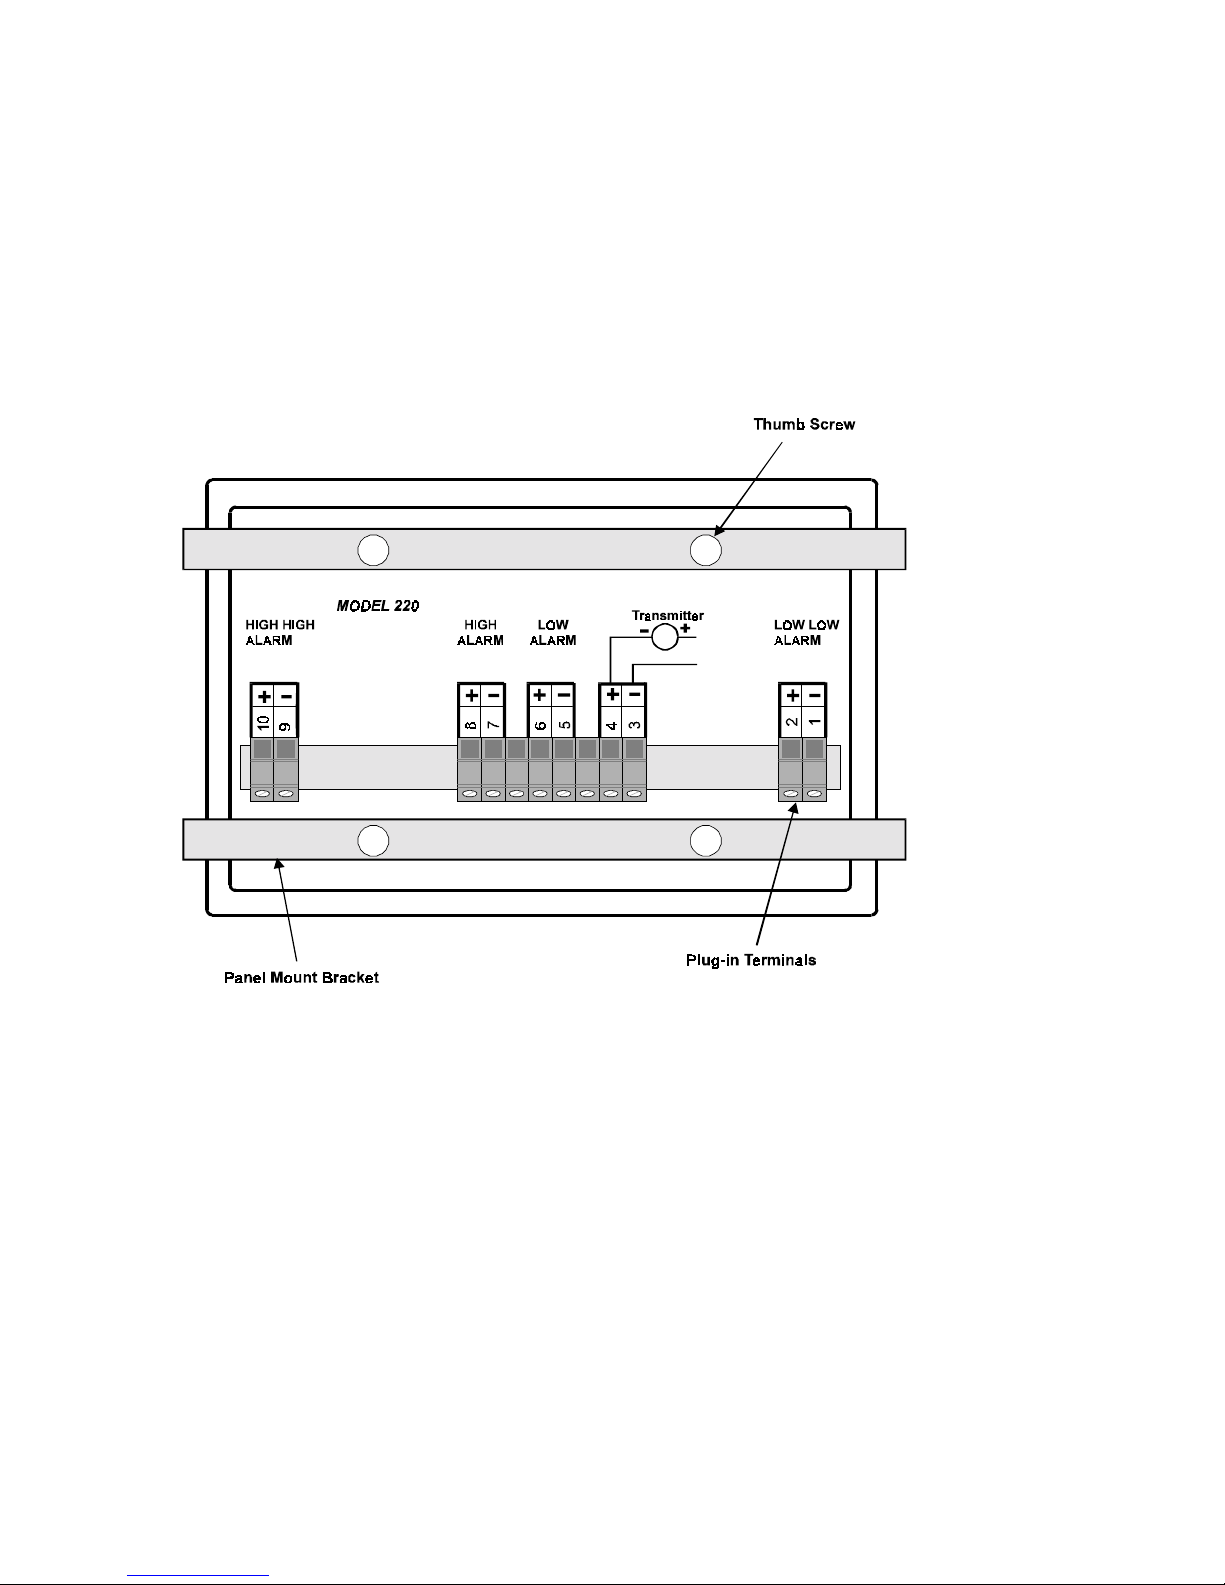
The panel mount version of the Model 220i is supplied with two panel
mount brackets and plug-in terminals, which are accessible from the rear
of the instrument.
A diagram of the rear panel is shown below:
The cutout for this version is 141mm (5.55") wide x 87mm (3.43") high.
Page 39

Installation
35
7.3 REMOVING THE FRONT PANEL
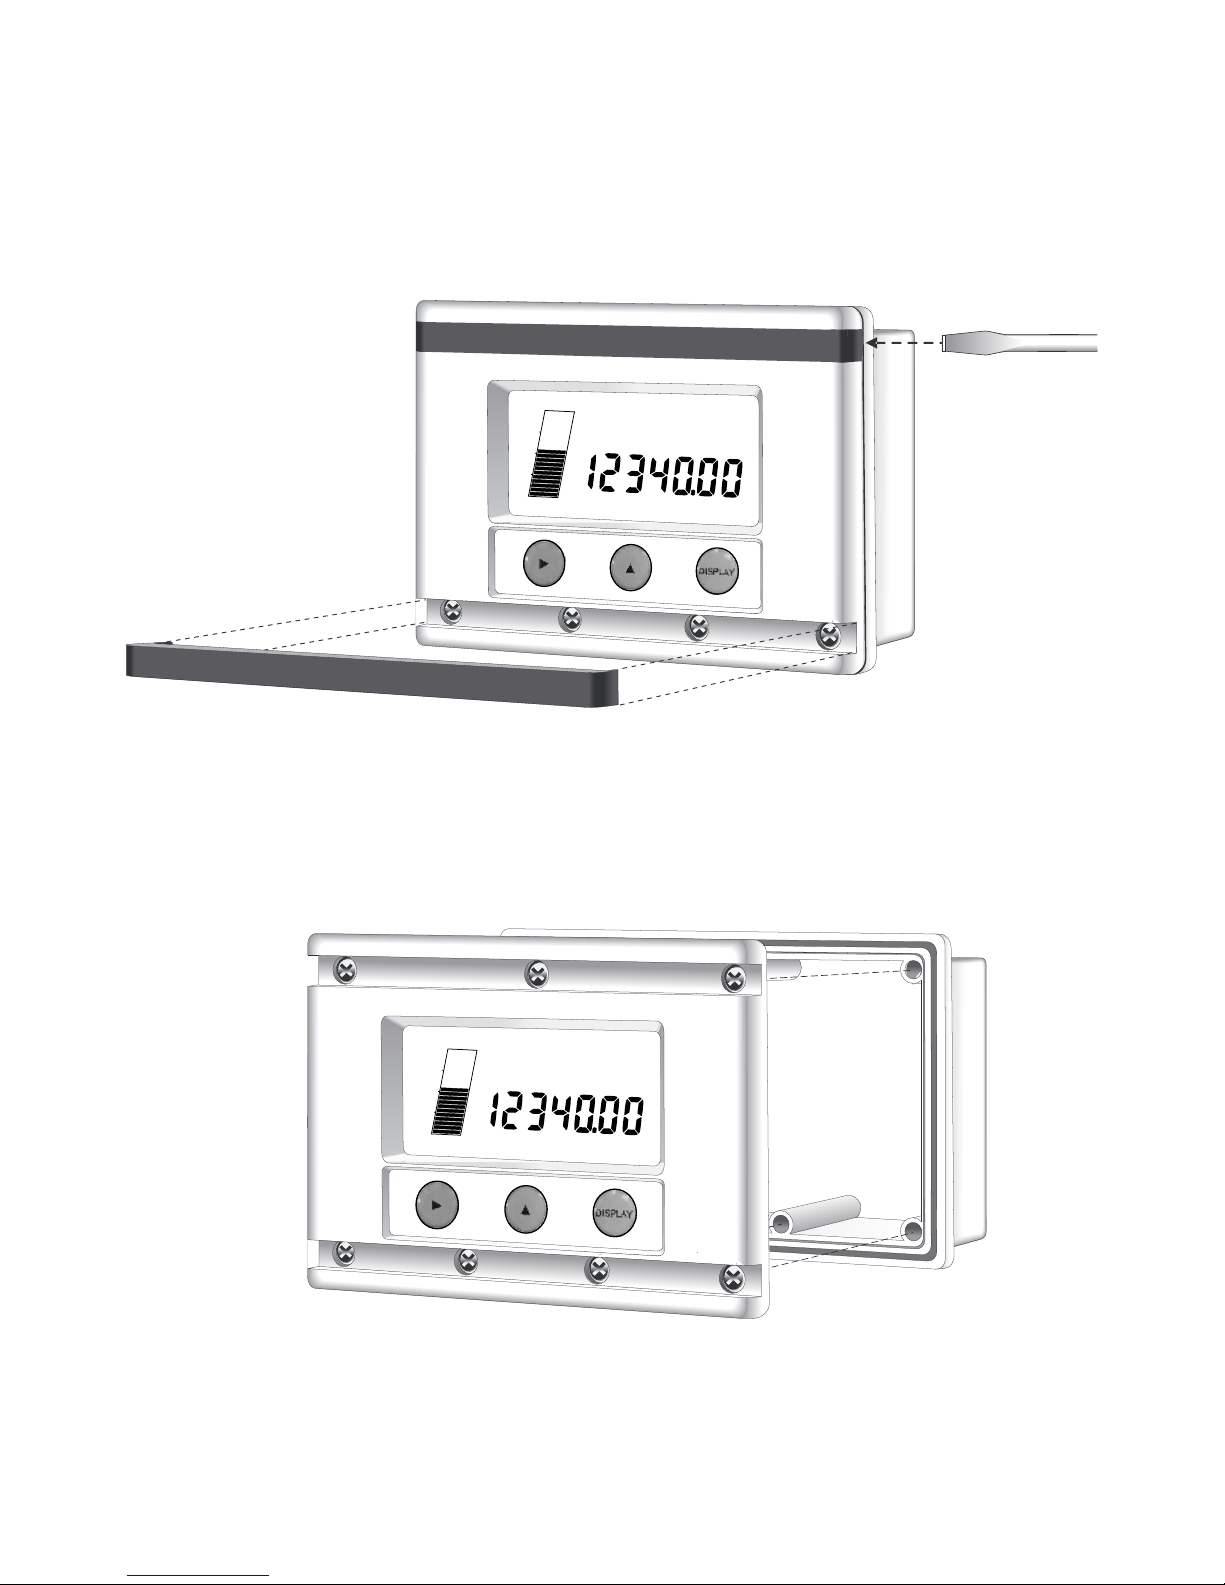
The front panel should be removed as follows:
1. Remove the top and bottom cover strips (ie. the dark plastic strip)
by levering a screwdriver under one end.
2. Undo the screws retaining the front. Do not remove the screws, they
are retained by O-rings.
3. Remove the front panel from the housing.
To replace the front cover, follow the above procedure in reverse. Ensure that
the front panel is aligned at connector points before tightening the screws.
Page 40
Installation
36
LEVEL
25
50
75
100
%
0
VOLU
ALARM
LEVEL
25
50
75
100
%
0
VOLU
ALARM
Page 41
Installation
37
7.4 THE MAIN ELECTRONICS
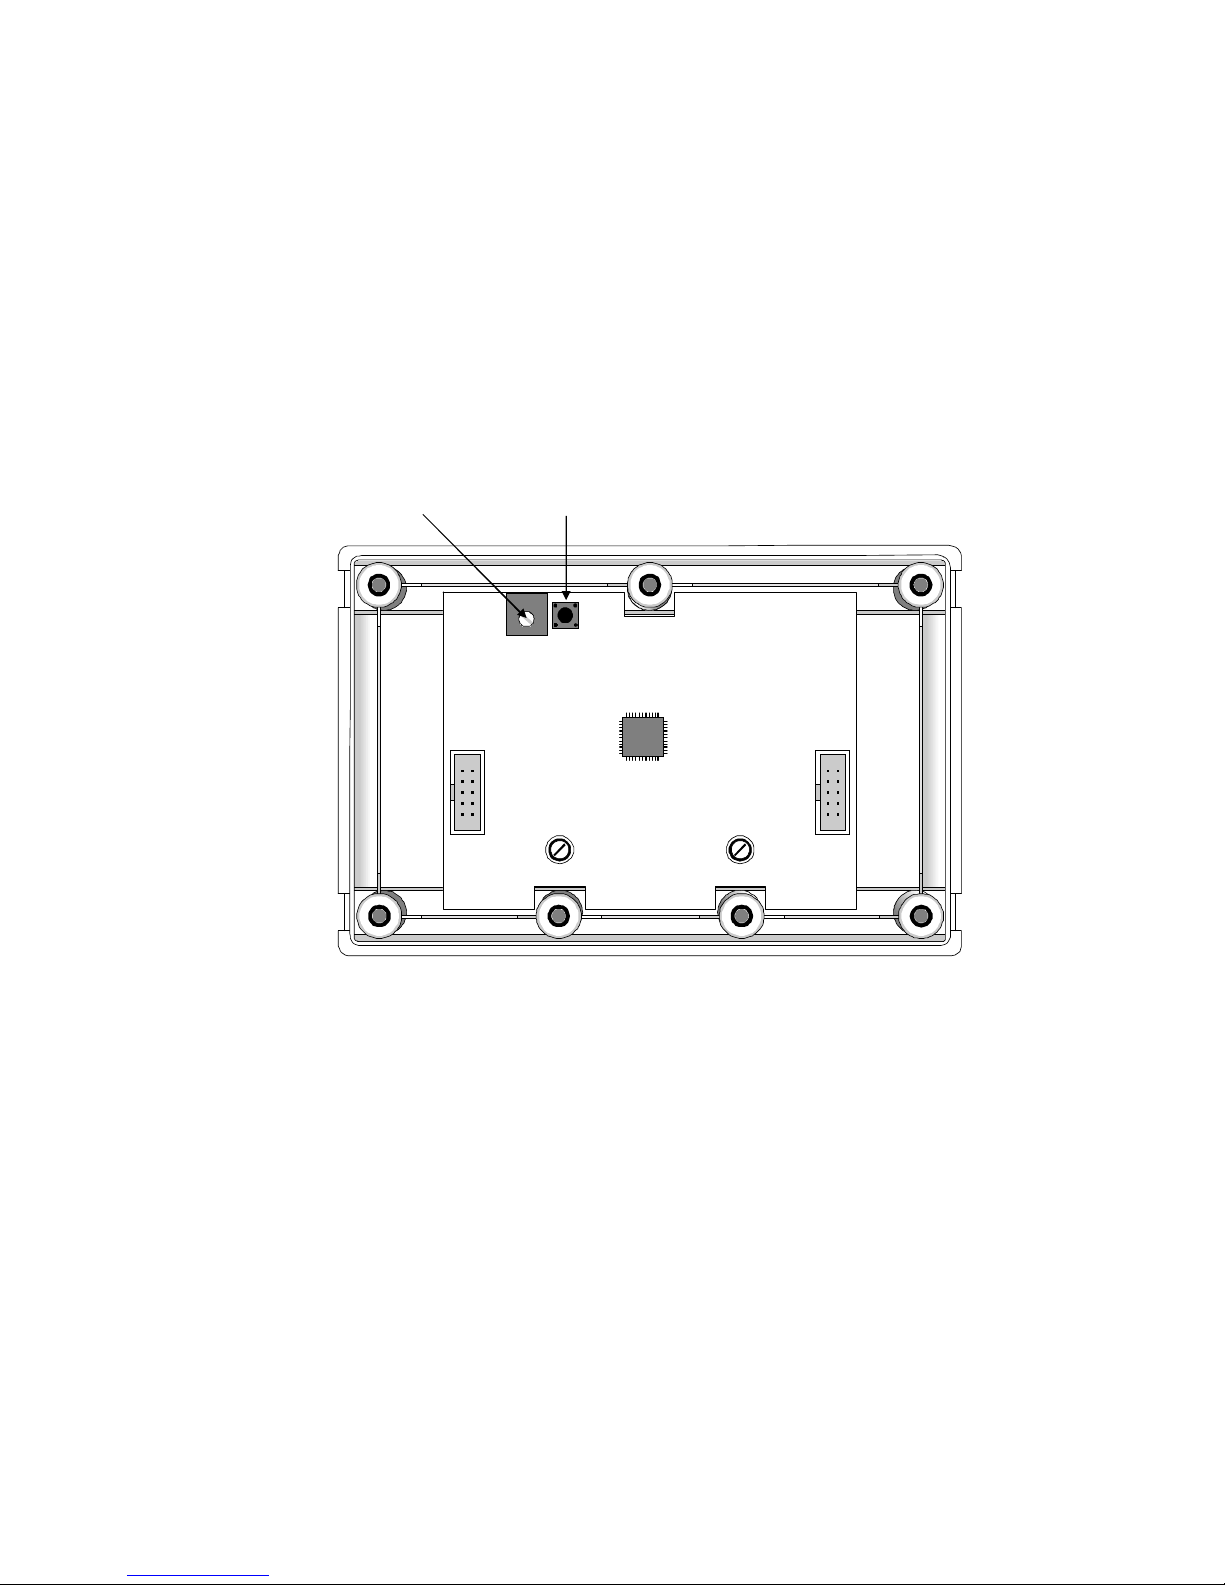
The front section of the housing contains the microprocessor and display. It
is possible to adjust the display contrast via a small potentiometer on the
board. The display contrast is shown below and this can be adjusted for
optimum contrast.
Adjacent to this control is a reset switch, which can be used to reset
the microprocessor. Note that pressing this button will reset all setup
parameters.
Display Contrast
RESET
CO NTR EC
SYST E MS
Page 42

Installation
38
7.5 WIRING
When connecting the Model 220i, it is good practice to use shielded cable.
The shield should be connected to earth at one end of the cable. The other
end of the shield should not be connected.
This wiring practice is mandatory in order to comply with the requirements
for Electromagnetic Compatibility as per EMC-Directive 2004/108/EC of the
Council of the European Community.
7.6 MAINTENANCE
All printed circuit boards must be repaired by Contrec Ltd. In the case of a
fault, no attempt should be made to repair the board as the intrinsically safe
functionality may be impaired.
SPECIAL CONDITIONS FOR SAFE USE
To comply with this products ATEX/IECEx certification the special conditions
for safe use must be followed.
The Instrument type 220i shall be mounted in an area where electrostatic
charge/discharge will be avoided.
Page 43

Installation
39
7.7 TERMINAL DESIGNATIONS
4-20mA Input
3 4-20mA (-)
4 4-20mA (+)
Outputs
1 Low-low Alarm (-)
2 Low-low Alarm (+)
5 Low Alarm (-)
6 Low Alarm (+)
7 High Alarm (-)
8 High Alarm (+)
10 High-high Alarm (-)
11 High-high Alarm (+)
Page 44

Intrinsic Safety Connections
40
8. INTRINSIC SAFETY
CONNECTIONS
When installing the Model 220i in hazardous areas, the wiring and
installation must comply with appropriate installation standards.
The approval uses entity parameters and an associated apparatus type
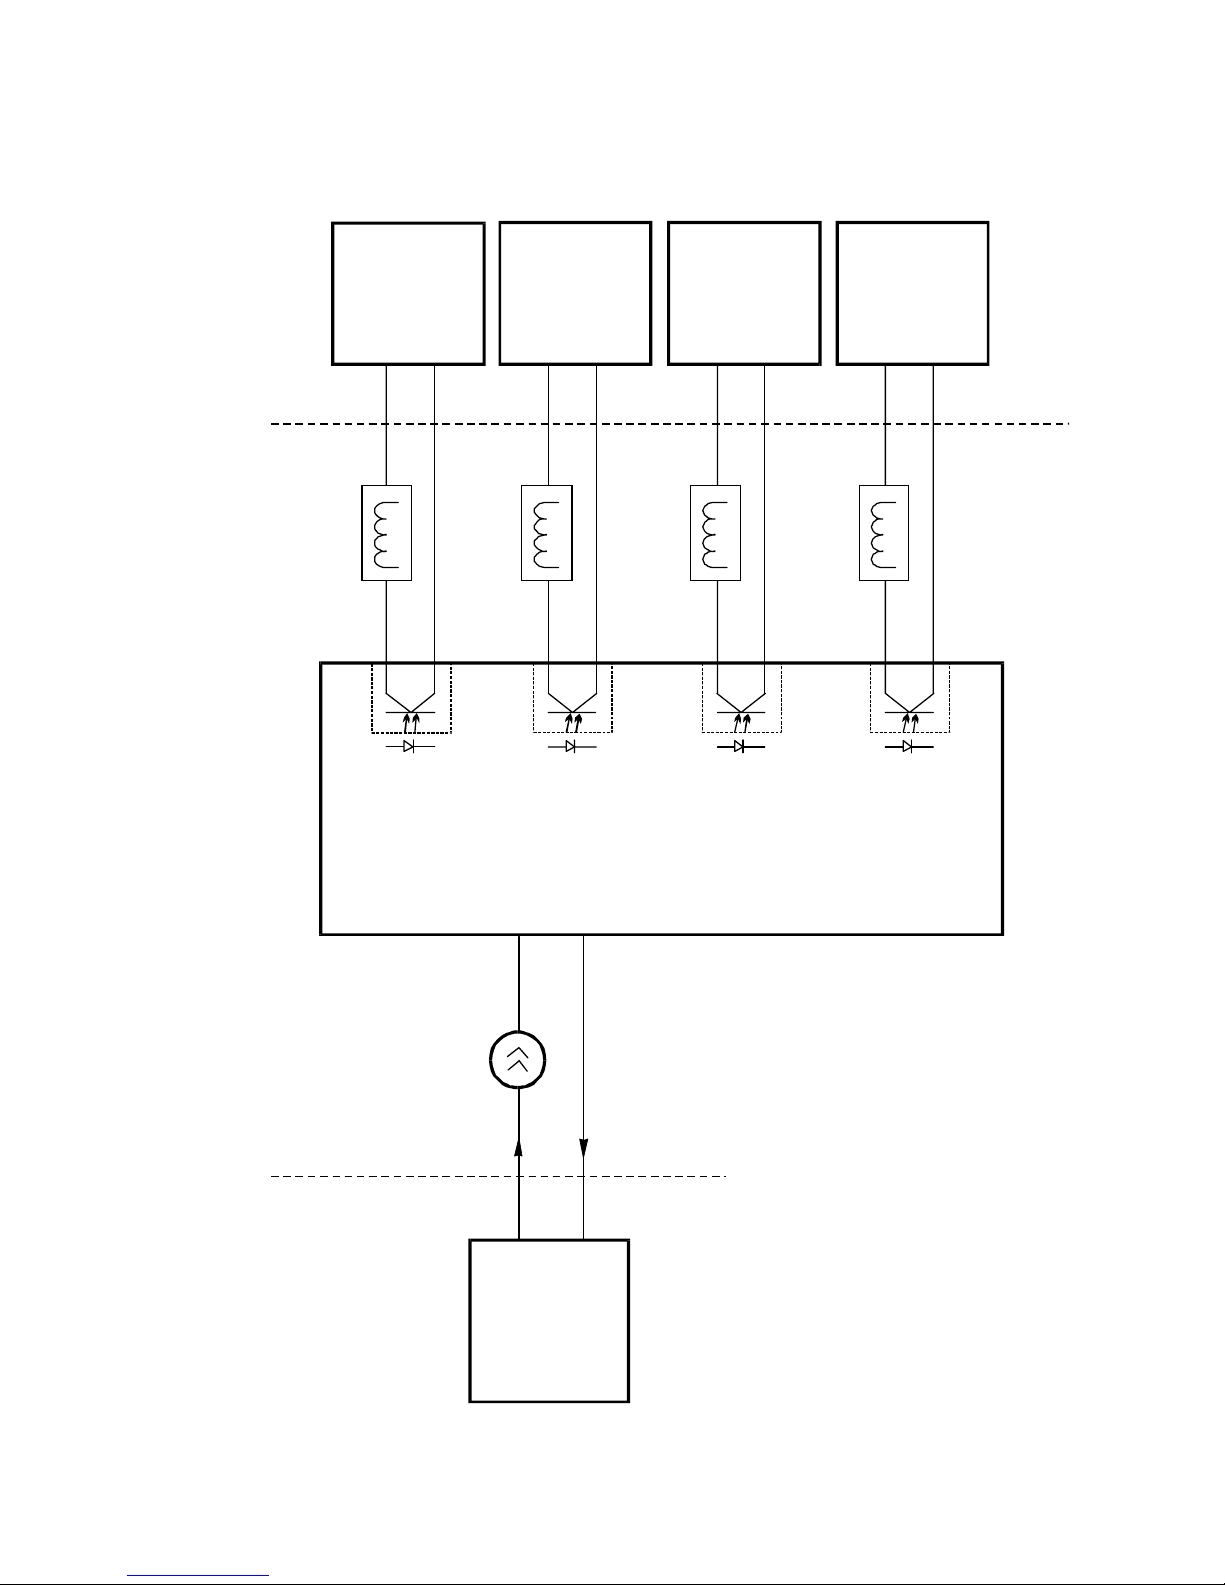
approval on the input/output connections to the 4-20mA current loop and
alarms. The 4-20mA input and alarm outputs must, therefore, only be
connected as shown on the following page to barriers with the specified
parameters.
The Model 220i will connect directly to a 4-20mA current loop and
alarms, provided they do not exceed the following input parameters:
Ui = 28V
Ii = 93mA
Pi = 653mW
The internal capacitance seen on the input (terminals 3-4) is 0.02uF while
the internal capacitance seen on the output (terminals 1-2, 5-6, 7-8 and
10-11) is 0.1uF maximum. Inductance is negligibly small on both the input
and output.
Outputs
The four open collector outputs must only be connected to certified
IS equipment via barriers as shown on the following page. Only
certified intrinsically safe solenoids may be used for IS applications.
Page 45
Intrinsic Safety Connections
41
MODEL 220
LEVEL MONITOR
2(+)
1(-)
6(+)
5(-)
4(+)
3(-)
APPROVED
4-20mA
CURRENT
LOOP
TRANSMITTER
IS Barrier 1
Ro = 300 ohm
IS BARRIERS 1-5
Uo = 28 V maximum
Io = 93 mA maximum
Po = 653 mW maximum
L/R < specified for selected barrier
SAFE AREA HAZARDOUS AREA
Cable Length < 5 km
Intrinsically Safe Installation
IS Barrier 2
Ro = 300 ohm
IS Barrier 3
Ro = 300 ohm
SAFE AREA
Approved
IS Coil
Approved
IS Coil
Uo = 28 V maximum
Io = 93 mA maximum
Po = 653 mW maximu
m
8(+)
7(-)
IS Barrier 4
Ro = 300 ohm
Approved
IS Coil
11(+)
10(-)
IS Barrier 5
Ro = 300 ohm
Approved
IS Coil
Page 46

Index
42
Index
4½ Resolution, 7
A
Alarms, 13
Acknowledgeable
Alarms, 15
Alarm Deadband, 15
Alarm Outputs, 30
C
Calculation of
Contents, 7
Contents, 7
Continuous, 15
D
Density Correction
Factor, 24
E
Electronics, 36
F
Filtering
Filter Factor, 22
Front Panel Operation,
8
H
Hazardous, 3
High Alarms, 14
I
Installation, 32
Intrinsic Safety, 3, 44
L
Level Bar Graph, 6
Low Alarms, 14
M
Microprocessor, 36
Model Number, 2
N
Non-Linearity, 18
Normalised, 19
O
Open Collector
Outputs, 30
P
Panel Mount, 33
Programming, 25
R
Relay & Power
Module, 39
S
Signal Input, 29
Span
Offset, 7
Standards, 1
T
Tank Conversion
Software, 21
Terminal
Designations,
38
Test Mode, 12
Timeout, 12
W
Wall Mounting, 32
Wiring, 37
 Loading...